Wednesday, October 2, 2019 DATE: RESOURCE MANAGEMENT … · John Marco Craig Chaikin, CFA. Senior ....
73
PHONE (808) 594-1888 FAX (808) 594-1868 COMMITTEE ON RESOURCE MANAGEMENT Dan Ahuna, Chairperson Robert K. Lindsey, Jr., Vice Chairperson Leina’ala Ahu Isa, At-Large Kalei Akaka, O’ahu Keli ‘1 Akina, At-Large Brendon Kalei’äina Lee, At-Large Carmen Hulu Lindsey, Maui Colette Y. Machado, Moloka’i/Läna’i John Waihe’e IV, At-Large III. New Business A. NHTF 2 Quarter Performance Review with Consultant Segal Marco-John Marco B. Discussion of search for future Investment Manager IV. Executive Session* V. Adjournment A. Approval of Minutes—April 10, 2019 If you require an auxiliary aid or accommodation due to a disability, please contact Raina Gushiken at telephone number 594- 1772 or by email at: [email protected] no later than three (3) business days prior to the date of the meeting. *Notice: Persons wishing to provide testimony are requested to submit 13 copies of their testimony to the Chief Executive Officer at 560 N. Nimitz. Suite 200, Honolulu, HI, 96817 or fax to 594-1868, or email [email protected] 48 hours prior to the scheduled meeting. Persons wishing to testify orally may do so at the meeting, provided that oral testimony shall be limited to five minutes. Notice: The 72 Hour rule, pursuant to OHA BOT Operations Manual, Section 49, shall be waived for distribution of new committee materials. Notice: This portion of the meeting will be closed pursuant to HRS § 92-5. Tr eeDanAhuna Date STATE OF HAWAII OFFICE OF HAWAIIAN AFFAIRS MEETING OF THE COMMITTEE ON RESOURCE MANAGEMENT DATE: TIME: PLACE: Wednesday, October 2, 2019 9:30 am OHA Board Room, Na Lama Kukui 560 N. Nimitz Hwy., Suite 200 Honolulu, HI 96817 AGENDA I. Call to Order II. Public Testimony* Chairperson, Committee on Resource Management
Transcript of Wednesday, October 2, 2019 DATE: RESOURCE MANAGEMENT … · John Marco Craig Chaikin, CFA. Senior ....
PHONE (808) 594-1888 FAX (808) 594-1868
COMMITTEE ON RESOURCE MANAGEMENTDan Ahuna, ChairpersonRobert K. Lindsey, Jr., Vice ChairpersonLeina’ala Ahu Isa, At-LargeKalei Akaka, O’ahuKeli ‘1 Akina, At-LargeBrendon Kalei’äina Lee, At-LargeCarmen Hulu Lindsey, MauiColette Y. Machado, Moloka’i/Läna’iJohn Waihe’e IV, At-Large
III. New BusinessA. NHTF 2 Quarter Performance Review with Consultant Segal Marco-John MarcoB. Discussion of search for future Investment Manager
IV. Executive Session*
V. Adjournment
A. Approval of Minutes—April 10, 2019
If you require an auxiliary aid or accommodation due to a disability, please contact Raina Gushiken at telephone number 594-1772 or by email at: [email protected] no later than three (3) business days prior to the date of the meeting.
*Notice: Persons wishing to provide testimony are requested to submit 13 copies of their testimony to the Chief Executive Officer at 560 N.Nimitz. Suite 200, Honolulu, HI, 96817 or fax to 594-1868, or email [email protected] 48 hours prior to the scheduled meeting.Persons wishing to testify orally may do so at the meeting, provided that oral testimony shall be limited to five minutes.
Notice: The 72 Hour rule, pursuant to OHA BOT Operations Manual, Section 49, shall be waived for distribution of new committeematerials.
Notice: This portion of the meeting will be closed pursuant to HRS § 92-5.
Tr eeDanAhuna Date
STATE OF HAWAIIOFFICE OF HAWAIIAN AFFAIRS
MEETING OF THE COMMITTEE ONRESOURCE MANAGEMENT
DATE:TIME:PLACE:
Wednesday, October 2, 20199:30 amOHA Board Room, Na Lama Kukui560 N. Nimitz Hwy., Suite 200Honolulu, HI 96817
AGENDA
I. Call to Order
II. Public Testimony*
Chairperson, Committee on Resource Management
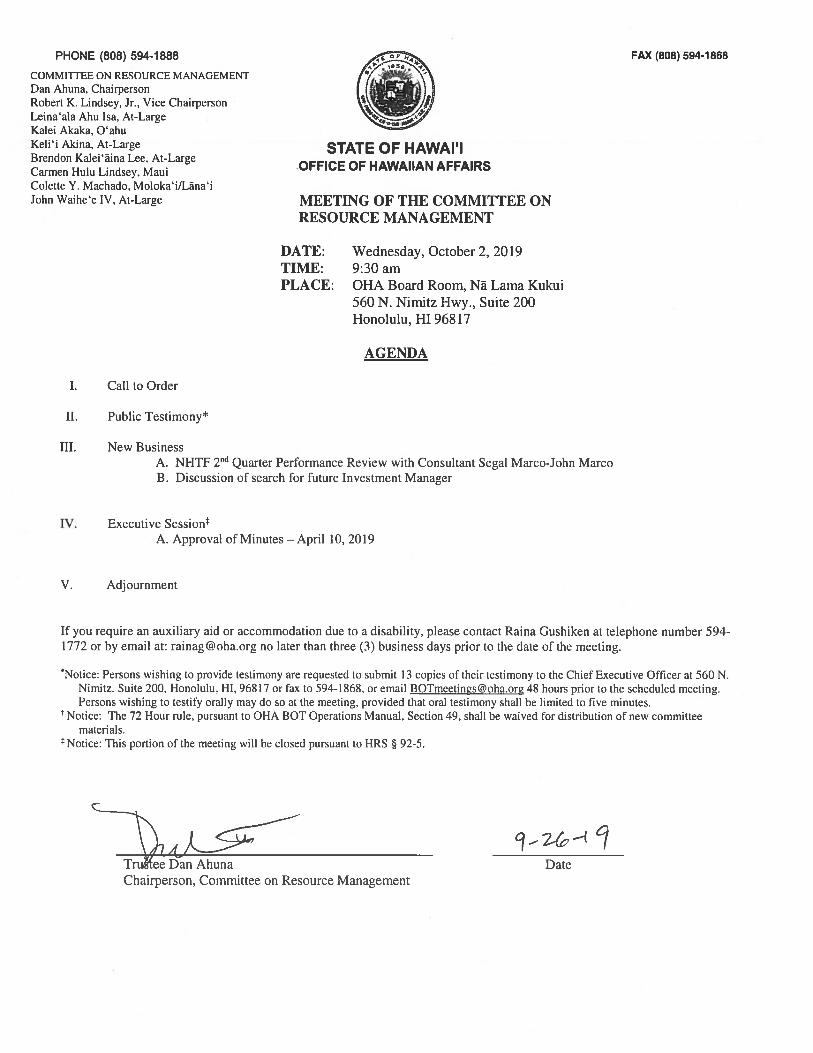
Quarter to Date Last 4 Quarters Quarter to Date Last 4 Quarters
6/30/2019 6/30/2019 6/30/2016 6/30/2016Commonfund 335,888 1,325,632 482,141 1,890,923JP Morgan 185,782 735,363 184,226 898,211PIMCO 83,475 315,849 NA NAPantheon* 65,026 275,869 83,097 340,564Goldman Sachs** 40,788 167,026 215,109 1,003,388SSGA 33,794 134,759 NA NAHighbridge*** 17,067 83,328 NA NAHDI 10,630 44,022 10,396 39,550ELA 2,500 10,000 5,000 38,380Total Advisor Fees 774,950 3,091,848 979,969 4,211,016Custody Fees**** 21,000 154,874 56,818 228,196Total Fees: 795,950 3,246,722 1,036,787 4,439,212*Prior to July 2011, Pantheon fees were included with Russell, Fees for Euro denominated funds were converted using the EURO/USD exchange rate
** Goldman Sachs are lagged by a quarter
*** 2017 and prior Highbridge fees included into JPM
**** Inception Date for Custody Fees is 1/1/2011. Fees include performance reporting Quarter fee is estimated.
Total Trust Fund Fees
Copyright © 2018 by The Segal Group, Inc. All rights reserved.
Office of Hawaiian Affairs
ANALYSIS OF INVESTMENT PERFORMANCE
Native Hawaiian Trust Fund June 2019
John Marco Craig Chaikin, CFASenior Vice President Vice President
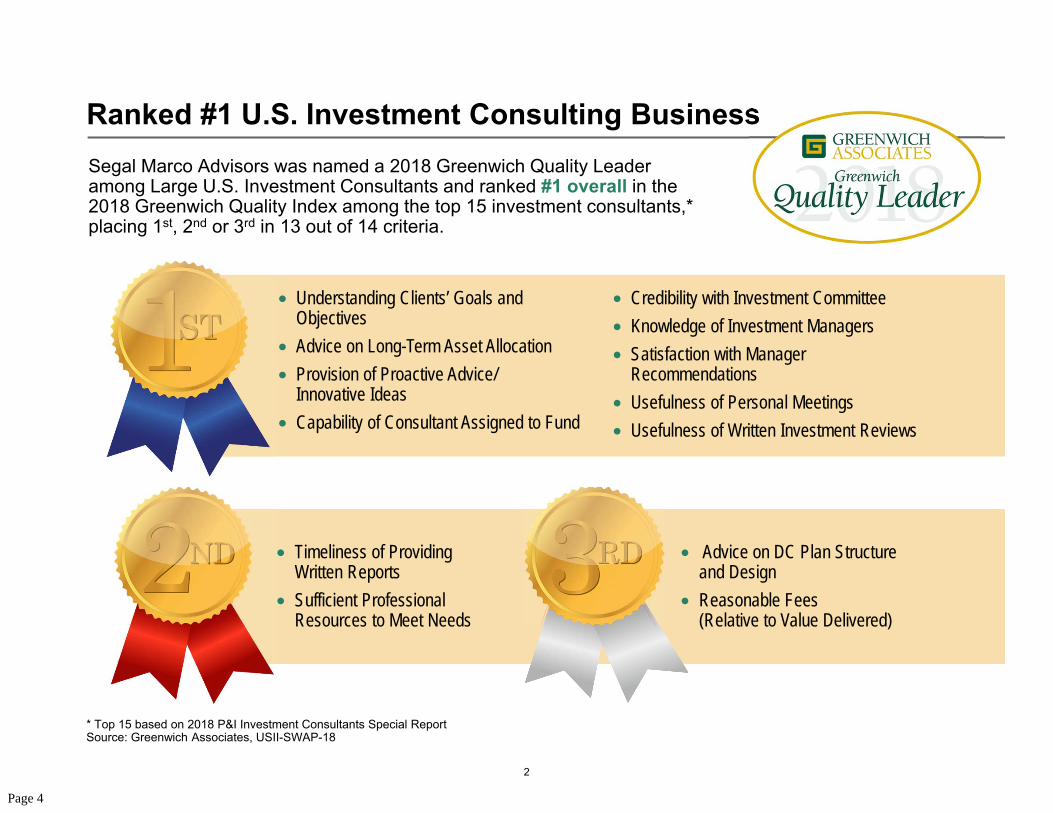
Segal Marco Advisors was named a 2018 Greenwich Quality Leader among Large U.S. Investment Consultants and ranked #1 overall in the 2018 Greenwich Quality Index among the top 15 investment consultants,* placing 1st, 2nd or 3rd in 13 out of 14 criteria.
Ranked #1 U.S. Investment Consulting Business
* Top 15 based on 2018 P&I Investment Consultants Special ReportSource: Greenwich Associates, USII-SWAP-18
• Timeliness of Providing Written Reports
• Sufficient Professional Resources to Meet Needs
• Understanding Clients’ Goals and Objectives
• Advice on Long-Term Asset Allocation• Provision of Proactive Advice/
Innovative Ideas• Capability of Consultant Assigned to Fund
• Credibility with Investment Committee• Knowledge of Investment Managers• Satisfaction with Manager
Recommendations• Usefulness of Personal Meetings• Usefulness of Written Investment Reviews
• Advice on DC Plan Structure and Design
• Reasonable Fees (Relative to Value Delivered)
Page 4
2
This performance report ("Report") is based upon information obtained by Segal Marco Advisors ("SMA") from third parties over which SMA does not exercise any control. Although the information collected by SMA is believed to be reliable, SMA cannot verify or guarantee the accuracy or validity of such information or the uniformity of the manner in which such information was prepared. The rates of return reflected herein are time weighted and geometrically linked on a monthly basis using a modified Dietz method. Monthly valuations and returns are calculated based on the assumptions that all transactions and prices are accurate from the custodian and /or investment manager. The client to whom Segal Marco Advisors delivers this Report ("Client") agrees and acknowledges that this Report has been prepared solely for the benefit of Client. SMA disclaims any and all liability that may arise in connection with Client’s conveyance (whether or not consented to by SMA) of the this Report (in whole or in part) to any third party. Client further agrees and acknowledges that SMA shall have no liability, whatsoever, resulting from, or with respect to, errors in, or incompleteness of, the information obtained from third parties. Client understands that the prior performance of an investment and /or investment manager is not indicative of such investment 's and/or investment manager's future performance. This Report does not constitute an offer or a solicitation of an offer for the purchase or sale of any security nor is it an endorsement of any custodian , investment and/or investment manager.
Ta b l e o f C o n t e n t sANALYSIS OF INVESTMENT PERFORMANCE
Section
Financial Market Conditions ............................................................................................................................................................1
Total Plan Overview.........................................................................................................................................................................2
Total Global Equities..................... ...................................................................................................................................................3
Total Global Fixed Income...............................................................................................................................................................4
Total Private Equity..........................................................................................................................................................................7
Total Hedge Funds..........................................................................................................................................................................6
Appendix..........................................................................................................................................................................................8
Total Global Real Assets.................................................................................................................................................................5
3

Financial Market Conditions
4
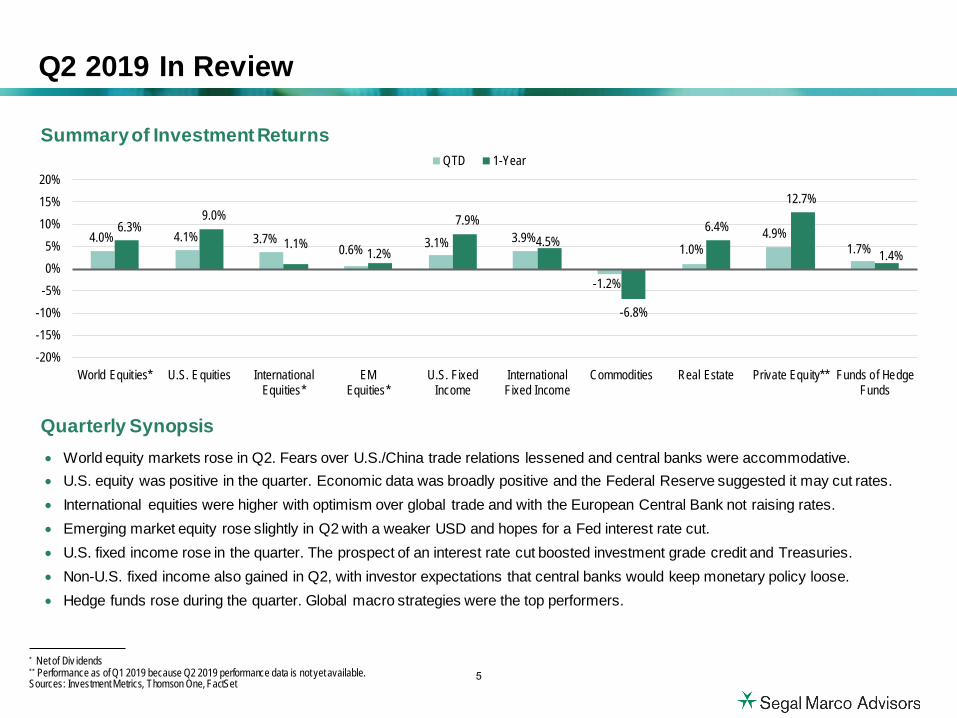
• World equity markets rose in Q2. Fears over U.S./China trade relations lessened and central banks were accommodative.• U.S. equity was positive in the quarter. Economic data was broadly positive and the Federal Reserve suggested it may cut rates.• International equities were higher with optimism over global trade and with the European Central Bank not raising rates.• Emerging market equity rose slightly in Q2 with a weaker USD and hopes for a Fed interest rate cut.• U.S. fixed income rose in the quarter. The prospect of an interest rate cut boosted investment grade credit and Treasuries.• Non-U.S. fixed income also gained in Q2, with investor expectations that central banks would keep monetary policy loose.• Hedge funds rose during the quarter. Global macro strategies were the top performers.
Summary of Investment Returns
Q2 2019 In Review
4.0% 4.1% 3.7%0.6% 3.1% 3.9%
-1.2%
1.0%4.9%
1.7%6.3%
9.0%
1.1%1.2%
7.9%4.5%
-6.8%
6.4%
12.7%
1.4%
-20%-15%-10%
-5%0%5%
10%15%20%
World Equit ies* U.S. Equities InternationalEquities*
EMEquities*
U.S. FixedIncome
InternationalFixed Income
Commodities Real Estate Private Equity** Funds of HedgeFunds
QTD 1-Year
Quarterly Synopsis
* Net of Div idends** Performance as of Q1 2019 because Q2 2019 performance data is not yet available.Sources: Investment Metrics, Thomson One, FactSet
5

1 Net of Div idends2 Formerly Citigroup Non-U.S. WGBI. Citigroup’s fixed income indices were purchased by London Stock Exchange Group (LSEG) and were all rebranded to FTSE by July 31, 2018. FTSE Russell is a unit of LSEG’s Information Serv ices Div ision and a wholly owned subsidiary of LSEG.3 NCREIF Fund Index (NFI) – Open End Diversified Core Equity (ODCE)4 Performance as of Q1 2019 because Q2 2019 performance data is not y et available.Sources: Investment Metrics, Thomson One, FactSet
Q2 2019 Index Returns
Asset Class Indices QTD YTD 1-Year 3-Year 5-Year 10-Year
World Equity MSCI World1 4.00 16.98 6.33 11.77 6.60 10.72
U.S. Equity Russell 3000 4.10 18.71 8.98 14.02 10.19 14.67
Non-U.S. Equity MSCI EAFE1 3.68 14.03 1.08 9.11 2.25 6.90
Emerging Market Equity MSCI EM1 0.61 10.58 1.21 10.66 2.49 5.81
U.S. Fixed Income Bloomberg Barclays U.S. Aggregate 3.08 6.11 7.87 2.31 2.95 3.90
Non-U.S. Fixed Income FTSE2 Non-U.S. WGBI(Unhedged) 3.93 5.50 4.54 0.83 0.19 1.88
Commodities Bloomberg Commodity Index -1.19 5.06 -6.75 -2.18 -9.15 -3.74
Private Real Estate NFI-ODCE3 0.99 2.42 6.41 7.57 9.76 9.88
Private Equity Thomson Reuters Private Equity4 4.9 4.9 12.7 14.7 12.1 15.2
Hedge Funds HFRI Fund of Funds Composite 1.69 6.38 1.36 4.32 2.23 3.23
6
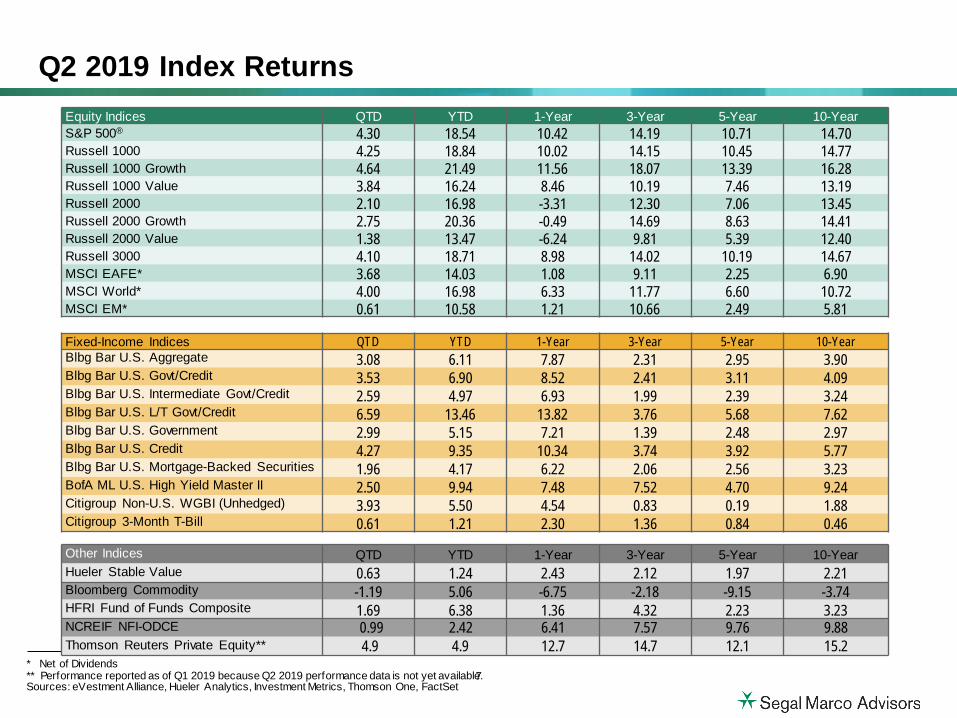
Q2 2019 Index ReturnsEquity Indices QTD YTD 1-Year 3-Year 5-Year 10-YearS&P 500® 4.30 18.54 10.42 14.19 10.71 14.70Russell 1000 4.25 18.84 10.02 14.15 10.45 14.77Russell 1000 Growth 4.64 21.49 11.56 18.07 13.39 16.28Russell 1000 Value 3.84 16.24 8.46 10.19 7.46 13.19Russell 2000 2.10 16.98 -3.31 12.30 7.06 13.45Russell 2000 Growth 2.75 20.36 -0.49 14.69 8.63 14.41Russell 2000 Value 1.38 13.47 -6.24 9.81 5.39 12.40Russell 3000 4.10 18.71 8.98 14.02 10.19 14.67MSCI EAFE* 3.68 14.03 1.08 9.11 2.25 6.90MSCI World* 4.00 16.98 6.33 11.77 6.60 10.72MSCI EM* 0.61 10.58 1.21 10.66 2.49 5.81
Fixed-Income Indices QTD YTD 1-Year 3-Year 5-Year 10-YearBlbg Bar U.S. Aggregate 3.08 6.11 7.87 2.31 2.95 3.90Blbg Bar U.S. Govt/Credit 3.53 6.90 8.52 2.41 3.11 4.09Blbg Bar U.S. Intermediate Govt/Credit 2.59 4.97 6.93 1.99 2.39 3.24Blbg Bar U.S. L/T Govt/Credit 6.59 13.46 13.82 3.76 5.68 7.62Blbg Bar U.S. Government 2.99 5.15 7.21 1.39 2.48 2.97Blbg Bar U.S. Credit 4.27 9.35 10.34 3.74 3.92 5.77Blbg Bar U.S. Mortgage-Backed Securities 1.96 4.17 6.22 2.06 2.56 3.23BofA ML U.S. High Yield Master II 2.50 9.94 7.48 7.52 4.70 9.24Citigroup Non-U.S. WGBI (Unhedged) 3.93 5.50 4.54 0.83 0.19 1.88Citigroup 3-Month T-Bill 0.61 1.21 2.30 1.36 0.84 0.46
Other Indices QTD YTD 1-Year 3-Year 5-Year 10-YearHueler Stable Value 0.63 1.24 2.43 2.12 1.97 2.21Bloomberg Commodity -1.19 5.06 -6.75 -2.18 -9.15 -3.74HFRI Fund of Funds Composite 1.69 6.38 1.36 4.32 2.23 3.23NCREIF NFI-ODCE 0.99 2.42 6.41 7.57 9.76 9.88Thomson Reuters Private Equity** 4.9 4.9 12.7 14.7 12.1 15.2
* Net of Dividends** Performance reported as of Q1 2019 because Q2 2019 performance data is not yet available.Sources: eVestment Alliance, Hueler Analytics, Investment Metrics, Thomson One, FactSet
7
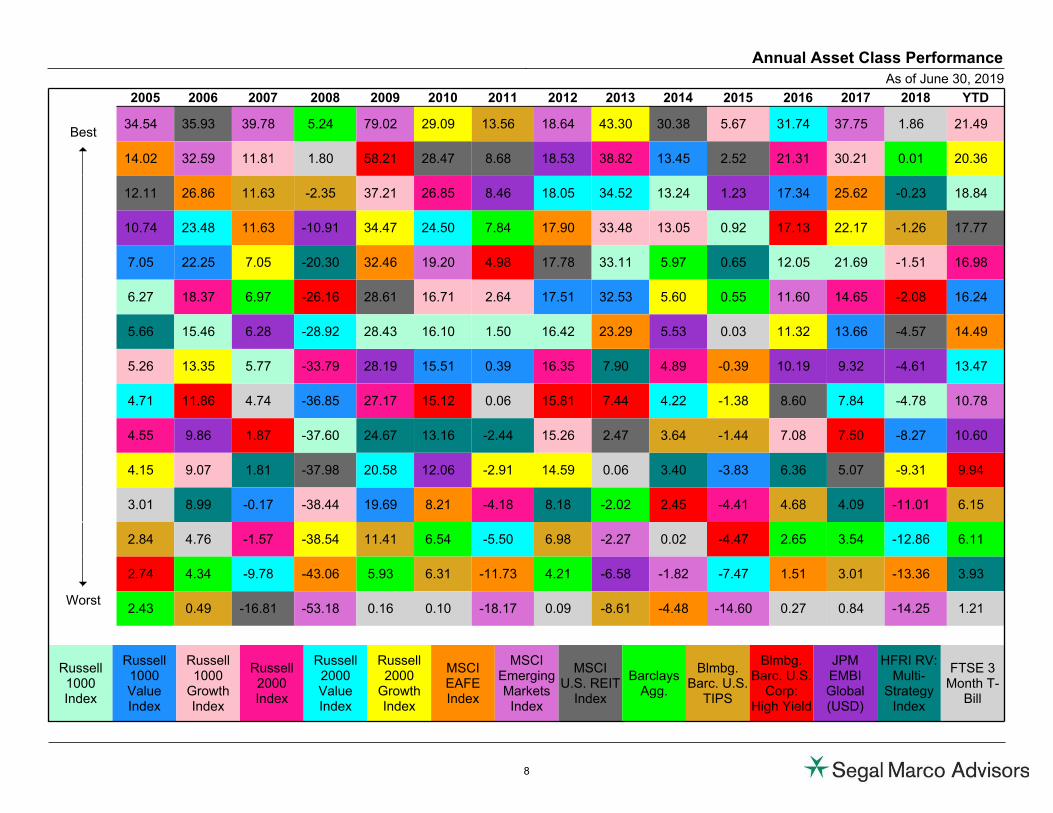
2005 2006 2007 2008 2009 2010 2011 2012 2013 2014 2015 2016 2017 2018 YTD
Best34.54 35.93 39.78 5.24 79.02 29.09 13.56 18.64 43.30 30.38 5.67 31.74 37.75 1.86 21.49
514.02 32.59 11.81 1.80 58.21 28.47 8.68 18.53 38.82 13.45 2.52 21.31 30.21 0.01 20.36
12.11 26.86 11.63 -2.35 37.21 26.85 8.46 18.05 34.52 13.24 1.23 17.34 25.62 -0.23 18.84
10.74 23.48 11.63 -10.91 34.47 24.50 7.84 17.90 33.48 13.05 0.92 17.13 22.17 -1.26 17.77
7.05 22.25 7.05 -20.30 32.46 19.20 4.98 17.78 33.11 5.97 0.65 12.05 21.69 -1.51 16.98
6.27 18.37 6.97 -26.16 28.61 16.71 2.64 17.51 32.53 5.60 0.55 11.60 14.65 -2.08 16.24
5.66 15.46 6.28 -28.92 28.43 16.10 1.50 16.42 23.29 5.53 0.03 11.32 13.66 -4.57 14.49
5.26 13.35 5.77 -33.79 28.19 15.51 0.39 16.35 7.90 4.89 -0.39 10.19 9.32 -4.61 13.47
4.71 11.86 4.74 -36.85 27.17 15.12 0.06 15.81 7.44 4.22 -1.38 8.60 7.84 -4.78 10.78
4.55 9.86 1.87 -37.60 24.67 13.16 -2.44 15.26 2.47 3.64 -1.44 7.08 7.50 -8.27 10.60
4.15 9.07 1.81 -37.98 20.58 12.06 -2.91 14.59 0.06 3.40 -3.83 6.36 5.07 -9.31 9.94
3.01 8.99 -0.17 -38.44 19.69 8.21 -4.18 8.18 -2.02 2.45 -4.41 4.68 4.09 -11.01 6.15
2.84 4.76 -1.57 -38.54 11.41 6.54 -5.50 6.98 -2.27 0.02 -4.47 2.65 3.54 -12.86 6.11
62.74 4.34 -9.78 -43.06 5.93 6.31 -11.73 4.21 -6.58 -1.82 -7.47 1.51 3.01 -13.36 3.93
Worst2.43 0.49 -16.81 -53.18 0.16 0.10 -18.17 0.09 -8.61 -4.48 -14.60 0.27 0.84 -14.25 1.21
Russell1000Index
Russell1000ValueIndex
Russell1000
GrowthIndex
Russell2000Index
Russell2000ValueIndex
Russell2000
GrowthIndex
MSCIEAFEIndex
MSCIEmergingMarkets
Index
MSCIU.S. REIT
Index
BarclaysAgg.
Blmbg.Barc. U.S.
TIPS
Blmbg.Barc. U.S.
Corp:High Yield
JPMEMBIGlobal(USD)
HFRI RV:Multi-
StrategyIndex
FTSE 3Month T-
Bill
Annual Asset Class Performance
As of June 30, 2019
8
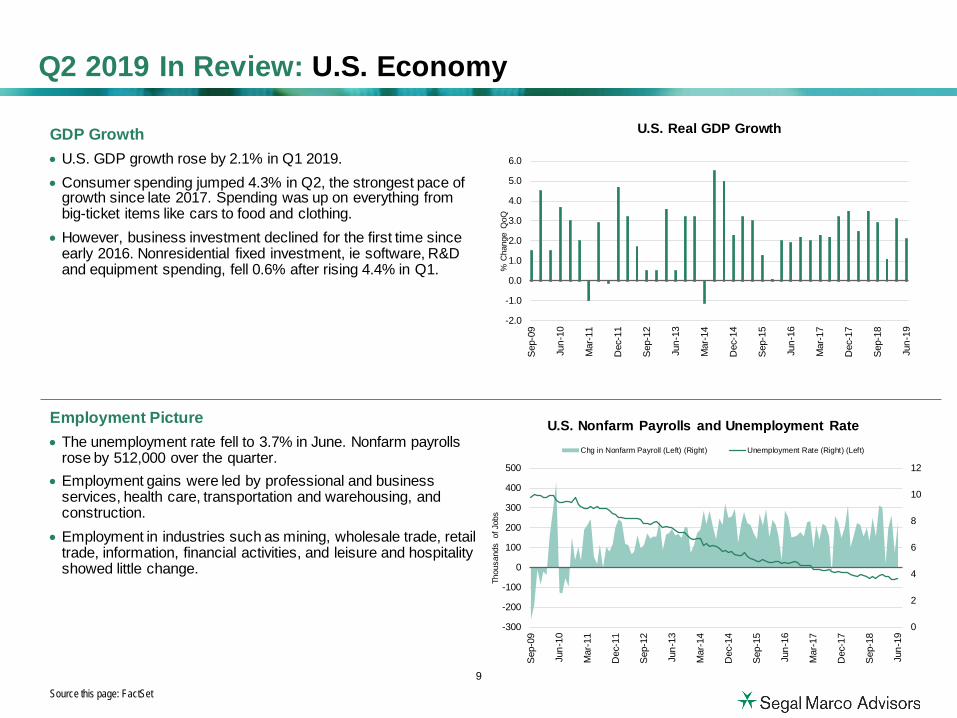
GDP Growth• U.S. GDP growth rose by 2.1% in Q1 2019.• Consumer spending jumped 4.3% in Q2, the strongest pace of
growth since late 2017. Spending was up on everything frombig-ticket items like cars to food and clothing.
• However, business investment declined for the first time sinceearly 2016. Nonresidential fixed investment, ie software, R&Dand equipment spending, fell 0.6% after rising 4.4% in Q1.
Employment Picture• The unemployment rate fell to 3.7% in June. Nonfarm payrolls
rose by 512,000 over the quarter. • Employment gains were led by professional and business
services, health care, transportation and warehousing, andconstruction.
• Employment in industries such as mining, wholesale trade, retailtrade, information, financial activities, and leisure and hospitalityshowed little change.
Q2 2019 In Review: U.S. Economy
Source this page: FactSet
0
2
4
6
8
10
12
-300
-200
-100
0
100
200
300
400
500
Sep-
09
Jun-
10
Mar
-11
Dec
-11
Sep-
12
Jun-
13
Mar
-14
Dec
-14
Sep-
15
Jun-
16
Mar
-17
Dec
-17
Sep-
18
Jun-
19
Thou
sand
s of
Job
s
U.S. Nonfarm Payrolls and Unemployment RateChg in Nonfarm Payroll (Left) (Right) Unemployment Rate (Right) (Left)
-2.0
-1.0
0.0
1.0
2.0
3.0
4.0
5.0
6.0
Sep-
09
Jun-
10
Mar
-11
Dec
-11
Sep-
12
Jun-
13
Mar
-14
Dec
-14
Sep-
15
Jun-
16
Mar
-17
Dec
-17
Sep-
18
Jun-
19
% C
hang
e Q
oQ
U.S. Real GDP Growth
9
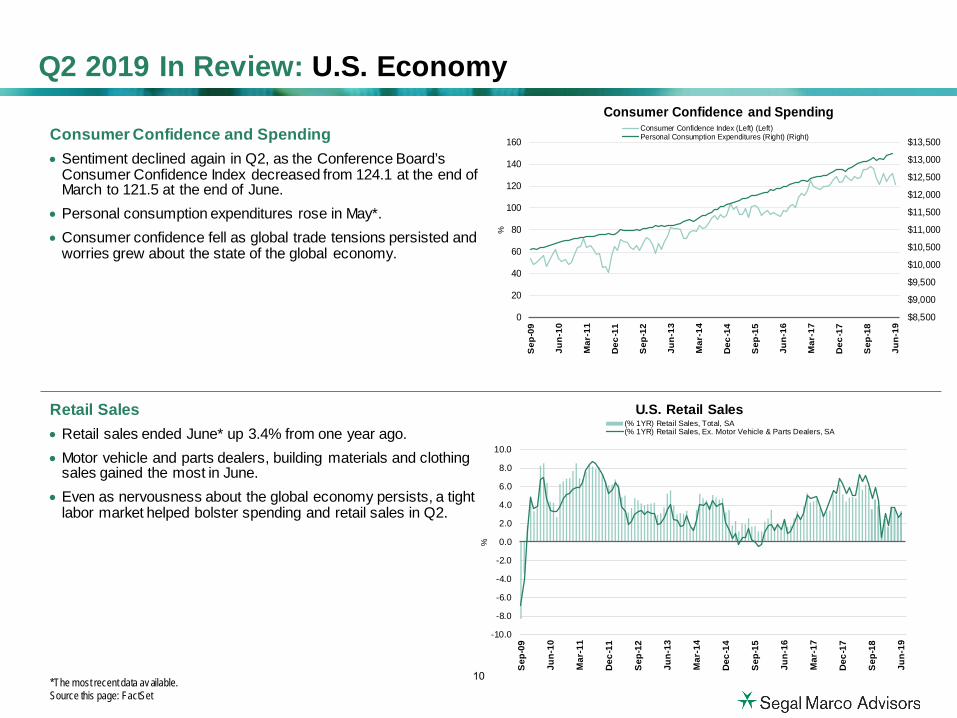
Consumer Confidence and Spending• Sentiment declined again in Q2, as the Conference Board’s
Consumer Confidence Index decreased from 124.1 at the end ofMarch to 121.5 at the end of June.
• Personal consumption expenditures rose in May*.• Consumer confidence fell as global trade tensions persisted and
worries grew about the state of the global economy.
Retail Sales• Retail sales ended June* up 3.4% from one year ago.• Motor vehicle and parts dealers, building materials and clothing
sales gained the most in June.• Even as nervousness about the global economy persists, a tight
labor market helped bolster spending and retail sales in Q2.
Q2 2019 In Review: U.S. Economy
*The most recent data av ailable.Source this page: FactSet
$8,500
$9,000
$9,500
$10,000
$10,500
$11,000
$11,500
$12,000
$12,500
$13,000
$13,500
0
20
40
60
80
100
120
140
160
Sep
-09
Jun-
10
Mar
-11
Dec
-11
Sep
-12
Jun-
13
Mar
-14
Dec
-14
Sep
-15
Jun-
16
Mar
-17
Dec
-17
Sep
-18
Jun-
19
%
Consumer Confidence and SpendingConsumer Confidence Index (Left) (Left)Personal Consumption Expenditures (Right) (Right)
-10.0
-8.0
-6.0
-4.0
-2.0
0.0
2.0
4.0
6.0
8.0
10.0
Sep-
09
Jun-
10
Mar
-11
Dec-
11
Sep-
12
Jun-
13
Mar
-14
Dec-
14
Sep-
15
Jun-
16
Mar
-17
Dec-
17
Sep-
18
Jun-
19
%
U.S. Retail Sales(% 1YR) Retail Sales, Total, SA(% 1YR) Retail Sales, Ex. Motor Vehicle & Parts Dealers, SA
10
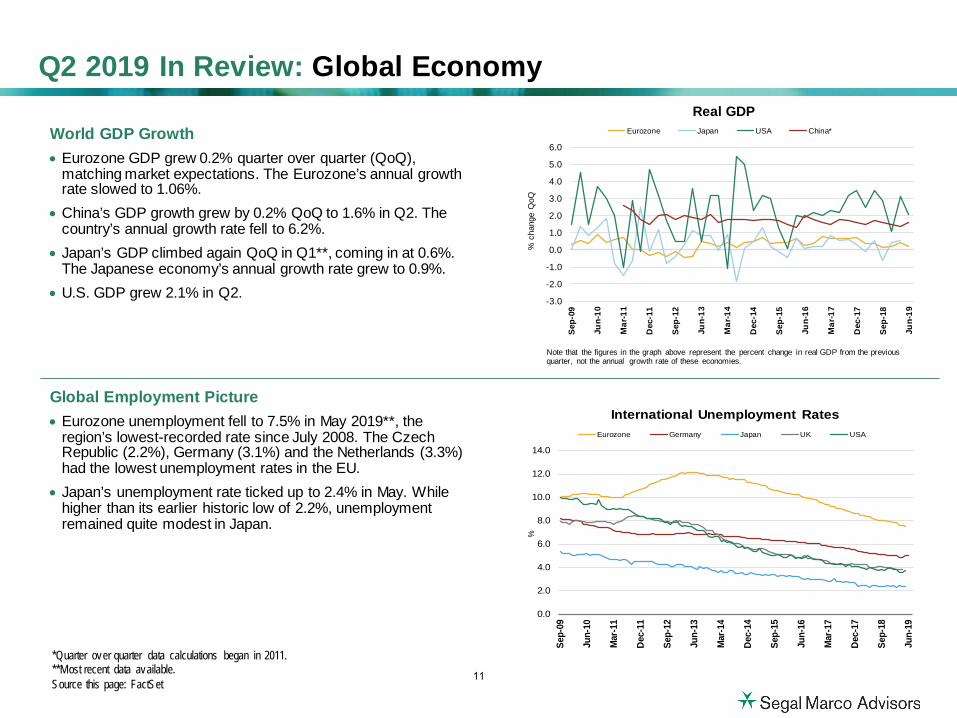
World GDP Growth• Eurozone GDP grew 0.2% quarter over quarter (QoQ),
matching market expectations. The Eurozone’s annual growth rate slowed to 1.06%.
• China’s GDP growth grew by 0.2% QoQ to 1.6% in Q2. Thecountry’s annual growth rate fell to 6.2%.
• Japan’s GDP climbed again QoQ in Q1**, coming in at 0.6%.The Japanese economy’s annual growth rate grew to 0.9%.
• U.S. GDP grew 2.1% in Q2.
Global Employment Picture• Eurozone unemployment fell to 7.5% in May 2019**, the
region’s lowest-recorded rate since July 2008. The Czech Republic (2.2%), Germany (3.1%) and the Netherlands (3.3%) had the lowest unemployment rates in the EU.
• Japan’s unemployment rate ticked up to 2.4% in May. Whilehigher than its earlier historic low of 2.2%, unemploymentremained quite modest in Japan.
Q2 2019 In Review: Global Economy
*Quarter over quarter data calculations began in 2011.**Most recent data available.Source this page: FactSet
Note that the figures in the graph above represent the percent change in real GDP from the previous quarter, not the annual growth rate of these economies.
0.0
2.0
4.0
6.0
8.0
10.0
12.0
14.0
Sep-
09
Jun-
10
Mar
-11
Dec-
11
Sep-
12
Jun-
13
Mar
-14
Dec-
14
Sep-
15
Jun-
16
Mar
-17
Dec-
17
Sep-
18
Jun-
19
%
International Unemployment RatesEurozone Germany Japan UK USA
-3.0
-2.0
-1.0
0.0
1.0
2.0
3.0
4.0
5.0
6.0
Sep-
09
Jun-
10
Mar
-11
Dec
-11
Sep-
12
Jun-
13
Mar
-14
Dec
-14
Sep-
15
Jun-
16
Mar
-17
Dec
-17
Sep-
18
Jun-
19
% c
hang
e Q
oQ
Real GDPEurozone Japan USA China*
11

Global Equity Performance and Valuations• Equity markets were broadly higher in Q2 despite ongoing global
trade tensions and disappointing economic data. The markets’ gainscame with the possibility of a rate cut from the Federal Reserve aswell as hopes that trade relations between the U.S. and China maybe improving.
• While stocks were lower in May when worries around trade tensionsescalated, they bounced back in June with prospects of a Fed ratecut.
• Developed market equities were positive in the quarter, though theylagged U.S. stocks. Emerging markets had a much sharper reaction to the renewed tariff threats and the MSCI EM Index made a smallergain relative to its developed counterparts.
• Global equity valuations were elevated, with P/Es on U.S. andemerging market stocks above historic medians. Only developedmarket equity valuations were a bit below median at the end of Q2.
Q2 2019 In Review: Global Equity Overview
Source this page: FactSet
Equity Indices QTD YTD 1-Year 3-Year 5-Year 10-Year
S&P 500 4.30 18.54 10.42 14.19 10.71 14.70
MSCI Europe, Australasia and Far East (EAFE)* 3.68 14.03 1.08 9.11 2.25 6.90
MSCI Emerging Markets (EM)* 0.61 10.58 1.21 10.66 2.49 5.81
Data range is from 3/31/00-06/30/19. P/E ratios are forward 12 months.
All data in the table are percentages.* Net of div idends
S&P 500 S&P 400 S&P 600 MSCI EAFE MSCI EMHigh 25.5 18.0 23.1 27.2 14.4Low 10.3 10.2 9.9 9.4 8.3Median 15.2 15.2 15.8 13.9 11.0Current 16.8 15.9 16.5 13.6 12.3Previous 16.5 15.5 16.5 13.3 12.2
0.0
5.0
10.0
15.0
20.0
25.0
30.0
Fo
rwa
rd P
rice
to
Ea
rnin
gs
(x)
Price to Earnings
Median Current
10-Yr Avg 14.9 15.6 15.6 13.2 11.3
12

U.S. Equity
Performance• Fueled by optimism about future U.S./China trade relations, the
S&P 500 hit a record high during 2Q. The top performing sector in2Q was Financials with a return of +8% in 2Q19. The next twowere Materials (+6.3%) and Technology (+6.1%). The Fed’s dovishpivot and an ensuing decline in longer rates drove performance inthe defensive Real Estate (+2.5%) and Utilities (+3.5%).
• Energy was the worst performing sector in the S&P 500 during 2Q(-2.8%). No other sector posted negative returns. The energysector has seen two abysmal quarters over the past year withprimarily supply driven volatility for oil and gas prices.
• All capitalization sizes were positive in the quarter. Both growthand value stocks gained, though growth outperformed value.
Q2 2019 In Review: U.S. Equity
Sources this page: Investment Metrics, FactSet
U.S. Equity Indices QTD YTD 1-Year 3-Year 5-Year 10-Year
S&P 500 4.30 18.54 10.42 14.19 10.71 14.70Russell 1000 4.25 18.84 10.02 14.15 10.45 14.77Russell 1000 Growth 4.64 21.49 11.56 18.07 13.39 16.28Russell 1000 Value 3.84 16.24 8.46 10.19 7.46 13.19Russell 2000 2.10 16.98 -3.31 12.30 7.06 13.45Russell 2000 Growth 2.75 20.36 -0.49 14.69 8.63 14.41Russell 2000 Value 1.38 13.47 -6.24 9.81 5.39 12.40Russell 3000 4.10 18.71 8.98 14.02 10.19 14.67
S&P 500 Sector Returns QTD 1-Year
Cons. Disc. 5.28 10.17
Cons. Staples 3.72 16.39
Energy -2.83 -13.25
Financials 8.00 6.31
Healthcare 1.38 12.99
Industrials 3.57 10.43
IT 6.06 14.34
Materials 6.31 3.20Telecom 4.49 13.66Real Estate 2.46 16.80Utilities 3.48 19.03
All data in the tables are percentages.
13

U.S. Equity
Performance• Following a strong Q1, international developed markets continued to
rise in Q2, though the pace of gains slowed. The MSCI EAFE, a proxyfor international developed markets, rose 3.7%, trailing domesticmarkets. Switzerland, Australia and Germany were the top performers,all returning between 7 and 9%, while Israel (-3.6%), Austria andFinland lagged.
• Brexit continues to loom over UK stocks, with lingering fears of anabrupt “no-deal” exit from the EU. Ex UK, however, European stocksmade solid gains, with global trade tensions staying relatively stable inthe quarter and with European Central Bank President Mario Draghihinting at further monetary easing to come.
• While Real Estate was negative in Q2, all other EAFE sectors were positive. Cyclical sectors such as Information Technology, ConsumerDiscretionary and Industrials led, while defensive sectors, such asConsumer Staples, Utilities and Healthcare, lagged the benchmark.
Q2 2019 In Review: International Equity
Sources this page: Investment Metrics, FactSet
MSCI International Equity Indices QTD YTD 1-Year 3-Year 5-Year 10-Year
World ex. U.S. 3.79 14.64 1.29 9.01 2.04 6.75EAFE 3.68 14.03 1.08 9.11 2.25 6.90EAFE Local Currency 2.80 13.68 2.17 9.80 5.85 8.35Europe 4.48 15.80 1.88 9.11 1.27 6.99Europe ex U.K. 5.82 16.88 3.39 10.00 1.91 6.99U.K. 0.91 12.91 -2.05 6.90 -0.31 6.82Japan 1.02 7.75 -4.19 8.06 4.47 5.85Pacific Asia ex Japan 5.16 18.03 8.06 11.94 4.04 8.92
MSCI EAFE Sector Returns QTD 1-Year
Consumer Disc. 5.90 -2.57
Cons. Staples 1.91 4.81
Energy 0.37 -5.54
Financials 4.28 -2.89
Healthcare 2.04 7.50
Industrials 5.88 2.40
IT 6.56 2.68
Materials 3.91 0.15Telecom 4.03 4.34Utilities 1.49 9.80Real Estate -2.17 2.30
All data in the tables are percentages and net of div idends.
14
U.S. Equity
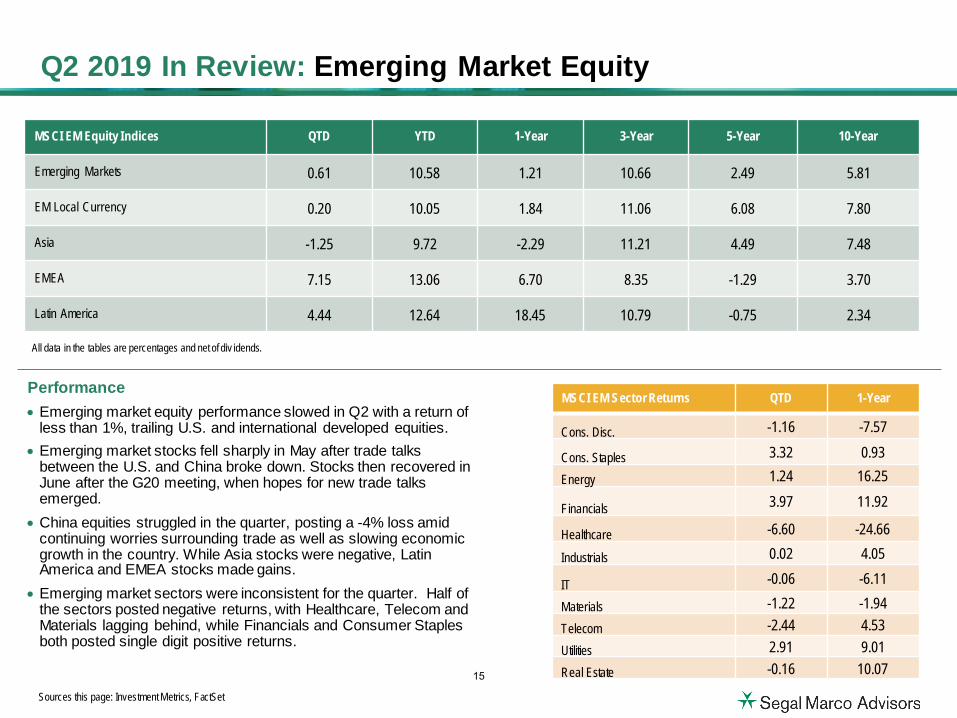
Performance• Emerging market equity performance slowed in Q2 with a return of
less than 1%, trailing U.S. and international developed equities.• Emerging market stocks fell sharply in May after trade talks
between the U.S. and China broke down. Stocks then recovered inJune after the G20 meeting, when hopes for new trade talksemerged.
• China equities struggled in the quarter, posting a -4% loss amid continuing worries surrounding trade as well as slowing economicgrowth in the country. While Asia stocks were negative, LatinAmerica and EMEA stocks made gains.
• Emerging market sectors were inconsistent for the quarter. Half ofthe sectors posted negative returns, with Healthcare, Telecom and Materials lagging behind, while Financials and Consumer Staplesboth posted single digit positive returns.
Q2 2019 In Review: Emerging Market Equity
Sources this page: Investment Metrics, FactSet
MSCI EM Equity Indices QTD YTD 1-Year 3-Year 5-Year 10-Year
Emerging Markets 0.61 10.58 1.21 10.66 2.49 5.81
EM Local Currency 0.20 10.05 1.84 11.06 6.08 7.80
Asia -1.25 9.72 -2.29 11.21 4.49 7.48
EMEA 7.15 13.06 6.70 8.35 -1.29 3.70
Latin America 4.44 12.64 18.45 10.79 -0.75 2.34
MSCI EM Sector Returns QTD 1-Year
Cons. Disc. -1.16 -7.57
Cons. Staples 3.32 0.93
Energy 1.24 16.25
Financials 3.97 11.92
Healthcare -6.60 -24.66
Industrials 0.02 4.05
IT -0.06 -6.11
Materials -1.22 -1.94Telecom -2.44 4.53Utilities 2.91 9.01Real Estate -0.16 10.07
All data in the tables are percentages and net of div idends.
15

Yield Curve• Treasury yields continued to fall across the curve in Q2, with the
Fed now ruling out interest rate hikes in 2019, and with global growth slowing.
• Global demand for Treasuries also contributed to lower yieldsacross all tenors. Trends from Q1 among shorter maturities continued, with the 5-yr yield (1.76%) falling below the 3 month yield (2.12%).
• The 30-year Treasury ended the quarter yielding 2.18%, whichwas 25 basis points (bps) lower than its yield at the end of Q1.The 2-year Treasury ended the quarter at 1.75%, which was 25bps lower than the prior quarter.
Monetary Policies/Global Interest Rates• Central bank deposit rates remained negative in Japan and
Europe. Slow growth and worries surrounding global trade uncertainty kept central banks on hold.
• The U.S. continues to be a global outlier with its policy rate at2.5%. Policy rates in the Eurozone and Japan remain negative.
• The Fed did not hike in Q2 as its plans for future rate increaseshave been dashed due to uncertainty surrounding economicgrowth and the effect of trade tensions.
Q2 2019 In Review: Fixed Income Overview
Source this page: FactSet
Interest Rates Fed Funds Rate EZ Deposit Facility Rate
Average 5.15% (1971-2019) 1.02% (1999-2019)
Max 20.0% (Mar. 1980) 3.75% (Oct. 2000)
Min 0.25% (Dec. 2008) -0.40% (Mar. 2016)
1M3M6M 1Y 2Y 3Y 5Y 7Y 10Y 30Y1.6%
1.8%
2.0%
2.2%
2.4%
2.6%
2.8%
3.0%
3.2%
Yiel
d(%
)06/28/2019
03/29/2019
12/31/2018
United States Treasury Yield Curve
7/01
/201
4
10/0
1/20
14
1/01
/201
5
4/01
/201
5
7/01
/201
5
10/0
1/20
15
1/01
/201
6
4/01
/201
6
7/01
/201
6
10/0
3/20
16
1/02
/201
7
4/03
/201
7
7/03
/201
7
10/0
2/20
17
1/01
/201
8
4/02
/201
8
7/02
/201
8
10/0
1/20
18
1/01
/201
9
4/01
/201
9
-1.0-0.50.00.51.01.52.02.53.0
%
Central Bank Target RatesFed Fund Target Rate Japan Target RateEurozone Deposit Facility - Yield
16
Q2 2019 In Review: U.S. Fixed Income
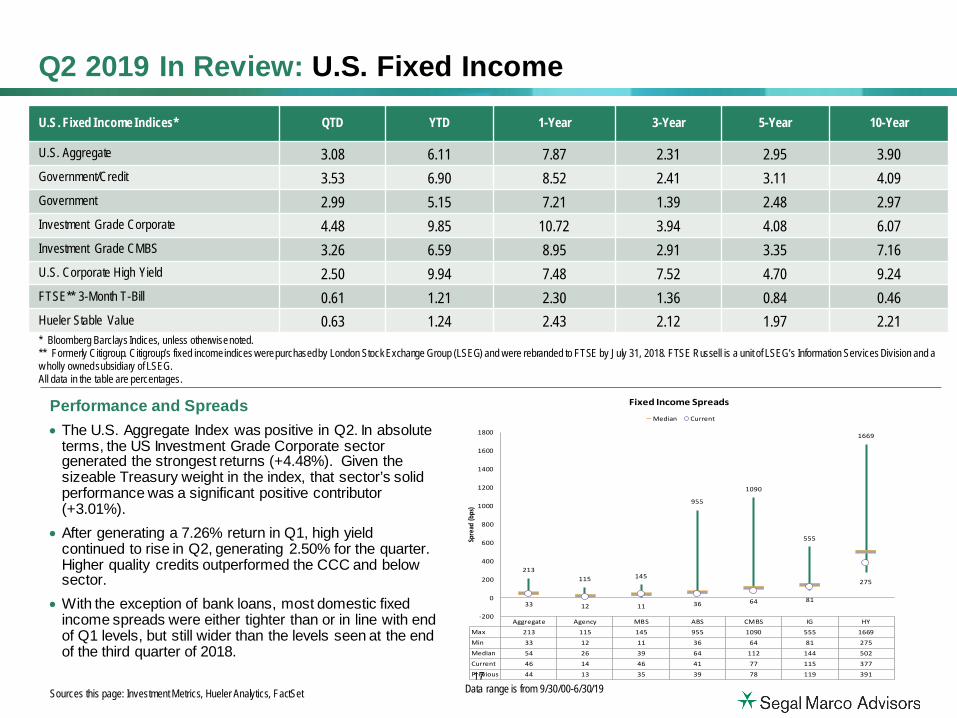
Performance and Spreads• The U.S. Aggregate Index was positive in Q2. In absolute
terms, the US Investment Grade Corporate sector generated the strongest returns (+4.48%). Given the sizeable Treasury weight in the index, that sector’s solid performance was a significant positive contributor (+3.01%).
• After generating a 7.26% return in Q1, high yieldcontinued to rise in Q2, generating 2.50% for the quarter. Higher quality credits outperformed the CCC and below sector.
• With the exception of bank loans, most domestic fixed income spreads were either tighter than or in line with end of Q1 levels, but still wider than the levels seen at the end of the third quarter of 2018.
Sources this page: Investment Metrics, Hueler Analytics, FactSet
* Bloomberg Barclays Indices, unless otherwise noted.** Formerly Citigroup. Citigroup’s fixed income indices were purchased by London Stock Exchange Group (LSEG) and were rebranded to FTSE by July 31, 2018. FTSE Russell is a unit of LSEG’s Information Services Division and a w holly owned subsidiary of LSEG.All data in the table are percentages.
U.S. Fixed Income Indices* QTD YTD 1-Year 3-Year 5-Year 10-Year
U.S. Aggregate 3.08 6.11 7.87 2.31 2.95 3.90Government/Credit 3.53 6.90 8.52 2.41 3.11 4.09Government 2.99 5.15 7.21 1.39 2.48 2.97Investment Grade Corporate 4.48 9.85 10.72 3.94 4.08 6.07Investment Grade CMBS 3.26 6.59 8.95 2.91 3.35 7.16U.S. Corporate High Yield 2.50 9.94 7.48 7.52 4.70 9.24FTSE** 3-Month T-Bill 0.61 1.21 2.30 1.36 0.84 0.46Hueler Stable Value 0.63 1.24 2.43 2.12 1.97 2.21
Data range is from 9/30/00-6/30/19
Aggregate Agency MBS ABS CMBS IG HYMax 213 115 145 955 1090 555 1669Min 33 12 11 36 64 81 275Median 54 26 39 64 112 144 502Current 46 14 46 41 77 115 377Previous 44 13 35 39 78 119 391
213115 145
955
1090
555
1669
33 12 11 36 64 81
275
-200
0
200
400
600
800
1000
1200
1400
1600
1800
Spre
ad (b
ps)
Fixed Income Spreads
Median Current
17
Q2 2019 In Review: International Fixed Income
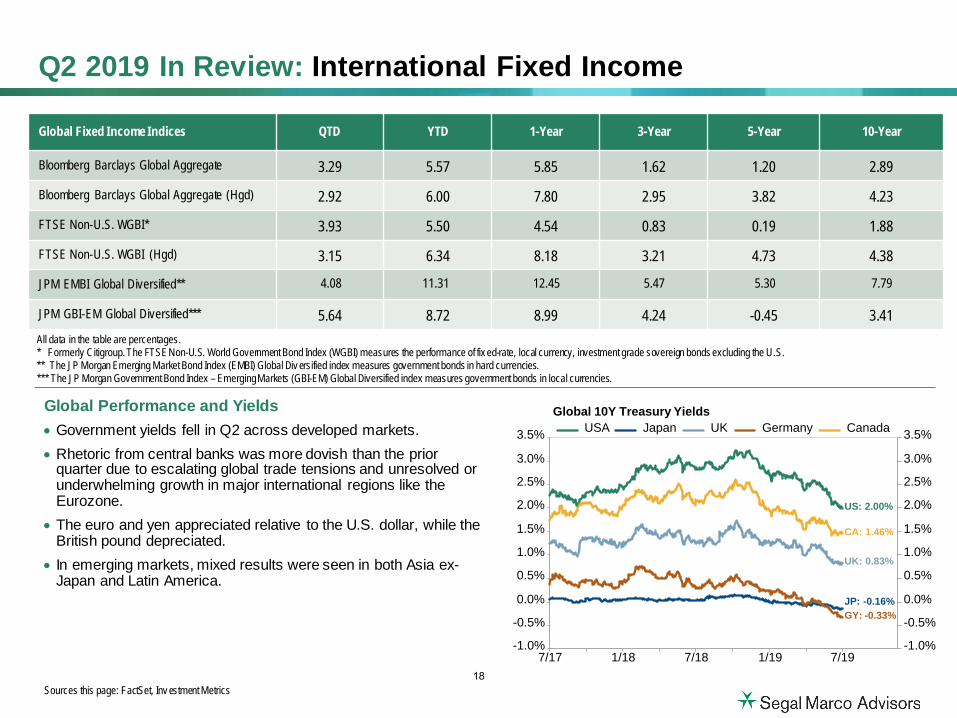
Global Performance and Yields• Government yields fell in Q2 across developed markets.• Rhetoric from central banks was more dovish than the prior
quarter due to escalating global trade tensions and unresolved orunderwhelming growth in major international regions like theEurozone.
• The euro and yen appreciated relative to the U.S. dollar, while theBritish pound depreciated.
• In emerging markets, mixed results were seen in both Asia ex-Japan and Latin America.
Sources this page: FactSet, Inv estment Metrics
Global Fixed Income Indices QTD YTD 1-Year 3-Year 5-Year 10-Year
Bloomberg Barclays Global Aggregate 3.29 5.57 5.85 1.62 1.20 2.89
Bloomberg Barclays Global Aggregate (Hgd) 2.92 6.00 7.80 2.95 3.82 4.23
FTSE Non-U.S. WGBI* 3.93 5.50 4.54 0.83 0.19 1.88
FTSE Non-U.S. WGBI (Hgd) 3.15 6.34 8.18 3.21 4.73 4.38
JPM EMBI Global Diversified**
JPM GBI-EM Global Diversified*** 5.64 8.72 8.99 4.24 -0.45 3.41All data in the table are percentages.* Formerly Citigroup. The FTSE Non-U.S. World Government Bond Index (WGBI) measures the performance of fix ed-rate, local currency, investment grade sovereign bonds excluding the U.S.** The JP Morgan Emerging Market Bond Index (EMBI) Global Div ersified index measures government bonds in hard currencies.*** The JP Morgan Government Bond Index – Emerging Markets (GBI-EM) Global Diversified index measures government bonds in local currencies.
7/17 1/18 7/18 1/19 7/19-1.0%-1.0%
-0.5%-0.5%
0.0%0.0%
0.5%0.5%
1.0%1.0%
1.5%1.5%
2.0%2.0%
2.5%2.5%
3.0%3.0%
3.5%3.5%
GY: -0.33%JP: -0.16%
UK: 0.83%
CA: 1.46%
US: 2.00%
Global 10Y Treasury YieldsUSA Japan UK Germany Canada
4.08 11.31 12.45 5.47 5.30 7.79
18
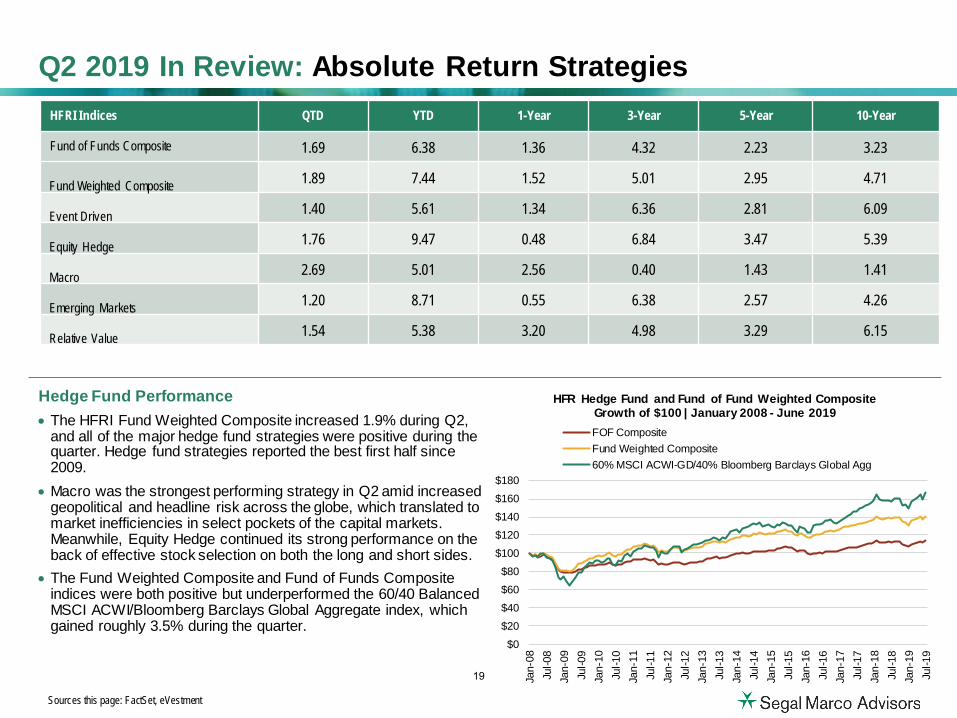
Hedge Fund Performance• The HFRI Fund Weighted Composite increased 1.9% during Q2,
and all of the major hedge fund strategies were positive during thequarter. Hedge fund strategies reported the best first half since2009.
• Macro was the strongest performing strategy in Q2 amid increased geopolitical and headline risk across the globe, which translated tomarket inefficiencies in select pockets of the capital markets.Meanwhile, Equity Hedge continued its strong performance on theback of effective stock selection on both the long and short sides.
• The Fund Weighted Composite and Fund of Funds Compositeindices were both positive but underperformed the 60/40 BalancedMSCI ACWI/Bloomberg Barclays Global Aggregate index, whichgained roughly 3.5% during the quarter.
Q2 2019 In Review: Absolute Return Strategies
Sources this page: FactSet, eVestment
HFRI Indices QTD YTD 1-Year 3-Year 5-Year 10-Year
Fund of Funds Composite 1.69 6.38 1.36 4.32 2.23 3.23
Fund Weighted Composite 1.89 7.44 1.52 5.01 2.95 4.71
Event Driven 1.40 5.61 1.34 6.36 2.81 6.09
Equity Hedge 1.76 9.47 0.48 6.84 3.47 5.39
Macro 2.69 5.01 2.56 0.40 1.43 1.41
Emerging Markets 1.20 8.71 0.55 6.38 2.57 4.26
Relative Value 1.54 5.38 3.20 4.98 3.29 6.15
$0$20$40$60$80
$100$120$140$160$180
Jan-
08Ju
l-08
Jan-
09Ju
l-09
Jan-
10Ju
l-10
Jan-
11Ju
l-11
Jan-
12Ju
l-12
Jan-
13Ju
l-13
Jan-
14Ju
l-14
Jan-
15Ju
l-15
Jan-
16Ju
l-16
Jan-
17Ju
l-17
Jan-
18Ju
l-18
Jan-
19Ju
l-19
HFR Hedge Fund and Fund of Fund Weighted CompositeGrowth of $100 | January 2008 - June 2019FOF CompositeFund Weighted Composite60% MSCI ACWI-GD/40% Bloomberg Barclays Global Agg
19

Performance• The total return for private equity funds, comprising
performance across all regions and strategies, was 4.9% in Q1 2019* and 12.7% over the 1-year period ending Q1.
• The 5-, 10-, and 20-year returns for private equity fundswere 12.1%, 15.2% and 12.6%, respectively, at the end ofQ1. Venture funds continued to outperform other strategiesover the most recent five years, however, fewer distributionswere seen from Venture funds than others.
• The 2017-vintages generated a double-digit return acrossstrategies by Q1 2019.
Fundraising• Globally, private equity funds raised approximately $220.9
billion across 527 funds through June 2019, which wasabout the same amount that was raised in 1H 2018.
• In Q2 2019, fundraising activity was still focused on NorthAmerica, while Europe and Asia closed fewer funds withless capital.
• Dry powder** continues to reach new records, with $1.54trillion as of June 2019, increased $0.28 trillion in a quarter.
Exit Activity• Buyout-backed exit activities continued to slow down in Q2
2019 as 451 exits were made in the quarter. Aggregate dealvalue spiked to $133 billion, however, from $44 billion in Q1.
• Venture-backed exit activities have been buildingmomentum and Q2 saw the greatest number of exits,excluding write-offs, announced since Q4 2017. The valueof those exits reached $56 billion, the highest quarterly totalever since a year ago. This was driven by a number of high-profile mega exits, including the IPO of Uber.
0.0%5.0%
10.0%15.0%20.0%25.0%30.0%
1 Yr. 5 Yr. 10 Yr. 20 Yr. 2017 2016 2015 2014 2013Investment Horizon
Global Private Equity Performance by Investment Horizon and Vintage Year
Total PE Venture Capital Buyouts
Vintage Year
Q2 2019 In Review: Private Equity
Sources this page: Thomson Reuters, Preqin
*Most recent data av ailable.**Dry powder is capital raised that hasn’t y et been invested.
“Vintage y ear” refers to the first y ear that capital w as committed in a particular fund. Vintage-year performance is calculated as the median percentile returns of all funds reporting as pooled IRRs.
0
50
100
150
200
0
200
400
6001Q
142Q
143Q
144Q
141Q
152Q
153Q
154Q
151Q
162Q
163Q
164Q
161Q
172Q
173Q
174Q
171Q
182Q
183Q
184Q
181Q
192Q
19
Aggr
egat
e D
eal V
alue
($bn
)
No.
of E
xits
Global Private Equity Exit
Buyout Exit Value VC Exit Value No. of Buyout Exits No. of VC Exits
050100150200
0200400600800
1Q14
2Q14
3Q14
4Q14
1Q15
2Q15
3Q15
4Q15
1Q16
2Q16
3Q16
4Q16
1Q17
2Q17
3Q17
4Q17
1Q18
2Q18
3Q18
4Q18
1Q19
2Q19
Aggr
egat
e D
eal V
alue
($bn
)
No.
of F
unds
Clo
sed
Global Private Equity Fundraising
Aggregate Capital Raised No. of Funds Closed
20
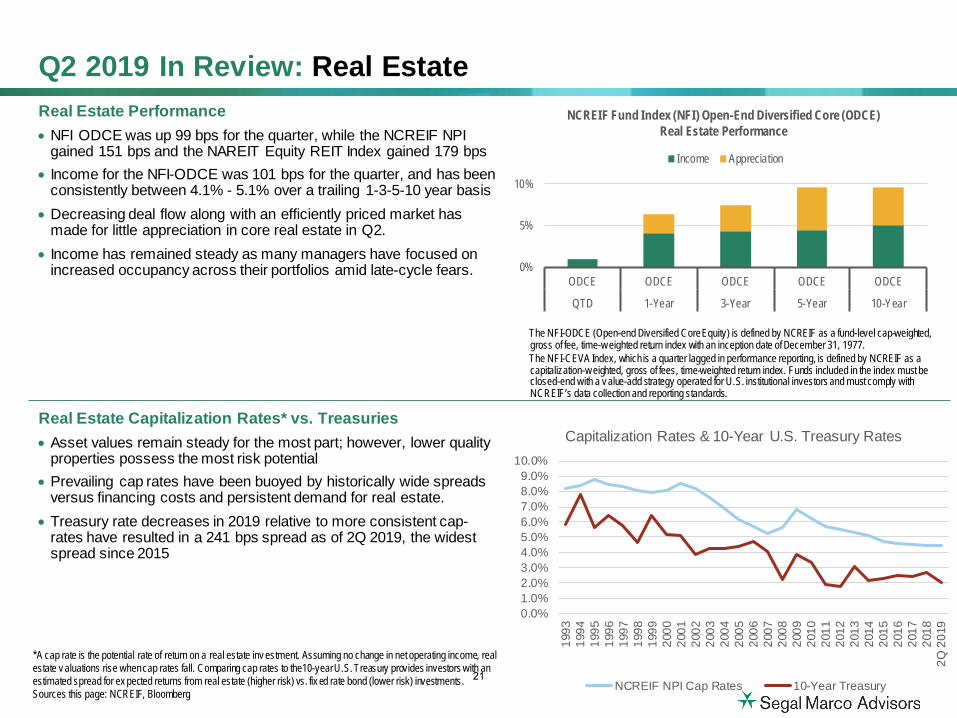
Q2 2019 In Review: Real EstateReal Estate Performance• NFI ODCE was up 99 bps for the quarter, while the NCREIF NPI
gained 151 bps and the NAREIT Equity REIT Index gained 179 bps• Income for the NFI-ODCE was 101 bps for the quarter, and has been
consistently between 4.1% - 5.1% over a trailing 1-3-5-10 year basis• Decreasing deal flow along with an efficiently priced market has
made for little appreciation in core real estate in Q2.• Income has remained steady as many managers have focused on
increased occupancy across their portfolios amid late-cycle fears.
Real Estate Capitalization Rates* vs. Treasuries• Asset values remain steady for the most part; however, lower quality
properties possess the most risk potential• Prevailing cap rates have been buoyed by historically wide spreads
versus financing costs and persistent demand for real estate.• Treasury rate decreases in 2019 relative to more consistent cap-
rates have resulted in a 241 bps spread as of 2Q 2019, the widestspread since 2015
*A cap rate is the potential rate of return on a real estate inv estment. Assuming no change in net operating income, real estate v aluations rise when cap rates fall. Comparing cap rates to the10-year U.S. Treasury provides investors with an estimated spread for ex pected returns from real estate (higher risk) vs. fix ed rate bond (lower risk) investments. Sources this page: NCREIF, Bloomberg
The NFI-ODCE (Open-end Diversified Core Equity) is defined by NCREIF as a fund-level cap-weighted, gross of fee, time-w eighted return index with an inception date of December 31, 1977.The NFI-CEVA Index, which is a quarter lagged in performance reporting, is defined by NCREIF as a capitalization-w eighted, gross of fees, time-weighted return index. Funds included in the index must be closed-end with a v alue-add strategy operated for U.S. institutional investors and must comply with NCREIF’s data collection and reporting standards.
0%
5%
10%
ODCE ODCE ODCE ODCE ODCE
QTD 1-Year 3-Year 5-Year 10-Year
NCREIF Fund Index (NFI) Open-End Diversified Core (ODCE) Real Estate Performance
Income Appreciation
0.0%1.0%2.0%3.0%4.0%5.0%6.0%7.0%8.0%9.0%
10.0%
1993
1994
1995
1996
1997
1998
1999
2000
2001
2002
2003
2004
2005
2006
2007
2008
2009
2010
2011
2012
2013
2014
2015
2016
2017
2018
2Q 2
019
Capitalization Rates & 10-Year U.S. Treasury Rates
NCREIF NPI Cap Rates 10-Year Treasury21
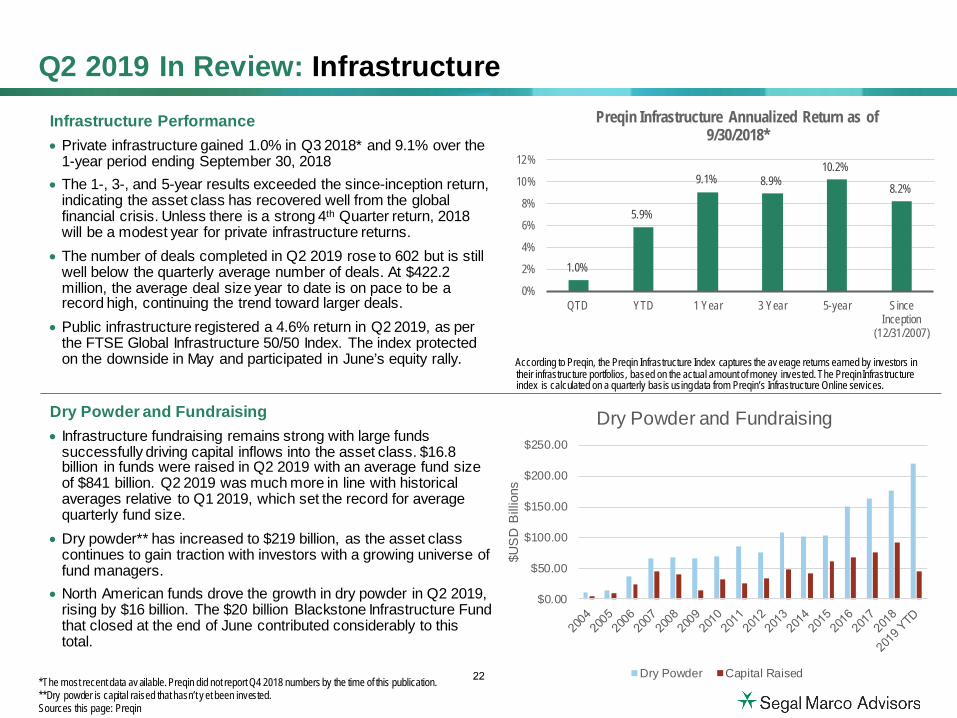
Q2 2019 In Review: InfrastructureInfrastructure Performance • Private infrastructure gained 1.0% in Q3 2018* and 9.1% over the
1-year period ending September 30, 2018• The 1-, 3-, and 5-year results exceeded the since-inception return,
indicating the asset class has recovered well from the globalfinancial crisis. Unless there is a strong 4th Quarter return, 2018 will be a modest year for private infrastructure returns.
• The number of deals completed in Q2 2019 rose to 602 but is stillwell below the quarterly average number of deals. At $422.2million, the average deal size year to date is on pace to be arecord high, continuing the trend toward larger deals.
• Public infrastructure registered a 4.6% return in Q2 2019, as perthe FTSE Global Infrastructure 50/50 Index. The index protectedon the downside in May and participated in June’s equity rally.
Dry Powder and Fundraising• Infrastructure fundraising remains strong with large funds
successfully driving capital inflows into the asset class. $16.8 billion in funds were raised in Q2 2019 with an average fund sizeof $841 billion. Q2 2019 was much more in line with historicalaverages relative to Q1 2019, which set the record for averagequarterly fund size.
• Dry powder** has increased to $219 billion, as the asset classcontinues to gain traction with investors with a growing universe offund managers.
• North American funds drove the growth in dry powder in Q2 2019,rising by $16 billion. The $20 billion Blackstone Infrastructure Fundthat closed at the end of June contributed considerably to thistotal.
*The most recent data av ailable. Preqin did not report Q4 2018 numbers by the time of this publication.**Dry powder is capital raised that hasn’t y et been invested.Sources this page: Preqin
1.0%
5.9%
9.1% 8.9%10.2%
8.2%
0%
2%
4%
6%
8%
10%
12%
QTD YTD 1 Year 3 Year 5-year SinceInception
(12/31/2007)
Preqin Infrastructure Annualized Return as of 9/30/2018*
According to Preqin, the Preqin Infrastructure Index captures the av erage returns earned by investors in their infrastructure portfolios, based on the actual amount of money invested. The PreqinInfrastructure index is calculated on a quarterly basis using data from Preqin’s Infrastructure Online services.
$0.00
$50.00
$100.00
$150.00
$200.00
$250.00
$US
D B
illio
ns
Dry Powder and Fundraising
Dry Powder Capital Raised22
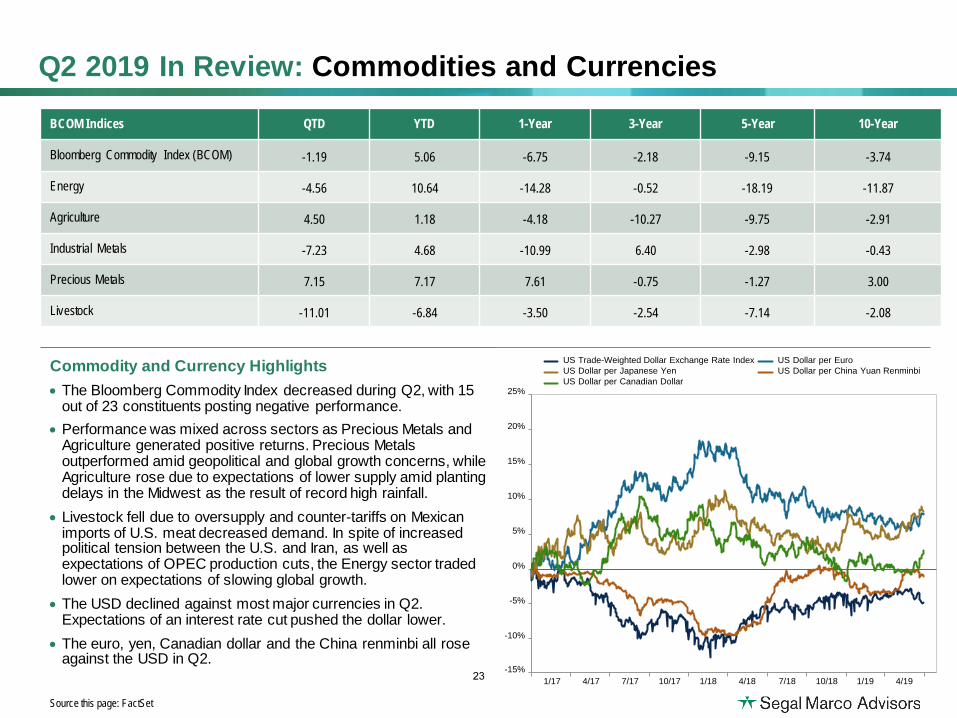
Q2 2019 In Review: Commodities and Currencies
Commodity and Currency Highlights• The Bloomberg Commodity Index decreased during Q2, with 15
out of 23 constituents posting negative performance. • Performance was mixed across sectors as Precious Metals and
Agriculture generated positive returns. Precious Metals outperformed amid geopolitical and global growth concerns, while Agriculture rose due to expectations of lower supply amid planting delays in the Midwest as the result of record high rainfall.
• Livestock fell due to oversupply and counter-tariffs on Mexican imports of U.S. meat decreased demand. In spite of increasedpolitical tension between the U.S. and Iran, as well asexpectations of OPEC production cuts, the Energy sector tradedlower on expectations of slowing global growth.
• The USD declined against most major currencies in Q2.Expectations of an interest rate cut pushed the dollar lower.
• The euro, yen, Canadian dollar and the China renminbi all roseagainst the USD in Q2.
Source this page: FactSet
BCOM Indices QTD YTD 1-Year 3-Year 5-Year 10-Year
Bloomberg Commodity Index (BCOM) -1.19 5.06 -6.75 -2.18 -9.15 -3.74
Energy -4.56 10.64 -14.28 -0.52 -18.19 -11.87
Agriculture 4.50 1.18 -4.18 -10.27 -9.75 -2.91
Industrial Metals -7.23 4.68 -10.99 6.40 -2.98 -0.43
Precious Metals 7.15 7.17 7.61 -0.75 -1.27 3.00
Livestock -11.01 -6.84 -3.50 -2.54 -7.14 -2.08
1/17 4/17 7/17 10/17 1/18 4/18 7/18 10/18 1/19 4/19-15%
-10%
-5%
0%
5%
10%
15%
20%
25%
US Trade-Weighted Dollar Exchange Rate Index US Dollar per EuroUS Dollar per Japanese Yen US Dollar per China Yuan RenminbiUS Dollar per Canadian Dollar
23

Total Plan Overview
24
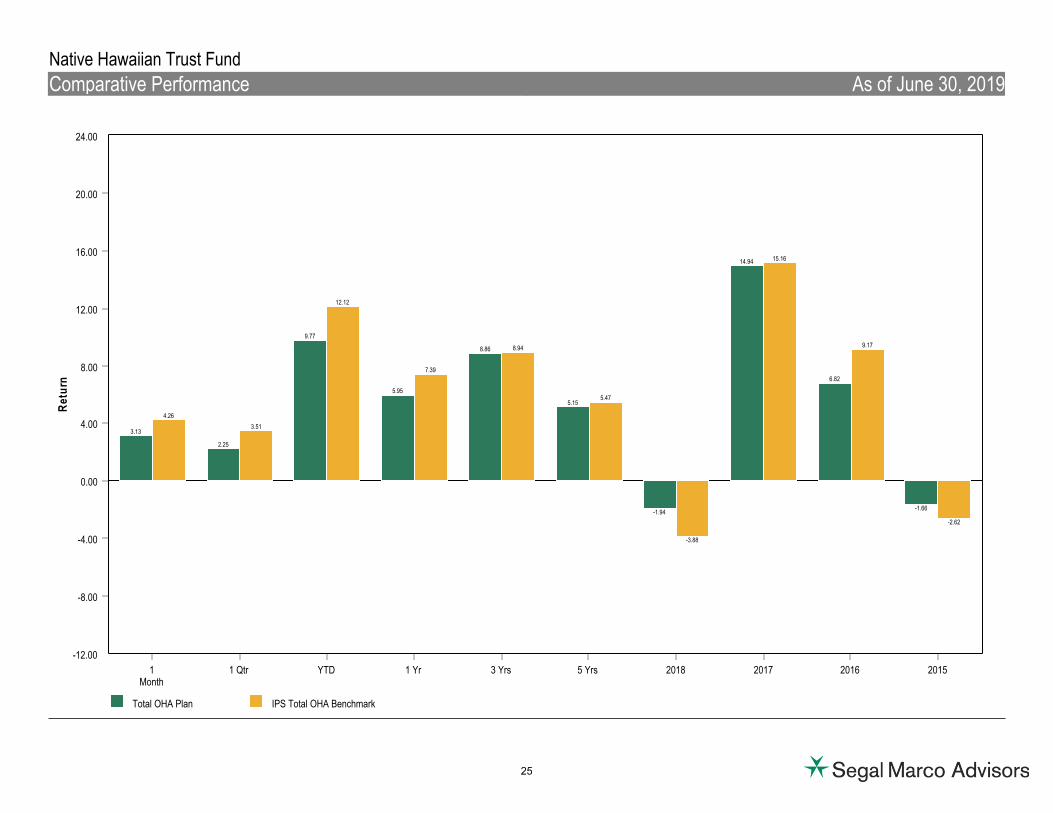
Total OHA Plan IPS Total OHA Benchmark
0.00
4.00
8.00
12.00
16.00
20.00
24.00
-4.00
-8.00
-12.00
Ret
urn
1Month
1 Qtr YTD 1 Yr 3 Yrs 5 Yrs 2018 2017 2016 2015
4.26
3.51
12.12
7.39
8.94
5.47
-3.88
15.16
9.17
-2.62
3.13
2.25
9.77
5.95
8.86
5.15
-1.94
14.94
6.82
-1.66
Native Hawaiian Trust Fund
Comparative Performance As of June 30, 2019
25
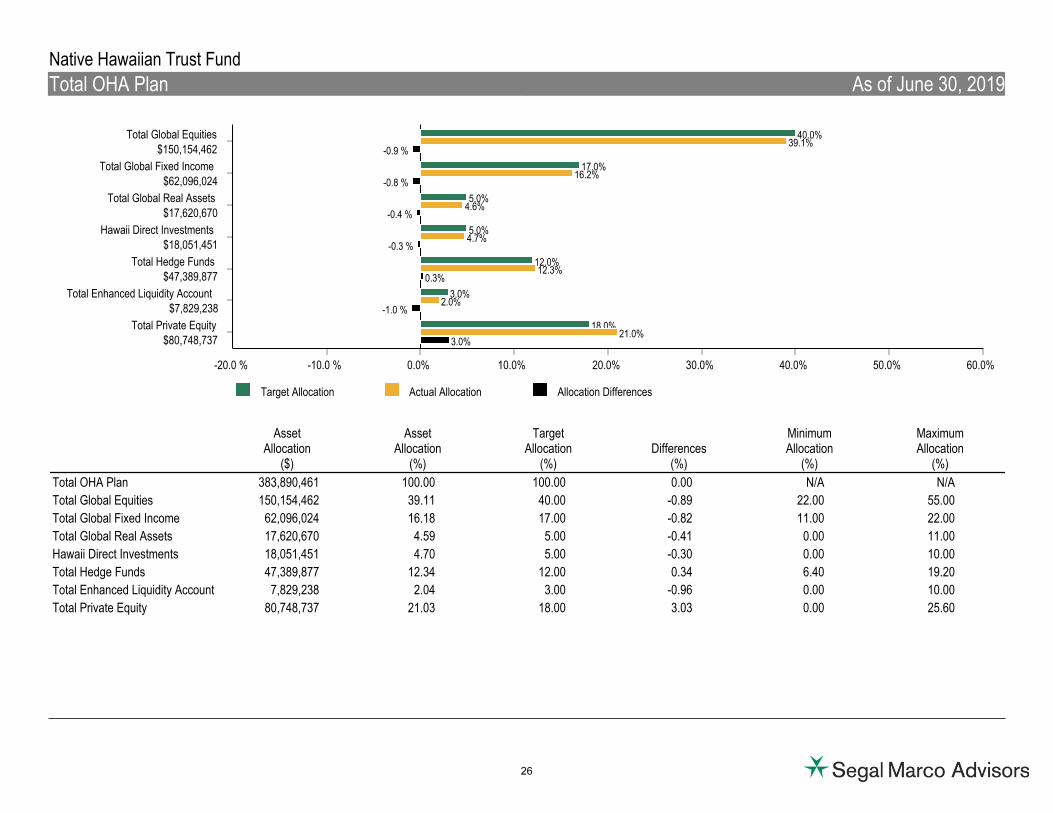
Target Allocation Actual Allocation Allocation Differences
0.0% 10.0% 20.0% 30.0% 40.0% 50.0% 60.0%-10.0 %-20.0 %
Total Private Equity$80,748,737
Total Enhanced Liquidity Account$7,829,238
Total Hedge Funds$47,389,877
Hawaii Direct Investments $18,051,451
Total Global Real Assets$17,620,670
Total Global Fixed Income$62,096,024
Total Global Equities$150,154,462
18.0%
3.0%
12.0%
5.0%
5.0%
17.0%
40.0%
21.0%
2.0%
12.3%
4.7%
4.6%
16.2%
39.1%
3.0%
-1.0 %
0.3%
-0.3 %
-0.4 %
-0.8 %
-0.9 %
AssetAllocation
($)
AssetAllocation
(%)
TargetAllocation
(%)Differences
(%)
MinimumAllocation
(%)
MaximumAllocation
(%)
Total OHA Plan 383,890,461 100.00 100.00 0.00 N/A N/A
Total Global Equities 150,154,462 39.11 40.00 -0.89 22.00 55.00
Total Global Fixed Income 62,096,024 16.18 17.00 -0.82 11.00 22.00
Total Global Real Assets 17,620,670 4.59 5.00 -0.41 0.00 11.00
Hawaii Direct Investments 18,051,451 4.70 5.00 -0.30 0.00 10.00
Total Hedge Funds 47,389,877 12.34 12.00 0.34 6.40 19.20
Total Enhanced Liquidity Account 7,829,238 2.04 3.00 -0.96 0.00 10.00
Total Private Equity 80,748,737 21.03 18.00 3.03 0.00 25.60
Native Hawaiian Trust Fund
Total OHA Plan As of June 30, 2019
26
Total Fund
($) %
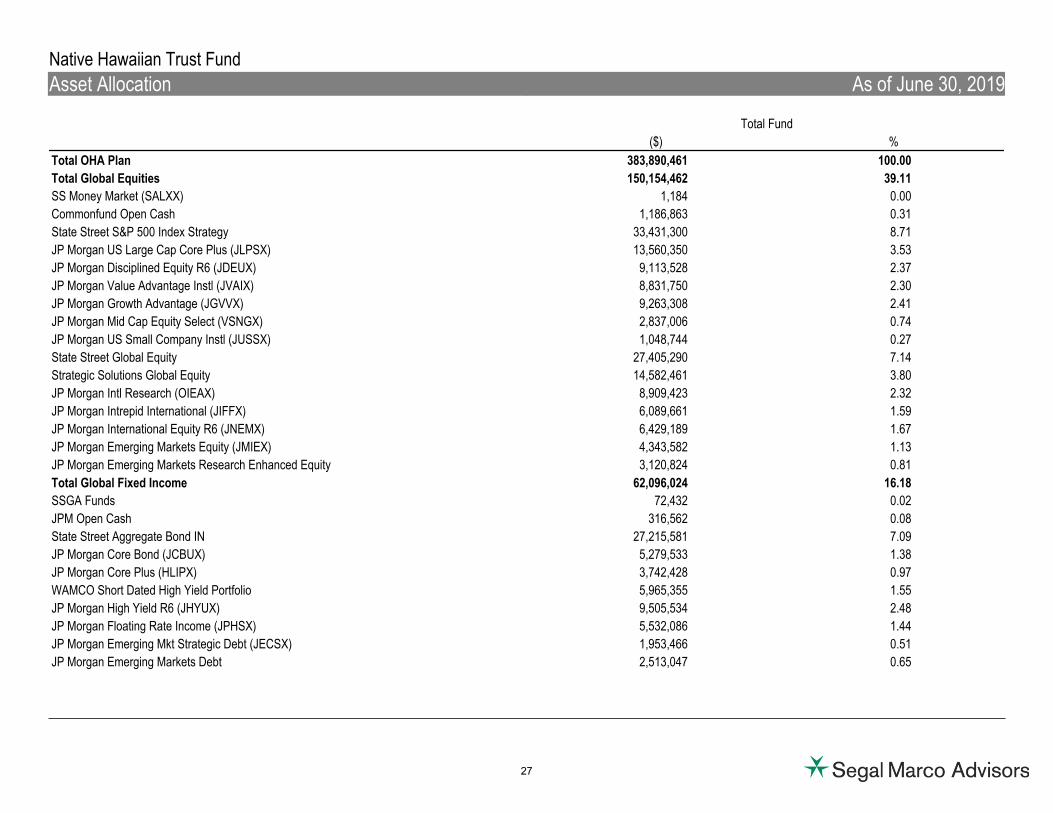
Total OHA Plan 383,890,461 100.00
Total Global Equities 150,154,462 39.11
SS Money Market (SALXX) 1,184 0.00
Commonfund Open Cash 1,186,863 0.31
State Street S&P 500 Index Strategy 33,431,300 8.71
JP Morgan US Large Cap Core Plus (JLPSX) 13,560,350 3.53
JP Morgan Disciplined Equity R6 (JDEUX) 9,113,528 2.37
JP Morgan Value Advantage Instl (JVAIX) 8,831,750 2.30
JP Morgan Growth Advantage (JGVVX) 9,263,308 2.41
JP Morgan Mid Cap Equity Select (VSNGX) 2,837,006 0.74
JP Morgan US Small Company Instl (JUSSX) 1,048,744 0.27
State Street Global Equity 27,405,290 7.14
Strategic Solutions Global Equity 14,582,461 3.80
JP Morgan Intl Research (OIEAX) 8,909,423 2.32
JP Morgan Intrepid International (JIFFX) 6,089,661 1.59
JP Morgan International Equity R6 (JNEMX) 6,429,189 1.67
JP Morgan Emerging Markets Equity (JMIEX) 4,343,582 1.13
JP Morgan Emerging Markets Research Enhanced Equity 3,120,824 0.81
Total Global Fixed Income 62,096,024 16.18
SSGA Funds 72,432 0.02
JPM Open Cash 316,562 0.08
State Street Aggregate Bond IN 27,215,581 7.09
JP Morgan Core Bond (JCBUX) 5,279,533 1.38
JP Morgan Core Plus (HLIPX) 3,742,428 0.97
WAMCO Short Dated High Yield Portfolio 5,965,355 1.55
JP Morgan High Yield R6 (JHYUX) 9,505,534 2.48
JP Morgan Floating Rate Income (JPHSX) 5,532,086 1.44
JP Morgan Emerging Mkt Strategic Debt (JECSX) 1,953,466 0.51
JP Morgan Emerging Markets Debt 2,513,047 0.65
Native Hawaiian Trust Fund
Asset Allocation As of June 30, 2019
27
Native Hawaiian Trust Fund
Asset Allocation As of June 30, 2019
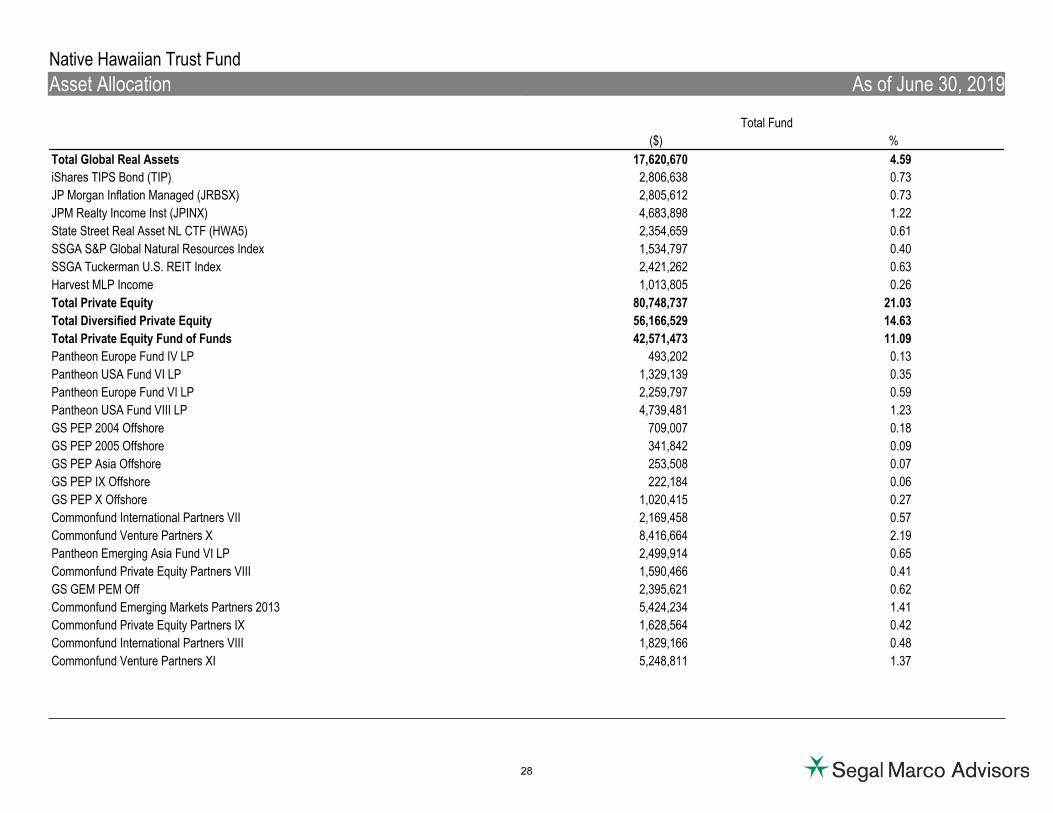
Total Fund
($) %
Total Global Real Assets 17,620,670 4.59
iShares TIPS Bond (TIP) 2,806,638 0.73
JP Morgan Inflation Managed (JRBSX) 2,805,612 0.73
JPM Realty Income Inst (JPINX) 4,683,898 1.22
State Street Real Asset NL CTF (HWA5) 2,354,659 0.61
SSGA S&P Global Natural Resources Index 1,534,797 0.40
SSGA Tuckerman U.S. REIT Index 2,421,262 0.63
Harvest MLP Income 1,013,805 0.26
Total Private Equity 80,748,737 21.03
Total Diversified Private Equity 56,166,529 14.63
Total Private Equity Fund of Funds 42,571,473 11.09
Pantheon Europe Fund IV LP 493,202 0.13
Pantheon USA Fund VI LP 1,329,139 0.35
Pantheon Europe Fund VI LP 2,259,797 0.59
Pantheon USA Fund VIII LP 4,739,481 1.23
GS PEP 2004 Offshore 709,007 0.18
GS PEP 2005 Offshore 341,842 0.09
GS PEP Asia Offshore 253,508 0.07
GS PEP IX Offshore 222,184 0.06
GS PEP X Offshore 1,020,415 0.27
Commonfund International Partners VII 2,169,458 0.57
Commonfund Venture Partners X 8,416,664 2.19
Pantheon Emerging Asia Fund VI LP 2,499,914 0.65
Commonfund Private Equity Partners VIII 1,590,466 0.41
GS GEM PEM Off 2,395,621 0.62
Commonfund Emerging Markets Partners 2013 5,424,234 1.41
Commonfund Private Equity Partners IX 1,628,564 0.42
Commonfund International Partners VIII 1,829,166 0.48
Commonfund Venture Partners XI 5,248,811 1.37
28
Native Hawaiian Trust Fund
Asset Allocation As of June 30, 2019
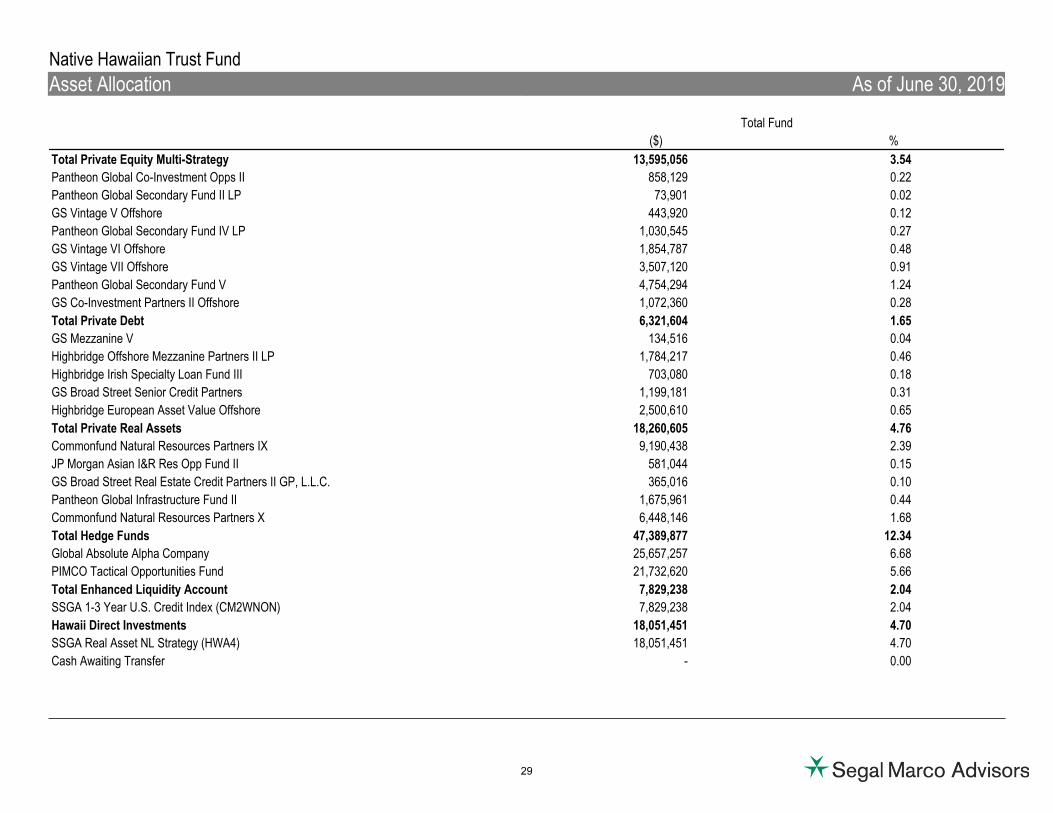
Total Fund
($) %
Total Private Equity Multi-Strategy 13,595,056 3.54
Pantheon Global Co-Investment Opps II 858,129 0.22
Pantheon Global Secondary Fund II LP 73,901 0.02
GS Vintage V Offshore 443,920 0.12
Pantheon Global Secondary Fund IV LP 1,030,545 0.27
GS Vintage VI Offshore 1,854,787 0.48
GS Vintage VII Offshore 3,507,120 0.91
Pantheon Global Secondary Fund V 4,754,294 1.24
GS Co-Investment Partners II Offshore 1,072,360 0.28
Total Private Debt 6,321,604 1.65
GS Mezzanine V 134,516 0.04
Highbridge Offshore Mezzanine Partners II LP 1,784,217 0.46
Highbridge Irish Specialty Loan Fund III 703,080 0.18
GS Broad Street Senior Credit Partners 1,199,181 0.31
Highbridge European Asset Value Offshore 2,500,610 0.65
Total Private Real Assets 18,260,605 4.76
Commonfund Natural Resources Partners IX 9,190,438 2.39
JP Morgan Asian I&R Res Opp Fund II 581,044 0.15
GS Broad Street Real Estate Credit Partners II GP, L.L.C. 365,016 0.10
Pantheon Global Infrastructure Fund II 1,675,961 0.44
Commonfund Natural Resources Partners X 6,448,146 1.68
Total Hedge Funds 47,389,877 12.34
Global Absolute Alpha Company 25,657,257 6.68
PIMCO Tactical Opportunities Fund 21,732,620 5.66
Total Enhanced Liquidity Account 7,829,238 2.04
SSGA 1-3 Year U.S. Credit Index (CM2WNON) 7,829,238 2.04
Hawaii Direct Investments 18,051,451 4.70
SSGA Real Asset NL Strategy (HWA4) 18,051,451 4.70
Cash Awaiting Transfer - 0.00
29
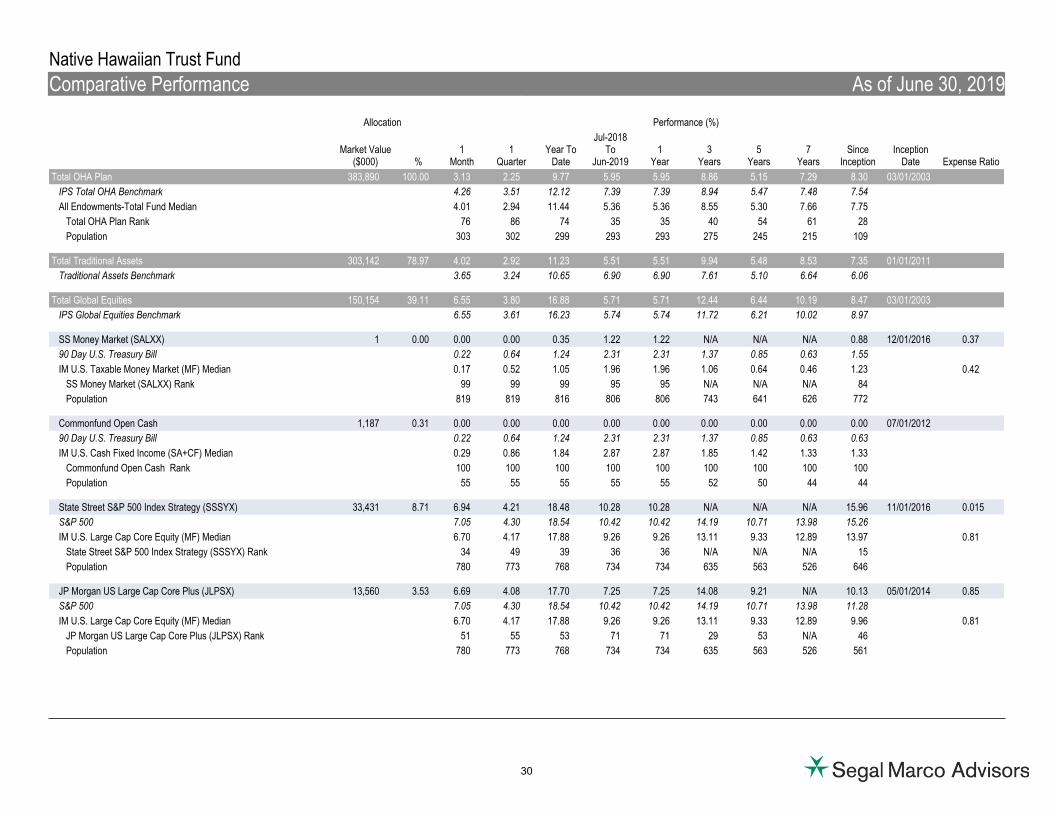
Expense Ratio
Allocation
Market Value($000) %
Performance (%)
1Month
1Quarter
Year ToDate
Jul-2018To
Jun-20191
Year3
Years5
Years7
YearsSince
InceptionInception
Date
Total OHA Plan 383,890 100.00 3.13 2.25 9.77 5.95 5.95 8.86 5.15 7.29 8.30 03/01/2003
IPS Total OHA Benchmark 4.26 3.51 12.12 7.39 7.39 8.94 5.47 7.48 7.54
All Endowments-Total Fund Median 4.01 2.94 11.44 5.36 5.36 8.55 5.30 7.66 7.75
Total OHA Plan Rank 76 86 74 35 35 40 54 61 28
Population 303 302 299 293 293 275 245 215 109
Total Traditional Assets 303,142 78.97 4.02 2.92 11.23 5.51 5.51 9.94 5.48 8.53 7.35 01/01/2011
Traditional Assets Benchmark 3.65 3.24 10.65 6.90 6.90 7.61 5.10 6.64 6.06
Total Global Equities 150,154 39.11 6.55 3.80 16.88 5.71 5.71 12.44 6.44 10.19 8.47 03/01/2003
IPS Global Equities Benchmark 6.55 3.61 16.23 5.74 5.74 11.72 6.21 10.02 8.97
SS Money Market (SALXX) 1 0.00 0.00 0.00 0.35 1.22 1.22 N/A N/A N/A 0.88 12/01/2016 0.37
90 Day U.S. Treasury Bill 0.22 0.64 1.24 2.31 2.31 1.37 0.85 0.63 1.55
IM U.S. Taxable Money Market (MF) Median 0.17 0.52 1.05 1.96 1.96 1.06 0.64 0.46 1.23 0.42
SS Money Market (SALXX) Rank 99 99 99 95 95 N/A N/A N/A 84
Population 819 819 816 806 806 743 641 626 772
Commonfund Open Cash 1,187 0.31 0.00 0.00 0.00 0.00 0.00 0.00 0.00 0.00 0.00 07/01/2012
90 Day U.S. Treasury Bill 0.22 0.64 1.24 2.31 2.31 1.37 0.85 0.63 0.63
IM U.S. Cash Fixed Income (SA+CF) Median 0.29 0.86 1.84 2.87 2.87 1.85 1.42 1.33 1.33
Commonfund Open Cash Rank 100 100 100 100 100 100 100 100 100
Population 55 55 55 55 55 52 50 44 44
State Street S&P 500 Index Strategy (SSSYX) 33,431 8.71 6.94 4.21 18.48 10.28 10.28 N/A N/A N/A 15.96 11/01/2016 0.015 S&P 500 7.05 4.30 18.54 10.42 10.42 14.19 10.71 13.98 15.26
IM U.S. Large Cap Core Equity (MF) Median 6.70 4.17 17.88 9.26 9.26 13.11 9.33 12.89 13.97 0.81
State Street S&P 500 Index Strategy (SSSYX) Rank 34 49 39 36 36 N/A N/A N/A 15
Population 780 773 768 734 734 635 563 526 646
JP Morgan US Large Cap Core Plus (JLPSX) 13,560 3.53 6.69 4.08 17.70 7.25 7.25 14.08 9.21 N/A 10.13 05/01/2014 0.85 S&P 500 7.05 4.30 18.54 10.42 10.42 14.19 10.71 13.98 11.28
IM U.S. Large Cap Core Equity (MF) Median 6.70 4.17 17.88 9.26 9.26 13.11 9.33 12.89 9.96 0.81
JP Morgan US Large Cap Core Plus (JLPSX) Rank 51 55 53 71 71 29 53 N/A 46
Population 780 773 768 734 734 635 563 526 561
Native Hawaiian Trust Fund
Comparative Performance As of June 30, 2019
30
Native Hawaiian Trust Fund
Comparative Performance As of June 30, 2019
Expense Ratio
Allocation
Market Value($000) %
Performance (%)
1Month
1Quarter
Year ToDate
Jul-2018To
Jun-20191
Year3
Years5
Years7
YearsSince
InceptionInception
Date
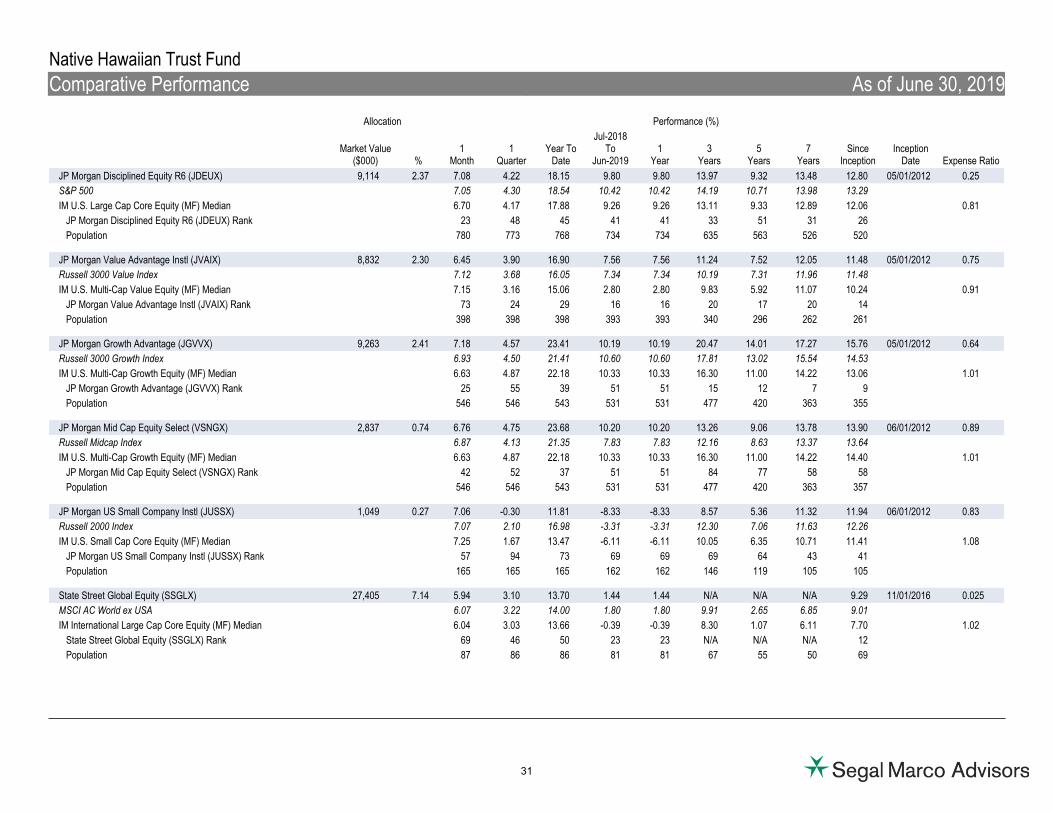
JP Morgan Disciplined Equity R6 (JDEUX) 9,114 2.37 7.08 4.22 18.15 9.80 9.80 13.97 9.32 13.48 12.80 05/01/2012 0.25
S&P 500 7.05 4.30 18.54 10.42 10.42 14.19 10.71 13.98 13.29
IM U.S. Large Cap Core Equity (MF) Median 6.70 4.17 17.88 9.26 9.26 13.11 9.33 12.89 12.06 0.81
JP Morgan Disciplined Equity R6 (JDEUX) Rank 23 48 45 41 41 33 51 31 26
Population 780 773 768 734 734 635 563 526 520
JP Morgan Value Advantage Instl (JVAIX) 8,832 2.30 6.45 3.90 16.90 7.56 7.56 11.24 7.52 12.05 11.48 05/01/2012 0.75
Russell 3000 Value Index 7.12 3.68 16.05 7.34 7.34 10.19 7.31 11.96 11.48
IM U.S. Multi-Cap Value Equity (MF) Median 7.15 3.16 15.06 2.80 2.80 9.83 5.92 11.07 10.24 0.91
JP Morgan Value Advantage Instl (JVAIX) Rank 73 24 29 16 16 20 17 20 14
Population 398 398 398 393 393 340 296 262 261
JP Morgan Growth Advantage (JGVVX) 9,263 2.41 7.18 4.57 23.41 10.19 10.19 20.47 14.01 17.27 15.76 05/01/2012 0.64
Russell 3000 Growth Index 6.93 4.50 21.41 10.60 10.60 17.81 13.02 15.54 14.53
IM U.S. Multi-Cap Growth Equity (MF) Median 6.63 4.87 22.18 10.33 10.33 16.30 11.00 14.22 13.06 1.01
JP Morgan Growth Advantage (JGVVX) Rank 25 55 39 51 51 15 12 7 9
Population 546 546 543 531 531 477 420 363 355
JP Morgan Mid Cap Equity Select (VSNGX) 2,837 0.74 6.76 4.75 23.68 10.20 10.20 13.26 9.06 13.78 13.90 06/01/2012 0.89
Russell Midcap Index 6.87 4.13 21.35 7.83 7.83 12.16 8.63 13.37 13.64
IM U.S. Multi-Cap Growth Equity (MF) Median 6.63 4.87 22.18 10.33 10.33 16.30 11.00 14.22 14.40 1.01
JP Morgan Mid Cap Equity Select (VSNGX) Rank 42 52 37 51 51 84 77 58 58
Population 546 546 543 531 531 477 420 363 357
JP Morgan US Small Company Instl (JUSSX) 1,049 0.27 7.06 -0.30 11.81 -8.33 -8.33 8.57 5.36 11.32 11.94 06/01/2012 0.83
Russell 2000 Index 7.07 2.10 16.98 -3.31 -3.31 12.30 7.06 11.63 12.26
IM U.S. Small Cap Core Equity (MF) Median 7.25 1.67 13.47 -6.11 -6.11 10.05 6.35 10.71 11.41 1.08
JP Morgan US Small Company Instl (JUSSX) Rank 57 94 73 69 69 69 64 43 41
Population 165 165 165 162 162 146 119 105 105
State Street Global Equity (SSGLX) 27,405 7.14 5.94 3.10 13.70 1.44 1.44 N/A N/A N/A 9.29 11/01/2016 0.025 MSCI AC World ex USA 6.07 3.22 14.00 1.80 1.80 9.91 2.65 6.85 9.01
IM International Large Cap Core Equity (MF) Median 6.04 3.03 13.66 -0.39 -0.39 8.30 1.07 6.11 7.70 1.02
State Street Global Equity (SSGLX) Rank 69 46 50 23 23 N/A N/A N/A 12
Population 87 86 86 81 81 67 55 50 69
31
Native Hawaiian Trust Fund
Comparative Performance As of June 30, 2019
Expense Ratio
Allocation
Market Value($000) %
Performance (%)
1Month
1Quarter
Year ToDate
Jul-2018To
Jun-20191
Year3
Years5
Years7
YearsSince
InceptionInception
Date
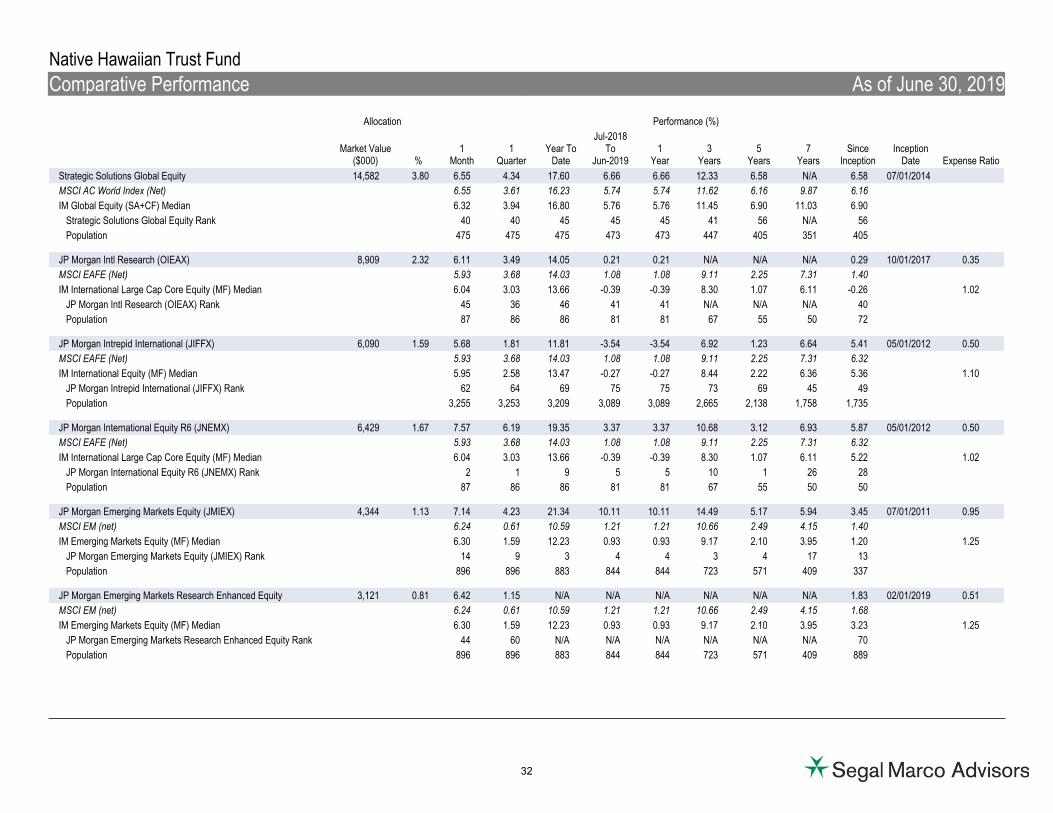
Strategic Solutions Global Equity 14,582 3.80 6.55 4.34 17.60 6.66 6.66 12.33 6.58 N/A 6.58 07/01/2014
MSCI AC World Index (Net) 6.55 3.61 16.23 5.74 5.74 11.62 6.16 9.87 6.16
IM Global Equity (SA+CF) Median 6.32 3.94 16.80 5.76 5.76 11.45 6.90 11.03 6.90
Strategic Solutions Global Equity Rank 40 40 45 45 45 41 56 N/A 56
Population 475 475 475 473 473 447 405 351 405
JP Morgan Intl Research (OIEAX) 8,909 2.32 6.11 3.49 14.05 0.21 0.21 N/A N/A N/A 0.29 10/01/2017 0.35
MSCI EAFE (Net) 5.93 3.68 14.03 1.08 1.08 9.11 2.25 7.31 1.40
IM International Large Cap Core Equity (MF) Median 6.04 3.03 13.66 -0.39 -0.39 8.30 1.07 6.11 -0.26 1.02
JP Morgan Intl Research (OIEAX) Rank 45 36 46 41 41 N/A N/A N/A 40
Population 87 86 86 81 81 67 55 50 72
JP Morgan Intrepid International (JIFFX) 6,090 1.59 5.68 1.81 11.81 -3.54 -3.54 6.92 1.23 6.64 5.41 05/01/2012 0.50
MSCI EAFE (Net) 5.93 3.68 14.03 1.08 1.08 9.11 2.25 7.31 6.32
IM International Equity (MF) Median 5.95 2.58 13.47 -0.27 -0.27 8.44 2.22 6.36 5.36 1.10
JP Morgan Intrepid International (JIFFX) Rank 62 64 69 75 75 73 69 45 49
Population 3,255 3,253 3,209 3,089 3,089 2,665 2,138 1,758 1,735
JP Morgan International Equity R6 (JNEMX) 6,429 1.67 7.57 6.19 19.35 3.37 3.37 10.68 3.12 6.93 5.87 05/01/2012 0.50
MSCI EAFE (Net) 5.93 3.68 14.03 1.08 1.08 9.11 2.25 7.31 6.32
IM International Large Cap Core Equity (MF) Median 6.04 3.03 13.66 -0.39 -0.39 8.30 1.07 6.11 5.22 1.02
JP Morgan International Equity R6 (JNEMX) Rank 2 1 9 5 5 10 1 26 28
Population 87 86 86 81 81 67 55 50 50
JP Morgan Emerging Markets Equity (JMIEX) 4,344 1.13 7.14 4.23 21.34 10.11 10.11 14.49 5.17 5.94 3.45 07/01/2011 0.95
MSCI EM (net) 6.24 0.61 10.59 1.21 1.21 10.66 2.49 4.15 1.40
IM Emerging Markets Equity (MF) Median 6.30 1.59 12.23 0.93 0.93 9.17 2.10 3.95 1.20 1.25
JP Morgan Emerging Markets Equity (JMIEX) Rank 14 9 3 4 4 3 4 17 13
Population 896 896 883 844 844 723 571 409 337
JP Morgan Emerging Markets Research Enhanced Equity 3,121 0.81 6.42 1.15 N/A N/A N/A N/A N/A N/A 1.83 02/01/2019 0.51
MSCI EM (net) 6.24 0.61 10.59 1.21 1.21 10.66 2.49 4.15 1.68
IM Emerging Markets Equity (MF) Median 6.30 1.59 12.23 0.93 0.93 9.17 2.10 3.95 3.23 1.25
JP Morgan Emerging Markets Research Enhanced Equity Rank 44 60 N/A N/A N/A N/A N/A N/A 70
Population 896 896 883 844 844 723 571 409 889
32
Native Hawaiian Trust Fund
Comparative Performance As of June 30, 2019
Expense Ratio
Allocation
Market Value($000) %
Performance (%)
1Month
1Quarter
Year ToDate
Jul-2018To
Jun-20191
Year3
Years5
Years7
YearsSince
InceptionInception
Date
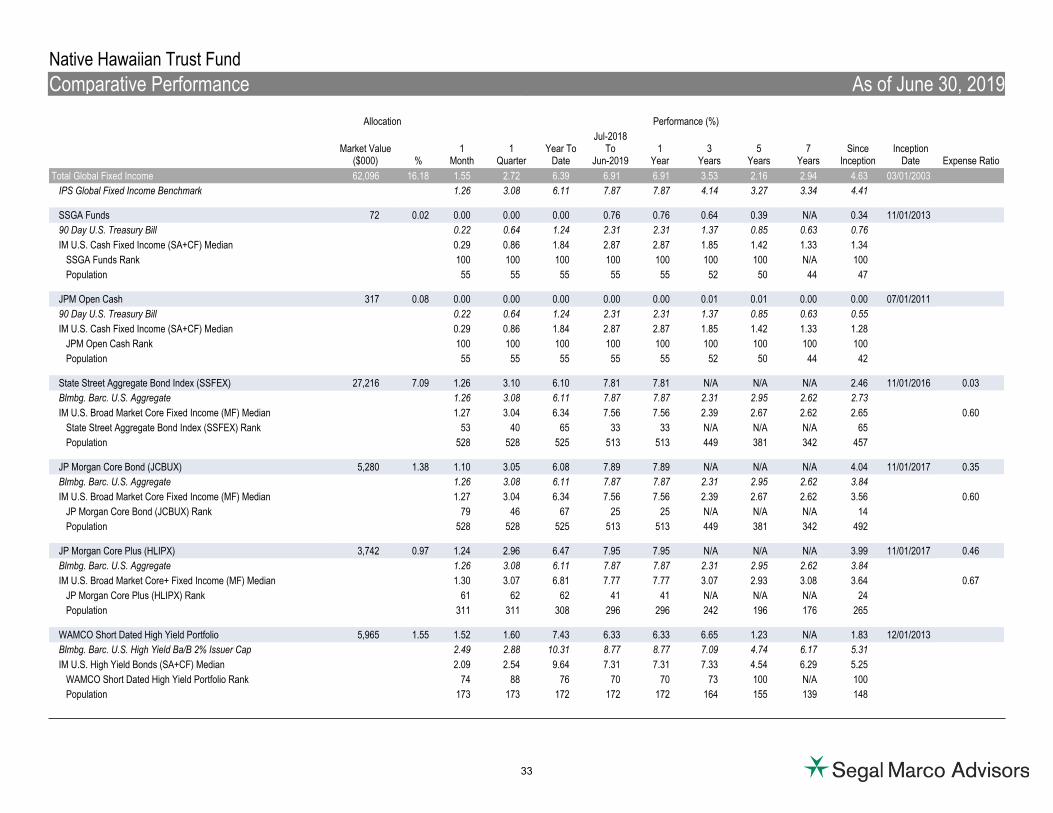
Total Global Fixed Income 62,096 16.18 1.55 2.72 6.39 6.91 6.91 3.53 2.16 2.94 4.63 03/01/2003
IPS Global Fixed Income Benchmark 1.26 3.08 6.11 7.87 7.87 4.14 3.27 3.34 4.41
SSGA Funds 72 0.02 0.00 0.00 0.00 0.76 0.76 0.64 0.39 N/A 0.34 11/01/2013
90 Day U.S. Treasury Bill 0.22 0.64 1.24 2.31 2.31 1.37 0.85 0.63 0.76
IM U.S. Cash Fixed Income (SA+CF) Median 0.29 0.86 1.84 2.87 2.87 1.85 1.42 1.33 1.34
SSGA Funds Rank 100 100 100 100 100 100 100 N/A 100
Population 55 55 55 55 55 52 50 44 47
JPM Open Cash 317 0.08 0.00 0.00 0.00 0.00 0.00 0.01 0.01 0.00 0.00 07/01/2011
90 Day U.S. Treasury Bill 0.22 0.64 1.24 2.31 2.31 1.37 0.85 0.63 0.55
IM U.S. Cash Fixed Income (SA+CF) Median 0.29 0.86 1.84 2.87 2.87 1.85 1.42 1.33 1.28
JPM Open Cash Rank 100 100 100 100 100 100 100 100 100
Population 55 55 55 55 55 52 50 44 42
State Street Aggregate Bond Index (SSFEX) 27,216 7.09 1.26 3.10 6.10 7.81 7.81 N/A N/A N/A 2.46 11/01/2016 0.03
Blmbg. Barc. U.S. Aggregate 1.26 3.08 6.11 7.87 7.87 2.31 2.95 2.62 2.73
IM U.S. Broad Market Core Fixed Income (MF) Median 1.27 3.04 6.34 7.56 7.56 2.39 2.67 2.62 2.65 0.60
State Street Aggregate Bond Index (SSFEX) Rank 53 40 65 33 33 N/A N/A N/A 65
Population 528 528 525 513 513 449 381 342 457
JP Morgan Core Bond (JCBUX) 5,280 1.38 1.10 3.05 6.08 7.89 7.89 N/A N/A N/A 4.04 11/01/2017 0.35
Blmbg. Barc. U.S. Aggregate 1.26 3.08 6.11 7.87 7.87 2.31 2.95 2.62 3.84
IM U.S. Broad Market Core Fixed Income (MF) Median 1.27 3.04 6.34 7.56 7.56 2.39 2.67 2.62 3.56 0.60
JP Morgan Core Bond (JCBUX) Rank 79 46 67 25 25 N/A N/A N/A 14
Population 528 528 525 513 513 449 381 342 492
JP Morgan Core Plus (HLIPX) 3,742 0.97 1.24 2.96 6.47 7.95 7.95 N/A N/A N/A 3.99 11/01/2017 0.46
Blmbg. Barc. U.S. Aggregate 1.26 3.08 6.11 7.87 7.87 2.31 2.95 2.62 3.84
IM U.S. Broad Market Core+ Fixed Income (MF) Median 1.30 3.07 6.81 7.77 7.77 3.07 2.93 3.08 3.64 0.67
JP Morgan Core Plus (HLIPX) Rank 61 62 62 41 41 N/A N/A N/A 24
Population 311 311 308 296 296 242 196 176 265
WAMCO Short Dated High Yield Portfolio 5,965 1.55 1.52 1.60 7.43 6.33 6.33 6.65 1.23 N/A 1.83 12/01/2013
Blmbg. Barc. U.S. High Yield Ba/B 2% Issuer Cap 2.49 2.88 10.31 8.77 8.77 7.09 4.74 6.17 5.31
IM U.S. High Yield Bonds (SA+CF) Median 2.09 2.54 9.64 7.31 7.31 7.33 4.54 6.29 5.25
WAMCO Short Dated High Yield Portfolio Rank 74 88 76 70 70 73 100 N/A 100
Population 173 173 172 172 172 164 155 139 148
33
Native Hawaiian Trust Fund
Comparative Performance As of June 30, 2019
Expense Ratio
Allocation
Market Value($000) %
Performance (%)
1Month
1Quarter
Year ToDate
Jul-2018To
Jun-20191
Year3
Years5
Years7
YearsSince
InceptionInception
Date
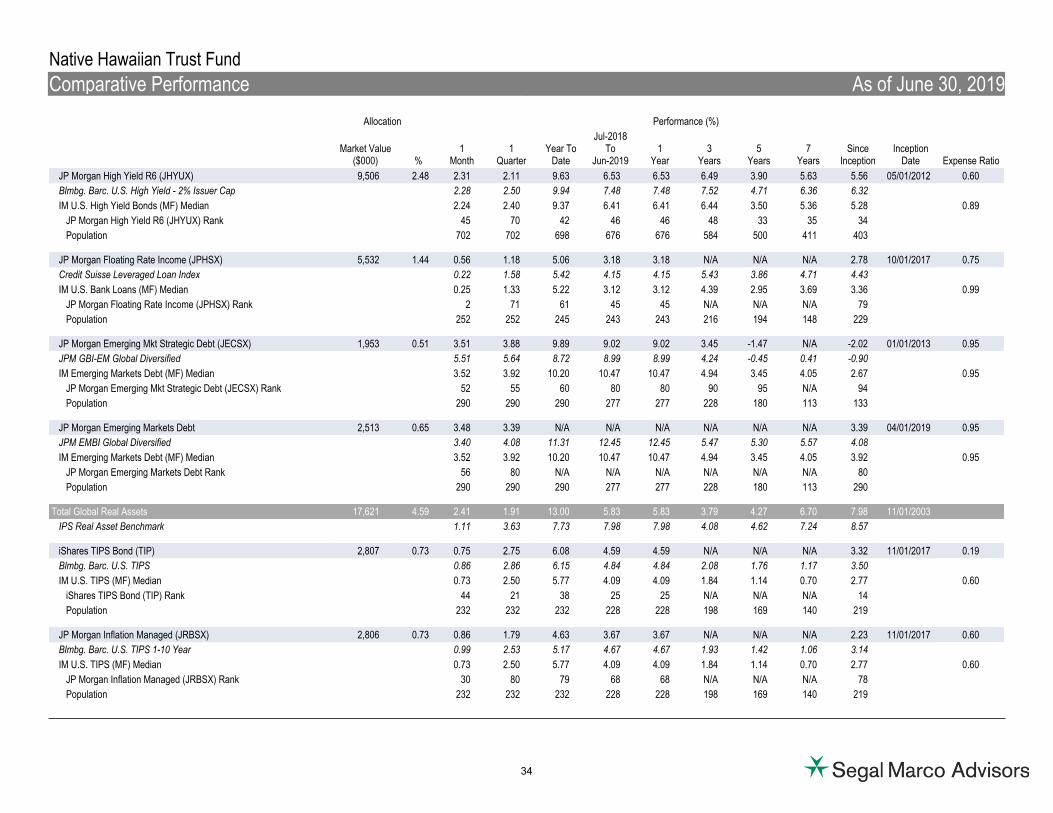
JP Morgan High Yield R6 (JHYUX) 9,506 2.48 2.31 2.11 9.63 6.53 6.53 6.49 3.90 5.63 5.56 05/01/2012 0.60
Blmbg. Barc. U.S. High Yield - 2% Issuer Cap 2.28 2.50 9.94 7.48 7.48 7.52 4.71 6.36 6.32
IM U.S. High Yield Bonds (MF) Median 2.24 2.40 9.37 6.41 6.41 6.44 3.50 5.36 5.28 0.89
JP Morgan High Yield R6 (JHYUX) Rank 45 70 42 46 46 48 33 35 34
Population 702 702 698 676 676 584 500 411 403
JP Morgan Floating Rate Income (JPHSX) 5,532 1.44 0.56 1.18 5.06 3.18 3.18 N/A N/A N/A 2.78 10/01/2017 0.75
Credit Suisse Leveraged Loan Index 0.22 1.58 5.42 4.15 4.15 5.43 3.86 4.71 4.43
IM U.S. Bank Loans (MF) Median 0.25 1.33 5.22 3.12 3.12 4.39 2.95 3.69 3.36 0.99
JP Morgan Floating Rate Income (JPHSX) Rank 2 71 61 45 45 N/A N/A N/A 79
Population 252 252 245 243 243 216 194 148 229
JP Morgan Emerging Mkt Strategic Debt (JECSX) 1,953 0.51 3.51 3.88 9.89 9.02 9.02 3.45 -1.47 N/A -2.02 01/01/2013 0.95
JPM GBI-EM Global Diversified 5.51 5.64 8.72 8.99 8.99 4.24 -0.45 0.41 -0.90
IM Emerging Markets Debt (MF) Median 3.52 3.92 10.20 10.47 10.47 4.94 3.45 4.05 2.67 0.95
JP Morgan Emerging Mkt Strategic Debt (JECSX) Rank 52 55 60 80 80 90 95 N/A 94
Population 290 290 290 277 277 228 180 113 133
JP Morgan Emerging Markets Debt 2,513 0.65 3.48 3.39 N/A N/A N/A N/A N/A N/A 3.39 04/01/2019 0.95
JPM EMBI Global Diversified 3.40 4.08 11.31 12.45 12.45 5.47 5.30 5.57 4.08
IM Emerging Markets Debt (MF) Median 3.52 3.92 10.20 10.47 10.47 4.94 3.45 4.05 3.92 0.95
JP Morgan Emerging Markets Debt Rank 56 80 N/A N/A N/A N/A N/A N/A 80
Population 290 290 290 277 277 228 180 113 290
Total Global Real Assets 17,621 4.59 2.41 1.91 13.00 5.83 5.83 3.79 4.27 6.70 7.98 11/01/2003
IPS Real Asset Benchmark 1.11 3.63 7.73 7.98 7.98 4.08 4.62 7.24 8.57
iShares TIPS Bond (TIP) 2,807 0.73 0.75 2.75 6.08 4.59 4.59 N/A N/A N/A 3.32 11/01/2017 0.19
Blmbg. Barc. U.S. TIPS 0.86 2.86 6.15 4.84 4.84 2.08 1.76 1.17 3.50
IM U.S. TIPS (MF) Median 0.73 2.50 5.77 4.09 4.09 1.84 1.14 0.70 2.77 0.60
iShares TIPS Bond (TIP) Rank 44 21 38 25 25 N/A N/A N/A 14
Population 232 232 232 228 228 198 169 140 219
JP Morgan Inflation Managed (JRBSX) 2,806 0.73 0.86 1.79 4.63 3.67 3.67 N/A N/A N/A 2.23 11/01/2017 0.60
Blmbg. Barc. U.S. TIPS 1-10 Year 0.99 2.53 5.17 4.67 4.67 1.93 1.42 1.06 3.14
IM U.S. TIPS (MF) Median 0.73 2.50 5.77 4.09 4.09 1.84 1.14 0.70 2.77 0.60
JP Morgan Inflation Managed (JRBSX) Rank 30 80 79 68 68 N/A N/A N/A 78
Population 232 232 232 228 228 198 169 140 219
34

Native Hawaiian Trust Fund
Comparative Performance As of June 30, 2019
Expense Ratio
Allocation
Market Value($000) %
Performance (%)
1Month
1Quarter
Year ToDate
Jul-2018To
Jun-20191
Year3
Years5
Years7
YearsSince
InceptionInception
Date
JPM Realty Income Inst (JPINX) 4,684 1.22 1.84 2.92 20.66 12.07 12.07 3.47 7.34 7.85 8.49 07/01/2011 0.68
Wilshire US REIT Index 1.42 1.63 17.92 10.53 10.53 4.11 7.84 8.72 9.27
IM Real Estate Sector (MF) Median 1.38 2.03 18.42 10.58 10.58 4.01 7.17 7.94 8.52 1.05
JPM Realty Income Inst (JPINX) Rank 13 18 15 33 33 61 45 56 52
Population 268 268 265 256 256 226 199 170 161
State Street Real Asset NL CTF 2,355 0.61 3.86 1.32 10.46 1.95 1.95 N/A N/A N/A 5.14 12/01/2016
FTSE EPRA/NAREIT Developed Index (Net) 1.56 -0.07 14.51 7.68 7.68 4.46 4.85 7.26 8.25
Global Real Assets (MF) Median 4.38 -0.94 13.04 -6.00 -6.00 0.63 -6.60 -2.00 -0.44
State Street Real Asset NL CTF Rank 58 31 63 31 31 N/A N/A N/A 28
Population 710 710 707 684 684 592 504 395 600
SSGA S&P Global Natural Resources Index 1,535 0.40 9.65 1.72 14.14 0.90 0.90 10.35 -0.65 N/A 3.60 01/01/2013
S&P Global Natural Resources Sector Index 9.74 1.30 13.84 -4.02 -4.02 11.37 0.74 3.01 1.84
IM Global Natural Resources (MF) Median 8.73 -0.49 13.07 -10.91 -10.91 2.91 -6.29 0.41 -1.03
SSGA S&P Global Natural Resources Index Rank 21 25 31 27 27 10 24 N/A 22
Population 106 106 106 101 101 94 91 81 85
SSGA Tuckerman U.S. REIT Index 2,421 0.63 1.35 0.81 16.63 9.80 9.80 3.51 7.24 N/A 8.37 01/01/2013
FTSE NAREIT All REITs Index 1.63 1.77 18.77 12.65 12.65 6.17 8.78 9.60 9.70
IM U.S. REIT (SA+CF) Median 1.42 2.11 19.22 12.33 12.33 5.25 8.76 9.49 9.75
SSGA Tuckerman U.S. REIT Index Rank 67 92 89 89 89 92 91 N/A 97
Population 48 48 48 48 48 47 47 43 45
Harvest MLP Income 1,014 0.26 3.31 -0.94 17.17 -2.15 -2.15 N/A N/A N/A 3.97 03/01/2018
Alerian MLP Index 2.64 0.12 16.96 3.09 3.09 -0.42 -7.20 1.02 5.39
35
Native Hawaiian Trust Fund
Comparative Performance As of June 30, 2019
Expense Ratio
Allocation
Market Value($000) %
Performance (%)
1Month
1Quarter
Year ToDate
Jul-2018To
Jun-20191
Year3
Years5
Years7
YearsSince
InceptionInception
Date
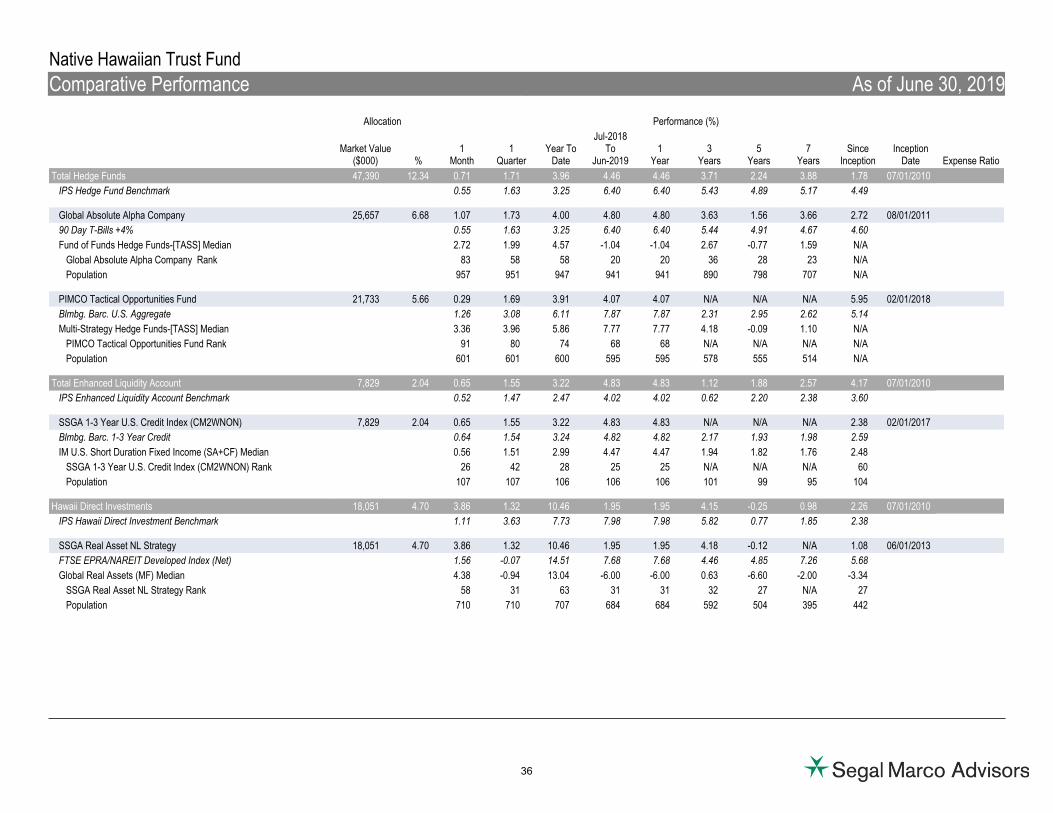
Total Hedge Funds 47,390 12.34 0.71 1.71 3.96 4.46 4.46 3.71 2.24 3.88 1.78 07/01/2010
IPS Hedge Fund Benchmark 0.55 1.63 3.25 6.40 6.40 5.43 4.89 5.17 4.49
Global Absolute Alpha Company 25,657 6.68 1.07 1.73 4.00 4.80 4.80 3.63 1.56 3.66 2.72 08/01/2011
90 Day T-Bills +4% 0.55 1.63 3.25 6.40 6.40 5.44 4.91 4.67 4.60
Fund of Funds Hedge Funds-[TASS] Median 2.72 1.99 4.57 -1.04 -1.04 2.67 -0.77 1.59 N/A
Global Absolute Alpha Company Rank 83 58 58 20 20 36 28 23 N/A
Population 957 951 947 941 941 890 798 707 N/A
PIMCO Tactical Opportunities Fund 21,733 5.66 0.29 1.69 3.91 4.07 4.07 N/A N/A N/A 5.95 02/01/2018
Blmbg. Barc. U.S. Aggregate 1.26 3.08 6.11 7.87 7.87 2.31 2.95 2.62 5.14
Multi-Strategy Hedge Funds-[TASS] Median 3.36 3.96 5.86 7.77 7.77 4.18 -0.09 1.10 N/A
PIMCO Tactical Opportunities Fund Rank 91 80 74 68 68 N/A N/A N/A N/A
Population 601 601 600 595 595 578 555 514 N/A
Total Enhanced Liquidity Account 7,829 2.04 0.65 1.55 3.22 4.83 4.83 1.12 1.88 2.57 4.17 07/01/2010
IPS Enhanced Liquidity Account Benchmark 0.52 1.47 2.47 4.02 4.02 0.62 2.20 2.38 3.60
SSGA 1-3 Year U.S. Credit Index (CM2WNON) 7,829 2.04 0.65 1.55 3.22 4.83 4.83 N/A N/A N/A 2.38 02/01/2017
Blmbg. Barc. 1-3 Year Credit 0.64 1.54 3.24 4.82 4.82 2.17 1.93 1.98 2.59
IM U.S. Short Duration Fixed Income (SA+CF) Median 0.56 1.51 2.99 4.47 4.47 1.94 1.82 1.76 2.48
SSGA 1-3 Year U.S. Credit Index (CM2WNON) Rank 26 42 28 25 25 N/A N/A N/A 60
Population 107 107 106 106 106 101 99 95 104
Hawaii Direct Investments 18,051 4.70 3.86 1.32 10.46 1.95 1.95 4.15 -0.25 0.98 2.26 07/01/2010
IPS Hawaii Direct Investment Benchmark 1.11 3.63 7.73 7.98 7.98 5.82 0.77 1.85 2.38
SSGA Real Asset NL Strategy 18,051 4.70 3.86 1.32 10.46 1.95 1.95 4.18 -0.12 N/A 1.08 06/01/2013
FTSE EPRA/NAREIT Developed Index (Net) 1.56 -0.07 14.51 7.68 7.68 4.46 4.85 7.26 5.68
Global Real Assets (MF) Median 4.38 -0.94 13.04 -6.00 -6.00 0.63 -6.60 -2.00 -3.34
SSGA Real Asset NL Strategy Rank 58 31 63 31 31 32 27 N/A 27
Population 710 710 707 684 684 592 504 395 442
36
Native Hawaiian Trust Fund
Comparative Performance As of June 30, 2019
Expense Ratio
Allocation
Market Value($000) %
Performance (%)
1Month
1Quarter
Year ToDate
Jul-2018To
Jun-20191
Year3
Years5
Years7
YearsSince
InceptionInception
Date
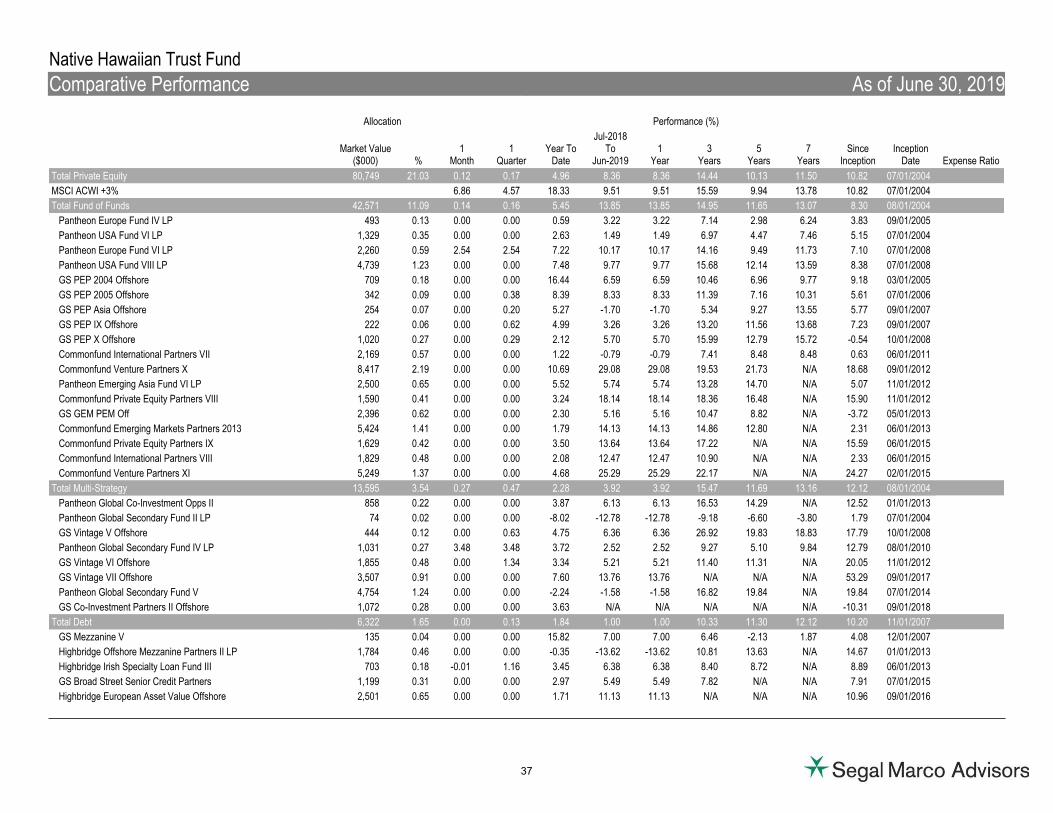
Total Private Equity 80,749 21.03 0.12 0.17 4.96 8.36 8.36 14.44 10.13 11.50 10.82 07/01/2004
MSCI ACWI +3% 6.86 4.57 18.33 9.51 9.51 15.59 9.94 13.78 10.82 07/01/2004
Total Fund of Funds 42,571 11.09 0.14 0.16 5.45 13.85 13.85 14.95 11.65 13.07 8.30 08/01/2004
Pantheon Europe Fund IV LP 493 0.13 0.00 0.00 0.59 3.22 3.22 7.14 2.98 6.24 3.83 09/01/2005
Pantheon USA Fund VI LP 1,329 0.35 0.00 0.00 2.63 1.49 1.49 6.97 4.47 7.46 5.15 07/01/2004
Pantheon Europe Fund VI LP 2,260 0.59 2.54 2.54 7.22 10.17 10.17 14.16 9.49 11.73 7.10 07/01/2008
Pantheon USA Fund VIII LP 4,739 1.23 0.00 0.00 7.48 9.77 9.77 15.68 12.14 13.59 8.38 07/01/2008
GS PEP 2004 Offshore 709 0.18 0.00 0.00 16.44 6.59 6.59 10.46 6.96 9.77 9.18 03/01/2005
GS PEP 2005 Offshore 342 0.09 0.00 0.38 8.39 8.33 8.33 11.39 7.16 10.31 5.61 07/01/2006
GS PEP Asia Offshore 254 0.07 0.00 0.20 5.27 -1.70 -1.70 5.34 9.27 13.55 5.77 09/01/2007
GS PEP IX Offshore 222 0.06 0.00 0.62 4.99 3.26 3.26 13.20 11.56 13.68 7.23 09/01/2007
GS PEP X Offshore 1,020 0.27 0.00 0.29 2.12 5.70 5.70 15.99 12.79 15.72 -0.54 10/01/2008
Commonfund International Partners VII 2,169 0.57 0.00 0.00 1.22 -0.79 -0.79 7.41 8.48 8.48 0.63 06/01/2011
Commonfund Venture Partners X 8,417 2.19 0.00 0.00 10.69 29.08 29.08 19.53 21.73 N/A 18.68 09/01/2012
Pantheon Emerging Asia Fund VI LP 2,500 0.65 0.00 0.00 5.52 5.74 5.74 13.28 14.70 N/A 5.07 11/01/2012
Commonfund Private Equity Partners VIII 1,590 0.41 0.00 0.00 3.24 18.14 18.14 18.36 16.48 N/A 15.90 11/01/2012
GS GEM PEM Off 2,396 0.62 0.00 0.00 2.30 5.16 5.16 10.47 8.82 N/A -3.72 05/01/2013
Commonfund Emerging Markets Partners 2013 5,424 1.41 0.00 0.00 1.79 14.13 14.13 14.86 12.80 N/A 2.31 06/01/2013
Commonfund Private Equity Partners IX 1,629 0.42 0.00 0.00 3.50 13.64 13.64 17.22 N/A N/A 15.59 06/01/2015
Commonfund International Partners VIII 1,829 0.48 0.00 0.00 2.08 12.47 12.47 10.90 N/A N/A 2.33 06/01/2015
Commonfund Venture Partners XI 5,249 1.37 0.00 0.00 4.68 25.29 25.29 22.17 N/A N/A 24.27 02/01/2015
Total Multi-Strategy 13,595 3.54 0.27 0.47 2.28 3.92 3.92 15.47 11.69 13.16 12.12 08/01/2004
Pantheon Global Co-Investment Opps II 858 0.22 0.00 0.00 3.87 6.13 6.13 16.53 14.29 N/A 12.52 01/01/2013
Pantheon Global Secondary Fund II LP 74 0.02 0.00 0.00 -8.02 -12.78 -12.78 -9.18 -6.60 -3.80 1.79 07/01/2004
GS Vintage V Offshore 444 0.12 0.00 0.63 4.75 6.36 6.36 26.92 19.83 18.83 17.79 10/01/2008
Pantheon Global Secondary Fund IV LP 1,031 0.27 3.48 3.48 3.72 2.52 2.52 9.27 5.10 9.84 12.79 08/01/2010
GS Vintage VI Offshore 1,855 0.48 0.00 1.34 3.34 5.21 5.21 11.40 11.31 N/A 20.05 11/01/2012
GS Vintage VII Offshore 3,507 0.91 0.00 0.00 7.60 13.76 13.76 N/A N/A N/A 53.29 09/01/2017
Pantheon Global Secondary Fund V 4,754 1.24 0.00 0.00 -2.24 -1.58 -1.58 16.82 19.84 N/A 19.84 07/01/2014
GS Co-Investment Partners II Offshore 1,072 0.28 0.00 0.00 3.63 N/A N/A N/A N/A N/A -10.31 09/01/2018
Total Debt 6,322 1.65 0.00 0.13 1.84 1.00 1.00 10.33 11.30 12.12 10.20 11/01/2007
GS Mezzanine V 135 0.04 0.00 0.00 15.82 7.00 7.00 6.46 -2.13 1.87 4.08 12/01/2007
Highbridge Offshore Mezzanine Partners II LP 1,784 0.46 0.00 0.00 -0.35 -13.62 -13.62 10.81 13.63 N/A 14.67 01/01/2013
Highbridge Irish Specialty Loan Fund III 703 0.18 -0.01 1.16 3.45 6.38 6.38 8.40 8.72 N/A 8.89 06/01/2013
GS Broad Street Senior Credit Partners 1,199 0.31 0.00 0.00 2.97 5.49 5.49 7.82 N/A N/A 7.91 07/01/2015
Highbridge European Asset Value Offshore 2,501 0.65 0.00 0.00 1.71 11.13 11.13 N/A N/A N/A 10.96 09/01/2016
37
Native Hawaiian Trust Fund
Comparative Performance As of June 30, 2019
Expense Ratio
Allocation
Market Value($000) %
Performance (%)
1Month
1Quarter
Year ToDate
Jul-2018To
Jun-20191
Year3
Years5
Years7
YearsSince
InceptionInception
Date
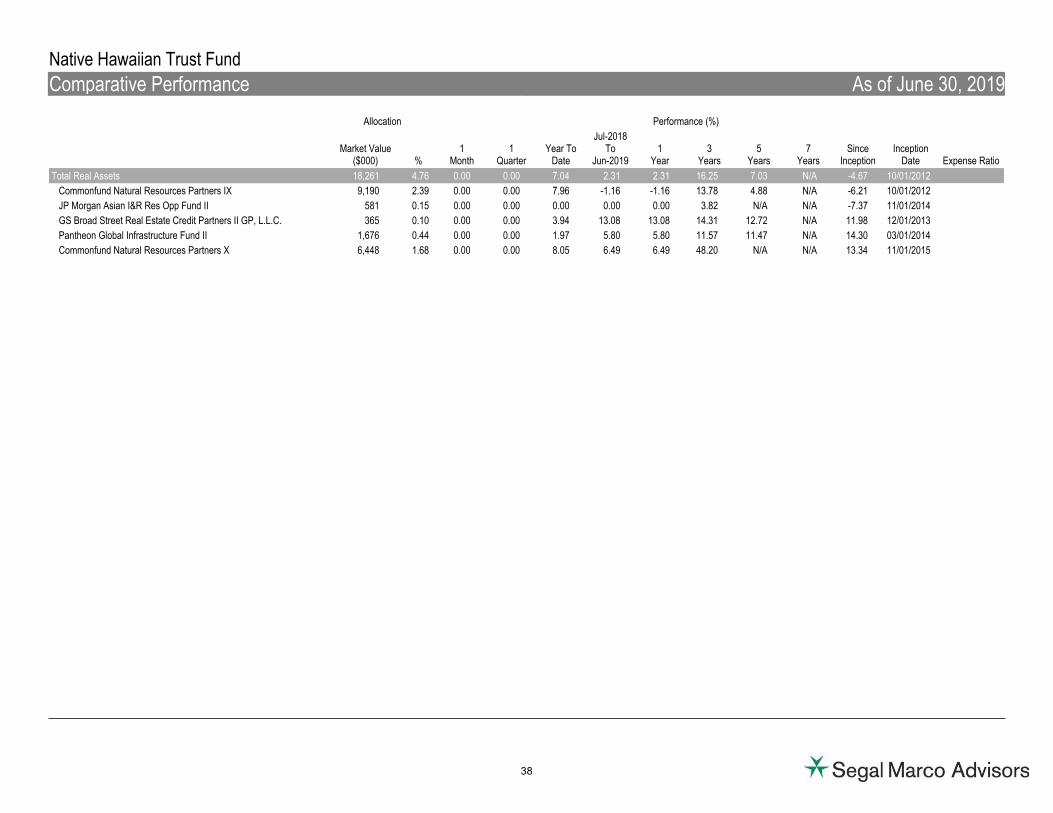
Total Real Assets 18,261 4.76 0.00 0.00 7.04 2.31 2.31 16.25 7.03 N/A -4.67 10/01/2012
Commonfund Natural Resources Partners IX 9,190 2.39 0.00 0.00 7.96 -1.16 -1.16 13.78 4.88 N/A -6.21 10/01/2012
JP Morgan Asian I&R Res Opp Fund II 581 0.15 0.00 0.00 0.00 0.00 0.00 3.82 N/A N/A -7.37 11/01/2014
GS Broad Street Real Estate Credit Partners II GP, L.L.C. 365 0.10 0.00 0.00 3.94 13.08 13.08 14.31 12.72 N/A 11.98 12/01/2013
Pantheon Global Infrastructure Fund II 1,676 0.44 0.00 0.00 1.97 5.80 5.80 11.57 11.47 N/A 14.30 03/01/2014
Commonfund Natural Resources Partners X 6,448 1.68 0.00 0.00 8.05 6.49 6.49 48.20 N/A N/A 13.34 11/01/2015
38

Native Hawaiian Trust Fund
Comparative Performance As of March 31, 2019
Expense Ratio
Allocation
Market Value($000) %
Performance (%)
1Month
1Quarter
Year ToDate
Jul-2018To
Mar-20191
Year3
Years5
Years7
YearsSince
InceptionInception
Date
Total Private Equity 82,993 21.82 4.72 4.78 4.78 8.18 12.78 15.11 11.05 11.66 11.00 07/01/2004
MSCI ACWI +3% 1.57 13.16 13.16 4.73 6.26 14.61 10.24 12.28 10.68 07/01/2004
Total Fund of Funds 43,891 11.54 5.25 5.29 5.29 13.67 18.07 15.35 12.59 13.15 8.43 08/01/2004
Pantheon Europe Fund IV LP 493 0.13 0.59 0.59 0.59 3.22 0.71 6.02 3.69 5.90 3.90 09/01/2005
Pantheon USA Fund VI LP 1,392 0.37 2.63 2.63 2.63 1.49 5.32 7.74 5.23 7.34 5.24 07/01/2004
Pantheon Europe Fund VI LP 2,653 0.70 4.57 4.57 4.57 7.45 13.47 13.24 10.20 11.19 7.02 07/01/2008
Pantheon USA Fund VIII LP 5,204 1.37 7.48 7.48 7.48 9.77 17.45 16.58 13.44 13.84 8.58 07/01/2008
GS PEP 2004 Offshore 709 0.19 16.44 16.44 16.44 6.59 11.27 10.45 7.42 10.15 9.35 03/01/2005
GS PEP 2005 Offshore 403 0.11 6.18 7.98 7.98 7.92 11.56 12.12 8.16 10.89 5.69 07/01/2006
GS PEP Asia Offshore 275 0.07 5.06 5.06 5.06 -1.89 -1.80 5.84 10.13 13.72 5.88 09/01/2007
GS PEP IX Offshore 264 0.07 4.35 4.35 4.35 2.63 9.22 14.41 12.97 13.89 7.33 09/01/2007
GS PEP X Offshore 1,112 0.29 1.18 1.82 1.82 5.39 10.80 16.78 14.31 15.87 -0.58 10/01/2008
Commonfund International Partners VII 2,207 0.58 1.22 1.22 1.22 -0.79 -3.70 6.39 9.67 7.71 0.65 06/01/2011
Commonfund Venture Partners X 8,749 2.30 10.69 10.69 10.69 29.08 37.42 20.02 22.18 N/A 19.45 09/01/2012
Pantheon Emerging Asia Fund VI LP 2,508 0.66 5.52 5.52 5.52 5.74 6.49 15.84 15.28 N/A 5.28 11/01/2012
Commonfund Private Equity Partners VIII 1,692 0.44 3.24 3.24 3.24 18.14 22.95 20.06 18.14 N/A 16.57 11/01/2012
GS GEM PEM Off 2,396 0.63 2.30 2.30 2.30 5.16 4.15 9.87 8.24 N/A -3.87 05/01/2013
Commonfund Emerging Markets Partners 2013 5,424 1.43 1.79 1.79 1.79 14.13 16.07 16.25 12.24 N/A 2.41 06/01/2013
Commonfund Private Equity Partners IX 1,629 0.43 3.50 3.50 3.50 13.64 16.87 19.18 N/A N/A 16.68 06/01/2015
Commonfund International Partners VIII 1,720 0.45 2.08 2.08 2.08 12.47 9.26 10.50 N/A N/A 2.49 06/01/2015
Commonfund Venture Partners XI 5,061 1.33 4.68 4.68 4.68 25.29 37.04 22.39 N/A N/A 25.90 02/01/2015
Total Multi-Strategy 14,167 3.73 1.75 1.80 1.80 3.43 8.80 16.00 12.84 13.23 12.30 08/01/2004
Pantheon Global Co-Investment Opps II 978 0.26 3.87 3.87 3.87 6.13 10.71 18.86 15.06 N/A 13.05 01/01/2013
Pantheon Global Secondary Fund II LP 99 0.03 -8.02 -8.02 -8.02 -12.78 -16.06 -10.76 -6.31 -4.26 1.82 07/01/2004
GS Vintage V Offshore 579 0.15 4.09 4.09 4.09 5.69 24.50 27.76 20.51 19.37 18.18 10/01/2008
Pantheon Global Secondary Fund IV LP 1,108 0.29 0.23 0.23 0.23 -0.93 3.77 8.30 5.51 9.45 12.74 08/01/2010
GS Vintage VI Offshore 2,004 0.53 1.98 1.98 1.98 3.82 4.30 10.86 15.78 N/A 20.66 11/01/2012
GS Vintage VII Offshore 3,507 0.92 7.60 7.60 7.60 13.76 21.14 N/A N/A N/A 63.99 09/01/2017
Pantheon Global Secondary Fund V 4,821 1.27 -2.24 -2.24 -2.24 -1.58 4.23 20.39 N/A N/A 20.99 07/01/2014
GS Co-Investment Partners II Offshore 1,072 0.28 2.60 3.63 3.63 N/A N/A N/A N/A N/A -10.31 09/01/2018
Total Debt 6,354 1.67 1.37 1.70 1.70 0.87 2.17 11.65 11.95 12.29 10.43 11/01/2007
GS Mezzanine V 135 0.04 15.82 15.82 15.82 7.00 13.26 7.05 -1.55 2.05 4.17 12/01/2007
Highbridge Offshore Mezzanine Partners II LP 1,784 0.47 -0.35 -0.35 -0.35 -13.62 -12.29 12.84 14.83 N/A 15.30 01/01/2013
Highbridge Irish Specialty Loan Fund III 752 0.20 0.42 2.26 2.26 5.16 7.26 8.64 8.70 N/A 9.07 06/01/2013
GS Broad Street Senior Credit Partners 1,177 0.31 2.53 2.97 2.97 5.49 6.10 9.47 N/A N/A 8.46 07/01/2015
Highbridge European Asset Value Offshore 2,506 0.66 1.71 1.71 1.71 11.13 11.67 N/A N/A N/A 12.08 09/01/2016
39
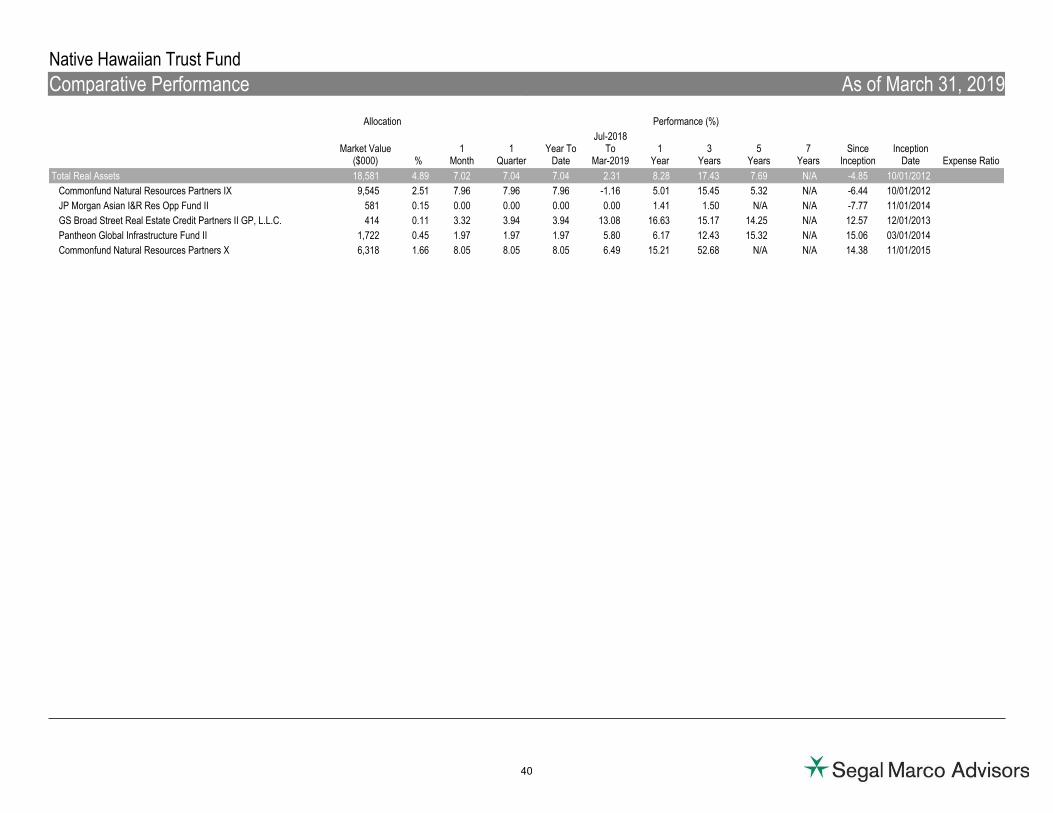
Native Hawaiian Trust Fund
Comparative Performance As of March 31, 2019
Expense Ratio
Allocation
Market Value($000) %
Performance (%)
1Month
1Quarter
Year ToDate
Jul-2018To
Mar-20191
Year3
Years5
Years7
YearsSince
InceptionInception
Date
Total Real Assets 18,581 4.89 7.02 7.04 7.04 2.31 8.28 17.43 7.69 N/A -4.85 10/01/2012
Commonfund Natural Resources Partners IX 9,545 2.51 7.96 7.96 7.96 -1.16 5.01 15.45 5.32 N/A -6.44 10/01/2012
JP Morgan Asian I&R Res Opp Fund II 581 0.15 0.00 0.00 0.00 0.00 1.41 1.50 N/A N/A -7.77 11/01/2014
GS Broad Street Real Estate Credit Partners II GP, L.L.C. 414 0.11 3.32 3.94 3.94 13.08 16.63 15.17 14.25 N/A 12.57 12/01/2013
Pantheon Global Infrastructure Fund II 1,722 0.45 1.97 1.97 1.97 5.80 6.17 12.43 15.32 N/A 15.06 03/01/2014
Commonfund Natural Resources Partners X 6,318 1.66 8.05 8.05 8.05 6.49 15.21 52.68 N/A N/A 14.38 11/01/2015
40
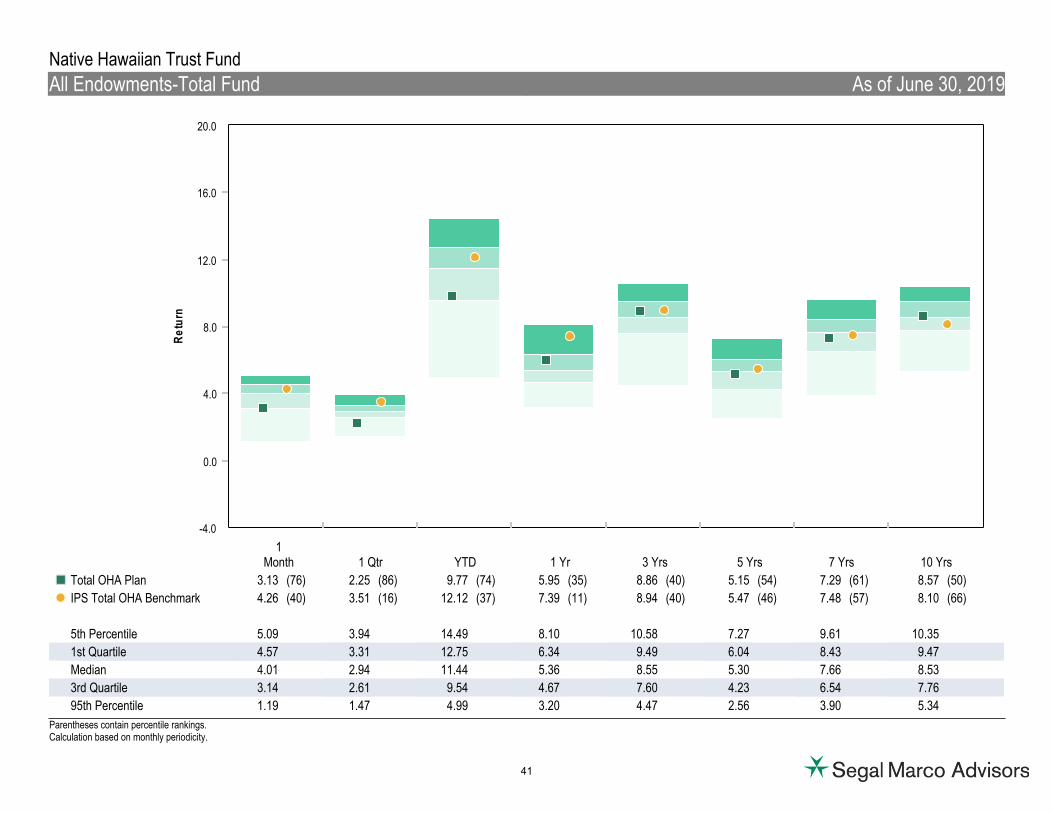
-4.0
0.0
4.0
8.0
12.0
16.0
20.0
Re
turn
1Month 1 Qtr YTD 1 Yr 3 Yrs 5 Yrs 7 Yrs 10 Yrs
Total OHA Plan 3.13 (76) 2.25 (86) 9.77 (74) 5.95 (35) 8.86 (40) 5.15 (54) 7.29 (61) 8.57 (50)¢£
IPS Total OHA Benchmark 4.26 (40) 3.51 (16) 12.12 (37) 7.39 (11) 8.94 (40) 5.47 (46) 7.48 (57) 8.10 (66)��
5th Percentile 5.09 3.94 14.49 8.10 10.58 7.27 9.61 10.35
1st Quartile 4.57 3.31 12.75 6.34 9.49 6.04 8.43 9.47
Median 4.01 2.94 11.44 5.36 8.55 5.30 7.66 8.53
3rd Quartile 3.14 2.61 9.54 4.67 7.60 4.23 6.54 7.76
95th Percentile 1.19 1.47 4.99 3.20 4.47 2.56 3.90 5.34
Native Hawaiian Trust Fund
All Endowments-Total Fund As of June 30, 2019
Parentheses contain percentile rankings.Calculation based on monthly periodicity.
41
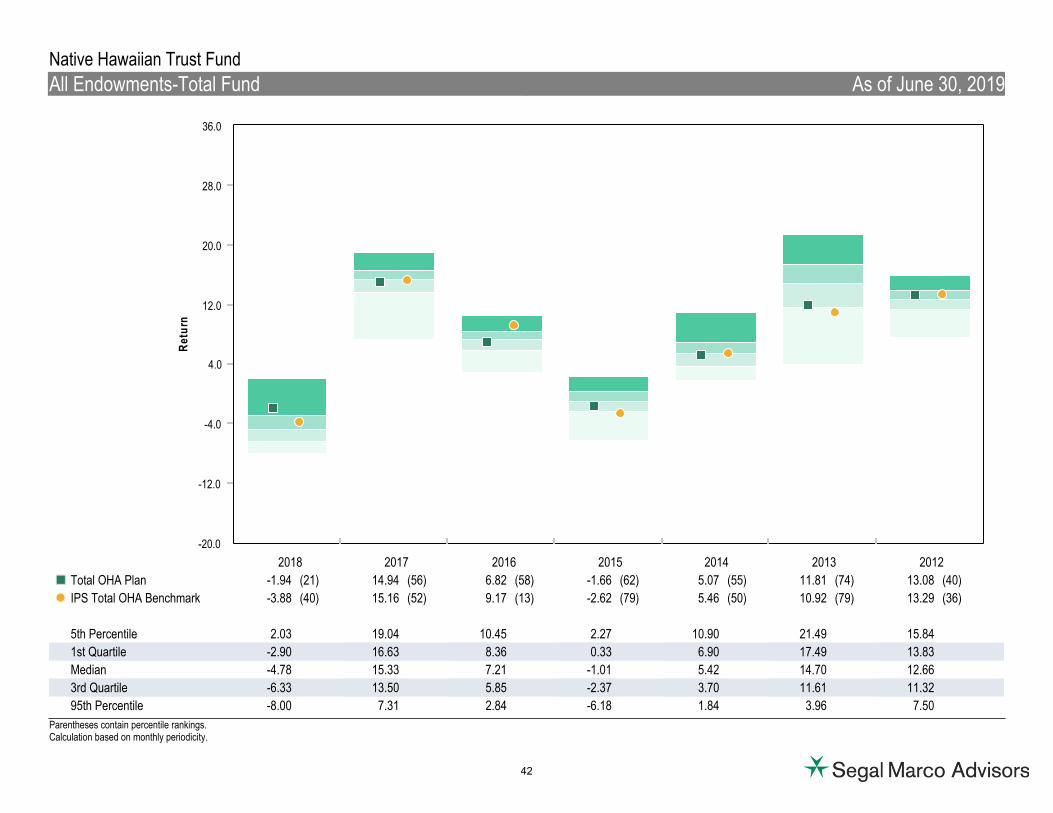
-20.0
-12.0
-4.0
4.0
12.0
20.0
28.0
36.0
Ret
urn
2018 2017 2016 2015 2014 2013 2012
Total OHA Plan -1.94 (21) 14.94 (56) 6.82 (58) -1.66 (62) 5.07 (55) 11.81 (74) 13.08 (40)¢£
IPS Total OHA Benchmark -3.88 (40) 15.16 (52) 9.17 (13) -2.62 (79) 5.46 (50) 10.92 (79) 13.29 (36)��
5th Percentile 2.03 19.04 10.45 2.27 10.90 21.49 15.84
1st Quartile -2.90 16.63 8.36 0.33 6.90 17.49 13.83
Median -4.78 15.33 7.21 -1.01 5.42 14.70 12.66
3rd Quartile -6.33 13.50 5.85 -2.37 3.70 11.61 11.32
95th Percentile -8.00 7.31 2.84 -6.18 1.84 3.96 7.50
Native Hawaiian Trust Fund
All Endowments-Total Fund As of June 30, 2019
Parentheses contain percentile rankings.Calculation based on monthly periodicity.
42
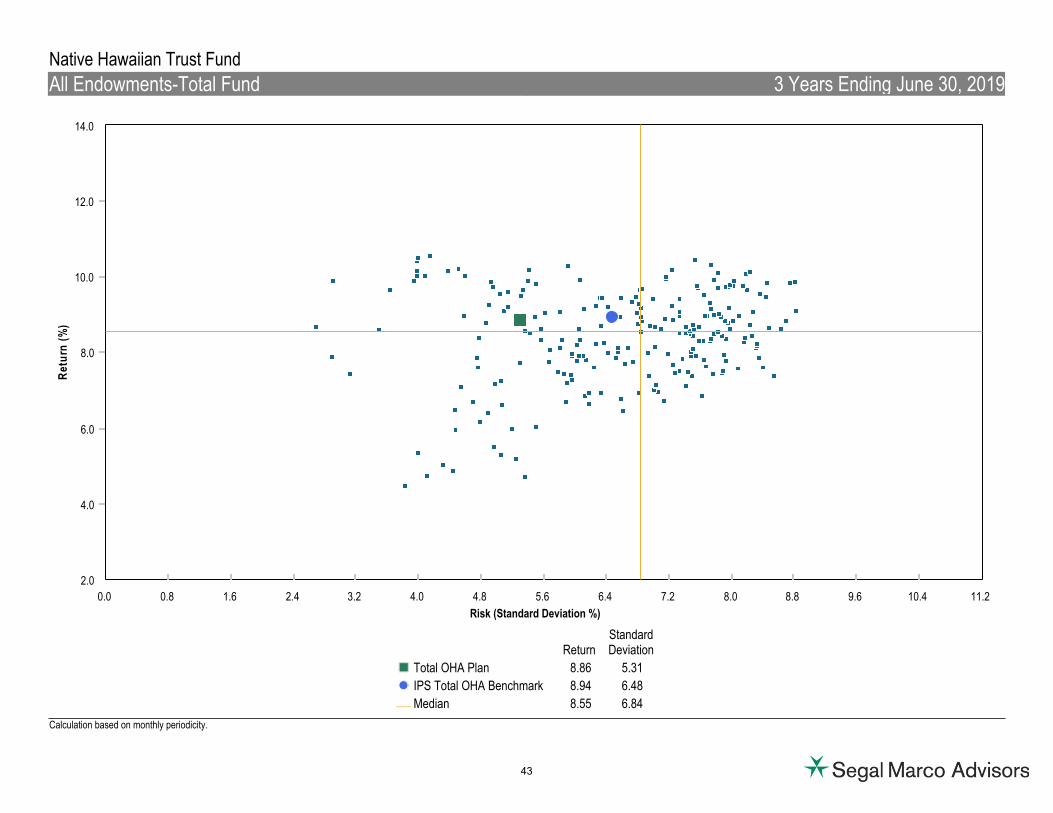
2.0
4.0
6.0
8.0
10.0
12.0
14.0
Ret
urn
(%)
0.0 0.8 1.6 2.4 3.2 4.0 4.8 5.6 6.4 7.2 8.0 8.8 9.6 10.4 11.2
Risk (Standard Deviation %)
ReturnStandardDeviation
Total OHA Plan 8.86 5.31¢£
IPS Total OHA Benchmark 8.94 6.48��
Median 8.55 6.84¾
Native Hawaiian Trust Fund
All Endowments-Total Fund 3 Years Ending June 30, 2019
Calculation based on monthly periodicity.
43
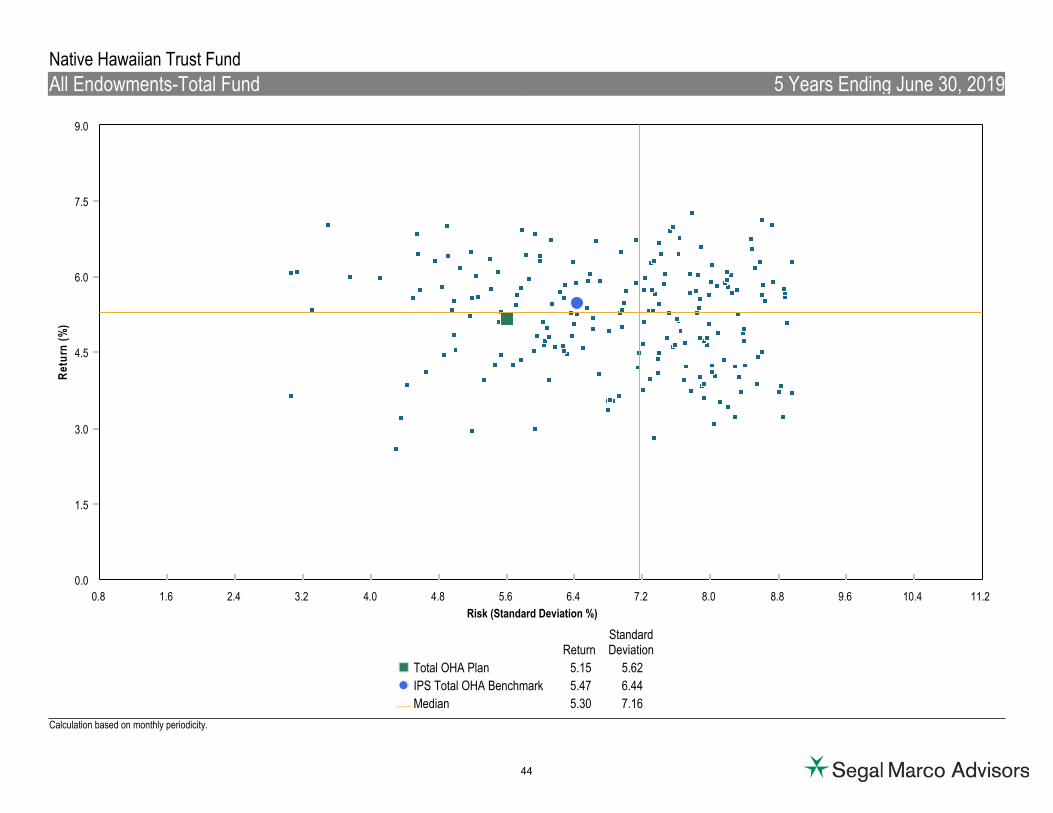
0.0
1.5
3.0
4.5
6.0
7.5
9.0
Ret
urn
(%)
0.8 1.6 2.4 3.2 4.0 4.8 5.6 6.4 7.2 8.0 8.8 9.6 10.4 11.2
Risk (Standard Deviation %)
ReturnStandardDeviation
Total OHA Plan 5.15 5.62¢£
IPS Total OHA Benchmark 5.47 6.44��
Median 5.30 7.16¾
Native Hawaiian Trust Fund
All Endowments-Total Fund 5 Years Ending June 30, 2019
Calculation based on monthly periodicity.
44

Total Global Equities
45
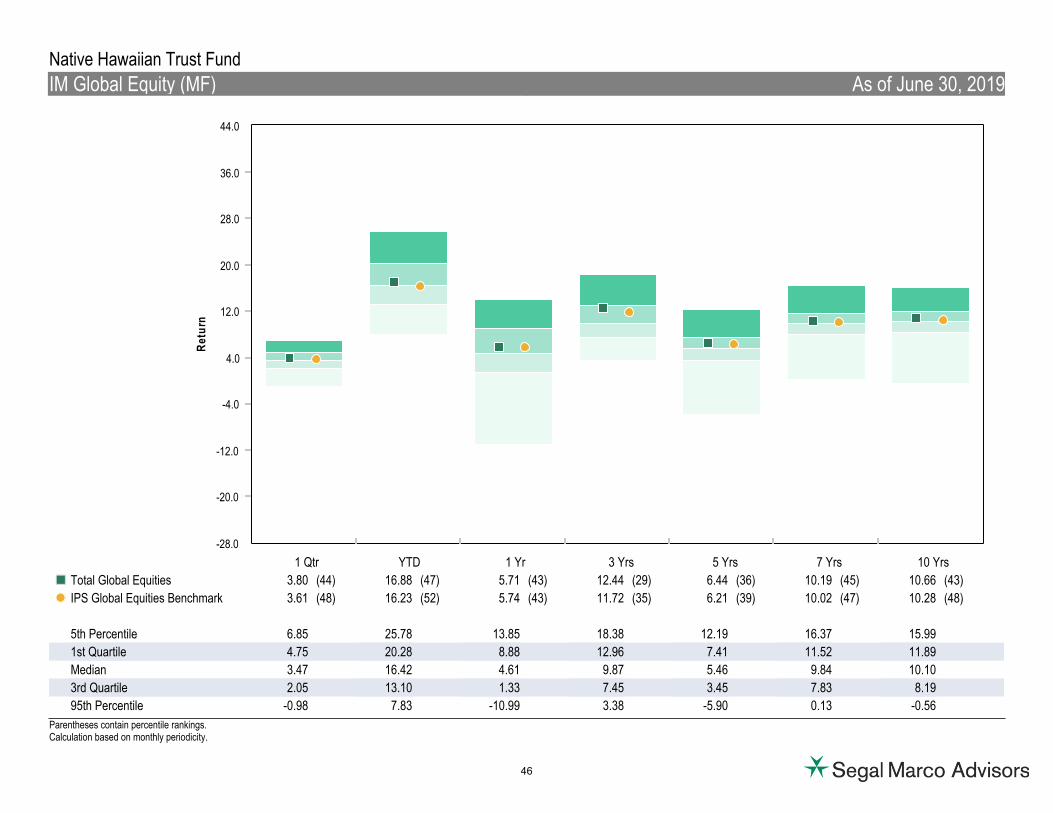
-28.0
-20.0
-12.0
-4.0
4.0
12.0
20.0
28.0
36.0
44.0
Ret
urn
1 Qtr YTD 1 Yr 3 Yrs 5 Yrs 7 Yrs 10 Yrs
Total Global Equities 3.80 (44) 16.88 (47) 5.71 (43) 12.44 (29) 6.44 (36) 10.19 (45) 10.66 (43)¢£
IPS Global Equities Benchmark 3.61 (48) 16.23 (52) 5.74 (43) 11.72 (35) 6.21 (39) 10.02 (47) 10.28 (48)��
5th Percentile 6.85 25.78 13.85 18.38 12.19 16.37 15.99
1st Quartile 4.75 20.28 8.88 12.96 7.41 11.52 11.89
Median 3.47 16.42 4.61 9.87 5.46 9.84 10.10
3rd Quartile 2.05 13.10 1.33 7.45 3.45 7.83 8.19
95th Percentile -0.98 7.83 -10.99 3.38 -5.90 0.13 -0.56
Native Hawaiian Trust Fund
IM Global Equity (MF) As of June 30, 2019
Parentheses contain percentile rankings.Calculation based on monthly periodicity.
46

-55.0
-40.0
-25.0
-10.0
5.0
20.0
35.0
50.0
65.0
80.0
Ret
urn
2018 2017 2016 2015 2014 2013 2012
Total Global Equities -9.72 (51) 24.24 (39) 8.02 (36) -1.75 (52) 3.50 (43) 23.91 (56) 17.83 (30)¢£
IPS Global Equities Benchmark -9.42 (46) 23.89 (42) 8.36 (33) -2.19 (57) 3.84 (41) 23.55 (58) 16.38 (40)��
5th Percentile -0.63 38.46 26.71 9.06 15.46 43.09 24.32
1st Quartile -6.74 27.08 9.82 2.03 5.82 29.70 18.53
Median -9.71 22.31 6.33 -1.64 2.58 25.00 14.88
3rd Quartile -13.41 17.18 3.17 -5.76 -0.78 18.35 10.48
95th Percentile -21.07 6.23 -6.09 -22.59 -14.35 2.60 -1.71
Native Hawaiian Trust Fund
IM Global Equity (MF) As of June 30, 2019
Parentheses contain percentile rankings.Calculation based on monthly periodicity.
47
Total Global Fixed Income
48

-4.0
-2.0
0.0
2.0
4.0
6.0
8.0
10.0
12.0
14.0
Ret
urn
1 Qtr YTD 1 Yr 3 Yrs 5 Yrs 7 Yrs 10 Yrs
Total Global Fixed Income 2.72 (82) 6.39 (59) 6.91 (37) 3.53 (21) 2.16 (33) 2.94 (25) 4.75 (28)¢£
IPS Global Fixed Income Benchmark 3.08 (69) 6.11 (69) 7.87 (19) 4.14 (16) 3.27 (14) 3.34 (15) 4.43 (34)��
5th Percentile 4.35 9.07 9.23 4.92 3.69 4.13 5.99
1st Quartile 3.84 7.09 7.40 3.34 2.55 2.94 4.79
Median 3.37 6.54 6.42 2.56 1.51 2.09 3.66
3rd Quartile 2.93 5.81 5.25 1.93 0.90 1.54 2.96
95th Percentile 1.94 3.53 3.60 1.00 0.23 0.58 1.88
Native Hawaiian Trust Fund
IM Global Fixed Income (MF) As of June 30, 2019
Parentheses contain percentile rankings.Calculation based on monthly periodicity.
49
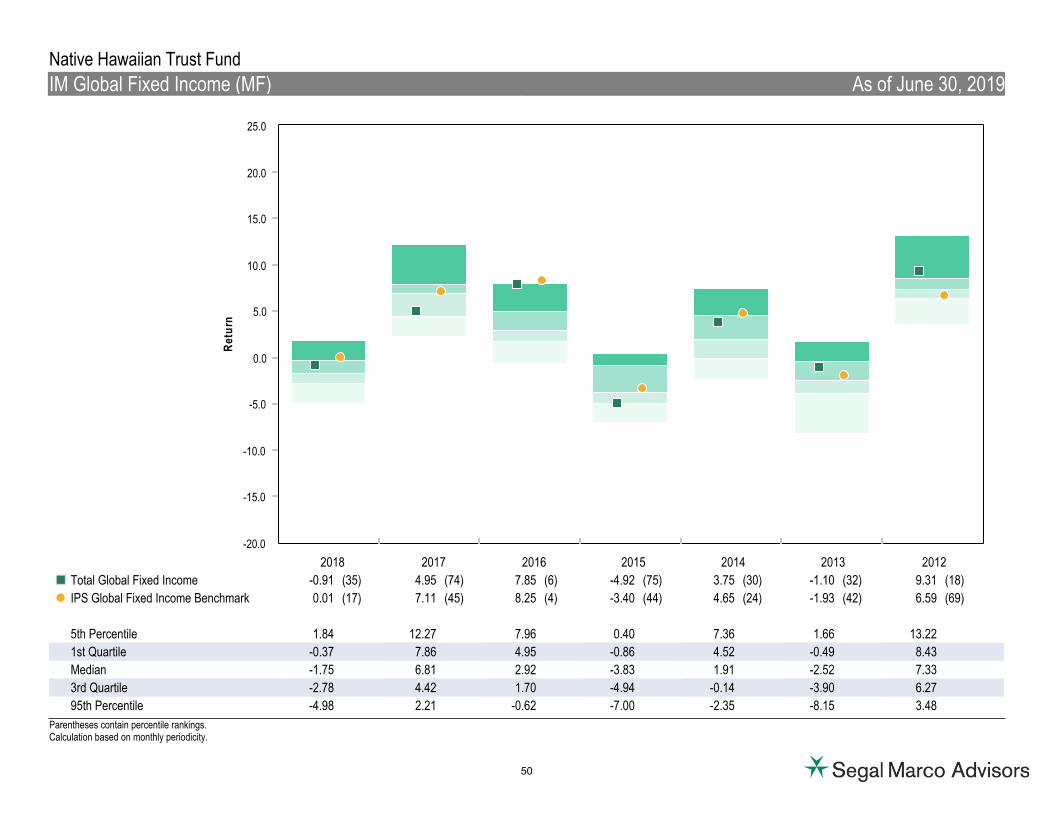
-20.0
-15.0
-10.0
-5.0
0.0
5.0
10.0
15.0
20.0
25.0
Ret
urn
2018 2017 2016 2015 2014 2013 2012
Total Global Fixed Income -0.91 (35) 4.95 (74) 7.85 (6) -4.92 (75) 3.75 (30) -1.10 (32) 9.31 (18)¢£
IPS Global Fixed Income Benchmark 0.01 (17) 7.11 (45) 8.25 (4) -3.40 (44) 4.65 (24) -1.93 (42) 6.59 (69)��
5th Percentile 1.84 12.27 7.96 0.40 7.36 1.66 13.22
1st Quartile -0.37 7.86 4.95 -0.86 4.52 -0.49 8.43
Median -1.75 6.81 2.92 -3.83 1.91 -2.52 7.33
3rd Quartile -2.78 4.42 1.70 -4.94 -0.14 -3.90 6.27
95th Percentile -4.98 2.21 -0.62 -7.00 -2.35 -8.15 3.48
Native Hawaiian Trust Fund
IM Global Fixed Income (MF) As of June 30, 2019
Parentheses contain percentile rankings.Calculation based on monthly periodicity.
50
Total Global Real Assets
51
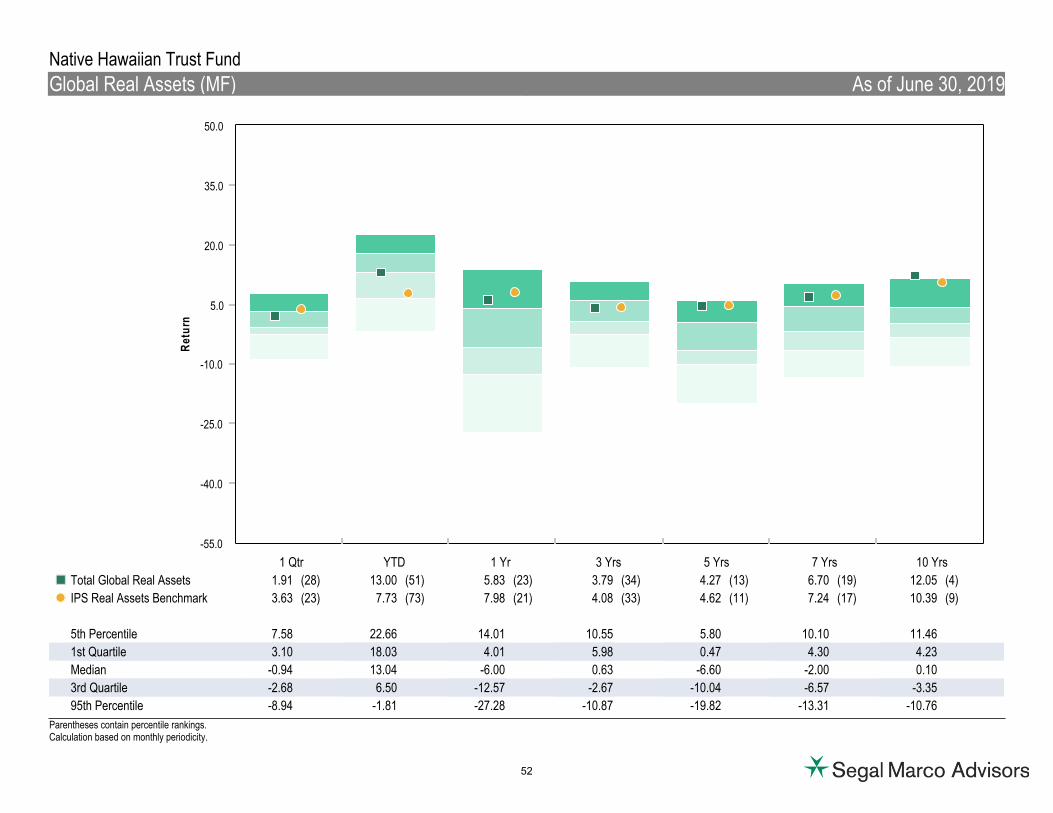
-55.0
-40.0
-25.0
-10.0
5.0
20.0
35.0
50.0
Ret
urn
1 Qtr YTD 1 Yr 3 Yrs 5 Yrs 7 Yrs 10 Yrs
Total Global Real Assets 1.91 (28) 13.00 (51) 5.83 (23) 3.79 (34) 4.27 (13) 6.70 (19) 12.05 (4)¢£
IPS Real Assets Benchmark 3.63 (23) 7.73 (73) 7.98 (21) 4.08 (33) 4.62 (11) 7.24 (17) 10.39 (9)��
5th Percentile 7.58 22.66 14.01 10.55 5.80 10.10 11.46
1st Quartile 3.10 18.03 4.01 5.98 0.47 4.30 4.23
Median -0.94 13.04 -6.00 0.63 -6.60 -2.00 0.10
3rd Quartile -2.68 6.50 -12.57 -2.67 -10.04 -6.57 -3.35
95th Percentile -8.94 -1.81 -27.28 -10.87 -19.82 -13.31 -10.76
Native Hawaiian Trust Fund
Global Real Assets (MF) As of June 30, 2019
Parentheses contain percentile rankings.Calculation based on monthly periodicity.
52

-80.0
-60.0
-40.0
-20.0
0.0
20.0
40.0
60.0
80.0
Ret
urn
2018 2017 2016 2015 2014 2013 2012
Total Global Real Assets -5.37 (9) 8.74 (35) 3.55 (92) -0.67 (6) 15.27 (5) 3.16 (56) 27.37 (1)¢£
IPS Real Assets Benchmark 1.70 (4) 7.65 (37) 4.06 (92) -0.79 (6) 15.02 (6) 4.39 (55) 28.65 (1)��
5th Percentile -1.40 26.84 40.54 -0.15 15.18 33.25 18.93
1st Quartile -10.92 14.08 27.78 -14.92 3.63 20.16 7.74
Median -14.79 3.16 17.07 -23.83 -11.32 8.49 2.30
3rd Quartile -20.16 -4.75 10.44 -30.38 -18.52 -9.21 -2.15
95th Percentile -30.67 -13.73 -5.95 -44.02 -31.27 -22.15 -18.83
Native Hawaiian Trust Fund
Global Real Assets (MF) As of June 30, 2019
Parentheses contain percentile rankings.Calculation based on monthly periodicity.
53

Total Hedge Funds
54

-28.0
-20.0
-12.0
-4.0
4.0
12.0
20.0
28.0
36.0
Ret
urn
1 Qtr YTD 1 Yr 3 Yrs 5 Yrs 7 Yrs 10 Yrs
Total Hedge Funds 1.71 (80) 3.96 (73) 4.46 (67) 3.71 (58) 2.24 (23) 3.88 (21) N/A¢£
IPS Hedge Fund Benchmark 1.63 (80) 3.25 (78) 6.40 (61) 5.43 (36) 4.89 (9) 5.17 (11) N/A��
5th Percentile 9.11 15.53 22.91 13.13 7.08 8.58 11.12
1st Quartile 5.36 8.56 11.65 6.73 2.03 3.10 5.61
Median 3.96 5.86 7.77 4.18 -0.09 1.10 3.61
3rd Quartile 2.27 3.68 1.74 2.36 -1.99 -0.11 2.58
95th Percentile -2.83 -2.65 -10.18 -8.86 -13.08 -11.15 -2.83
Native Hawaiian Trust Fund
Multi-Strategy Hedge Funds-[TASS] As of June 30, 2019
Parentheses contain percentile rankings.Calculation based on monthly periodicity.
55
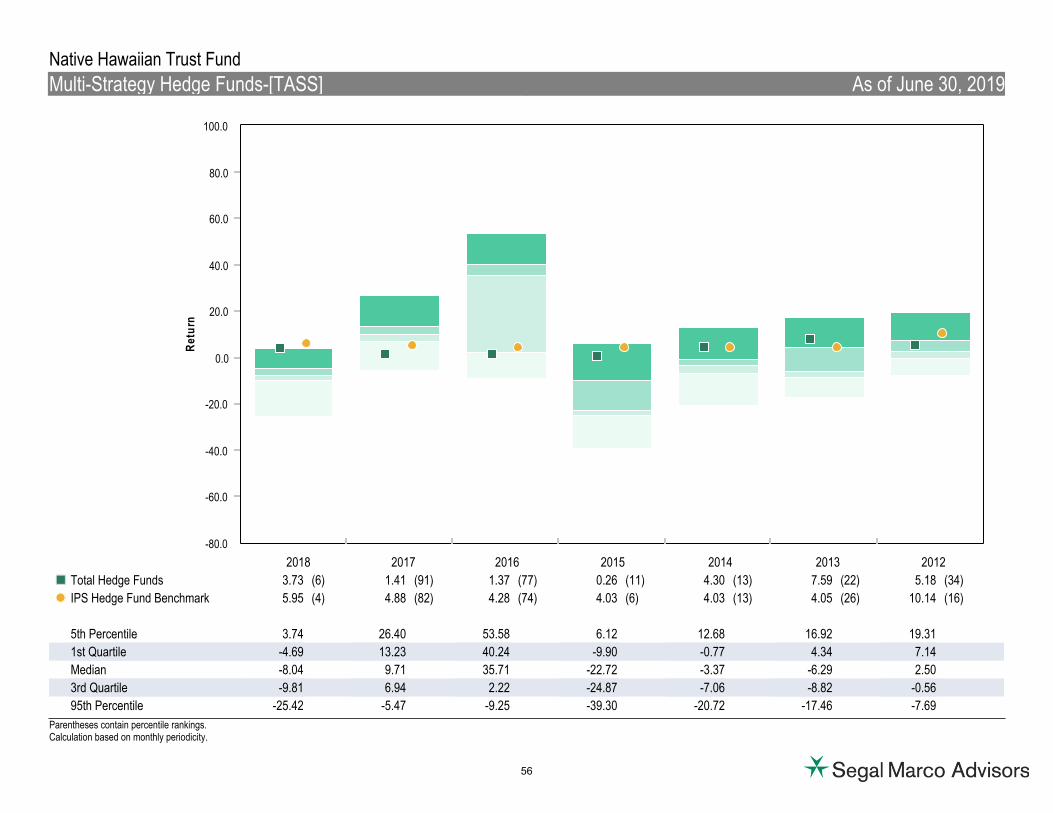
-80.0
-60.0
-40.0
-20.0
0.0
20.0
40.0
60.0
80.0
100.0
Ret
urn
2018 2017 2016 2015 2014 2013 2012
Total Hedge Funds 3.73 (6) 1.41 (91) 1.37 (77) 0.26 (11) 4.30 (13) 7.59 (22) 5.18 (34)¢£
IPS Hedge Fund Benchmark 5.95 (4) 4.88 (82) 4.28 (74) 4.03 (6) 4.03 (13) 4.05 (26) 10.14 (16)��
5th Percentile 3.74 26.40 53.58 6.12 12.68 16.92 19.31
1st Quartile -4.69 13.23 40.24 -9.90 -0.77 4.34 7.14
Median -8.04 9.71 35.71 -22.72 -3.37 -6.29 2.50
3rd Quartile -9.81 6.94 2.22 -24.87 -7.06 -8.82 -0.56
95th Percentile -25.42 -5.47 -9.25 -39.30 -20.72 -17.46 -7.69
Native Hawaiian Trust Fund
Multi-Strategy Hedge Funds-[TASS] As of June 30, 2019
Parentheses contain percentile rankings.Calculation based on monthly periodicity.
56
Total Private Equity
57

PartnershipsInvestment
TypeVintage
YearInvestment
Strategy
CapitalCommitted
($000)
TotalContribution
($000)
TotalDistribution
($000)
MarketValue($000)
IRR(%)
TVPIMultiple
DPIMultiple
PICMultiple PME+
Pantheon Europe Fund IV LP Fund Of Funds 2004 International Private Equity 5,172 4,836 5,822 493 4.72 1.31 1.20 0.94 8.10
Pantheon Global Secondary Fund II LP Secondary 2004 Secondaries 5,000 4,750 5,620 74 4.33 1.20 1.18 0.95 6.12
Pantheon USA Fund VI LP Fund Of Funds 2004 Hybrid 6,000 5,670 7,616 1,329 7.07 1.58 1.34 0.95 7.60
GS PEP 2004 Offshore Fund Of Funds 2004 Buyouts 9,900 11,077 15,075 709 6.86 1.43 1.36 1.12 6.95
GS PEP 2005 Offshore Fund Of Funds 2005 Hybrid 2,000 2,177 2,289 342 3.30 1.21 1.05 1.09 8.78
Pantheon Europe Fund VI LP Fund Of Funds 2007 International Private Equity 6,481 5,807 6,754 2,260 9.15 1.55 1.16 0.90 13.93
Pantheon USA Fund VIII LP Fund Of Funds 2007 Other 7,500 6,750 7,901 4,739 12.14 1.87 1.17 0.90 13.25
GS PEP Asia Offshore Fund Of Funds 2007 Buyouts 1,000 894 1,120 254 9.57 1.54 1.25 0.89 12.67
GS PEP IX Offshore Fund Of Funds 2007 Buyouts 1,000 1,039 1,371 222 9.04 1.53 1.32 1.04 12.44
GS Mezzanine V Partnership 2007 Other 8,500 7,768 10,032 135 10.00 1.31 1.29 0.91 7.19
GS PEP X Offshore Fund Of Funds 2008 Buyouts 3,000 2,930 3,741 1,020 11.51 1.63 1.28 0.98 13.92
GS Vintage V Offshore Secondary 2008 Secondaries 4,500 3,973 6,038 444 13.10 1.63 1.52 0.88 14.54
Pantheon Global Secondary Fund IV LP Secondary 2010 Secondaries 5,000 3,358 4,195 1,031 13.33 1.56 1.25 0.67 14.81
Commonfund International Partners VII Fund Of Funds 2011 Buyouts 3,000 2,651 1,315 2,169 7.18 1.32 0.50 0.88 13.54
Commonfund Natural Resources Partners IX Fund Of Funds 2011 Energy & Natural Resources 10,000 8,665 1,776 9,190 7.20 1.27 0.21 0.87 12.31
Commonfund Venture Partners X Fund Of Funds 2012 Venture Capital 5,000 4,625 1,577 8,417 20.91 2.16 0.34 0.93 11.98
Pantheon Emerging Asia Fund VI LP Fund Of Funds 2012 International Private Equity 2,000 1,754 48 2,500 10.77 1.45 0.03 0.88 12.76
Pantheon Global Co-Investment Opps II Co-Investment 2012 International Private Equity 1,000 928 804 858 15.05 1.79 0.87 0.93 12.40
Highbridge Offshore Mezzanine Partners II LP Direct 2012 Mezzanine 5,000 4,802 5,170 1,784 15.30 1.50 1.12 0.93 11.69
Commonfund Private Equity Partners VIII Fund Of Funds 2012 Buyouts 2,000 1,550 1,028 1,590 16.41 1.69 0.66 0.78 12.08
GS Vintage VI Offshore Secondary 2012 Secondaries 5,000 4,354 3,841 1,855 11.41 1.31 0.88 0.87 12.41
GS GEM PEM Off Fund Of Funds 2012 Buyouts 2,500 2,585 616 2,396 4.67 1.17 0.24 1.03 12.40
Commonfund Emerging Markets Partners 2013 Fund Of Funds 2013 International Private Equity 5,000 4,000 653 5,424 14.69 1.52 0.16 0.80 12.14
Highbridge Irish Specialty Loan Fund III Direct 2013 Other 3,000 3,672 3,637 703 6.22 1.18 0.99 1.22 10.74
Pantheon Global Infrastructure Fund II Secondary 2013 Infrastructure 2,000 1,686 588 1,676 12.91 1.34 0.35 0.84 12.29
JP Morgan Asian I&R Res Opp Fund II Other 2013 Infrastructure 930 996 64 581 -10.02 0.64 0.06 1.07 10.49
GS Broad Street Real Estate Credit Partners II GP, L.L.C. Partnership 2013 Real Estate 3,000 3,668 3,825 365 10.62 1.14 1.04 1.22 10.16
Pantheon Global Secondary Fund V Secondary 2014 Secondaries 7,000 4,701 1,449 4,754 13.75 1.32 0.31 0.67 11.29
Commonfund Private Equity Partners IX Fund Of Funds 2014 Buyouts 2,000 1,420 397 1,629 17.65 1.43 0.28 0.71 12.97
Commonfund International Partners VIII Fund Of Funds 2014 Buyouts 3,000 1,853 334 1,829 8.87 1.17 0.18 0.62 13.57
Commonfund Natural Resources Partners X Fund Of Funds 2014 Energy & Natural Resources 9,500 5,771 1,379 6,448 25.55 1.36 0.24 0.61 12.52
Commonfund Venture Partners XI Fund Of Funds 2015 Venture Capital 4,750 3,741 307 5,249 22.53 1.49 0.08 0.79 12.61
GS Broad Street Senior Credit Partners Partnership 2015 Other 2,500 2,355 1,360 1,199 7.67 1.09 0.58 0.94 12.53
Highbridge European Asset Value Offshore Direct 2016 Other 3,000 2,411 278 2,501 8.56 1.17 0.12 0.80 11.74
Office of Hawaiian Affairs
Composite Overview June 30, 2019
58
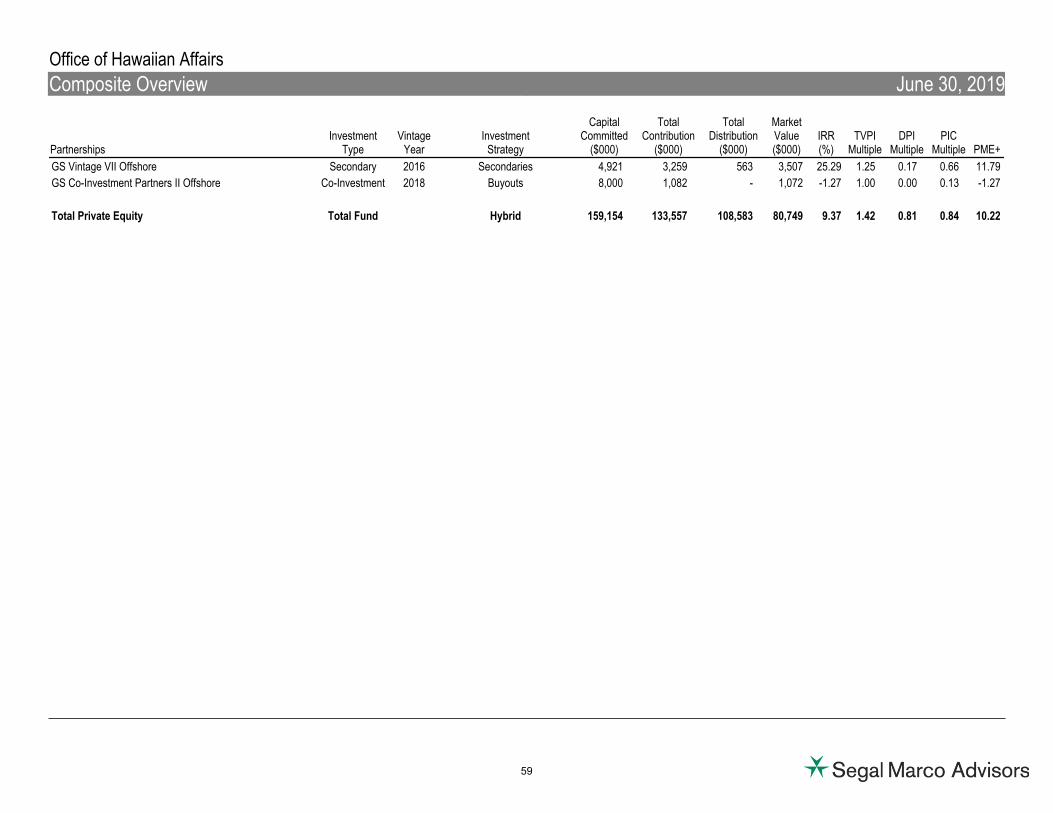
Office of Hawaiian Affairs
Composite Overview June 30, 2019
PartnershipsInvestment
TypeVintage
YearInvestment
Strategy
CapitalCommitted
($000)
TotalContribution
($000)
TotalDistribution
($000)
MarketValue($000)
IRR(%)
TVPIMultiple
DPIMultiple
PICMultiple PME+
GS Vintage VII Offshore Secondary 2016 Secondaries 4,921 3,259 563 3,507 25.29 1.25 0.17 0.66 11.79
GS Co-Investment Partners II Offshore Co-Investment 2018 Buyouts 8,000 1,082 - 1,072 -1.27 1.00 0.00 0.13 -1.27
Total Private Equity Total Fund Hybrid 159,154 133,557 108,583 80,749 9.37 1.42 0.81 0.84 10.22
59
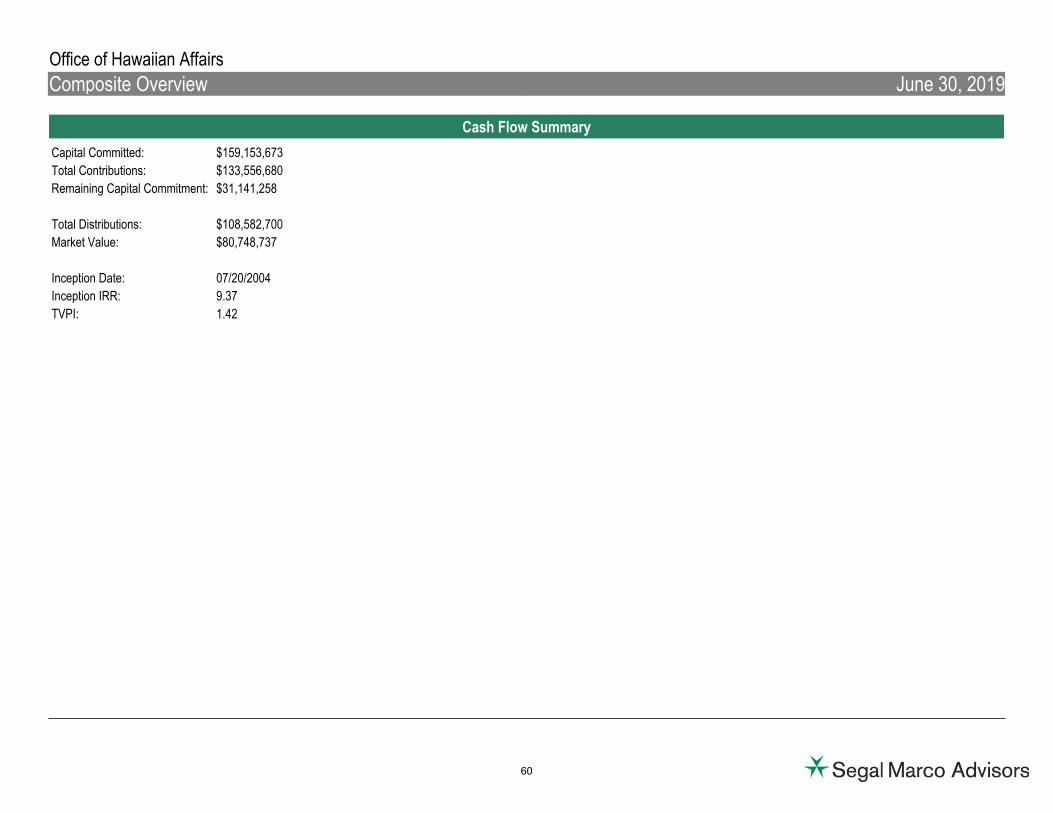
Cash Flow Summary
Capital Committed: $159,153,673
Total Contributions: $133,556,680
Remaining Capital Commitment: $31,141,258
Total Distributions: $108,582,700
Market Value: $80,748,737
Inception Date: 07/20/2004
Inception IRR: 9.37
TVPI: 1.42
Office of Hawaiian Affairs
Composite Overview June 30, 2019
60
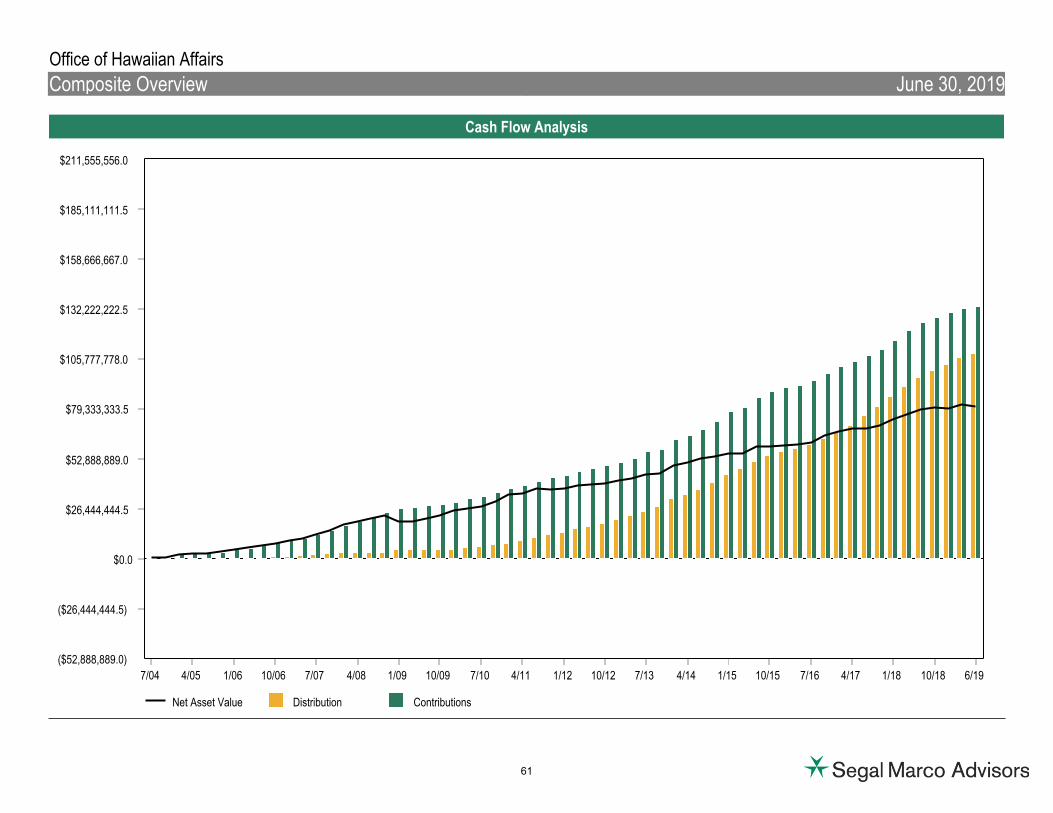
Cash Flow Analysis
Net Asset Value Distribution Contributions
$0.0
$26,444,444.5
$52,888,889.0
$79,333,333.5
$105,777,778.0
$132,222,222.5
$158,666,667.0
$185,111,111.5
$211,555,556.0
($26,444,444.5)
($52,888,889.0)
7/04 4/05 1/06 10/06 7/07 4/08 1/09 10/09 7/10 4/11 1/12 10/12 7/13 4/14 1/15 10/15 7/16 4/17 1/18 10/18 6/19
Office of Hawaiian Affairs
Composite Overview June 30, 2019
61

Appendix
62
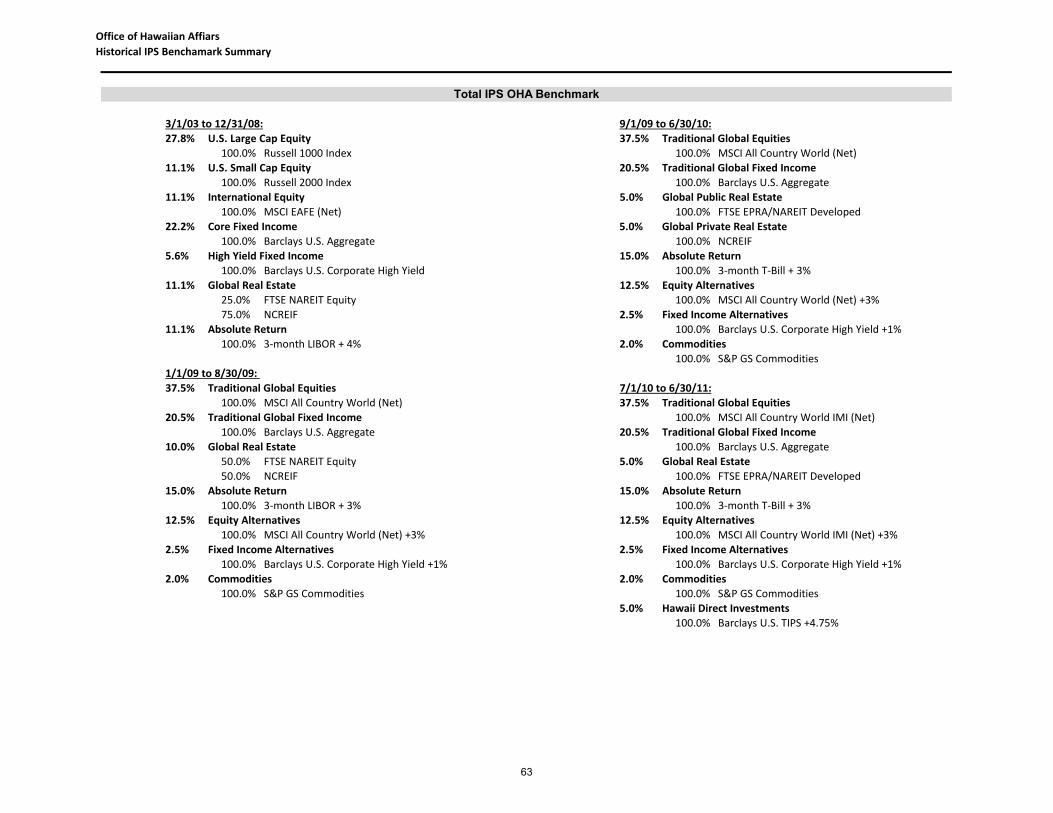
Office of Hawaiian Affiars Historical IPS Benchamark Summary
3/1/03 to 12/31/08: 9/1/09 to 6/30/10:27.8% U.S. Large Cap Equity 37.5% Traditional Global Equities
100.0% Russell 1000 Index 100.0% MSCI All Country World (Net) 11.1% U.S. Small Cap Equity 20.5% Traditional Global Fixed Income
100.0% Russell 2000 Index 100.0% Barclays U.S. Aggregate 11.1% International Equity 5.0% Global Public Real Estate
100.0% MSCI EAFE (Net) 100.0% FTSE EPRA/NAREIT Developed22.2% Core Fixed Income 5.0% Global Private Real Estate
100.0% Barclays U.S. Aggregate 100.0% NCREIF5.6% High Yield Fixed Income 15.0% Absolute Return
100.0% Barclays U.S. Corporate High Yield 100.0% 3‐month T‐Bill + 3% 11.1% Global Real Estate 12.5% Equity Alternatives
25.0% FTSE NAREIT Equity 100.0% MSCI All Country World (Net) +3% 75.0% NCREIF 2.5% Fixed Income Alternatives
11.1% Absolute Return 100.0% Barclays U.S. Corporate High Yield +1%100.0% 3‐month LIBOR + 4% 2.0% Commodities
100.0% S&P GS Commodities1/1/09 to 8/30/09: 37.5% Traditional Global Equities 7/1/10 to 6/30/11:
100.0% MSCI All Country World (Net) 37.5% Traditional Global Equities 20.5% Traditional Global Fixed Income 100.0% MSCI All Country World IMI (Net)
100.0% Barclays U.S. Aggregate 20.5% Traditional Global Fixed Income 10.0% Global Real Estate 100.0% Barclays U.S. Aggregate
50.0% FTSE NAREIT Equity 5.0% Global Real Estate50.0% NCREIF 100.0% FTSE EPRA/NAREIT Developed
15.0% Absolute Return 15.0% Absolute Return100.0% 3‐month LIBOR + 3% 100.0% 3‐month T‐Bill + 3%
12.5% Equity Alternatives 12.5% Equity Alternatives100.0% MSCI All Country World (Net) +3% 100.0% MSCI All Country World IMI (Net) +3%
2.5% Fixed Income Alternatives 2.5% Fixed Income Alternatives100.0% Barclays U.S. Corporate High Yield +1% 100.0% Barclays U.S. Corporate High Yield +1%
2.0% Commodities 2.0% Commodities100.0% S&P GS Commodities 100.0% S&P GS Commodities
5.0% Hawaii Direct Investments100.0% Barclays U.S. TIPS +4.75%
Total IPS OHA Benchmark
63
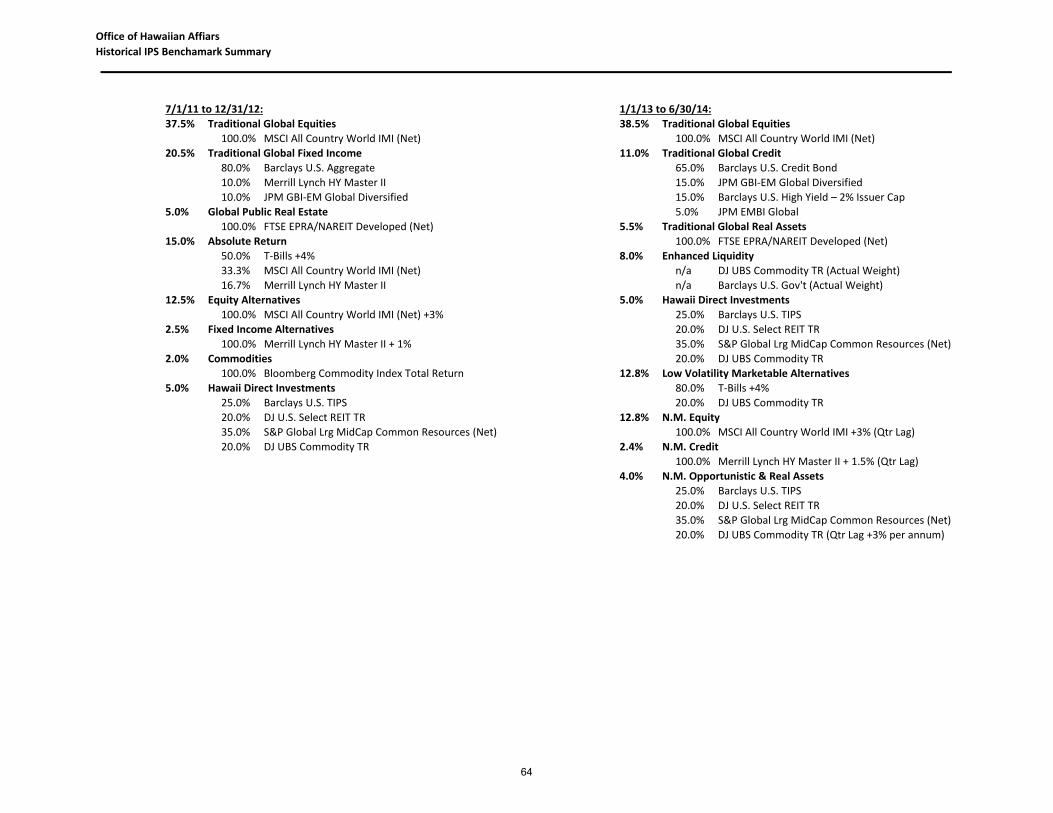
Office of Hawaiian Affiars Historical IPS Benchamark Summary
7/1/11 to 12/31/12: 1/1/13 to 6/30/14:37.5% Traditional Global Equities 38.5% Traditional Global Equities
100.0% MSCI All Country World IMI (Net) 100.0% MSCI All Country World IMI (Net) 20.5% Traditional Global Fixed Income 11.0% Traditional Global Credit
80.0% Barclays U.S. Aggregate 65.0% Barclays U.S. Credit Bond 10.0% Merrill Lynch HY Master II 15.0% JPM GBI‐EM Global Diversified10.0% JPM GBI‐EM Global Diversified 15.0% Barclays U.S. High Yield – 2% Issuer Cap
5.0% Global Public Real Estate 5.0% JPM EMBI Global100.0% FTSE EPRA/NAREIT Developed (Net) 5.5% Traditional Global Real Assets
15.0% Absolute Return 100.0% FTSE EPRA/NAREIT Developed (Net)50.0% T‐Bills +4% 8.0% Enhanced Liquidity33.3% MSCI All Country World IMI (Net) n/a DJ UBS Commodity TR (Actual Weight)16.7% Merrill Lynch HY Master II n/a Barclays U.S. Gov't (Actual Weight)
12.5% Equity Alternatives 5.0% Hawaii Direct Investments100.0% MSCI All Country World IMI (Net) +3% 25.0% Barclays U.S. TIPS
2.5% Fixed Income Alternatives 20.0% DJ U.S. Select REIT TR 100.0% Merrill Lynch HY Master II + 1% 35.0% S&P Global Lrg MidCap Common Resources (Net)
2.0% Commodities 20.0% DJ UBS Commodity TR 100.0% Bloomberg Commodity Index Total Return 12.8% Low Volatility Marketable Alternatives
5.0% Hawaii Direct Investments 80.0% T‐Bills +4%25.0% Barclays U.S. TIPS 20.0% DJ UBS Commodity TR 20.0% DJ U.S. Select REIT TR 12.8% N.M. Equity35.0% S&P Global Lrg MidCap Common Resources (Net) 100.0% MSCI All Country World IMI +3% (Qtr Lag)20.0% DJ UBS Commodity TR 2.4% N.M. Credit
100.0% Merrill Lynch HY Master II + 1.5% (Qtr Lag)4.0% N.M. Opportunistic & Real Assets
25.0% Barclays U.S. TIPS 20.0% DJ U.S. Select REIT TR 35.0% S&P Global Lrg MidCap Common Resources (Net)20.0% DJ UBS Commodity TR (Qtr Lag +3% per annum)
64
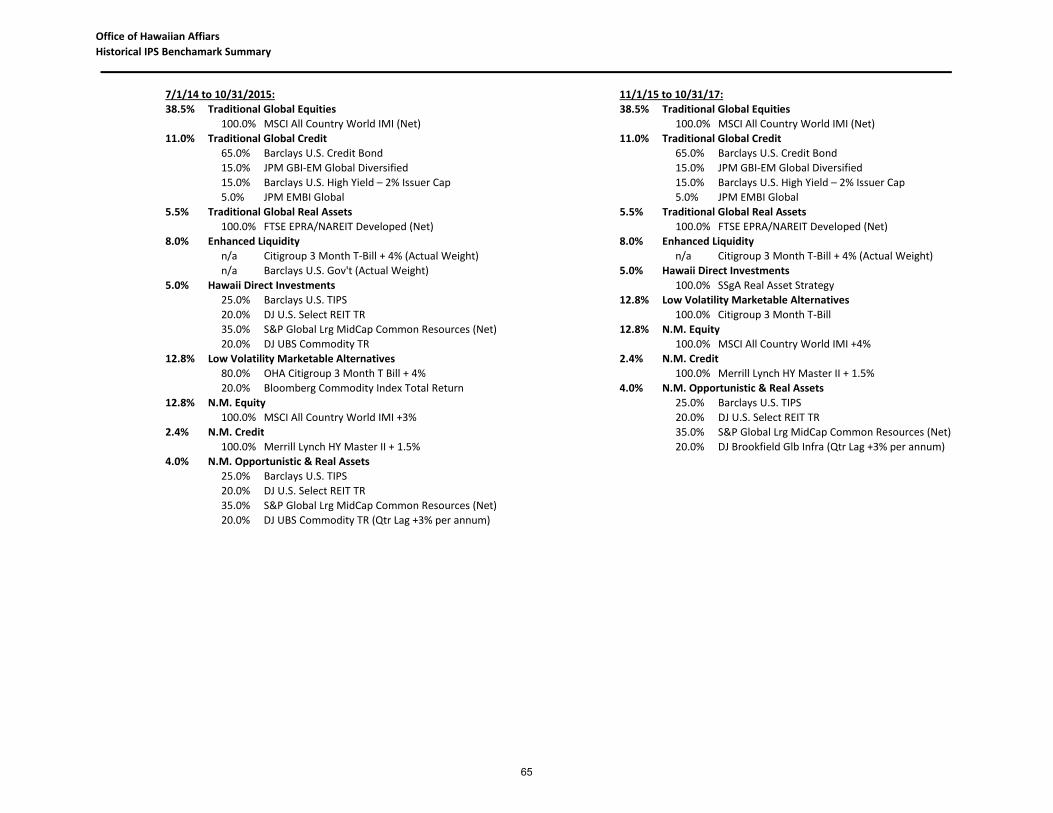
Office of Hawaiian Affiars Historical IPS Benchamark Summary
7/1/14 to 10/31/2015: 11/1/15 to 10/31/17:38.5% Traditional Global Equities 38.5% Traditional Global Equities
100.0% MSCI All Country World IMI (Net) 100.0% MSCI All Country World IMI (Net) 11.0% Traditional Global Credit 11.0% Traditional Global Credit
65.0% Barclays U.S. Credit Bond 65.0% Barclays U.S. Credit Bond 15.0% JPM GBI‐EM Global Diversified 15.0% JPM GBI‐EM Global Diversified15.0% Barclays U.S. High Yield – 2% Issuer Cap 15.0% Barclays U.S. High Yield – 2% Issuer Cap5.0% JPM EMBI Global 5.0% JPM EMBI Global
5.5% Traditional Global Real Assets 5.5% Traditional Global Real Assets100.0% FTSE EPRA/NAREIT Developed (Net) 100.0% FTSE EPRA/NAREIT Developed (Net)
8.0% Enhanced Liquidity 8.0% Enhanced Liquidityn/a Citigroup 3 Month T‐Bill + 4% (Actual Weight) n/a Citigroup 3 Month T‐Bill + 4% (Actual Weight)n/a Barclays U.S. Gov't (Actual Weight) 5.0% Hawaii Direct Investments
5.0% Hawaii Direct Investments 100.0% SSgA Real Asset Strategy25.0% Barclays U.S. TIPS 12.8% Low Volatility Marketable Alternatives20.0% DJ U.S. Select REIT TR 100.0% Citigroup 3 Month T‐Bill35.0% S&P Global Lrg MidCap Common Resources (Net) 12.8% N.M. Equity20.0% DJ UBS Commodity TR 100.0% MSCI All Country World IMI +4%
12.8% Low Volatility Marketable Alternatives 2.4% N.M. Credit80.0% OHA Citigroup 3 Month T Bill + 4% 100.0% Merrill Lynch HY Master II + 1.5% 20.0% Bloomberg Commodity Index Total Return 4.0% N.M. Opportunistic & Real Assets
12.8% N.M. Equity 25.0% Barclays U.S. TIPS 100.0% MSCI All Country World IMI +3% 20.0% DJ U.S. Select REIT TR
2.4% N.M. Credit 35.0% S&P Global Lrg MidCap Common Resources (Net)100.0% Merrill Lynch HY Master II + 1.5% 20.0% DJ Brookfield Glb Infra (Qtr Lag +3% per annum)
4.0% N.M. Opportunistic & Real Assets25.0% Barclays U.S. TIPS 20.0% DJ U.S. Select REIT TR 35.0% S&P Global Lrg MidCap Common Resources (Net)20.0% DJ UBS Commodity TR (Qtr Lag +3% per annum)
65

Office of Hawaiian Affiars Historical IPS Benchamark Summary
11/1/17 to Present:40.0% Traditional Global Equities
100.0% MSCI All Country World17.0% Traditional Global Credit
100.0% Bloomberg Barclays U.S. Aggregate5.0% Traditional Global Real Assets
100.0% Bloomberg Barclays U.S. TIPS +3% 12.0% Hedge Funds
100.0% Citigroup 3 Month T‐Bill +4%18.0% Private Equity
100.0% MSCI All Country World +3% 3.0% Enhanced Liquidity
100.0% Bloomberg Barclays 1‐3 Year Treasury5.0% Hawaii Direct Investments
100.0% Bloomberg Barclays U.S. TIPS +3%
1/1/11 to 6/30/11: 1/1/13 to 10/31/17:59.5% Traditional Global Equities 70.0% Traditional Global Equities
100.0% MSCI All Country World IMI (Net) 100.0% MSCI All Country World IMI (Net) 32.5% Traditional Global Fixed Income 20.0% Traditional Global Fixed Income
100.0% Bloomberg Barclays U.S. Aggregate 65.0% Barclays U.S. Credit Bond 8.0% Traditional Global Real Assets 15.0% JPM GBI‐EM Global Diversified
100.0% FTSE EPRA/NAREIT Developed 15.0% Barclays U.S. High Yield – 2% Issuer Cap5.0% JPM EMBI Global
7/1/11 to 12/31/2012: 10.0% Global Public Real Estate59.5% Traditional Global Equities 100.0% FTSE EPRA/NAREIT Developed (Net)
100.0% MSCI All Country World IMI (Net) 32.5% Traditional Global Fixed Income 11/1/17 to Present:
80.0% Barclays U.S. Aggregate 64.5% Traditional Global Equities 10.0% Merrill Lynch HY Master II 100.0% MSCI All Country World10.0% JPM GBI‐EM Global Diversified 27.4% Traditional Global Credit
8.0% Global Public Real Estate 100.0% Bloomberg Barclays U.S. Aggregate100.0% FTSE EPRA/NAREIT Developed (Net) 8.1% Traditional Global Real Assets
100.0% Bloomberg Barclays U.S. TIPS +3%
Total IPS Traditional Assets Benchmark
66

Office of Hawaiian Affiars Historical IPS Benchamark Summary
3/1/03 to 12/31/08: 1/1/13 to 10/31/17:55.6% U.S. Large Cap Equity 70.0% Traditional Global Equities
100.0% Russell 1000 Index 100.0% MSCI All Country World IMI (Net) 22.2% U.S. Small Cap Equity 20.0% Traditional Global Credit
100.0% Russell 2000 Index 65.0% Barclays U.S. Credit Bond 22.2% International Equity 15.0% JPM GBI‐EM Global Diversified
100.0% MSCI EAFE (Net) 15.0% Barclays U.S. High Yield – 2% Issuer Cap5.0% JPM EMBI Global
1/1/09 to 6/30/10: 10.0% Traditional Global Real Assets55.1% Traditional Global Equities 100.0% FTSE EPRA/NAREIT Developed (Net)
100.0% MSCI All Country World (Net) 30.2% Traditional Global Fixed Income 11/1/17 to Present:
100.0% Barclays U.S. Aggregate 64.5% Traditional Global Equities 14.7% Global Real Estate 100.0% MSCI All Country World
50.0% FTSE NAREIT Equity 27.4% Traditional Global Credit50.0% NCREIF 100.0% Bloomberg Barclays U.S. Aggregate
8.1% Traditional Global Real Assets7/1/10 to 6/30/11: 100.0% Bloomberg Barclays U.S. TIPS +3% 59.5% Traditional Global Equities
100.0% MSCI All Country World IMI (Net) 32.5% Traditional Global Fixed Income
100.0% Barclays U.S. Aggregate 8.0% Global Real Estate
100.0% FTSE EPRA/NAREIT Developed
7/1/11 to 12/31/12:59.5% Traditional Global Equities
100.0% MSCI All Country World IMI (Net) 32.5% Traditional Global Fixed Income
80.0% Barclays U.S. Aggregate10.0% Merrill Lynch HY Master II 10.0% JPM GBI‐EM Global Diversified
8.0% Global Public Real Estate100.0% FTSE EPRA/NAREIT Developed (Net)
Total IPS Global Equities Benchmark
67
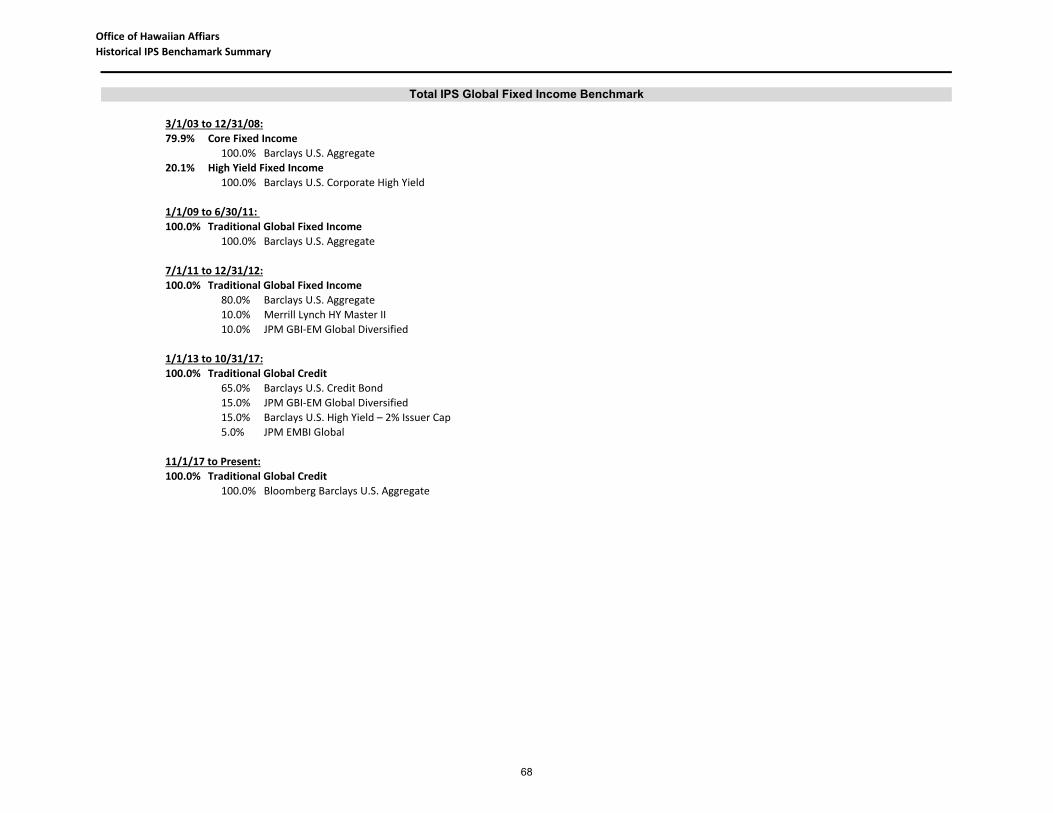
Office of Hawaiian Affiars Historical IPS Benchamark Summary
3/1/03 to 12/31/08:79.9% Core Fixed Income
100.0% Barclays U.S. Aggregate 20.1% High Yield Fixed Income
100.0% Barclays U.S. Corporate High Yield
1/1/09 to 6/30/11: 100.0% Traditional Global Fixed Income
100.0% Barclays U.S. Aggregate
7/1/11 to 12/31/12:100.0% Traditional Global Fixed Income
80.0% Barclays U.S. Aggregate10.0% Merrill Lynch HY Master II 10.0% JPM GBI‐EM Global Diversified
1/1/13 to 10/31/17:100.0% Traditional Global Credit
65.0% Barclays U.S. Credit Bond 15.0% JPM GBI‐EM Global Diversified15.0% Barclays U.S. High Yield – 2% Issuer Cap5.0% JPM EMBI Global
11/1/17 to Present:100.0% Traditional Global Credit
100.0% Bloomberg Barclays U.S. Aggregate
Total IPS Global Fixed Income Benchmark
68

Office of Hawaiian Affiars Historical IPS Benchamark Summary
11/1/03 to 12/31/08:100.0% Global Real Estate
25.0% FTSE NAREIT Equity 75.0% NCREIF
1/1/09 to 6/30/10: 100.0% Global Real Estate
50.0% FTSE NAREIT Equity 50.0% NCREIF
7/1/10 to 12/31/13:100.0% Global Real Estate
100.0% FTSE EPRA/NAREIT Developed
1/1/14 to 10/31/17:100.0% Traditional Global Real Assets
100.0% FTSE EPRA/NAREIT Developed (Net)
11/1/17 to Present:100.0% Traditional Global Real Assets
100.0% Bloomberg Barclays U.S. TIPS +3%
7/1/10 to 6/30/11: 7/1/14 to 10/31/15:100.0% Absolute Return 100.0% Low Volatility Marketable Alternatives
100.0% 3‐month T‐Bill + 3% 80.0% OHA Citigroup 3 Month T Bill + 4%20.0% Bloomberg Commodity Index Total Return
7/1/11 to 12/31/12:100.0% Absolute Return 11/1/15 to 10/31/17:
50.0% T‐Bills +4% 100.0% Low Volatility Marketable Alternatives33.3% MSCI All Country World IMI (Net) 100.0% Citigroup 3 Month T‐Bill16.7% Merrill Lynch HY Master II
11/1/17 to Present:1/1/13 to 6/30/14: 100.0% Hedge Funds100.0% Low Volatility Marketable Alternatives 100.0% Citigroup 3 Month T‐Bill +4%
80.0% T‐Bills +4%20.0% DJ UBS Commodity TR
Total IPS Hedge Funds Benchmark
Total IPS Global Real Assets Benchmark
69
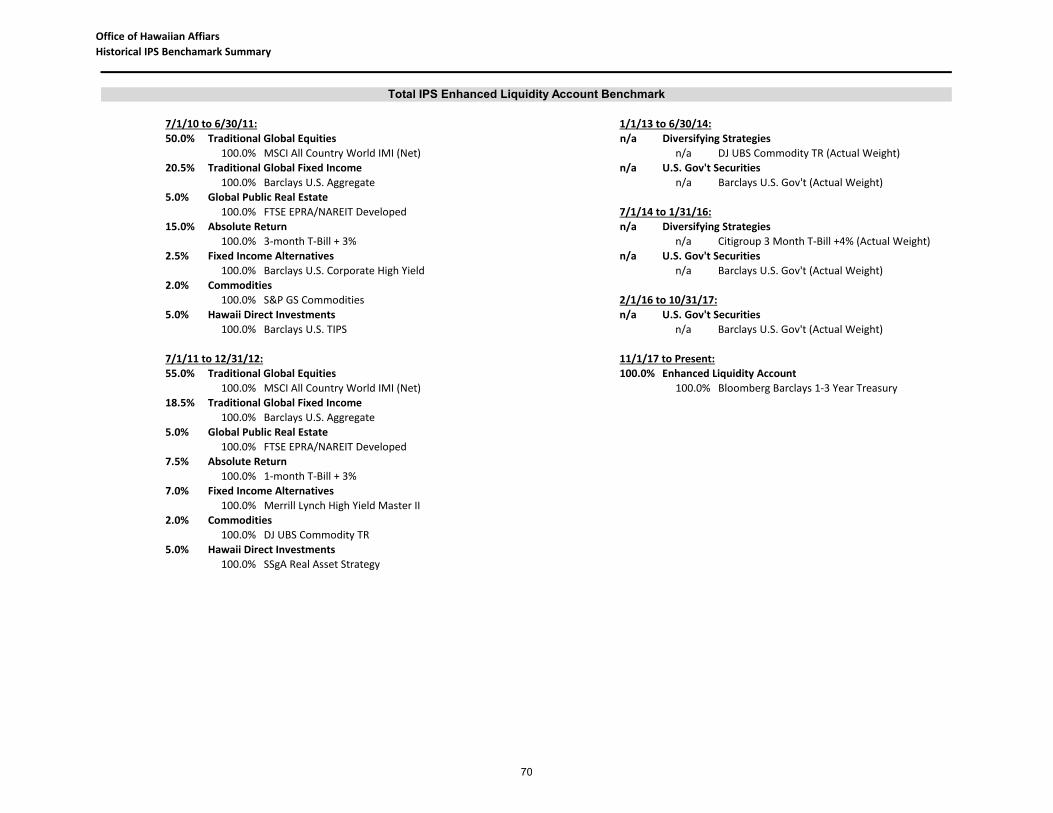
Office of Hawaiian Affiars Historical IPS Benchamark Summary
7/1/10 to 6/30/11: 1/1/13 to 6/30/14:50.0% Traditional Global Equities n/a Diversifying Strategies
100.0% MSCI All Country World IMI (Net) n/a DJ UBS Commodity TR (Actual Weight)20.5% Traditional Global Fixed Income n/a U.S. Gov't Securities
100.0% Barclays U.S. Aggregate n/a Barclays U.S. Gov't (Actual Weight)5.0% Global Public Real Estate
100.0% FTSE EPRA/NAREIT Developed 7/1/14 to 1/31/16:15.0% Absolute Return n/a Diversifying Strategies
100.0% 3‐month T‐Bill + 3% n/a Citigroup 3 Month T‐Bill +4% (Actual Weight)2.5% Fixed Income Alternatives n/a U.S. Gov't Securities
100.0% Barclays U.S. Corporate High Yield n/a Barclays U.S. Gov't (Actual Weight)2.0% Commodities
100.0% S&P GS Commodities 2/1/16 to 10/31/17:5.0% Hawaii Direct Investments n/a U.S. Gov't Securities
100.0% Barclays U.S. TIPS n/a Barclays U.S. Gov't (Actual Weight)
7/1/11 to 12/31/12: 11/1/17 to Present:55.0% Traditional Global Equities 100.0% Enhanced Liquidity Account
100.0% MSCI All Country World IMI (Net) 100.0% Bloomberg Barclays 1‐3 Year Treasury18.5% Traditional Global Fixed Income
100.0% Barclays U.S. Aggregate 5.0% Global Public Real Estate
100.0% FTSE EPRA/NAREIT Developed7.5% Absolute Return
100.0% 1‐month T‐Bill + 3% 7.0% Fixed Income Alternatives
100.0% Merrill Lynch High Yield Master II2.0% Commodities
100.0% DJ UBS Commodity TR 5.0% Hawaii Direct Investments
100.0% SSgA Real Asset Strategy
Total IPS Enhanced Liquidity Account Benchmark
70
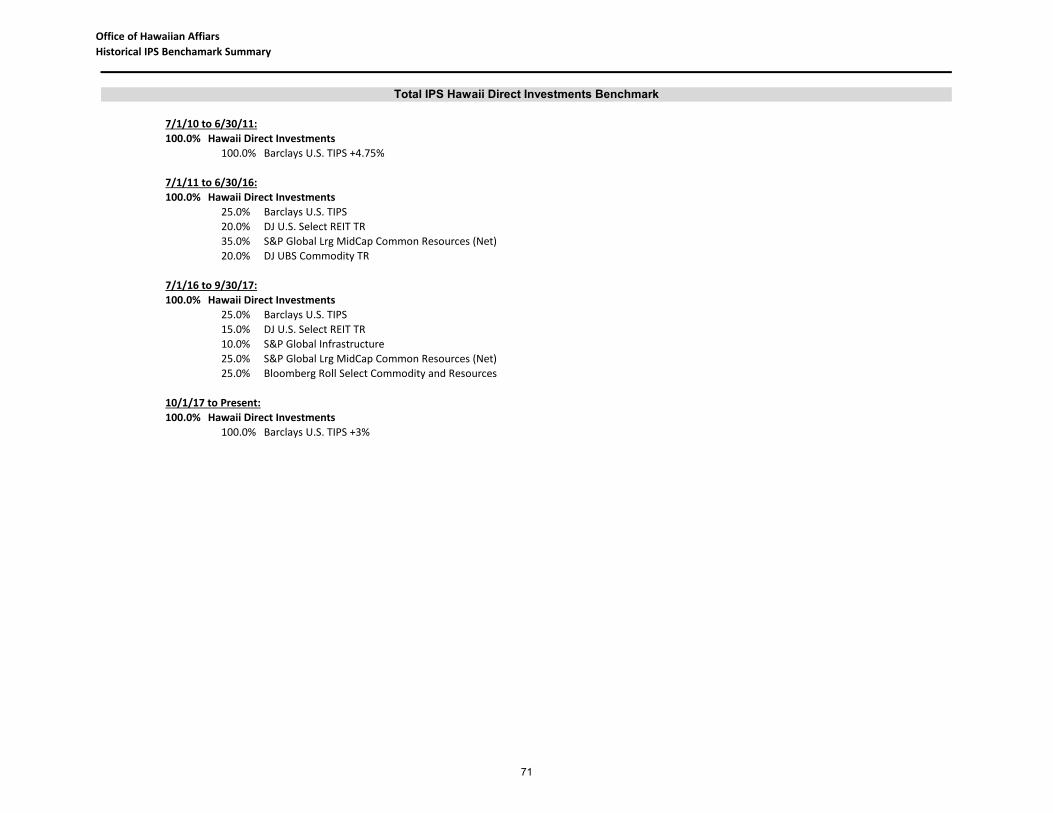
Office of Hawaiian Affiars Historical IPS Benchamark Summary
7/1/10 to 6/30/11:100.0% Hawaii Direct Investments
100.0% Barclays U.S. TIPS +4.75%
7/1/11 to 6/30/16:100.0% Hawaii Direct Investments
25.0% Barclays U.S. TIPS 20.0% DJ U.S. Select REIT TR 35.0% S&P Global Lrg MidCap Common Resources (Net)20.0% DJ UBS Commodity TR
7/1/16 to 9/30/17:100.0% Hawaii Direct Investments
25.0% Barclays U.S. TIPS 15.0% DJ U.S. Select REIT TR 10.0% S&P Global Infrastructure 25.0% S&P Global Lrg MidCap Common Resources (Net)25.0% Bloomberg Roll Select Commodity and Resources
10/1/17 to Present:100.0% Hawaii Direct Investments
100.0% Barclays U.S. TIPS +3%
Total IPS Hawaii Direct Investments Benchmark
71