
WED TALAL ABUZINADAH SCHOOL OF COMPUTER SCIENCE
99
NETWORK MODELS FOR GENETIC TESTING A dissertation submitted to The University of Manchester for the degree of Master of Science in the Faculty of Engineering and Physical Sciences 2014 WED TALAL ABUZINADAH SCHOOL OF COMPUTER SCIENCE
Transcript of WED TALAL ABUZINADAH SCHOOL OF COMPUTER SCIENCE

NETWORK MODELS FOR GENETIC
TESTING
A dissertation submitted to The University of Manchester for
the degree of Master of Science
in the Faculty of Engineering and Physical Sciences
2014
WED TALAL ABUZINADAH
SCHOOL OF COMPUTER SCIENCE

2
Contents
Abstract 7
Declaration 9
Intellectual Property Statement 10
1. Introduction 11
1.1 Motivation 11
1.2 Involved Parties 15
1.3 Aims and Objectives 15
1.4 Dissertation Structure 16
2. Background 17
2.1 The Evolution of Modeling Genetic Networks 17
2.2 Introduction to Network Models 18
2.3 Introduction to Biological Networks 19
2.3.1 Protein-Protein Interaction Networks 19
2.3.2 Metabolic Networks 19
2.3.3 Genetic Networks 20
2.4 Steps toward Building a Better Panel of Genes: 20
2.4.2 Step 1: Initial Panel 21
2.4.2 Step 2: Expansion of Panel 21
2.4.2.1 Available Tools/Strategies for Network Expansion 21
2.4.2.2 Protein Interactions Databases 21
2.4.2.3 Metabolic Pathway Databases 23
2.4.3 Network Ranking 24
3. Methods 26
3.1 Research Methodology 26
3.2 Comprehensive Functional Analysis and Expansion of Large Gene Panels 27
3.2.1 Annotation Resources 28
3.2.2 Bioinformatics Enrichment Tools 28
3.2.2.1 Classification of Bioinformatics Enrichment Tools 29
3.2.2.2 Application of Bioinformatics Enrichment Tools 31
3.3 Pseudo Code for Comprehensive Functional Analysis and Expansion of Large Gene Panels 35
3.4 Pseudo Code Implementation Using The Database for Annotation, Visualization and
Integrated Discovery (DAVID) 38
3.4.1 Introduction to DAVID 38

3
3.4.2 Why DAVID? 38
3.4.3 DAVID Knowledgebase 39
3.4.4 DAVID Tools 40
3.4.5 Application of DAVID 41
3.4.5.1 Pseudo Code Implementation: Analysis and Prioritization 41
3.4.5.2 Pseudo Code Implementation: Text-Mining 44
3.5 Results and Evaluation 48
3.5.1 The Created List 48
3.5.2 Evaluation 48
4. Pipeline for Comprehensive Functional Analysis and Expansion of Large Gene Panels 51
4.1 Design Overview 451
4.2 Pipeline Implementation 52
4.3 Pipeline Methods 53
4.4 Pipeline Components 55
4.5 Pipeline Features 56
5. Conclusion and Future Work 57
5.1 Conclusion 57
5.2 Future Work 60
6. References 61
Appendix 69
Appendix A 69
Appendix B 75
Appendix C 77
Appendix D 81
Appendix E 91
Appendix F 93
Appendix G 99
Word Count: 20964

4
List of Tables
Table 3.1: Statistical Information on OMIM Diseases Associated with Initial
list
42
Table 3.2: Statistical Information on KEGG Pathways Associated with Initial
Gene List
43
Table 3.3: Disease-related Genes from the Genetic Home Reference Website
45
Table 3.4: Pathway-related Genes from DAVID Pathway Viewer
45
Table 3.5: Related Genes Identified by PubMed Papers
46
Table 3.6: Novel Related Genes as Identified by Peroxisome Pathway
47
Table 3.7: Missing Novel Related Genes
50

5
List of Figures
Figure 1.1: The COGS Clinical Reporting Guidelines 14
Figure 3.1: Common Infrastructure for Bioinformatics Tools 29
Figure 3.2: Classes of Bioinformatics Tools 30
Figure 3.3: DAVID Gene-Disease Association Annotations 42
Figure 3.4: DAVID Pathway Annotations 43
Figure 3.5: DAVID Literature Annotations 46
Figure 3.6: KEGG Peroxisome Pathway 47
Figure 4.1: Pipeline Design 52

6
List of Charts
Chart 3.1: Tools used in Gene Ontology Analysis 32
Chart 3.2: Protein-Protein Interactions Analysis 32
Chart 3.3: Pathway Analysis 33
Chart 3.4: Gene-Disease Association Analysis 33
Chart 3.5: Text-mining Analysis 34
Chart 3.6: Integrative Functional Analysis 34

7
Abstract
The continual advancements in Next Generation Sequencing (NGS) technologies has
tremendously broadened the scope of genetic research and brought genetic testing to
higher level of complexity. Through application of these technologies, the Centre for
Genomic Medicine at The University of Manchester and Saint Mary’s Hospital have
developed a cataract gene panel that allows faster diagnosis and personalized
treatment for children born with cataracts. The panel was developed in accordance to
the Clinical Practice Guidelines, and thus only includes genes that were retrieved
from scientific literature. It succeeded in determining the precise genetic cause of
congenital cataract in 75% of the 36 examined cases. However, revealing the cause of
more complex and rare conditions require an enhanced panel of genes.
This project aims to develop a systematic workflow, which uses the current clinically-
valid list of genes known to cause congenital cataract, analyzes it through the
application of single or multiple bioinformatics tools, produces a panel of novel
candidates and categorizes it based on the strength of founded evidence. Accordingly,
the project requires two main deliverables, which are: (i) a workflow that analyzes
and expands an initial panel of genes; and (ii) a list of ranked novel disease gene
candidates.
In order to meet the requirements and accomplish the deliverables of the project, a
background study of available strategies and tools that can be utilized to expand and
rank gene panels is completed. Moreover, the idea of comprehensive functional
analysis is introduced and a survey of applicable tools is conducted. This results in
designing a workflow for comprehensive functional analysis and expansion of large
gene panels that has been implemented using the Database for Annotation,
Visualization and Integrated Discovery (DAVID). Implementation of the workflow

8
results in an evidence-based list of novel candidates that has been evaluated by field
experts. The received feedback makes it obvious that even though the workflow
generates a panel of interesting candidates; it fails to capture some genes that have
been previously retrieved, by clinicians, from scientific literature. Moreover, the list is
currently being tested in the laboratory to determine whether the exome data identifies
any variants in the novel genes. In case variants were identified through the
application of exome-based analysis, the handcrafted workflow will be regarded
successful and efforts should be directed towards its automation.

9
Declaration
No portion of the work referred to in the dissertation has been submitted in support of
an application for another degree or qualification of this or any other university or
other institute of learning.

10
Intellectual Property Statement
The author of this dissertation (including any appendices and/or schedules to this
dissertation) owns certain copyright or related rights in it (the “Copyright”) and s/he
has given The University of Manchester certain rights to use such Copyright,
including for administrative purposes.
ii. Copies of this dissertation, either in full or in extracts and whether in hard or
electronic copy, may be made only in accordance with the Copyright, Designs and
Patents Act 1988 (as amended) and regulations issued under it or, where appropriate,
in accordance with licensing agreements whichthe University has entered into. This
page must form part of any such copies made.
iii. The ownership of certain Copyright, patents, designs, trade marks and other
intellectual property (the “Intellectual Property”) and any reproductions of copyright
works in the dissertation, for example graphs and tables (“Reproductions”), which
may be described in this dissertation, may not be owned by the author and may be
owned by third parties. Such Intellectual Property and Reproductions cannot and must
not be made available for use without the prior written permission of the owner(s) of
the relevant Intellectual Property and/or Reproductions.
iv. Further information on the conditions under which disclosure, publication and
commercialisation of this dissertation, the Copyright and any Intellectual Property
and/or Reproductions described in it may take place is available in the University IP
Policy (see http://documents.manchester.ac.uk/display.aspx?DocID=487), in any
relevant Dissertation restriction declarations deposited in the University Library, The
University Library’s regulations (see
http://www.manchester.ac.uk/library/aboutus/regulations) and in The University’s
Guidance for the Presentation of Dissertations

11
1 Introduction
1.1 Motivation
A genetic disorder is a disease that results from single or multiple abnormalities in an
individual’s Deoxyribonucleic Acid (DNA) [1]. An abnormality is a mutation in the
DNA sequence, which carries genetic material that is found in the cells of humans and
almost all other creatures [2]. While some genetic disorders may be caused by gene
mutations that are inherited from the parents, other diseases are influenced by either
random gene changes that occur during person’s life, or a combination of gene
mutations and environmental factors including lack of exercise, poor diet and
smoking [3]. To be mentioned, research on the complete set of human genes, which is
referred to as the Human Genome Project, has proven that a significant number of
human diseases are genetic since many common diseases such as diabetes and cancer
have a strong genetic component. This results in the recognition of approximately
6000 genetic diseases. Moreover, Statistical studies on genetic disorders demonstrate
that genetic-related issues are the reason behind hospitalizing 10% of adults and 3%
of children. [4]
Genomics is a relatively new scientific field that studies how genes are related to
human health and disease [5]. The core technology that transformed genetic research,
helped understanding genetic factors and led to prevention of birth defects and
disabilities is DNA sequencing. However, the continual advancements in throughput,
speed, and scalability of DNA sequences has tremendously broadened the scope of
genetic research, which results in the development of an improved technology named
the Next Generation Sequencing (NGS) Technology. Through rapid generation of
large-scale low-cost sequence data, this technology made it feasible to address
biological questions in living beings at genome-wide level, implement clinical
diagnostics and identify therapeutic targets. [6] Consequently, application of NGS
technology has a great potential to transform the discovery of genomic biomarkers
that are relevant and valid for clinical use. Biomarker discovery is a complicated
12
process that involves six process components, which are: “candidate discovery,
qualification, verification, research assay optimization, biomarker validation and
commercialization.” [7] Such comprehensive pipeline is essential to understand
disease development and progression, improve diagnostic at earlier stages, and
maximize efficiency of treatments [8]. Moreover, the ability to find novel biomarker
is valuable as it facilitates the process of drug discovery and enables a new
personalized approach in medicine [9]. Due to the complexity and multifactorial
feature of genetic disorders as well as diseases with strong genetic components, they
offer an immediate chance to use the biomarker discovery pipeline, which played an
important role in detecting toxicity and predicting diseases, such as breast cancer and
prostate cancer [9].
Genetic defects are a major cause of human disease, disability, and death [10]. Such
faults play an important role in many kinds of heritable diseases. As a result, genetic
tests, a type of medical test that determine an individual’s likelihood of carrying or
transmitting a genetic disorder via clinical or laboratory evidence, were developed
[11,12]. In accordance to the Genetics Home Reference [13], more than 1000 genetic
tests are presently being used, and they can be categorized into: (i) newborn
screening; (ii) diagnostic testing; (iii) carrier testing; (iv) prenatal testing; (v)
preimplantation testing; (vi) predictive and presymptomatic testing; and (vii) forensic
testing [11]. With the advent of DNA sequencing, new DNA-based methods were
crafted to increase the sensitivity and evaluation power of genetic testing [12]. While
test results, in case negative, provide great relief from hesitation and help people
manage their health care plan and have better quality of life, positive results have
many potential benefits [11], including: (i) providing people with information and
professional advice about their condition [14]; (ii) directing people toward possible
ways to prevent complications, such as undergoing preventive surgery [15]; (iii)
notifying people about treatment planning and options [11]; (iv) becoming eligible for
screening [15]; (v) helping people make decisions about having children [11]; and (iv)
enhancing the quality of life and increasing life expectancy [14]. In spite of the
remarkable advantages of genetic testing, they, however, have several limitations and
risks. Therefore, the decision about whether to be tested or not is personal. Though, a
geneticist or genetic counselor can provide assistance by discussing the benefits,
drawbacks, technique limitations and risks of the specific type of test to be performed

13
on patient. [11] Moreover, the patient needs to be aware whether the testing aims at
research or clinical use. The purpose of research testing is to gather new findings
about genes and genetic mutations in order to positively influence clinical genetic
testing, which targets a specific disorder and results in providing patients, families
and doctors with more information about genetic conditions. [14]
NGS technologies produce huge volume of data by sequencing millions of DNA
fragments in parallel. Application of NGS extends the traditional technique of genetic
testing that does not support parallel processing of DNA fragments by allowing
information collection on a whole set of genes at once. The ability to look at the entire
genetic material in an individual makes it possible to identify the exact location of
gene mutation, and predict the patient’s response to a specific drug leading to
personalized medicine. Moreover, NGS technologies open the door to unexpected
findings, which brings genetic testing to a higher level of intricacy. [16]
The type of heritable diseases that fall within the scope of this project is Congenital
Cataracts, a disease characterized by clouding of the lens of the eye that is present
when a baby is born [17]. It is responsible for 5% to 20% of blindness in children
[18], “affecting around 200,000 children around the world every year”. Due to the
exceptional genetic and clinical diversity of congenital cataracts, genetic testing of
affected families and individuals is a crucial activity. Using NGS, such activity plays
an important role in: (i) understanding the underlying mechanism of the disease,
including the contributions of molecules, structural proteins, transcription factors and
enzymes [19]; (ii) confirming diagnosis at the molecular level; and (iii) enabling
more accurate prognosis; (iv) developing a genotype-phenotype correlation system to
recommend the causal gene from disease phenotype; (v) identifying new pathways;
(vi) guiding potential therapies; (vii) using congenital cataracts as diagnostic
biomarker for other syndromes. [20]
It has been discovered by researchers from the University of Manchester that genetic
mutations cause around half of the congenital cataract cases. Thus, a test that screens
all genes known to be associated with congenital cataracts and pinpoints the exact
mutation responsible has been developed, using advanced NGS technologies, to allow
faster diagnosis and personalized treatment. [21] The test, which was offered to U.K.
14
patients through the National Health Service (NHS) in December 2013, succeeded in
determining the precise genetic cause of congenital cataract in 75% of the 36
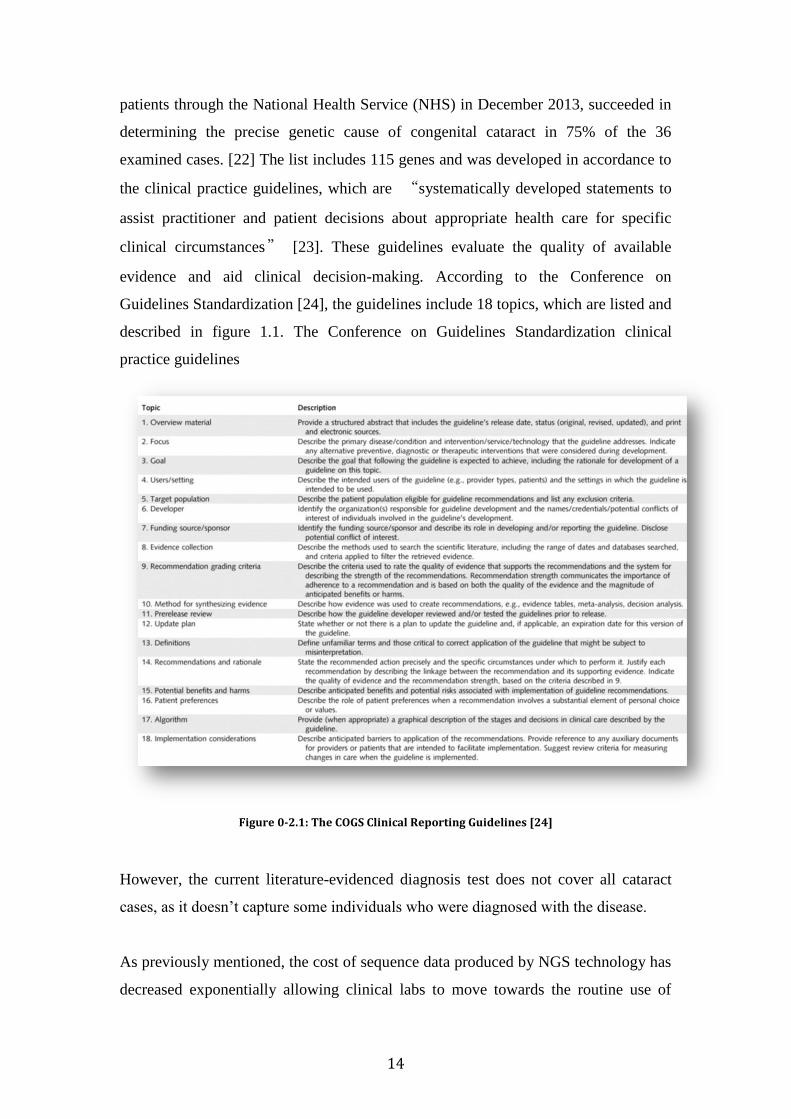
examined cases. [22] The list includes 115 genes and was developed in accordance to
the clinical practice guidelines, which are “systematically developed statements to
assist practitioner and patient decisions about appropriate health care for specific
clinical circumstances” [23]. These guidelines evaluate the quality of available
evidence and aid clinical decision-making. According to the Conference on
Guidelines Standardization [24], the guidelines include 18 topics, which are listed and
described in figure 1.1. The Conference on Guidelines Standardization clinical
practice guidelines
Figure 0-2.1: The COGS Clinical Reporting Guidelines [24]
However, the current literature-evidenced diagnosis test does not cover all cataract
cases, as it doesn’t capture some individuals who were diagnosed with the disease.
As previously mentioned, the cost of sequence data produced by NGS technology has
decreased exponentially allowing clinical labs to move towards the routine use of
15
whole-exome sequencing (WES). Even though whole-exome sequencing technology
has established a rich framework for the identification of novel disease genes, the task
of interpreting its data remains a challenge. [25] Thus, a logic approach to address this
challenge is to handcraft a workflow that systematically prioritizes candidate genes
through the application of computational methods and bioinformatics tools in order to
guide whole-exome analysis efforts. Such semi-automated workflow can then be
improved into a fully automated pipeline that analyzes data produced by NGS
technology and prioritizes promising genes for exome-based analysis. To be
mentioned, while the panel under study includes genes associated with Congenital
Cataract, we considered building a generic workflow that can be applied to any type
of disease.
1.2 Involved Parties:
This project aims to expand a panel of genes known to cause congenital cataracts
through the use of computational models and modern bioinformatics tools. The
cataract panel was developed by a team from the Centre for Genomic Medicine at The
University of Manchester and Saint Mary’s Hospital, which consists of Prof Graeme
Black and Rachel Gillespie.
1.3 Aims and Objectives:
1.3.1 Aim:
Development of a systematic workflow, which uses the current clinically-valid list of
genes known to cause congenital cataract, analyzes it through the application of single
or multiple bioinformatics tools and produces an evidence-based panel of novel
candidates that can be categorized into 3 tiers:
Tier 1: genes to be added to the list, as they were identified in the literature to
be associated with cataract but weren’t included in the initial list.
Tier 2: interesting genes that require further research and validation, as they
were identified by different types of gene functional analysis.
Tier 3: genes that require further research and validation, as they give clues
about some type of metabolic disorders underlying cataract and might suggest
therapeutic targets.
16
1.3.2 Objectives:
Development of a clinically-valid model for genetic networks in collaboration with
the Department of Clinical Genetics in Saint Mary’s Hospital:
Identify multiple strategies to expand genetic networks.
Identify multiple strategies to rank genetic networks.
Handcraft a systematic workflow for comprehensive functional analysis and
expansion of large gene panels.
Implement the handcrafted workflow through the application of
bioinformatics tools.
Produce a clinically-useful, evidence-based panel of novel genes that dissects
the unrevealed genetic basis of diseases.
Design an automated pipeline for comprehensive functional analysis and
expansion of large gene panels
1.4 Dissertation Structure:
In order to meet the objectives of the project, the report was structured as follows:
Chapter 1 gives an overview of the project in hand, states its aim, and lists its
objectives. Moreover, it describes the big project in which this project participates.
Chapter 2 starts with an explanation of the concept of modeling genetic
networks, and definition of network models. Afterwards, biological networks along
with their characteristics and types are introduced. This is followed by a complete
literature review of the currently used strategies for gene list expansion and
prioritization.
Chapter 3 provides a description of the methodology that is followed to
develop and validate the analysis and expansion workflow. It then introduces the idea
of comprehensive functional analysis and provides information about applicable tools.
Next, the workflow is designed, implemented, and evaluated
Chapter 4 provides an initial design for the computational pipeline that
automates the handcrafted workflow. It specifies the methods, components and
features to be included in the pipeline.
Chapter 5 gives conclusion of the entire MSc project and highlights potential
areas for future work.

17
2 Background
Since genes usually work together forming one huge collaboration networks, this
chapter starts with explaining of the concept of modeling genetic networks.
Afterwards, network models and biological networks along with their characteristics
and types are introduced. Next, a complete background study of the currently used
strategies for gene list expansion and prioritization is completed.
2.1 The Evolution of Modeling Genetic Networks
The genomics revolution along with the advents in systems biology, during the last
decade, have brought a new era of research that catapulted the reductionist approach
into the realm of technology-based predictive approach. The reductionist approach of
the 1960 and 1970s, where a biological system is understood by analyzing its
individual components, has significantly inspired the study of life sciences in general
and genetics in specific. [26] Despite the fact that the reductionism has faced limited
success in deciphering the complexity of biological systems, scientists were able to
make progress in recognizing the functionality of molecules and their interactions
through the use of this methodology [27]. However, with the observed impact of
information sciences on biological and genetics research during the 1980s, scientists
realized that the separate parts of biological systems function in extremely structured
networks and don’t work in isolation [26]. Accordingly, they gradually shifted toward
a more holistic approach that integrates both computational and experimental
strategies to enable broader study of living beings, and to facilitate integrated analysis
of their dynamic network interactional and functional activities from a system-wide
perspective. By navigating from molecule to systems biology, researchers were able
to understand the flow of biological information, explore biochemical pathways, and
develop predictive network models. Consequently, they were able to discover
efficient biomarkers and therapeutic targets that improved our knowledge of health
and disease. [28]

18
2.2 Introduction to Network Models
Physics, chemistry, ecology, biology, neuroscience, transportation, communication,
social science, computer science, the internet and the World Wide Web, are a few
examples of scientific areas that are defined by a large number of interrelated
dynamical systems. In order to integrally capture and represent this connectivity
between structure and dynamics of previously mentioned systems, they were modeled
as networks. [29] A network model is a conceptually simple and flexible way of
representing entities that are linked to each other by some type of relationship in the
form of a graph where nodes symbolize entities and arcs symbolize relationships
between these nodes. Though it is hard to express the transmission and exchange of
information between entities using different types of models, network models provide
supplementary details of real life situations since a variety of different kinds of
entities and relationships can be expressed. Thus, unlike hierarchical models, network
models are distinguished by their ability to handle one to one, one to many, and many
to many relationships among both abstract and observable entities. [30] The study of
networks has seen important shift moving away from mathematical graph theory and
static networks toward complex, dynamic and irregularly structured networks that
comprise thousands or millions of nodes. Undoubtedly, this exciting movement has
been encouraged by the optimized capabilities of computing devices and the increased
availability of enormous databases that store information about real-world networks,
such as transportation networks, phone call networks and genetic networks. [31] Since
it is impossible to directly analyze the structure and behavior of such complex
networks, unified statistical properties that are common to almost all types of real
networks were identified. Accordingly, the topology of networked systems is
characterized by the presence of a heightened number of short cycles (Transitivity),
and by having relatively short paths between pairs of nodes that speed up the
communication among distant nodes (Small-world Property). Moreover, the study of
real networks has pointed out the existence of inhomogeneous degree distribution
since nodes are topologically inequivalent (Scale-free Property). [32] These statistical
properties have initiated the development of new network models that reflect the
complex structure and dynamical processes of real topologies aiming to predict the
behavior of networked systems. The random graph, small-world network, and scale-
19
free network model are considered the most important constructed models that were
capable of mimicking the growth, function, and features observed in real-world
topologies. [29]
2.3 Introduction to Biological Networks
The Human Genome Project, which aimed to deliver a comprehensive sequence of
the human genome, was completed by June 2000 opening the doors to a new post-
genomic era where the main issue is no longer to investigate the genetic code itself,
but to model the web of interactions through which individual molecular components
of biological systems interact in order to obtain deep understanding of the
mechanisms of living organisms. [32] Based on the evidence presented by Boccaletti
et al. [31], it was verified that previously mentioned statistical properties, which are:
transitivity, small world and scale-free distribution are universal characteristics of
biological networks, and therefore developing network models for these networks can
be useful. Due to the complications of biological systems, its processes can be
analyzed as a multi-layered system divided into metabolic pathways, which are
shaped by protein interactions, whose production is governed by gene regulatory
networks. [29]
2.3.1 Protein-Protein Interaction Networks
Different types of proteins interact with each other in order to regulate the biological
activity in living cells. [34] Protein-protein interactions are modeled by a network
where nodes correspond to proteins that interconnect via physical interactions
visualized by edges. Using the concept of complex networks to study protein
interactions require consistent databases which have become publicly available, e.g.,
STRING (http://string.embl.de), IntAct (http://www.ebi.ac.uk/intact) and BIND
(http://bind.ca). [29]
2.3.2 Metabolic Networks
Metabolic pathways organize the complete set of chemical reactions involved in
maintaining the survival of a living cell. [35] In order to model these pathways,
scientists have constructed networks whose nodes represent either metabolites,
reactions or enzymes and edges are chemical reactions. [29] The availability of

20
principles and measurements to describe the structure and dynamics of developed
networks, in addition to high-throughput methodologies made it possible to build
major catalogues that reproduce integrated metabolic pathways, such as KEGG
(http://www.genome.ad.jp/kegg), WIT (http://www.wit.mcs.anl.gov/wit) and EcoCyc
(http://www.biocyc.org/ecocyc). [31]
2.3.3 Genetic Networks
The function, fitness, and living state of a cell are determined by thousands of genes
that work together under the governance of gene expression programs. [36] The gene
regulatory network is an extremely important category of biological networks and
therefore it is one of the first networked systems being modeled. [32] In order to
evaluate the expression level of interacting genes, its time evolution as well as the
phenotypic influence of disturbed genes, many computational approaches were
developed to allow discoveries in genetic networks. [29]
2.4 Steps toward Building a Better Panel of Genes
Genetic testing examines individual’s genetic material, “such as DNA and RNA, and
molecules, such as proteins” [37] by analyzing tiny sample of body tissues or blood. It
may be performed for several medical reasons comprising inherited disorder
diagnostic, risk assessment of genetic condition and identification of genetic variants
or gene vulnerability to a multifactorial disease. [38] The emergence of many
technologies is expected to play a key role in the future development of genetic
testing. Examples of technologies include microarrays, epigenetics and whole genome
DNA sequencing. Even though these technologies are capable of generating huge
amount of information, they are unable to detect all gene mutations and therefore no
deterministic clinically useful information can be produced. [39] As a result,
researches have been motivated to think about methodologies to effectively use the
huge volume of genetic information. According to a paper published by the
Proceedings of the National Academy of Sciences [40], a group of researchers worked
with a large gene expression knowledge base and used computational methods to
analyze its disease-related data increasing the accuracy of diagnosis rate to 95 percent.
They first started with standardizing gene expression profiles and diseases annotations
associated with gene, and then developed a predictive diagnostic tool in order to
21
expand the database. Afterwards, an evaluation model was created to assess the
system’s diagnostic accuracy and precision. This methodology results in building a
better panel of genes that can be moved from research settings, and translated into a
resource for clinical practice. Therefore, a detailed explanation of each step is
mentioned below. [41]
2.4.1 Step 1: Initial Panel
The impact of using genetic testing as a research tool is that it allows increased
understanding of disease-related mutations and improved observation of
complications. However, these rewards remain unattained if we continue using the
traditional approach in which every gene is studied and analyzed individually.
Accordingly, panel tests were developed to undertake simultaneous analysis of
multiple genes. In this context, researches from Oxford Regional Molecular Genetic
Laboratory have developed a panel that consists of the four most common mutated
genes associated with Arrhythmogenic Right Ventricular Cardiomyopathy (ARVC),
and discovered that synchronized analysis of genes as a panel enhances the clinical
efficacy of genetic testing [42]. Moreover, faster diagnosis and higher detection rate
were observed by a research group based in the United Kingdom as a result for
generating a comprehensive panel that includes 22 genes linked to congenital
myopathy. [43]
2.4.2 Step 2: Expansion of Panel
2.4.2.1 Available Tools/Strategies for Network Expansion
2.4.2.2 Protein Interactions Databases
Advances in the field of proteomics, which focuses on protein-protein interactions,
are matched with the development of many experimental techniques and
computational methodologies including algorithms that use protein-protein interaction
databases and PubMed publications in order to predict new interactions at genome-
wide level. During the last 20 years, many computational methods, such as the
maximum likelihood estimation technique, parsimony-explanation approach and
association method, have been developed to infer protein-protein and domain-domain
interactions through the application of specific type of programming and statistical
calculations. Moreover, many available online systems are based on machine learning

22
techniques that predict PPIs from text, e.g., the Protein Information Extraction
System. [44]
Nowadays, there exist many publicly available widely used protein interaction
databases that provide information on PPISs, each of which has its own capabilities
and features that makes a large volume of biological data available for researchers at
their fingertips. Users of PPI databases will receive detailed information concerning
their protein of interest, in addition to a list and a visualized network of interactions.
Two of the largest databases, that include thousands of protein interactions, links,
publications, as well as information on pathways, biological functions and disease
associations, are the Human Protein Reference Database (HPRD) and the BioGrid
Database. For example, according to Pattin et al., the HPRD has exceeded the number
of 38,000 PPIs and 270,000 PubMid links. Moreover, there exist other databases that
are smaller than HPRD and BioGrid yet they offer additional features, such as the
numerical confidence score of each interaction. Examples of such databases include
the Biomolecular Interaction Network Database (BIND), the Biomolecular Object
Network Database, the Molecular Interaction database (MINT) and the Database of
Interacting Proteins (DIP). However, there are other types of database resources that
provide comprehensive and integrative information on protein interactions as they
have access to a collection of the previously mentioned databases. STRING, the
Search Tool for the Retrieval of Interacting Genes/Proteins, is an instance of these
resources. It houses about 2.5 million proteins of 630 different creatures as it gathers
data from HPRD, BioGrid, MINT, BIND, DIP, and other pathway interaction
databases. In regards to interactions that have not been confirmed by experiments,
STRING, in addition to other database resources such as the Unified Human
Interactome (UniHI) and GeneNetwork, predict interactions by executing different
computational algorithms to derive the confidence score of each interaction based on
orthology and text mining approaches. [44]
Taking advantage of their outstanding capabilities and features, protein interaction
databases have been used in both wide scale studies and focused projects that are
concerned with a single or small number of proteins. A recent study on human
inherited neurodegenerative disorders caused by balance loss including Alzheimer’s
disease and Parkinson’s disease, demonstrates how PPI databases have been used to
23
develop and expand interaction network of causative proteins. A total of 81
interactions, out of the 770 novel protein interactions, were formerly characterized to
be associated with this disorder. [44] Another study examining PPI networks has
concluded that systematic mapping and expansion of such networks using PPI
databases made it feasible to understand the dynamic features of biological properties
and disease mechanism [45].
2.4.2.3 Metabolic Pathway Databases
A large number of the most wide spreading diseases in modern societies including
obesity, diabetes, and cardiovascular disease involve a strong metabolic component
and are associated with hundreds of genes. In order to analyze human metabolism,
reveal disease mechanisms and define drug targets, several research groups have
developed high-quality system-level metabolic knowledge bases that are based on
different network approaches. Each pathway database has its own approach for
reconstructing a genome scale metabolic network, besides different methods for data
representation, exchange formats and query execution.
This diversity of metabolic pathway databases has inspired researchers to go through
the challenge of integrating the body of metabolic knowledge into a comprehensive
metabolic database that systematically predicts networks and therefore plays an
important role in the understanding of human health and disease. [42]
Over the past 20 years, a number of manually-curated pathway databases have been
built by computationally capturing, organizing and linking system, genomic, and
chemical information originated from high-throughput experiments in order to allow
biological interpretation of these datasets. KEGG, the Kyoto Encyclopedia of Genes
and Genomes, is one of the first and most popular integrated database sources in the
world consisting of 16 main databases and constituted by different components and
modules that describes human biological processes. [41] Another knowledge base of
metabolic reconstructions that is capable of browsing and linking the contents of 7
different databases is the Biochemical Genetic and Genomic knowledgebase
(BIGG). Moreover, there exist another knowledge base of human metabolic reactions
and pathways that is distinguished by its pathway visualization, optimized data
mining and cross-database analysis tools as well as its improved orthology prediction

24
methods which is Reactome. Furthermore, It allows inferences for 22 species as it
consists of 2975 proteins, 2907 metabolic reactions, and 4455 literature citations. [42]
Metabolic knowledge bases provide users with prediction models and instinctive
networks of pathways and reactions for metabolism, genetic information, cellular
activities, environments information, and organismal systems. Therefore, various use
cases and many research partnerships have utilized the databases mentioned earlier to
fill knowledge gaps and identify areas of future focus. One of the use cases of the
BIGG database is the case study for orphans reactions, which are reactions that miss
its catalyzing enzyme. The list of orphans reaction was inferred from other models
and expanded to find out that 12 out of 30 new reactions occur in at least one model.
[43] In addition, Reactome collaborated with the BioHealth Base Group at University
of Texas Southwestern Medical College to develop a prediction method to further
analyze the lifespan of influenza virus. [44]
2.4.3 Network Ranking:
Thanks to the advancement of next-generation sequencing technologies the time have
finally come for discovering rare genetic mutations underlying human disease.
However, in order to make good use of these technologies and the detailed catalogue
of genes they generate, we must define clear guidelines and strict standards for
separating genuine disease-associated variants from the many non-pathogenic
variants. Identification of pathogenic variants was approached by different
technologies to match the genetic architecture of investigated disease. Examples of
utilized high-throughput technologies include exome sequencing, genotyping arrays
and deep whole-genome sequencing. Even though fruitful conclusions were recorded
when investigators assessed variants using these approaches, many variants were
incorrectly assigned to diseases. A recent study on 104 sequenced genomes reported
that, out of 400 published variants, almost 177 (27%) were either non-pathogenic or
lacked evidence to prove pathogenicity. Since false-positive assignments of disease
mutations are not accurately observed, incorrect prognostic, erroneous drug targets or
inaccurate medical advices might occur. Such studies made it obvious that increasing
the confidence level of variant interpretation is essential for valid disease diagnostic
and medical decision-making.
25
Expansion of genes panel is followed by careful analysis, held by researchers, to
identify genes and variants that are causally associated with genetic disorders.
Genetic, informatics, and experimental are three classes of evidence that empower the
role of statistical genetics and contribute to the implication of pathogenicity at both
gene and variant level. While statistical genetics provides data about the population
frequency, gene disruption and phenotype recapitulation, informatics and
experimental evidence deliver information on protein interaction, biochemical
function, gene expression and model systems.
As mentioned above, disease-mutation databases include a big number of false
positive assignments of pathogenicity. In order to reduce this burden, core guidelines
for researchers were set and standards that guide the process of assessing both gene-
level and variant-level evidences in research and clinical settings were defined.
Moreover, rules for sharing sequenced data, clinical phenotype databases and
publications were identified as objective display of findings plays a key role in
genetic research. In accordance to these guidelines, researchers are required to
document complete positive and negative results obtained from gene or variant
analysis. In addition, formal statistical support for different classes and types of
evidence, as well as gene and variant implications is needed to compare and contrast
the wide range of reported information. Application of comparative genomic
approach and experimentally validating predicted variants is also essential. Following
these guidelines makes it feasible to implement a centralized repository of mutant
data that is based on frequently updated structured evidence and supported by rapid
modification of false entries. A prominent example of integrated efforts in this field is
the newly launched ClinVar database, developed by the US National Centre for
Biotechnology information (NCBI), which is projected to include data from different
databases such as LOUD, OMIM and DECIPHER. [45]
26
3 Methods
This chapter provides a description of the project methodology. Based on the data
collected from the background study, it is obvious that a wide range of strategies and
tools is available. This introduces the idea of integrating these strategies into a single
comprehensive functional analysis process. In order to perform this type of analysis,
annotation resources were further explored and a survey of applicable bioinformatics
tools was conducted. Afterwards, the workflow for comprehensive functional analysis
and expansion of large gene panels has been designed, implemented, and evaluated.
3.1 Research Methodology
Research is a structured process of exploring, collecting and interpreting information
that “utilizes acceptable scientific methodology to solve problems and create new
knowledge that is generally applicable”. Adopting logical steps to scientifically
investigate the nature of the project, analyze collected information and solve research
problem is essential to avoid wasting time and effort when trying to meet the
specified requirements. [46] Our project aims to develop a model for genetic networks
where expansion and reduction of gene panels are based on systematic workflow. In
order to meet this objective, a research methodology that consists of three main
phases, which are research, development and validation, is followed [47].
3.1.1 Research Phase
In this phase, background research has been carried out to identify bioinformatics
tools that can be utilized to expand, analyze and validate the initial panel of genes.
Moreover, evaluation and experimental application of these possible tools have been
conducted in order to improve the accuracy and specificity of the novel genes
discovered. Another important area to be researched is the possibility to develop a
validation model that integrates different tools into a single comprehensive pipeline so
that novel genes are clinically verified.

27
3.1.2 Development Phase
The development phase aims to create a workflow that combines most applicable
bioinformatics tools for network expansion and reduction. The workflow first runs
multiple strategies to expand the initial panel, and then produces an expanded list of
novel genes, which will be compared against an existing list of exome sequenced
genes. Afterwards, other tools are used to filter the matched genes of the expanded
list, which yields to a new panel of highly confident genes. This filtered panel
proceeds to the next phase for validation and verification purposes.
3.1.3 Validation Phase:
Once the gene panel is finalized and shared with the clinical genetics team in St.
Mary’s Hospital, we begin the validation phase. For candidate genes to be validated
they are required to have a certain confidence score that will be determined later by
the genetics team. To be mentioned, extensive guidelines structure the entire
validation process in order to meet the international regulations and policies
administering the identification of novel genes that are involved in disease diagnostic
[48].
3.2 Comprehensive Functional Analysis and Expansion of Large
Gene Panels
Extracting biological meaning from data sets, ranging in size from hundred to
thousands genes/proteins, presents a new challenge for investigators in the field of
molecular and system biology [49]. One approach to address this challenge has been
to comprehensively interpret functional enrichment in gene lists through the
application of computational bioinformatics tools. To be mentioned, the
comprehensive functional enrichment analysis is a promising bioinformatics
technique that is based on the integration of functional, interacting, and evolutionary
properties of genes. It aims to (i) effectively annotate gene panels; (ii) identify genes’
functional associations; (iii) predict disease-causing genes; (iv) distinguish the best
candidates for further study; and (v) merge the diverse and heterogeneous annotation
resources, which describe different aspects of biological processes. [50] Since there
doesn’t exist a standard methodology to perform such analysis, the wide range of

28
publicly available annotation resources and bioinformatics tools were explored; the
application of these tools was analyzed; a strategy was developed, implemented,
tested and evaluated.
3.2.1 Annotation Resources
The functional, interacting, and evolutionary properties of genes have been used as
the fundamental resource for many computational gene-annotation tools. These
properties include: (i) gene function (Gene Ontology); (ii) protein-protein
interactions; (iii) pathway; (iv) protein domains; (v) disease associations; and (vi)
other properties, such as tissue expression, gene regulation, gene expression, sequence
properties and orthologs. [51]
3.2.2 Bioinformatics Enrichment Tools
Between 2002 and 2008, approximately 68 high-throughput enrichment tools were
developed to address the challenge of biologically interpreting large gene panels.
Even though these tools have their distinct capabilities, analytic algorithms and
features, they share the same infrastructure, which consists of three major layers: (i)
data support layer in the form of a backend database resource that collects biological
data in a gene-to-annotation format; (ii) data mining layer that combines analytic
algorithms with statistical methods to calculate the enrichment of annotation terms
associated with the large gene panels; and (iii) result presentation layer that represents
the tool interface, home page and exploration methods. (figure 3.1)[52]

29
Figure 3.1: Common Infrastructure for Bioinformatics Tools [52]
3.2.2.1 Classification of Bioinformatics Enrichment Tools
Current bioinformatics enrichment tools are categorized, based on the difference of
algorithms and statistical methods, into three classes. These classes are: (i) Singular
Enrichment Analysis (SEA); (ii) Gene Set Enrichment Analysis (GSEA); and (iii)
Modular Enrichment Analysis (MEA) (figure 3.2). [52]
Class 1: Singular Enrichment Analysis (SEA)
The input to the SEA is a pre-selected gene list that is linearly tested by calculating
the enrichment P-value for each annotation term in order to produce a simple table of
enriched terms. Even though the SEA strategy adopts of the most traditional
algorithm for enrichment analysis, it is capable of analyzing any type of gene lists
generated from any high-throughput genomic studies or bioinformatics technologies.
Thus, it has been effectively used by many of the former and recently developed

30
tools, such as GoMiner, Onto-Express, DAVID, EASE, GOEAST and GFinder.
However, this strategy has three main weaknesses, which are: (i) its lengthy output;
(ii) its inability to fully capture the inter-relationships between enriched annotation
terms; and (iii) its dependency on the quality of the user’s pre-selected gene list. [52]
Class 2: Gene Set Enrichment Analysis (GSEA)
GSEA takes as an input all genes and their diverse biological information, such as
attributes and experimental values, which are obtained from biological
studies/technologies. It, afterwards, integrates these values in order to calculate a
summarized biological value for each input gene. Regardless of the difficulty to
comprehend the complexity of biological data structures into a single statistical score,
the GSEA strategy has been utilized by many tools, such as ErmineJ, FatiScan,
MEGO, PAGE, MetaGF, Go-Mapper and ADGO. [52]
Class 3: Modular Enrichment Analysis (MEA)
MEA takes into consideration the complex and networked nature of biological
processes by combining the traditional P-value calculations with new algorithms that
reflect the inter-relationships between genes and terms. Some recent tools used such
data-mining logic to improve discovery sensitivity and specifity, such as Ontologizer,
topGO, GENECODIS, ADGO, ProfCom, GOToolbox and DAVID. Although MEA
allows enrichment analysis to become module-centric, some ‘orphan’ genes that are
not involved in strong associations with their neighbor may be left out of analysis, and
therefore they need to be analyzed separately. [52]
Figure 3.2: Classes of Bioinformatics Tools [51]
31
In addition to the algorithm-based classification, bioinformatics enrichment tools can
be categorized in accordance to the annotation resource they put to use. These
categories include: (i) Gene Ontology (GO) tools; (ii) protein-protein interactions
tools; (iii) pathway tools; (iv) protein domains tools; (v) disease associations tools;
(vi) text-mining tools; (vii) integrative functional annotation tools; and (viii) other
tools, such as transcription factors binding sites (TFBS) tools, tissue expression tools
and network visualization tools. [51] Such tools aim of to provide users with an
improved illustrative power in order to understand the underlying biology of involved
genes and proteins.
3.2.2.2 Application of Bioinformatics Enrichment Tools
During the past several years, bioinformatics enrichment tools have successfully
contributed to the functional analysis of large gene panels for thousands of high-
throughput genomic studies. This is clearly demonstrated by the high number of
citations for these tools based on the statistics provided by Google Scholar. In order to
gain insight into the way these tools were used to functionally interpret gene panels,
41 research papers [53-93] that put into application a total of 50 tools were reviewed
and analyzed. Appendix A contains the list of papers and type of tools they used for
analysis. In addition, Appendix B includes the different types of analysis, applied
tools, and the frequency of use.
Analysis Summary:
(i) Gene Ontology (GO) Analysis
In order to detect biological, molecular and cellular functions of differentially
expressed gene lists, identified by the reviewed research papers, 18 tools were
used (chart 3.1). However, GOToolbox, DAVID, GOTM and WebGestalt were
more frequently used than other GO enrichment tools.

32
Chart 3.1: Tools used in Gene Ontology Analysis
(ii) Protein-Protein Interactions Analysis
In order to derive physical interactions between proteins and detect high
confidence interactions among differentially expressed gene lists, identified by
the reviewed research papers, 8 tools were used (chart 3.2). However, HPRD,
OPHID and STRING were more frequently used than other pathway enrichment
tools for protein-protein interactions.
Chart 3.2: Protein-Protein Interactions Analysis
3% 3%
17%
3%
11%
3%
3% 3% 3% 3% 3%
9% 3%
3%
9%
3%
3%
14%
3%
Gene Ontology Analysis
BibliosphereG:ProfilerGOMAPPFinderDAVIDGATHERGOAMetaCoreTAIRGeneCardsGOEATWebGestaltErmineJGeneCodisGOTMTopFunnFatiGOGOToolbox
9%
8%
25%
17%
8%
8%
8%
17%
Protein-Protein Interactions Analysis
DIP
MINT
HPRD
OPHID
Intact
Reactome
IRefIndex
STRING

33
(iii) Pathway Analysis
In order to map the differentially expressed gene lists, identified by the
reviewed research papers, to relevant metabolic, signaling and other pathways
and determine which pathways are over-represented, 16 tools were used (chart
3.3). However, KEGG, DAVID and Ingenuity were more frequently used than
other pathway enrichment tools.
Chart 3.3: Pathway Analysis
(iv) Disease Associations Analysis
In order to extract strong genetic involvement between diseases and gene lists,
identified by the reviewed research papers, 6 disease associations tools were
used (chart 3.4), out of which OMIM was the most commonly used.
Chart 3.4: Gene-Disease Association Analysis
4% 4% 4%
4%
15%
4%
19%
4% 4%
4%
8%
4%
4%
12%
4% 4%
Pathway Analysis
BioCarta
GATHER
Invitrogen iPath
Reactome
DAVID
GeneCodis
KEGG
SigPathway
ConsensusPathDB
GSEA
37%
12% 12%
13%
13%
13%
Gene-Disease Association Analysis
OMIM
BioMart
OPHID
DAVID
Swiss-Prot
HPRD

34
(v) Text-mining Analysis
In order to examine co-occurrence of interesting terms in public scientific
literature and understand the functional context of differentially expressed gene
lists, identified by the reviewed research papers, 12 tools were used (chart 3.5).
However, NCBI Entrez Gene, UniProt and PubMed were more frequently used
than other text-mining enrichment tools.
Chart 3.5: Text-mining Analysis
(vi) Integrative Functional Analysis
In order to perform multi-tiered analysis that merges different annotation
resources and infers stronger associations among differentially expressed gene
lists, identified by the reviewed research papers, 6 tools were used (chart 3.6),
out of which DAVID was the most commonly used.
Chart 3.6: Integrative Functional Analysis
5% 5%
15%
5%
5%
5% 5%
5%
20%
10%
15%
5%
Text-Mining Analysis
Chilibot
NCBI dbSNP
PubMed
Polysearch
Ensembl
GeneRIF
Swiss-Prot
Candid
NCBI Entrez Gene
OMIM
5% 5%
75%
5%
5% 5%
Integrative Functional Analysis
BioGPS
GSEA
DAVID
Onto-Express
EASE
WebGestalt

35
(vii) Other types of analysis were conducted using different bioinformatics
enrichment tools, such as PFAM for protein domains analysis and oPOSSUM
for transcription factors binding sites (TFBS) analysis.
The Database for Annotation, Visualization, and Integrated Discovery (DAVID) was
used in 24 out of the 41 reviewed papers in order to perform different types of
analysis, such as GO, pathways, gene-disease associations and integrative functional
Analysis. This number makes it obvious that DAVID is a simple option to consider
when implementing the pseudo code we’ll develop in the next section.
3.3 Pseudo Code for Comprehensive Functional Analysis and
Expansion of Large Gene Panels
At different stages of any genetic study, biologists and geneticists need to decide
which genes to investigate further and which to disregard because of limited evidence.
In order to cutoff arbitrary decision when identifying the most promising genes
among large panels of candidates, systematic workflows that run comprehensive
analysis and prioritization are needed. In an attempt to address this need, we have
designed a pseudo code for comprehensive functional analysis, prioritization and
expansion of large gene panels. The pseudo code aims at producing an evidence-
based list of novel genes that expands any given list of genes by executing 5 main
steps, which are: (i) analysis; (ii) prioritization; (iii) text-mining; and (iv) Filtering.
Comprehensive functional analysis is the first step in gene expansion workflow. It
takes as input any list of genes/proteins and produces two lists as its output, which
are: (i) list of seed genes; and (ii) list of seed keywords. Due to the complex and
heterogeneous nature of annotation sources, different types of functional analysis are
integrated in order to collect existing knowledge about gene/proteins. This is
accomplished by identifying enriched GO terms, biological pathways, protein-protein
interactions, protein domains and gene-disease associations.
Step two aims at prioritizing the list of seed genes and keywords produced by the
previous step, possibly using multiple statistical methods or gene prioritization

36
approaches, in order to generate two lists, which are: (i) list of statistically
significance genes; and (ii) list of statistically significance keywords. To be
mentioned, the most popular statistical measures incorporated in different types of
enrichment categories to rank their identified genes are: (i) Fisher exact; (ii) Chi-
square; (iii) Hypergeometric distribution; and (iv) Binomial distribution [52].
Step three combines the lists of statistically significant genes and keywords and
applies text-mining strategies in order to produce an expanded list of genes. The
expanded list of genes is annotated with evidence in order to state the reason behind
adding the gene to the list. The goal of text-mining is to automatically extract
information about gene and their functional associations and identify keyword
matches in scientific literature abstracts or full texts.
When running different types of enrichment analysis and multiple strategies of text-
mining, it becomes increasingly common to have more than one evidence associated
with the same gene. Here comes the role of the filtering function in which gene
repetitions are removed and evidences obtained for the same gene are aggregated.
This step produces the final output of the pseudo code that is: an expanded list of
novel genes with evidence.

37
{
Input: List of Candidate Genes
Analyze
{
Identify enriched Gene Ontology Terms
Identify enriched Biological Pathways
Identify enriched Protein-Protein Interactions
Identify enriched Protein Domains
Identify enriched Disease Associations
}
Get
{
List of Seed Genes
List of Seed Keywords
}
Prioritize
{
Statistical Calculations: (Percentage of Involved Genes, P-value,
Benjamini)
}
Get
{
Prioritized List of Statistically Significant Genes
Prioritized List of Statistically Significant Keywords
}
Apply Text-Mining Strategies
Get Expanded List of Genes with Evidence
Filter Expanded List of Genes with Evidence
Output: Expanded List of Novel Genes with Evidence
}

38
3.4 Pseudo Code Implementation Using The Database for
Annotation, Visualization and Integrated Discovery (DAVID)
3.4.1 Introduction to DAVID:
The Database for Annotation, Visualization and Integrated Discovery (DAVID),
which was released in 2003, is a free web-based online application that provides a
powerful data-mining environment aiming at systematically excerpt biological themes
behind large gene lists. It consists of an integrated knowledgebase and a
comprehensive suite of functional annotation tools, in order to address the challenge
of functionally analyzing large ‘interesting’ data sets derived from high throughput
genomic and proteomic screening approaches by merging exploratory, computational
and statistical solutions. DAVID Bioinformatics Resources are owned by one of the
world’s leading medical research centers, the National Institutes of Health (NIH), and
were developed by the Laboratory of Immunopathogenesis and Bioinformatics (LIB).
LIB aims to mainly address the laboratory and bioinformatics requirements for many
research projects that are sponsored by the National Institute of Allergy and Infec
tious Diseases (NIAID). [94]
3.4.2 Why DAVID?
- The engine, database, algorithms, tools and functionalities of DAVID have been
continuously updated and expanded by a dedicated team of qualified
bioinformaticians, Ph.D. certified biologists and professional programmers and in
collaboration with world-class bioinformatics groups. To be mentioned, DAVID
version 6.7 is the latest update to the sixth version of the original bioinformatics
resource. [94]
- Until 2012, DAVID has been used by investigators from more than 5000
institutions worldwide with an approximate rate of 1200 gene lists submitted daily
by almost 400 investigators. [95]
- Since 2004, DAVID has been referenced by Nature papers and cited by 15116
scientific publications. [96]
- Unlike many publically available gene-specific tools, such as LocusLink,
GeneCards, Proteome, Ensembl and Swiss-Prot, DAVID provides some unique

39
capabilities to efficiently agglomerate biological mechanisms associated with
hundreds or thousands of genes in parallel. [97] These features include:
o The DAVID Knowledgebase provides centralized coverage of biological
information, as it integrates more than 20 types of main gene/protein
identifiers and more than 40 recognized functional annotation categories from
almost all well-known public bioinformatics databases. As a result, DAVID is
able to handle any number of gene identifiers generated by any type of
genomic platform. Moreover, investigators are no longer required to navigate
between bioinformatics resources collecting information about a single gene at
a time. [98]
o DAVID includes a set of novel data mining tools to address many-genes-to-
many-terms redundant relationships. These tools are: the DAVID Functional
Classification Tool and the DAVID Functional Annotation Clustering Tool.
[98]
o The DAVID Pathway Viewer provides dynamic visualization of biochemical
pathway maps. [98]
3.4.3 DAVID Knowledgebase:
Due to the globally distributed, rapidly growing and complex nature of biological
research, our biological knowledge is spread over many superfluous resources
managed by individual groups. Multiple identifiers and different annotation terms that
are associated with the same gene could be collected in various levels across different
bioinformatics resources. Therefore, a number of public efforts have focused on the
construction of a successful functional analytic algorithm that involves a highly
integrated, comprehensive and rich gene annotation database, such as NCBI Entrez
Gene, UniProt, and Protein Information Resource (PIR). However, the analytical
power of such centralized annotation resources is limited since many types of
genomic platforms and databases are not accumulated, queries are executed on single
or limited batch of genes at a time and the process of downloading a database is time
consuming and complicated for a regular user. Due to the limitations mentioned
above, the DAVID knowledgebase, which is a rich gene-focused knowledgebase that
incorporates the most valuable and highly considered heterogeneous annotation
resources, was developed to become idyllically suitable for high throughput analytic
studies. Two major steps were involved in the construction of the knowledgebase that

40
can be freely downloadable and searchable through the DAVID bioinformatics
resources website. In the first place, a novel single-linkage algorithm, called the
David Gene Concept, was designed to aggregate tens of millions of redundant
gene/protein identifiers that are found in NCBI, PIR, UniProt and other publicly
available resources into unique DAVID gene clusters. To be mentioned, the David
Gene Concept improves cross-referencing ability across redundant identifiers by
overlapping more than 40 categories of functional annotation resources. The second
step was to assign diverse annotation data from different databases to the same cluster
in pair-wise text format files that are easy to use and download. [98]
3.4.4 DAVID Tools:
All tools included in the DAVID Bioinformatics Resource aim to facilitate functional
analysis of large lists of genes allowing investigators to extract and explore biological
knowledge from these lists. The latest release of DAVID resource consists of five
integrated, web-based tools, which are: the Functional Annotation tool, the Gene
Functional Classification tool, the Gene ID Conversion, the Gene Name Batch Viewer
and the NIAID Pathogen Annotation Browser. These tools promote structural and
functional discovery for any uploaded gene list as they allow users to convert between
different types of gene/protein identifiers, explore interesting and related genes or
annotation terms, classify large lists into functional groups, divide redundant terms
into clusters, dynamically view gene-term relationships and visualize genes on
biochemical pathway maps. [98]
The Functional Annotation tool, which is an automated enrichment analysis algorithm
with highly extended annotation coverage compared to other similar tool, is the key
DAVID component utilized to analyze the initial list of genes. Out of more than 60
annotation categories, the Gene Ontology terms, protein-protein interactions, protein
functional domains, disease associations, biochemical pathways, sequence general
features, homologies, gene functional summaries, gene tissue expressions and
literature are the most important categories covered by the tool. In addition, the tool
suite consists of three sub-tools, which are: the Functional Annotation Clustering, the
Functional Annotation Chart and the Functional Annotation Table. While the
annotation table enables users to investigate gene-specific annotation data, without
including any statistical calculations, the annotation chart provides a statistically
41
appended gene-term enrichment analysis. On the other hand, the annotation
clustering, which is a newly added feature to the suite, deploys a new algorithm
groups similar annotation terms into functional clusters by measuring the co-
associations between genes and terms. [97]
3.4.5 Application of DAVID:
The computational infrastructure, setup information, hardware requirements and
input/output formats of DAVID bioinformatics tools and resources are specified in
Appendix C.
3.4.5.1 Pseudo Code Implementation: Analysis and Prioritization
The list of gene known to cause congenital cataract, which consists of 115 genes
(Appendix D), was uploaded, and functionally analyzed by DAVID. A step-by-step
guide of the gene list submission and the application of DAVID Gene Functional
Annotation Tool is provided in Appendix C.
DAVID Gene Functional Annotation Tool automatically maps the uploaded list to the
associated biological annotation terms, links terms to their annotation source,
classifies sources into their corresponding annotation categories, ranks the
overrepresented terms in accordance to their statistical significance and returns a table
that summarizes annotation results. A complete description of the annotation
summary results table and its contained functional annotation chart table is provided
in Appendix C. Obviously, the summary results table revealed large amount of
enriched terms in the ten available annotation categories, which are: Disease,
Functional Categories, Gene Ontology, General Annotation, Literature, Main
Accession, Pathways, Protein Domains, Protein Interactions and Tissue Expression.
Due to the wide-ranging, redundant and distributed nature of annotation contents
across various databases, investigators with weak genomic background find it difficult
to concentrate on the broad biological picture rather than an individual gene or term.
Therefore, the results derived from DAVID Functional Annotation Tool were shared
with the team from the Centre for Genomic Medicine at The University of
Manchester in order to increase the efficiency of biological interpretation and decide
on the categories of interest.

42
Because gene-disease association networks assist the exploration of phenotype to
genotype relationships and the indication of common genetic origin of human
diseases [99], the category of gene-disease associations was selected as the first to
carry out the analysis. DAVID gene-disease association annotations are based on two
sources, which are: the Genetic Association Database, and the Online Mandelian
Inheritance in Man (OMIM). We chose to focus on the gene-disease association terms
provided by OMIM as it involves 82% of our initial genes (figure 3.3). According to
OMIM, Nine diseases are associated with different amounts of our initial genes. Table
3.1 lists these diseases and provides the amount and percentage of associated initial
genes, in addition to the statistical significance of each disease.
Figure3.3: DAVID Gene-Disease Association Annotations
Disease Genes Count
(%) P-Value Benjamini
Walker Warburg Syndrome 5 (4.5%)
1.7E-6 4.0E-4
Zellweger Syndrome 5.1E-6 5.9E-4
Neonatal Adrenoleukodystrophy 4 (3.6%) 1.4E-4 1.1E-2
Anterior Segment Mesenchymal
Dysgenesis 3 (2.7%) 1.8E-3 9.8E-2
Infantile Refsum Disease
2 (1.8%) 4.9E-2 9.0E-1
Cataract, Congenital
Cataract, Coppock-like
Tricothiodystrophy
Peters Anomaly 7.3E-2 9.4E-1
Table 3.1: Statistical Information on OMIM Diseases Associated with Initial list
43
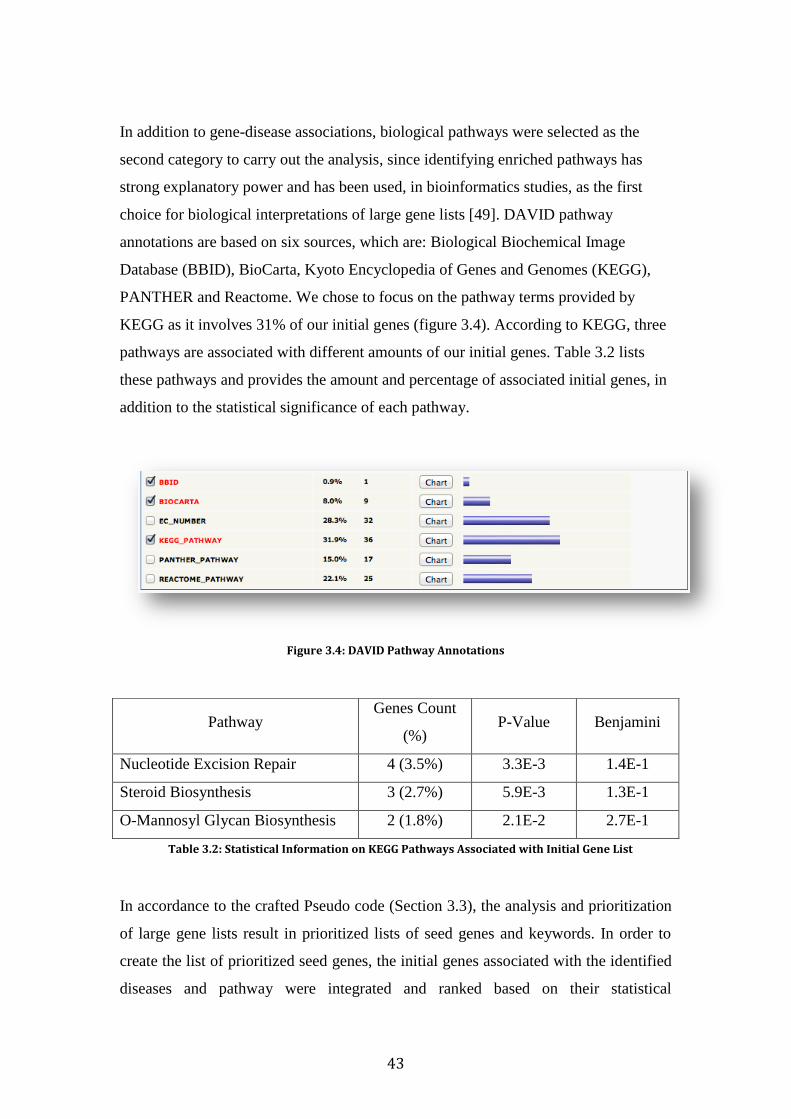
In addition to gene-disease associations, biological pathways were selected as the
second category to carry out the analysis, since identifying enriched pathways has
strong explanatory power and has been used, in bioinformatics studies, as the first
choice for biological interpretations of large gene lists [49]. DAVID pathway
annotations are based on six sources, which are: Biological Biochemical Image
Database (BBID), BioCarta, Kyoto Encyclopedia of Genes and Genomes (KEGG),
PANTHER and Reactome. We chose to focus on the pathway terms provided by
KEGG as it involves 31% of our initial genes (figure 3.4). According to KEGG, three
pathways are associated with different amounts of our initial genes. Table 3.2 lists
these pathways and provides the amount and percentage of associated initial genes, in
addition to the statistical significance of each pathway.
Figure 3.4: DAVID Pathway Annotations
In accordance to the crafted Pseudo code (Section 3.3), the analysis and prioritization
of large gene lists result in prioritized lists of seed genes and keywords. In order to
create the list of prioritized seed genes, the initial genes associated with the identified
diseases and pathway were integrated and ranked based on their statistical
Pathway Genes Count
(%) P-Value Benjamini
Nucleotide Excision Repair 4 (3.5%) 3.3E-3 1.4E-1
Steroid Biosynthesis 3 (2.7%) 5.9E-3 1.3E-1
O-Mannosyl Glycan Biosynthesis 2 (1.8%) 2.1E-2 2.7E-1
Table 3.2: Statistical Information on KEGG Pathways Associated with Initial Gene List

44
significance. Similarly, the list of prioritized seed keywords was generated by
compiling and statistically ordering the annotation terms within each annotation
category.
3.4.5.2 Pseudo Code Implementation: Text-Mining
In order to produce the expanded and evidence-based list of genes, three text-mining
strategies were applied. The first strategy involves querying the Genetics Home
Reference website, which collects the genetic components of medical conditions from
a variety of sources, including GeneReviews, OMIM, MedlinePlus, Genetic Alliance
and the Genetic and Rare Diseases Information Centre [100], in order to get the genes
known to be related to each of the diseases reported by DAVID (table 3.3).
Conversely, the genes related to the pathways reported by DAVID can be collected
from the functional annotation tool itself via the Pathway Viewer feature. In addition
to displaying genes from user’s list on pathway maps, the Pathway Viewer generates
a gene report for all pathway genes (table 3.4) [101]. The second strategy utilizes
DAVID’s literature mining annotation that is based on 2 resources, including: Gene
Related InFormation (GeneRIF) abstracts and PubMed full-text scientific literature.
As the 227 paper links contained in PubMed involves the entire set of initial genes
(100%) (figure 3.5), each of which was reviewed to identify associations between
genes and congenital cataract by looking for the following terms: “congenital”,
“cataract”, “glycosylation”, “congenital muscular dystrophies” and “inherited
cataract”. Table 3.5 lists the PubMed titles of scientific papers in which new related
genes were identified. In addition, it provides the amount and percentage of
associated initial genes, the statistical significance of each paper, and the newly
reported genes. In conjunction with scientific literature, the third strategy uses GO to
identify enriched pathways, which results in the detection of the peroxisome pathway.
The genes related to the peroxisome pathway, which are listed in table 3.6, were
collected from the KEGG pathway website (figure 3.6) [102]. As the text-mining
strategies aim to produce an expanded list of genes with evidence, the genes listed in
the tables below were compiled along with their statistical information and evidence
type.

45
Disease Novel Related Genes
Walker Warburg Syndrome ISPD
Zellweger Syndrome
PEX5 Neonatal Adrenoleukodystrophy
Infantile Refsum Disease
Anterior Segment Mesenchymal
Dysgenesis
None
Cataract, Congenital
CRYBP1
AQP0
CHX10
Cataract, Coppock-like None
Tricothiodystrophy ERCC1
GTF2H5
Peters Anomaly CYP1B1
Table 3.3: Disease-related Genes from the Genetic Home Reference Website
Pathway Novel Related Genes
Nucleotide Excision Repair
RAD23A
RAD23B
CETN2
CUL4A
CUL4B
CCNH
CDK7
DDB1
DDB2
ERCC1
ERCC4
ERCC5
GTF2H1
GTF2H2
GTF2H2B
GTF2H2C
GTF2H2D
GTF2H3
GTF2H4
GTF2H5
LIG1
MNAT1
POLD1
POLD2
POLE
POLE2
POLE3
POLD3
POLD4
POLE4
PCNA
RFC1
RFC2
RFC3
RFC4
RFC5
RPA1
RPA2
RPA3
RPA4
RBX1
XPA
XPC

46
Steroid Biosynthesis
DHCR24
NSDHL
CEL
CYP27B1
EBP
FDFT1
HSD17B7
LSS
LIPA
SQIE
SOAT1
SOAT2
SC4MOL
TM7SF2
O-Mannosyl Glycan
Biosynthesis POMGNT1
Table 3.4: Pathway-related Genes from DAVID Pathway Viewer
Figure3.5: DAVID Literature Annotations
PubMed Title Novel Related Genes
Mutation of the Melastatin-Related
Cation Channel, TRPM3, Underlies
Inherited Cataract and Glaucoma
TRPM3
Congenital muscular dystrophies with
defective glycosylation of dystroglycan:
A population study
POMGnT1
Refining genotype phenotype
correlations in muscular dystrophies with
defective glycosylation of dystroglycan
POMGnT1
Table 3.5: Related Genes Identified by PubMed Papers

47
Figure3.6: KEGG Peroxisome Pathway
Pathway Novel Related Genes
Mutation of the Melastatin-Related
Cation Channel, TRPM3, Underlies
Inherited Cataract and Glaucoma
PMP34
PMP70
PXMP2
PXMP4
MPV17
Table 3.6: Novel Related Genes as Identified by Peroxisome Pathway

48
3.5 Results and Evaluation
3.5.1 The Created List
After successfully completing the design and implementation of the pseudo code, a
list of novel genes, that expands the initial list of genes known to be associated with
congenital cataract, has been created in order to meet the objectives of the project.
Appendix E includes the list of novel genes along with their statistical information
and the evidence on which expansion was based. The list was generated by following
the steps defined in the design of the pseudo code, which are: analysis, prioritization,
and text-mining. DAVID Functional Annotation Tool was used for analysis,
prioritization, and part of the text-mining strategies, while the KEGG and Genetics
Home Reference websites were used for the application of the remaining text-mining
strategies.
3.5.2 Evaluation
During the past years, an active area of research has been the development of
strategies that boost disease gene discovery by means of computational tools.
Reflecting the influence of computer science on biology, many bioinformatics tools
have been developed and integrated into several variant identification pipelines. In
this project, two main deliverables were accomplished which are: (i) a pseudo code
that analyzes and expands large gene panels; and (ii) a list of novel genes that expands
an initial list of disease-related genes. For the purpose of reaching comprehensive
evaluation of the project’s deliverables, two different evaluations were introduced,
which are: (i) methodology evaluation; and (ii) list evaluation. This full evaluation
assesses how well the proposed methodology can predict novel disease-related genes
and ascertains whether the applied tools do their required jobs.
3.5.2.1 Methodology Evaluation:
The methodology evaluation aims at determining whether the handcrafted pseudo
code captures the whole set of genes that need to be added to the expanded list as
suggested by field experts. An expert evaluation of the methodology was conducted
by the geneticists, Rachel Gillespie, who developed the initial panel. During the
course of the project, couple of meetings with clinicians took place in order to discuss
the research’s findings, select applicable tools, discuss tool’s output, and provide

49
expert recommendations. This type of evaluation covers the content of the expanded
list of genes and generates two main components; which are:
1- A fine-tuned version of the expanded list:
The fine tuned version of the expanded list is an excel sheet, created by
Rachel, to provide supportive information and useful links for each novel gene
and facilitate further biological interpretation of these genes (Appendix F).
The following fields present these details:
HUGO Approved Symbol, which is a unique abbreviation for the gene
approved by the HUGO Gene Nomenclature Committee (HGNC).
[103]
Link to HGNC website that provide a detailed symbol report for each
gene. Also, it offers links to external resources, such as gene resources,
protein resources, clinical resources and other databases that gives
useful information on each gene. [104]
Approved Name, which is a unique gene name approved by HGNC.
[103]
MIM Accession Link which directs to the Online Mendelian
Inheritance in Man and provides information on each gene, such as:
gene-phenotype relationships, gene structure, molecular genetics and
allelic variats. [105]
Disease Phenotype, which lists diseases and traits associated to genes.
HGNC ID, which is a unique gene number approved by HGNC. [103]
Location, which defines the location of the gene “Cytogenetic
location”. [106]
RefSeq mRNA ID, which is a unique number for the reference
sequence messenger RNA.
2- A list of 18 genes that weren’t captured by the methodology along with links
to scientific literature from which they were curated (Appendix G). Since
these genes, which are listed in table 3.7, weren’t captured by neither DAVID
nor applied text-mining strategies, then activities associated with collecting
evidence from the literature need to be revisited, modified and tested.

50
Novel Related Genes
AQP1
AQP5
UNC45B
CTDP1
LEPREL1
TBC1D20
CDS
COL4A6
CRYBA2
CPOX
GBA2
EPHA5
EPHA2
EPHA3
EPHA6
EPG5
FOXP1
UHRF1
Table 3.7: Missing Novel Related Genes
3.5.2.2 List Evaluation:
Exome sequencing is a powerful and cost-effective tool that can be utilized for
dissecting the genetic component of complex hereditary diseases by discovering
variants across hundreds or thousands of genes. The list evaluation aims at
determining whether the exome data identifies any variants in the novel genes. This
evaluation has significant impact on the application of exome sequencing to validate
the interpretation of genetic data, improve clinical diagnostic and influence
therapeutics decision-making. However, we didn’t get the results yet from the
laboratory. In case variants were identified through the application of exome-based
analysis, the handcrafted pseudo code will be regarded successful and efforts should
be directed towards its automation.

51
4 Pipeline for Comprehensive Functional
Analysis and Expansion of Large Gene Panels
This chapter provides an initial design for the computational pipeline that automates
the handcrafted workflow. It specifies the methods, components and features to be
included in the pipeline.
4.1 Design Overview
All the steps that are semi-automated in the pseudo code for gene list expansion can
be improved into a fully-automated computational pipeline that meets the basic
requirements of current disease gene discovery studies. The pipeline for
comprehensive functional analysis and expansion of large gene panels is designed to
be capable of accepting a list of any type of gene identifiers and generating a list of
novel genes that is highly structured and annotated with statistical measures and
evidence information. In a fully-automatic, time-saving and cost-effective way, it
executes the steps previously mentioned in the pseudo code design, which are: (i)
analysis; (ii) prioritization; (iii) text-mining; and (iv) Filtering. Different types of data
including input genes and analysis results are stored, by the pipeline, in a structured
MySQL relational database that is, in turn, linked to a user-friendly web interface.
Below we describe the methods and components that are incorporated in the pipeline
design.
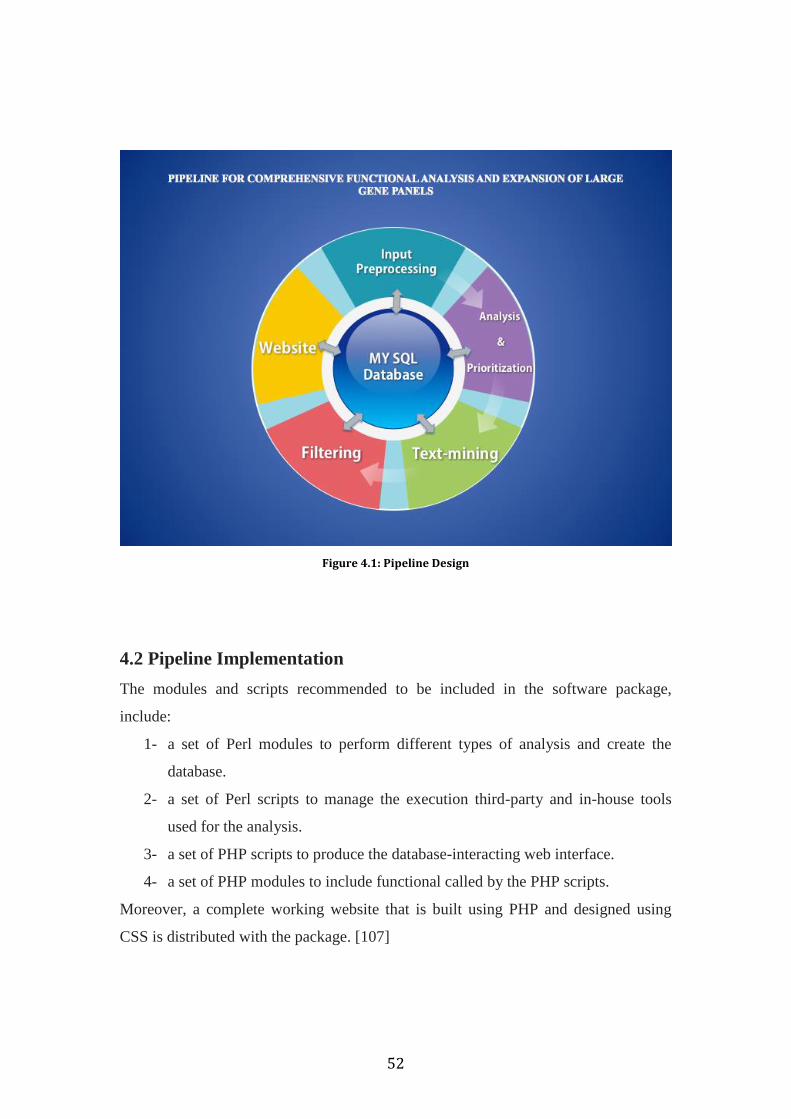
52
Figure 4.1: Pipeline Design
4.2 Pipeline Implementation
The modules and scripts recommended to be included in the software package,
include:
1- a set of Perl modules to perform different types of analysis and create the
database.
2- a set of Perl scripts to manage the execution third-party and in-house tools
used for the analysis.
3- a set of PHP scripts to produce the database-interacting web interface.
4- a set of PHP modules to include functional called by the PHP scripts.
Moreover, a complete working website that is built using PHP and designed using
CSS is distributed with the package. [107]
53
4.3 Pipeline Methods
1- Input preprocessing:
The pipeline takes as input a list consisted of any type/number of gene identifiers. It
prepares and checks the quality of inserted data for the subsequent method, which is
analysis, by performing the following tasks: (i) input validation; (ii) duplicate
removing; and (iii) gene identifier (ID) conversion. While simple functions can be
used to validate and remove duplicates from input data, gene ID conversion tools are
required to complete the third tasks [108]. These tools collect gene identifiers from
different resources, such as NCBI, PIR and UniProt and, based on the user selection,
map any gene ID to another [109]. Examples of gene ID conversion tools include:
DAVID Gene ID Conversion Tool [110] and BioMart ID Converter [111].
2- Analysis
Automatic functional analysis of large gene lists is essential for current genetic
studies in order to overcome the limitations encountered by semi-automated analysis
that uses inflexible scripts to integrate multiple bioinformatics tools. These limitations
include: (i) the need for data submission via web [112]; (ii) the need for user
interference [113,114]; (iii) the difficulty to maintain, modify, and reproduce the
analysis [115]; and (iv) the limited number of combined tools and annotation
resources [116]. A feasible way to overcome these weaknesses is to automatically
combine multiple resources that covers the wide range of gene biological properties
through the application of single or multiple bioinformatics tools [117]. Based on the
survey of tools conducted on section (3.2.2), we chose to apply DAVID
bioinformatics resources and tools to perform the entire set of enrichment analysis,
which includes: GO terms, biological pathways, protein-protein interactions, protein
domains and gene-disease associations. However, reliably introducing tools to the
pipeline requires highly skilled bioinformaticians and computer scientists who are
capable of: (i) easily adding methods, resources and tools to the pipeline software
design; (ii) running and executing several tools by using scripts; (iii) managing and
controlling different types of enrichment categories by using independent modules;
and (iv) storing analysis results in independent tables contained in the relational
database [115].

54
3- Prioritization
None of the currently available statistical methods or prioritization tools is perfectly
suitable for all categories of enrichment analysis due to the (i) differences in the
volume of users’ gene lists; (ii) variation of the number of genes linked to enrichment
categories; (iii) random distribution and nonexistence of complete annotation
resources; (iv) strong relationships among genes; [52] and (v) inaccuracy in
determining the degree of specificity (number of true candidate genes) and sensitivity
(number of correct predicted genes). [117] These shortcomings can be addressed by
developing, as well as introducing to the pipeline, a computational function that
precisely selects the type of statistical method or prioritization tool based on the input
list of genes and the biological question it aims to answer [118]. To be mentioned,
statistical examination of enriched genes and annotation terms is performed by
various statistical methods, which are adopted by bioinformatics enrichment tools via
data-mining strategies in order to rank genes. Thus, lists of seed genes produced by
enrichment tools are ranked in accordance to applied statistical method. However,
prioritization methods and tools that fits the user needs can be added to the pipeline
by using scripts and modules.
4- Text-mining
Fully-automated text-mining strategies go beyond extracting information from
scientific literature by integrating the enriched data derived from biological databases
and bioinformatics tools with the results originated by text-mining of abstracts and
full-text research papers [119]. Moreover, they annotate candidate genes with
information found in these papers [120]. Three entities need to be added to the
pipeline in order to reliably automate the application of text mining strategies, which
are: (i) an information retrieval engine for access to scientific literature, such as
Lucene; (ii) a natural language analysis component based on the General Architecture
for Text-Mining (GATE); and (iii) a result verification components that validate
extracted information by accessing various databases such as NCBI Entrez Gene.
[119]
55
5- Filtering
The prioritized and annotated list of promising genes is processed by a simple
filtering function to remove duplicates and merge evidences associated with the same
gene. This function also stores the final output of the pipeline, which is an expanded
list of novel genes with evidence, in the relational database.
4.4 Pipeline Components
Database:
A relational database that can be analyzed by Structured Query Language (SQL) is a
key component of the pipeline since it stores input data and results of pipeline
methods that are performed by different functions and analysis modules. Moreover,
the database contains data that is required to carry out different types of pipeline
analysis, such as gene identifiers and scientific papers. In order to protect user’s
privacy, access to the database can be password-protected. [107]
Website:
The pipeline sets up web-interfaces that can be easily accessible to non-programmers.
The website allows: (i) efficient access to the relational database; (ii) integration
among different data types; (iii) advanced querying; (iv) information retrieval; and (v)
user redirection to external third-party databases and tools, through strong data-
mining environment. Results derived from pipeline implementation are summarized
and presented in tabular, textual and graphical views. Moreover, the full results of
different enrichment analysis can be retrieved and saved by the user. To be
mentioned, files required for website setup are contained in the pipeline software
package. [107]

56
4.5 Pipeline Features
In order to meet the requirements of modern bioinformatics studies, the pipeline,
along with its software, methods and components, need to have the following features
[107]:
1- To be highly flexible and adaptable.
2- Parallelization:
3- To facilitate the incorporation of third-party applications, tools and web
services.
4- To provide a strong data mining environment that is made available to users
via highly-configurable web-interface.
5- To be based on an open source license to support free distribution, code
availability and incorporation within different projects.
6- To allow easy configuration and customization of the pipeline.
7- To support both sequential and parallel mode in order to manage execution
time.

57
5 Conclusion and Future Work
This chapter gives conclusion of the entire MSc project and highlights potential areas
for future work.
5.1 Conclusion
The project started with a comprehensive research about the nature of the topic in
hand, which is a Network Model for Genetic Testing. This activity expanded my
limited knowledge on Bioinformatics and allowed the exploration of areas that
strongly relate to my project, such as the advancements in NGS technologies and the
important role of clinical genetic testing. Consequently, the scope, requirements,
aims, objectives and deliverables were completely understood and accurately
identified. The main objective of the project can be described in two main points,
which are: (i) to extend an initial panel of genes into an evidence-based expanded list
of candidates through the application of systematic bioinformatics methodologies; and
(ii) to create a generic workflow for gene lists analysis and expansion. In order to
achieve these objectives, the status of the current list, its development methodology,
its capabilities and limitations were clearly defined.
Afterwards, a background study was conducted to give a clear understanding of the
current status and strategies for systematic expansion of gene panels, workflows that
have been developed and prioritization methodologies that have been used. Moreover,
the fact that genes work in networks was highlighted by: explaining the concept of
modeling genetic networks, defining networks models and describing the types and
characteristics of biological networks. By completing a literature review of the current
expansion and prioritization strategies for gene panels, it was obvious that researchers
have not yet arrived at a gold standard to develop a clinically-valid list of candidate
genes. The wide range of available bioinformatics tools and strategies that can be
employed to accomplish our goals brings the idea of creating a workflow that
comprehensively analyze and systematically prioritize gene lists.

58
The background research was followed by a clear and systematic identification of the
methods used for project implementation. Since comprehensive functional analysis of
large gene panels is a huge task that is based on different resources, various
bioinformatics tools and several system biology methodologies, exploring these
aspects is a must. A survey of available bioinformatics tools was completed in order
to understand their applications, functionalities and resources. Consequently, it has
been obvious that one of the popular tools used by researchers for comprehensive
functional analysis is DAVID. Based on the information collected from the previously
mentioned activities, a pseudo code was handcrafted to expand the gene list by
following three main steps, which are: (i) analysis; (ii) prioritization; and (iii) text-
mining. The pseudo code was implemented using DAVID and resulted in an
evidence-based list of novel genes that included 68 genes. Comprehensive Evaluation
that covers the proposed workflow and the created list was done, by the clinician, in
order to determine whether the suggested methodology produces results that make
sense to experts. The feedback we got states that though the methodology suggests
meaningful candidates that pinpoints interesting research areas, some genes, curated
from the literature, weren’t captured.
Finally, efforts were directed toward designing a computational pipeline that fully
automates the hand crafted pseudo code in order to meet the requirements of modern
disease gene discovery studies. The pipeline for comprehensive functional analysis
and expansion of large gene panels accepts any type of gene identifiers and runs four
methods executed by different scripts and modules that are included in the software
package. These methods include: (i) analysis; (ii) prioritization; (iii) text-mining; and
(iv) Filtering, and they aim to generate a list of novel genes that is annotated with
statistical measures and evidence information. Different types of data is stored in a
relational database and made available to users via user-friendly PHP website. To be
mentioned, a clear description of the pipeline’s software, methods, components and
features were included.
This project has clearly shown that expansion of large gene lists is not a difficult task.
There are so many free and commercial tools that either do a single type of analysis or
integrate different types of analysis. Both types have their strengths and limitations,

59
which are determined by annotation sources on which their analysis is based,
computational algorithms by which their evidence is collected, and statistical and
prioritization measurements by which their output is ranked. Accordingly, the key
challenge is to decide which tool best fits the requirements of the task in hand. In
terms of my project, I followed a low-cost strategy, which is a survey of available
tools. I used Google Scholar to search for papers in which bioinformatics tools and
strategies were used to analyze gene lists, created a list of the tools they used,
highlighted the purpose of using them, classified them into categories, and ordered
them based on how frequently they were used. By analyzing the survey results, we
arrived at a conclusion that DAVID is an easy first option for analyzing the initial
gene list as it has been used by many research studies and experiments to perform
different types of analysis. In addition to selecting the ideal tool, another challenge is
to select the appropriate prioritization tool or statistical measure to rank the produced
list of genes and extract the most promising candidate genes. Due to time limitation,
only statistical measures incorporated with DAVID were used to rank the list and no
prioritization tools were applied nor included in the pseudo code. However, in order
to increase the analytic power of our workflow, text-mining strategies were included
to collect more evidence about the produced panel of genes and to aid its ranking
process.
In regards to the proposed workflow, though it includes all basic steps for
comprehensive functional analysis and expansion of gene lists, it needs to be extended
by adding detailed information about each of its steps. These details can be added to
the pseudo code as sub-steps and they include information about: (i) bioinformatics
tools and strategies to be used in each type of analysis; (ii) statistical measures and
prioritization tools that best match each type of analysis; (iii) text-mining strategies
that best support the analyzed list; (iv) the types of filters used.
Regardless of the cost-effective methodology for tool selection and lack of details in
the generic workflow, the results produced were acceptable as per expert evaluation.
This gives insight that if better methodologies were put to practice when selecting the
appropriate bioinformatics tools, more interesting results will be produced by our
workflow.

60
5.2 Future Work
Even though the deliverables of the project were successfully attained, there is a load
of functionalities and features that could be added to improve the usability of
developed workflow. The project currently provides a generic workflow and suggests
an initial design for an automated pipeline. Both, the workflow and pipeline, need to
be further tested and evaluated in order to improve the quality of produced candidates.
Therefore, some of the future works identified during the implementation of the
project include:
Revisit, modify and test all activities associated with collecting evidence from
the literature in order to cover all missing genes that were reported by
clinicians.
Develop a tool selection methodology that takes into consideration the type of
input, purpose of study and expected output in order to enable effective
decision-making by skillful and regular users.
Test the current workflow using different sets of genes in order to evaluate and
compare results.
Extend the current workflow to include detailed sub-steps of each contained
step.
Modify the pipeline design in accordance to the updated workflow.
Build, run, test and evaluate the pipeline in order to fully automate the process
of discovering novel disease gene candidates.
Acceptance of different types of genes identifiers, integration of different
annotation resources and execution of different types of analysis, require
programming and bioinformatics skills, as well as strong computing and
networking infrastructures in order to be fully-automated. This automation is
usually associated with challenges because different types of analysis can be
time and resource consuming. Addressing these challenges is crucial when
implementing the pipeline.

61
6 References 1. What is a Genetic Disease? (n.d.). Retrieved April 24, 2014, from Genetic
Alliance: http://www.geneticalliance.org/diseases
2. BBC. (2011). Retrieved April 25, 2014, from DNA:
http://www.bbc.co.uk/schools/gcsebitesize/science/edexcel_pre_2011/genes/dna
rev1.shtml
3. Frequently Asked Questions About Genetic Disorders. (2012). Retrieved April
25, 2014, from Natoional Human Genome Institute:
https://www.genome.gov/19016930
4. Anne Matthews, R. P. (2010).
https://www.netwellness.org/healthtopics/idbd/2.cfm. Retrieved April 24, 2014,
from NetWellness: https://www.netwellness.org/healthtopics/idbd/2.cfm
5. Pediatric Genetics. (2013). Retrieved April 27, 2013, from Centers for Disease
Control and Prevention:
http://www.cdc.gov/ncbddd/pediatricgenetics/facts.html
6. Koboldt, D. C., Steinberg, K. M., Larson, D. E., Wilson, R. K., & Mardis, E. R.
(2013). The next-generation sequencing revolution and its impact on
genomics.Cell, 155(1), 27-38.
7. Rifai, N., Gillette, M. A., & Carr, S. A. (2006). Protein biomarker discovery and
validation: the long and uncertain path to clinical utility. Nature
biotechnology,24(8), 971-983.
8. Kuzdza, S. A Comprehensive Biomarker Discovery and Analysis Platform.
Perkinelmer.
9. Hoefkens, D. J. Towards unbiased biomarker discovery. Drug Discovery
World.
10. Britannica, E. (2014). human genetic disease. Retrieved from
http://www.britannica.com/EBchecked/topic/228874/human-genetic-disease.P
11. Medical Genetic Testing Information for health professionals. (2010).
12. Stone, E. M., Aldave, A. J., Drack, A. V., MacCumber, M. W., Sheffield, V. C.,
Traboulsi, E., & Weleber, R. G. (2012). Recommendations for genetic testing of
inherited eye diseases: report of the American Academy of Ophthalmology task
force on genetic testing. Ophthalmology, 119(11), 2408-2410.
13. Genetic Disorders. (2014). Retrieved August 1, 2014, from Genetic Home
Reference: http://ghr.nlm.nih.gov/
14. Genetic Testing. Retrieved August 1, 2014, from MEDIC 8:
http://www.medic8.com/genetic-testing/index.htm
62
15. Positive and Negative Aspects of Genetic Testing. Retrieved August 5, 2014,
from IMPACT Targeted Prostate Cancer Screening: http://impact-
study.co.uk/public/geneticsandcancer/genetictesting/positiveandnegativeaspects
16. Nigro, V., & Piluso, G. (2012). Next generation sequencing (NGS) strategies
for the genetic testing of myopathies. Acta Myologica, 31(3), 196.
17. Cataracts in Children, Congenital and Acquired. (n.d.). Retrieved April 27,
2014, from EyeWiki:
http://eyewiki.aao.org/Cataracts_in_Children,_Congenital_and_Acquired
18. Childhood Cataract (2014). Retrieved April 27, 2014, from NHS Choices:
http://www.nhs.uk/Conditions/Cataracts-childhood/Pages/Introduction.aspx
19. Churchill, A., & Graw, J. (2011). Clinical and experimental advances in
congenital and paediatric cataracts. Philosophical Transactions of the Royal
Society B: Biological Sciences, 366(1568), 1234-1249.
20. Koenekoop, R. K., Lopez, I., Den Hollander, A. I., Allikmets, R., & Cremers, F.
P. (2007). Genetic testing for retinal dystrophies and dysfunctions: benefits,
dilemmas and solutions. Clinical & experimental ophthalmology, 35(5), 473-
485.
21. Genetic test speeds up diagnosis for children with cataracts. (2013). Retrieved
April 29, 2014, from University of Manchester:
http://www.manchester.ac.uk/discover/news/article/?id=10662
22. DNA Test for Congenital Cataracts Leads to Faster, More Accurate Diagnoses
of Rare Diseases Linked to Childhood Blindness. (2013). Retrieved April 29,
2014, from Central Manchester University Hospitals:
http://www.cmft.nhs.uk/media-centre/latest-news/dna-test-for-congenital-
cataracts-leads-to-faster-more-accurate-diagnoses-of-rare-diseases-linked-to-
childhood-blindness
23. Field, M. J., & Lohr, K. N. (Eds.). (1992). Guidelines for Clinical Practice::
From Development to Use. National Academies Press.
24. Shiffman, R. N., Shekelle, P., Overhage, J. M., Slutsky, J., Grimshaw, J., &
Deshpande, A. M. (2003). Standardized reporting of clinical practice guidelines:
a proposal from the Conference on Guideline Standardization. Annals of
Internal medicine, 139(6), 493-498.
25. Chen, Y., Jiang, T., & Jiang, R. (2011). Uncover disease genes by maximizing
information flow in the phenome–interactome network. Bioinformatics, 27(13),
i167-i176.
26. Ideker, T., Galitski, T., & Hood, L. (2001). A new approach to decoding life:
systems biology. Annual review of genomics and human genetics, 2(1), 343-
372.
27. Galitski, T. (2012). Reductionism Gives Way to Systems Biology.
28. Juan, H. F., & Huang, H. C. (Eds.). (2012). Systems Biology: Applications in
Cancer-related Research. World Scientific.
29. Costa, L. D. F., Oliveira Jr, O. N., Travieso, G., Rodrigues, F. A., Villas Boas,
P. R., Antiqueira, L., ... & Correa Rocha, L. E. (2011). Analyzing and modeling
63
real-world phenomena with complex networks: a survey of
applications.Advances in Physics, 60(3), 329-412.
30. Network Model. (n.d.). Retrieved from EComputer Notes:
http://ecomputernotes.com/fundamental/what-is-a-database/network-model
31. Boccaletti, S. (2006). Complex networks: Structure and dynamics. Elsevier.
32. Newman, M. E. (2003). The structure and function of complex networks. SIAM
review, 45(2), 167-256.
33. Collins, F. S., Green, E. D., Guttmacher, A. E., & Guyer, M. S. (2003). A vision
for the future of genomics research. Nature, 422(6934), 835-847.
34. Why a Network in Protein-Protein interactions? (2013). Retrieved May 1, 2014,
from Protein-Protein Interaction Network: http://ppi-net.org/
35. Dr Ananya Mandal, M. (2013). What is Metabolism? Retrieved May 1, 2014,
from Medical News: http://www.news-medical.net/health/What-is-
Metabolism.aspx
36. MacNeil, L. T., & Walhout, A. J. (2011). Gene regulatory networks and the role
of robustness and stochasticity in the control of gene expression. Genome
research, 21(5), 645-657.
37. Hallowell, N. (1999). Doing the right thing: genetic risk and
responsibility.Sociology of Health & Illness, 21(5), 597-621.
38. Hoedemaekers, R. (1999). Genetic screening and testing. In The ethics of
genetic screening (pp. 207-230). Springer Netherlands.
39. American Society of Clinical Oncology. (2003). American Society of Clinical
Oncology policy statement update: genetic testing for cancer
susceptibility.Journal of clinical oncology: official journal of the American
Society of Clinical Oncology, 21(12), 2397.
40. Proceeding of the National Academy of Sciences of the United States of
America (2014). From PNAS at: http://www.pnas.org/
41. Huang, H. (2009). Bayesian approach to transforming public gene expression
repositories into disease diagnosis databases. PNAS.
42. te Rijdt, W. P., Jongbloed, J. D., de Boer, R. A., Thiene, G., Basso, C., van den
Berg, M. P., & van Tintelen, J. P. (2013). Clinical utility gene card for:
arrhythmogenic right ventricular cardiomyopathy (ARVC). European Journal
of Human Genetics.
43. Filipek, P. A., Accardo, P. J., Ashwal, S., Baranek, G. T., Cook, E. H., Dawson,
G., ... & Volkmar, F. R. (2000). Practice parameter: Screening and diagnosis of
autism Report of the Quality Standards Subcommittee of the American
Academy of Neurology and the Child Neurology Society. Neurology, 55(4),
468-479.
44. MacArthur, D. G., Manolio, T. A., Dimmock, D. P., Rehm, H. L., Shendure, J.,
Abecasis, G. R., ... & Gunter, C. (2014). Guidelines for investigating causality
of sequence variants in human disease. Nature, 508(7497), 469-476.
45. Galitski, T. (2012). Reductionism Gives Way to Systems Biology.
46. Purohit, P. A. Study Material for Research Methodology

64
47. Genomic Health Product Development Phases. (2014, May 5). Retrieved from
Genomic Health: http://www.genomichealth.com/en-
US/Science/ProductDevelopment/ProductDevelopmentPhases.aspx#.U2d4_q1d
UwK
48. Zolg, J. W., & Langen, H. (2004). How industry is approaching the search for
new diagnostic markers and biomarkers. Molecular & Cellular
Proteomics, 3(4), 345-354.
49. Khatri, P., Sirota, M., & Butte, A. J. (2012). Ten years of pathway analysis:
current approaches and outstanding challenges. PLoS computational
biology,8(2), e1002375.
50. Huang, Q., Wu, L. Y., Wang, Y., & Zhang, X. S. (2013). GOMA: Functional
enrichment analysis tool based on GO modules. Chinese journal of
cancer,32(4), 195.
51. Kann, M. G. (2010). Advances in translational bioinformatics: computational
approaches for the hunting of disease genes. Briefings in bioinformatics, 11(1),
96-110.
52. Huang, D. W., Sherman, B. T., & Lempicki, R. A. (2009). Bioinformatics
enrichment tools: paths toward the comprehensive functional analysis of large
gene lists. Nucleic acids research, 37(1), 1-13.
53. Pospisilik, J. A., Schramek, D., Schnidar, H., Cronin, S. J., Nehme, N. T.,
Zhang, X., ... & Penninger, J. M. (2010). < i> Drosophila</i> Genome-wide
Obesity Screen Reveals Hedgehog as a Determinant of Brown versus White
Adipose Cell Fate. Cell, 140(1), 148-160.
54. Alsford, S., Turner, D. J., Obado, S. O., Sanchez-Flores, A., Glover, L.,
Berriman, M., ... & Horn, D. (2011). High-throughput phenotyping using
parallel sequencing of RNA interference targets in the African
trypanosome. Genome research, 21(6), 915-924.
55. Wellmer, F., Alves-Ferreira, M., Dubois, A., Riechmann, J. L., & Meyerowitz,
E. M. (2006). Genome-wide analysis of gene expression during early
Arabidopsis flower development. PLoS genetics, 2(7), e117.
56. Lin, J., Gan, C. M., Zhang, X., Jones, S., Sjöblom, T., Wood, L. D., ... &
Velculescu, V. E. (2007). A multidimensional analysis of genes mutated in
breast and colorectal cancers. Genome research, 17(9), 000-000.
57. Teixeira, M. C., Raposo, L. R., Mira, N. P., Lourenço, A. B., & Sá-Correia, I.
(2009). Genome-wide identification of Saccharomyces cerevisiae genes
required for maximal tolerance to ethanol. Applied and environmental
microbiology, 75(18), 5761-5772.
58. Tydell, C. C., David-Fung, E. S., Moore, J. E., Rowen, L., Taghon, T., &
Rothenberg, E. V. (2007). Molecular dissection of prethymic progenitor entry
into the T lymphocyte developmental pathway. The Journal of
Immunology,179(1), 421-438.
59. Sanders, S. J., Ercan-Sencicek, A. G., Hus, V., Luo, R., Murtha, M. T., Moreno-
De-Luca, D., ... & Mane, S. M. (2011). Multiple recurrent de novo CNVs,

65
including duplications of the 7q11. 23 Williams syndrome region, are strongly
associated with autism. Neuron, 70(5), 863-885.
60. Hsu, S. D., Lin, F. M., Wu, W. Y., Liang, C., Huang, W. C., Chan, W. L., ... &
Huang, H. D. (2010). miRTarBase: a database curates experimentally validated
microRNA–target interactions. Nucleic acids research, gkq1107.
61. Trimboli, A. J., Cantemir-Stone, C. Z., Li, F., Wallace, J. A., Merchant, A.,
Creasap, N., ... & Leone, G. (2009). Pten in stromal fibroblasts suppresses
mammary epithelial tumours. Nature, 461(7267), 1084-1091.
62. Chu, C., Qu, K., Zhong, F. L., Artandi, S. E., & Chang, H. Y. (2011). Genomic
maps of long noncoding RNA occupancy reveal principles of RNA-chromatin
interactions. Molecular cell, 44(4), 667-678.
63. Shi, L. Z., Wang, R., Huang, G., Vogel, P., Neale, G., Green, D. R., & Chi, H.
(2011). HIF1α–dependent glycolytic pathway orchestrates a metabolic
checkpoint for the differentiation of TH17 and Treg cells. The Journal of
experimental medicine, 208(7), 1367-1376.
64. Wagner, S. A., Beli, P., Weinert, B. T., Nielsen, M. L., Cox, J., Mann, M., &
Choudhary, C. (2011). A proteome-wide, quantitative survey of in vivo
ubiquitylation sites reveals widespread regulatory roles. Molecular & Cellular
Proteomics, 10(10), M111-013284.
65. Beck, M., Schmidt, A., Malmstroem, J., Claassen, M., Ori, A., Szymborska, A.,
... & Aebersold, R. (2011). The quantitative proteome of a human cell
line.Molecular systems biology, 7(1).
66. Oshlack, A., & Wakefield, M. J. (2009). Transcript length bias in RNA-seq data
confounds systems biology. Biol Direct, 4(1), 14.
67. Liu, G. H., Barkho, B. Z., Ruiz, S., Diep, D., Qu, J., Yang, S. L., ... &
Belmonte, J. C. I. (2011). Recapitulation of premature ageing with iPSCs from
Hutchinson-Gilford progeria syndrome. Nature, 472(7342), 221-225.
68. Liu, L., Luo, G. Z., Yang, W., Zhao, X., Zheng, Q., Lv, Z., ... & Zhou, Q.
(2010). Activation of the imprinted Dlk1-Dio3 region correlates with
pluripotency levels of mouse stem cells. Journal of Biological
Chemistry, 285(25), 19483-19490.
69. Patnaik, S. K., Kannisto, E., Knudsen, S., & Yendamuri, S. (2010). Evaluation
of microRNA expression profiles that may predict recurrence of localized stage
I non–small cell lung cancer after surgical resection. Cancer research, 70(1),
36-45.
70. Zhang, E. E., Liu, A. C., Hirota, T., Miraglia, L. J., Welch, G., Pongsawakul, P.
Y., ... & Kay, S. A. (2009). A genome-wide RNAi screen for modifiers of the
circadian clock in human cells. Cell, 139(1), 199-210.
71. Malhotra, D., Portales-Casamar, E., Singh, A., Srivastava, S., Arenillas, D.,
Happel, C., ... & Biswal, S. (2010). Global mapping of binding sites for Nrf2
identifies novel targets in cell survival response through ChIP-Seq profiling and
network analysis. Nucleic acids research, 38(17), 5718-5734.
72. Teekakirikul, P., Eminaga, S., Toka, O., Alcalai, R., Wang, L., Wakimoto, H.,
... & Seidman, J. G. (2010). Cardiac fibrosis in mice with hypertrophic

66
cardiomyopathy is mediated by non-myocyte proliferation and requires Tgf-
β.The Journal of clinical investigation, 120(10), 3520-3529.
73. Sequeira, A., Mamdani, F., Ernst, C., Vawter, M. P., Bunney, W. E., Lebel, V.,
... & Turecki, G. (2009). Global brain gene expression analysis links
glutamatergic and GABAergic alterations to suicide and major depression.PLoS
One, 4(8), e6585.
74. Van Baarlen, P., Troost, F. J., van Hemert, S., van der Meer, C., de Vos, W. M.,
de Groot, P. J., ... & Kleerebezem, M. (2009). Differential NF-κB pathways
induction by Lactobacillus plantarum in the duodenum of healthy humans
correlating with immune tolerance. Proceedings of the National Academy of
Sciences, 106(7), 2371-2376.
75. Fulp, C. T., Cho, G., Marsh, E. D., Nasrallah, I. M., Labosky, P. A., & Golden,
J. A. (2008). Identification of Arx transcriptional targets in the developing basal
forebrain. Human molecular genetics, 17(23), 3740-3760.
76. Bauersachs, S., Ulbrich, S. E., Gross, K., Schmidt, S. E., Meyer, H. H.,
Wenigerkind, H., ... & Wolf, E. (2006). Embryo-induced transcriptome changes
in bovine endometrium reveal species-specific and common molecular markers
of uterine receptivity. Reproduction, 132(2), 319-331.
77. Asmann, Y. W., Stump, C. S., Short, K. R., Coenen-Schimke, J. M., Guo, Z.,
Bigelow, M. L., & Nair, K. S. (2006). Skeletal muscle mitochondrial functions,
mitochondrial DNA copy numbers, and gene transcript profiles in type 2
diabetic and nondiabetic subjects at equal levels of low or high insulin and
euglycemia.Diabetes, 55(12), 3309-3319.
78. Ma, W., Yang, D., Gu, Y., Guo, X., Zhao, W., & Guo, Z. (2009). Finding
disease-specific coordinated functions by multi-function genes: insight into the
coordination mechanisms in diseases. Genomics, 94(2), 94-100.
79. Chen, J., Wang, Y., Shen, B., & Zhang, D. (2013). Molecular signature of
cancer at gene level or pathway level? Case studies of colorectal cancer and
prostate cancer microarray data. Computational and mathematical methods in
medicine, 2013.
80. Miller, J. A., Oldham, M. C., & Geschwind, D. H. (2008). A systems level
analysis of transcriptional changes in Alzheimer's disease and normal aging.The
Journal of Neuroscience, 28(6), 1410-1420.
81. Park, J. E., Tan, H. S., Datta, A., Lai, R. C., Zhang, H., Meng, W., ... & Sze, S.
K. (2010). Hypoxic tumor cell modulates its microenvironment to enhance
angiogenic and metastatic potential by secretion of proteins and
exosomes.Molecular & Cellular Proteomics, 9(6), 1085-1099.
82. Codreanu, S. G., Zhang, B., Sobecki, S. M., Billheimer, D. D., & Liebler, D. C.
(2009). Global analysis of protein damage by the lipid electrophile 4-hydroxy-
2-nonenal. Molecular & Cellular Proteomics, 8(4), 670-680.
83. Lascorz, J., Chen, B., Hemminki, K., & Försti, A. (2011). Consensus pathways
implicated in prognosis of colorectal cancer identified through systematic
enrichment analysis of gene expression profiling studies. PLoS One, 6(4),
e18867.

67
84. Waldman, Y. Y., Geiger, T., & Ruppin, E. (2013). A Genome-Wide Systematic
Analysis Reveals Different and Predictive Proliferation Expression Signatures
of Cancerous vs. Non-Cancerous Cells. PLoS genetics, 9(9), e1003806.
85. Masud, R., Shameer, K., Dhar, A., Ding, K., & Kullo, I. J. (2012). Gene
expression profiling of peripheral blood mononuclear cells in the setting of
peripheral arterial disease. J. Clinical Bioinformatics, 2, 6.
86. Tejera, E., Bernardes, J., & Rebelo, I. (2012). Preeclampsia: a bioinformatics
approach through protein-protein interaction networks analysis. BMC systems
biology, 6(1), 97.
87. Flavell, S. W., Kim, T. K., Gray, J. M., Harmin, D. A., Hemberg, M., Hong, E.
J., ... & Greenberg, M. E. (2008). Genome-wide analysis of MEF2
transcriptional program reveals synaptic target genes and neuronal activity-
dependent polyadenylation site selection. Neuron, 60(6), 1022-1038.
88. Gaulton, K. J., Mohlke, K. L., & Vision, T. J. (2007). A computational system
to select candidate genes for complex human traits. Bioinformatics, 23(9), 1132-
1140.
89. George, R. A., Liu, J. Y., Feng, L. L., Bryson-Richardson, R. J., Fatkin, D., &
Wouters, M. A. (2006). Analysis of protein sequence and interaction data for
candidate disease gene prediction. Nucleic acids research, 34(19), e130-e130.
90. Radivojac, P., Peng, K., Clark, W. T., Peters, B. J., Mohan, A., Boyle, S. M., &
Mooney, S. D. (2008). An integrated approach to inferring gene–disease
associations in humans. Proteins: Structure, Function, and
Bioinformatics,72(3), 1030-1037.
91. Wang, L. L., Li, Y., & Zhou, S. F. (2009). A bioinformatics approach for the
phenotype prediction of nonsynonymous single nucleotide polymorphisms in
human cytochromes P450. Drug Metabolism and Disposition, 37(5), 977-991.
92. Wu, J., Li, Y., & Jiang, R. (2014). Integrating multiple genomic data to predict
disease-causing nonsynonymous single nucleotide variants in exome
sequencing studies. PLoS genetics, 10(3), e1004237.
93. van Driel, M. A., Bruggeman, J., Vriend, G., Brunner, H. G., & Leunissen, J. A.
(2006). A text-mining analysis of the human phenome. European journal of
human genetics, 14(5), 535-542.
94. Fact Sheet (2009). Retrieved July 24, 2014, from DAVID Bioinformatics
Resources: http://david.abcc.ncifcrf.gov/content.jsp?file=fact.html
95. Jiao, X., Sherman, B. T., Huang, D. W., Stephens, R., Baseler, M. W., Lane, H.
C., & Lempicki, R. A. (2012). DAVID-WS: a stateful web service to facilitate
gene/protein list analysis. Bioinformatics, 28(13), 1805-1806.
96. DAVID Bioinformatics Resources ). Retrieved July 24, 2014, from Google
Scholar: http://scholar.google.com/citations?user=dMn7gzYAAAAJ
97. Dennis Jr, G., Sherman, B. T., Hosack, D. A., Yang, J., Gao, W., Lane, H. C., &
Lempicki, R. A. (2003). DAVID: database for annotation, visualization, and
integrated discovery. Genome biol, 4(5), P3.
98. Huang, D. W., Sherman, B. T., Tan, Q., Kir, J., Liu, D., Bryant, D., ... &
Lempicki, R. A. (2007). DAVID Bioinformatics Resources: expanded

68
annotation database and novel algorithms to better extract biology from large
gene lists.Nucleic acids research, 35(suppl 2), W169-W175.
99. Goh, K. I., Cusick, M. E., Valle, D., Childs, B., Vidal, M., & Barabási, A. L.
(2007). The human disease network. Proceedings of the National Academy of
Sciences, 104(21), 8685-8690.
100. About Genetic Home Reference. (2014). Retrieved September 1, 2014, from
Genetic Home Reference: http://ghr.nlm.nih.gov/about
101. Functional Annotation Tool. (2007). Retrieved July 17, 2014, from DAVID
Bioinformatics Resources at:
http://david.abcc.ncifcrf.gov/content.jsp?file=functional_annotation.html
102. KEGG Pathway Database. (2014). Retrieved August 5, 2014, from KEGG:
Kyoto Encyclopedia of Genes and Genomes at:
http://www.genome.jp/kegg/pathway.html
103. HGNC. Retrieved August 19, 2014, from HUGO Gene Nomenclature
Committee at: http://www.genenames.org/
104. Gene Search. Retrieved August 19, 2014, from HUGO Gene Nomenclature
Committee at: http://www.genenames.org/cgi-bin/search
105. OMIM Search. Retrieved August 9, 2014, from OMIM at:
http://omim.org/entry/
106. How do geneticists indicate the location of a gene? (2014). Retrieved September
1, 2014, from Genetic Home Reference:
http://ghr.nlm.nih.gov/handbook/howgeneswork/genelocation
107. Forment, J., Gilabert, F., Robles, A., Conejero, V., Nuez, F., & Blanca, J. M.
(2008). EST2uni: an open, parallel tool for automated EST analysis and
database creation, with a data mining web interface and microarray expression
data integration. BMC bioinformatics, 9(1), 5.
108. Wang, X., Terfve, C., Rose, J., & Markowetz, F. (2012). Gene set enrichment
and network analyses of high-throughput screens using HTSanalyzeR.
109. DAVID Gene Association Conversion. (2007). Retrieved July 17, 2014, from
DAVID Bioinformatics Resources at:
http://david.abcc.ncifcrf.gov/helps/conversion.html#submission
110. Gene ID Conversion Tool. (2009). Retrieved July 23, 2014, from DAVID
Bioinformatics Resources at: http://david.abcc.ncifcrf.gov/conversion.jsp
111. BioMart Central Porter. Retrieved August 22, 2014, from BioMart at:
http://central.biomart.org/converter/#!/ID_converter/gene_ensembl_config_2
112. Ayoubi, P., Jin, X., Leite, S., Liu, X., Martajaja, J., Abduraham, A., ... & Prade,
R. A. (2002). PipeOnline 2.0: automated EST processing and functional data
sorting. Nucleic acids research, 30(21), 4761-4769.
113. Almeida, L. G., Paixão, R., Souza, R. C., Da Costa, G. C., Barrientos, F. J., Dos
Santos, M. T., ... & Vasconcelos, A. T. R. (2004). A system for automated
bacterial (genome) integrated annotation—SABIA. Bioinformatics, 20(16),
2832-2833.
114. Wyman, S. K., Jansen, R. K., & Boore, J. L. (2004). Automatic annotation of
organellar genomes with DOGMA. Bioinformatics, 20(17), 3252-3255.

69
115. Koski, L. B., Gray, M. W., Lang, B. F., & Burger, G. (2005). AutoFACT: an
automatic functional annotation and classification tool. BMC
bioinformatics,6(1), 151.
116. Allen, J. E., Pertea, M., & Salzberg, S. L. (2004). Computational gene
prediction using multiple sources of evidence. Genome Research, 14(1), 142-
148.
117. Moreau, Y., & Tranchevent, L. C. (2012). Computational tools for prioritizing
candidate genes: boosting disease gene discovery. Nature Reviews
Genetics,13(8), 523-536.
118. Witte, R., & Baker, C. J. (2005). Combining biological databases and text
mining to support new bioinformatics applications. In Natural Language
Processing and Information Systems (pp. 310-321). Springer Berlin Heidelberg.
119. Couto, F. M., Silva, M. J., & Coutinho, P. (2003, November). ProFAL: PROtein
Functional Annotation through Literature. In JISBD (pp. 747-756).

70
Appendix
Appendix A: Bioinformatics Enrichment Tools Used in Reviewed Research
Papers
Title Tool 1 Tool 2 Tool 3 Tool 4 Tool 5
1 Drosophila Genome-wide Obesity Screen Reveals Hedgehog as a Determinant of Brown versus White Adipose Cell Fate
GOToolbox Cytoscape
2 High-throughput phenotyping using parallel sequencing of RNA interference targets in the African trypanosome
GOToolbox GeneDB TriTrypDB
3 Genome-Wide Analysis of Gene Expression during Early ArabidopsisFlower Development
GOToolbox TAIR
4 A multidimensional analysis of genes mutated in breast and colorectal cancers
The InterPro database
GO OPHID Cytoscape KEGG, Invitrogen iPath, BioCarta, sigPathway databases
5 Genome-Wide Identification of Saccharomyces cerevisiae Genes Required for Maximal Tolerance to Ethanol
GOToolBox BioGrid
6 Molecular Dissection of Prethymic Progenitor Entry into the T Lymphocyte Developmental Pathway1
GOToolBox NCBI Ensembl
MGI
7 Multiple Recurrent De Novo CNVs, Including Duplications of the 7q11.23 Williams Syndrome Region, Are Strongly Associated with Autism
DAVID MetaCore from GeneGo, Inc

71
8 miRTarBase: a database curates experimentally validated microRNA–target interactions
DAVID
9 Pten in Stromal Fibroblasts Suppresses Mammary Epithelial Tumors
DAVID
10 Genomic Maps of Long Noncoding RNA Occupancy Reveal Principles of RNA-Chromatin Interactions
DAVID
11 HIF1α–dependent glycolytic pathway orchestrates a metabolic checkpoint for the differentiation of TH17 and Tregcells
DAVID
12 A Proteome-wide, Quantitative Survey of In Vivo Ubiquitylation Sites Reveals Widespread Regulatory Roles
DAVID STRING Cytoscape
13 The quantitative proteome of a human cell line
DAVID
14 Transcript length bias in RNA-seq data confounds systems biology
DAVID
15 Recapitulation of premature aging with iPSCs from Hutchinson-Gilford progeria syndrome
DAVID
16 Activation of the Imprinted Dlk1-Dio3Region Correlates with Pluripotency Levels of Mouse Stem Cells
DAVID GOEAST
17 Evaluation of MicroRNA Expression Profiles That May Predict Recurrence of Localized Stage I Non–Small Cell Lung Cancer after Surgical Resection
DAVID miRGator

72
18 A Genome-wide RNAi
Screen for Modifiers of
the Circadian Clock in
Human Cells
DAVID
19 Global mapping of binding sites for Nrf2 identifies novel targets in cell survival response through ChIP-Seq profiling and network analysis
DAVID
20 Cardiac fibrosis in mice with hypertrophic cardiomyopathy is mediated by non-myocyte proliferation and requires Tgf-β
DAVID
21 Global Brain Gene Expression Analysis Links Glutamatergic and GABAergic Alterations to Suicide and Major Depression
DAVID ErmineJ AVADIS
22 Differential NF-κB pathways induction by Lactobacillus plantarum in the duodenum of healthy humans correlating with immune tolerance
ErmineJ GSEA IPA
23 Identification of Arx transcriptional targets in the developing basal forebrain
WebGestalt GSEA oPOSSUM
24 Embryo-induced transcriptome changes in bovine endometrium reveal species-specific and common molecular markers of uterine receptivity
Entrez Gene GOTM Bibliosphere
25 Skeletal Muscle Mitochondrial Functions, Mitochondrial DNA Copy Numbers, and Gene Transcript Profiles in Type 2 Diabetic and Nondiabetic Subjects at
GOTM MAPPFinder

73
Equal Levels of Low or High Insulin and Euglycemia
26 Finding disease-specific
coordinated functions by
multi-function genes:
Insight into the
coordination
mechanisms in diseases
GO KEGG OMIM HPRD
27 Molecular Signature of Cancer at Gene Level or Pathway Level? Case Studies of Colorectal Cancer and Prostate Cancer Microarray Data
GSEA Onto-Express MetaCore KEGG
28 A Systems Level Analysis of Transcriptional Changes in Alzheimer's Disease and Normal Aging
EASE WebGestalt Chilibot IPA
29 Hypoxic Tumor Cell Modulates Its Microenvironment to Enhance Angiogenic and Metastatic Potential by Secretion of Proteins and Exosomes
ProteinPilot GeneCards TMHMM SecretomeP KEGG, PANTHER
30 Global Analysis of Protein Damage by the Lipid Electrophile 4-Hydroxy-2-nonenal
WebGestalt HPRD, MINT, intact, REACTOME, and DIP
CFinder CytoScape
31 Consensus Pathway Implicated in Prognosis of Colorectal Cancer Identified through Systematic Enrichment Analysis of Gene Expression Profiling Studies
10 Enrichment Tools
32 A Genomewide Systematic Analysis Reveals different and Predictive Proliferation Expression Signatures of Cancerous vs. Non-Cancerous Cells
GO DAVID PubMed
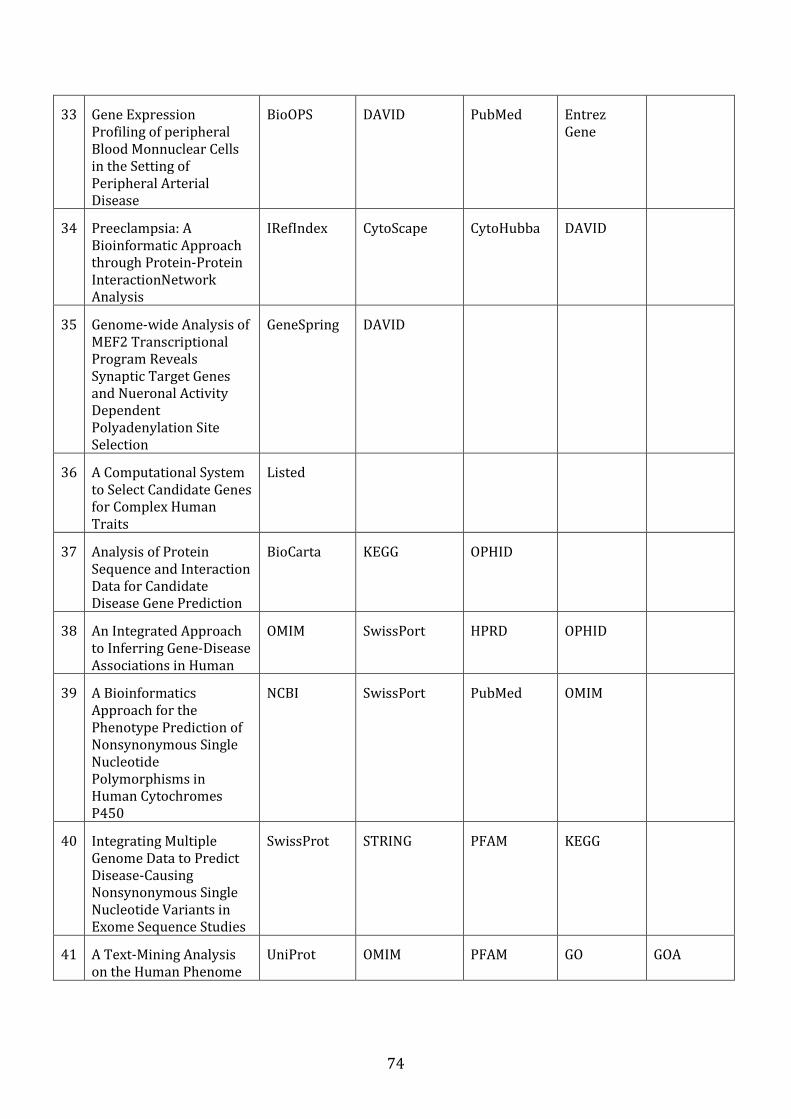
74
33 Gene Expression Profiling of peripheral Blood Monnuclear Cells in the Setting of Peripheral Arterial Disease
BioOPS DAVID PubMed Entrez Gene
34 Preeclampsia: A Bioinformatic Approach through Protein-Protein InteractionNetwork Analysis
IRefIndex CytoScape CytoHubba DAVID
35 Genome-wide Analysis of MEF2 Transcriptional Program Reveals Synaptic Target Genes and Nueronal Activity Dependent Polyadenylation Site Selection
GeneSpring DAVID
36 A Computational System to Select Candidate Genes for Complex Human Traits
Listed
37 Analysis of Protein Sequence and Interaction Data for Candidate Disease Gene Prediction
BioCarta KEGG OPHID
38 An Integrated Approach to Inferring Gene-Disease Associations in Human
OMIM SwissPort HPRD OPHID
39 A Bioinformatics Approach for the Phenotype Prediction of Nonsynonymous Single Nucleotide Polymorphisms in Human Cytochromes P450
NCBI SwissPort PubMed OMIM
40 Integrating Multiple Genome Data to Predict Disease-Causing Nonsynonymous Single Nucleotide Variants in Exome Sequence Studies
SwissProt STRING PFAM KEGG
41 A Text-Mining Analysis on the Human Phenome
UniProt OMIM PFAM GO GOA

75
Appendix B: Frequency of Using Bioinformatics Tools to Complete Different
Categories of Initial List Analysis
(Name of Tool (Frequency of Use)
Gene Ontology Terms:
Bibliosphere
(1)
DAVID (4) TAIR (1) ErmineJ (1) FatiGO (1)
G:Profiler (1) GATHER (1) GeneCards (1) GeneCodis GOToolbox
(5)
GO (6) GOA (1) GOEAT (1) GOTM (3) GSEA (1)
MAPPFinder
(1)
MetaCore (1) WebGestalt (3) TopFunn (1)
Biological Pathways
BioCarta (1) DAVID (4) ConsensusPathDB
(1)
G:Profiler (1)
GATHER (1) GeneCodis (1) GSEA (1) Ingenuity (3)
Invitrogen iPath (1) KEGG (5) MetaCore (2) Onto-Express (1)
Reactome (1) SigPathway (1) ToppFun (1) WebGestalt (1)
Protein-Protein Interactions
DIP (1) HPRD (3) Intact (1) IRefIndex (1)
MINT (1) OPHID (2) Reactome (1) STRING (2)
Protein Domains
InterPro (1) PFAM (2)
Disease Associations
OMIM (3) OPHID (1) Swiss-Prot (1)
BioMart (1) DAVID (1) HPRD (1)

76
Text-Mining
Chilibot (1) Ensembl (1) NCBI Entrez Gene (4)
NCBI dbSNP (1) GeneRIF (1) OMIM (2)
PubMed (3) Swiss-Prot (1) UniProt (3)
Polysearch (1) Candid (1) Phenopred (1)
Transcription Factors Binding Sites
GSEA (1) oPOSSUM (1)
Functional Annotation of Gene Sets:
BioGPS (1) DAVID (15) EASE (1)
GSEA (1) Onto-Express (1) WebGestalt (1)

77
Appendix C: Comprehensive Functional Analysis of Large Gene Lists Using
DAVID “A step-by-step Guide”
DAVID Computational Infrastructure:
The DAVID bioinformatics tools and resources are built on Tomcat web server in a
Linux machine (4-CPU for 3.5 GHz speed, 8 GB memory) where the server
components are written in Java, and the performance of web services is monitored by
a set of automated programs. [98]
Requirements and Setup:
DAVID’s software was designed based on software engineering best practices and
requires no special configuration and installation in the user’s computer. A user
equipped with a computer that has a standard web bowser and high-speed Internet
connection can easily access all DAVID tools. However, in order to get the best of
DAVID web-based applications, it is recommended to use Microsoft Internet
Explorer or Firefox in a Windows XP environment. [98]
The only required input for all DAVID analytic tools is a list of gene identifiers that
can be uploaded in one of the following formats:
1- A list of one gene identifier per line that can be copied and pasted into the
Gene List Manager textbox.
2- A list of comma-delimited gene identifier in one line that can be copied and
pasted into the Gene List Manager textbox.
3- A tab-delimited text file that can contain up to two columns, where gene
identifiers must be inserted in the first column and other types of information
can be optionally added to the second column.
All results generated by DAVID are contained in HTML tables that can be explored
on the web browser, downloaded as flat text files, saved in Microsoft Excel Format or
directly pasted in Microsoft Word and Microsoft Excel.

78
Application of DAVID
I. Gene List Submission:
The list of gene known to cause congenital cataract was submitted to DAVID using
the activities listed below:
1. Go to the official DAVID website at: http://david.abcc.ncifcrf.gov/
2. Click on Start Analysis on the website header.
3. Upload the gene list to the Gene List Manager by performing the following
steps:
1.1. Copy and paste the list of gene identifiers into the first text box or use the
second box to upload a text file that includes the gene identifiers.
1.2. Select the Official_Gene_Symbol as the gene identifier type.
1.3. Specify the type of list to be uploaded as a Gene List.
1.4. Click on Submit List.
4. Select the Homo Sapiens as the type of background species to limit annotation.
II. Application of DAVID Gene Functional Annotation Tool:
The list of gene was functionally analyzed by selecting the Functional Annotation
Tool from the listed DAVID tools. This results in two major tables, which are: the
Annotation Summary Results Tables, and the Functional Annotation Chart Table. A
detailed description of the fields and contents of each table is provided below.
The Annotation Summary Results Tables:
The annotation summary results consist of ten HTML tables that represent
different annotation categories, which are: Disease, Functional Categories, Gene
Ontology, General Annotation, Literature, Main Accession, Pathways, Protein
Domains, Protein Interactions and Tissue Expression. Each HTML table consists
of the following fields:
1. Annotation source: some annotation sources are recommended by DAVID and
thus checked as defaults.
2. Percentage of involved genes.
3. Number of involved genes.
4. Chart button: a separate chart report for every annotation source is displayed by
clicking on this button.
5. A graphical display of the number of involved genes.

79
Figure: Description of The Annotation Summary Results Table [101]
The Functional Annotation Chart Table:
The functional annotation chart of each annotation source can be displayed by
clicking on the Chart button corresponding to the source of interest. The resulting
table provides statistical information about enriched annotation terms associated
with our gene list that are represented in the following fields:
1. Category: a general item that groups similar biological sources.
2. Term: a descriptive item that belongs to an annotation source.
3. RT: a separate list of functionally related genes is displayed by clicking on
this link
4. Genes: a separate list of involved genes is displayed by clicking on this link
5. Count: Number of involved genes
6. Percentage: Percentage of involved genes
7. P-Value: an EASE score that examines the importance of gene-term
enrichment. The smaller the P-Value, the more important it is.

80
Figure: Description of The Functional Annotation Chart Table [101]
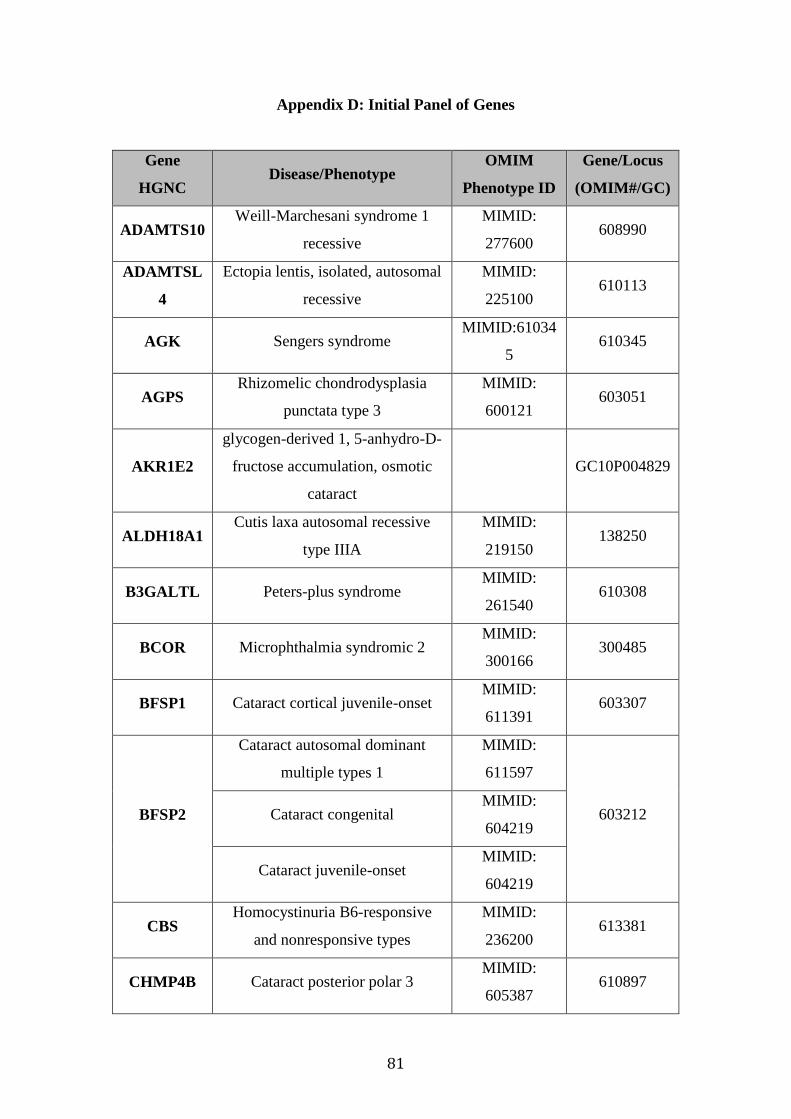
81
Appendix D: Initial Panel of Genes
Gene
HGNC Disease/Phenotype
OMIM
Phenotype ID
Gene/Locus
(OMIM#/GC)
ADAMTS10 Weill-Marchesani syndrome 1
recessive
MIMID:
277600 608990
ADAMTSL
4
Ectopia lentis, isolated, autosomal
recessive
MIMID:
225100 610113
AGK Sengers syndrome MIMID:61034
5 610345
AGPS Rhizomelic chondrodysplasia
punctata type 3
MIMID:
600121 603051
AKR1E2
glycogen-derived 1, 5-anhydro-D-
fructose accumulation, osmotic
cataract
GC10P004829
ALDH18A1 Cutis laxa autosomal recessive
type IIIA
MIMID:
219150 138250
B3GALTL Peters-plus syndrome MIMID:
261540 610308
BCOR Microphthalmia syndromic 2 MIMID:
300166 300485
BFSP1 Cataract cortical juvenile-onset MIMID:
611391 603307
BFSP2
Cataract autosomal dominant
multiple types 1
MIMID:
611597
603212 Cataract congenital MIMID:
604219
Cataract juvenile-onset MIMID:
604219
CBS Homocystinuria B6-responsive
and nonresponsive types
MIMID:
236200 613381
CHMP4B Cataract posterior polar 3 MIMID:
605387 610897

82
COL18A1 Knobloch syndrome type 1 MIMID:
267750 120328
COL2A1 Stickler syndrome type I MIMID:
108300 120140
COL4A1 Brain small vessel disease with
Axenfeld-Rieger anomaly
MIMID:
607595 120130
COL11A1
Marshall Syndrome MIMID:
154780 120280
Stickler syndrome MIMID:
604841
CRYAA
Cataract, autosomal dominant
nuclear
123580 Cataract, congenital, autosomal
recessive
CRYAB
Cataract posterior polar 2 MIMID:
613763 123590
Myopathy myofibrillar alpha-B
crystallin-related
MIMID:
608810
CRYBA1 Cataract congenital zonular with
sutural opacities
MIMID:
600881 123610
CRYBA4
Microphthalmia with cataract 4 MIMID:61042
6 123631
Cataract lamellar 2 MIMID:
610425
CRYBB1 Cataract congenital nuclear
autosomalrecessive 3
MIMID:
611544 600929
CRYBB2
Cataract sutural withpunctate and
cerulean opacities
MIMID:
607133
123620 Cataract Coppock-like MIMID:
604307
Cataract cerulean type 2 MIMID:
601547
CRYBB3 Cataract congenital nuclear 2 MIMID: 123630
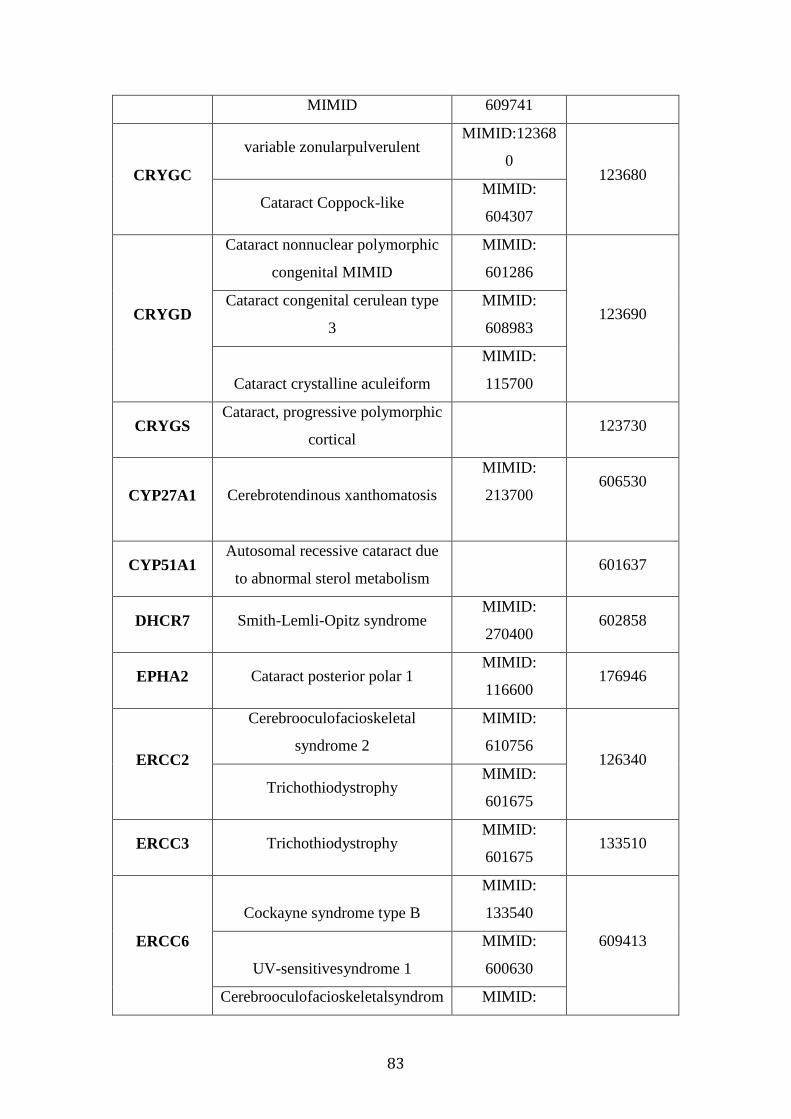
83
MIMID 609741
CRYGC
variable zonularpulverulent MIMID:12368
0 123680
Cataract Coppock-like MIMID:
604307
CRYGD
Cataract nonnuclear polymorphic
congenital MIMID
MIMID:
601286
123690 Cataract congenital cerulean type
3
MIMID:
608983
Cataract crystalline aculeiform
MIMID:
115700
CRYGS Cataract, progressive polymorphic
cortical 123730
CYP27A1 Cerebrotendinous xanthomatosis
MIMID:
213700
606530
CYP51A1 Autosomal recessive cataract due
to abnormal sterol metabolism 601637
DHCR7 Smith-Lemli-Opitz syndrome MIMID:
270400 602858
EPHA2 Cataract posterior polar 1 MIMID:
116600 176946
ERCC2
Cerebrooculofacioskeletal
syndrome 2
MIMID:
610756 126340
Trichothiodystrophy MIMID:
601675
ERCC3 Trichothiodystrophy MIMID:
601675 133510
ERCC6
Cockayne syndrome type B
MIMID:
133540
609413
UV-sensitivesyndrome 1
MIMID:
600630
Cerebrooculofacioskeletalsyndrom MIMID:

84
e 1 214150
ERCC8
Cockayne syndrome type A
MIMID
MIMID:
216400 609412
UV-sensitive syndrome 2
MIMID:61462
1
EYA1
Anterior segment anomalies with
or without cataract
MIMID:
113650 601653
Branchiootorenal syndrome 1 with
or without cataracts
MIMID:
113650
FAM126A Leukodystrophy hypomyelinating
5 MIMID
MIMID:
610532 610531
FBN1
Ectopia lentis familial MIMID:
129600
134797 Marfan syndrome
MIMID:
154700
Weill-Marchesani syndrome 2
dominant
MIMID:
608328
FKRP
Muscular dystrophy-
dystroglycanopathy (congenital
with brain and eyeanomalies) type
A 5
MIMID:
613153 606596
FKTN
Muscular dystrophy-
dystroglycanopathy (congenital
with brain and eye anomalies) type
A 4
MIMID:
253800 607440
FOXC1 Axenfeld-Rieger syndrome type 3 MIMID:
602482 601090
FOXD3
Anterior segment dysgenesis MIMID:
107250 611539
Peter’s anomaly MIMID:
604229
FOXE3 Aphakia congenital primary
MIMID:
610256 601094
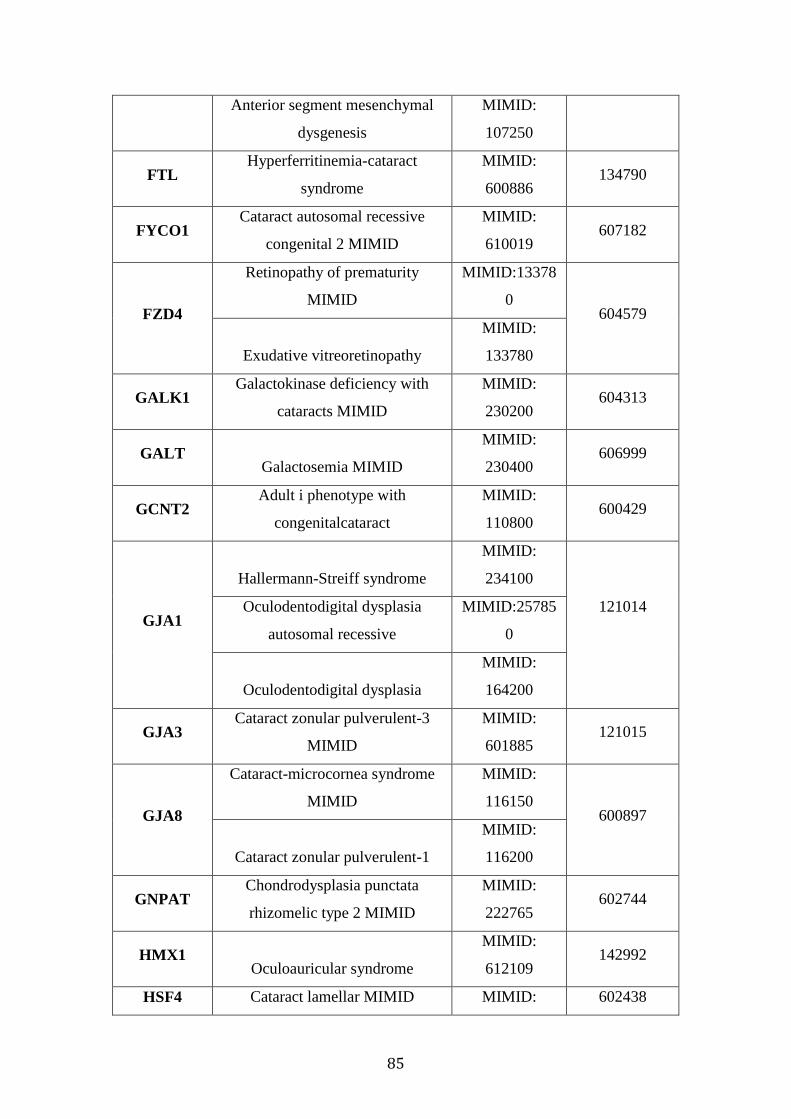
85
Anterior segment mesenchymal
dysgenesis
MIMID:
107250
FTL Hyperferritinemia-cataract
syndrome
MIMID:
600886 134790
FYCO1 Cataract autosomal recessive
congenital 2 MIMID
MIMID:
610019 607182
FZD4
Retinopathy of prematurity
MIMID
MIMID:13378
0 604579
Exudative vitreoretinopathy
MIMID:
133780
GALK1 Galactokinase deficiency with
cataracts MIMID
MIMID:
230200 604313
GALT Galactosemia MIMID
MIMID:
230400 606999
GCNT2 Adult i phenotype with
congenitalcataract
MIMID:
110800 600429
GJA1
Hallermann-Streiff syndrome
MIMID:
234100
121014
Oculodentodigital dysplasia
autosomal recessive
MIMID:25785
0
Oculodentodigital dysplasia
MIMID:
164200
GJA3 Cataract zonular pulverulent-3
MIMID
MIMID:
601885 121015
GJA8
Cataract-microcornea syndrome
MIMID
MIMID:
116150 600897
Cataract zonular pulverulent-1
MIMID:
116200
GNPAT Chondrodysplasia punctata
rhizomelic type 2 MIMID
MIMID:
222765 602744
HMX1 Oculoauricular syndrome
MIMID:
612109 142992
HSF4 Cataract lamellar MIMID MIMID: 602438

86
116800
Cataract Marner type
MIMID:
116800
JAM3
Hemorrhagic destruction of the
brain, subependymal calcification,
and cataracts
MIMID:
613730 606871
LARGE
Muscular dystrophy-
dystroglycanopathy (congenital
with brain and eyeanomalies) type
A 6
MIMID:
613154 603590
LMX1B Nail-patella syndrome MIMID
MIMID:
161200 602575
LRP5 Osteoporosis-pseudoglioma
syndrome
MIMID:
259770 603506
LTBP2
Microspherophakiaand/or
megalocornea with ectopia lentis
and with or without secondary
glaucoma
MIMID:
251750 602091
MAF
Cataract pulverulent or cerulean
with or without microcornea
MIMID
MIMID:61020
2
177075
MAN2B1 Mannosidosis alpha- types I and II
MIMID
MIMID:
248500 609458
MFSD6L Neuronal ceroid lipofucinosis
GC17M00870
0
MIP Cataract polymorphic and lamellar
MIMID:
604219 154050
MIR184 EDICT syndrome MIMID
MIMID:
614303 613146
MYH9 Epstein syndrome MIMID
MIMID:
153650 160775
Fechtner syndrome
MIMID:
153640

87
NDP Norrie Disease MIMID:
310600 300658
NF2 Neurofibromatosis type 2 MIMID
MIMID:
101000 607379
NHS Nance-Horan syndrome MIMID
MIMID:
302350 300457
Cataract congenital X-linked
MIMID:30220
0
OCRL Lowe syndrome
MIMID:
309000 300535
OPA3 Optic atrophy3 with cataract
MIMID
MIMID:
165300 606580
PAX6
Cataract with late-onset corneal
dystrophy
MIMID:
604219 607108
Peters anomaly
MIMID:
604229
PEX1
Peroxisome biogenesis disorder
1A (Zellweger)
MIMID:
214100
602136 Refsum disease infantile
MIMID:
266510
Adrenoleukodystrophy neonatal
MIMID:20237
0
PEX12 Peroxisome biogenesis disorder
3A (Zellweger)
MIMID:
614859 601758
PEX13
Peroxisome biogenesis disorder
11A (Zellweger)
MIMID:
614883 601789
Adrenoleukodystrophy neonatal
MIMID:20237
0
PEX16 Peroxisome biogenesis disorder
8A, (Zellweger)
MIMID:
614876
603360
PEX2 Peroxisome biogenesis disorder MIMID: 170993

88
5A, (Zellweger) 614866
PEX26
Adrenoleukodystrophy neonatal
MIMID
MIMID:
202370
608666 Peroxisome biogenesis disorder
7A (Zellweger)
MIMID:
614872
Refsum disease infantile
MIMID:
266510
PEX3 Peroxisome biogenesis disorder
10A (Zellweger)
MIMID:
614822 603164
PEX6 Peroxisome biogenesis disorder
4A (Zellweger)
MIMID:
614862 601498
PEX7 Rhizomelic chondrodysplasia
punctata type 1
MIMID:
215100 601757
PEX5L Peroxisome biogenesis disorder
MIMID:
611058
PEX10 Peroxisome biogenesis disorder MIMID:
602859 614870
PEX11β Peroxisome biogenesis disorder MIMID:
603867 614920
PEX14 Peroxisome biogenesis disorder MIMID:
601791 614887
PEX19 Peroxisome biogenesis disorder MIMID:
600279 614886
PITX2 Peters anomaly MIMID
MIMID:
604229 601542
Iridogoniodysgenesis type 2
MIMID:
137600
PITX3 Cataract posterior polar 4
MIMID:
610623 602669
Anterior segment mesenchymal
dysgenesis
MIMID:
107250
POMT1 Muscular dystrophy-
dystroglycanopathy (congenital
MIMID:
236670 607423

89
with brain and eyeanomalies) type
A 1 MIMID
POMT2
Muscular dystrophy-
dystroglycanopathy (congenital
with brain and eyeanomalies) type
A 2
MIMID:
613150 607439
PVRL3 Severe bilateral congenital cataract 607147
PXDN Congenital cataract, corneal
opacity, developmental glaucoma 605158
RAB18 Warburg micro syndrome 3
MIMID:
614222 602207
RAB3GAP1 Warburg micro syndrome 1
MIMID:
600118 602536
RAB3GAP2 Martsolf syndrome MIMID
MIMID:
212720 609275
Warburg micro syndrome 2
MIMID:
614225
RECQL2 Werner syndrome MIMID:
277700 604611
RECQL4 Rothmund-Thomson syndrome
MIMID:
268400 603780
RNLS Congenital cataract, autosomal
recessive 609360
SC5DL Lathosterolosis
MIMID:
607330 602286
SEC23A Craniolenticulosutural dysplasia
MIMID:
607812 610511
SIL1 Marinesco-Sjogren syndrome
MIMID:
248800 608005
SIX5 Branchiootorenal syndrome 2
MIMID
MIMID:
610896 600963
SIX6 Microphthalmia with cataract 2
MIMID
MIMID:
212550 606326
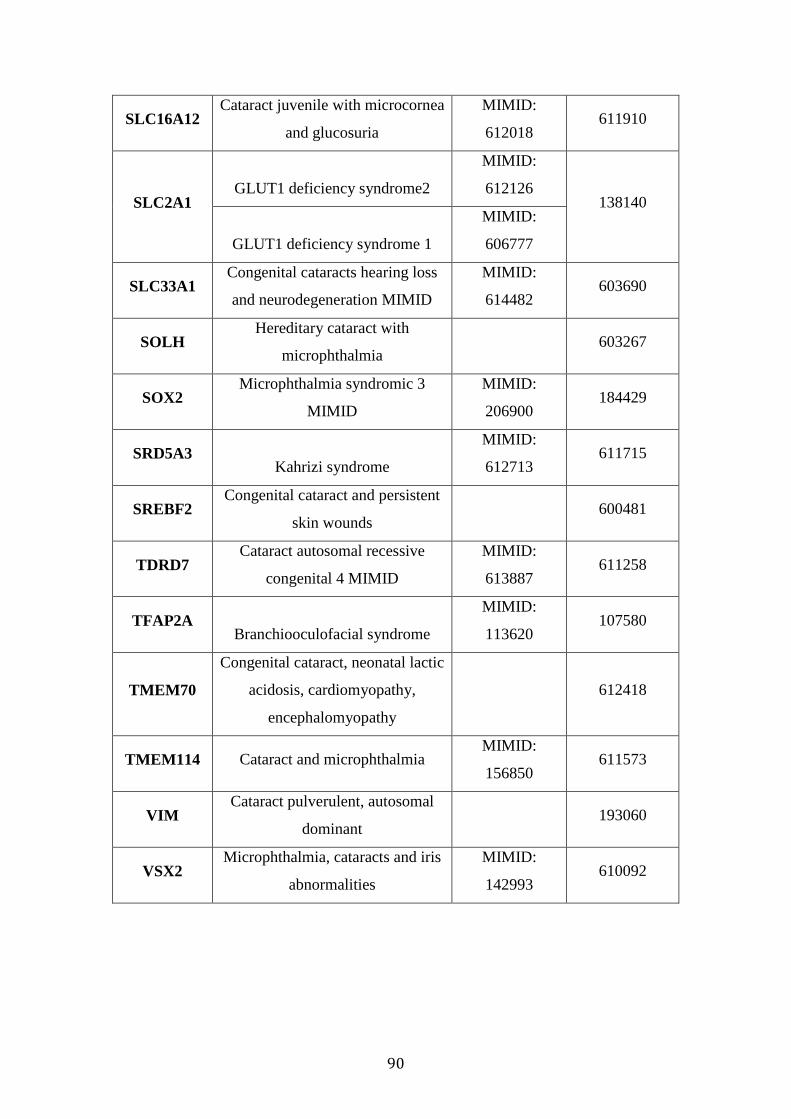
90
SLC16A12 Cataract juvenile with microcornea
and glucosuria
MIMID:
612018 611910
SLC2A1 GLUT1 deficiency syndrome2
MIMID:
612126 138140
GLUT1 deficiency syndrome 1
MIMID:
606777
SLC33A1 Congenital cataracts hearing loss
and neurodegeneration MIMID
MIMID:
614482 603690
SOLH Hereditary cataract with
microphthalmia 603267
SOX2 Microphthalmia syndromic 3
MIMID
MIMID:
206900 184429
SRD5A3 Kahrizi syndrome
MIMID:
612713 611715
SREBF2 Congenital cataract and persistent
skin wounds 600481
TDRD7 Cataract autosomal recessive
congenital 4 MIMID
MIMID:
613887 611258
TFAP2A Branchiooculofacial syndrome
MIMID:
113620 107580
TMEM70
Congenital cataract, neonatal lactic
acidosis, cardiomyopathy,
encephalomyopathy
612418
TMEM114 Cataract and microphthalmia MIMID:
156850 611573
VIM Cataract pulverulent, autosomal
dominant 193060
VSX2 Microphthalmia, cataracts and iris
abnormalities
MIMID:
142993 610092
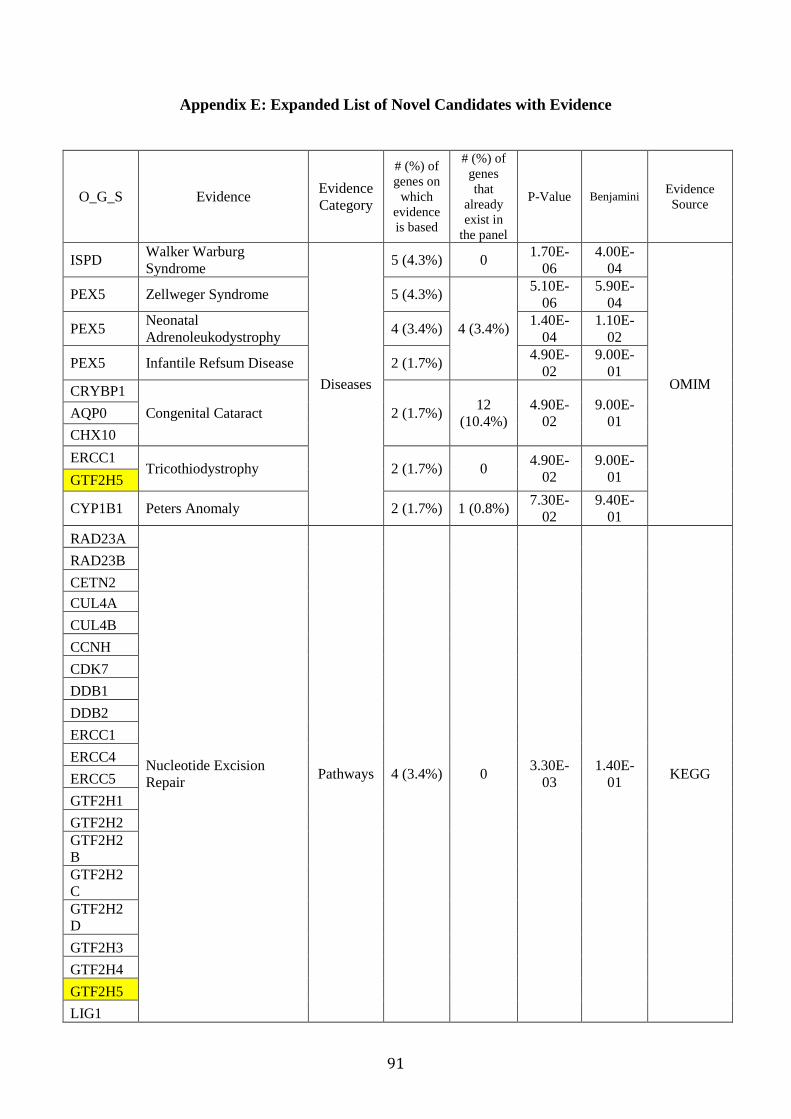
91
Appendix E: Expanded List of Novel Candidates with Evidence
O_G_S Evidence Evidence
Category
# (%) of
genes on
which
evidence
is based
# (%) of
genes
that
already
exist in
the panel
P-Value Benjamini Evidence
Source
ISPD Walker Warburg
Syndrome
Diseases
5 (4.3%) 0 1.70E-
06
4.00E-
04
OMIM
PEX5 Zellweger Syndrome 5 (4.3%)
4 (3.4%)
5.10E-
06
5.90E-
04
PEX5 Neonatal
Adrenoleukodystrophy 4 (3.4%)
1.40E-
04
1.10E-
02
PEX5 Infantile Refsum Disease 2 (1.7%) 4.90E-
02
9.00E-
01
CRYBP1
Congenital Cataract 2 (1.7%) 12
(10.4%)
4.90E-
02
9.00E-
01 AQP0
CHX10
ERCC1 Tricothiodystrophy 2 (1.7%) 0
4.90E-
02
9.00E-
01 GTF2H5
CYP1B1 Peters Anomaly 2 (1.7%) 1 (0.8%) 7.30E-
02
9.40E-
01
RAD23A
Nucleotide Excision
Repair Pathways 4 (3.4%) 0
3.30E-
03
1.40E-
01 KEGG
RAD23B
CETN2
CUL4A
CUL4B
CCNH
CDK7
DDB1
DDB2
ERCC1
ERCC4
ERCC5
GTF2H1
GTF2H2
GTF2H2
B
GTF2H2
C
GTF2H2
D
GTF2H3
GTF2H4
GTF2H5
LIG1

92
MNAT1
POLD1
POLD2
POLD3
POLD4
POLE
POLE2
POLE3
POLE4
RFC1
RFC2
RFC3
RFC4
RFC5
RPA1
RPA2
RPA3
RPA4
RBX1
XPA
XPC
DHCR24
Steroid Biosynthesis 3 (2.6%) 0 5.90E-
03
1.30E-
01
NSDHL
CEL
CYP27B1
EBP
FDFT1
HSD17B7
LSS
LIPA
SQIE
SOAT1
SOAT2
SC4MOL
TM7SF2
POMGN
T1
O-Mannosyl Glycan
Biosynthesis 2 (1.7%) 0
2.10E-
02
2.70E-
01
GALE
Leloir Pathway of
Galactose Metabolism 2 (1.7%) 0
1.70E-
02
1.50E-
02
BIOCART
A

93
Appendix F: A Fine-tuned Version of the Expanded List
O_G_S
HUGO
Approve
d
Symbol
Link Approved Name MIM
Accession
Disease
Phenotype HGNC ID Location
RefSeq
mRNA ID
ISPD ISPD ISPD
isoprenoid synthase
domain containing 614631
Muscular
dystrophy-
dystroglycan
opathy
(congenital
with brain
and eye
anomalies),
type A, 7
HGNC:37276 7p21.2 NM_0011014
26
NM_0011014
17
CCNH CCNH CCNH cyclin H 601953
HGNC:1594 5q13.3-q14 NM_001239
NM_0011991
89
CDK7 CDK7 CDK7
cyclin-dependent
kinase 7 601953
HGNC:1778
5q12.1 NM_001799
CEL CEL CEL carboxyl ester lipase 114840
Maturity-
onset
diabetes of
the young,
type VIII
HGNC:1848
9q34.3 NM_001807
CETN2 CETN2 CETN2
centrin, EF-hand
protein, 2 300006
HGNC:1867
Xq28 NM_004344
CUL4A CUL4
A
CUL4
A
cullin 4A 603137
HGNC:2554
13q34 NM_0010088
95
NM_0012785
13
NM_003589
NM_0012785
14
CUL4B CUL4B CUL4B cullin 4B 300304
Mental
retardation,
X-linked,
syndromic
15 (Cabezas
type)
HGNC:2555
Xq23 NM_0010798
72
NM_003588
CYP1B1 CYP1B
1
CYP1B
1
cytochrome P450,
family 1, subfamily
B, polypeptide 1
601771
Glaucoma
3A, primary
open angle,
congenital,
juvenile, or
adult onset,
Peter's
Anomaly
HGNC:2597
2p22.2 NM_000104
CYP27B
1
CYP27
B1
CYP27
B1
cytochrome P450,
family 27, subfamily
B, polypeptide 1
609506
Vitamin D-
dependent
rickets, type
I
HGNC:2606
12q14.1 NM_000785
DDB1 DDB1 DDB1
damage-specific
DNA binding protein
1, 127kDa
600045
HGNC:2717
11q12-q13 NM_001923

94
DDB2 DDB2 DDB2
damage-specific
DNA binding protein
2, 48kDa
600811
Xeroderma
pigmentosu
m, group E,
DDB-
negative
subtype
HGNC:2718
11p12-p11 NM_000107
DHCR24 DHCR
24
DHCR
24
24-
dehydrocholesterol
reductase
606418
Desmosterol
osis HGNC:2859
1p32.3 NM_014762
EBP EBP EBP
emopamil binding
protein (sterol
isomerase)
300205
Chondrodys
plasia
punctata, X-
linked
dominant
HGNC:3133
Xp11.23-p11.22
NM_006579
ERCC1 ERCC1 ERCC1
excision repair cross-
complementation
group 1
126380
Cerebroocul
ofacioskeleta
l syndrome 4
HGNC:3433
19q13.32 NM_001983
NM_0011660
49
NM_202001
ERCC4 ERCC4 ERCC4
excision repair cross-
complementation
group 4
133520
Xeroderma
pigmentosu
m, type
F/Cockayne
syndrome
HGNC:3436
16p13.3 NM_005236
ERCC5 ERCC5 ERCC5
excision repair cross-
complementation
group 5
133530
Xeroderma
pigmentosu
m, group
G/Cockayne
syndrome
HGNC:3437
13q22-q34 NM_000123
FDFT1 FDFT1 FDFT1
farnesyl-diphosphate
farnesyltransferase 1 184420
HGNC:3629
8p23.1-p22 NM_004462
NM_0012877
48
NM_0012877
43
NM_0012877
42
NM_0012877
47
NM_0012877
51
NM_0012877
44
GALE GALE GALE
UDP-galactose-4-
epimerase 606953
Galactose
epimerase
deficiency
HGNC:4116
1p36-p35 NM_0010082
16
NM_0011276
21
NM_000403
GTF2H1 GTF2H
1
GTF2H
1
general transcription
factor IIH,
polypeptide 1, 62kDa
189972
HGNC:4655
11p15.1-
p14
NM_0011423
07
NM_005316
GTF2H2 GTF2H
2
GTF2H
2
general transcription
factor IIH,
polypeptide 2, 44kDa
601748
HGNC:4656
5q13.2 NM_001515
GTF2H2
B
GTF2H
2B
GTF2H
2B
general transcription
factor IIH,
polypeptide 2B
HGNC:31393
5q13.2

95
(pseudogene)
GTF2H2
C
GTF2H
2C
GTF2H
2C
GTF2H2 family
member C HGNC:31394
5q13.2 NM_0010987
28
GTF2H2
D
GTF2H
2C_2
GTF2H
2C_2
GTF2H2 family
member C, copy 2 HGNC:35418
5q13.2
alternate reference
locus
GTF2H3 GTF2H
3
GTF2H
3
general transcription
factor IIH,
polypeptide 3, 34kDa
601750
HGNC:4657
12q24.31 NM_0012718
67
NM_0012718
68
NM_001516
NM_0012718
66
GTF2H4 GTF2H
4
GTF2H
4
general transcription
factor IIH,
polypeptide 4, 52kDa
601760
HGNC:4658
6p21.3 NM_001517
GTF2H5 GTF2H
5
GTF2H
5
general transcription
factor IIH,
polypeptide 5
608780
Trichothiody
strophy,
complement
ation group
A
HGNC:21157
6q25.3 NM_207118
CRYBP1 HIVEP
1
HIVEP
1
human
immunodeficiency
virus type I enhancer
binding protein 1
194540
HGNC:4920
6p24-p22.3 NM_002114
HSD17B
7
HSD17
B7
HSD17
B7
hydroxysteroid (17-
beta) dehydrogenase
7
606756
HGNC:5215
1q23 NM_016371
LIG1 LIG1 LIG1
ligase I, DNA, ATP-
dependent 126391
DNA ligase I
deficiency HGNC:6598
19q13.2-
q13.3 NM_000234
LIPA LIPA LIPA
lipase A, lysosomal
acid, cholesterol
esterase
613497
Cholesteryl
ester storage
disease
HGNC:6617
10q23.2-
q23.3 NM_000235
Wolman
disease NM_0011276
05
LSS LSS LSS
lanosterol synthase
(2,3-oxidosqualene-
lanosterol cyclase)
600909
HGNC:6708
21q22.3 NM_002340
NM_0011454
36
NM_0011454
37
AQP0 MIP MIP
major intrinsic
protein of lens fiber 154050
Cataract 15,
multiple
types
HGNC:7103
12q13 NM_012064
MNAT1 MNAT
1
MNAT
1
MNAT CDK-
activating kinase
assembly factor 1
602659
HGNC:7181
14q23 NM_002431
NM_0011779
63
SC4MO
L
MSMO
1
MSMO
1
methylsterol
monooxygenase 1 607545
HGNC:10545
4q32-q34 NM_006745
NM_0010173
69
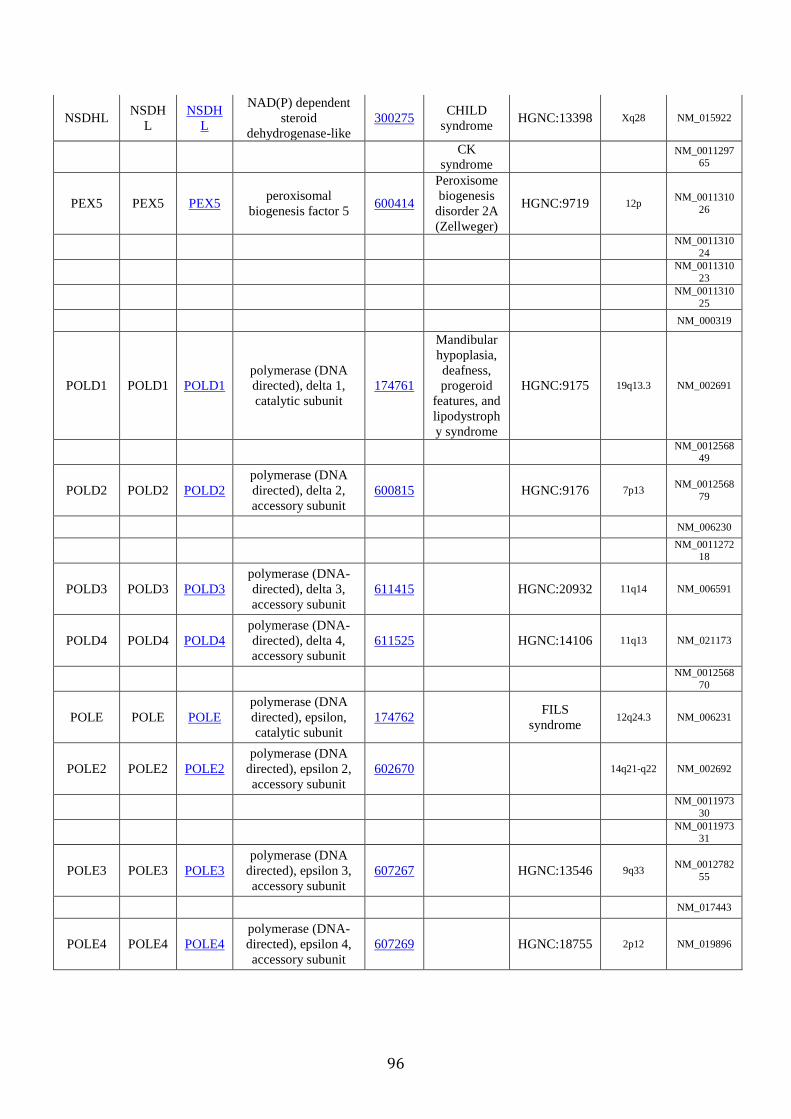
96
NSDHL NSDH
L
NSDH
L
NAD(P) dependent
steroid
dehydrogenase-like
300275
CHILD
syndrome HGNC:13398
Xq28 NM_015922
CK
syndrome NM_0011297
65
PEX5 PEX5 PEX5
peroxisomal
biogenesis factor 5 600414
Peroxisome
biogenesis
disorder 2A
(Zellweger)
HGNC:9719
12p NM_0011310
26
NM_0011310
24
NM_0011310
23
NM_0011310
25
NM_000319
POLD1 POLD1 POLD1
polymerase (DNA
directed), delta 1,
catalytic subunit
174761
Mandibular
hypoplasia,
deafness,
progeroid
features, and
lipodystroph
y syndrome
HGNC:9175 19q13.3 NM_002691
NM_0012568
49
POLD2 POLD2 POLD2
polymerase (DNA
directed), delta 2,
accessory subunit
600815
HGNC:9176 7p13
NM_0012568
79
NM_006230
NM_0011272
18
POLD3 POLD3 POLD3
polymerase (DNA-
directed), delta 3,
accessory subunit
611415
HGNC:20932 11q14 NM_006591
POLD4 POLD4 POLD4
polymerase (DNA-
directed), delta 4,
accessory subunit
611525
HGNC:14106 11q13 NM_021173
NM_0012568
70
POLE POLE POLE
polymerase (DNA
directed), epsilon,
catalytic subunit
174762
FILS
syndrome 12q24.3 NM_006231
POLE2 POLE2 POLE2
polymerase (DNA
directed), epsilon 2,
accessory subunit
602670
14q21-q22 NM_002692
NM_0011973
30
NM_0011973
31
POLE3 POLE3 POLE3
polymerase (DNA
directed), epsilon 3,
accessory subunit
607267
HGNC:13546 9q33
NM_0012782
55
NM_017443
POLE4 POLE4 POLE4
polymerase (DNA-
directed), epsilon 4,
accessory subunit
607269
HGNC:18755 2p12 NM_019896

97
POMGN
T1
POMG
NT1
POMG
NT1
protein O-linked
mannose N-
acetylglucosaminyltra
nsferase 1 (beta 1,2-)
606822
Muscular
dystrophy-
dystroglycan
opathy
(congenital
with brain
and eye
anomalies),
type A, 3
HGNC:19139 1p34.1 NM_017739
NM_0012437
66
RAD23A RAD23
A
RAD23
A
RAD23 homolog A
(S. cerevisiae) 600061
HGNC:9812 19p13.2 NM_005053
NM_0012703
62
NM_0012703
63
RAD23B RAD23
B
RAD23
B
RAD23 homolog B
(S. cerevisiae) 600062
HGNC:9813 9q31.2 NM_002874
RBX1 RBX1 RBX1
ring-box 1, E3
ubiquitin protein
ligase
603814
HGNC:9928 22q13.2 NM_014248
RFC1 RFC1 RFC1
replication factor C
(activator 1) 1,
145kDa
102579
HGNC:9969 4p14-p13 NM_002913
NM_0012047
47
RFC2 RFC2 RFC2
replication factor C
(activator 1) 2, 40kDa 600404
HGNC:9970 7q11.23 NM_002914
NM_0012787
93
NM_0012787
92
NM_181471
NM_0012787
91
RFC3 RFC3 RFC3
replication factor C
(activator 1) 3, 38kDa 600405
HGNC:9971 13q13.2 NM_002915
NM_181558
RFC4 RFC4 RFC4
replication factor C
(activator 1) 4, 37kDa 102577
HGNC:9972 3q27 NM_002916
NM_181573
RFC5 RFC5 RFC5
replication factor C
(activator 1) 5,
36.5kDa
600407
HGNC:9973 12q24.3 NM_007370
NM_0012068
01
NM_181578
NM_0011301
12
RPA1 RPA1 RPA1
replication protein
A1, 70kDa 179835
HGNC:10289 17p13.3 NM_002945
RPA2 RPA2 RPA2
replication protein
A2, 32kDa 179836
HGNC:10290 1p35 NM_002946
RPA3 RPA3 RPA3
replication protein
A3, 14kDa 179837
HGNC:10291 7p21.3 NM_002947
RPA4 RPA4 RPA4
replication protein
A4, 30kDa 300767
HGNC:30305 Xq21 NM_013347

98
SOAT1 SOAT1 SOAT1
sterol O-
acyltransferase 1 102642
HGNC:11177 1q25 NM_003101
NM_0012525
11
NM_0012525
12
SOAT2 SOAT2 SOAT2
sterol O-
acyltransferase 2 601311
HGNC:11178 12q13.13 NM_003578
SQIE SQIE
TM7SF2 TM7SF
2
TM7SF
2
transmembrane 7
superfamily member
2
603414
HGNC:11863 11q13.1 NM_003273
NM_0012772
33
CHX10 VSX2 VSX2
visual system
homeobox 2 142993
Microphthal
mia with
coloboma 3
HGNC:1975 14q24.3 NM_182894
XPA XPA XPA
xeroderma
pigmentosum,
complementation
group A
611153
Xeroderma
pigmentosu
m, group A
HGNC:12814 9q22.3 NM_000380
XPC XPC XPC
xeroderma
pigmentosum,
complementation
group C
613208
Xeroderma
pigmentosu
m, group
HGNC:12816 3p25 NM_004628
NM_0011457
69

99
Appendix G: Missing Novel Related Genes
O_G_S Link
AQP1
AQP5
UNC45B http://www.ncbi.nlm.nih.gov/pubmed/24549050 (dominant juvenile cataract)
CTDP1 http://www.ncbi.nlm.nih.gov/pubmed/24690360 (CCFDN syndrome)
LEPREL1 http://www.ncbi.nlm.nih.gov/pubmed/24172257(high myopia and early onset cataract)
TBC1D20 http://www.ncbi.nlm.nih.gov/pubmed/24239381(Warburg Micro syndrome)
CDS http://www.ncbi.nlm.nih.gov/pubmed/24385758 (Chanarin-dorfman syndrome)
COL4A6
CRYBA2 http://www.ncbi.nlm.nih.gov/pubmed/23508780 (adCC)
CPOX http://www.ncbi.nlm.nih.gov/pubmed/23631845
GBA2 http://www.ncbi.nlm.nih.gov/pubmed/23332916
EPHA5 http://www.ncbi.nlm.nih.gov/pubmed/23401654
EPHA2
EPHA3
EPHA6
EPG5 http://www.ncbi.nlm.nih.gov/pubmed/23222957
FOXP1
UHRF1


![[Talal Asad] Genealogies of Religion Discipline](https://static.fdocuments.us/doc/165x107/55cf8e33550346703b8f9d84/talal-asad-genealogies-of-religion-discipline.jpg)


