Wed GS - Insurance Conditions v04 › ... › 2018_07-16_07-19 › Insurance_Condit… ·...
21
1 Sean Kevelighan President and Chief Executive Officer Insurance Information Institute 2018 ECONOMIC AND INSURANCE MARKET CONDITIONS I.I.I. MISSION Improving public understanding of insurance... …what it does and how it works
Transcript of Wed GS - Insurance Conditions v04 › ... › 2018_07-16_07-19 › Insurance_Condit… ·...

1
Sean KevelighanPresident and Chief Executive Officer
Insurance Information Institute
2 0 1 8 E C O N O M I C A N D I N S U R A N C E M A R K E T C O N D I T I O N S
I . I . I . M I S S I O N
Improving public understanding of insurance...
…what it does and how it works
2
D I S R U P T I V E F O R C E S I N T H E W O R L D
Catastrophes
Geopolitical Technology
Economics
2 0 1 7 : A R E C O R D Y E A R O F C ATA S T R O P H E L O S S E S
$14 billion insured wildfire losses;
California estimated ~$11 billion
Thunderstorm-related losses 2nd
highest ever in US
Flooding events spurred 73% of federal disaster
declarations
N.A. hurricane season record-
breaking insured & economic losses; disasters affected
>25 million Americans
Auto: reaching epidemic proportions
Cyber: risk continuing to increase
3
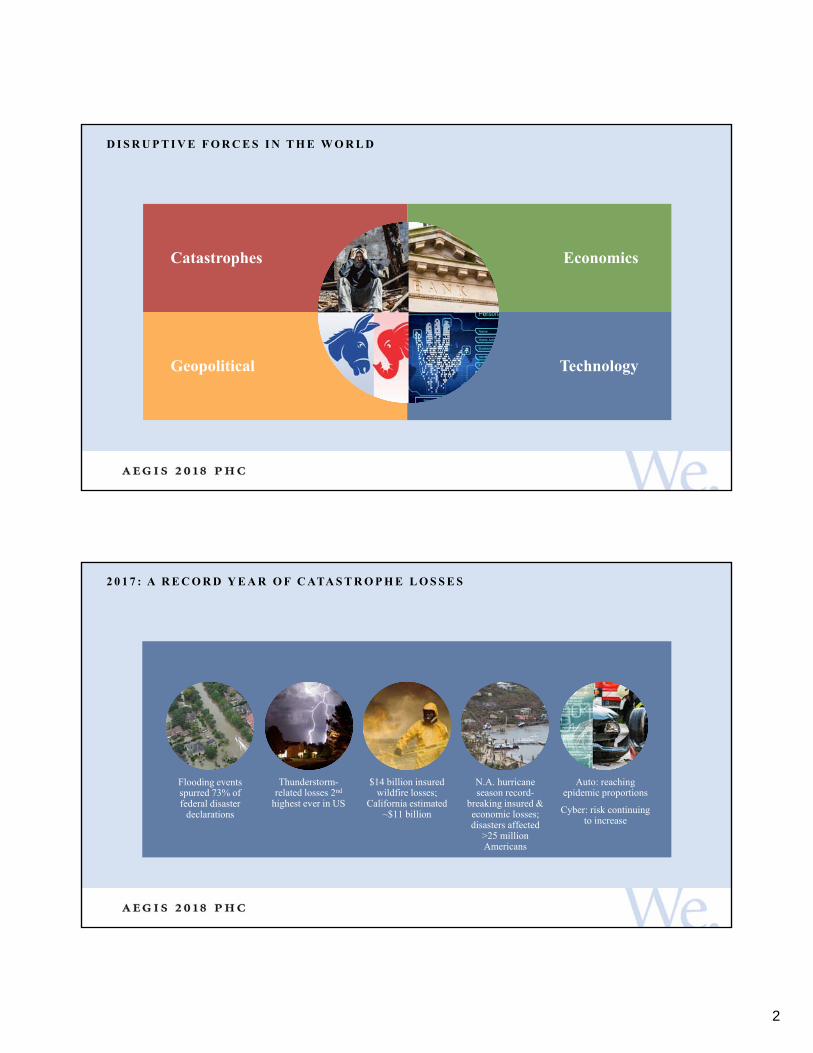
E C O N O M I C S
Fiscal policies, i.e., tax reform and deregulation
surfacing
Tepid monetary policies; keeping interest rates at historic lows — moving
slowly...
Strengthening fundamentals:
All OECD economies growing – 1st in 10 years
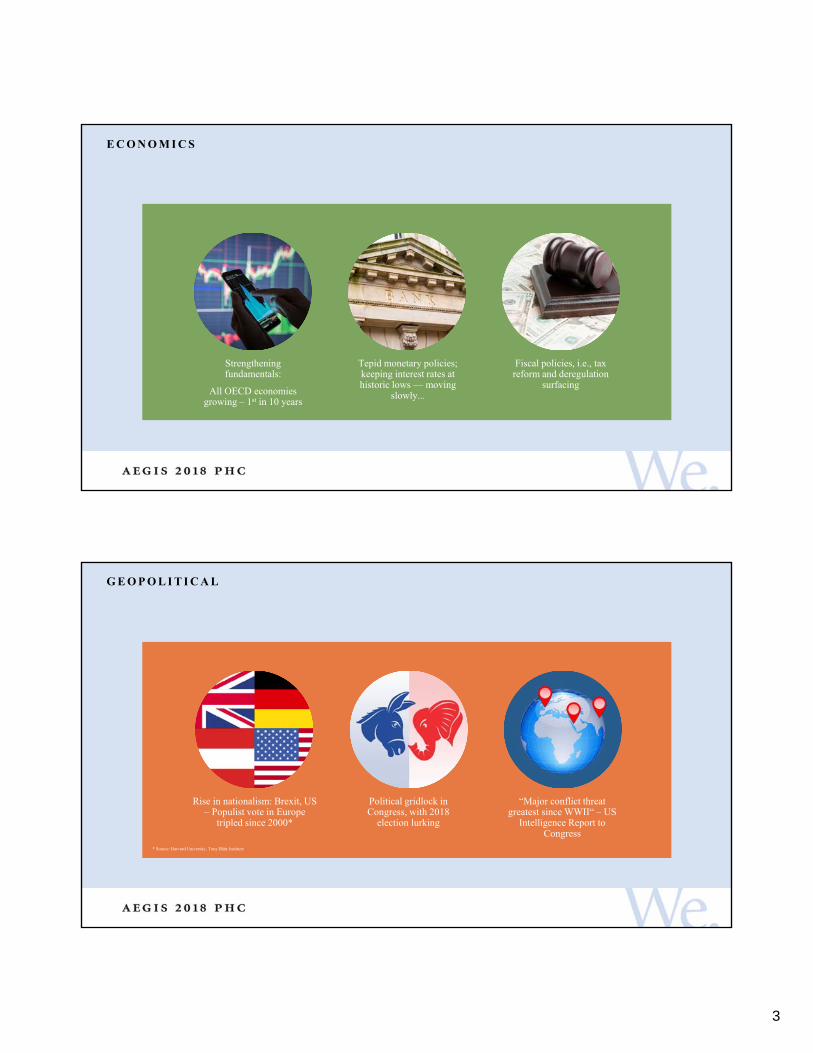
G E O P O L I T I C A L
“Major conflict threat greatest since WWII“ – US
Intelligence Report to Congress
Political gridlock in Congress, with 2018
election lurking
Rise in nationalism: Brexit, US – Populist vote in Europe
tripled since 2000*
* Source: Harvard University, Tony Blair Institute
4
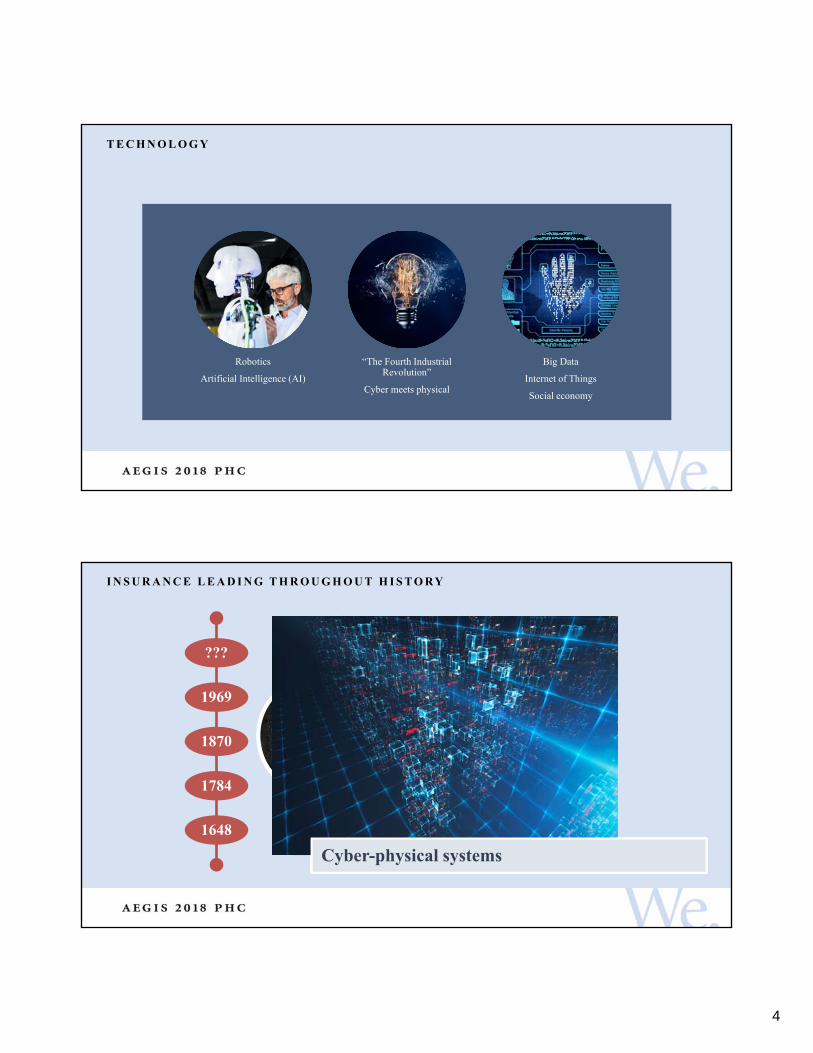
T E C H N O L O G Y
Big Data
Internet of Things
Social economy
“The Fourth Industrial Revolution”
Cyber meets physical
Robotics
Artificial Intelligence (AI)
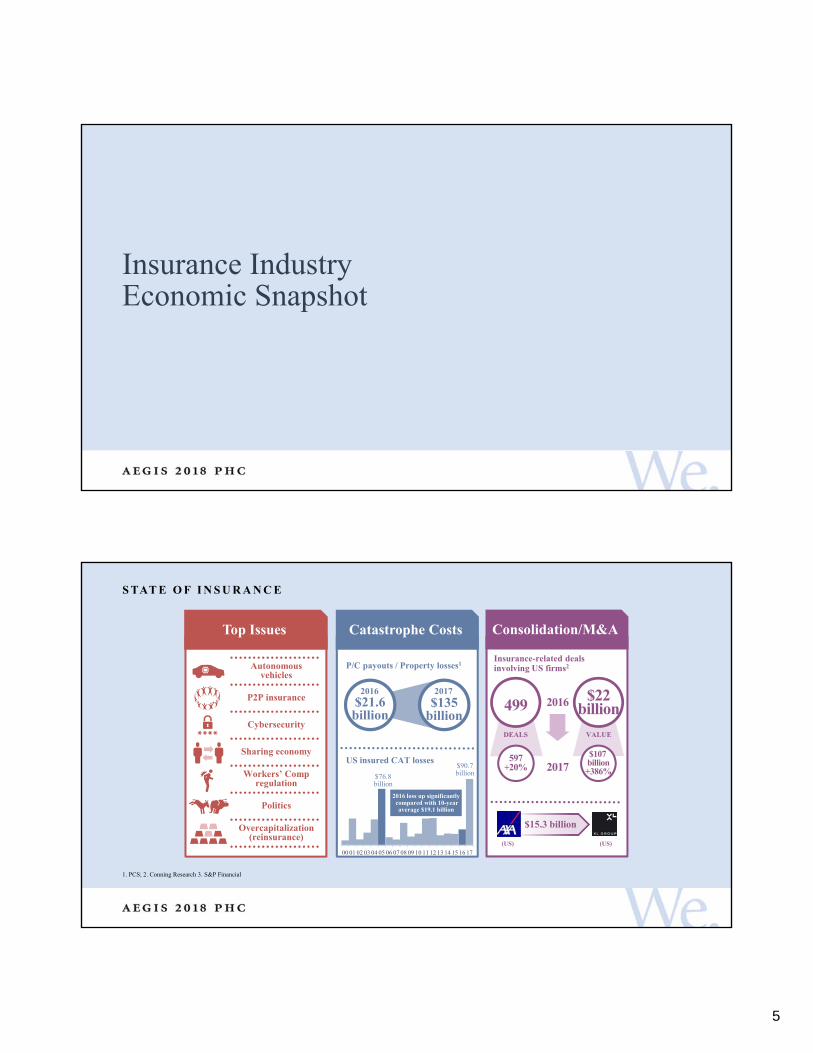
I N S U R A N C E L E A D I N G T H R O U G H O U T H I S T O RY
1648
1784
1870
1969
???
Edward Lloyd’s Coffee HouseSteam, Water, Mechanical ProductionDivision of Labor, Electricity, Mass ProductionElectronics, IT, Automated ProductionCyber-physical systems
5
Insurance Industry Economic Snapshot
S TAT E O F I N S U R A N C E
1. PCS; 2. Conning Research 3. S&P Financial
Autonomousvehicles
P2P insurance
Cybersecurity
Sharing economy
Workers’ Compregulation
Politics
Overcapitalization(reinsurance)
Top Issues
2017
2016499$22
billion
DEALS VALUE
Insurance-related deals involving US firms2
$15.3 billion
Consolidation/M&A
597+20%
$107 billion+386%
(US) (US)
US insured CAT losses
P/C payouts / Property losses1
Catastrophe Costs
00 01 02 03 04 05 06 07 08 09 10 11 12 13 14 15 16 17
2016 loss up significantlycompared with 10-year average $19.1 billion
$21.6billion
2016
$135billion
2017
$76.8billion
$90.7billion
6
2018 combined ratios for catastrophe-affected lines of business will likely improve (due to reversion to the mean). Personal Auto & Commercial Auto likely will be closer to 100
There is no sign of a “hard” market in 2018, but premium in both personal and commercial lines will likely continue rising
P/C insurance markets Financial markets The US economy
In the US, short-term interest rates are finally rising and this is expected to continue. Long-term rates haven’t changed as much, so the yield curve is flatter
Although bond yields anticipate inflation continuing near 2 percent for five or more years, more direct measures see prices rising closer to 3 percent, with prices in some sectors (lately, e.g., lumber) rising much faster
Real GDP growth has shown unexpected strength in recent calendar quarters. Both personal consumption (+4.7%) and business nonresidential fixed investment (8.1%) are rising, heralding a growing exposure base
This is the second longest expansion since WWII, and many forecasters say it will become the longest when it persists into July 2019. There are virtually no signs of another recession
The insurance industry and the economy
2 0 1 8− 2 0 2 0 O V E RV I E W
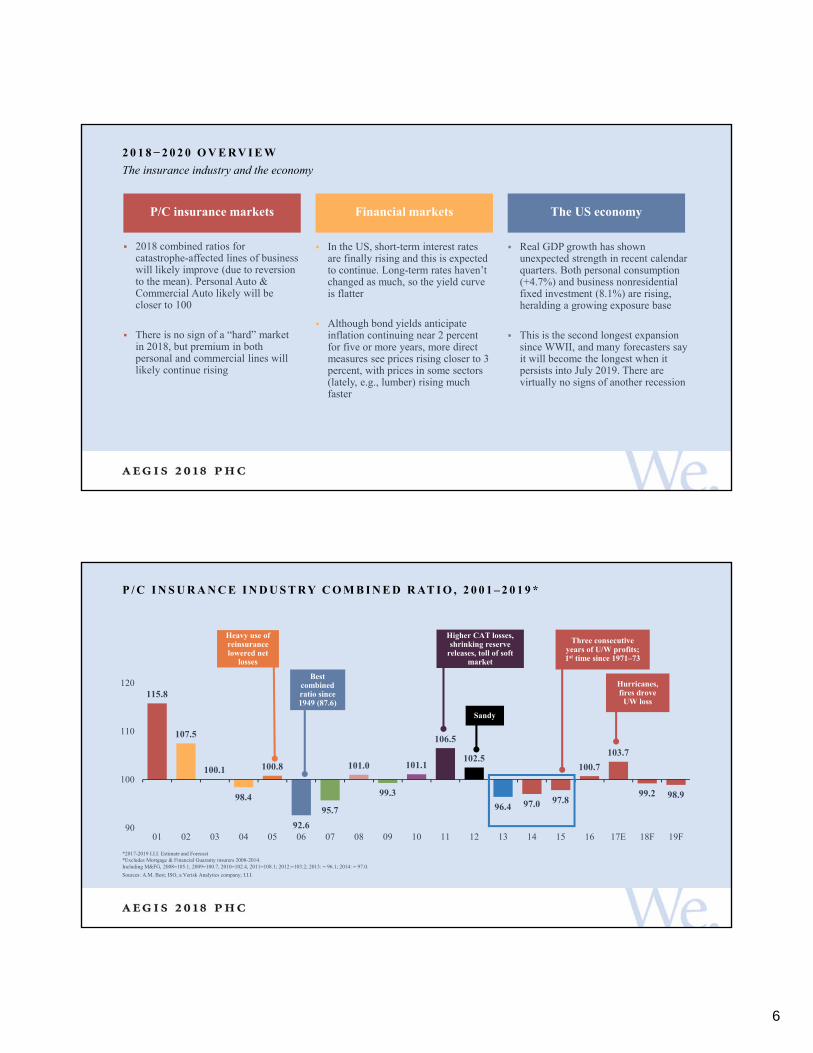
P / C I N S U R A N C E I N D U S T RY C O M B I N E D R AT I O , 2 0 0 1 – 2 0 1 9 *
*2017-2019 I.I.I. Estimate and Forecast*Excludes Mortgage & Financial Guaranty insurers 2008-2014.Including M&FG, 2008=105.1, 2009=100.7, 2010=102.4, 2011=108.1; 2012:=103.2; 2013: = 96.1; 2014: = 97.0.
Sources: A.M. Best; ISO, a Verisk Analytics company; I.I.I.
115.8
107.5
100.1
98.4
100.8
92.6
95.7
101.0
99.3
101.1
106.5
102.5
96.4 97.0 97.8
100.7
103.7
99.2 98.9
90
100
110
120
01 02 03 04 05 06 07 08 09 10 11 12 13 14 15 16 17E 18F 19F
Hurricanes, fires drove
UW loss
Heavy use of reinsurance lowered net
losses
Best combined ratio since 1949 (87.6)
Higher CAT losses, shrinking reserve
releases, toll of soft market
Sandy
Three consecutive years of U/W profits; 1st time since 1971–73

7
Insurance and Commercial Trends
15.7%
4.7%
-5%
0%
5%
10%
15%
20%
07 08 09 10 11 12 13 14 15 16 17 18
NPW Growth
N E T P R E M I U M G R O W T H , A N N U A L C H A N G E
Through first quarter.
SOURCES: A.M. Best (2007-2013), ISO (2014-present), Federal Reserve Bank of St. Louis (FRED), Insurance Information Institute.
Tax reform led to spike in net written premium in 2018
8
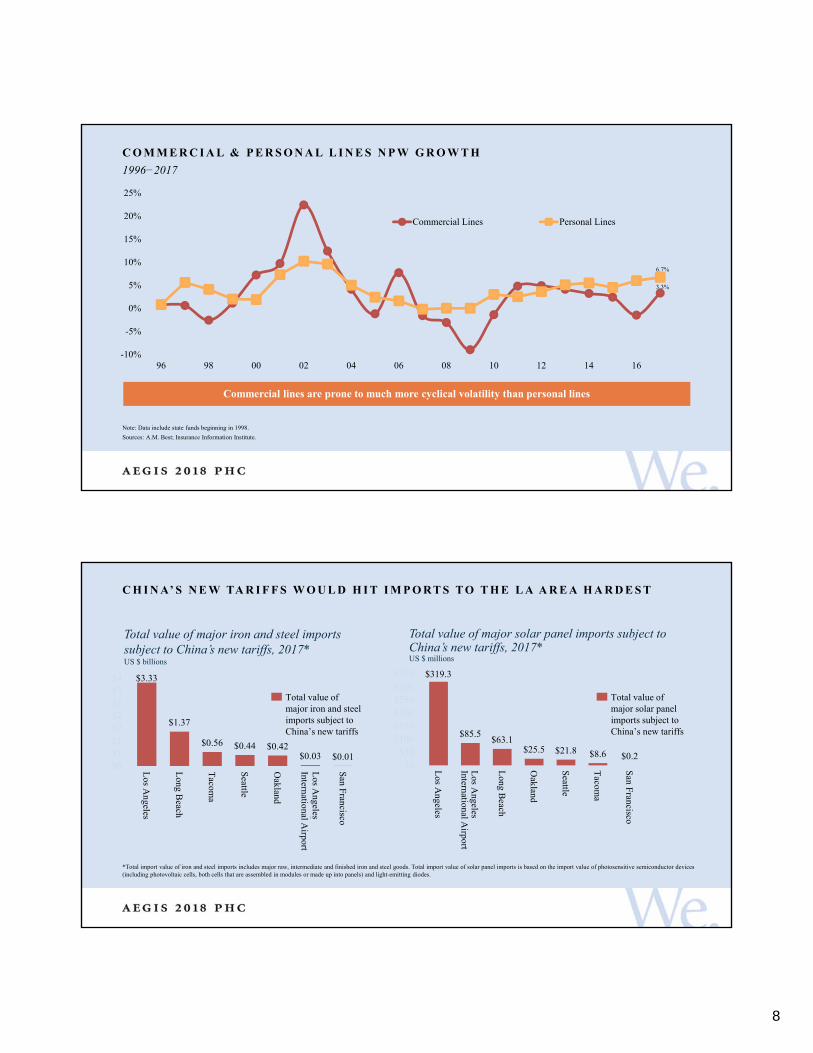
1996−2017
C O M M E R C I A L & P E R S O N A L L I N E S N P W G R O W T H
Note: Data include state funds beginning in 1998.
Sources: A.M. Best; Insurance Information Institute.
-10%
-5%
0%
5%
10%
15%
20%
25%
96 98 00 02 04 06 08 10 12 14 16
Commercial Lines Personal Lines
Commercial lines are prone to much more cyclical volatility than personal lines
3.3%
6.7%
C H I N A’ S N E W TA R I F F S W O U L D H I T I M P O RT S T O T H E L A A R E A H A R D E S T
*Total import value of iron and steel imports includes major raw, intermediate and finished iron and steel goods. Total import value of solar panel imports is based on the import value of photosensitive semiconductor devices (including photovoltaic cells, both cells that are assembled in modules or made up into panels) and light-emitting diodes.
$319.3
$85.5$63.1
$25.5 $21.8 $8.6 $0.2$0
$50$100$150$200$250$300$350
Los A
ngeles
Los A
ngelesInternational A
irport
Long B
each
Oakland
Seattle
Tacom
a
San F
rancisco
Total value of major solar panel imports subject to China’s new tariffs, 2017*US $ millions
Total value of major solar panel imports subject to China’s new tariffs
$3.33
$1.37
$0.56 $0.44 $0.42$0.03 $0.01
$0$1$1$2$2$3$3$4
Los A
ngeles
Long B
each
Tacom
a
Seattle
Oakland
Los A
ngelesInternational A
irport
San F
rancisco
Total value of major iron and steelimports subject to China’s new tariffs
Total value of major iron and steel imports subject to China’s new tariffs, 2017*US $ billions
Los A
ngeles
Los A
ngeles

9
(Wage disbursements, change from year earlier)
PAY R O L L S C L I M B I N G
SOURCES: U.S. Bureau of Economic Analysis, Compensation of Employees, Received: Wage and Salary Disbursements [A576RC1], retrieved from FRED, Federal Reserve Bank of St. Louis; https://fred.stlouisfed.org/series/A576RC1; National Bureau of Economic Research (recession dates).
4.7%
-6.0%
-4.0%
-2.0%
0.0%
2.0%
4.0%
6.0%
8.0%
Q4
:20
05
Q4
:20
06
Q4
:20
07
Q4
:20
08
Q4
:20
09
Q4
:20
10
Q4
:20
11
Q4
:20
12
Q4
:20
13
Q4
:20
14
Q4
:20
15
Q4
:20
16
Q4
:20
17
More workers, slow but steady wage growth keep Workers’ Comp exposures rising
Catastrophes
10
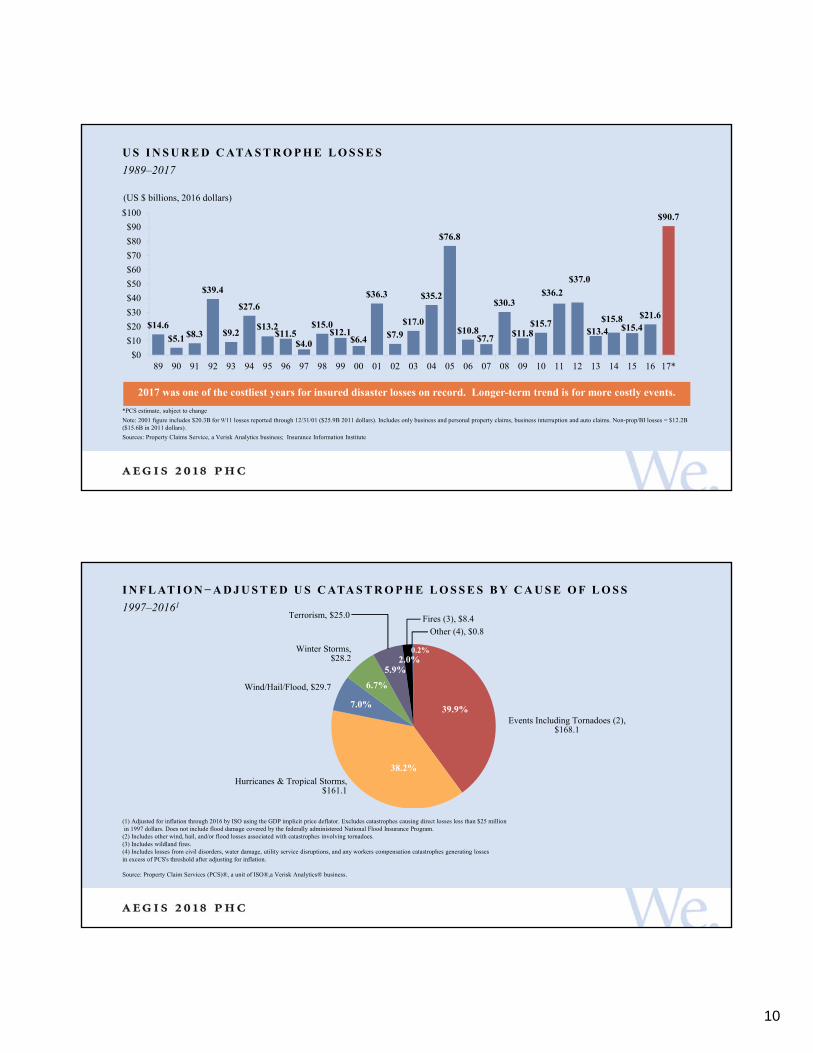
1989–2017
U S I N S U R E D C ATA S T R O P H E L O S S E S
*PCS estimate, subject to change
Note: 2001 figure includes $20.3B for 9/11 losses reported through 12/31/01 ($25.9B 2011 dollars). Includes only business and personal property claims, business interruption and auto claims. Non-prop/BI losses = $12.2B ($15.6B in 2011 dollars).
Sources: Property Claims Service, a Verisk Analytics business; Insurance Information Institute
$14.6
$5.1 $8.3
$39.4
$9.2
$27.6
$13.2$11.5
$4.0
$15.0$12.1
$6.4
$36.3
$7.9$17.0
$35.2
$76.8
$10.8$7.7
$30.3
$11.8$15.7
$36.2
$37.0
$13.4$15.8
$15.4$21.6
$90.7
$0
$10
$20
$30
$40
$50
$60
$70
$80
$90
$100
89 90 91 92 93 94 95 96 97 98 99 00 01 02 03 04 05 06 07 08 09 10 11 12 13 14 15 16 17*
(US $ billions, 2016 dollars)
2017 was one of the costliest years for insured disaster losses on record. Longer-term trend is for more costly events.
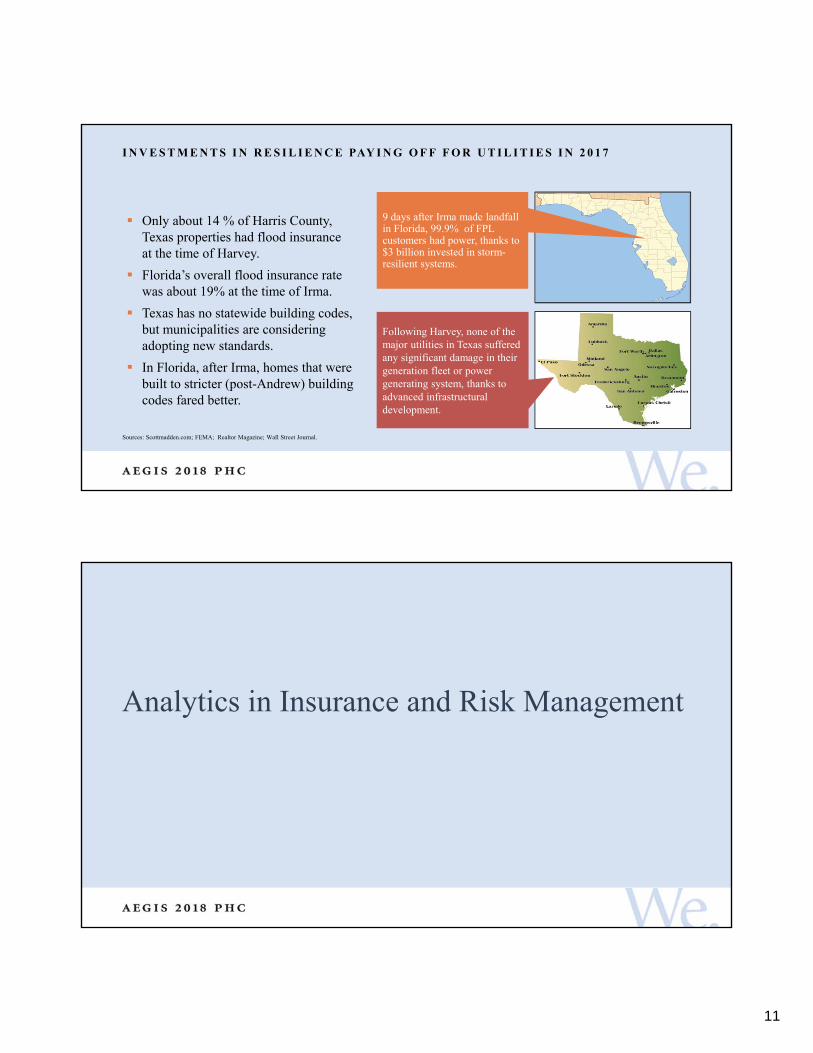
1997–20161
I N F L AT I O N−A D J U S T E D U S C ATA S T R O P H E L O S S E S B Y C A U S E O F L O S S
(1) Adjusted for inflation through 2016 by ISO using the GDP implicit price deflator. Excludes catastrophes causing direct losses less than $25 millionin 1997 dollars. Does not include flood damage covered by the federally administered National Flood Insurance Program.
(2) Includes other wind, hail, and/or flood losses associated with catastrophes involving tornadoes.(3) Includes wildland fires.(4) Includes losses from civil disorders, water damage, utility service disruptions, and any workers compensation catastrophes generating lossesin excess of PCS's threshold after adjusting for inflation.
Source: Property Claim Services (PCS)®, a unit of ISO®,a Verisk Analytics® business.
39.9%
38.2%
7.0%
6.7%
5.9%2.0%
0.2%
Events Including Tornadoes (2), $168.1
Fires (3), $8.4
Hurricanes & Tropical Storms, $161.1
Wind/Hail/Flood, $29.7
Winter Storms, $28.2
Terrorism, $25.0
Other (4), $0.8
11
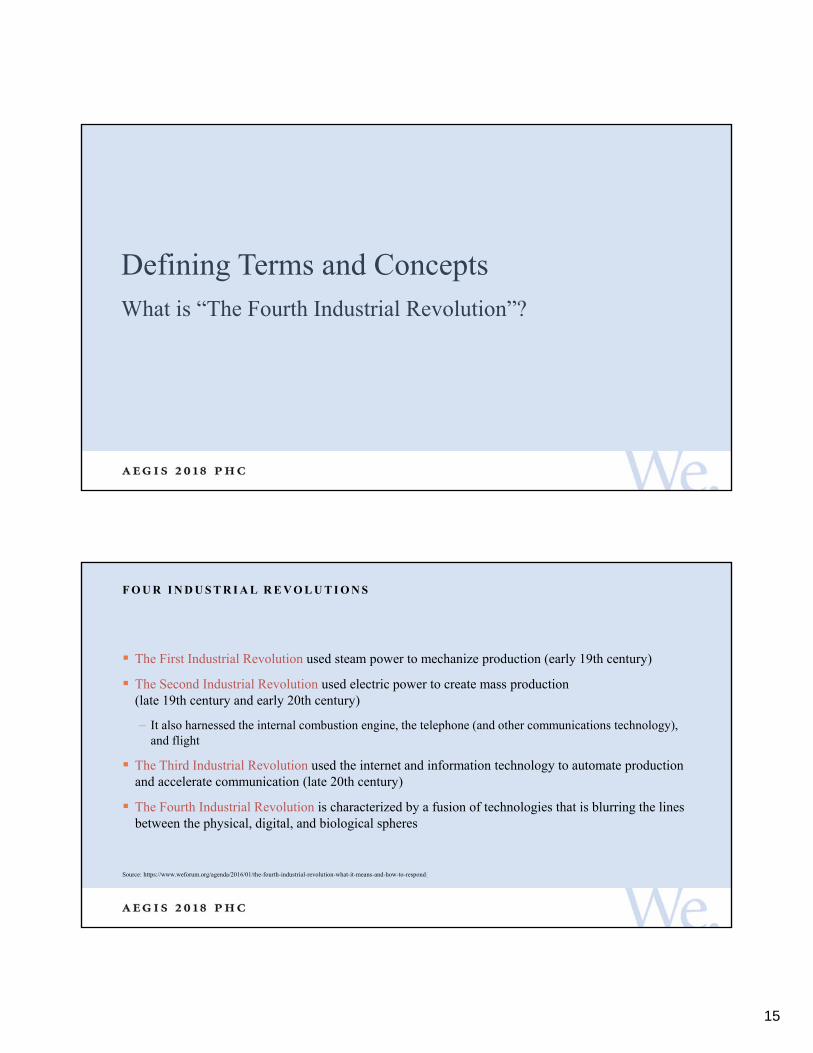
I N V E S T M E N T S I N R E S I L I E N C E PAY I N G O F F F O R U T I L I T I E S I N 2 0 1 7
Sources: Scottmadden.com; FEMA; Realtor Magazine; Wall Street Journal.
9 days after Irma made landfall in Florida, 99.9% of FPL customers had power, thanks to $3 billion invested in storm-resilient systems.
Following Harvey, none of the major utilities in Texas suffered any significant damage in their generation fleet or power generating system, thanks to advanced infrastructural development.
Only about 14 % of Harris County, Texas properties had flood insurance at the time of Harvey.
Florida’s overall flood insurance rate was about 19% at the time of Irma.
Texas has no statewide building codes, but municipalities are considering adopting new standards.
In Florida, after Irma, homes that were built to stricter (post-Andrew) building codes fared better.
Analytics in Insurance and Risk Management

12
U S I N G A I T O P R E PA R E F O R N AT U R A L D I S A S T E R S
C O N N E C T I N G T H E R I S K A N D I N S U R A N C E C H A I N
Source: Raconteur

13
C H A L L E N G E S T H E I N S U R A N C E I N D U S T RY FA C E S I N I N N O VAT I O N
Sources: PricewaterhouseCoopers, Global Insurtech Report - 2017
10%
30%
50%
70%
90%
Talent Data storage, privacy andprotection regulations
IT security Digital identityauthentication regulations
New business modelregulations
Gun Liability

14
D E AT H S B Y F I R E A R M S , 2 0 1 4 A N D 2 0 1 5
Source: Centers for Disease Control and Prevention, National Vital Statistics Report.
586 489
21,334 22,018
10,94512,979
270 2820
5,000
10,000
15,000
20,000
25,000
2014 2015
Accidental discharge of firearms Suicide by firearmsAssault (homicide) by firearms Undetermined intent
Nothing more recent?
G U N L I A B I L I T Y C O V E R A G E
Personal Insurance Group Personal Insurance Commercial Insurance
Personal firearms liability insurance was available from some organizations to cover acts of self-defense
Offers protection against civil liability, the cost to defend against civil and criminal legal actions and access to attorney referrals
As of 2018, most brokers and insurers have stopped administering the programs
Coverages can be triggered by active shooting incidents, including general liability, business interruption and property insurance
Workers’ comp insurance is implicated in shootings in the workplace while commercial general liability insurance coverage might also be implicated in a public area
Most individuals have some property and liability coverage for firearms in their standard homeowners’ policy
Only covers accidental shootings and in some cases, acts of self-defense
Personal umbrella policies are available, covering liability above the homeowner policy limit
15
Defining Terms and ConceptsWhat is “The Fourth Industrial Revolution”?
F O U R I N D U S T R I A L R E V O L U T I O N S
The First Industrial Revolution used steam power to mechanize production (early 19th century)
The Second Industrial Revolution used electric power to create mass production (late 19th century and early 20th century)
– It also harnessed the internal combustion engine, the telephone (and other communications technology), and flight
The Third Industrial Revolution used the internet and information technology to automate production and accelerate communication (late 20th century)
The Fourth Industrial Revolution is characterized by a fusion of technologies that is blurring the lines between the physical, digital, and biological spheres
Source: https://www.weforum.org/agenda/2016/01/the-fourth-industrial-revolution-what-it-means-and-how-to-respond/

16
F O U R M A I N E F F E C T S O N B U S I N E S S O F T H E F O U RT H I N D U S T R I A L R E V O L U T I O N
Source: https://www.weforum.org/agenda/2016/01/the-fourth-industrial-revolution-what-it-means-and-how-to-respond/
1. Customer expectations
2. Product enhancement
− Products can be more personalized and/or have added digitally-enhanced features
− Products can be more durable and resilient, and more cheaply and easily maintained
3. Collaborative innovation
− Given the speed of innovation, organizations will need new forms of collaboration to keep up
4. Organizational forms
− Talent, culture, and organizational forms will have to be rethought
Insurance Under the FourthIndustrial RevolutionTime Frame: Next 10 Years

17
F O U R M A I N E F F E C T S O F T H E F O U RT H I N D U S T R I A L R E V O L U T I O N O N T H E I N S U R A N C E B U S I N E S S
1. Customer expectations (personal lines and small business insurance)
Regarding shopping for, and buying, insurance
– Artificial Intelligence (AI) could, via big data, determineunique characteristics for each prospective customer
– AI and virtual reality could help buyer choose idealpolicy limits in part by simulating various claims events
F O U R M A I N E F F E C T S O F T H E F O U RT H I N D U S T R I A L R E V O L U T I O N O N T H E I N S U R A N C E B U S I N E S S
2. Product enhancement
Policies can be linked to sensors on the policyholder’s property (or, for life and health insurance, on the policyholder)
Policies can be linked to recommend tailored behavior-changeinformation that would reduce risks that could become claims,such as real-time driving suggestions, etc.
Policies can be linked to tailored educational information, such as updated flood-zone maps, new scientific discoveries regarding earthquakes, etc.

18
F O U R M A I N E F F E C T S O F T H E F O U RT H I N D U S T R I A L R E V O L U T I O N O N T H E I N S U R A N C E B U S I N E S S
3. Collaborative innovation
Need for new forms of collaboration
Insurers devising new coverages, collaborating with customers and business
Insurers will have to collaborate with regulators
Technology could foster creation of new insurers with specialized coverage
F O U R M A I N E F F E C T S O F T H E F O U RT H I N D U S T R I A L R E V O L U T I O N O N T H E I N S U R A N C E B U S I N E S S
4. Talent, culture, and organizational forms
The percent of people in the agency, underwriting, financialmanagement and claims areas will shrink
The percent of people in actuarial and IT areas will explode
Insurers will want to be seen by customers as part of a “financial safety net”
19
How Insurance DrivesEconomic Growth
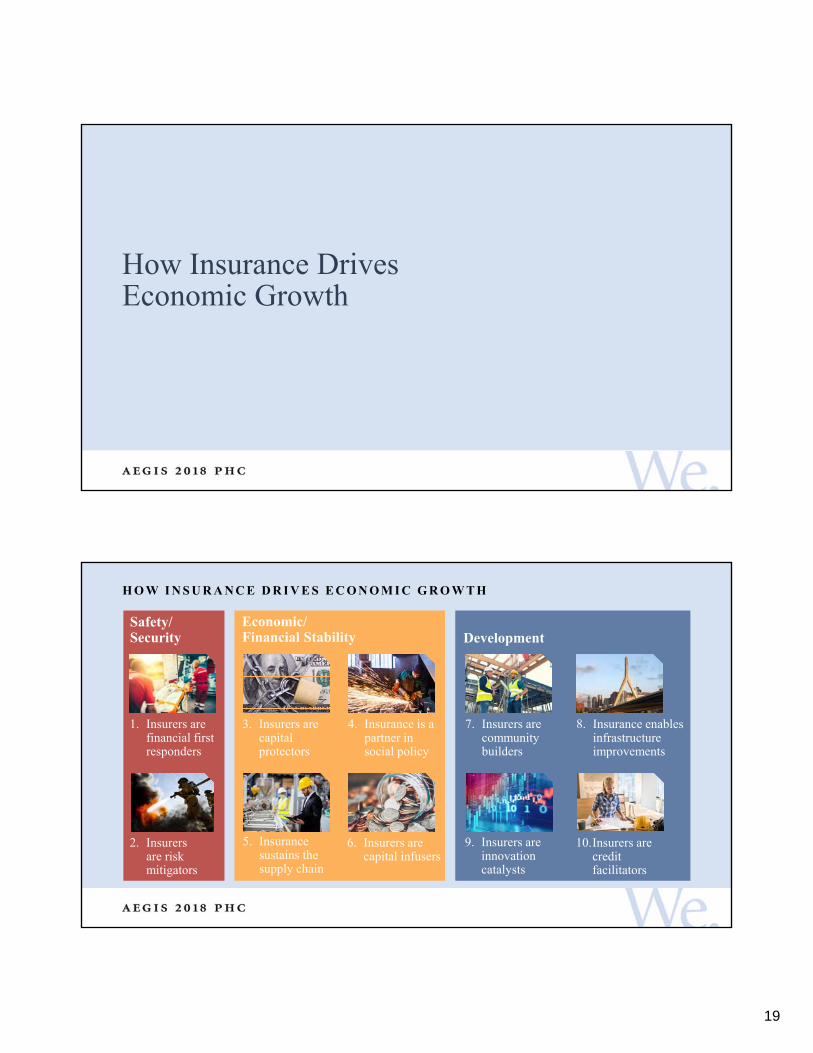
H O W I N S U R A N C E D R I V E S E C O N O M I C G R O W T H
Safety/Security
1. Insurers are financial first responders
Economic/Financial Stability Development
2. Insurers are risk mitigators
3. Insurers are capital protectors
10.Insurers are credit facilitators
5. Insurance sustains the supply chain
4. Insurance is a partner in social policy
6. Insurers are capital infusers
7. Insurers are community builders
8. Insurance enables infrastructure improvements
9. Insurers are innovation catalysts
20
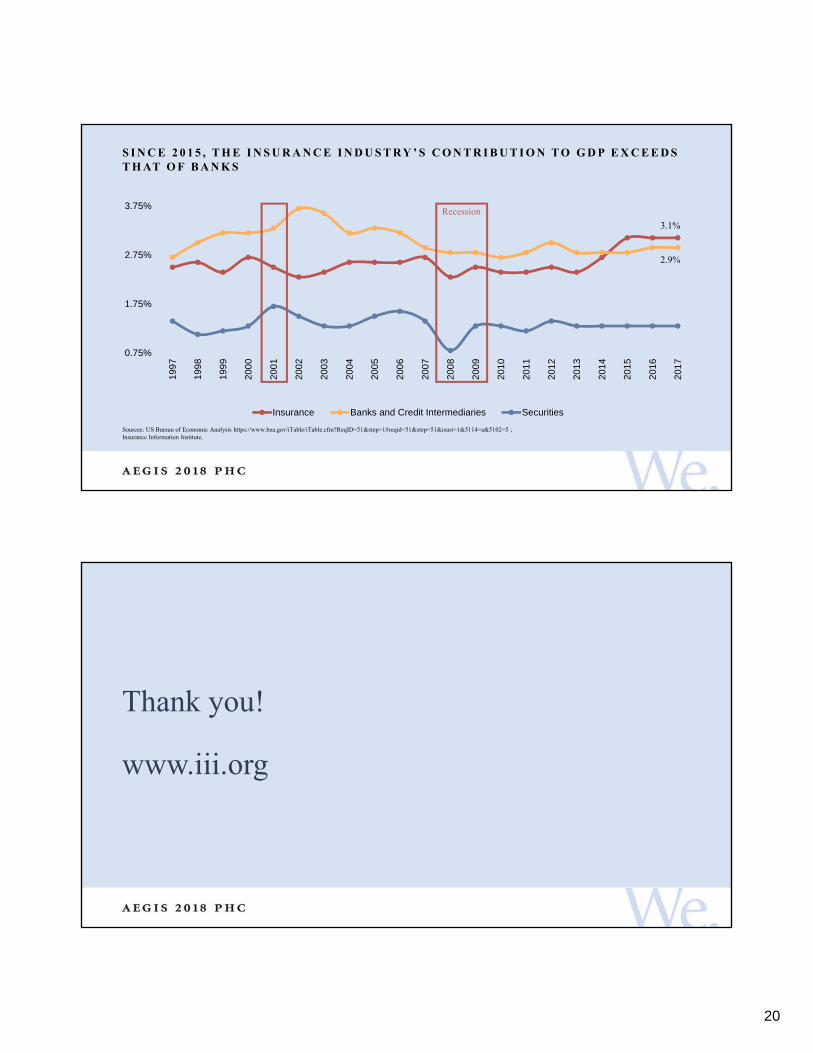
S I N C E 2 0 1 5 , T H E I N S U R A N C E I N D U S T RY ’ S C O N T R I B U T I O N T O G D P E X C E E D ST H AT O F B A N K S
Sources: US Bureau of Economic Analysis https://www.bea.gov/iTable/iTable.cfm?ReqID=51&step=1#reqid=51&step=51&isuri=1&5114=a&5102=5 ; Insurance Information Institute.
0.75%
1.75%
2.75%
3.75%
199
7
199
8
199
9
200
0
200
1
200
2
200
3
200
4
200
5
200
6
200
7
200
8
200
9
201
0
201
1
201
2
201
3
201
4
201
5
201
6
201
7
Insurance Banks and Credit Intermediaries Securities
Recession
3.1%
2.9%
Thank you!
www.iii.org
21