
eMarketer Webinar: Mobile, Social & Geolocation—Key Trends for Marketers
Upload
klipfolioCategory
view
192download
0
Webinar: Why Marketers Need Dashboards
1

Mychelle MollotChief Marketing Officer,
Klipfolio
Jonathan TaylorDigital Marketing Manager,
Klipfolio
Erin CropperDirector of Customer
Success at Stratigent

Questions we will answer
1. Why do Marketers need Digital Dashboards?
2. What metrics/KPIs matter?
3. What does a Marketing dashboard look like,
and how do I build one?
4. What do I need to know to make my dashboard
project a success?

Why do marketers need dashboards?
WHY
To answer a question we all have:
How are we doing?

How are we doing?
in SEO?
And email
campaigns?
Advertising?
Social media?
Events?
Last month?
This month?
RIGHT NOW?
But this question is actually many questions

And answering it requires data from a lot of
cloud services
Social Media Web Analytics
CRM
Marketing
Automation
SEO

And on-prem data sources
Social Media Web Analytics
EMAILSEO
Marketing
Automation CRM

And answering it requires
data from multiple services
and databases at the same
time.
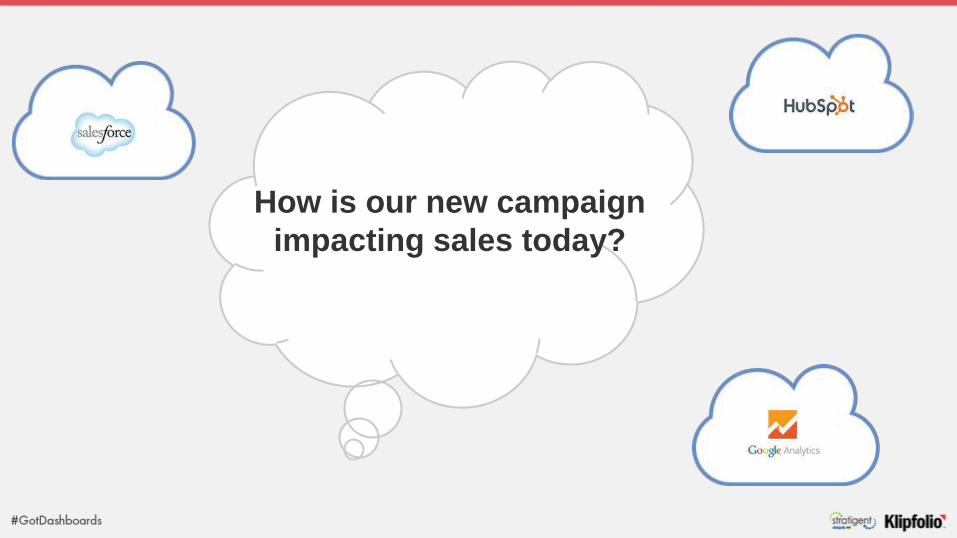
How is our new campaign
impacting sales today?

So how are most marketing
organizations getting the
answer today?
HOW ARE WE DOING?

Most are using the Quarterly Marketing Presentation
● Many hours of reporting, cutting,
pasting, analyzing
● Often very functionally focused
(Web, programs, advertising….)
● Huge opportunity cost

But there is a better way! Marketing Dashboards

A Dashboard answers the
“how are we doing?”
question regardless of
where the information is
coming from.

It becomes the
single place for
all the key
metrics you need
to track on a
regular basis

And it is always on and
tracking, giving you the
answers you need, in
the time-frame you need
them:
● every minute
● every hour
● every day
● every week

Marketing Dashboards take you from: Reflective, quarterly performance management Continuous optimization

WHAT
WHAT KPIS AND METRICS
MATTER?

Why KPIs are Important
▪ Have a clear way to assess
performance
▪ Give us hints about where to look
for insights
▪ Provide context
▪ Create consensus regarding
what’s important

Why does this exist in the first place, and is it
doing what it’s supposed to do?
Defining KPI’s doesn’t have to be difficult – we’re
answering one question with many metrics.
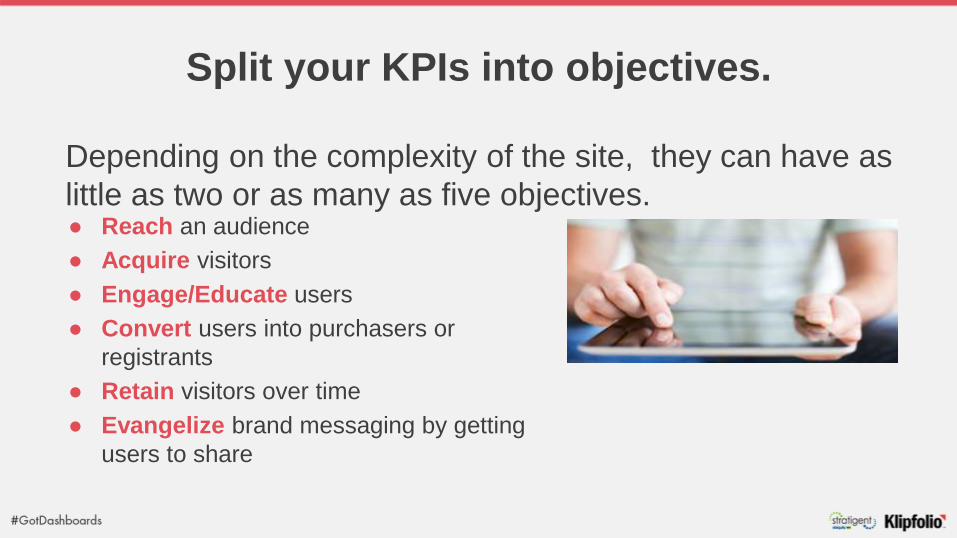
● Reach an audience
● Acquire visitors
● Engage/Educate users
● Convert users into purchasers or
registrants
● Retain visitors over time
● Evangelize brand messaging by getting
users to share
Depending on the complexity of the site, they can have as
little as two or as many as five objectives.
Split your KPIs into objectives.
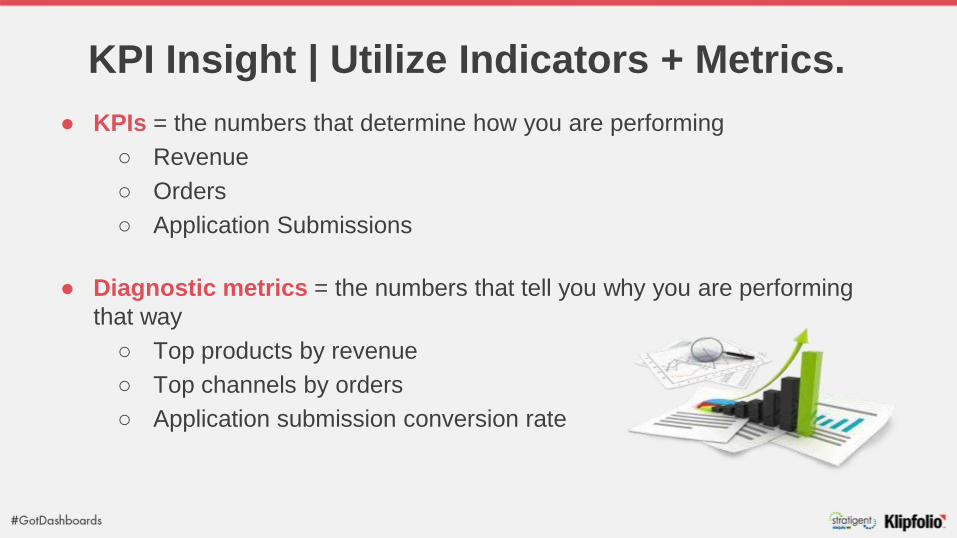
KPI Insight | Utilize Indicators + Metrics.
● KPIs = the numbers that determine how you are performing
○ Revenue
○ Orders
○ Application Submissions
● Diagnostic metrics = the numbers that tell you why you are performing
that way
○ Top products by revenue
○ Top channels by orders
○ Application submission conversion rate

What other types of KPIs can I use?
● Smoke alarms = a metric that tells you if something has gone horribly awry
○ Zero yield searches
● Predictor/Leading Indicator = how is this going to perform in the future?
○ Intent to Purchase
○ Conversion Proxy (e.g., form prints for an offline coupon)
● Latent metrics = where are there opportunities?
○ Customer Satisfaction
○ Competitive Data

Key Tips for KPIs:
● Minimize.
○ Too many KPIs make it impossible to know what is important. Only
things that are actionable or provide valuable context should be KPIs.
● Provide context.
○ Don’t just show a number – show something that will tell you why this
number is the way that it is.
● Adjust frequently.
○ When there is a site change, a re-organization, or a change in
marketing strategy, reassess your KPIs
● Be accountable.
○ If no one is accountable to a particular number, no one will ever care if
it changes or stays exactly the same.
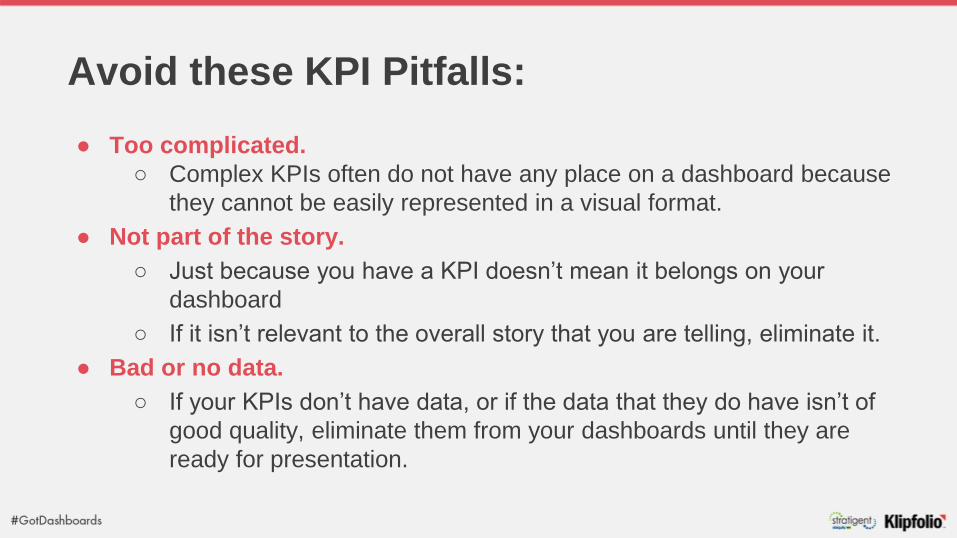
Avoid these KPI Pitfalls:
● Too complicated.
○ Complex KPIs often do not have any place on a dashboard because
they cannot be easily represented in a visual format.
● Not part of the story.
○ Just because you have a KPI doesn’t mean it belongs on your
dashboard
○ If it isn’t relevant to the overall story that you are telling, eliminate it.
● Bad or no data.
○ If your KPIs don’t have data, or if the data that they do have isn’t of
good quality, eliminate them from your dashboards until they are
ready for presentation.

● Align the elements to a grid
● Place according to importance
● Place related things together (e.g., objectives, metric types, etc.)
● A 3/6 column layout is the easiest to start with
Designing Insight | Use layouts strategically.

Designing Insight |
Assign Placement Importance.
Designing Insight |
Place related things together.
Key Metrics
Referral
Sources
Top X Lists
Imp
ort
an
t Most Important

What does a marketing Dashboard
look like and how can I build one?

HOW
HOW CAN I MAKE MY DASHBOARD
PROJECT A SUCCESS?

Most dashboard projects fail in the following
areas:
1. Unclear requirements
2. Expanding timelines
3. Bad data or no data
4. Lack of understanding

Unclear RequirementsUnclear requirements make it tough to design a dashboard that meets the needs
of your audience.
PROBLEM SOLUTION
Executives are looking for different KPIs or timeframe
comparisons.
Get signoff on a comprehensive list of requirements
before designing.
Visual design elements aren’t consistent with what the
business wants to see.
Ask your audience if they have any visual
specifications to be considered during design.
• Data sources aren’t well defined
• Metric definitions don’t include key components for
automation
Define data sources and metric definitions for the
technical team during the requirements phase and get
signoff.
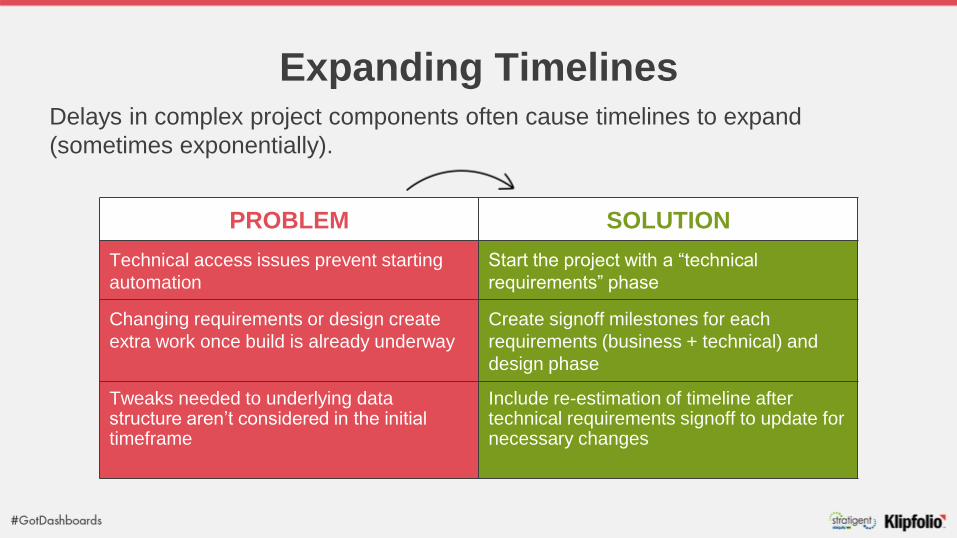
Expanding Timelines
PROBLEM SOLUTION
Technical access issues prevent starting
automation
Start the project with a “technical
requirements” phase
Changing requirements or design create
extra work once build is already underway
Create signoff milestones for each
requirements (business + technical) and
design phase
Tweaks needed to underlying data structure aren’t considered in the initial timeframe
Include re-estimation of timeline after technical requirements signoff to update for necessary changes
Delays in complex project components often cause timelines to expand
(sometimes exponentially).

Bad Data or No Data
PROBLEM SOLUTION
Reports for key KPIs or comparisons have
insufficient data
Check through key KPIs as part of the
technical requirements phase
Custom reports that needed to be created
weren’t ready for the launch of the
dashboard
Re-estimate the timeline after the tech
requirements phase, and move out launch
if needed
Complex requirements force the presentation of smaller than ideal datasets
Work with stakeholders to assess if a larger dataset can be used; if not, use caveats and lots of education
Nothing is worse than a dashboard without data, and dashboards with bad data
only serve to undercut stakeholder confidence.

Lack of Understanding
PROBLEM SOLUTION
Stakeholders don’t understand what data
points the dashboard represents
Ensure that requirements are very well
documented at the outset, and create a
data dictionary
It isn’t immediately clear what is important,
and what changes are significant
Design with the most important elements at
the top left, and use color to highlight
changes
Data caveats and other important footnotes aren’t clear to users of the dashboard, causing confusion
Use annotations and analysis wherever possible, and conduct extensive knowledge transfer for all users
No dashboard project is successful without providing a solid understanding to the
business.

Thank You!
http://www.klipfolio.com/ http://www.stratigent.com/


![[Webinar] Marketers vs. Duplicates: How You Can Win](https://static.fdocuments.us/doc/165x107/55d5018abb61eb4e7e8b4657/webinar-marketers-vs-duplicates-how-you-can-win.jpg)


![[WEBINAR] How Digital Marketers Engage on Social Media](https://static.fdocuments.us/doc/165x107/55a5b4d31a28ab1b3a8b45d7/webinar-how-digital-marketers-engage-on-social-media.jpg)