Webinar: Minimizing Bus Bunching – Results from a new strategy that cuts wait times, improve...
61
Minimizing Bus Bunching Results from a new strategy that cuts wait times, improve comfort and brings reliability to bus services Juan Carlos Muñoz, Felipe Delgado, Ricardo Giesen Sergio Ariztía, Daniel Hernández, Felipe Ortiz and William Phillips Department of Transport Engineering and Logistics Pontificia Universidad Católica de Chile
-
Upload
brtcoe -
Category
Technology
-
view
891 -
download
1
Transcript of Webinar: Minimizing Bus Bunching – Results from a new strategy that cuts wait times, improve...

Minimizing Bus Bunching Results from a new strategy that cuts wait
times, improve comfort and brings reliability to bus services
Juan Carlos Muñoz, Felipe Delgado, Ricardo Giesen
Sergio Ariztía, Daniel Hernández, Felipe Ortiz and William Phillips Department of Transport Engineering and Logistics
Pontificia Universidad Católica de Chile
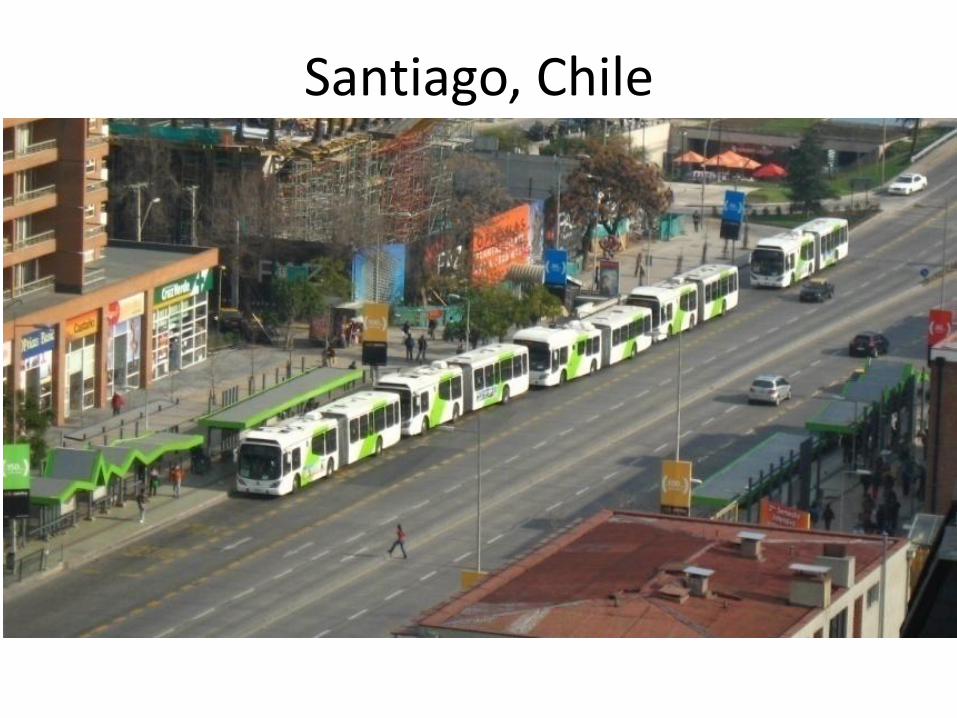
Santiago, Chile

Time-space trajectories Line 201, March 25th, 2009
0 20 40 60 80 100 120 140 160 180 200 220 240 260 280 3000
2.5
5
7.5
10
12.5
15
17.5
20
22.5
25
27.5
30
32.5
35
Tiempo (minutos)
Posic
ión (
Km
.)
6:30 AM 8:30 AM
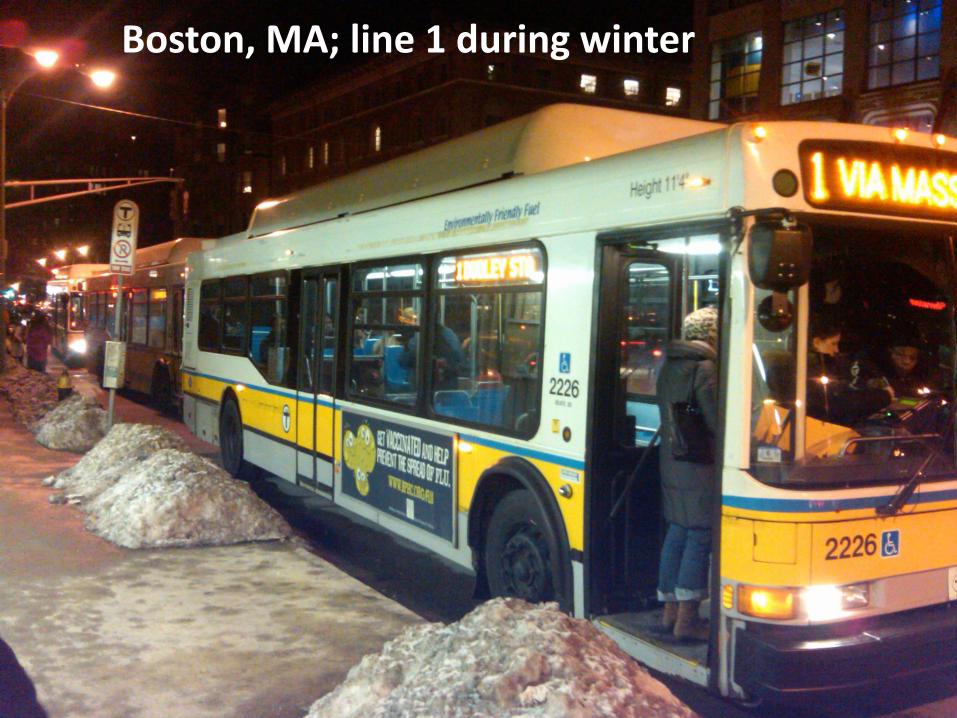
Boston, MA; line 1 during winter

Boston, MA; line 1 during summer

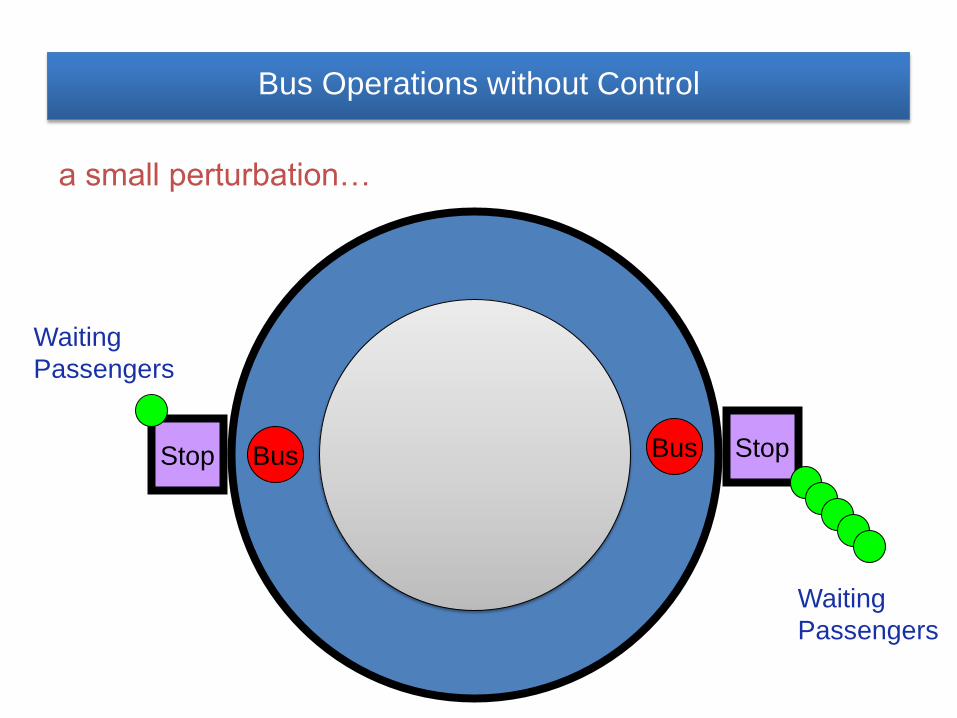
Is keeping regular headways that
difficult?
Transit Leaders Roundtable MIT, June 2011
Ricardo Giesen ©
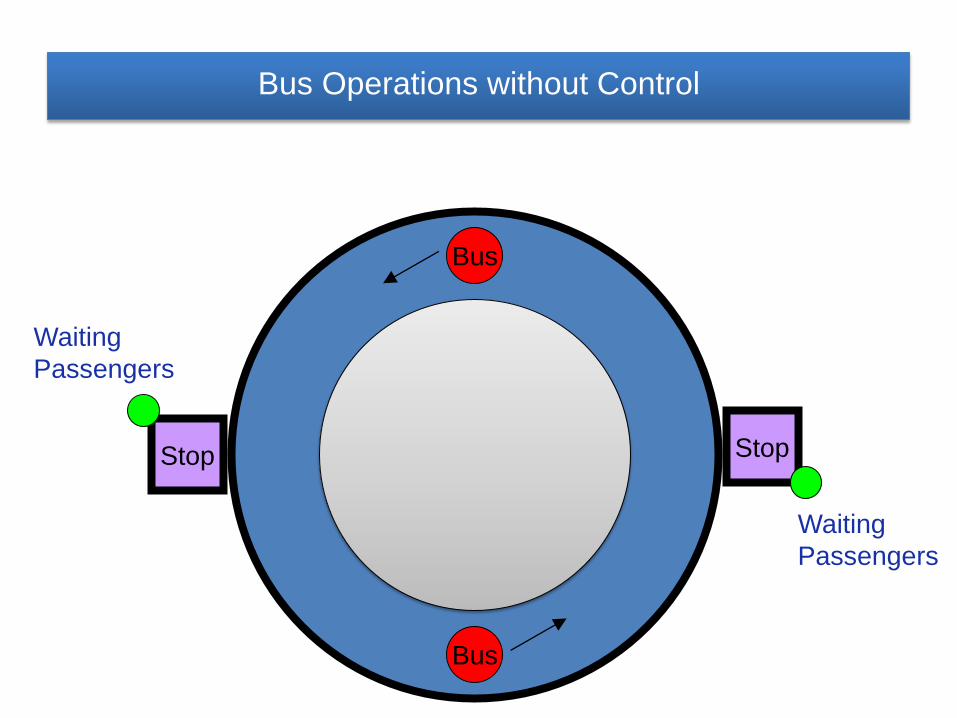
Bus
Bus
Stop Stop
Waiting
Passengers
Waiting
Passengers
Bus Operations without Control
Ricardo Giesen ©
Bus Bus Stop Stop
a small perturbation…
Waiting
Passengers
Waiting
Passengers
Bus Operations without Control
Ricardo Giesen ©
Bus
Bus
Stop Stop
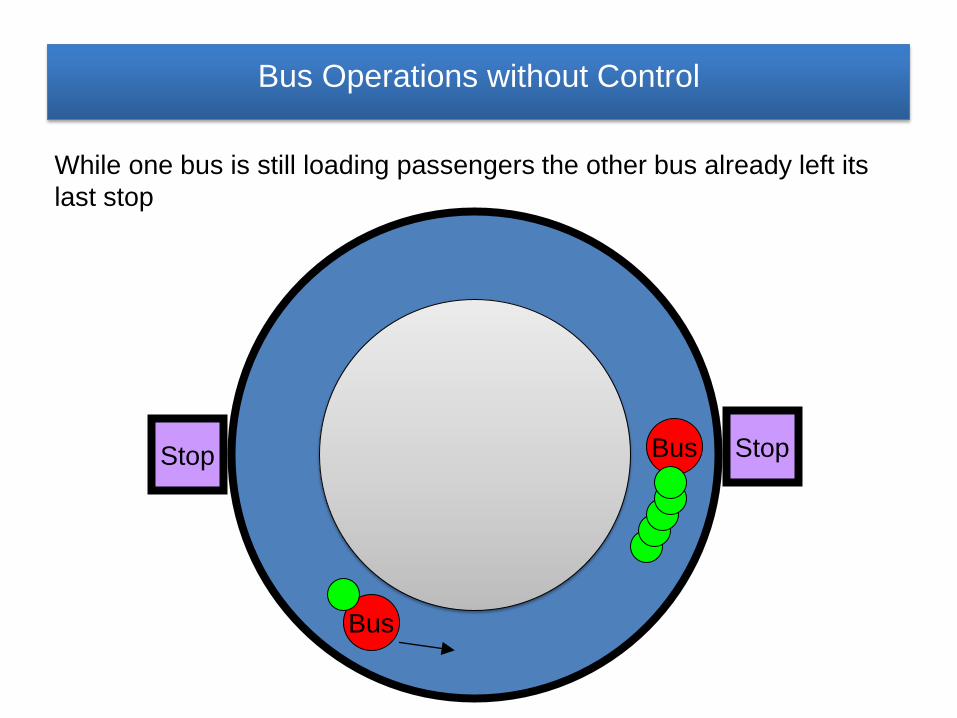
While one bus is still loading passengers the other bus already left its
last stop
Bus Operations without Control

Ricardo Giesen ©
Bus
Bus Stop Stop
Bus Operations without Control
Ricardo Giesen ©
Bus
Bus
Stop Stop
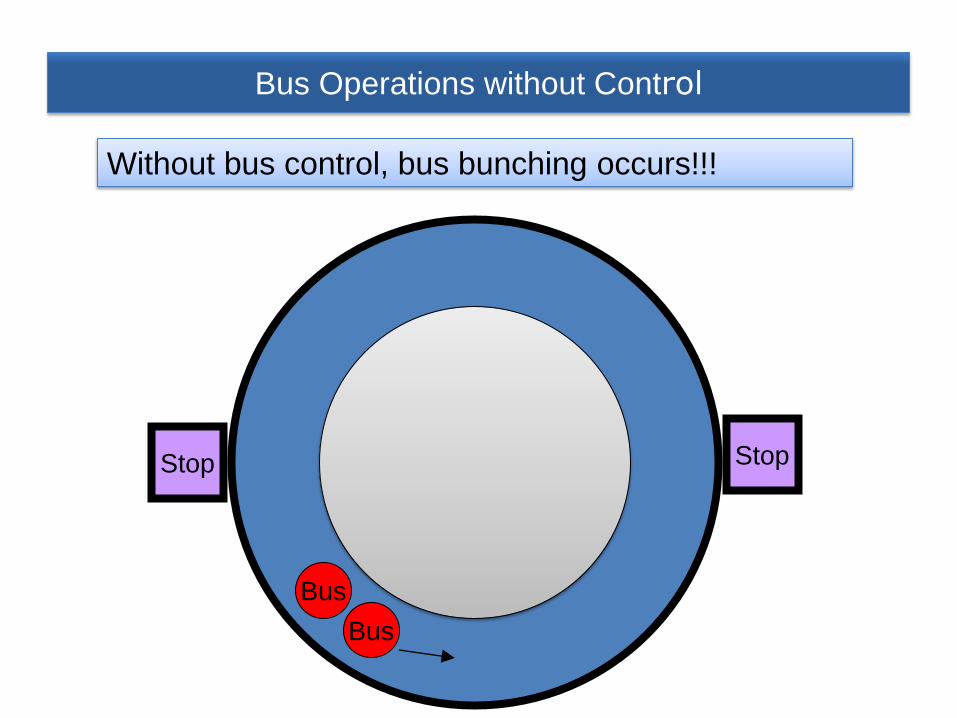
Without bus control, bus bunching occurs!!!
Bus Operations without Control

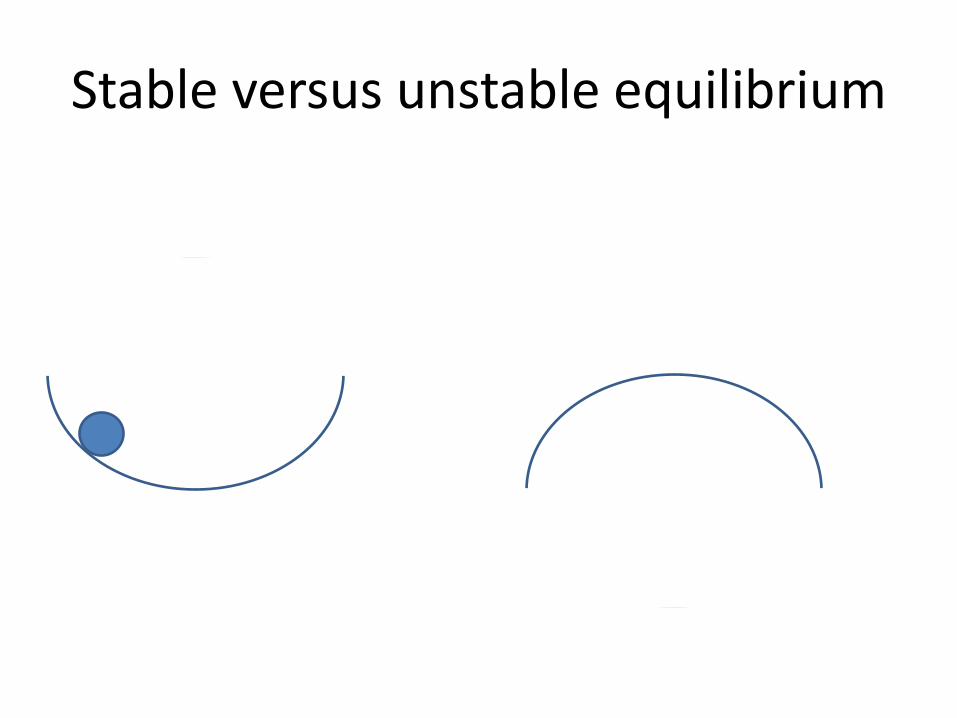
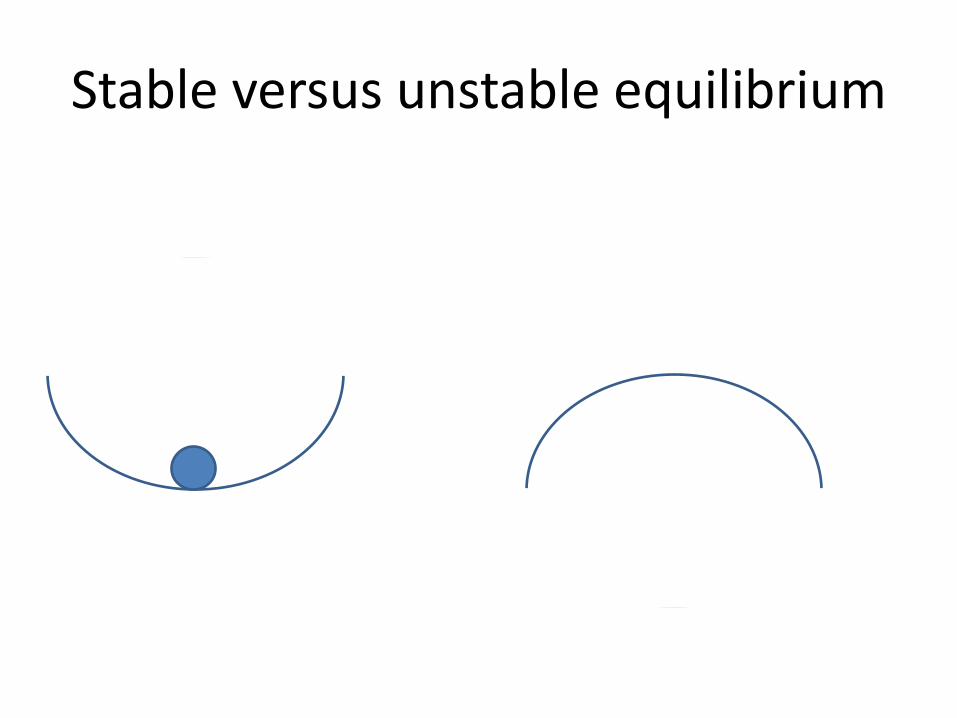
Stable versus unstable equilibrium
Stable versus unstable equilibrium
Stable versus unstable equilibrium

Stable versus unstable equilibrium

Stable versus unstable equilibrium

Stable versus unstable equilibrium
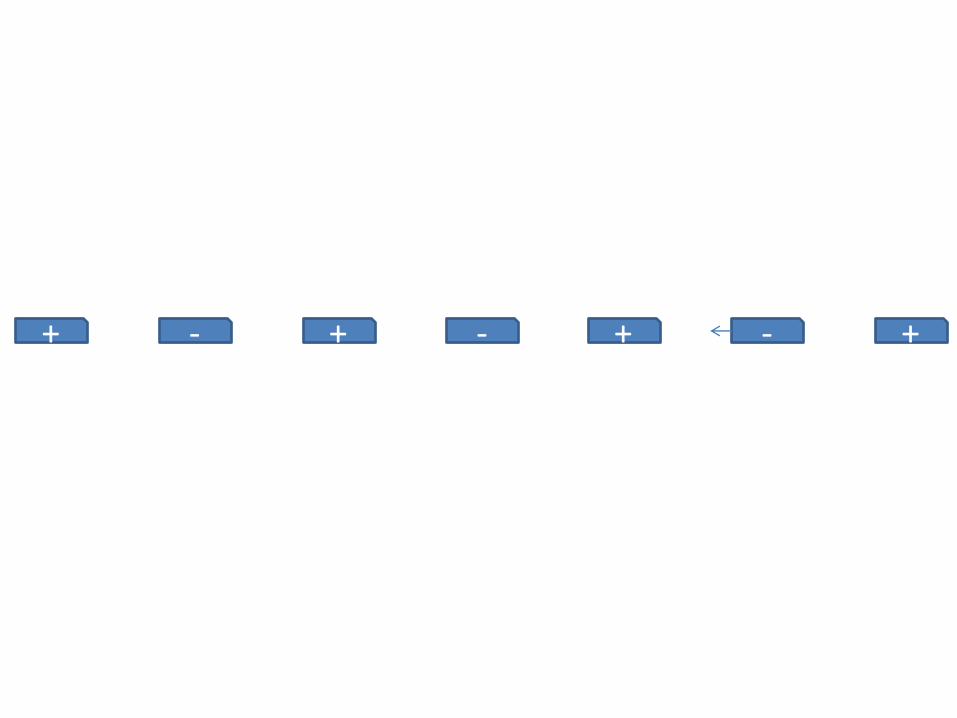
+ - + - + - +
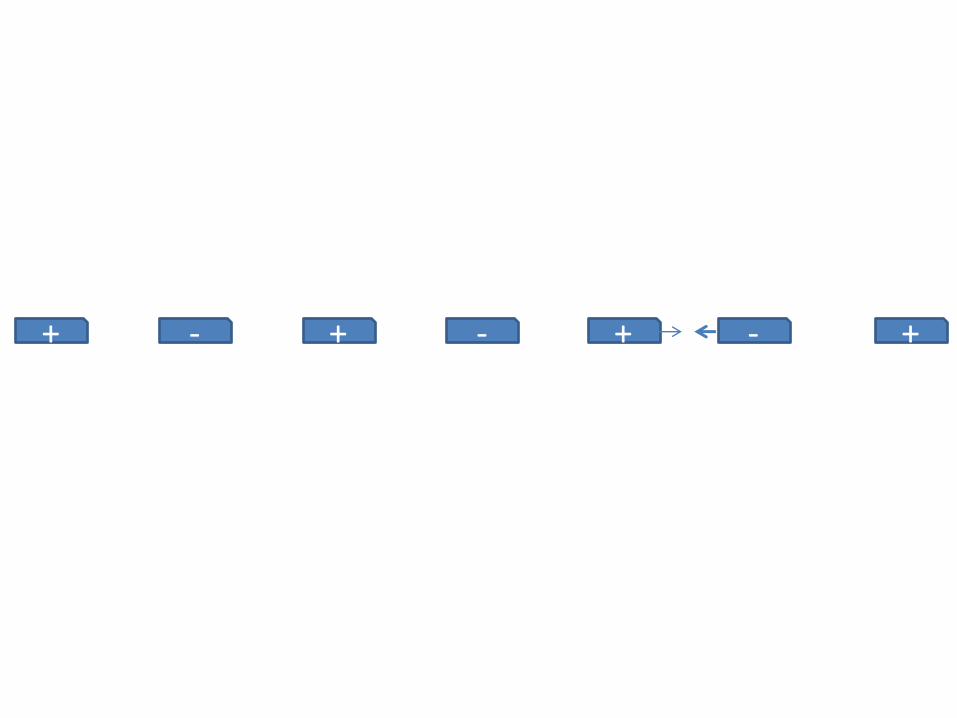
+ - + - + - +

+ - + - + - +

+ - + - + - +
And so on so forth. Our challenge is to keep an inherently unstable system: buses evenly spaced Now, if we want to prevent bunching from occurring … when is the right time to intervene?

Bus bunching is
specially serious,
where bus capacity
is an active
constraint.

Bus bunching
Severe problem if not controlled
Most passengers wait longer than they should for crowded
buses
Reduces reliability affecting passengers and operators
Affects Cycle time and capacity
Creates frictions between buses (safety)
Put pressure in the authority for more buses
Contribution: Control Mechanism to Avoid Bus Bunching!
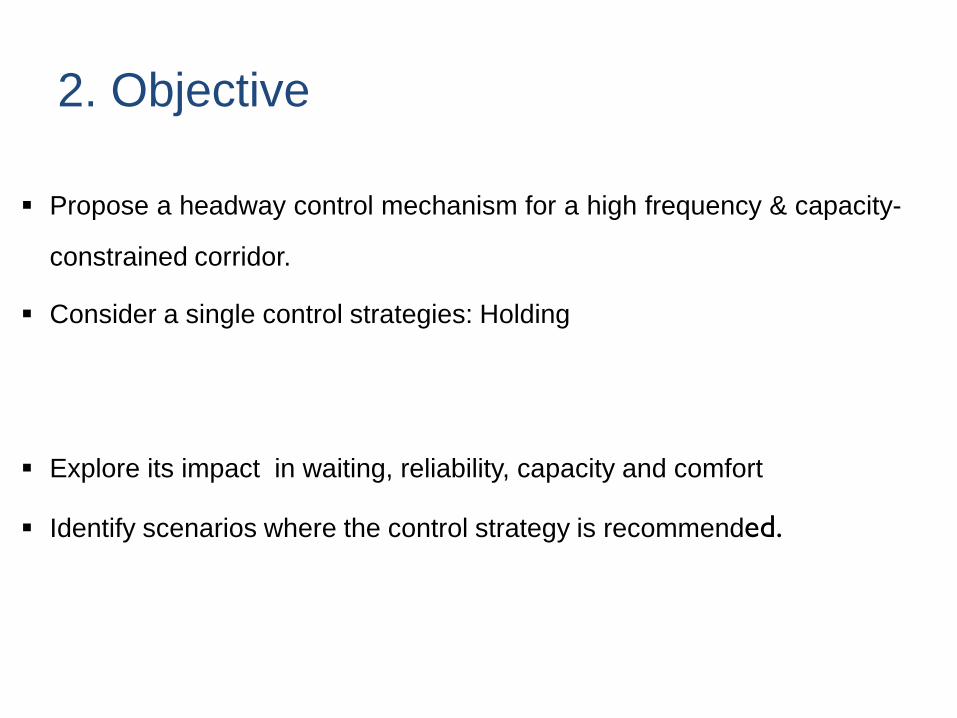
2. Objective
Propose a headway control mechanism for a high frequency & capacity-
constrained corridor.
Consider a single control strategies: Holding
Explore its impact in waiting, reliability, capacity and comfort
Identify scenarios where the control strategy is recommended.

3. Approach
Based on real-time information (or estimations) about:
Bus position.
Bus loads.
# of Passengers waiting at each stop.
We run a rolling-horizon optimization model each time a bus reaches a stop or every certain amount of time (e.g. 2 minutes)
The model minimizes:
Time waiting for first bus + time waiting for subsequent buses +
+ time held + penalty for being prevented from boarding

4. Experiment: Simulation Scenarios
Scenario Bus capacity is
reached
Service frequency
1 Yes High
2 No High
3 Yes Medium
4 No Medium
One-way loop Transit corridor with 30 Stops

No control
Spontaneous evolution of the system.
Buses dispatched from terminal as soon as they arrive or until the design headway is
reached.
No other control action is taken along the route.
Threshold control
Myopic rule of regularization of headways between buses at every stop.
A bus can be held at every stop to reach a minimum headway with the previous bus.
Holding (HRT)
Solve the rolling horizon optimization model not including green extension or boarding
limits.
Estrategias de control simuladas 4. Experiment: Control strategies
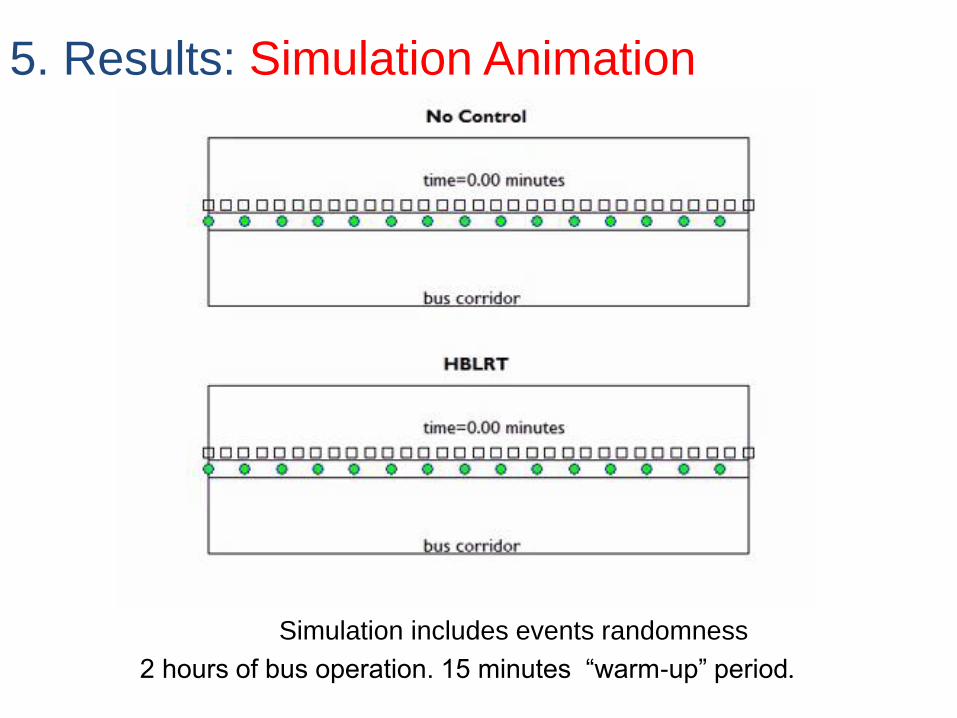
5. Results: Simulation Animation
Simulation includes events randomness
2 hours of bus operation. 15 minutes “warm-up” period.

No Threshold HRT
control control
Wfirst 4552.10 1220.47 805.33
Std. Dev. 459.78 310.43 187.28
% reduction -73.19 -82.31
Wextra 1107.37 661.70 97.49
Std. Dev. 577.01 1299.95 122.59
% reduction -40.25 -91.20
Win-veh 270.57 6541.56 1649.28
Std. Dev. 36.00 868.74 129.56
% reduction 2317.74 509.57
Tot 5930.03 8423.73 2552.10
Std. Dev. 863.80 2377.11 390.01
% reduction 42.05 -56.96
5. Results: Time savings

5. Results: Time-space trajectories
No Control Threshold
0 20 40 60 80 100 1200
1
2
3
4
5
6
7
8
9
10s2 NETS sc corrida17
Dis
tance (
Km
)
Time(minutes)0 20 40 60 80 100 120
0
1
2
3
4
5
6
7
8
9
10Scenario 1 threshold run17
Dis
tance (
Km
)
Time(minutes)

5. Results: Time-space trajectories
No
Co
ntr
ol
Th
resh
old
0 20 40 60 80 100 1200
1
2
3
4
5
6
7
8
9
10s2 NETS sc corrida17
Dis
tance (
Km
)
Time(minutes)
0 20 40 60 80 100 1200
1
2
3
4
5
6
7
8
9
10Scenario 1 threshold run17
Dis
tance (
Km
)
Time(minutes)
HRT
0 20 40 60 80 100 1200
1
2
3
4
5
6
7
8
9
10Scenario 1 threshold run17
Dis
tance (
Km
)
Time(minutes)

5. Results: Bus Loads
No Control Threshold
0 5 10 15 20 25 300
20
40
60
80
100
120Scenario 1 HBLRT alpha=05 Beta=05
Load (
Pax.)
Stop0 5 10 15 20 25 30
0
20
40
60
80
100
120Scenario 1 HBLRT alpha=05 Beta=05
Load (
Pax.)
Stop
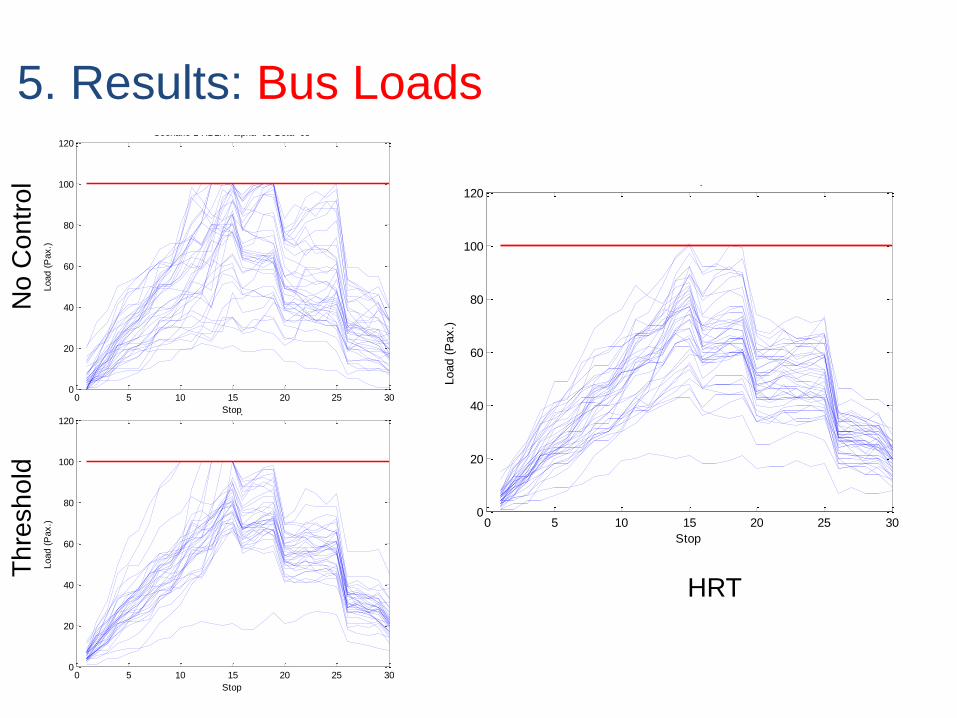
5. Results: Bus Loads
0 5 10 15 20 25 300
20
40
60
80
100
120Scenario 1 HBLRT alpha=05 Beta=05
Load (
Pax.)
Stop
0 5 10 15 20 25 300
20
40
60
80
100
120Scenario 1 HBLRT alpha=05 Beta=05
Load (
Pax.)
Stop
No
Co
ntr
ol
Th
resh
old
HRT
0 5 10 15 20 25 300
20
40
60
80
100
120Scenario 1 HBLRT alpha=05 Beta=05
Load (
Pax.)
Stop

5. Results: Cycle Time
No Control Threshold
25 30 35 40 450
50
100
150
200
250
300
350
mean =33.64
Std.Dev. =3.51
No control
Fre
quency
Cycle Time (Minutes)25 30 35 40 45
0
50
100
150
200
250
300
350
mean =35.62
Std.Dev. =1.38
HRT 05
Fre
quency
Cycle Time (Minutes)

5. Results: Cycle Time
25 30 35 40 450
50
100
150
200
250
300
350
mean =33.64
Std.Dev. =3.51
No control
Fre
quency
Cycle Time (Minutes)
25 30 35 40 450
50
100
150
200
250
300
350
mean =35.62
Std.Dev. =1.38
HRT 05
Fre
quency
Cycle Time (Minutes)
No
Co
ntr
ol
Th
resh
old
25 30 35 40 450
50
100
150
200
250
300
350
mean =32.11
Std.Dev. =1.2
HRT 05
Fre
quency
Cycle Time (Minutes)
HRT

5. Results: Waiting time Distribution
% of passengers that have to wait between:
Period 15-25 Period 25-120
0-2 min 2-4 min > 4 min 0-2 min 2-4 min > 4 min
No Control 57.76 29.60 12.64 63.46 27.68 8.86
Threshold Control 78.15 20.64 1.21 82.52 16.46 1.02
HRT 79.24 20.29 0.47 87.30 12.62 0.08

Disobeying Drivers
Similar disobedience across all drivers
A subset of drivers never obey
Technological
Disruption
Random signal fail
Failure in the signal receptor equipment
Signal-less zone
Homogeneous distribution across buses
Concentration in certain buses
Concentration in certain stops
6. Impact of implementation failures

Common disobedience rate across drivers
8000
9000
10000
11000
12000
13000
14000
15000
0%10%20%30%40%50%60%70%80%90%100%
Tota
l W
aiti
ng
Tim
e [M
in]
Obedience rate
HRT, Beta=0,5
Sin Control

0 20 40 60 80 100 1200
1
2
3
4
5
6
7
8
9
10
Dis
tancia
[K
m]
Tiempo [Minutos]0 20 40 60 80 100 120
0
1
2
3
4
5
6
7
8
9
10
Dis
tan
cia
[K
m]
Tiempo [Minutos]
0 20 40 60 80 100 1200
1
2
3
4
5
6
7
8
9
10
Dis
tancia
[K
m]
Tiempo [Minutos]0 20 40 60 80 100 120
0
1
2
3
4
5
6
7
8
9
10
Dis
tancia
[K
m]
Tiempo [Minutos]
HRT, 50% obedience HRT
HRT, 20% obedience No Control
Common disobedience rate across drivers
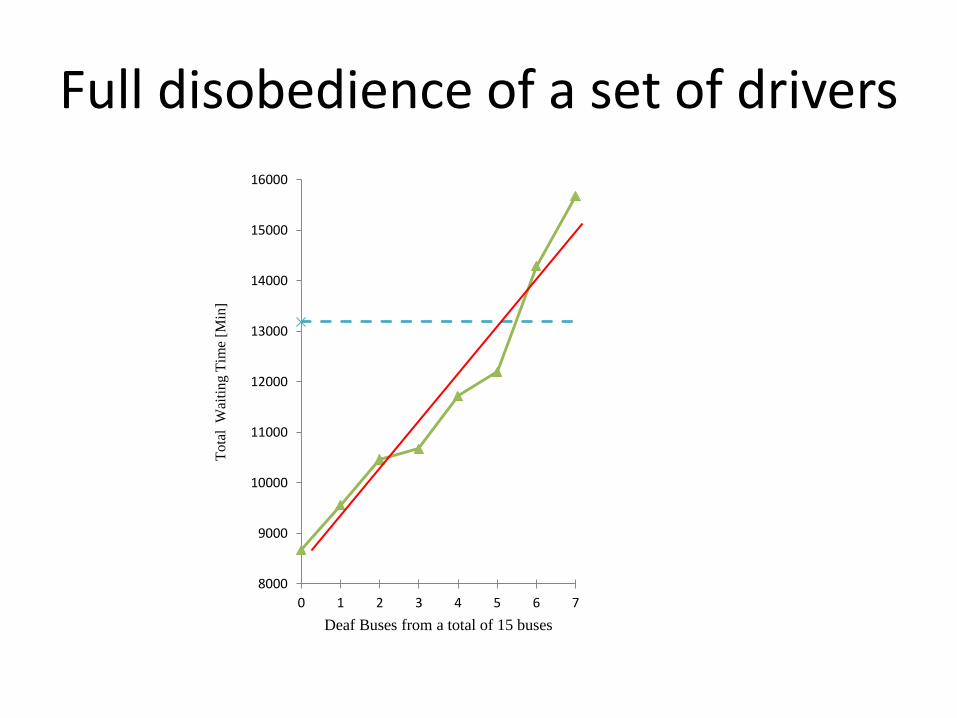
Full disobedience of a set of drivers
8000
9000
10000
11000
12000
13000
14000
15000
16000
0 1 2 3 4 5 6 7
Tota
l W
aiti
ng T
ime
[Min
]
Deaf Buses from a total of 15 buses
0 20 40 60 80 100 1200
1
2
3
4
5
6
7
8
9
10
Dis
tan
cia
[K
m]
Tiempo [Minutos]
0 20 40 60 80 100 1200
1
2
3
4
5
6
7
8
9
10
Dis
tan
cia
[K
m]
Tiempo [Minutos]0 20 40 60 80 100 120
0
1
2
3
4
5
6
7
8
9
10
Dis
tan
cia
[K
m]
Tiempo [Minutos]
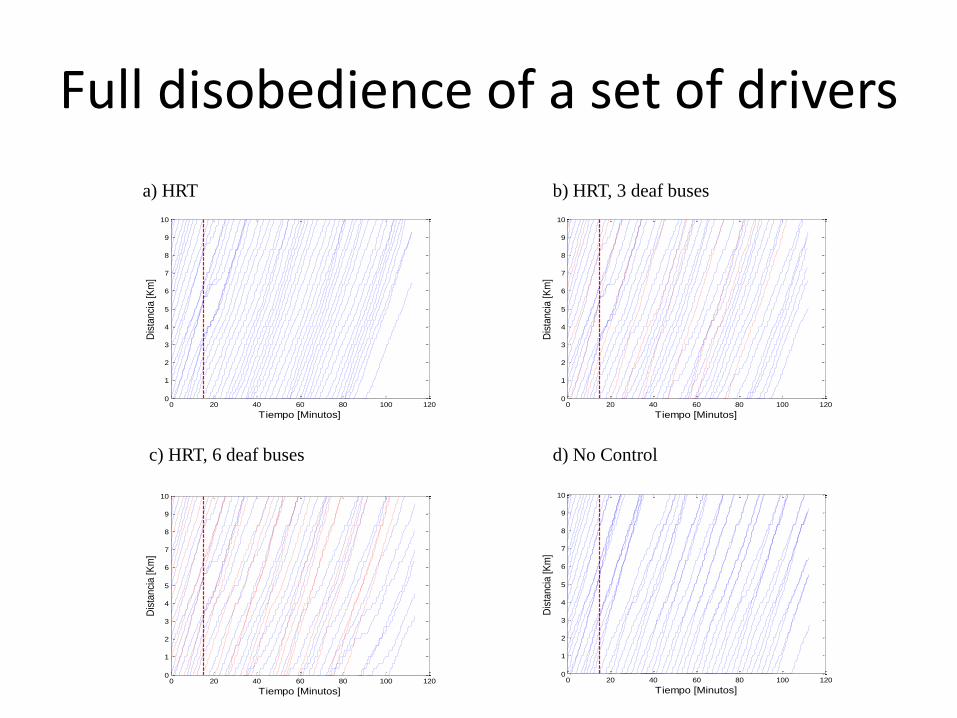
b) HRT, 3 deaf buses a) HRT
c) HRT, 6 deaf buses d) No Control
0 20 40 60 80 100 1200
1
2
3
4
5
6
7
8
9
10
Dis
tan
cia
[K
m]
Tiempo [Minutos]
Full disobedience of a set of drivers

7. Implementation
• The first pilot plan consisted in implemnting our holding
tool in buses of line 210 of SuBus from Transantiago
(Santiago, Chile) along its full path from 7:00 to 9:30 AM.
• We chose 24 out of 130 stops to hold buses
• One person in each of these 24 stops received text
messages (from a central computer) into their cell
phones indicating when each bus should depart from the
stop.

Plan Description

Implementation
Real time GPS information of each bus
Program optimizing dispatch times for each bus from each stop
Text messages were sent automatically to each person in each of the 24 stops
Buses are held according to the text message instructions (never more than one minute)

Control Points

The results were very promising even though the conditions were far
from ideal
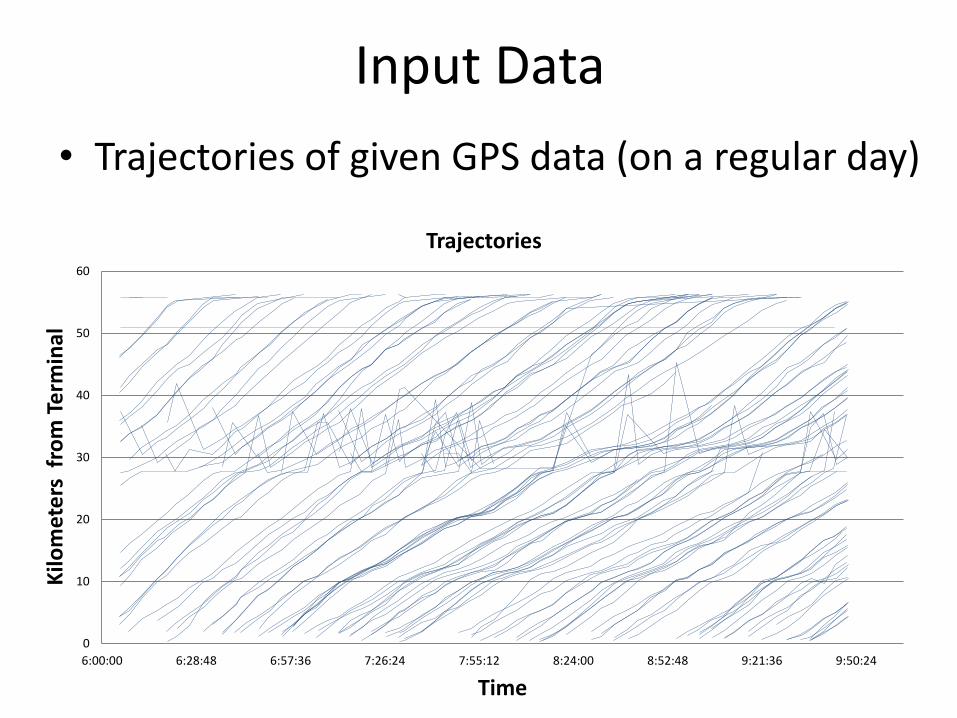
Input Data
• Trajectories of given GPS data (on a regular day)
0
10
20
30
40
50
60
6:00:00 6:28:48 6:57:36 7:26:24 7:55:12 8:24:00 8:52:48 9:21:36 9:50:24
Kilo
met
ers
fro
m T
erm
inal
Time
Trajectories

Input Data • The trajectiories traveled by buses can be
inferred as:
0
10
20
30
40
50
60
6:00:00 6:28:48 6:57:36 7:26:24 7:55:12 8:24:00 8:52:48 9:21:36 9:50:24
Kilo
met
ers
fro
m T
erm
inal
Time
Corrected Trajectories for a typical day

Pilot Analysis
• Trajectories of our experiment
0
10
20
30
40
50
60
6:00:00 6:28:48 6:57:36 7:26:24 7:55:12 8:24:00 8:52:48 9:21:36 9:50:24
Kilo
me
ters
fro
m T
erm
inal
Time
Pilot Corrected Trajectories

Pilot Analysis
• Again… versus a regular day
0
10
20
30
40
50
60
6:00:00 6:28:48 6:57:36 7:26:24 7:55:12 8:24:00 8:52:48 9:21:36 9:50:24
Kilo
met
ers
fro
m T
erm
inal
Time
Corrected Trajectories

• Difference between the projected departure time and the actual departure time
0
1
2
3
4
5
6
7
8
9
10
-10
20
-96
0
-90
0
-84
0
-78
0
-72
0
-66
0
-60
0
-54
0
-48
0
-42
0
-36
0
-30
0
-24
0
-18
0
-12
0
-60 0
60
12
0
18
0
24
0
30
0
36
0
42
0
48
0
54
0
60
0
66
0
72
0
78
0
84
0
90
0
96
0
10
20
Mo
re
Fre
cue
nci
a
Diferencia (s)
Parada 2/(M) Mirador
The speeds we used need fine-tuning
Unbiased prediction
Significant dispersion

• Difference between the projected departure time and the actual departure time
The speeds we used need fine-tuning
0
2
4
6
8
10
12
14
16
-10
20
-96
0
-90
0
-84
0
-78
0
-72
0
-66
0
-60
0
-54
0
-48
0
-42
0
-36
0
-30
0
-24
0
-18
0
-12
0
-60 0
60
12
0
18
0
24
0
30
0
36
0
42
0
48
0
54
0
60
0
66
0
72
0
78
0
84
0
90
0
96
0
10
20
Mo
re
Fre
cue
nci
a
Diferencia (s)
Parada 2/ (M) Santa Isabel
Biased prediction
Significant dispersion

Main results
• Transantiago computes an indicator for regularity based on intervals exceeding twice the expected headway (and for how much).
0
2
4
6
8
10
12
14
Piloto1 Prueba8 Prueba9 Prueba10 Prueba11 Prueba12 Prueba13 Prueba14 Prueba15 Prueba16 Prueba17
ICR Aproximado PM y TPM (UF)
Fines due to regularity on that day dropped around 50%
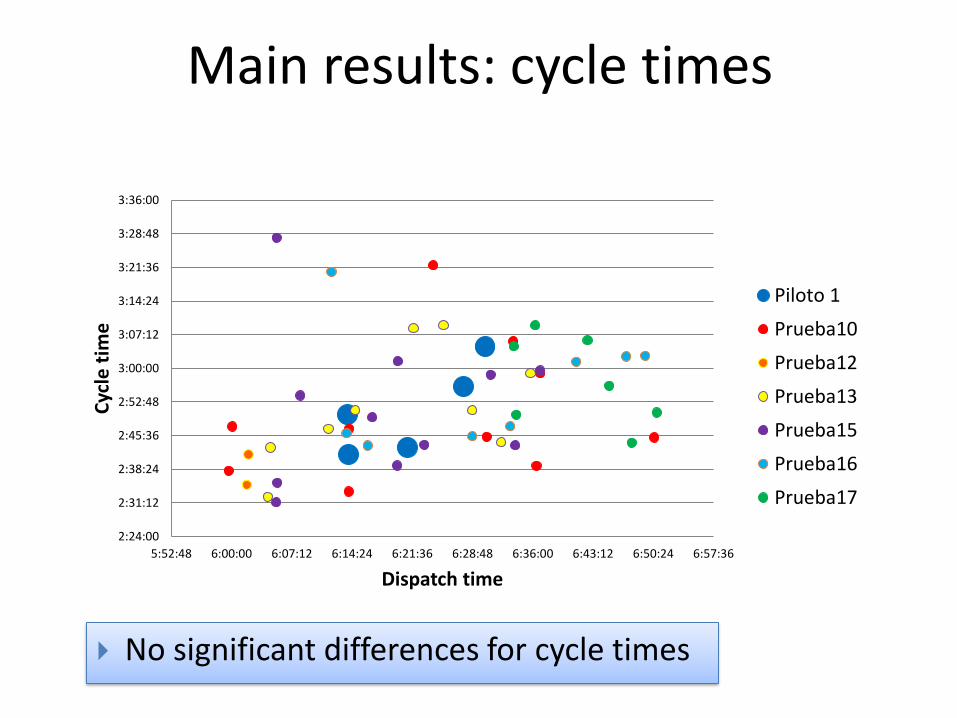
Main results: cycle times
2:24:00
2:31:12
2:38:24
2:45:36
2:52:48
3:00:00
3:07:12
3:14:24
3:21:36
3:28:48
3:36:00
5:52:48 6:00:00 6:07:12 6:14:24 6:21:36 6:28:48 6:36:00 6:43:12 6:50:24 6:57:36
Cyc
le t
ime
Dispatch time
Piloto 1
Prueba10
Prueba12
Prueba13
Prueba15
Prueba16
Prueba17
No significant differences for cycle times

Unexpected result
• The demand captured by the line grew!

Can we quantify this impact?
• Line 210 captured an extra 20% demand!
94.000
96.000
98.000
100.000
102.000
104.000
106.000
7.400 7.600 7.800 8.000 8.200 8.400 8.600 8.800
Demand for Line 210 (pax)
Demand on All lines
(pax)

This pilot plan can improve significantly
1) GPS errors can be corrected
2) Run the Optimization more often (from 3.5 to 2 min)
3) Calibrate speeds and arrival rates
4) Check data inputs before feeding the system
And more importantly:
5) Bypass the person at the stop. Communicate to drivers
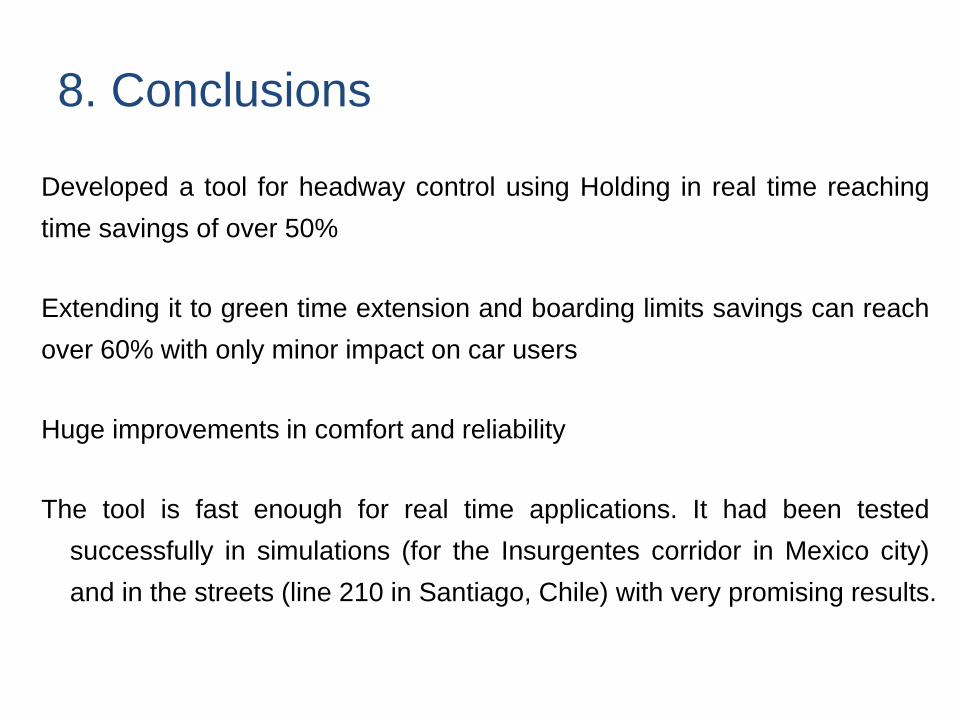
8. Conclusions
Developed a tool for headway control using Holding in real time reaching
time savings of over 50%
Extending it to green time extension and boarding limits savings can reach
over 60% with only minor impact on car users
Huge improvements in comfort and reliability
The tool is fast enough for real time applications. It had been tested
successfully in simulations (for the Insurgentes corridor in Mexico city)
and in the streets (line 210 in Santiago, Chile) with very promising results.

Publications and working papers
• Delgado, F., Muñoz, J.C., Giesen, R., Cipriano, A. (2009) Real-Time Control of Buses in a Transit Corridor Based on Vehicle Holding and Boarding Limits. Transportation Research Record, Vol 2090, 55-67
• Munoz, J.C. and Giesen, R. (2010). Optimization of Public Transportation Systems. Encyclopedia of Operations Research and Management Science, Vol 6, 3886-3896.
• Delgado, F., J.C. Muñoz and R. Giesen (2012) How much can holding and limiting boarding improve transit performance? Trans Res Part B, , vol.46 (9), 1202-1217
• Muñoz, J.C., C. Cortés, F. Delgado, F. Valencia, R. Giesen, D. Sáez and A. Cipriano (2011) Comparison of dynamic control strategies for transit operations. Submitted to Trans Res Part C.
Roles for Richer Data and Better Analysis in Improving the
Effectiveness of Transit Systems
Nigel H.M. Wilson
January 25, 2013
11:00 AM (Boston time)

Minimizing Bus Bunching Results from a new strategy that cuts wait
times, improve comfort and brings reliability to bus services
Juan Carlos Muñoz, Felipe Delgado, Ricardo Giesen
William Phillips, Sergio Ariztía and Daniel Hernández Department of Transport Engineering and Logistics
Pontificia Universidad Católica de Chile