Webinar: Findings From 15 Years Of Travel Surveys At ...
38
Portland State University Portland State University PDXScholar PDXScholar TREC Webinar Series Transportation Research and Education Center (TREC) 6-2-2020 Webinar: Findings From 15 Years Of Travel Surveys Webinar: Findings From 15 Years Of Travel Surveys At Portland Area Transit-oriented Developments At Portland Area Transit-oriented Developments (TODs) (TODs) Jennifer Dill Portland State University, [email protected] Nathan McNeil Portland State University, [email protected] Follow this and additional works at: https://pdxscholar.library.pdx.edu/trec_webinar Part of the Transportation Commons, Urban Studies Commons, and the Urban Studies and Planning Commons Let us know how access to this document benefits you. Recommended Citation Recommended Citation Dill, Jennifer and McNeil, Nathan, "Webinar: Findings From 15 Years Of Travel Surveys At Portland Area Transit-oriented Developments (TODs)" (2020). TREC Webinar Series. 51. https://pdxscholar.library.pdx.edu/trec_webinar/51 This Book is brought to you for free and open access. It has been accepted for inclusion in TREC Webinar Series by an authorized administrator of PDXScholar. Please contact us if we can make this document more accessible: [email protected].
Transcript of Webinar: Findings From 15 Years Of Travel Surveys At ...

Portland State University Portland State University
PDXScholar PDXScholar
TREC Webinar Series Transportation Research and Education Center (TREC)
6-2-2020
Webinar: Findings From 15 Years Of Travel Surveys Webinar: Findings From 15 Years Of Travel Surveys
At Portland Area Transit-oriented Developments At Portland Area Transit-oriented Developments
(TODs) (TODs)
Jennifer Dill Portland State University, [email protected]
Nathan McNeil Portland State University, [email protected]
Follow this and additional works at: https://pdxscholar.library.pdx.edu/trec_webinar
Part of the Transportation Commons, Urban Studies Commons, and the Urban Studies and Planning
Commons
Let us know how access to this document benefits you.
Recommended Citation Recommended Citation Dill, Jennifer and McNeil, Nathan, "Webinar: Findings From 15 Years Of Travel Surveys At Portland Area Transit-oriented Developments (TODs)" (2020). TREC Webinar Series. 51. https://pdxscholar.library.pdx.edu/trec_webinar/51
This Book is brought to you for free and open access. It has been accepted for inclusion in TREC Webinar Series by an authorized administrator of PDXScholar. Please contact us if we can make this document more accessible: [email protected].

Findings from 15 Years of Travel Surveys at Portland area Transit-oriented DevelopmentsJennifer Dil l , PhD. and Nathan McNeil

AgendaØDefining TODsØTODs in Portland
ØPSU Surveys
ØFindings: Who lives in TODs?ØFindings: How do TOD residents travel?
Ø“Revisiting TODs” – Change over time

What is a Transit-Oriented Development?Pedestrian-friendly, mixed-use developments within walking distance of a rail transit station and a core commercial area (Calthorpe The Next American Metropolis 1993)
Broad concept that includes any development that benefits from its proximity to a transit facility and that generates significant transit ridership. (MARTA, Atlanta)
Projects near transit stops that: reduce automobile dependence; encourage high shares of pedestrian and bicycle access trips to transit; help to foster safe station environments; enhance physical connections to transit stations from surrounding areas; and provide a vibrant mix of land-use activities. (WMATA, DC)

TODs in the Portland region
Orenco Station Beaverton Round

Metro TOD Program
“Metro’s Transit-Oriented Development Program strategically invests to help more people live, work and shop in neighborhoods served by high-quality transit.”
PSU Surveys
20052007201020142018

Houses and TownhomesSingle-family, Small Lot 1.5 to 2 Story Town Homes
Orenco Station single family housing (SFH, duplexes, triplexes)
Landmark, Gresham

2- to 3-Story Townhomes
Center Commons, Portland Oneonta, Gresham
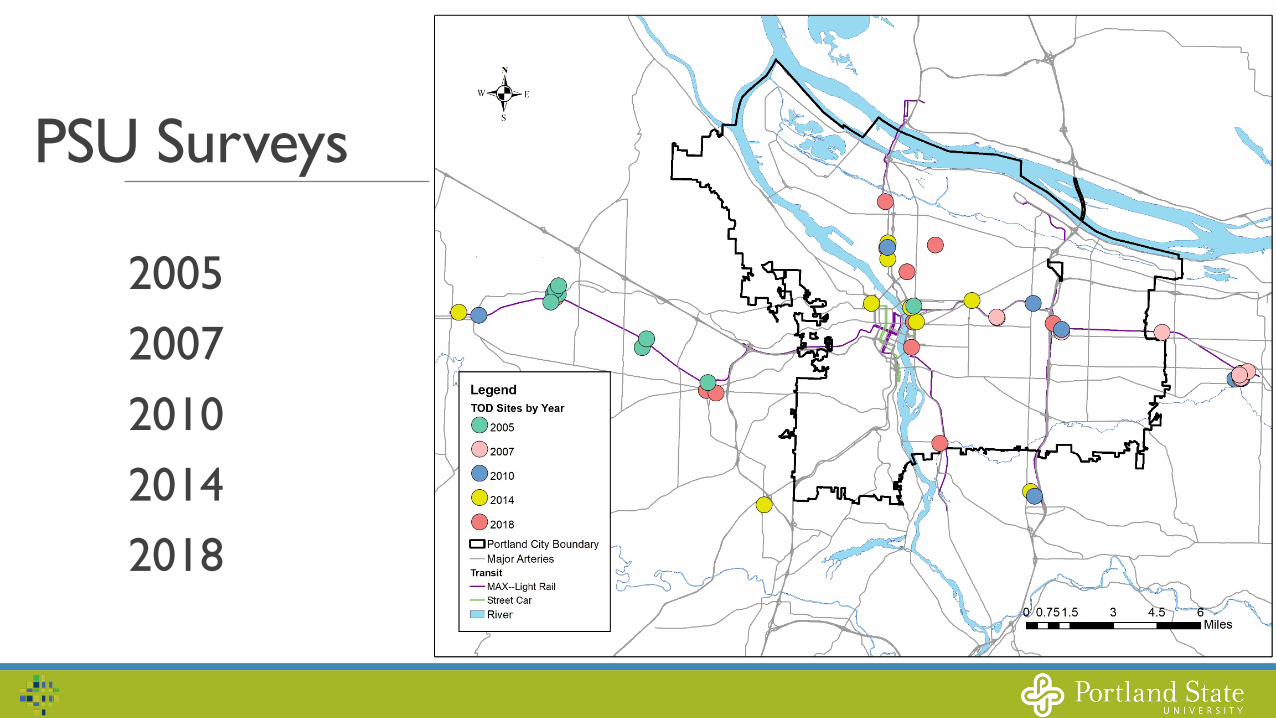
3 to 4-story Apartment/Condo Buildings(some with ground floor retail)
Nexus, Hillsboro (Orenco) Central Point, Gresham

5+ story Apartment Buildings,many with ground floor retail
Slate, Portland Hub 9, Hillsboro (Orenco)

Typical Methodology§ Survey packets sent via USPS or hand-delivered to doors.
§ Generally all occupied units in selected TODs
§ Worked with building managers
§ 2 full mailings plus a reminder postcard
§ Paper surveys with pre-paid return envelope plus online option 2014-current
§ Incentives offered - ~$5 gift card (e.g. Starbucks) and/or raffle

TOD Types§ High or low density:
• Jobs• Population
§ Transit Access and Walkability• Intersection density• Measure of transit access (# of
transit trips; jobs accessible by transit within 30 minutes)
• Distance to Station
TOD type High Transit Access
Low Transit Access
High Density
High Transp. High Density
(n=9)
Low Transp. High Density
(n=3)
Low DensityHigh Transp. Low Density
(n=11)
Low Transp. Low Density
(n=20)

Who lives in the TODs?1.7 persons per household45% in 1-person households44% in 2-person householdsOnly 10% have a child under 16
21% were 65 or older,but only 6-9% in TODs not limited to older adults
42% are under 20-34 years old
19% have household incomes < $25kMedian income: $50-75k
61% have a 4-yr college degree
21% are people of color (non-white and/or Hispanic)
Surrounding cities:7-36% in 1-person households26-34% in 2-person households23-56% have a child under 18
10-15% are 65+
20-37% age 20-34
4-25% have household incomes under $25kMedian income: $50-63k
18-46% have a 4-yr college degree (of age 25+)
17-28% not one-race, white

How do TOD residents travel?Vehicle ownership
Commuting
Non-commute trips
Trip generation
Changes in mode use since moving to TOD
Role of housing preferences and attitudes

Low vehicle ownership60-75% of the respondents are in a household with zero or one motor vehicle
In the surrounding cities, 22% of the 1-and 2-person households have zero or one motor vehicle.
36% of TOD residents live in a household with fewer vehicles than people of driving age (16+)
15% 18% 16%7% 12%
57% 52% 60%
55%57%
23% 30% 21%
32%27%
0%
10%
20%
30%
40%
50%
60%
70%
80%
90%
100%
High Transp. Low Transp. High Transp. Low Transp.
High Density High Density Low Density Low Density Overall
0 1 2 3+

High levels of transit use for commuting17-27% of the TOD residents commute to work or school primarily by transit.
1-12% of workers in the surrounding cities commute mainly by transit.
10% of TOD residents switched from commuting primarily by private vehicle to transit since moving to the TOD.
50% 58% 64% 63% 59%
27% 19% 17% 22% 22%
12% 17% 8% 5% 8%12% 6% 12% 11% 11%
High Transp. Low Transp. High Transp. Low Transp.
High Density High Density Low Density Low Density Overall
Private vehicle Public transit Walk or bike Combination
Surrounding cities:% of workers commuting by transit2011 5-year ACS data

Lower rates of transit use for non-commute tripsSome differences based on TOD type: rates of High-High TOD residents sometimes higher than Low density TOD residents. 0%
5%
10%
15%
20%
25%
30%
35%
40%
45%
commute restaurants,bars, coffee
stores/shops entertainment serviceprovider
park/openspace
visit friends orfamily
High Density-High Transp. High Density-Low Transp.
Low Density-High Transp. Low Density-Low Transp.
% using transit once a week or more for this trip purpose

TOD residents are walking/biking to destinationsDifferences between TOD types reveal different patterns.
Overall, residents walked to businesses in neighborhood an average of 8.8 times in the past 30 days.
Higher in High-High TODs (10.2) vs. Low-Low TODs (7.8).
0%
10%
20%
30%
40%
50%
60%
70%
restaurants,bars, coffee
stores/shops entertainment serviceprovider
park/openspace
visit friends orfamily
gym/indoorrecreation
0%
10%
20%
30%
40%
50%
60%
70%
restaurants,bars, coffee
stores/shops entertainment serviceprovider
park/openspace
visit friends orfamily
gym/indoorrecreation
High Density-High Transp. High Density-Low Transp. Low Density-High Transp. Low Density-Low Transp.
Transit once a week
Walk/bike once a week

Trip Generation
ITE Trip Generation Manual, 9th Edition, 2012.
Name (code) Avg. Low High # Studies
Single Family Detached (210) 9.52 4.31 21.85 198
Apartment (220) 6.65 1.27 12.50 88
Low Rise Apt. (221) 6.59 5.10 9.24 22
High Rise Apt. (222) 4.20 3.00 6.45 9
Mid Rise Apt. (223) 0
Condo/ Townhouse (230) 5.81 1.53 11.79 56
Low Rise Condo/ Townhouse (231) 0
High Rise Condo/ Townhouse (232) 4.18 3.91 4.93 4

Trip Generation: Home-based MV trips per unit
TOD type
High Transit Access
Low Transit Access
High Density
1.72 (n=6)
3.50 (n=3)
Low Density
2.45 (n=11)
2.41 (n=14)
ITE Trip Generation Manual, 10th Edition, 2017: Added mixed use, urban categories Portland Area TODs
Name (code) Unit Type Setting/
LocationAverage Rate
Range of Rates
# Studies
Multifamily Housing (Mid-Rise) (221)
Dwelling Units General Urban/ Suburban 5.44 1.27-12.50 27
Occupied Dwelling Units
General Urban/ Suburban 4.75 2.95-5.49 4
Dwelling Units Dense Multi-Use Urban 2.59 1
Occupied Dwelling Units
Dense Multi-Use Urban 3.83 2.39-6.18 3
Occupied Dwelling Units Center City Core 3.74 3.16-5.14 3
Mid-Rise Residential with 1st-Floor Comm. (231)
Dwelling Units General Urban/ Suburban 3.44 1
Occupied Dwelling Units
General Urban/ Suburban 3.62 1

Changes in mode use since moving to TODNo significant differences in shares stating they are driving a lot less now.
High-High TOD residents most likely to say they are using transit a lot more now, though only significantly more than the Low-High TOD residents.
0%
10%
20%
30%
40%
50%
60%
A lot less now A lot morenow
A lot less now A lot morenow
A lot less now A lot morenow
Drive Use public transit (bus or rail) Walk in your neighborhood
High Density-High Transp. High Density-Low Transp.
Low Density-High Transp. Low Density-Low Transp.

Living near transit was important to most residents
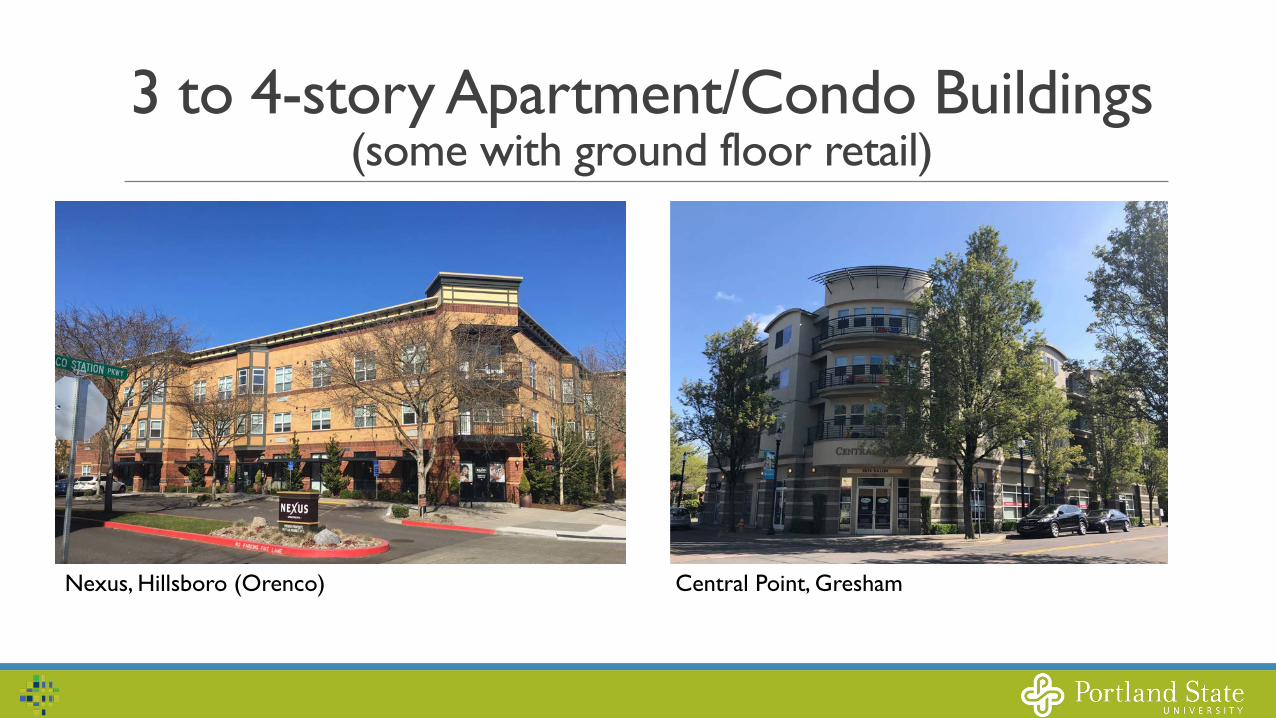
46% indicated that access to transit was “4: extremely important” in choosing their current home 26% rated it a 3 out of 4
The preference for living near transit did not vary between the types of TODs.
Attitudes and preferences are importantThe level of importance of transit access in housing choice is correlated with changes in travel by transit, but there is still increased transit use among those for whom it was not important.
Note: Does not include senior-focused TODs.
18%
26%29%
17%
5%
15%
27%
47%
0%
10%
20%
30%
40%
50%
60%
70%
1: Not at all important 2 3 4: ExtremelyImportant
A lot less now A little less nowAbout the same A little more nowA lot more now
46% indicated that access to transit was “4: extremely important” in choosing their current home 26% rated it a 3 out of 4
41%23%

Preferences are correlated with transit use
0%
5%
10%
15%
20%
25%
30%
35%
40%
45%
1: Not at allimportant
2 3 4: ExtremelyImportant
Takes transit to non-work destination weekly
Transit is primary commute mode

Preferences are correlated with transit useCommuting by transit goes up significantly among those with the highest preference for living near transit.
0%
5%
10%
15%
20%
25%
30%
35%
40%
45%
1: Not at allimportant
2 3 4: ExtremelyImportant
Takes transit to non-work destination weekly
Transit is primary commute mode
Transit was primary commute mode atprevious residence
14% pt. diff.

Conclusions (part 1)Demographics of TOD residents differs some from the surrounding cities, though likely mainly a function of the housing type
TOD residents are commuting by transit (more than surrounding cities)
TOD residents do not use transit much for non-commute travel◦ Residents are walking to nearby destinations
Trip generation is likely much lower than traditional ITE rates
Many TOD residents claim to be driving less and taking transit and walking more since moving to the TOD
Preference for transit plays a role in behavior, but not the only factor.
TOD is likely enabling people who want to use transit more to do so

Revisiting TODs & Neighborhood Change
Original surveys conducted between 2005 and 2018
NITC funded research conducted in 2018 and 2019 looking at change over time
Selection of Buildings
Survey Current Residents
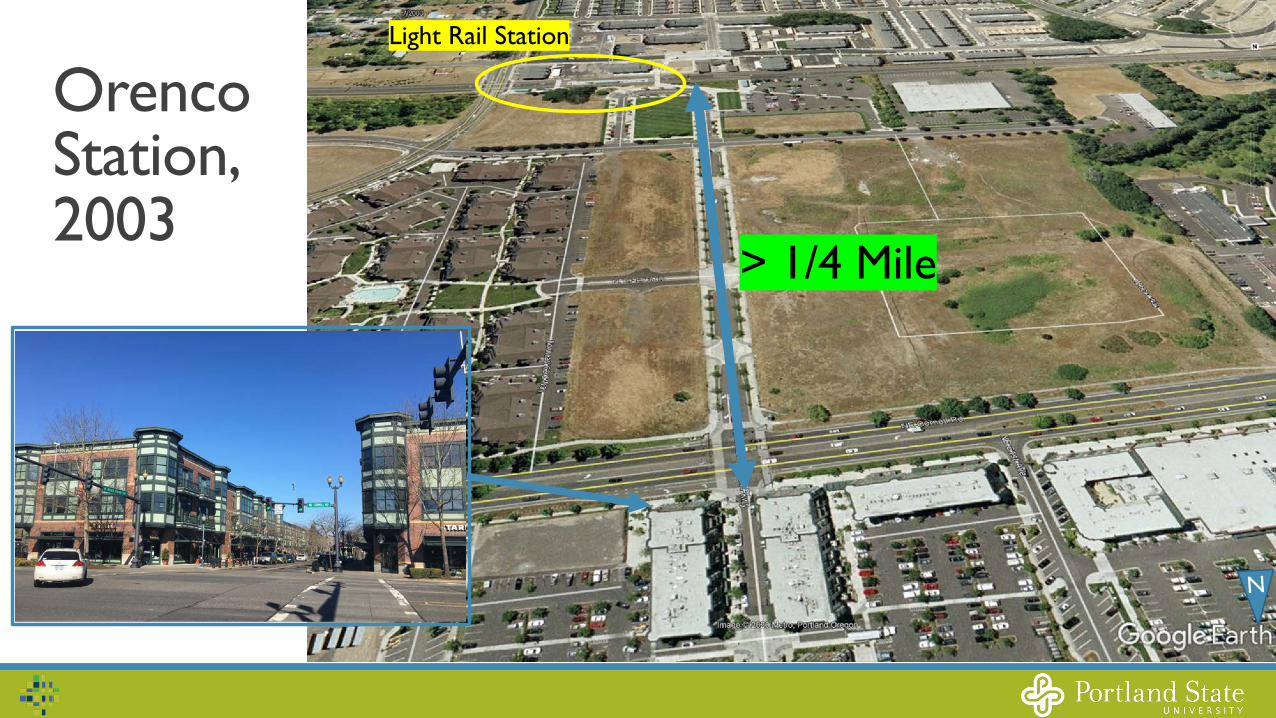
OrencoStation,2003
Light Rail Station
> 1/4 Mile
N

OrencoStation,2018
Light Rail Station
N

Beaverton Round,2005
Light Rail Station
N

Beaverton Round,2018
N

Neighborhood Change
BuildingLand-Use Change
Destinations Change
Walk Bike Network Change
Transit Change
East Portland TODs Minor Moderate None Yes
Gresham Central Minor Minor Major No
Gresham TODs Minor Moderate Major No
Beaverton Round Minor Major Minor No
Nexus Apartments Major Moderate Major No
Club 1201 Major Major Minor No
Orenco MFH Moderate Major None Yes
Elmonica Condos Major Minor Major No

Commuting at least once per week by …walking or biking to work at least one day a week rose from 9% to 29%
0%
10%
20%
30%
40%
50%
60%
70%
80%
Commute by DrivingAlone at Least Once
per Week
Commute by Transitat Least Once per
Week
Commute by Walkor Bike at least once
per weekBaseline
Wave 2

Commuting by Drive Aloneshare of people commuting to work by driving alone four to five days a week fell from 58% to 46%
the share never driving alone rose from 11% to 24%
0%
10%
20%
30%
40%
50%
60%
70%
80%
90%
100%
Beaverton Gresham Hillsboro Portland TODs2005 1-yr ACS 2010 1-yr ACS 2018 1-yr ACSOriginal Resurvey
Usual commute mode Commute mode 4-5 days/wk
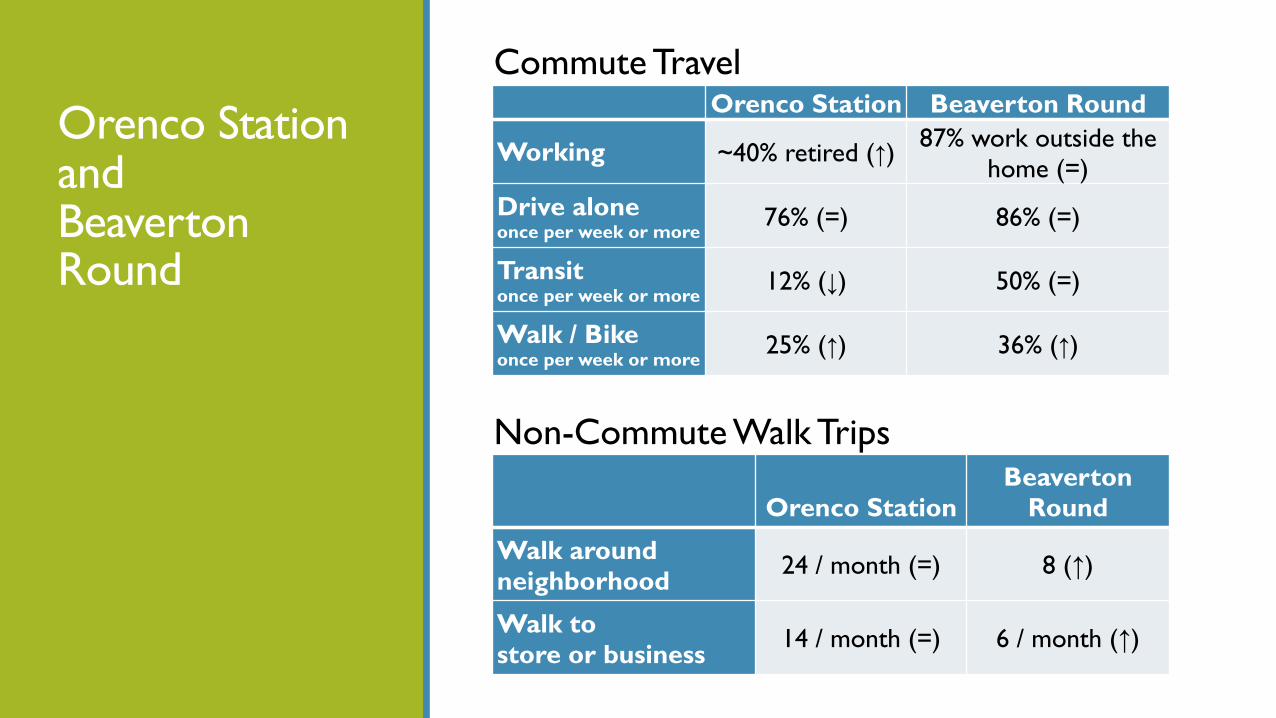
Orenco Station and Beaverton Round
Orenco Station Beaverton Round
Working ~40% retired (↑) 87% work outside the home (=)
Drive alone once per week or more
76% (=) 86% (=)
Transit once per week or more
12% (↓) 50% (=)
Walk / Bike once per week or more
25% (↑) 36% (↑)
Commute Travel
Orenco StationBeaverton
Round
Walk around neighborhood 24 / month (=) 8 (↑)
Walk to store or business 14 / month (=) 6 / month (↑)
Non-Commute Walk Trips

Revisiting TODs:Conclusions
§ Key results consistent with TOD objectives• Decrease in drive alone commuting• Increase in walk / bike commute• Share of people living in low-car households
(fewer cars than adults) increased from 34% to 50%
§ Increased preference for walking rather than driving
§ Fewer changes than expected in non-commute trips
§ Further modeling required to disentangle land use and demographic change
§ May have been limited by the variety of geographies

Findings From 15 Years of Travel Surveys at Portland Area Transit-oriented Developments (TODs)https:/ /trec .pdx.edu/research/project/1240
Jenni fer Di l l , PhD, jd i l [email protected]
Nathan McNei l , nmcnei [email protected]
Thank you!