Webinar 20120924
110
Webinar 20120924 GAP
-
Upload
chalokedotcom -
Category
Business
-
view
37.043 -
download
3
Transcript of Webinar 20120924
Webinar 20120924
GAP


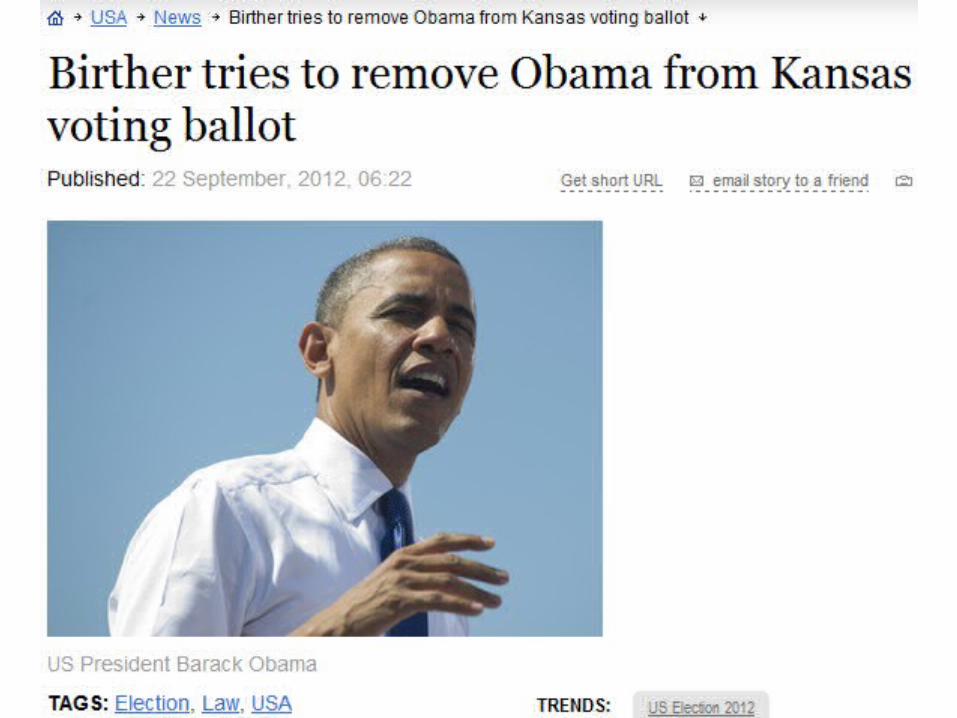

Taitz claims that Obama’s birth certificate is fraudulent and that the president is using a fake Social Security number from Connecticut. As a result of forging his US citizenship documents and committing identity theft, he should not be eligible to run for president again. The Kansas District Court Judge Larry Hendricks scheduled an Oct. 3 court hearing to consider removing Obama from the ballot.
Joe Montgomery, a Kansas resident who initially objected to Obama’s eligibility but then withdrew his claim, stated last week that Obama could not be US citizen because his father was a Kenyan and UK national Citizenship, he said, comes primarily from the father. After Montgomery and his family received threats, he withdrew his objection on Sept. 15 – the claim which the board based its decision on.


2004 & 2012 Endorsed by the Communist Party CPUSA
8/17/2007 to SEIU: (Y)our agenda's been my agendaService Employees International Union (SEIU) is a labor union representing about 1.8 million workers in over 100 occupations in the United States
7/13/2008 to La Raza: (We) rise and fall together as one people ... And together, ... we will transform this nation.La Raza, Spanish language, translates to "race", the product of gradual racial mixing
1/17/2008 If somebody wants to build a coal-powered plant, they can, It's just that it will bankrupt them ... under my plan of a cap-and-trade system, electricity rates would necessarily skyrocket


What’s the hidden reason behind the war in Afghanistan? Uranium mines? The Trans-Afghan pipeline? Geostrategic position? Or perhaps the control of drug trafficking?


CrudeOil


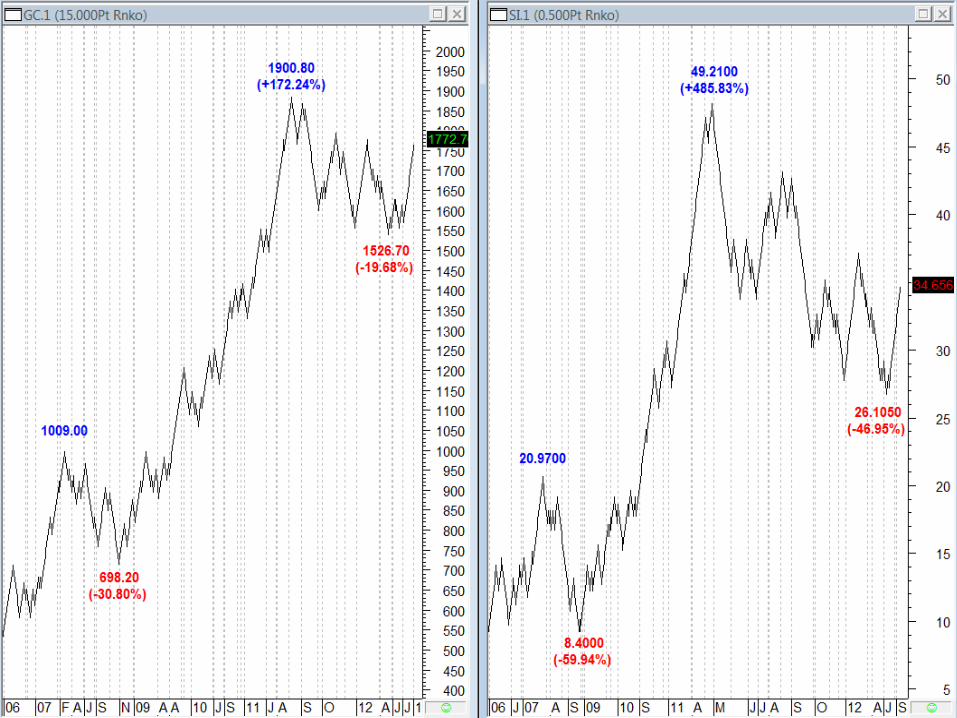
Gold


Gold or Silver?


Rubber


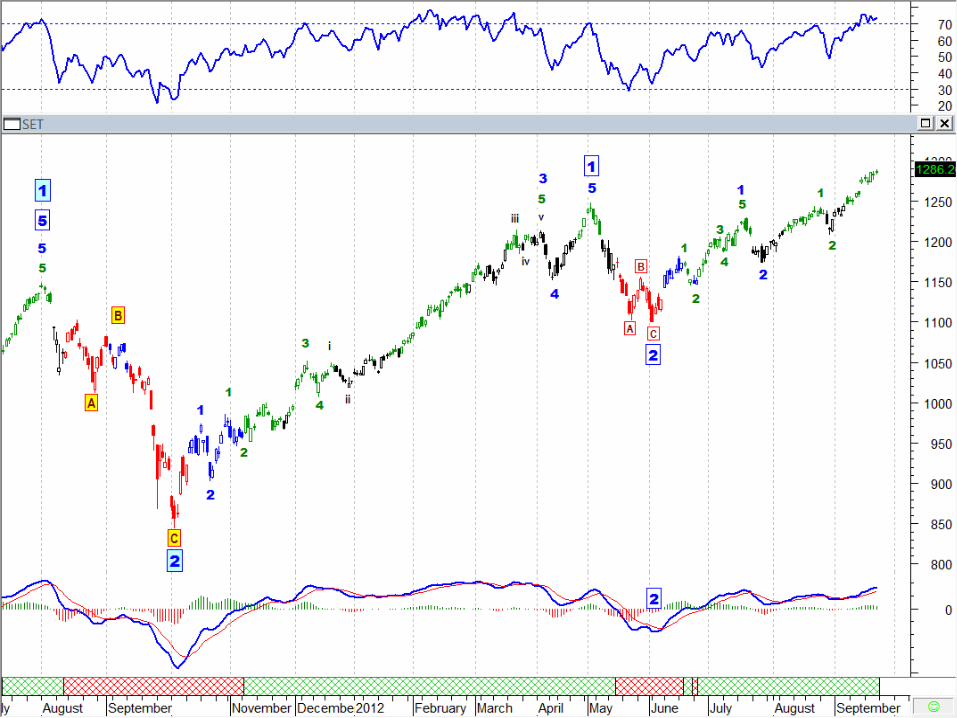
SET


Gaps andGap Analysis

Have you ever wondered what causes gaps in price charts and what they mean? Well, you've come to the right place. Just in case, a gap is an area on a price chart in which there were no trades. Normally this occurs between the close of the market on one day and the next day's open. Lot's of things can cause this, such as an earnings report coming out after the stock market has closed for the day. If the earnings were significantly higher than expected, many investors might place buy orders for the next day. This could result in the price opening higher than the previous day's close. If the trading that day continues to trade above that point, a gap will exist in the price chart. Gaps can offer evidence that something important has happened to the fundamentals or the psychology of the crowd that accompanies this market movement. Before we get into the different types of gaps, here is a chart showing a gap so you will know what we are talking about


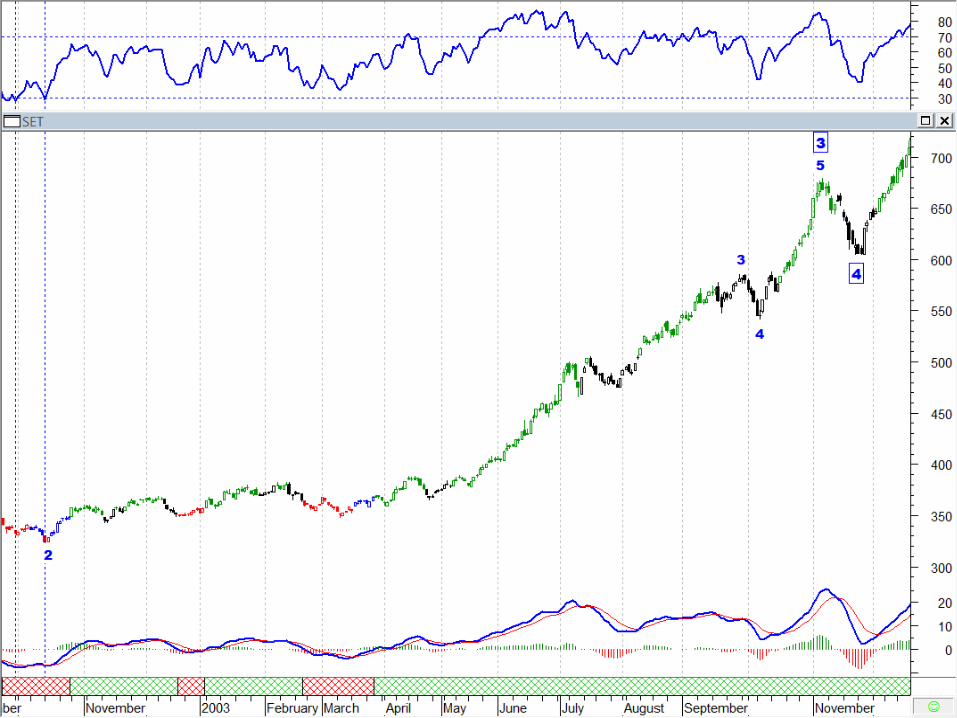
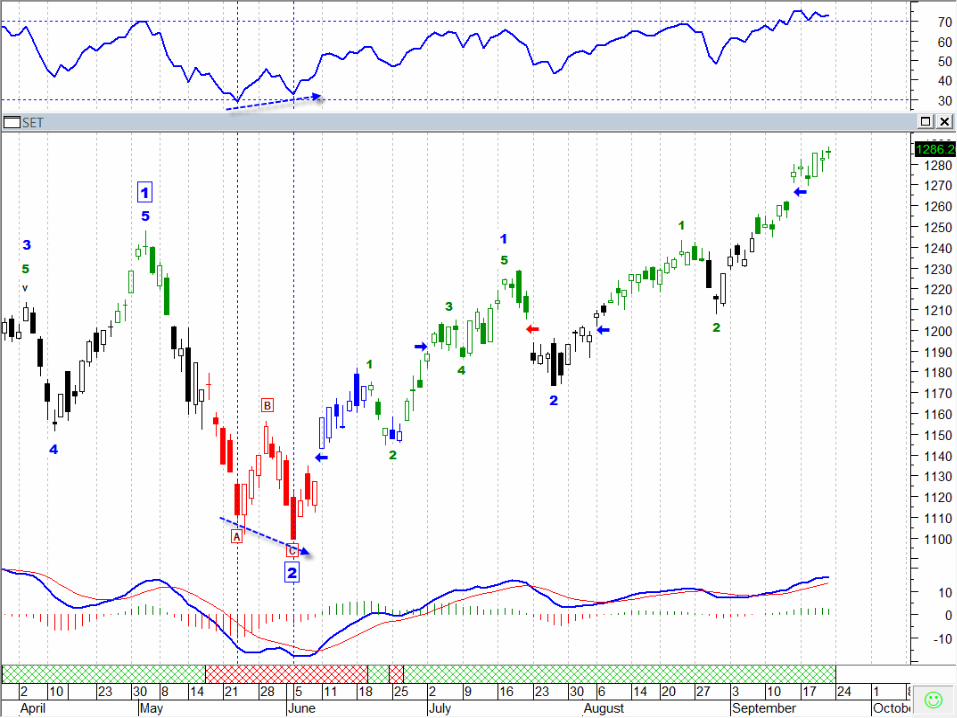
Common GapsSometimes referred to as a trading gap or an area gap, the common gap is usually uneventful. In fact, they can be caused by a stock going ex-dividend when the trading volume is low. These gaps are common (get it?) and usually get filled fairly quickly. "Getting filled" means that the price action at a later time (few days to a few weeks) usually retraces at the least to the last day before the gap. This is also known as closing the gap. Here is a chart of two common gaps that have been filled. Notice that after the gap the prices have come down to at least the beginning of the gap? That is called closing or filling the gap.


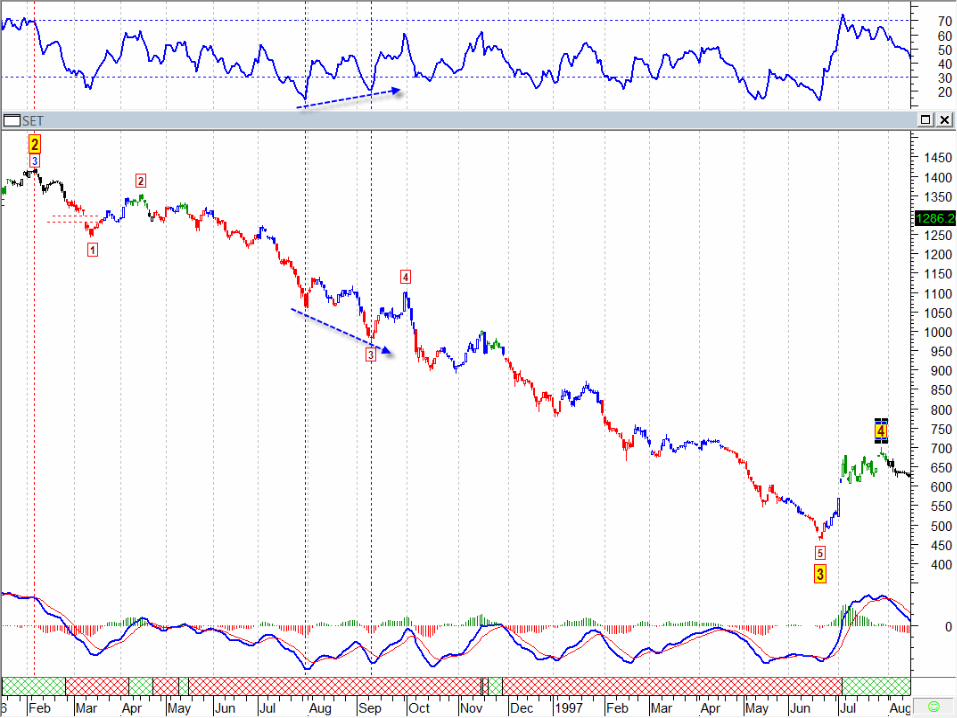
Volume will (should) pick up significantly, for not only the increased enthusiasm, but many are holding positions on the wrong side of the breakout and need to cover or sell them. It is better if the volume does not happen until the gap occurs. This means that the new change in market direction has a chance of continuing. The point of breakout now becomes the new support (if an upside breakout) or resistance (if a downside breakout). Don't fall into the trap of thinking this type of gap, if associated with good volume, will be filled soon. It might take a long time. Go with the fact that a new trend in the direction of the stock has taken place, and trade accordingly. Notice in the chart below how prices spent over 2 week without going lower than about 1100. When they did, it was with increased volume and a breakaway gap.

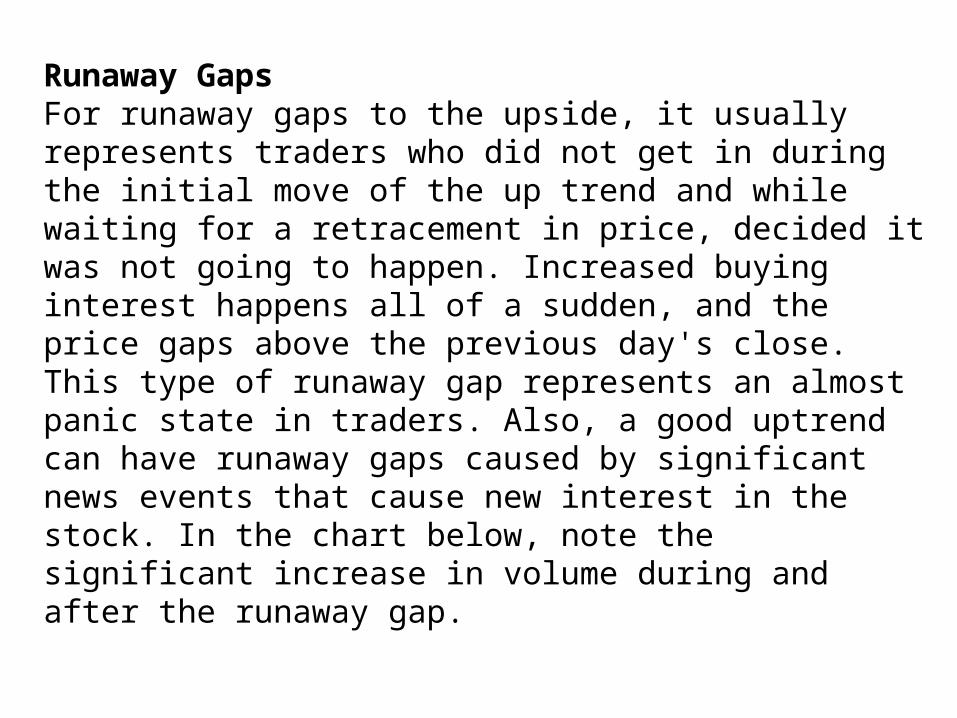
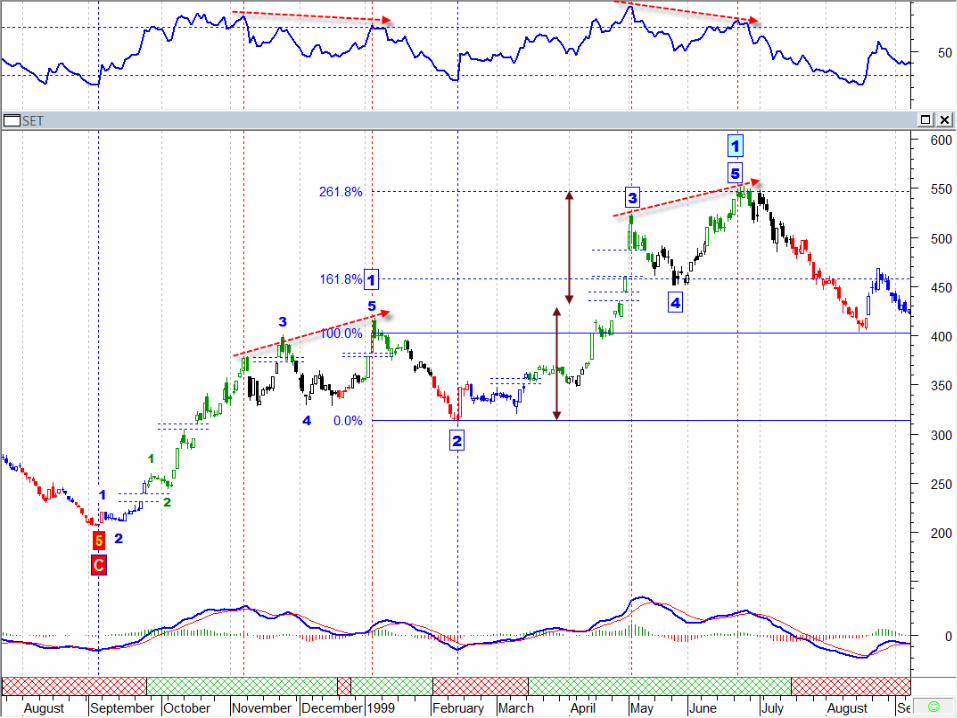
Runaway GapsFor runaway gaps to the upside, it usually represents traders who did not get in during the initial move of the up trend and while waiting for a retracement in price, decided it was not going to happen. Increased buying interest happens all of a sudden, and the price gaps above the previous day's close. This type of runaway gap represents an almost panic state in traders. Also, a good uptrend can have runaway gaps caused by significant news events that cause new interest in the stock. In the chart below, note the significant increase in volume during and after the runaway gap.


Runaway gaps can also happen in downtrends. This usually represents increased liquidation of that stock by traders and buyers who are standing on the sidelines. These can become very serious as those who are holding onto the stock will eventually panic and sell – but sell to whom? The price has to continue to drop and gap down to find buyers. Not a good situation. The term measuring gap is also used for runaway gaps. This is an interpretation that is hard to find examples for, but it is a way of helping one decide how much longer a trend will last. The theory is that the measuring gap will occur in the middle of, or half way through, the move. Sometimes, the futures market will have runaway gaps that are caused by trading limits imposed by the exchanges. Getting caught on the wrong side of the trend when you have these limit moves in futures can be horrifying. The good news is that you can also be on the right side of them. These are not common occurrences in the futures market despite all the wrong information being touted by those who do not understand it, and are only repeating something they read from an uninformed reporter.
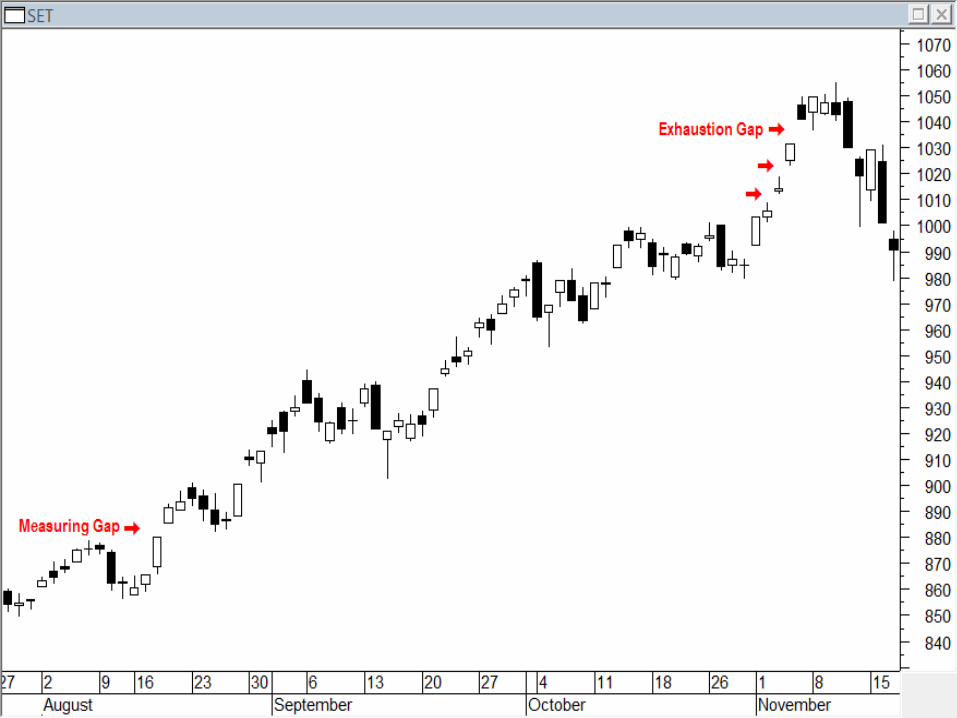
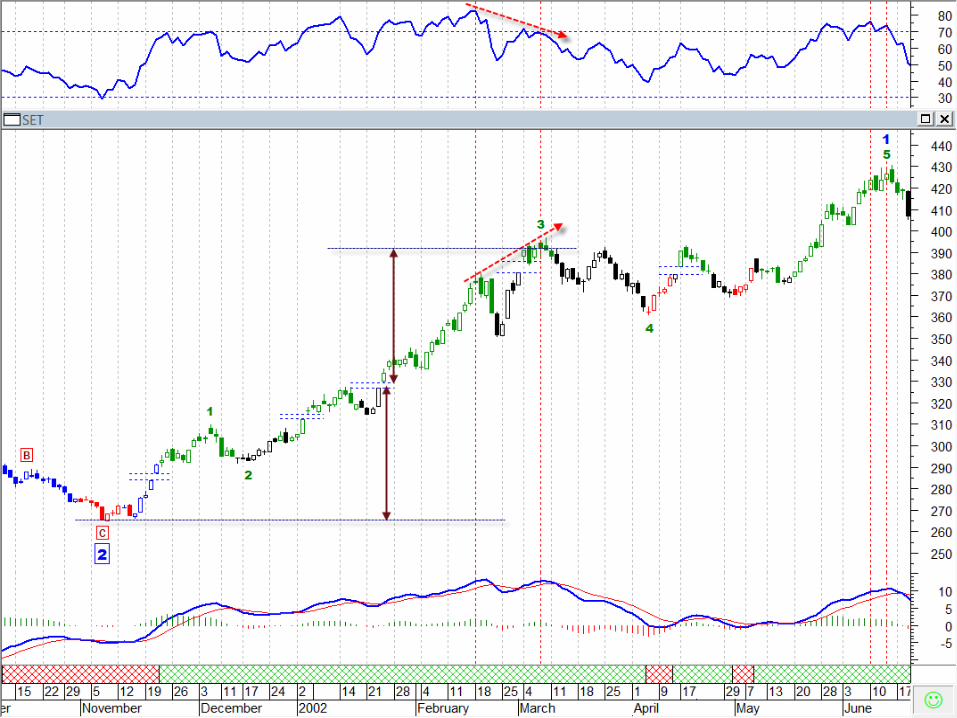
Exhaustion GapsExhaustion gaps are those that happen near the end of a good up- or downtrend. They are many times the first signal of the end of that move. They are identified by high volume and large price difference between the previous day's close and the new opening price. They can easily be mistaken for runaway gaps if one does not notice the exceptionally high volume.It is almost a state of panic if the gap appears during a long down move where pessimism has set in. Selling all positions to liquidate holdings in the market is not uncommon. Exhaustion gaps are quickly filled as prices reverse their trend. Likewise, if they happen during a bull move, some bullish euphoria overcomes trades, and buyers cannot get enough of that stock. The prices gap up with huge volume; then, there is great profit taking and the demand for the stock totally dries up. Prices drop, and a significant change in trend occurs. Exhaustion gaps are probably the easiest to trade and profit from. In the chart, notice that there was one more day of trading to the upside before the stock plunged. The high volume was the giveaway that this was going to be, either, an exhaustion gap or a runaway gap. Because of the size of the gap and the near doubling of volume, an exhaustion gap was in the making here.

ConclusionThere is an old saying that the market abhors a vacuum and all gaps will be filled. While this may have some merit for common and exhaustion gaps, holding positions waiting for breakout or runaway gaps to be filled can be devastating to your portfolio. Likewise, waiting to get on-board a trend by waiting for prices to fill a gap can cause you to miss the big move. Gaps are a significant technical development in price action and chart analysis, and should not be ignored. Japanese candlestick analysis is filled with patterns that rely on gaps to fulfill their objectives.

Workshop


![20120924-powerpoint HPS v3 [相容模式] · • Dr Harry Harinder Singh Gill • Ms Chan Yee-ying陳猗瑩女士 . Title: Microsoft PowerPoint - 20120924-powerpoint_HPS_v3 [相容模式]](https://static.fdocuments.us/doc/165x107/60d848518936e1303a76ba22/20120924-powerpoint-hps-v3-c-a-dr-harry-harinder-singh-gill-a-ms.jpg)