Webdiaeia20114 En
9
Global and Regional Trends of FDI Outflows in 2010 HIGHLIGHTS Much of the recovery of foreign direct investment (FDI) is likely to be driven by investments from developing and transition economies whose share in world outflows has now reached 28 per cent The Global Investment Trend Monitor No. 5 issued in January 2011 showed that global FDI flows (measured by inflows) increased only marginally in 2010 and developing and transition economies, for the first time, accounted for more than half of global FDI inflows. This Monitor looks at outward FDI. It shows that developing and transition economies are also increasingly important investors with their share in global outflows increasing to 28 per cent in 2010, up from 15 per cent in 2007, the year prior to the financial crisis (figure 1). Figure 1. FDI outflows from developing and transition economies: the value and their share in global FDI outflows, 2000-2010 (Billions of US dollars and per cent) 0 50 100 150 200 250 300 350 400 2000 2001 2002 2003 2004 2005 2006 2007 2008 2009 2010 B i l l i o n s o f d o l l a r s 0 5 10 15 20 25 30 Share Value Source : UNCTAD. This report can be freely cited provided appropriate acknowledgement is given to UNCTAD, together with a reference to the document. U U U N N N C C C T T T A A A D D D No. 6 27 April 2011 G G Gl l l o o o b b b a a a l ll I I In n n v v v e e e s s s t t t m mm e ee n n n t t t T T T r r r e e e n n d d s s s M M Mo o o n n n i i i t t t o oo r r r
-
Upload
varnika-goel -
Category
Documents
-
view
217 -
download
0
Transcript of Webdiaeia20114 En

8/3/2019 Webdiaeia20114 En
http://slidepdf.com/reader/full/webdiaeia20114-en 1/9
Global and Regional Trends of FDI Outflows in 2010
HIGHLIGHTS
Much of the recovery of foreign direct investment (FDI) is likely to be driven by investments from developing and transition economies whose share in world outflows has now reached 28 per cent
The Global Investment Trend Monitor No. 5 issued in January 2011 showed that global FDI flows(measured by inflows) increased only marginally in 2010 and developing and transition economies,for the first time, accounted for more than half of global FDI inflows. This Monitor looks at outwardFDI. It shows that developing and transition economies are also increasingly important investors withtheir share in global outflows increasing to 28 per cent in 2010, up from 15 per cent in 2007, the year prior to the financial crisis (figure 1).
Figure 1. FDI outflows from developing and transition economies:the value and their share in global FDI outflows, 2000-2010
(Billions of US dollars and per cent)
0
50
100
150
200
250
300
350
400
2000 2001 2002 2003 2004 2005 2006 2007 2008 2009 2010
B i l l i o n s o f d o l l a r s
0
5
10
15
20
25
30
Share Value
Source : UNCTAD.
This report can be freely cited provided appropriate acknowledgement is given to UNCTAD, together with areference to the document.
UUUNNNCCCTTTAAADDD No. 6
27 April 2011 GGGlllooobbbaaalll IIInnnvvveeessstttmmmeeennnttt TTTr r r eeennndddsss MMMooonnniiitttooor r r

8/3/2019 Webdiaeia20114 En
http://slidepdf.com/reader/full/webdiaeia20114-en 2/9
Global FDI outflows in 2010 increased to more than $1.3 trillion, by 13 per cent, from $1.2 trillionin 2009 although their level remained 40 per cent below the peak of 2007. While the large
difference between FDI inflows and outflows is mainly explained by statistical reasons,1
theclear upward trend as seen in outflows confirms the general observation that FDI bottomed outin 2010.
A feature of the increased importance of developing and transition economies as investors is
that a lion's share of their investments (70 per cent) are directed towards other developing andtransition economies compared with developed countries where the share of these economies isonly 50 per cent.
Outward FDI flows rose in all major groups of economies, but at different speeds. FDI flows fromdeveloping and transition economies picked up strongly, reflecting the strength of their economies, the dynamism of their transnational corporations (TNCs) and their growingaspiration to compete in new markets. FDI outflows from developed countries grew moremodestly, reflecting the subdued investment drive of European TNCs.
The recovery of FDI outflows in 2010 was driven by higher reinvested earnings, mainly dueto strong corporate profits and other investments (mainly intra-company loans), while equityinvestments remained sluggish.
Looking at the main modes of entry of TNCs in foreign markets, cross-border mergers andacquisitions (M&As) are still volatile: they increased by 36 per cent in 2010 as a whole;however in the first quarter of 2011 they declined again. In contrast, greenfield investmentprojects − both new and expansion − are not only larger in value and number than cross-border M&As but also they maintained their upward trend at the beginning of 2011.
Global FDI outflows rose by 13 per cent in 2010, though their level was 40per cent lower than that in the peak of 2007
Global FDI outflows rose in 2010 to an estimated $1,346 billion or 13 per cent, compared with $1,189billion in the previous year (annex 1). Similar to FDI inflows, however, outflows fell short of the peak of 2007(figure 2).The rise of FDI outflows in 2010 reflected an improvement of corporate profits and the increasinginternationalization of TNCs. The financial crisis caused firms to rationalize their corporate structure andincrease efficiencies wherever possible, often by relocating business functions to cost-advantageous locations.
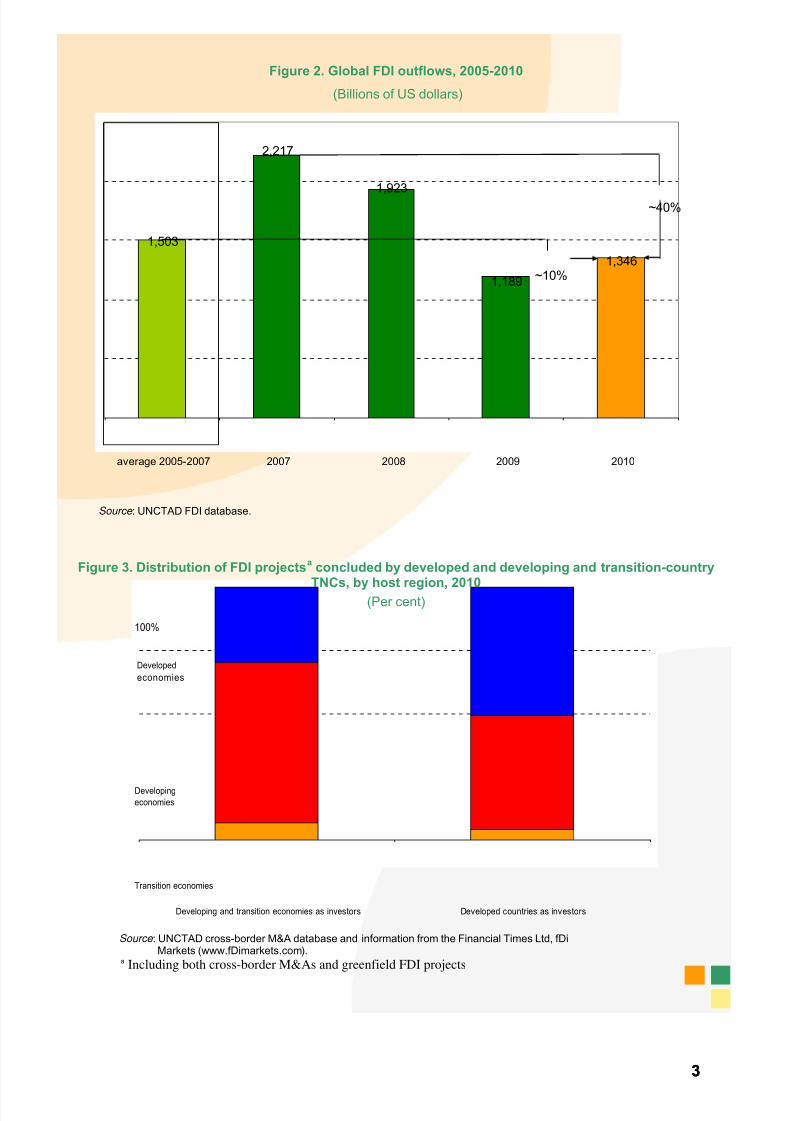
As developed countries are still confronting the effects of the crisis, many TNCs in developing andtransition economies are investing in other emerging markets, where recovery is strong and the economic
outlook better. Indeed, in 2010, 70 per cent of investment by developing and transition economies are directedtowards other developing and transition economies compared with developed countries where the share of these economies is about 50 per cent (figure 3).
1 The difference between global inflows and outflows is the result of various reasons, including different methods of data collection
between host and home countries, different data coverage of FDI flows (i.e. treatment of reinvested earnings), and different timesused for recording FDI transactions. In addition, the fact that outflows exceed inflows suggests that part of flows recorded as outflowsin home countries may not be necessarily recorded as inflows of FDI in host countries.
22
8/3/2019 Webdiaeia20114 En
http://slidepdf.com/reader/full/webdiaeia20114-en 3/9
Figure 2. Global FDI outflows, 2005-2010
(Billions of US dollars)
1,503
2,217
1,923
1,189
1,346
average 2005-2007 2007 2008 2009 2010
~10%
~40%
Source : UNCTAD FDI database.
Figure 3. Distribution of FDI projectsa
concluded by developed and developing and transition-country
TNCs, by host region, 2010(Per cent)
Developing and transition economies as inves
Transition economies
Developing
economies
Developed
economies
100%
tors Developed countries as investors
Source : UNCTAD cross-border M&A database and information from the Financial Times Ltd, fDi
Markets (www.fDimarkets.com).a Including both cross-border M&As and greenfield FDI projects
33
8/3/2019 Webdiaeia20114 En
http://slidepdf.com/reader/full/webdiaeia20114-en 4/9
Developed countries: moderate recovery
FDI outflows from developed countries for 2010 rose to $970 billion, an increase of 10 per cent over theprevious year. This is only half of the peak level recorded in 2007, however. Limited recovery was madepossible by an unprecedented amount of cash on TNCs’ balance sheets and historically low rates of debtfinancing. Reflecting the divergences of economic situations in the major economies of the developed world,trends in FDI outflows differed markedly across countries and subregions, and also in their three components –equity investment, reinvested earnings and other capital flows (mainly intra-company loans).
Outflows from Europe were slightly up despite a 67 per cent fall in cross-border M&A deals carried outby European TNCs. In some countries, outflows were mostly driven by a revival of intra-company financing toaffiliates located abroad (for example, for Germany and Switzerland, there was a dramatic swing of intra-company loans, from -$24 billion and -$7 billion, respectively, in 2009, to nearly $19 billion and $12 billion in2010). In contrast, outflows from the United Kingdom, traditionally one of the largest investor countries,continued to suffer in 2010, reaching a level last seen in 1993, as parent firms withdrew or were paid backloans from their affiliates in order to strengthen their balance sheets at home.
Outflows from the United States rose significantly (by 31 per cent) in 2010, mainly due to higher equityinvestments abroad (cross-border M&A deals by United States firms more than doubled in 2010) andreinvested earnings. Japanese outward FDI dropped by 24 per cent as declining intra-company loans andreinvested earnings overwhelmed a near doubling of cross-border M&As.
Developing countries: a strong recovery has started
After a temporary setback in 2009, FDI flows from developing countries returned to their previousupward trend. They reached an estimated $316 billion in 2010, 23 per cent more than in 2009. However, theyshowed an uneven pattern among regions. A strong rebound of outward FDI flows from Latin America and theCaribbean and developing Asia more than offset the decline of outflows from Africa and West Asia.
FDI flows from Africa declined further in 2010. UNCTAD estimates its value at $4 billion, barely one per cent of the developing economies’ total, down from $4.5 billion in 2009. Outflows from the two major outwardinvestors, the Libyan Arab Jamahiriya and South Africa, which together accounted for more than half of theregional total in 2009, fell significantly. On the positive side, outflows from Egypt more than doubled, to $1.2billion.
Outward FDI from South, East and South-East Asia rose by more than 20 per cent in 2010,particularly from Hong Kong (China), China, the Republic of Korea, Taiwan Province of China and Malaysia(table 2). Outflows from the region’s two largest FDI sources – Hong Kong (China) and China – rose by morethan $10 billion each, reaching historical highs of $76 billion and $68 billion (estimated), respectively. Chinesecompanies continued to be on a buying spree, actively acquiring overseas assets in a wide range of industriesand countries. Cross-border M&A purchases by companies from the region as a whole surged to nearly $94billion in 2010. The value of deals increased in all three − primary, manufacturing and services − sectors,particularly in oil and gas in the primary sector, finance and telecommunications among services, as well asfood and beverage, motor vehicles and chemical products in manufacturing.
FDI outflows from West Asia dropped to near zero in 2010. This is due on one hand to large-scaledivestments by West Asian firms from their enterprises abroad. The largest divestment deals included the$10.7 billion sale by Zain Group (Kuwait) of its African operations to Bharti Airtel (India), and the $2.2 billionsale by International Petroleum Investment Company (Abu Dhabi’s sovereign wealth fund) of a 70 per centstake in Hyundai Oilbank in the Republic of Korea. On the other hand in 2010, West Asian greenfield projectsabroad – mainly targeting developing countries – dropped by 52 per cent in value. Government-controlledentities – West Asia’s main outward investors – have been redirecting part of their oil surplus to support their home country weakened by the global financial crisis. This is expected to continue as Governments vowed tofinance higher social spending to pre-empt or respond to popular discontent.
Latin American and the Caribbean was the subregion with the strongest increase of outward FDIflows in 2010 mainly due to the surge in cross-border M&As purchases. The region’s TNCs, bolstered by strongeconomic growth at home, have increased their acquisitions abroad, particularly in developed countries whereinvestment opportunities have arisen in the aftermath of the crisis. Brazilian companies such as Vale, Gerdau,
Camargo Correa, Votorantim, Petrobras, and Braskem have undertaken acquisitions in the iron ore, steel, food,cement, chemical, and petroleum refining industries in developed countries. Mexican firms such as GrupoTelevisa, Sigma Alimentos, Metalsa and Inmobiliaria Carso purchased firms in the United States in theindustries such as media, food, motor vehicles and services.
44

8/3/2019 Webdiaeia20114 En
http://slidepdf.com/reader/full/webdiaeia20114-en 5/9
All the big investor countries - Brazil, Chile, Colombia and Mexico - registered increases in both their outward FDI flows and cross-border M&As purchases. The most noticeable case was Brazil where FDI outflows jumped from high negative value in 2009 (-$10 billion) to $11.5 billion in 2010, largely due to the nearly five foldincrease of the equity capital component of its outward investments.
Transition economies: growing again
After a short-lived setback in 2009, FDI flows from the transition economies of South-East Europe and
the Commonwealth of Independent States (CIS) grew by 24 per cent, reaching an estimated all-time record of $61 billion. Most of the outward FDI projects, as in the past years, were carried out by Russian TNCs, followedby those from Kazakhstan. The quick recovery of natural-resource-based companies in transition economieswas helped by strong support by the State, and got a boost from recovering commodity prices and higher stockmarket valuations, easing the cash flow problems these firms were facing in 2009. Transition-economy firmsincreased their purchases in developing and transition economies in 2010. Examples include the acquisition byVimpelcom (Russian Federation) of ZAO Kyivstar GSM (Ukraine) for $5.5 billion (annex 2).
Diverging trends in outward FDI components and modes of entry
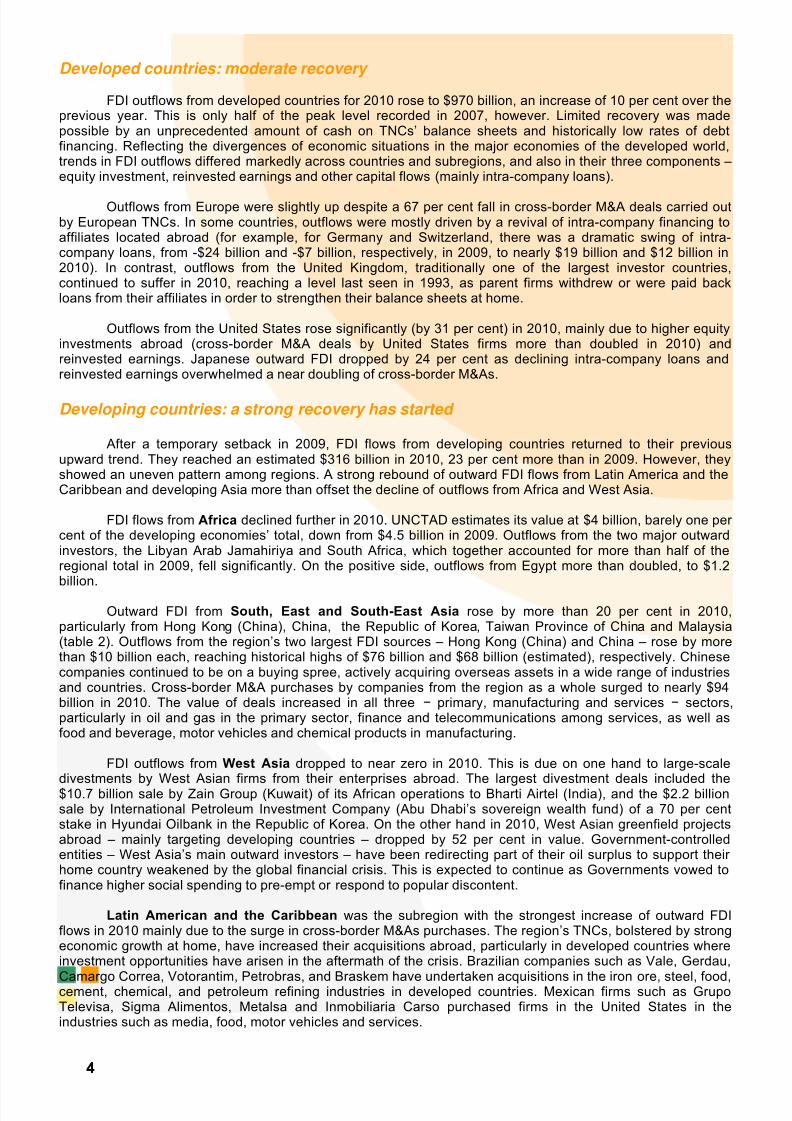
Data on FDI outflows of 44 countries (mainly developed countries) show that both reinvested earningsand other capital flows (mainly intra-company loans) increased by 45 per cent in 2010, while equity investments
dropped by 11 per cent (figure 4). The level of reinvested earnings was still below the peak of 2007, but their share in total FDI nevertheless exceeded 50 per cent. The continuing depressed level of equity investmentswas still the key factor that kept FDI flows relatively low. It is a source of concern as among the components of FDI, equity investment compared with reinvested earnings and intra-company loans, is the most directly relatedto TNCs’ long-term international investment strategies. This type of investment directly involves acquisition or establishment of foreign affiliates. Therefore its low level demonstrates that the FDI recovery starting in 2010remains fragile.
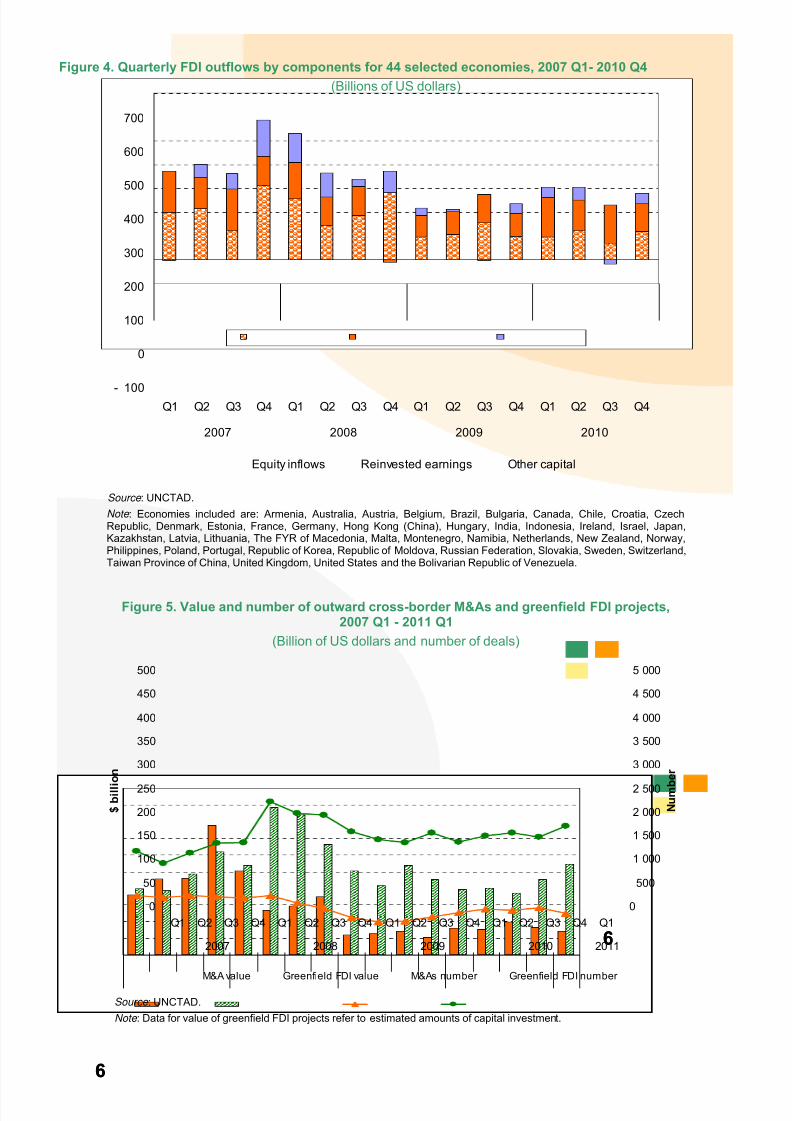
Cross-border M&As continued to react more quickly to changing economic conditions. They jumped by 36per cent in 2010 (figure 5), reflecting both the growing value of assets on the stock market and the increasedfinancial capability of potential buyers to carry out such operations. Nevertheless, they declined again in the firstquarter of 2011 as confidence was undermined by factors such as the impending tightening of fiscal policy, regionalconflicts and the sovereign debt crises of some European countries. Greenfield investments registered a rise in
both value and number during the first quarter of 2011, and continue to account for the bulk of FDI projects (figure5).
Improving outward FDI prospects for 2011
With the global economic recovery gaining strength, rising stock market valuations and reboundingcorporate profits of TNCs, UNCTAD expects FDI outflows to continue rising in 2011. Ongoing corporate andindustrial restructuring and a new wave of privatization in some countries with empty state coffers in the wake of the financial crisis are creating new investment opportunities for cash-rich companies in developed and developingcountries. Emerging economies, particularly Brazil, China, India and the Russian Federation have gained groundas sources of FDI in recent years. Outflows from these economies are expected to continue to grow in 2011, as theresult of rapid economic growth, abundant financial resources and strong motives of firms to acquire mineralresources and strategic assets abroad.
55
8/3/2019 Webdiaeia20114 En
http://slidepdf.com/reader/full/webdiaeia20114-en 6/9
Figure 4. Quarterly FDI outflows by components for 44 selected economies, 2007 Q1- 2010 Q4
(Billions of US dollars)
- 100
0
100
200
300
400
500
600
700
Q1 Q2 Q3 Q4 Q1 Q2 Q3 Q4 Q1 Q2 Q3 Q4 Q1 Q2 Q3 Q4
2007 2008 2009 2010
Equity inflows Reinvested earnings Other capital
Source : UNCTAD.
Note : Economies included are: Armenia, Australia, Austria, Belgium, Brazil, Bulgaria, Canada, Chile, Croatia, CzechRepublic, Denmark, Estonia, France, Germany, Hong Kong (China), Hungary, India, Indonesia, Ireland, Israel, Japan,Kazakhstan, Latvia, Lithuania, The FYR of Macedonia, Malta, Montenegro, Namibia, Netherlands, New Zealand, Norway,Philippines, Poland, Portugal, Republic of Korea, Republic of Moldova, Russian Federation, Slovakia, Sweden, Switzerland,Taiwan Province of China, United Kingdom, United States and the Bolivarian Republic of Venezuela.
Figure 5. Value and number of outward cross-border M&As and greenfield FDI projects,2007 Q1 - 2011 Q1
(Billion of US dollars and number of deals)
66
0
50
100
150
200
250
300
350
400
450
500
Q1 Q2 Q3 Q4 Q1 Q2 Q3 Q4 Q1 Q2 Q3 Q4 Q1 Q2 Q3 Q4 Q1
66
2007 2008 2009 2010 2011
$ b i l l i o n
0
500
1 000
1 500
2 000
2 500
3 000
3 500
4 000
4 500
5 000
N u m b
e r
M&A value Greenfield FDI value M&As number Greenfield FDI number
Source : UNCTAD.
Note : Data for value of greenfield FDI projects refer to estimated amounts of capital investment.

8/3/2019 Webdiaeia20114 En
http://slidepdf.com/reader/full/webdiaeia20114-en 7/9
Annex 1. FDI outflows and cross-border M&As, by region and major economy, 2009−2010
(Billions of US dollars)
FDI outflows Net cross-border M&Asb
Region / economy 2009 2010a
Growth rate (%)
2009 2010Growth rate
(%)
World 1 188.7 1 346.2 13.2 249.7 338.8 35.7
Developed economies 882.3 969.5 9.9 160.8 215.7 34.1Europe 503.5 516.7 2.6 102.7 33.8 -67.1
European Union 433.6 450.0 3.8 89.7 17.3 -80.7 Austria 6.5 10.8 67.4 3.3 1.7 -50.6 Belgium - 17.0 31.1 .. - 9.6 - 0.2 ..France 147.2 122.9 -16.5 41.6 7.2 -82.8 Germany 78.2 104.9 34.1 24.3 7.1 -70.6 Ireland 23.9 16.2 -32.2 - 0.5 2.5 ..Italy 39.2 23.1 -41.0 17.5 - 5.3 ..Luxembourg 18.7 18.3 -2.3 3.4 3.0 -11.4 Netherlands 26.9 31.9 18.5 - 3.3 14.3 ..Poland 5.2 4.7 -9.9 0.1 0.3 149.7 Spain 9.7 22.3 128.7 - 1.3 1.9 ..
Sweden 25.8 30.1 16.6 9.0 - 0.1 ..United Kingdom 44.4 24.8 -44.1 - 3.5 - 4.1 ..
Norway 34.4 8.7 -74.7 0.6 - 4.1 ..Switzerland 33.3 58.3 75.2 7.4 10.2 37.9 Canada 38.8 36.9 -5.0 16.7 32.3 93.4 United States 248.1 325.5 31.2 23.8 86.3 263.4 Australia 16.1 24.8 53.5 - 3.0 15.3 ..Japan 74.7 56.7 -24.1 17.4 31.0 77.8
Developing economies 257.6 316.1 22.7 74.0 96.9 31.1Africa 4.5 4.0 -11.3 2.7 3.2 17.9
Egypt 0.6 1.2 105.8 0.1 1.1 1331.8 South Africa 1.2 0.5 -60.9 1.5 1.5 -0.2
Latin America and the Caribbean 47.6 83.9 76.4 3.7 15.7 320.1
Brazil - 10.1 11.5 .. 2.5 7.8 210.1Chile 8.1 8.7 8.5 0.1 0.5 892.1Colombia 3.1 6.5 110.6 0.2 3.2 1420.9 Venezuela, Bolivarian Republic of 1.8 2.4 30.3 - - ..Mexico 7.6 12.7 67.1 3.2 3.3 1.8
Asia and Oceania 205.5 228.1 11.0 67.5 78.1 15.6 West Asia 19.0 - 0.2 .. 26.8 -15.6 ..
Saudi Arabia 2.2 2.0 -8.7 0.1 0.4 247.2 Turkey 1.6 1.8 14.6 - - ..
South, East and South-East Asia 186.4 228.2 22.4 40.5 93.5 131.1China 56.5 68.0 20.3 21.5 29.2 35.9 Hong Kong, China 64.0 76.1 18.9 7.5 14.5 93.7 Korea, Republic of 10.6 19.2 81.9 7.0 9.9 42.6
Taiwan Province of China 5.9 11.1 89.6 0.6 - 0.5 ..India 15.9 13.2 -17.3 0.3 26.4 8978.5 Malaysia 8.0 13.2 64.7 3.3 2.3 -29.6 Singapore 18.5 19.7 6.9 2.8 7.9 184.2 Thailand 3.8 2.7 -29.2 0.9 2.9 228.3
South-East Europe and the CIS 48.7 60.6 24.3 7.4 9.7 30.5
Kazakhstan 3.1 7.8 150.3 - 0.3 ..Russian Federation 43.7 51.7 18.4 7.6 9.1 19.5
Source : UNCTAD.a Preliminary estimates by UNCTAD.b Net cross-border M&A purchases by a home economy are purchases of companies abroad by home-based TNCs excluding sales of foreign affiliates of home-based TNCs, while table 3 includes all cross-border M&A deals.
Note : World FDI outflows are projected on the basis of 117 economies for which data are available for full year or part of 2010, as of 13 April2011. Data are estimated by annualizing their available data, in most cases three quarters of 2010. The proportion of outflows from theseeconomies in total outflows to their respective region or subregion in 2009 is used to extrapolate 2010 regional data.
77
8/3/2019 Webdiaeia20114 En
http://slidepdf.com/reader/full/webdiaeia20114-en 8/9
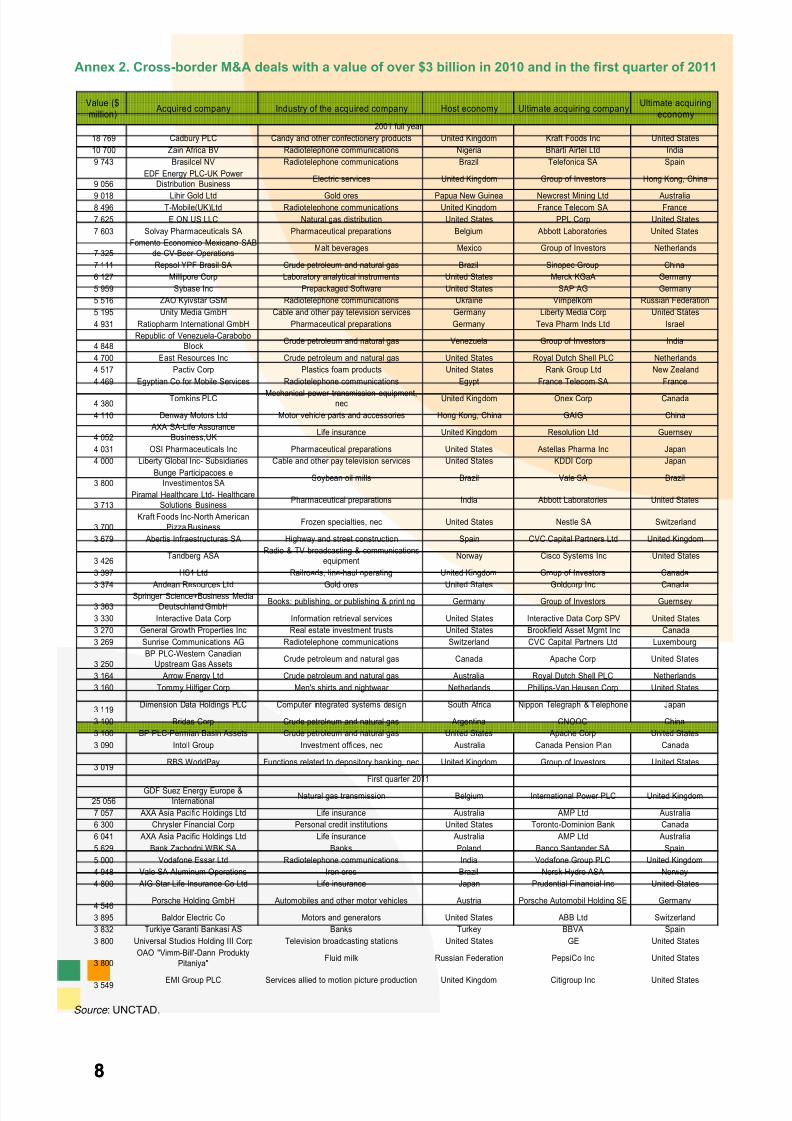
Annex 2. Cross-border M&A deals with a value of over $3 billion in 2010 and in the first quarter of 2011
Value ($million)
Acquired company Industry of the acquired company Host economy Ultimate acquiring companyUltimate acquiring
economy2001 full year
18 769 Cadbury PLC Candy and other confectionery products United Kingdom Kraft Foods Inc United States
10 700 Zain Africa BV Radiotelephone communications Nigeria Bharti Airtel Ltd India
9 743 Brasilcel NV Radiotelephone communications Brazil Telefonica SA Spain
9 056EDF Energy PLC-UK Power
Distribution BusinessElectric services United Kingdom Group of Investors Hong Kong, China
9 018 Lihir Gold Ltd Gold ores Papua New Guinea Newcrest Mining Ltd Australia8 496 T-Mobile(UK)Ltd Radiotelephone communications United Kingdom France Telecom SA France
7 625 E.ON US LLC Natural gas distribution United States PPL Corp United States
7 603 Solvay Pharmaceuticals SA Pharmaceutical preparations Belgium Abbott Laboratories United States
7 325Fomento Economico Mexicano SAB
de CV-Beer OperationsMalt beverages Mexico Group of Investors Netherlands
7 111 Repsol YPF Brasil SA Crude petroleum and natural gas Brazil Sinopec Group China
6 127 Millipore Corp Laboratory analytical instruments United States Merck KGaA Germany
5 959 Sybase Inc Prepackaged Software United States SAP AG Germany
5 516 ZAO Kyivstar GSM Radiotelephone communications Ukraine Vimpelkom Russian Federation
5 195 Unity Media GmbH Cable and other pay television services Germany Liberty Media Corp United States
4 931 Ratiopharm International GmbH Pharmaceutical preparations Germany Teva Pharm Inds Ltd Israel
4 848Republic of Venezuela-Carabobo
BlockCrude petroleum and natural gas Venezuela Group of Investors India
4 700 East Resources Inc Crude petroleum and natural gas United States Royal Dutch Shell PLC Netherlands
4 517 Pactiv Corp Plastics foam products United States Rank Group Ltd New Zealand
4 469 Egyptian Co for Mobile Services Radiotelephone communications Egypt France Telecom SA France
4 380Tomkins PLC Mechanical power transmission equipment,
necUnited Kingdom Onex Corp Canada
4 110 Denway Motors Ltd Motor vehicle parts and accessories Hong Kong, China GAIG China
4 052AXA SA-Life Assurance
Business,UKLife insurance United Kingdom Resolution Ltd Guernsey
4 031 OSI Pharmaceuticals Inc Pharmaceutical preparations United States Astellas Pharma Inc Japan
4 000 Liberty Global Inc- Subsidiaries Cable and other pay television services United States KDDI Corp Japan
3 800Bunge Participacoes e
Investimentos SASoybean oil mills Brazil Vale SA Brazil
3 713Piramal Healthcare Ltd- Healthcare
Solutions BusinessPharmaceutical preparations India Abbott Laboratories United States
3 700Kraft Foods Inc-North American
Pizza BusinessFrozen specialties, nec United States Nestle SA Switzerland
3 679 Abertis Infraestructuras SA Highway and street construction Spain CVC Capital Partners Ltd United Kingdom
3 426Tandberg ASA
Radio & TV broadcasting & communicationsequipment
Norway Cisco Systems Inc United States
3 397 HS1 Ltd Railroads, line-haul operating United Kingdom Group of Investors Canada
3 374Andean Resources Ltd Gold ores United States Goldcorp Inc Canada
3 363Springer Science+Business Media
Deutschland GmbHBooks: publishing, or publishing & printing Germany Group of Investors Guernsey
3 330 Interactive Data Corp Information retrieval services United States Interactive Data Corp SPV United States
3 270 General Growth Properties Inc Real estate investment trusts United States Brookfield Asset Mgmt Inc Canada
3 269 Sunrise Communications AG Radiotelephone communications Switzerland CVC Capital Partners Ltd Luxembourg
3 250BP PLC-Western Canadian
Upstream Gas AssetsCrude petroleum and natural gas Canada Apache Corp United States
3 164 Arrow Energy Ltd Crude petroleum and natural gas Australia Royal Dutch Shell PLC Netherlands
3 160 Tommy Hilfiger Corp Men's shirts and nightwear Netherlands Phillips-Van Heusen Corp United States
3 119Dimension Data Holdings PLC Computer integrated systems design South Africa Nippon Telegraph & Telephone Japan
3 100 Bridas Corp Crude petroleum and natural gas Argentina CNOOC China
3 100 BP PLC-Permian Basin Assets Crude petroleum and natural gas United States Apache Corp United States
3 090 Intoll Group Investment offices, nec Australia Canada Pension Plan Canada
3 019RBS WorldPay Functions related to depository banking, nec United Kingdom Group of Investors United States
First quarter 2011
25 056GDF Suez Energy Europe &
InternationalNatural gas transmission Belgium International Power PLC United Kingdom
7 057 AXA Asia Pacific Holdings Ltd Life insurance Australia AMP Ltd Australia
6 300 Chrysler Financial Corp Personal credit institutions United States Toronto-Dominion Bank Canada
6 041 AXA Asia Pacific Holdings Ltd Life insurance Australia AMP Ltd Australia
5 629 Bank Zachodni WBK SA Banks Poland Banco Santander SA Spain
5 000 Vodafone Essar Ltd Radiotelephone communications India Vodafone Group PLC United Kingdom
4 948 Vale SA-Aluminum Operations Iron ores Brazil Norsk Hydro ASA Norway
4 800 AIG Star Life Insurance Co Ltd Life insurance Japan Prudential Financial Inc United States
4 546Porsche Holding GmbH Automobiles and other motor vehicles Austria Porsche Automobil Holding SE Germany
3 895 Baldor Electric Co Motors and generators United States ABB Ltd Switzerland
3 832 Turkiye Garanti Bankasi AS Banks Turkey BBVA Spain
3 800 Universal Studios Holding III Corp Television broadcasting stations United States GE United States
3 800OAO "Vimm-Bill'-Dann Produkty
Pitaniya"Fluid milk Russian Federation PepsiCo Inc United States
3 549 EMI Group PLC Services allied to motion picture production United Kingdom Citigroup Inc United States Source : UNCTAD.
88

8/3/2019 Webdiaeia20114 En
http://slidepdf.com/reader/full/webdiaeia20114-en 9/9
The next issue of UNCTAD’s Global Investment Trends Monitor will be released in mid-October
2011. Final data for 2010 will appear in theWorld Investment Report 2011, scheduled to bereleased on 26 July 2011. Final
The next issue of UNCTAD’s Investment Policy Monitor will be released on 29 April 2011.
9