Webcast 1Q20
23
Transcript of Webcast 1Q20

176,670 241,219
54,901
67,777 16,052
16,116 247,623
325,112
1Q19 1Q20
Car Rental Fleet Rental Franchising
36,651 38,361
1Q19 1Q20
48,733 58,556
1Q19 1Q20
114,845
156,620
1Q19 1Q20
2
# of cars sold
Average rented fleet – Car Rental
End of the period fleet
1Q20 OPERATING HIGHLIGHTSAverage rented fleet – Fleet Rental

210.8 230.9
1Q19 1Q20
378.6 434.4
1Q19 1Q20
538.2632.7
1Q19 1Q20
3
Net revenues (R$ million)
Net income (R$ million)EBIT (R$ million)
EBITDA (R$ million)
1Q20 FINANCIAL HIGHLIGHTS
2,374.0 2,794.6
1Q19* 1Q20(*) GAAP revenue including the effects of the reclassification of PIS and COFINS credits

3,027.8
1,258.0 1,428.0 1,848.5
2,519.4
3,302.1
689.4 887.8
2015 2016 2017 2018 2019 1Q19 1Q20
(*) Excluding the effects of the reclassification of PIS and COFINS credits
CAR RENTAL Average rented fleet
Net revenues (R$ million)
4
43,315 51,51569,762
97,245
128,718114,845
156,620
2015 2016 2017 2018 2019 1Q19 1Q20
MAINTENANCE OF THE STRONG GROWTH PACE IN THE 1Q20, EVEN CONSIDERING THE IMPACTS OF COVID-19 IN THE LAST WEEK OF MARCH
*

5
Average rental rate (in R$) Utilization rate (%)
CAR RENTAL
84.679.7
75.2 72.9 71.6 74.169.2
2015 2016 2017 2018 2019 1Q19 1Q20
75.4% 78.0% 78.6% 79.6% 79.1% 79.8% 78.2%
2015 2016 2017 2018 2019 1Q19 1Q20
AVERAGE RENTAL AND UTILIZATION RATES REFLECTING THE MIX OF SEGMENTS AND THE IMPACTS OF COVID-19 AT THE END OF THE QUARTER
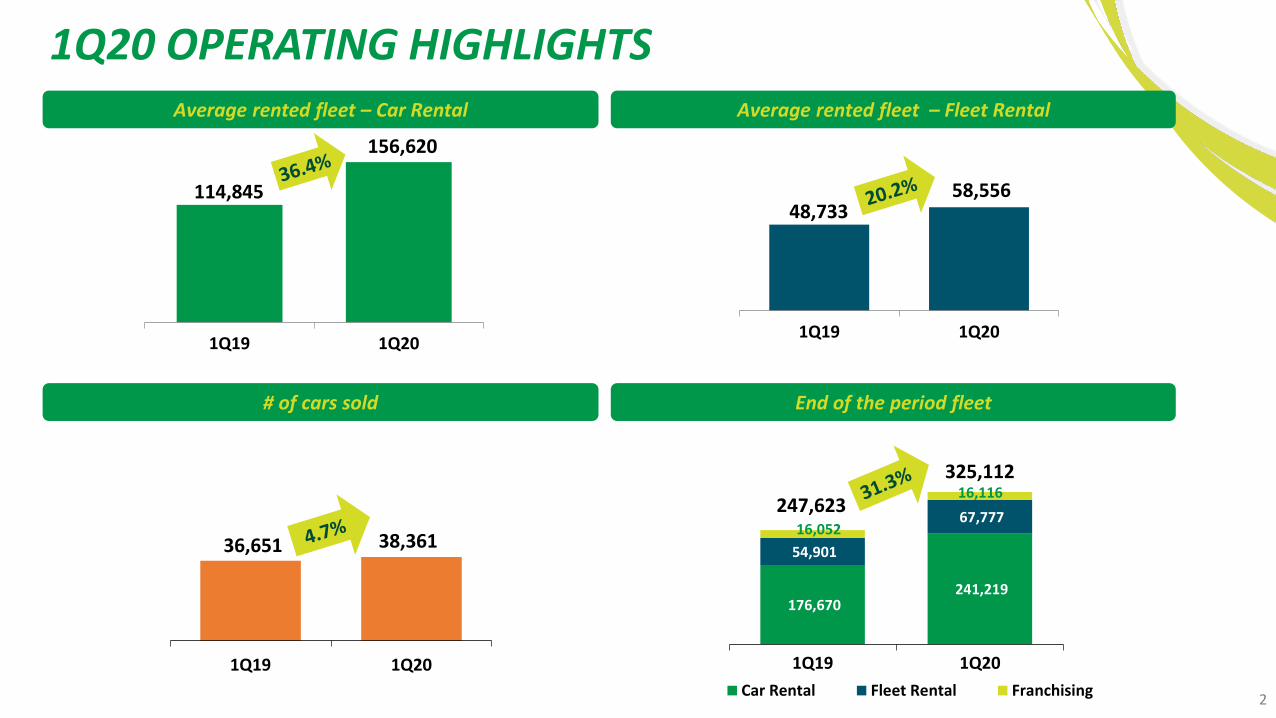
CAR RENTAL NETWORK EVOLUTION
Number of car rental locations - Brazil and abroad
6
MAINTENANCE OF THE NUMBER OF LOCALIZA`S CORPORATE BRANCHES COMPARED TO THE END OF 2019
320 333 384 401 427 427
174 158133 125 101 101
70 70 71 65 74 80564 561 588 591 602 608
2015 2016 2017 2018 2019 1Q20
Localiza's branches - Brazil Franchisees's branches - Brazil Franchisees's branches - abroad

940.3 608.5 651.8 742.1 848.8
1,023.9
219.0 256.2
2015 2016 2017 2018 2019 1Q19 1Q20
(*) Excluding the effects of the reclassification of PIS and COFINS credits
FLEET RENTAL Average rented fleet
Net revenues (R$ million)
7
30,280 31,22235,424 42,321
53,02948,733
58,556
-
10,0 00.0
20,0 00.0
30,0 00.0
40,0 00.0
50,0 00.0
60,0 00.0
70,0 00.0
2015 2016 2017 2018 2019 1Q19 1Q20
IN 1Q20, FLEET RENTAL DIVISION REGISTERED A 20.2% INCREASE IN AVERAGE RENTED FLEET
*

64,032 87,833
143,414 165,421
223,534
36,943 40,879 64,305 68,449
90,554111,279
147,915
36,651 38,361
2015 2016 2017 2018 2019 1Q19 1Q20
NET INVESTMENT Car purchase and sales (quantity*)
Net investment in fleet (R$ million)
Cars purchased Cars sold Hertz Brasil
Purchases (includes accessories) Used car sales net revenues Hertz Brasil
8
* Does not consider theft / crashed cars written off.
(273)19,384
135,252
8,162
52,86054,142
292 2,518
75,619
2,278.43,289.6
5,753.6
6,981.8
10,283.3
1,595.21,838.12,044.9 2,342.5
3,451.2
4,510.4
6,206.7
1,460.1 1,645.5
2015 2016 2017 2018 2019 1Q19 1Q20
233.5
947.1
5,467.9
285.7
2,302.4
2,471.4
135.1 192.6
4,076.6
CAR SALES VOLUMES IMPACTED BY THE SOCIAL DISTANCING MEASURES AT THE END OF THE QUARTER
9
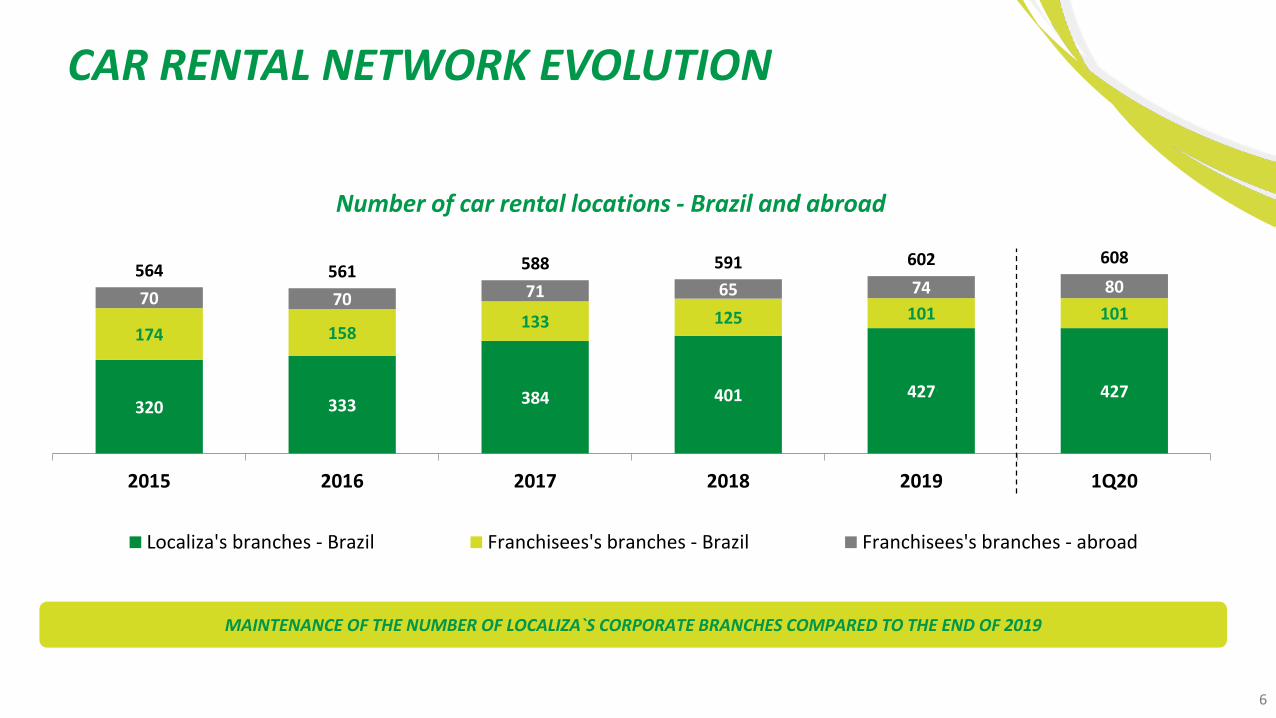
NUMBER OF USED CARS POINTS OF SALE
STABLE SALES YOY, EVEN CONSIDERING THE EFFECTS OF THE PANDEMIC AND THE SOCIAL DISTANCING MEASURES
7784
99107
123
108
124
64,305 68,449
90,554
111,279
147,915
36,651 38,361
-
20,0 00
40,0 00
60,0 00
80,0 00
100 ,000
120 ,000
140 ,000
160 ,000
-10
10
30
50
70
90
110
130
2015 2016 2017 2018 2019 1Q19 1Q20
Point of sale Cars sold

10
END OF PERIOD FLEET(Quantity)
76,755 94,156 135,578
177,672 238,174
176,670
241,219 33,948
34,960
44,877
54,430
68,957
54,901
67,777
13,992 14,015
13,824
15,922
16,230
16,052
16,116
124,695143,131
194,279
248,024
323,361
247,623
325,112
2015 2016 2017 2018 2019 1Q19 1Q20
Car Rental Fleet Rental Franchising
STRONG FLEET GROWTH IN ALL BUSINESS DIVISIONS

11
CONSOLIDATED NET REVENUES(R$ million)
CONSOLIDATED NET REVENUES INCREASED 17.7%, REFLECTING THE LOWER USED CAR SALES VOLUME IN 1Q20
1,883.1 2,096.8 2,607.13,385.3 3,988.9
913.9 1,149.1
2,044.9 2,342.5
3,451.2
4,510.4
6,206.7
1,460.1 1,645.5
3,928.04,439.3
6,058.3
7,895.7
10,195.6
2,374.02,794.6
2015 2016 2017 2018 2019* 1Q19* 1Q20
Rental Used car sales
(*) GAAP number including the effects of the IFRS16 and the reclassification of PIS and COFINS credits

12
CONSOLIDATED EBITDA(R$ million)
(*) 2017 adjusted by the one-time costs incurred - Hertz Brasil acquisition and Franchisees incorporation(**) GAAP number including the reclassification of PIS and COFINS credits in Car Rental and Fleet Rental divisions
EBITDA margin:
Activities 2015 2016 2017* 2018 2019** 1Q19 1Q20
Car Rental 31.8% 32.3% 34.9% 35.9% 45.5% 48.9% 47.8%
Fleet Rental 62.2% 64.5% 61.9% 64.0% 67.7% 72.7% 70.4%
Rental Consolidated 41.7% 42.3% 42.6% 43.0% 50.9% 54.7% 52.9%
Used Car Sales 7.3% 5.5% 5.9% 3.0% 3.0% 2.6% 1.5%
934.8 1,015.61,314.2
1,590.1
2,212.8
538.2632.7
2015 2016 2017OTC Hertz
2018 2019 1Q19 1Q20
CONSOLIDATED EBITDA GROWTH IN LINE WITH NET REVENUES INCREASE
13
6.0
4.0
2.0
4.0 4.0 4.0
1st year 2nd year 3rd year
Depreciation methods (R$ thousand)Illustrative example for 1 car with a total depreciation of R$12 thousand
SOYD method straight-line method
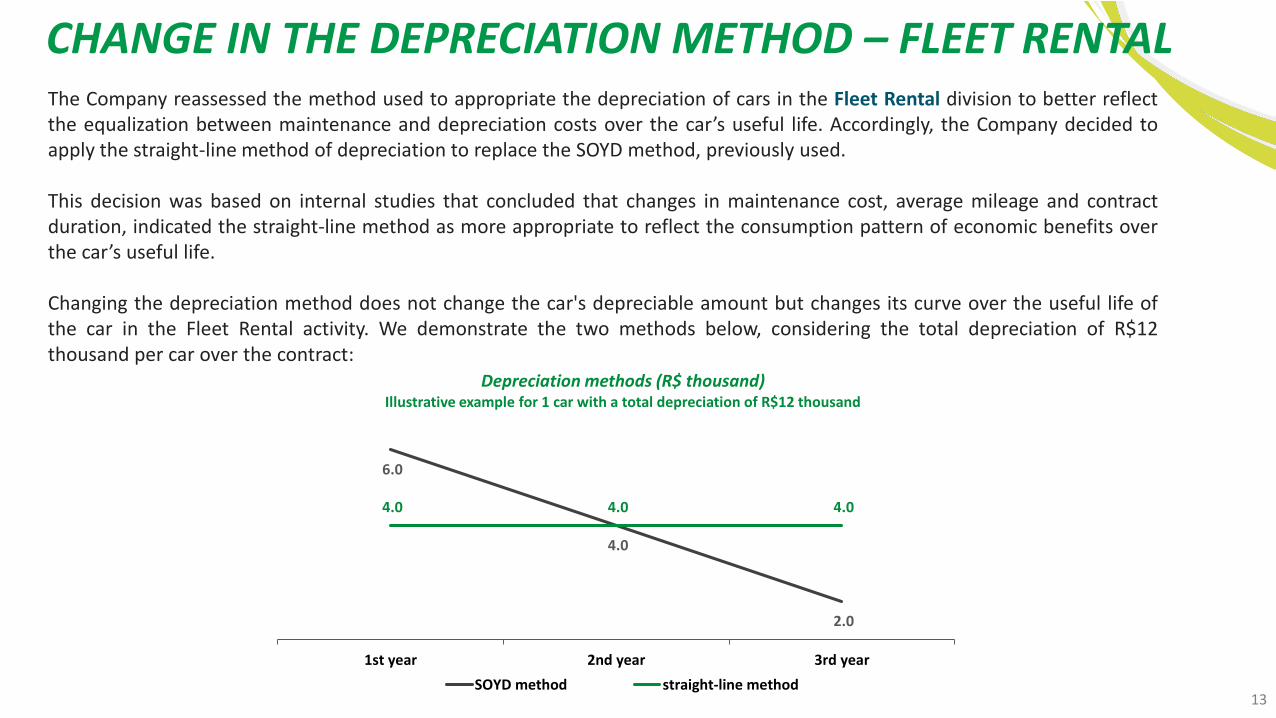
CHANGE IN THE DEPRECIATION METHOD – FLEET RENTALThe Company reassessed the method used to appropriate the depreciation of cars in the Fleet Rental division to better reflectthe equalization between maintenance and depreciation costs over the car’s useful life. Accordingly, the Company decided toapply the straight-line method of depreciation to replace the SOYD method, previously used.
This decision was based on internal studies that concluded that changes in maintenance cost, average mileage and contractduration, indicated the straight-line method as more appropriate to reflect the consumption pattern of economic benefits overthe car’s useful life.
Changing the depreciation method does not change the car's depreciable amount but changes its curve over the useful life ofthe car in the Fleet Rental activity. We demonstrate the two methods below, considering the total depreciation of R$12thousand per car over the contract:

14
AVERAGE ANNUALIZED DEPRECIATION PER CAR(In R$)
Fleet Rental
Car Rental
FLAT DEPRECIATION LEVEL IN THE CAR RENTAL DIVISION, COMPARING TO PRIOR QUARTER. FOR THE FLEET RENTAL DIVISION THE COMPANY STARTED USING THE STRAIGHT-LINE METHOD OF DEPRECIATION
622.1
1,251.2 1,250.11,012.4
1,917.62,202.4
2015 2016 2017 2018 2019 1Q20
3,935.2 3,714.03,104.3
3,601.13,923.4
2,397.1
2015 2016 2017 2018 2019 1Q20
15
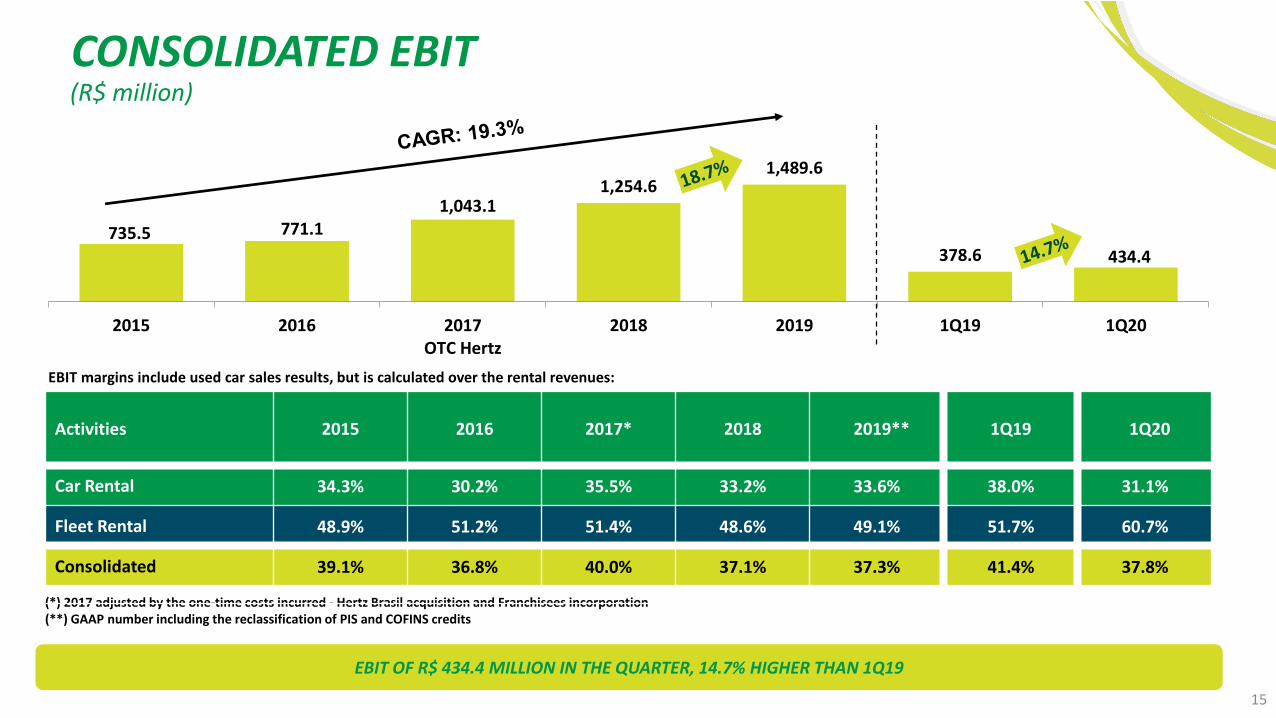
CONSOLIDATED EBIT(R$ million)
(*) 2017 adjusted by the one-time costs incurred - Hertz Brasil acquisition and Franchisees incorporation(**) GAAP number including the reclassification of PIS and COFINS credits
EBIT OF R$ 434.4 MILLION IN THE QUARTER, 14.7% HIGHER THAN 1Q19
Activities 2015 2016 2017* 2018 2019** 1Q19 1Q20
Car Rental 34.3% 30.2% 35.5% 33.2% 33.6% 38.0% 31.1%
Fleet Rental 48.9% 51.2% 51.4% 48.6% 49.1% 51.7% 60.7%
Consolidated 39.1% 36.8% 40.0% 37.1% 37.3% 41.4% 37.8%
EBIT margins include used car sales results, but is calculated over the rental revenues:
735.5 771.11,043.1
1,254.61,489.6
378.6 434.4
2015 2016 2017OTC Hertz
2018 2019 1Q19 1Q20
16
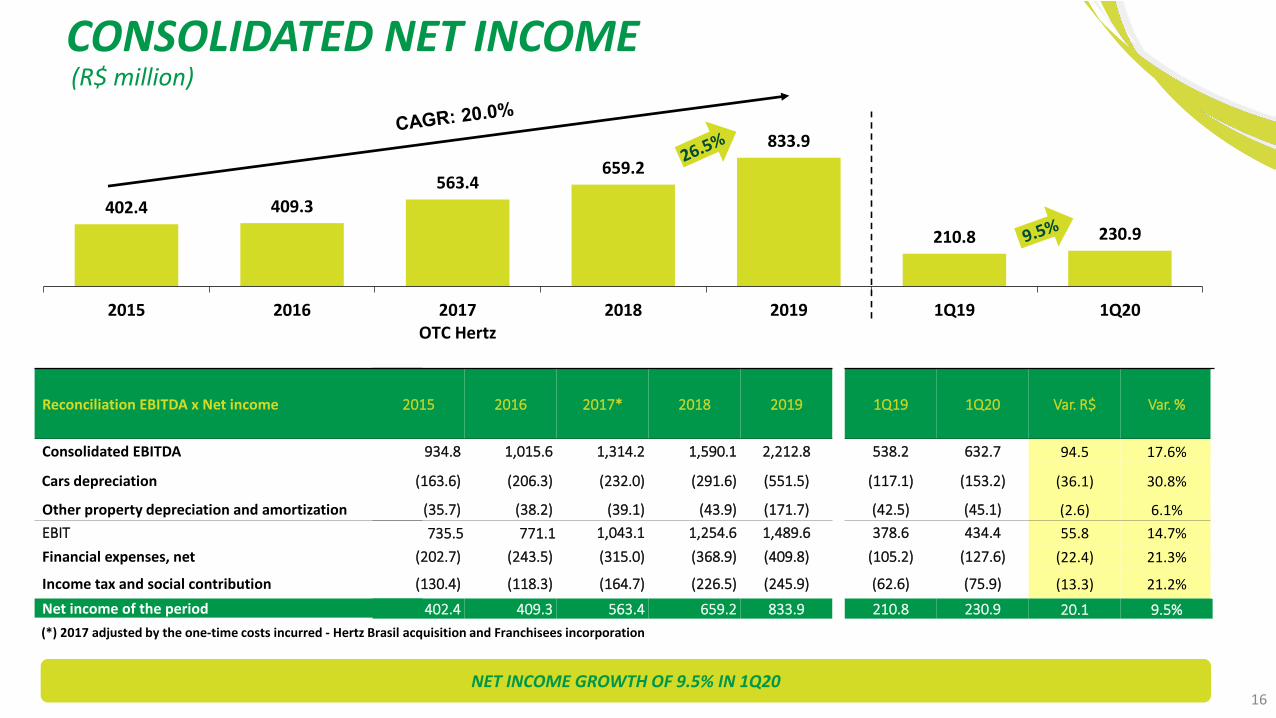
CONSOLIDATED NET INCOME(R$ million)
(*) 2017 adjusted by the one-time costs incurred - Hertz Brasil acquisition and Franchisees incorporation
NET INCOME GROWTH OF 9.5% IN 1Q20
Reconciliation EBITDA x Net income
Consolidated EBITDA
Cars depreciation
Other property depreciation and amortization
EBIT
Financial expenses, net
Income tax and social contribution
Net income of the period
402.4 409.3
563.4659.2
833.9
210.8 230.9
2015 2016 2017OTC Hertz
2018 2019 1Q19 1Q20
2015 2016 2017* 2018 2019 1Q19 1Q20 Var. R$ Var. %
934.8 1,015.6 1,314.2 1,590.1 2,212.8 538.2 632.7 94.5 17.6%
(163.6) (206.3) (232.0) (291.6) (551.5) (117.1) (153.2) (36.1) 30.8%
(35.7) (38.2) (39.1) (43.9) (171.7) (42.5) (45.1) (2.6) 6.1%
735.5 771.1 1,043.1 1,254.6 1,489.6 378.6 434.4 55.8 14.7%
(202.7) (243.5) (315.0) (368.9) (409.8) (105.2) (127.6) (22.4) 21.3%
(130.4) (118.3) (164.7) (226.5) (245.9) (62.6) (75.9) (13.3) 21.2%
402.4 409.3 563.4 659.2 833.9 210.8 230.9 20.1 9.5%
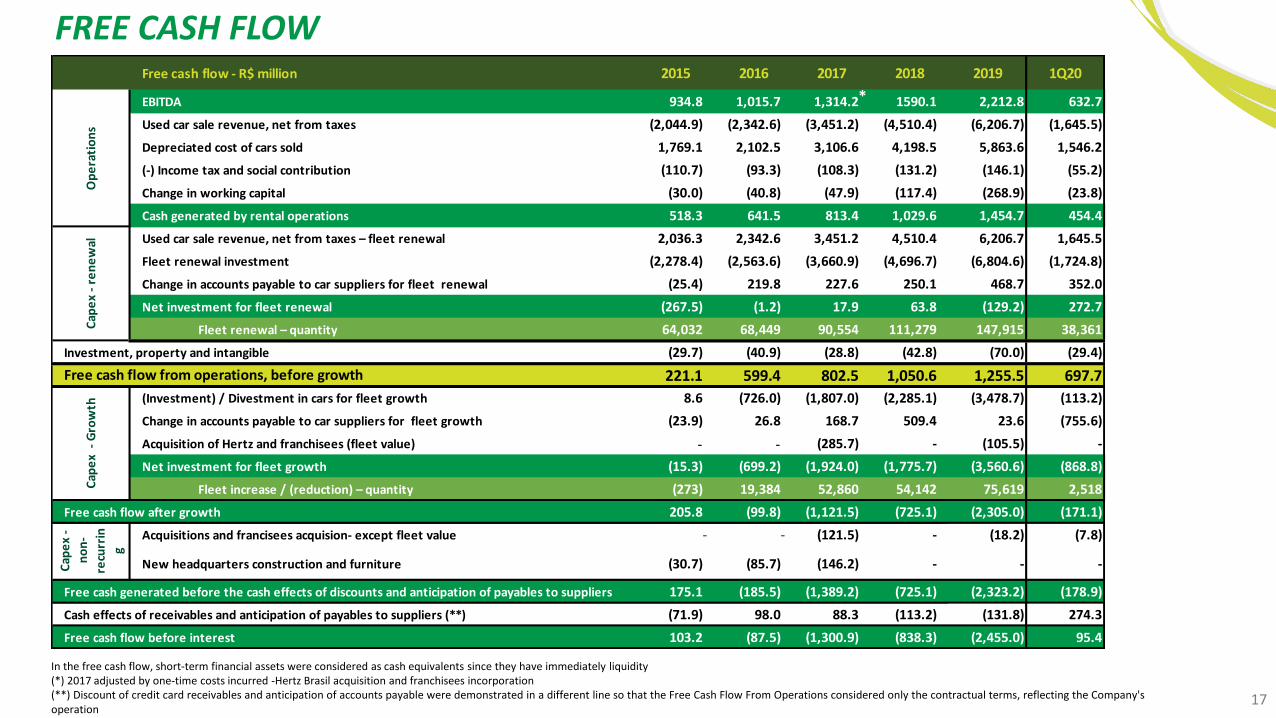
FREE CASH FLOW
17
In the free cash flow, short-term financial assets were considered as cash equivalents since they have immediately liquidity(*) 2017 adjusted by one-time costs incurred -Hertz Brasil acquisition and franchisees incorporation(**) Discount of credit card receivables and anticipation of accounts payable were demonstrated in a different line so that the Free Cash Flow From Operations considered only the contractual terms, reflecting the Company'soperation
Free cash flow - R$ million 2015 2016 2017 2018 2019 1Q20
EBITDA 934.8 1,015.7 1,314.2 1590.1 2,212.8 632.7
Used car sale revenue, net from taxes (2,044.9) (2,342.6) (3,451.2) (4,510.4) (6,206.7) (1,645.5)
Depreciated cost of cars sold 1,769.1 2,102.5 3,106.6 4,198.5 5,863.6 1,546.2
(-) Income tax and social contribution (110.7) (93.3) (108.3) (131.2) (146.1) (55.2)
Change in working capital (30.0) (40.8) (47.9) (117.4) (268.9) (23.8)
Cash generated by rental operations 518.3 641.5 813.4 1,029.6 1,454.7 454.4
Used car sale revenue, net from taxes – fleet renewal 2,036.3 2,342.6 3,451.2 4,510.4 6,206.7 1,645.5
Fleet renewal investment (2,278.4) (2,563.6) (3,660.9) (4,696.7) (6,804.6) (1,724.8)
Change in accounts payable to car suppliers for fleet renewal (25.4) 219.8 227.6 250.1 468.7 352.0
Net investment for fleet renewal (267.5) (1.2) 17.9 63.8 (129.2) 272.7
Fleet renewal – quantity 64,032 68,449 90,554 111,279 147,915 38,361
(29.7) (40.9) (28.8) (42.8) (70.0) (29.4)
221.1 599.4 802.5 1,050.6 1,255.5 697.7
(Investment) / Divestment in cars for fleet growth 8.6 (726.0) (1,807.0) (2,285.1) (3,478.7) (113.2)
Change in accounts payable to car suppliers for fleet growth (23.9) 26.8 168.7 509.4 23.6 (755.6)
Acquisition of Hertz and franchisees (fleet value) - - (285.7) - (105.5) -
Net investment for fleet growth (15.3) (699.2) (1,924.0) (1,775.7) (3,560.6) (868.8)
Fleet increase / (reduction) – quantity (273) 19,384 52,860 54,142 75,619 2,518
205.8 (99.8) (1,121.5) (725.1) (2,305.0) (171.1)
Acquisitions and francisees acquision- except fleet value - - (121.5) - (18.2) (7.8)
New headquarters construction and furniture (30.7) (85.7) (146.2) - - -
175.1 (185.5) (1,389.2) (725.1) (2,323.2) (178.9)
(71.9) 98.0 88.3 (113.2) (131.8) 274.3
103.2 (87.5) (1,300.9) (838.3) (2,455.0) 95.4
Cap
ex
-
no
n-
recu
rrin
g
Free cash generated before the cash effects of discounts and anticipation of payables to suppliers
Free cash flow after growth
Cash effects of receivables and anticipation of payables to suppliers (**)
Free cash flow before interest
Op
era
tio
ns
Cap
ex
- re
ne
wal
Investment, property and intangible
Free cash flow from operations, before growth
Cap
ex
- G
row
th*
18
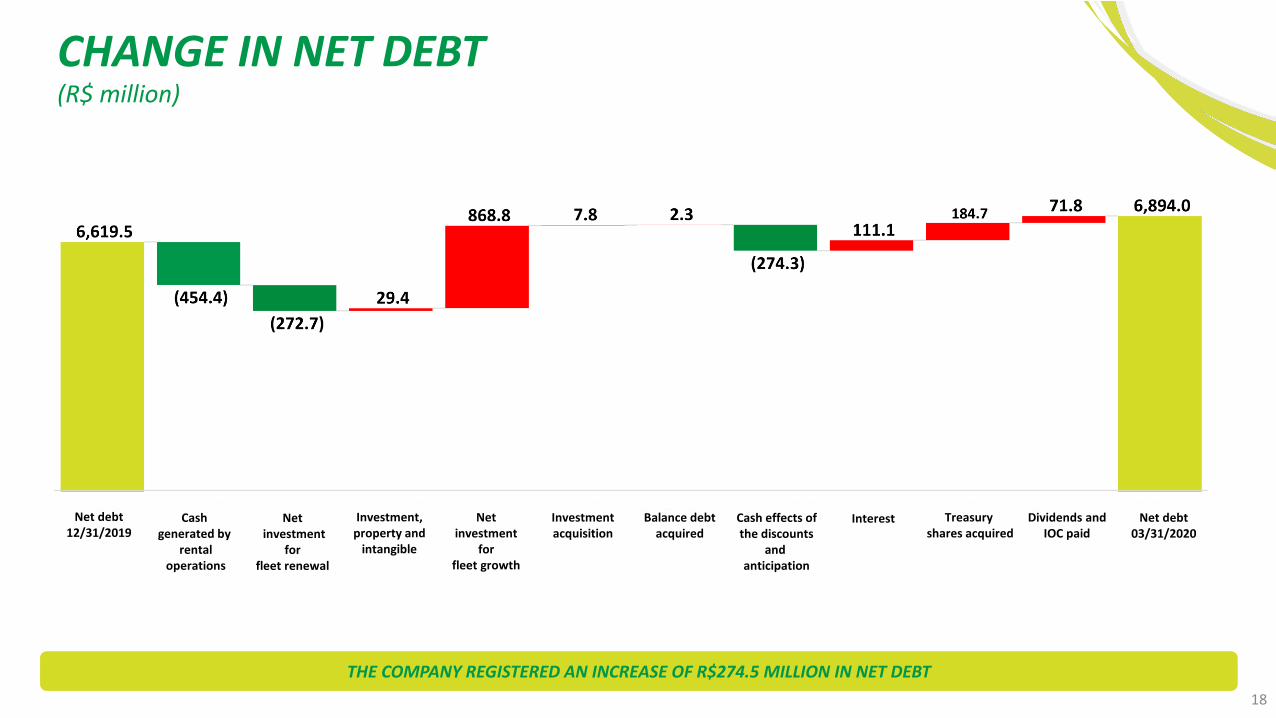
CHANGE IN NET DEBT(R$ million)
Net debt12/31/2019
Cash generated by
rentaloperations
Netinvestment
for fleet renewal
Investment, property and
intangible
Net investment
for fleet growth
Investmentacquisition
Balance debtacquired
Cash effects ofthe discounts
andanticipation
Interest Treasuryshares acquired
Dividends andIOC paid
Net debt03/31/2020
THE COMPANY REGISTERED AN INCREASE OF R$274.5 MILLION IN NET DEBT

3,893.7
100.0
100.0
3,993.7
5.4
1,378.7 1,458.4 1,715.1
2,514.7 2,144.8
1,258.4
258.3
Cash and financial assets
2020 2021 2022 2023 2024 2025 2026 2027 to 2032
3,893.7
5.4
1,278.71,458.4
1,715.1
2,514.72,144.8
1,258.4
258.3
Cash and financial assets
2020 2021 2022 2023 2024 2025 2026 2027 to 2032
19
DEBT MATURITY PROFILE (PRINCIPAL)(R$ million)
As of March 31, 2020
THE COMPANY RAISED R$2.7 BILLION TO EXTEND DEBT DURATION AND STRENGTHEN ITS CASH POSITION IN VIEW OF THE PANDEMIC SCENARIO
2,742.5
2,842.5
Proforma with new issuances after 03/31/2020

20
DEBT RATIOS
Net debt versus fleet value
(R$ million)
BALANCE AT THE END OF PERIOD 2015 2016 2017 2018 2019 1Q20
Net debt / Fleet value 44% 45% 55% 55% 49% 50%
Net debt / annualized EBITDA 1.7x 2.1x 2.9x 3.3x 3.0x 2.7x
Net debt / Equity 0.8x 0.9x 1.5x 1.7x 1.2x 1.3x
EBITDA / Net financial expenses 4.6x 4.2x 4.2x 4.3x 5.4x 5.0x
1,588.6 2,084.03,864.7
5,241.06,619.5 6,894.0
3,642.74,623.6
7,038.1
9,533.4
13,515.9 13,653.6
2015 2016 2017 2018 2019 1Q20Net debt Fleet value

17.0%
15.4% 15.6%
12.9%11.6%
10.1%
9.5%10.2%
7.6%
5.0% 4.6%3.4%
2015 2016 2017* 2018 2019** annualized 1Q20
ROIC Cost of debt after taxes
EXPRESSIVE RESULTS IN THE QUARTER, STRENGTHENING THE SOLID FINANCIAL POSITION TO FACE CRISIS
ROIC considered each year´s effective income tax and social contribution rate
(*) 2017 adjusted by the one-time costs incurred - Hertz Brasil acquisition and Franchisees incorporation
(**) Includes IFRS 16 accounting standard
21
7.5p.p.5.2p.p.
8.0p.p.
6.7p.p.7.9p.p. 7.0p.p.
ROIC VERSUS COST OF DEBT AFTER TAXES
22
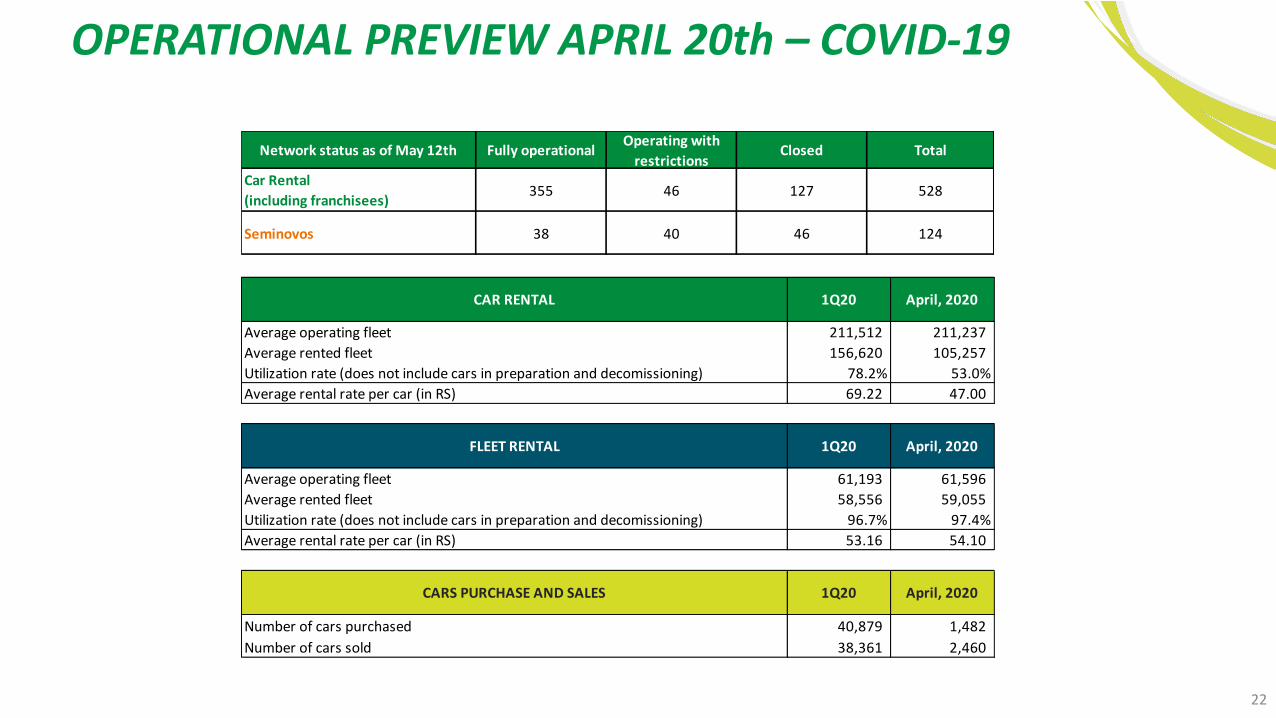
Network status as of May 12th Fully operationalOperating with
restrictionsClosed Total
Car Rental
(including franchisees)355 46 127 528
Seminovos 38 40 46 124
CAR RENTAL 1Q20 April, 2020
Average operating fleet 211,512 211,237
Average rented fleet 156,620 105,257
Utilization rate (does not include cars in preparation and decomissioning) 78.2% 53.0%
Average rental rate per car (in RS) 69.22 47.00
FLEET RENTAL 1Q20 April, 2020
Average operating fleet 61,193 61,596
Average rented fleet 58,556 59,055
Utilization rate (does not include cars in preparation and decomissioning) 96.7% 97.4%
Average rental rate per car (in RS) 53.16 54.10
CARS PURCHASE AND SALES 1Q20 April, 2020
Number of cars purchased 40,879 1,482
Number of cars sold 38,361 2,460
OPERATIONAL PREVIEW APRIL 20th – COVID-19

23
Thank You!
The material presented is a presentation of general background information about LOCALIZA as of the date of the presentation. It is information in summary form and does not purport to be complete. It is not
intended to be relied upon as advice to potential investors.
This presentation contains statements that are not guarantees of future performance. Investors are cautioned that any such forward-looking statements are and will be, as the case may be, subject to many risks,
uncertainties and factors relating to the operations and business environments of LOCALIZA and its subsidiaries that may cause the actual results of the companies to be materially different from any future
results expressed or implied in such forward-looking statements.
Although LOCALIZA believes that the expectations and assumptions reflected in the forward-looking statements are reasonable based on information currently available to LOCALIZA’s management, LOCALIZA
cannot guarantee future results or events. LOCALIZA expressly disclaims a duty to update any of the forward-looking statement.
This presentation does not constitute an offer, invitation or solicitation of an offer to subscribe to or purchase any securities. Neither this presentation nor anything contained herein shall form the basis of any contract or
commitment whatsoever.
www.ir.localiza.com
Email: [email protected]
Tel: 55 31 3247-7024
Disclaimer