
Webcast 1Q10
20
1 1 Conference Call / Webcast Almir Guilherme Barbassa CFO and Investor Relations Officer May 18 th , 2010 Results Announcement 1 st Quarter 2010 (Brazilian Corporate Law)
-
Upload
petrobras -
Category
Investor Relations
-
view
511 -
download
0
Transcript of Webcast 1Q10
11
Conference Call / Webcast
Almir Guilherme Barbassa CFO and Investor Relations OfficerMay 18th, 2010
Results Announcement1st Quarter 2010
(Brazilian Corporate Law)
22
DISCLAIMERDISCLAIMER
The presentation may contain forecasts about future events. Such forecasts merely reflect the expectations of the Company's management. Such terms as "anticipate", "believe", "expect", "forecast", "intend", "plan", "project", "seek", "should", along with similar or analogous expressions, are used to identify such forecasts. These predictions evidently involve risks and uncertainties, whether foreseen or not by the Company. Therefore, the future results of operations may differ from current expectations, and readers must not base their expectations exclusively on the information presented herein. The Company is not obliged to update the presentation/such forecasts in light of new information or future developments.
The United States Securities and Exchange Commission permits oil and gas companies, in their filings with the SEC, to disclose only proved reserves that a company has demonstrated by actual production or conclusive formation tests to be economically and legally producible under existing economic and operating conditions. We use certain terms in this presentation, such as oil and gas resources, that the SEC’s guidelines strictly prohibit us from including in filings with the SEC.
CAUTIONARY STATEMENT FOR US INVESTORS
33
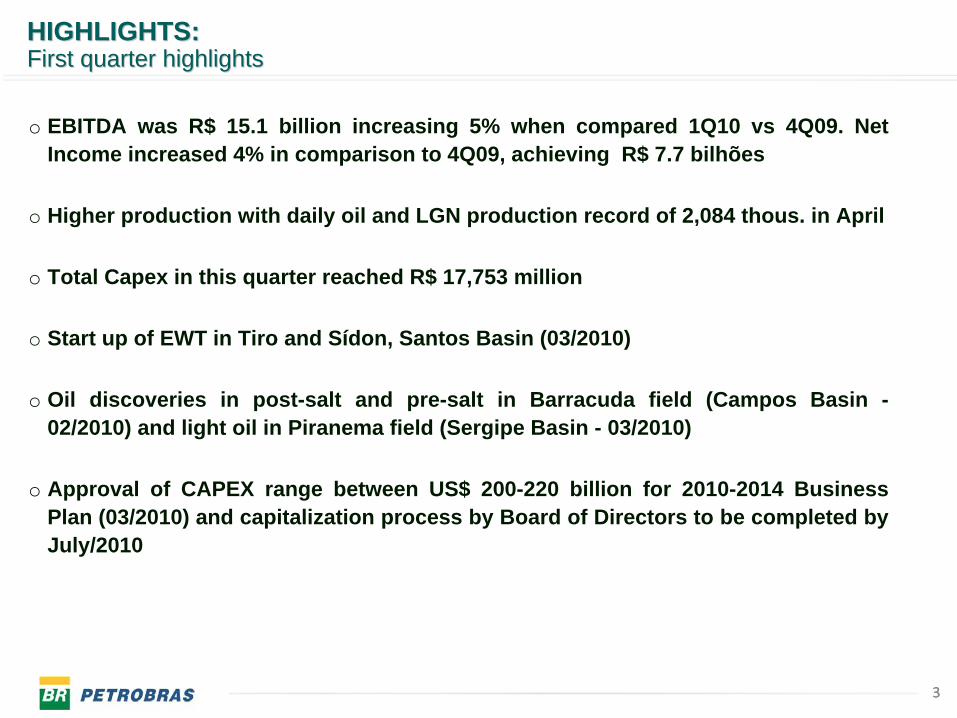
o EBITDA was R$ 15.1 billion increasing 5% when compared 1Q10 vs 4Q09. Net Income increased 4% in comparison to 4Q09, achieving R$ 7.7 bilhões
o Higher production with daily oil and LGN production record of 2,084 thous. in April
o Total Capex in this quarter reached R$ 17,753 million
o Start up of EWT in Tiro and Sídon, Santos Basin (03/2010)
o Oil discoveries in post-salt and pre-salt in Barracuda field (Campos Basin - 02/2010) and light oil in Piranema field (Sergipe Basin - 03/2010)
o Approval of CAPEX range between US$ 200-220 billion for 2010-2014 Business Plan (03/2010) and capitalization process by Board of Directors to be completed by July/2010
HIGHLIGHTS:HIGHLIGHTS:First quarter highlightsFirst quarter highlights
4
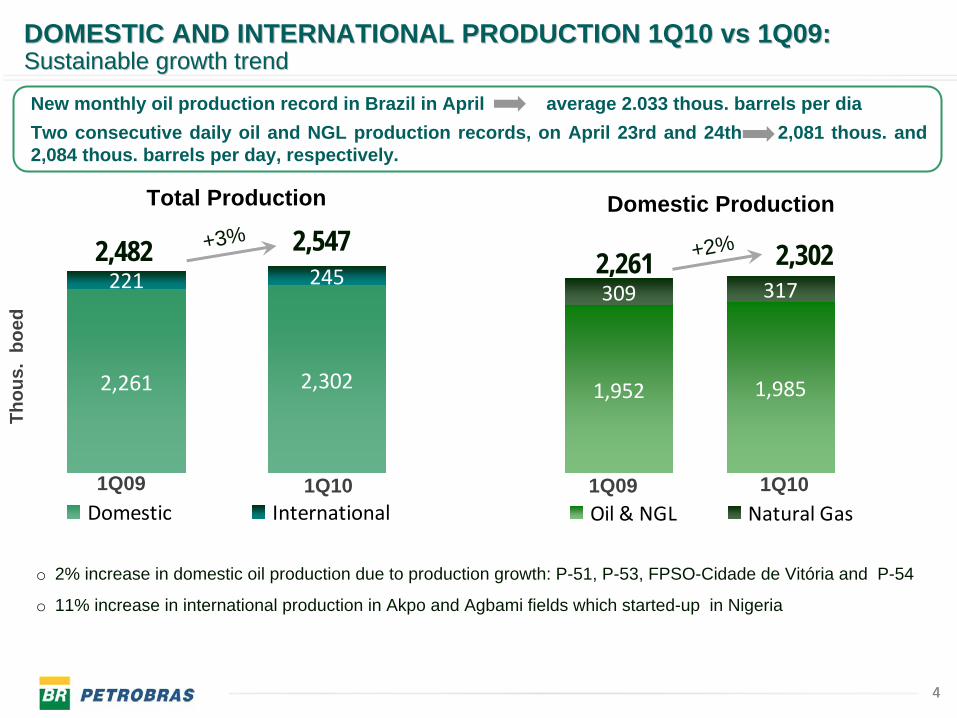
221 245
2,3022,261
Domestic International
309 317
1,9851,952
Oil & NGL Natural Gas
Domestic ProductionTotal Production
1Q09 1Q10
+3%
Thou
s. b
oed
1Q09
+2%2,482 2,547
1Q10
2,261 2,302
o 2% increase in domestic oil production due to production growth: P-51, P-53, FPSO-Cidade de Vitória and P-54
o 11% increase in international production in Akpo and Agbami fields which started-up in Nigeria
4
New monthly oil production record in Brazil in April average 2.033 thous. barrels per diaTwo consecutive daily oil and NGL production records, on April 23rd and 24th 2,081 thous. and 2,084 thous. barrels per day, respectively.
DOMESTIC AND INTERNATIONAL PRODUCTION 1Q10 DOMESTIC AND INTERNATIONAL PRODUCTION 1Q10 vsvs 1Q09:1Q09:SustainableSustainable growthgrowth trendtrend
55
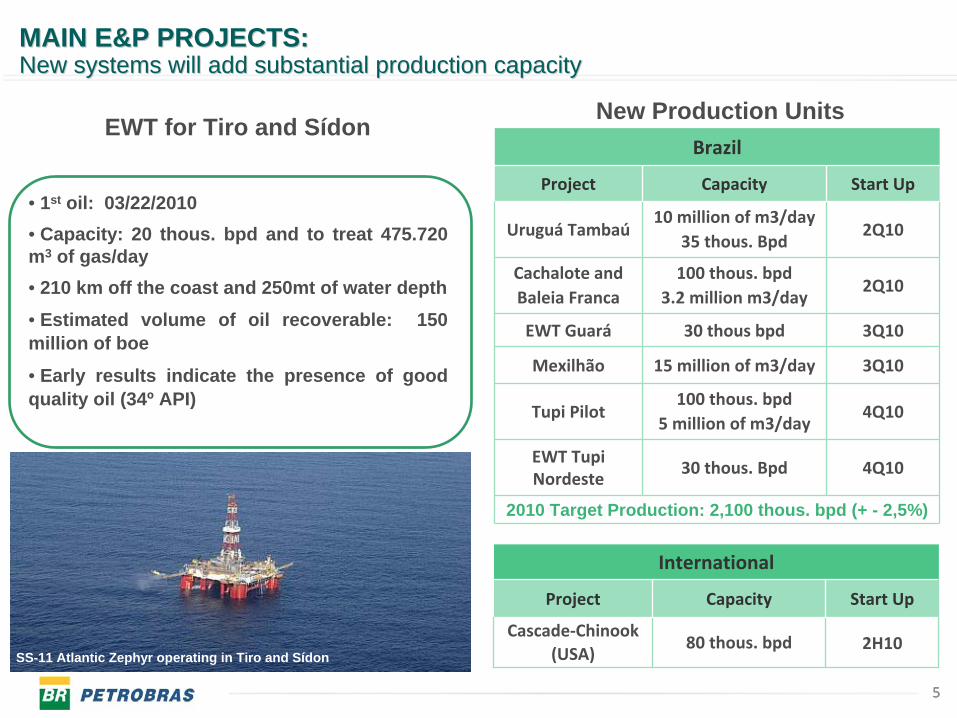
• 1st oil: 03/22/2010 • Capacity: 20 thous. bpd and to treat 475.720 m3 of gas/day• 210 km off the coast and 250mt of water depth• Estimated volume of oil recoverable: 150 million of boe
• Early results indicate the presence of good quality oil (34º API)
EWT for Tiro and Sídon
SS-11 Atlantic Zephyr operating in Tiro and Sídon
Brazil
Project Capacity Start Up
Uruguá
Tambaú10 million
of
m3/day35 thous. Bpd
2Q10
Cachalote andBaleia Franca
100 thous. bpd3.2 million
m3/day2Q10
EWT Guará 30 thous
bpd 3Q10
Mexilhão 15 million
of
m3/day 3Q10
Tupi Pilot100 thous. bpd
5 million
of
m3/day4Q10
EWT Tupi
Nordeste
30 thous. Bpd 4Q10
2010 Target Production: 2,100 thous. bpd (+ - 2,5%)
New Production Units
International
Project Capacity Start Up
Cascade‐Chinook(USA)
80 thous. bpd 2H10
MAIN E&P PROJECTS:MAIN E&P PROJECTS:New systems will add substantial production capacityNew systems will add substantial production capacity
6
PRODUÇÃO 2010
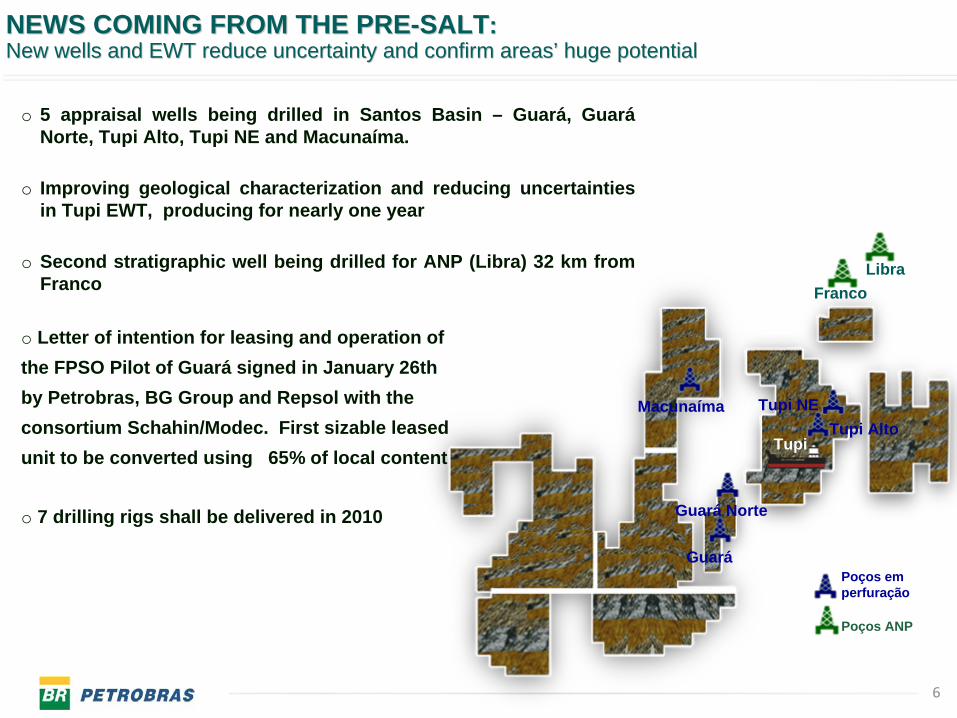
Tupi
Guará
Tupi NETupi Alto
Macunaíma
Guará Norte
FrancoLibra
o 5 appraisal wells being drilled in Santos Basin – Guará, Guará Norte, Tupi Alto, Tupi NE and Macunaíma.
o Improving geological characterization and reducing uncertainties in Tupi EWT, producing for nearly one year
o Second stratigraphic well being drilled for ANP (Libra) 32 km from Franco
Poços em perfuração
Poços ANP
o Letter of intention for leasing and operation of the FPSO Pilot of Guará signed in January 26th by Petrobras, BG Group and Repsol with the consortium Schahin/Modec. First sizable leased unit to be converted using 65% of local content
o 7 drilling rigs shall be delivered in 2010
NEWS COMING FROM THE PRENEWS COMING FROM THE PRE--SALTSALT::New wells and EWT reduce uncertainty and confirm areasNew wells and EWT reduce uncertainty and confirm areas’’ huge potentialhuge potential
7
20
70
120
170
220
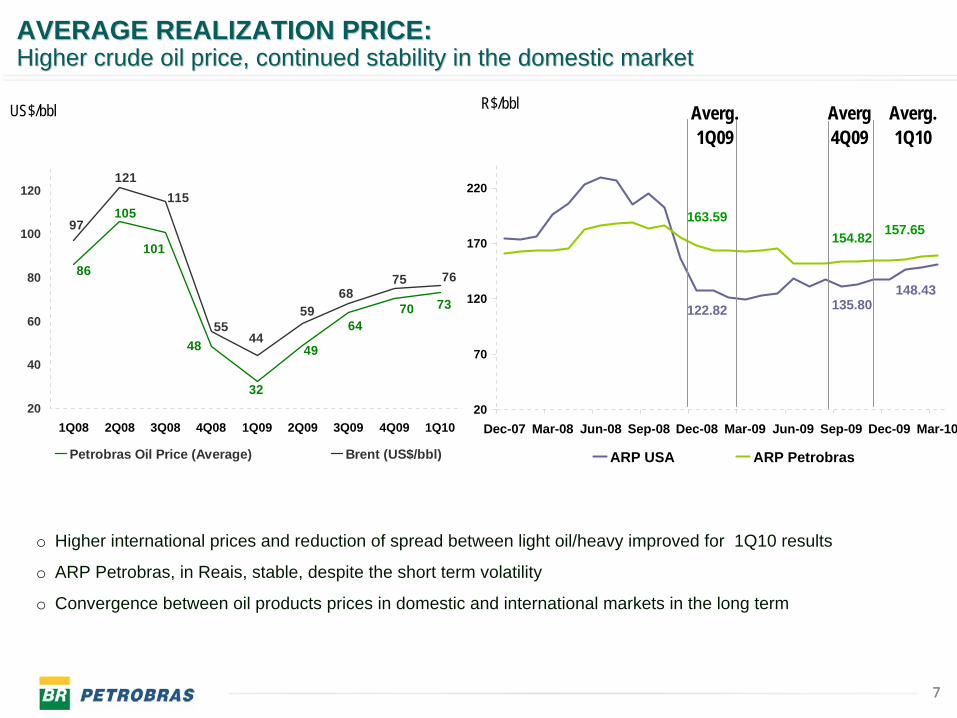
Dec-07 Mar-08 Jun-08 Sep-08 Dec-08 Mar-09 Jun-09 Sep-09 Dec-09 Mar-10
ARP USA ARP Petrobras
7
R$/bbl
o Higher international prices and reduction of spread between light oil/heavy improved for 1Q10 results
o ARP Petrobras, in Reais, stable, despite the short term volatility
o Convergence between oil products prices in domestic and international markets in the long term
7064
101
105
86
48
32
49
73
4455
115121
97
5968
75 76
20
40
60
80
100
120
1Q08 2Q08 3Q08 4Q08 1Q09 2Q09 3Q09 4Q09 1Q10
Petrobras Oil Price (Average) Brent (US$/bbl)
Averg4Q09
Averg.1Q10
Averg.1Q09
US$/bbl
148.43135.80122.82
163.59154.82 157.65
AVERAGE REALIZATION PRICE:AVERAGE REALIZATION PRICE:Higher crude oil price, continued stability in the domestic markHigher crude oil price, continued stability in the domestic marketet
8
R$/barrel
9.408.727.82 9.02 9.5114.3310.786.87 13.84 15.23
75 7668
5944
1Q09 2Q09 3Q09 4Q09 1Q10
Lifting Cost Gov. Take Brent
17.9 1 17.58 16 .8 4 16 .51 16 .9 5
16 .3 3 2 1.2 8 2 4 .78 2 6 .53 2 6 .8 7
1Q0 9 2 Q0 9 3 Q0 9 4 Q0 9 1Q10
Lif t ing C o st Go v. T ake
34.24 38.86 41.62 43.04 43.82
14.69 19.50 22.86 24.74 23.73
US$/barrel
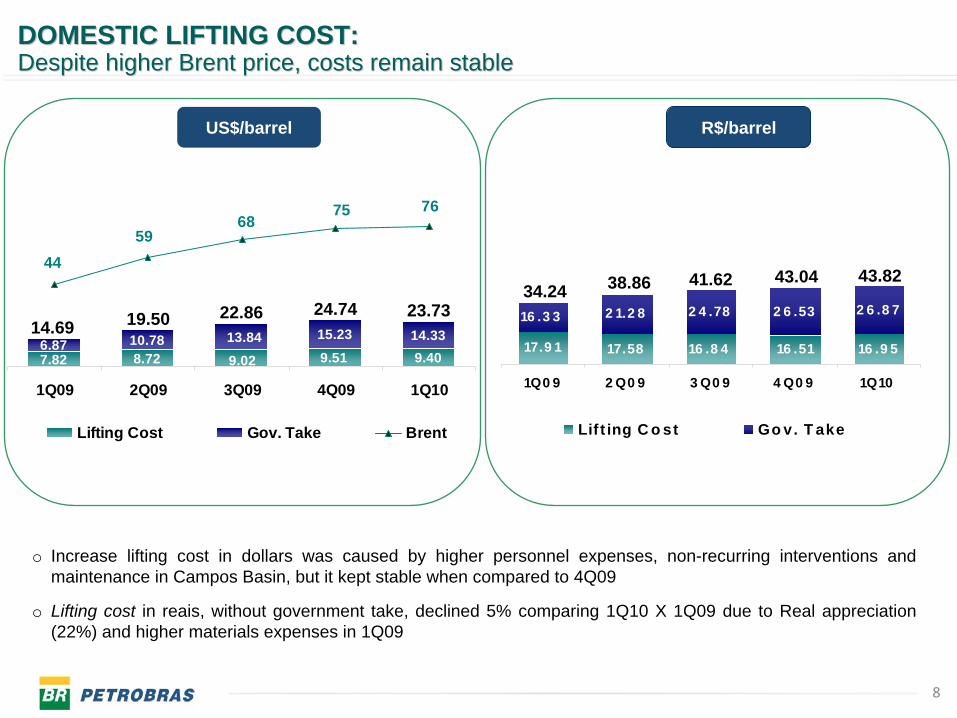
o Increase lifting cost in dollars was caused by higher personnel expenses, non-recurring interventions and maintenance in Campos Basin, but it kept stable when compared to 4Q09
o Lifting cost in reais, without government take, declined 5% comparing 1Q10 X 1Q09 due to Real appreciation (22%) and higher materials expenses in 1Q09
DOMESTIC LIFTING COST:DOMESTIC LIFTING COST:Despite higher Brent price, costs remain stableDespite higher Brent price, costs remain stable
9
1Q09 4Q09 1Q10
+15%
247 257223
9
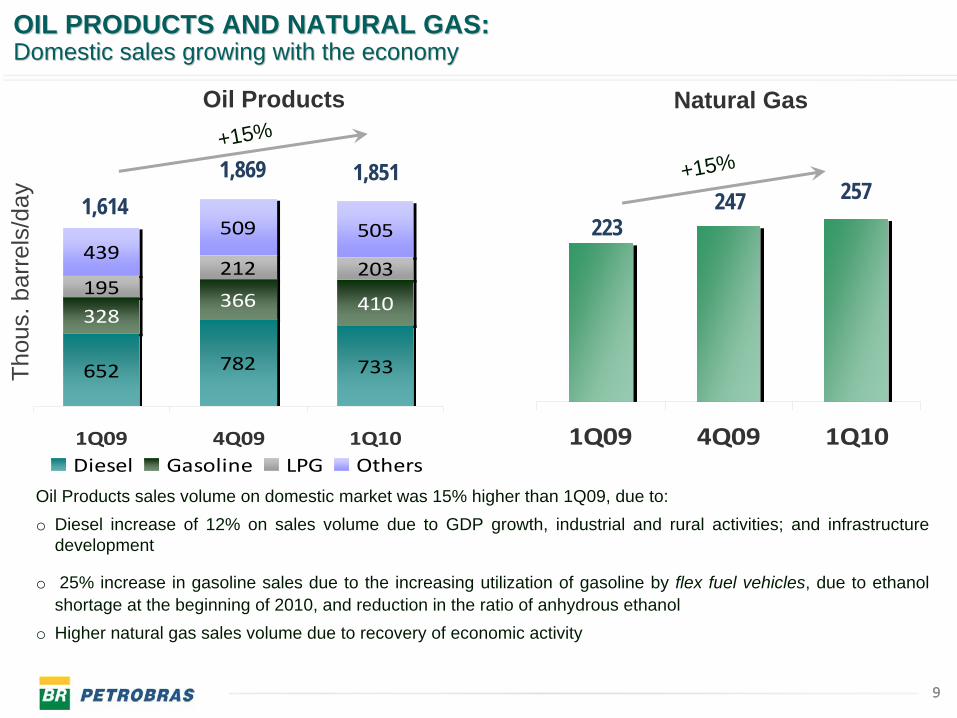
Oil Products sales volume on domestic market was 15% higher than 1Q09, due to:o Diesel increase of 12% on sales volume due to GDP growth, industrial and rural activities; and infrastructure
development
o 25% increase in gasoline sales due to the increasing utilization of gasoline by flex fuel vehicles, due to ethanol shortage at the beginning of 2010, and reduction in the ratio of anhydrous ethanol
o Higher natural gas sales volume due to recovery of economic activity
Natural Gas
Thou
s. b
arre
ls/d
ay
652 782 733
366195
212 203439
509 505
410328
1Q09 4Q09 1Q10Diesel Gasoline LPG Others
Oil Products
1,6141,869 1,851+15%
OIL PRODUCTS AND NATURAL GAS:OIL PRODUCTS AND NATURAL GAS: Domestic sales growing with the economyDomestic sales growing with the economy
10
1Q09 (thous. barrels/day)
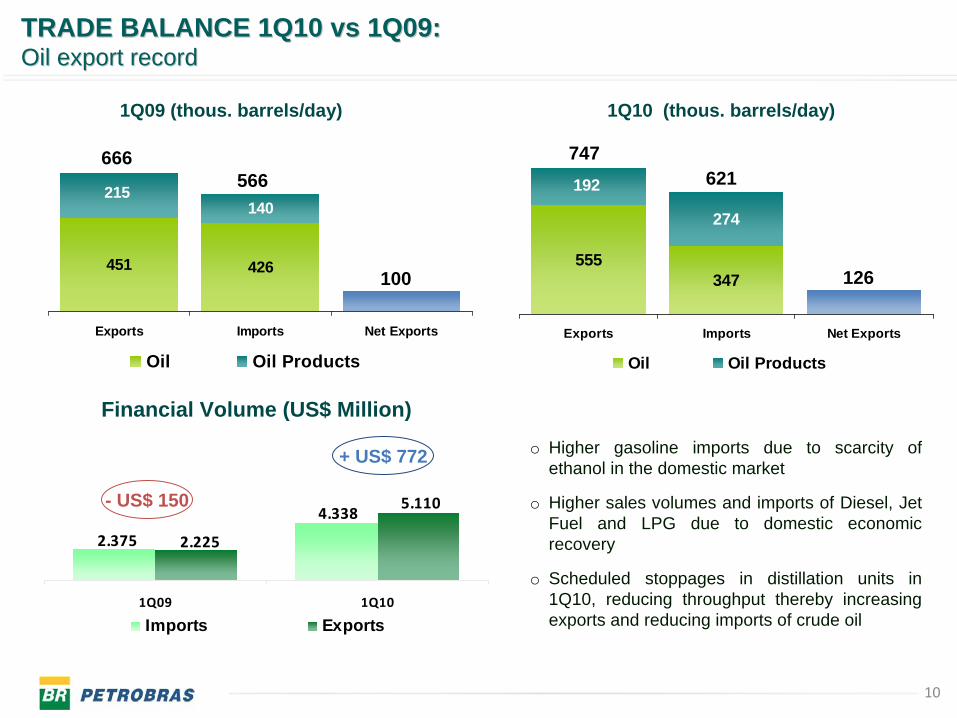
o Higher gasoline imports due to scarcity of ethanol in the domestic market
o Higher sales volumes and imports of Diesel, Jet Fuel and LPG due to domestic economic recovery
o Scheduled stoppages in distillation units in 1Q10, reducing throughput thereby increasing exports and reducing imports of crude oil
451 426
140215
Exports Imports Net Exports
Oil Oil Products
1Q10 (thous. barrels/day)
555
274
347
192
Exports Imports Net Exports
Oil Oil Products
747621
126100
566666
2.375
4.338
2.225
5.110
1Q09 1Q10
Imports Exports
Financial Volume (US$ Million)
- US$ 150
+ US$ 772
TRADE BALANCE 1Q10 TRADE BALANCE 1Q10 vsvs 1Q09:1Q09:OilOil exportexport recordrecord
11
OPERATING INCOME 1Q10 vs 4Q09:OPERATING INCOME 1Q10 vs 4Q09:HigherHigher salessales volumes volumes andand reductionreduction in in operatingoperating expensesexpenses
(R$ MILLION)
4Q09Operating Income (1)
Net Operating Revenue COGS
Operating Expenses
1Q10Operating Income (1)
11*(1) Operating income before financial result, equity balance and taxes
9,658
2,716 (1,530) 773 11,617
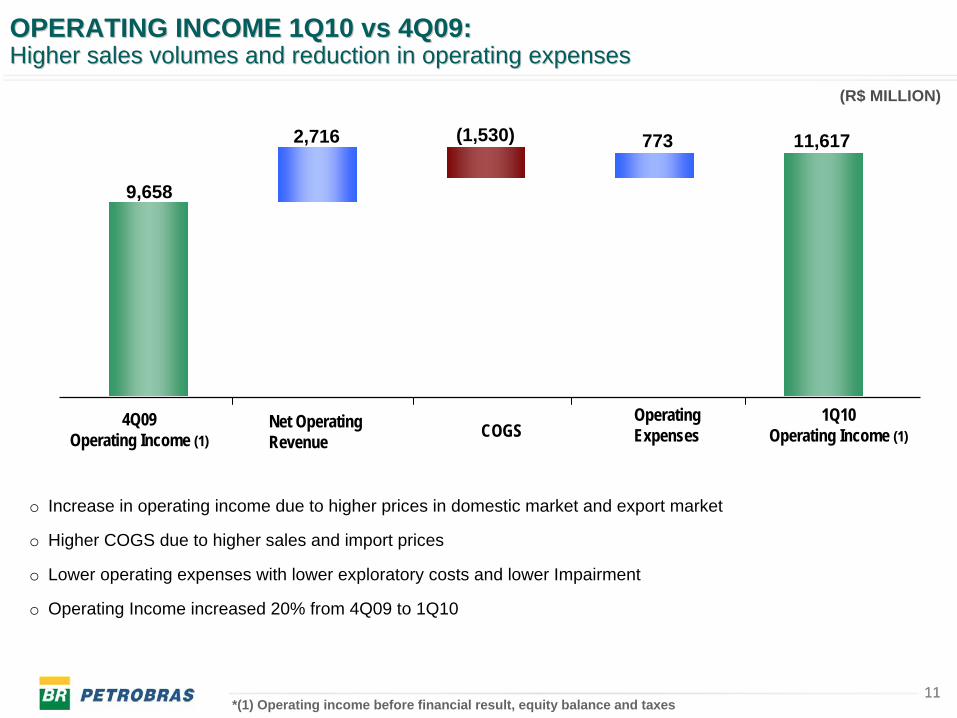
o Increase in operating income due to higher prices in domestic market and export market
o Higher COGS due to higher sales and import prices
o Lower operating expenses with lower exploratory costs and lower Impairment
o Operating Income increased 20% from 4Q09 to 1Q10
12
(R$ MILLION)
12
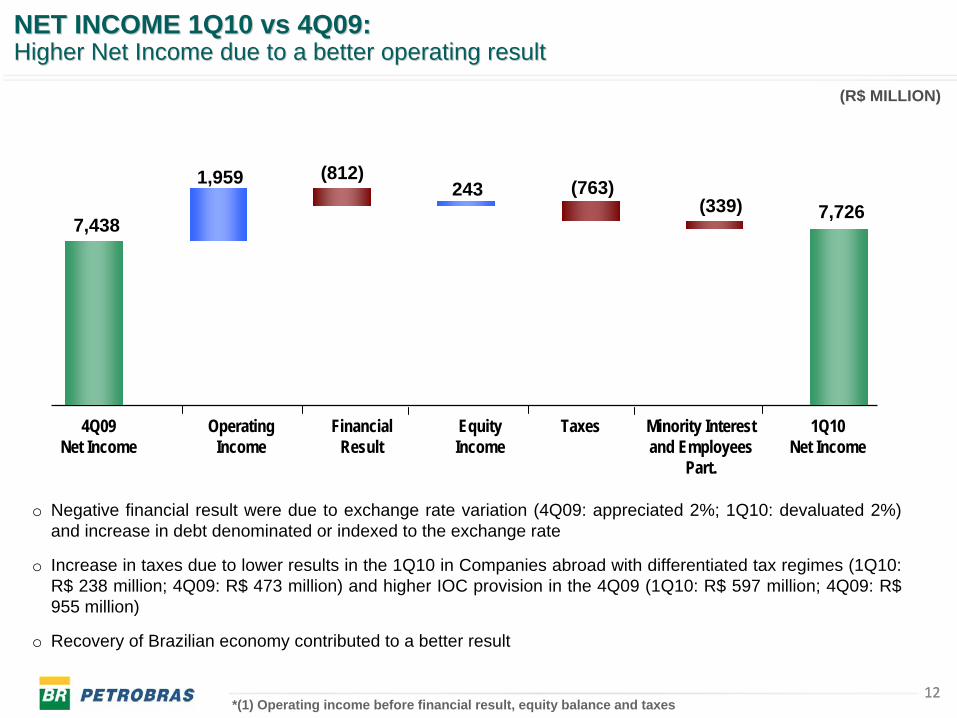
7,438
1,959 (812)243 (763)
(339) 7,726
1Q10Net Income
4Q09Net Income
Taxes Minority Interest and Employees
Part.
Financial Result
Equity Income
Operating Income
*(1) Operating income before financial result, equity balance and taxes
o Negative financial result were due to exchange rate variation (4Q09: appreciated 2%; 1Q10: devaluated 2%) and increase in debt denominated or indexed to the exchange rate
o Increase in taxes due to lower results in the 1Q10 in Companies abroad with differentiated tax regimes (1Q10: R$ 238 million; 4Q09: R$ 473 million) and higher IOC provision in the 4Q09 (1Q10: R$ 597 million; 4Q09: R$ 955 million)
o Recovery of Brazilian economy contributed to a better result
NET INCOME 1Q10 vs 4Q09:NET INCOME 1Q10 vs 4Q09:HigherHigher Net Net IncomeIncome duedue to a to a betterbetter operatingoperating resultresult
13
(R$ MILLION)
13
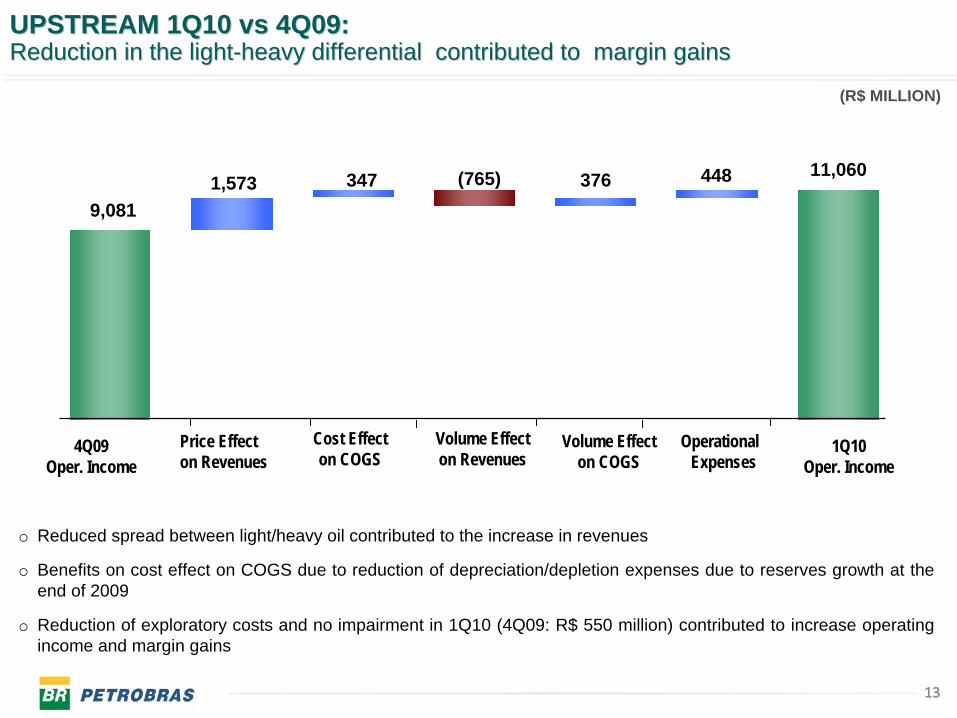
9,0811,573 (765)347 376 448 11,060
4Q09Oper. Income
1Q10Oper. Income
Price Effect on Revenues
Volume Effecton Revenues
Cost Effecton COGS
OperationalExpenses
Volume Effecton COGS
o Reduced spread between light/heavy oil contributed to the increase in revenues
o Benefits on cost effect on COGS due to reduction of depreciation/depletion expenses due to reserves growth at the end of 2009
o Reduction of exploratory costs and no impairment in 1Q10 (4Q09: R$ 550 million) contributed to increase operating income and margin gains
UPSTREAM UPSTREAM 1Q10 vs 4Q09: 1Q10 vs 4Q09: ReductionReduction in in thethe lightlight--heavyheavy differentialdifferential contributedcontributed to to marginmargin gainsgains
14
(R$ MILLION)
14
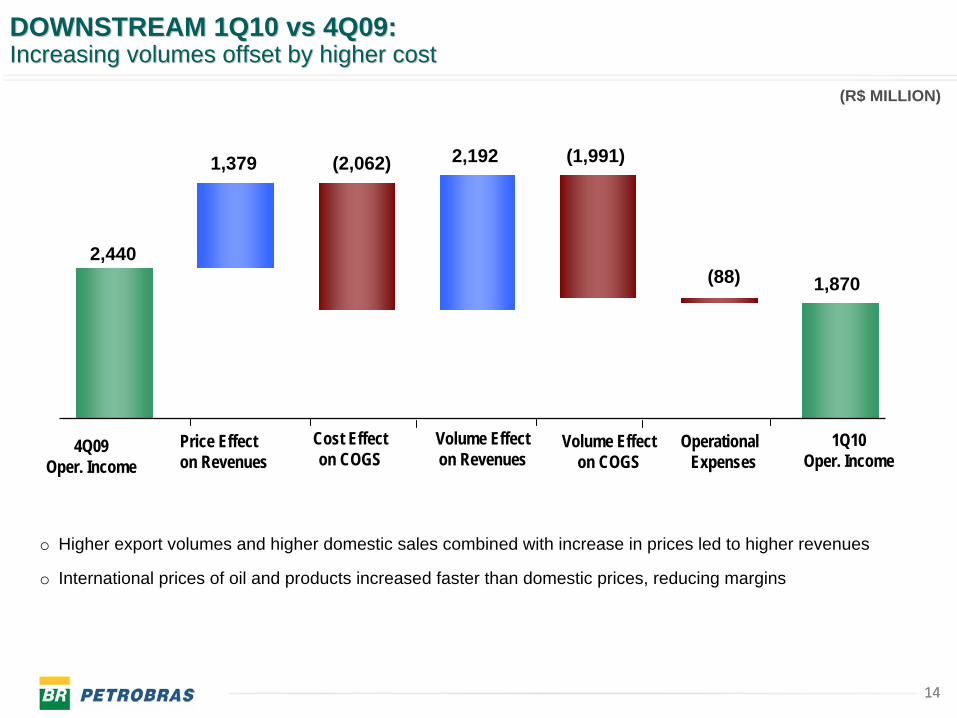
2,440
1,379 2,192(2,062) (1,991)
(88) 1,870
4Q09Oper. Income
1Q10Oper. Income
Price Effect on Revenues
Volume Effecton Revenues
Cost Effecton COGS
OperationalExpenses
Volume Effecton COGS
o Higher export volumes and higher domestic sales combined with increase in prices led to higher revenues
o International prices of oil and products increased faster than domestic prices, reducing margins
DOWNSTREAM 1Q10 DOWNSTREAM 1Q10 vsvs 4Q09:4Q09:Increasing volumes offset by higher costIncreasing volumes offset by higher cost
15
GAS & ENERGY, INTERNATIONAL and DISTRIBUTION (1Q10 GAS & ENERGY, INTERNATIONAL and DISTRIBUTION (1Q10 vsvs 4Q09)4Q09)Continued improvement across other segmentsContinued improvement across other segments
15
Gas
&En
ergy
Inte
rnat
iona
lD
istr
ibut
ion
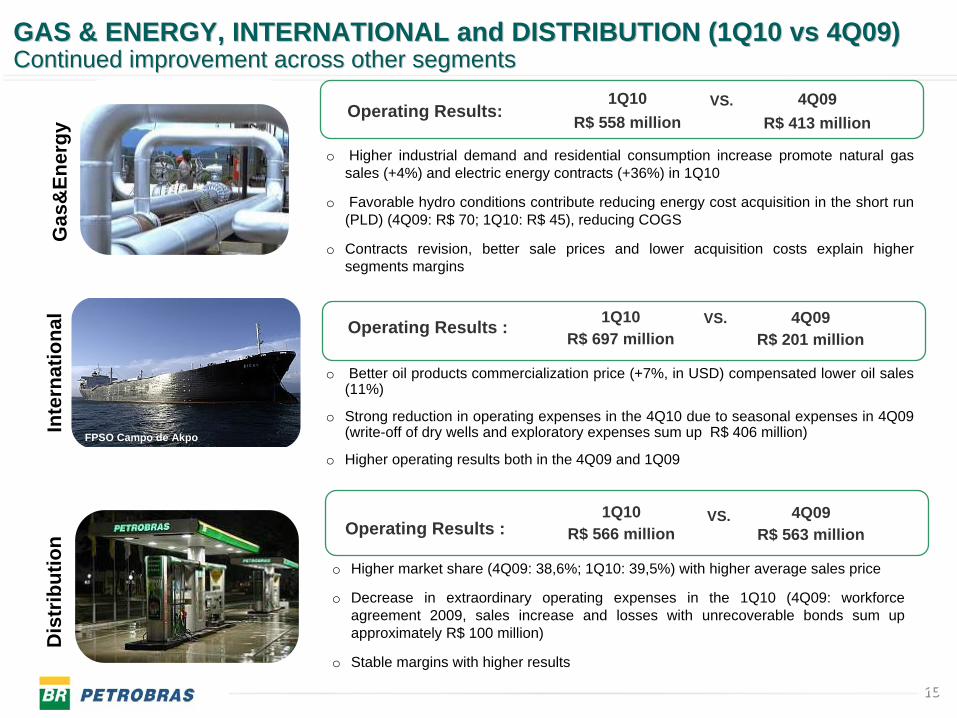
Operating Results:1Q10
R$ 558 million4Q09
R$ 413 millionVS.
Operating Results : 1Q10R$ 697 million
4Q09R$ 201 million
VS.
Operating Results :1Q10
R$ 566 million4Q09
R$ 563 millionVS.
FPSO Campo de Akpo
o Higher industrial demand and residential consumption increase promote natural gas sales (+4%) and electric energy contracts (+36%) in 1Q10
o Favorable hydro conditions contribute reducing energy cost acquisition in the short run (PLD) (4Q09: R$ 70; 1Q10: R$ 45), reducing COGS
o Contracts revision, better sale prices and lower acquisition costs explain higher segments margins
o Better oil products commercialization price (+7%, in USD) compensated lower oil sales (11%)
o Strong reduction in operating expenses in the 4Q10 due to seasonal expenses in 4Q09 (write-off of dry wells and exploratory expenses sum up R$ 406 million)
o Higher operating results both in the 4Q09 and 1Q09
o Higher market share (4Q09: 38,6%; 1Q10: 39,5%) with higher average sales price
o Decrease in extraordinary operating expenses in the 1Q10 (4Q09: workforce agreement 2009, sales increase and losses with unrecoverable bonds sum up approximately R$ 100 million)
o Stable margins with higher results
16
Investments* 1Q09 R$ 14.4 Billion
5,6
6,1
24,710,1
0,05
1,3
1,1
3,8
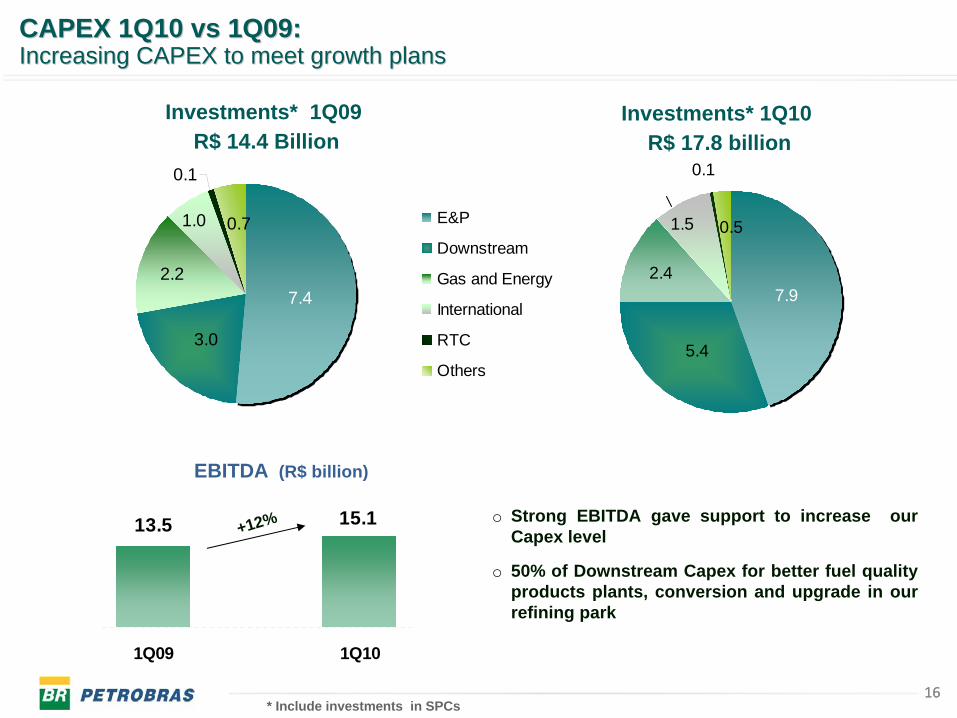
CAPEX 1Q10 CAPEX 1Q10 vsvs 1Q09:1Q09:Increasing CAPEX to meet growth plansIncreasing CAPEX to meet growth plans
Investments* 1Q10R$ 17.8 billion
5.4
1.5
7.92.4
0.1
0.5
3.0
1.0
7.42.2
0.1
0.7 E&P
Downstream
Gas and Energy
International
RTC
Others
16* Include investments in SPCs
EBITDA (R$ billion)
+12% o Strong EBITDA gave support to increase our Capex level
o 50% of Downstream Capex for better fuel quality products plants, conversion and upgrade in our refining park
13.5 15.1
1Q09 1Q10
1717
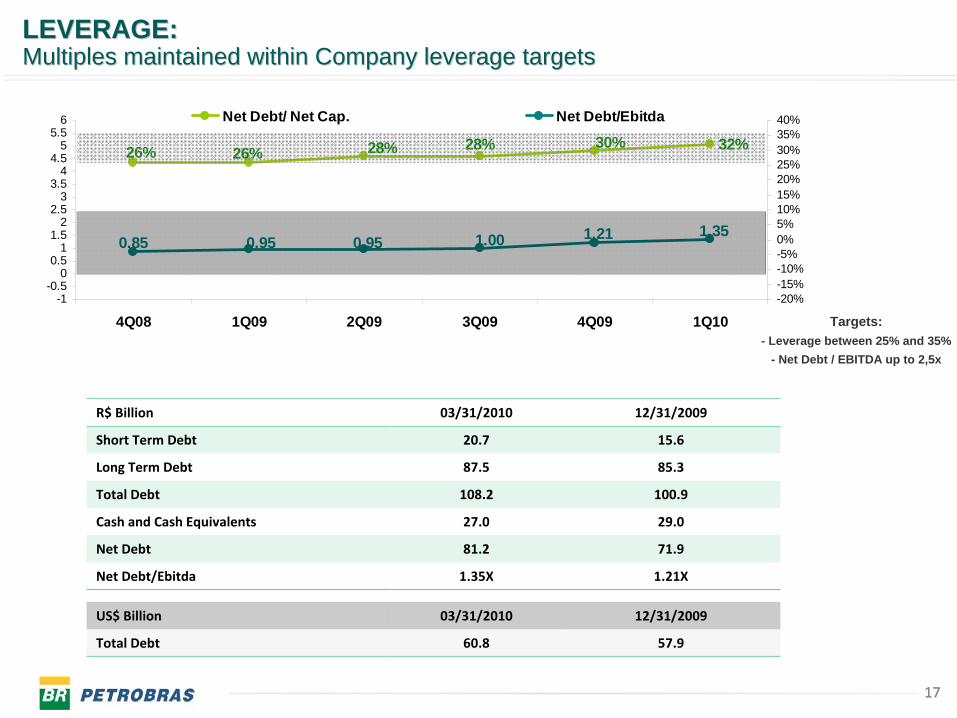
R$ Billion 03/31/2010 12/31/2009
Short Term Debt 20.7 15.6
Long Term Debt 87.5 85.3
Total Debt 108.2 100.9
Cash and Cash Equivalents 27.0 29.0
Net Debt 81.2 71.9
Net Debt/Ebitda 1.35X 1.21X
US$ Billion 03/31/2010 12/31/2009
Total Debt 60.8 57.9
26%26% 28% 28% 30% 32%
0.95 0.95 1.00 1.21 1.350.85
-1-0.5
00.5
11.5
22.5
33.5
44.5
55.5
6
4Q08 1Q09 2Q09 3Q09 4Q09 1Q10-20%-15%-10%-5%0%5%10%15%20%25%30%35%40%Net Debt/ Net Cap. Net Debt/Ebitda
LEVERAGE:LEVERAGE: Multiples maintained within Company leverage targets Multiples maintained within Company leverage targets
Targets:- Leverage between 25% and 35%
- Net Debt / EBITDA up to 2,5x
18
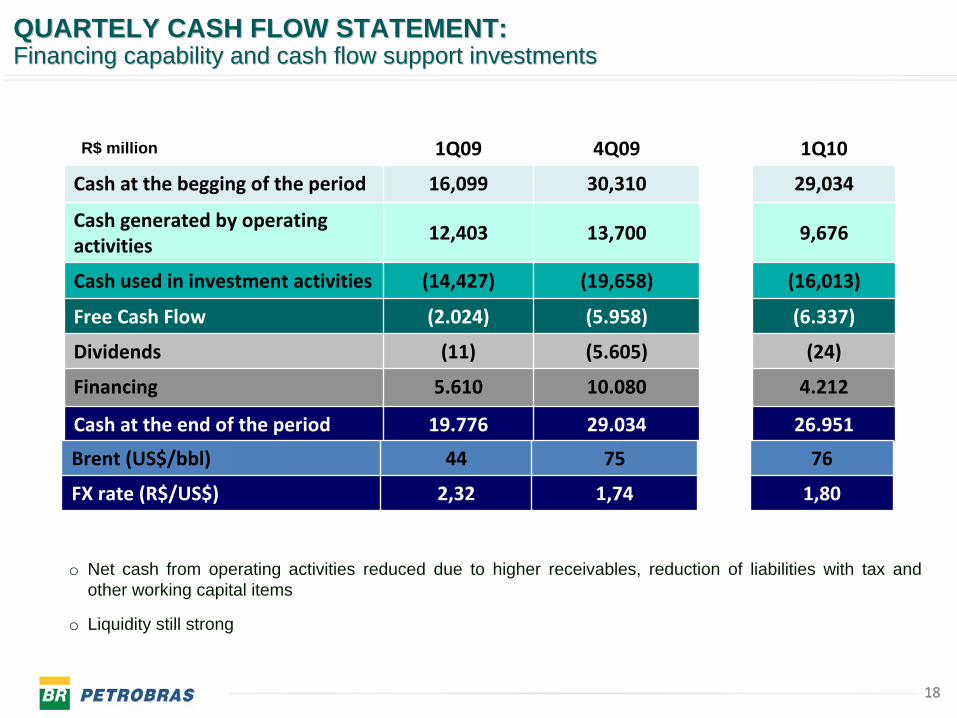
1Q09 4Q09 1Q10
Cash at the begging of the period 16,099 30,310 29,034
Cash generated by operating
activities12,403 13,700 9,676
Cash used in investment activities (14,427) (19,658) (16,013)
Free
Cash
Flow (2.024) (5.958) (6.337)
Dividends (11) (5.605) (24)
Financing 5.610 10.080 4.212
Cash at the end of the period 19.776 29.034 26.951
R$ million
o Net cash from operating activities reduced due to higher receivables, reduction of liabilities with tax and other working capital items
o Liquidity still strong
18
Brent (US$/bbl) 44 75 76
FX rate (R$/US$) 2,32 1,74 1,80
QUARTELY CASH FLOW STATEMENT:QUARTELY CASH FLOW STATEMENT:Financing capability and cash flow support investmentsFinancing capability and cash flow support investments
19
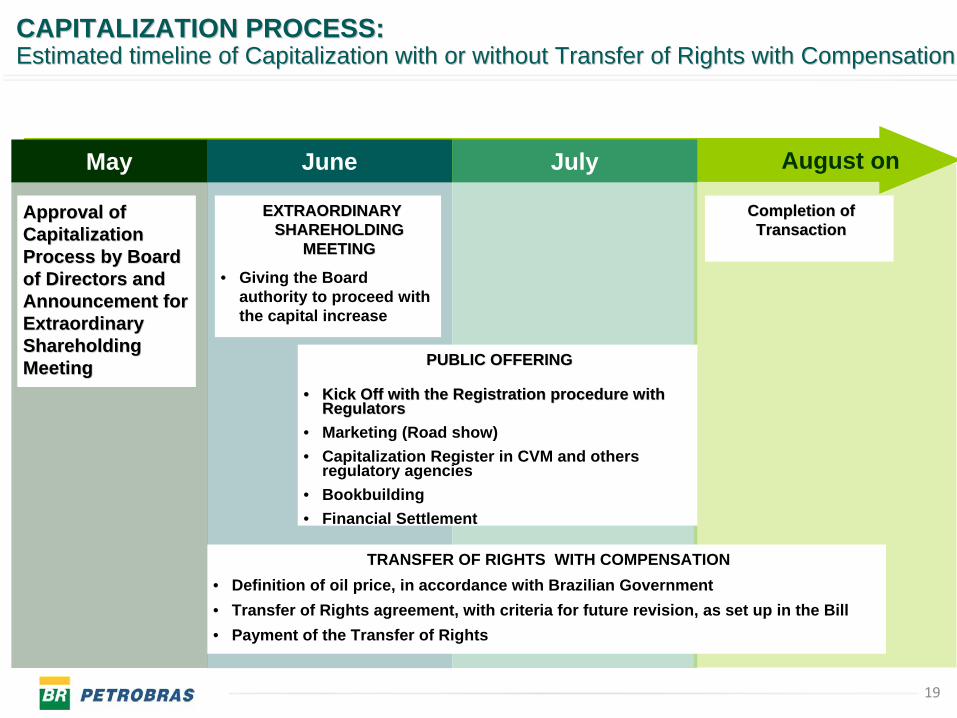
CAPITALIZATION PROCESS:CAPITALIZATION PROCESS:Estimated timeline of Capitalization with or without Transfer ofEstimated timeline of Capitalization with or without Transfer of Rights withRights with CompensationCompensation
Approval of Approval of Capitalization Capitalization Process by Board Process by Board of Directors and of Directors and Announcement for Announcement for Extraordinary Extraordinary Shareholding Shareholding MeetingMeeting
EXTRAORDINARY EXTRAORDINARY SHAREHOLDING SHAREHOLDING
MEETINGMEETING
• Giving the Board authority to proceed with the capital increase
August onMay July
Completion of Completion of TransactionTransaction
June
TRANSFER OF RIGHTS WITH COMPENSATION• Definition of oil price, in accordance with Brazilian Government• Transfer of Rights agreement, with criteria for future revision, as set up in the Bill• Payment of the Transfer of Rights
PUBLIC OFFERINGPUBLIC OFFERING
•• Kick Off with the Registration procedure with Kick Off with the Registration procedure with RegulatorsRegulators
• Marketing (Road show)• Capitalization Register in CVM and others
regulatory agencies• Bookbuilding• Financial Settlement