bhg2.files.wordpress.com file · Web viewbhg2.files.wordpress.com
Upload
truongnhanCategory
view
218download
0
Introductory Financial Accounting
ACCT11081 – Martin Turner
Rachel Jackson (Pirere)
C98078215
Assignment 1 Steps 7-11
Step 7 Involves you exploring the inventory practices of your firm.
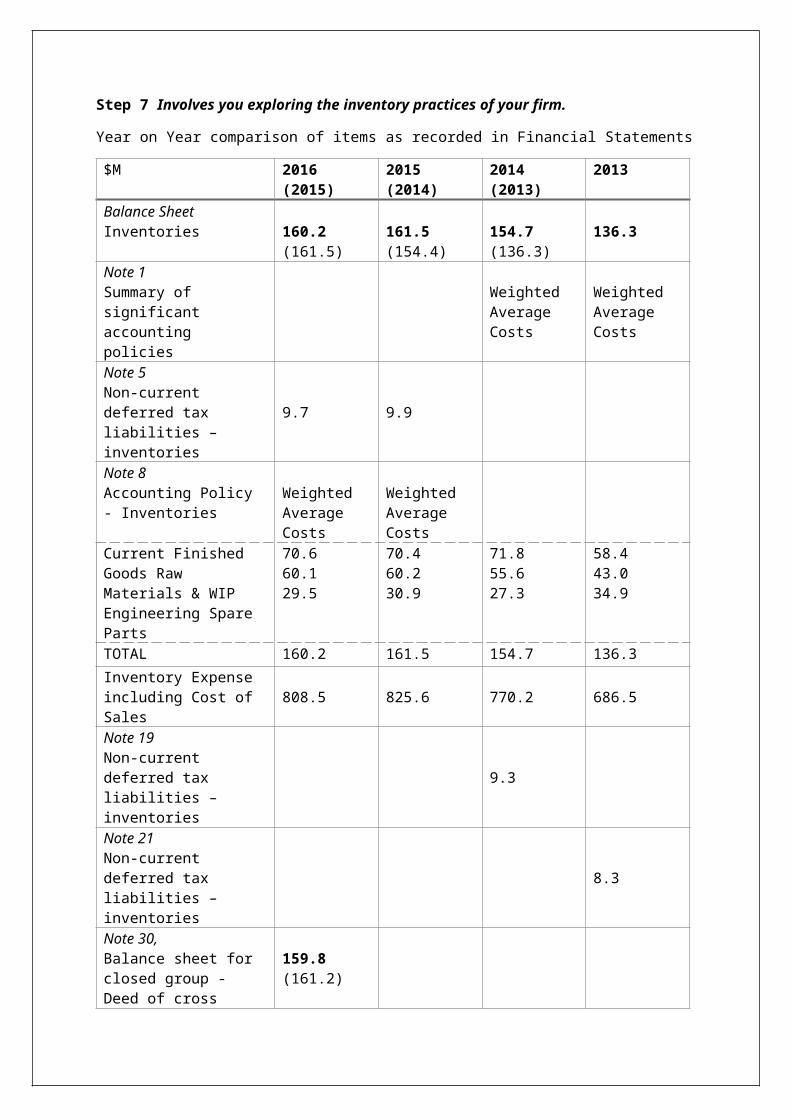
Year on Year comparison of items as recorded in Financial Statements
$M 2016 (2015) 2015 (2014) 2014 (2013) 2013Balance Sheet Inventories 160.2 (161.5) 161.5 (154.4) 154.7 (136.3) 136.3 Note 1 Summary of significant accounting policies
Weighted Average Costs
Weighted Average Costs
Note 5Non-current deferred tax liabilities – inventories 9.7 9.9Note 8 Accounting Policy - Inventories
Weighted Average Costs
Weighted Average Costs
Current Finished Goods Raw Materials & WIPEngineering Spare Parts
70.660.129.5
70.460.230.9
71.855.627.3
58.443.034.9
TOTAL 160.2 161.5 154.7 136.3
Inventory Expense including Cost of Sales 808.5 825.6 770.2 686.5
Note 19Non-current deferred tax liabilities – inventories 9.3Note 21Non-current deferred tax liabilities – inventories 8.3Note 30, Balance sheet for closed group - Deed of cross guarantee
159.8 (161.2)
Note 31Balance sheet for Closed group - Deed of cross guarantee
161.2 (153.8)
Note 32Balance sheet for Closed group - Deed of cross guarantee
154.2 (127.3) 127.3
Note 31Reconciliation of profit after income tax
1.3
Note 32 Reconciliation of profit after income tax
(1.4)
Note 33Reconciliation of profit after income tax
(13.9) (1.5)
Note 37Business Combinations 154.7 (2014)

(acquisition accounting) /restated 154.4 (2014)
Note 38Business Combinations (reconciliations of acquisitioned business)
4.5
$M 2016 2015 2014 2013Total Revenue 1396.2 1413.1 1337.8 1228.0Cost of Sales 808.5 825.6 770.2 686.5COS as a % of Revenue
63% 58% 55% 56%
The IA2/ AASB102 defines Inventory as assets held for sale in the ordinary course of business; in the process of production for that sale; in the form of materials or supplies to be consumed in the production process or in the rendering of services. Inventory for Adelaide Brighton that is purchased and held for sale include raw materials, WIP and finished goods but also Engineering Spare Parts Stores which I will discuss further later on. AdiBri’s inventory also include cement, industrial lime, premixed concrete, aggregates and concrete products.
Inventory is reported on the balance sheet as a current asset (bought on at cost) and then once sold is reported on the income statement as an expense against revenue for the current period. This shows the relationship between the balance sheet and the income statement where an organisations key goal is to generate revenue from sales and then how that creates wealth for the business owners as the carryover of net revenue ultimately contributes to an organisations Equity. Very early on in the unit I asked a serious newbie question on social media about why and how is ‘inventory’ not listed on my income statement (smiley crying face). I can’t see it anywhere??? So I now understand that inventory as the asset is of course listed on the balance sheet but inventory as a cost of sales is an expense and rightly so should sit on the income statement.
Inventories for Adelaide Brighton have been recorded year on year seeing a steady increase for each of the years with a downturn recorded for 2016 which inevitably reflected on the company’s overall decrease in profit for the year. In reviewing Inventories through my financial statements I firstly noted where the term ‘inventories’ was found in each financial statement year and while there has been movement for which notes they are recorded in, the company has been consistent with what it records but not where it records within the notes. As depicted in table 2, Cost of Sales as a percentage of total revenue is fairly consistent and reflective of revenue with a rise in 2016 of 7% in cost of sales. The increase could be due to an increase in the market for cost of raw materials or a sign of a downturn in the market requirement for AdiBri’s products. When I thought about inventory for AdiBri being its cement and cement products I recalled the news article (Steps 3-6) about AdiBri’s contaminated product and I then thought about how and if AdiBri had to write that inventory off how might that look for the 2017 results – I guess I’ll have to wait till the end of the year for that OR check the half yearly report which I did. Turns out the contaminated concrete is a contributing factor to NPAT being reported as down by 10.9%! I expect the write-off would be listed under impairments so would have been interesting to see that breakdown.
Weighted average cost is used to account for inventory, and is recorded in Note 1 -Summary of Significant Accounting Policies for years 2013 and 2014 and has moved to Note 8 – Inventories in

2015 and 2016. AdiBri have consistently applied weighted average costs as their inventory cost assignment but have not specifically stated whether they use a periodic or perpetual method. I surmise that the meaning of the following statement from the notes suggest that AdiBri may use both perhaps?
Inventory quantities are verified through stocktakes where inventory is either counted or, in the case of bulk materials, volumetric surveys are converted to weight using density factors. Certain volumetric surveys are performed by independent surveyors utilising aerial and laser surveys.
I understand this to mean that concrete bags for instance could be counted as per the perpetual method although it has been suggested that turnover of high volume high frequency stock is less cost effective to maintain under a perpetual system. On the other hand, new computerised systems can make this job easier and would make sense for an organisation the size of AdiBri. Further to support my assumption is the Key Audit note “Measurement of inventory quantities for finished goods, raw materials and work in progress” which looks to closely examine their method of measuring their inventory. However, it only uses this method to measure raw materials and WIP which may mean they don’t use this method to measure their bagged cement products or other cement products such as pavers (finished goods) and so I suggest they could use the perpetual method for this inventory. I further am assuming that surveyed inventory could only be reconciled once the survey is completed and so could be done using the periodic method but again, the bagged cement products could also be counted only at stocktake so I am not absolutely clear on which method AdiBri use.
Of particular interest to me in the audit notes was in relation to how AdiBri measures its raw materials and work in progress (WIP) which is normally stockpiled prior to use or sale. Raw materials and WIP for 2016 was $130.7M and is measured using independent surveyors to perform volumetric surveys to estimate quantities of stock using aerial and laser surveys. The survey quantities are then reported in cubic meters, to tonnages using density factors (‘google’ convert volume to weight… Density = mass/volume so V=m/ρ but you need to understand the density of the substance you are trying to convert – I’m sure AdiBri do ). The auditors assessed the independent surveyors and their method, competency and objectivity and were satisfied that they could rely on their work for the purpose of the audit. Essentially they examined whether AdiBri’s independent surveyors were in fact reliable in their methodology to surveying and that Adibri’s internal lab testing for density was also reliable. They identified that AdiBri used the same method and factors year on year which validated AdiBri’s approach to how they measure their inventory. There was no evidence in the 2014 or 2015 annual report noting such an audit matter.
Another thing I noticed was that Inventories on Balance Sheet for Financials as at 31 st December 2014 lists $157.4 but in 2015 financials lists as $157.3M? On further review, the notes reveal that the 2015 value has been re-stated due to inventory realised as belonging to the previous period from acquisition of a new business.
Non-current deferred tax liabilities were reported in different notes; 2015 & 2016 in Note 5, with 2014 reported in Note 19 and 2013 in Note 21 however the breakdown of Inventories as current assets are recorded across all financials in Note 8 and so perhaps it was just easier to consolidate all the information hence change in reporting notes for 2015, 2016?
The actual breakdown of inventory is recorded as Engineering spare parts stores; raw materials and work in progress and then finished goods with the sum of these equalling the amounts recorded on the balance sheet. I can only guess why AdiBri who predominantly sell concrete, concrete products, clinker and lime would have Engineering spare parts stores and that it totals nearly 30% of their
inventory? It was difficult to find any information in relation to what engineering spare parts AdiBri would hold as inventories and why. Could the requirement to produce the concrete and other products be included in the cost of sales e.g. parts required for maintenance on the concrete plant equipment? If that is included in cost of sales, then why isn’t labour included for instance? I have scoured the company website and reports and can’t seem to find any information within the statements that provides the answer and so have discussed with work colleagues who are thinking along the same lines as I am. In the organisation I work for, it holds two types of inventory; Inventories held for sale and Inventories held for distribution being 1) Quarry and Road Making Materials and 2) Stores Inventory. Number 1 is held at various quarries (located geographically to assist with associated works in those areas) and number 2 is held at our Depot Store. Inventory held at the Depot Store is distributed to staff so that they can complete required works specific to the services we provide e.g. pipework for maintenance of water infrastructure; plumbing parts to repair water infrastructure; road signage and bagged cement to name a few. The Store holds approximately 750 lines all of which are specifically used internally and not sold to the public. I will assume that AdiBri’s inventory holdings is not dissimilar to the organisation I work for, just perhaps the numbers are much larger.
Inventory reported in the notes under Deed of cross guarantee is similarly reported across the years in Notes 30, 31 & 32 but what does deed of cross guarantee mean? In Adibri’s financials it states it is a deed under which each company guarantees the debts of the others. The deed also enables the parent company and one or more of its wholly-owned subsidiaries to be viewed as one economic entity and obtain relief in having to provide financials for each of these companies, i.e. one set of financials can be provided as consolidated financial statements to ASIC and are referred to in relation to the deed as the closed group of companies – what is an extended closed group definition? The extended closed group is any entity which is a party to the deed of cross guarantee, irrespective if that entity relies on the financial reporting relief.
I’m not sure I could suggest improvement in relation to how AdiBri manage their inventory and that is mostly due to the type of business they conduct and specifically their product. I can see that the inventory held is consistent to its revenue and year on year reflective of each other. I would have liked to have seen volume of stock recorded rather than just a value so that I could attempt to calculate just how much inventory AdiBri holds but I suspect it would be in the hundreds of thousands of tonnes and again would like to have seen detail of Engineering Spare Parts Stores.

Step 8 involves exposing you to a commonly used accounting software, includes online quiz results.


Step 9 Create a set of business transactions for your company, recording these in MYOB and producing a set of financial statements.
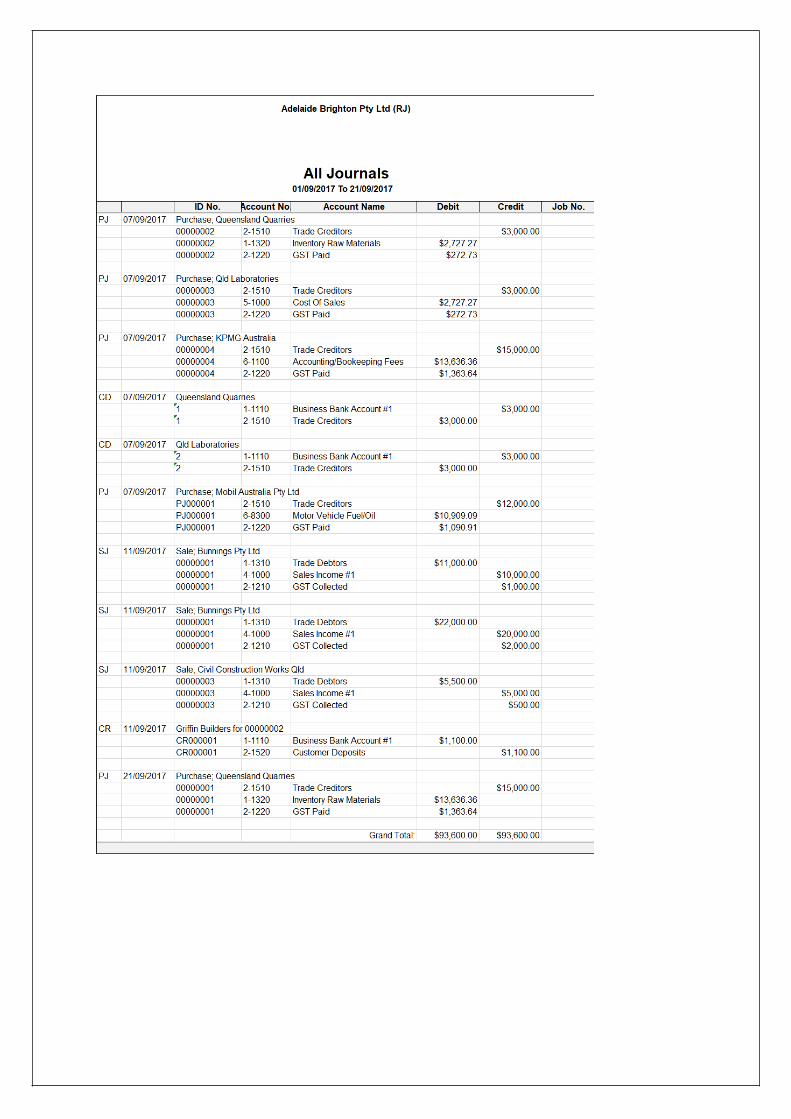
First attempt… In creating transactions for my company I tried to think of the types of transactions that my company might experience on a day to day basis being a concrete and cement products business. I didn’t consider that AdiBri operates through its subsidiaries and just made the assumption that the transactions related to AdiBri specifically however in hindsight I don’t think this worked. Given that AdiBri report as the consolidated group of companies I think it was unrealistic for me to create the transactions on such a small scale. I also didn’t give any thought for how each of the transactions might have reflected on the final outcome and the analysis requirement of this step. In then actually looking to do a print screen and drop it into my assignment, I have discovered that I have only done 9 transactions! So, here is my one opportunity to give my company a head start. You will note transaction number 10 is rather significant in comparison to the others and my intended outcome was to hopefully reflect that my company is not doing so bad – but is that what actually happened?
No… its not what happened at all! You might notice that my All Journals transaction list does not reflect my comments above and that is because I repeated this exercise three times, yep, three times. My first attempt was abysmal and I went into the step without any consideration for what my
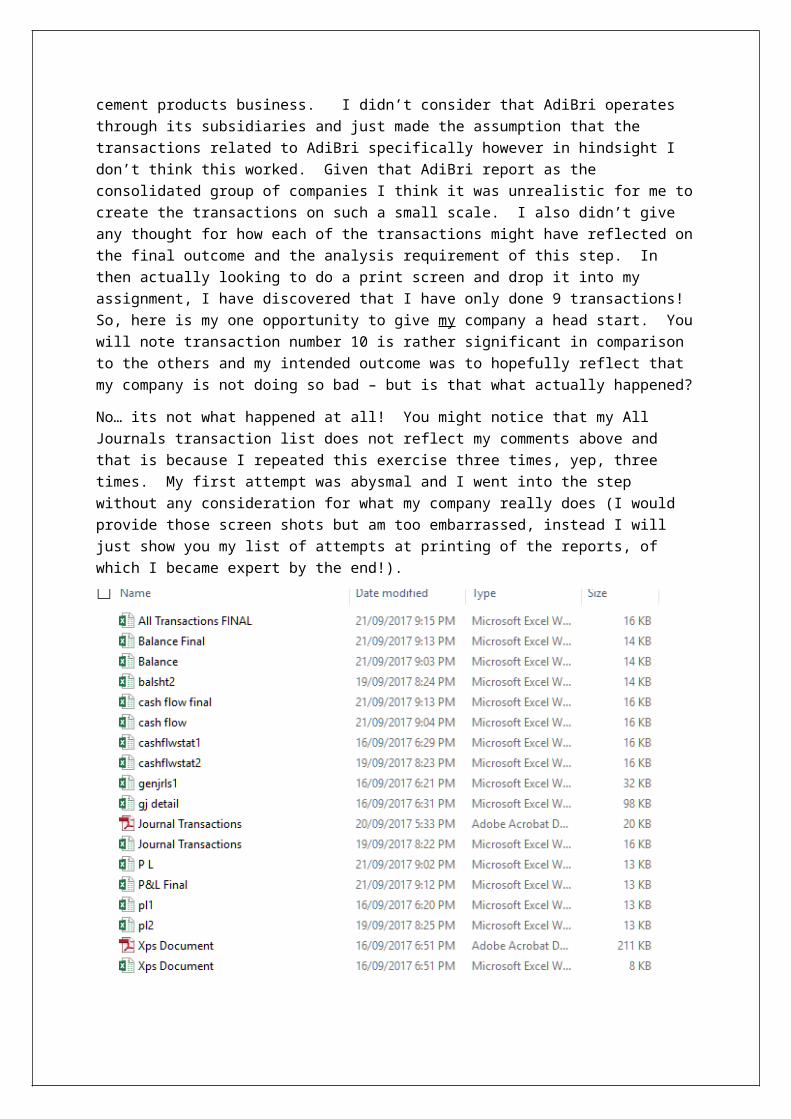
company really does (I would provide those screen shots but am too embarrassed, instead I will just show you my list of attempts at printing of the reports, of which I became expert by the end!).
In not having any consideration for the transactions I was entering the result was less than acceptable. My profit and loss statement was seriously negative and it matched my equity. So, I decided to put more effort into how exactly a company might transact from start up. I had another go at entering sales etc. but it too failed so finally I chose to go through the easy set up in MYOB for creating a company and decided to give myself a starting balance (as the supposed business owner?), although this wasn’t required I wondered how it would affect my end result. I also looked to start my business up with buying products to sell. My mistake was trying to enter these using the ‘item’ layout. In not wanting to re-do this exercise yet again, I persevered but could only access one item ‘rock’. Not sure why my other items would not show up in my items list when recording sales but I decided not to linger given this was my third attempt. What I also did was attempt to reflect purchases in my dates but got caught up and forgot so some of my transactions defaulted to the current date which threw out my approach all together. I took notes as I went so I could recall the decision I made in setting up my company, i.e. Starting month June; Review each chart for Service/manufacturing/construction & building – chose manufacturing; account set up $500k in Business Bank 1 – Equity; added $2.3M to plant & equipment (I needed a factory?); Finished goods to 1-1330 - $100k; Raw Materials 1-1320 $200K. I noted the tax codes used and payment method (cash). I then noted what I would call my customers and my and also suppliers also. I think this helped somewhat. To the point… what does my profit and loss statement tell me?
An appropriate way to evaluate the Income statement is to use gross profit margin ratio which establishes the entities profit margin where profit margin = profit/revenue. $7727.28/$35,000 x 100 = 22%. This would indicate that the entity has a good profit margin, perhaps too good given that it has high turnover of product however this should be compared with other reporting periods to evaluate whether the profit is increasing or decreasing.

Gross profit margin results in 92% gross profit which would assume that only 8% would go to cost of sales. Again, if this were a real situation you might say I’m on a winner
In establishing the liquidity of the business I look to the balance sheet and quickly establish using the Liquidity ration i.e. Current ration = current assets/current liabilities that my company is doing extremely well! Using the appropriate values, current assets being at $849K and my liabilities at $42K it provides an outcome of 2012% which would suggest the entity has made an excessive investment in assets and I think that is even an understatement!
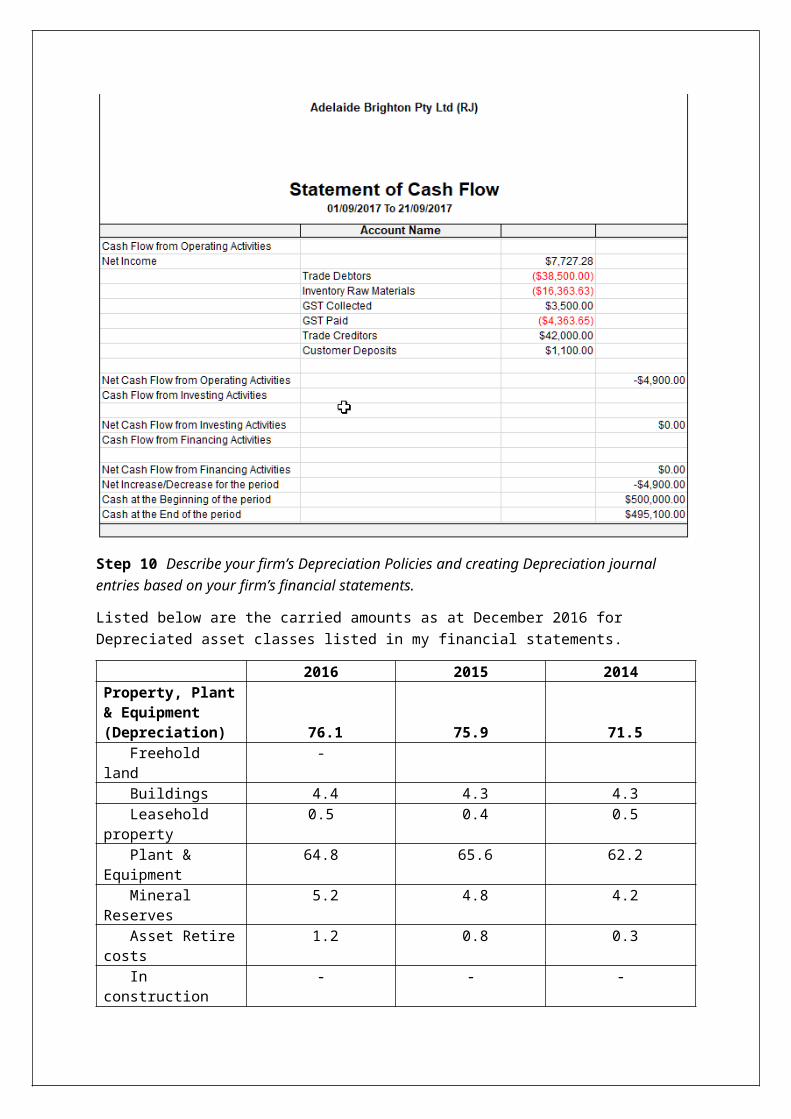
On first glance it may look like my firm is doing great but I do think it is seriously distorted. I am not able to use some ratios given I am unable to substantiate averages for some items. Not to be defeatist but entering 10 transactions for such a small period, not having carrying values to input the statements would suggest we are a very new company with a huge plant & equipment (assets) with minimal inventory to gain revenue. Given the outcome of the Statement of Cash flows and regardless of my efforts to put some ‘weight’ behind my entity; the statement of cash flows assist in assessing the ability of the entity to generate cash and what may be needed in the future. Given my result is a negative due to AdiBri spending more than they made in the month would indicate that if AdiBri continued to trade as they are they will need all the equity they have!


Step 10 Describe your firm’s Depreciation Policies and creating Depreciation journal entries based on your firm’s financial statements.
Listed below are the carried amounts as at December 2016 for Depreciated asset classes listed in my financial statements.
2016 2015 2014Property, Plant & Equipment (Depreciation) 76.1 75.9 71.5 Freehold land - Buildings 4.4 4.3 4.3 Leasehold property 0.5 0.4 0.5 Plant & Equipment 64.8 65.6 62.2 Mineral Reserves 5.2 4.8 4.2 Asset Retire costs 1.2 0.8 0.3 In construction - - -Amortisation 2.0 1.9 1.5Impairment - - 2.0TOTAL 78.1 77.8 75.0
My company first details depreciation in its Financial Summary in the CEO and Managing Director review of the annual reports. It is here that I find the total depreciated amount for the company of which is reported as Depreciation, Amortisation and Impairment. Depreciation for my entity is not a big expense with it representing only 5.5% on average of its total revenue. In comparison to the
organisation I work for, depreciation represents almost 25% of total revenue but then it isn’t like other organisations!
Underlying depreciation and amortisation were recorded for 2014 & 2015 but not reported in 2016 however there is nil effect to the depreciation in 2015 as it excludes items of revenue and expenses. In 2014, the underlying depreciation and amortisation do not equal the total depreciation as it did in 2015 and I investigated a little further. As is explained in the notes, the underlying results were impacted by a number of significant items, I read on further to try to understand if the write off or impairment as I now know it was part of something bigger and came across this note:
The Group announced the rationalisation of clinker production at the Munster site in February 2014. As part of the rationalisation, a number of employees were made redundant at a cost of $5.6 million. In addition, assets not required following the cessation of clinker manufacture at the site were considered impaired and an impairment charge of $2.0 million was recognised.
So essentially a factory was closed down and the assets were impaired. I certainly did not expect to come to understand that from reviewing depreciation!
Note 4 details the entity’s expenses and it is here where I find how my company has dealt with depreciation on its assets. Depreciation is listed for Buildings, Plant & Equipment and Mineral Reserves. When I look at my table above I wonder how they have accounted for Leasehold property and asset retirement costs but a quick calculation and I have found them. Buildings is recorded as it is (4.3), Leasehold property (0.4) is included with Plant & Equipment (65.6) and Mineral Reserves (4.8) is recorded including Asset retirement cost (0.8). Also included in note 4 is amounts my company have amortised on intangible assets and impairments.
My company’s intangible assets are made up of Goodwill; Software and Other Intangibles as reported across the three years noting that goodwill did not move from 2015 to 2016 which would indicate that AdiBri did not make any acquisitions where they paid more than the company’s assets were worth. The company’s goodwill increased from 2014 to 2015 so again, I went back to the notes to see if I could see why? And I couldn’t? I can see the business combination in the 2014 report but the carrying amount is not bought across from 2014 ($246.2M) to the 2015 report ($248.7M) accurately – is this a mistake or is there something else I should be looking for? In the 2014 report, it has business combinations listed as $75.6M but in the 2015 report listing the previous year as $78.1 and then I found it listed under Note 37 Business Combinations. An adjustment of $2.5M was recognised ‘adjustment to additional goodwill’ as the acquisition accounting did not complete until 2015.
AdiBri have recorded Depreciation, amortisation and impairments using the straight line method and is assessed over the estimated useful life being:
Buildings 20 - 40 years
Plant & Equipment 3 - 40 years
I have used a ratio to establish Average useful life left in years is current with expected stated useful life (as stated above) however given that these items could make up any number of things, this is just an assumption based on the overall asset class, not the individual assets that makeup the whole.
2014 2015 2016Buildings 33 33 33 yearsPlant & Equipment 20 19 19 yearsMineral Reserves 44 35 39 years

Straight line method uses the equation Depreciable amount/useful life. The depreciable amount is the total cost of the item including freight, installation costs (including employee costs) and any other amount that can be attributed to buying that item or getting it ready for use like testing less any trade discounts and GST; minus the residual value.
Journal entries:
I have looked to the 2016 Financial Report to make an assumption about the types of transactions that an accountant might perform for AdiBri and so went to the Balance Sheet and Non-current assets listed at Property, Plant & Equipment. In reviewing the note 11 and looked to the Reconciliations for the carrying amount (starting position for year 2016) for Assets.
$M DR CR1 DepreciationDepreciation – P&E (Assets) 64.8Accumulated Depreciation (Contra-Asset)
64.8
2 DepreciationDepreciation – Buildings (Asset)
4.4
Accumulated Depreciation (Contra-Asset)
4.4
3 DepreciationDepreciation – Mineral Reserves (Asset) 1.2Accumulated Depreciation (Contra-Asset)
1.2
The above journal entries are taken straight from the 2016 financial statement and recognise the depreciation for each of the asset classes as described above. These journal entries make up part of the whole of depreciation for the AdiBri for the year and are recognised as an expense on the income statement and an asset on the balance sheet.
As I come to the end I feel like I have learned much more than I thought I would but in some regards, not enough… Maria talks about the Advanced Accounting Unit and I expect I would normally have left that one till later but after having done this unit with the support/learning/coaching style of Martin’s I expect this time I will be prepared for what’s in stall