€¦ · Web viewFinancial support: This work was funded by the European Commission grant 603794...
53
111Equation Chapter 1 Section 1Occupational exposure to high- frequency electromagnetic fields and brain tumor risk in the INTEROCC study: An individualized assessment approach Javier Vila a-c , Michelle C Turner a-d , Esther Gracia-Lavedan a-c , Jordi Figuerola a-c , Joseph D Bowman e , Laurel Kincl f , Lesley Richardson g , Geza Benke h , Martine Hours i , Daniel Krewski d , Dave McLean j , Marie-Elise Parent k , Siegal Sadetzki l,m , Klaus Schlaefer n , Brigitte Schlehofer n , Joachim Schüz o , Jack Siemiatycki g , Martie van Tongeren p,q and Elisabeth Cardis a-c , on behalf of the INTEROCC Study Group r a Barcelona Institute for Global Health (ISGlobal), Barcelona, Spain b Universitat Pompeu Fabra (UPF), Barcelona, Spain c CIBER Epidemiología y Salud Pública (CIBERESP), Madrid, Spain d McLaughlin Centre for Population Health Risk Assessment, University of Ottawa, Ottawa, Canada e National Institute for Occupational Safety and Health (NIOSH), Ohio, USA f Oregon State University (OSU), Corvallis, Oregon, USA g University of Montreal Hospital Research Centre (CRCHUM), Montreal, Canada h School of Public Health and Preventive Medicine, Monash University, Melbourne, Australia i Université de Lyon, Université Lyon1 Claude Bernard, IFSTTAR, Unité Mixte de Recherche Épidémiologique et de Surveillance Transports Travail Environnement, Lyon, France j Massey University, Wellington, New Zealand k INRS-Institut Armand-Frappier, Université du Québec, Laval, Canada l Cancer and Radiation Epidemiology Unit, Gertner Institute, Chaim Sheba Medical Center, Tel-Hashomer, Israel m Sackler Faculty of Medicine, Tel Aviv University, Tel Aviv, Israel 1
Transcript of €¦ · Web viewFinancial support: This work was funded by the European Commission grant 603794...

111Equation Chapter 1 Section 1Occupational exposure to high-frequency electromagnetic fields and brain tumor risk in the INTEROCC study: An individualized assessment approach
Javier Vilaa-c, Michelle C Turnera-d, Esther Gracia-Lavedana-c, Jordi Figuerolaa-c, Joseph D Bowmane, Laurel Kinclf, Lesley Richardsong, Geza Benkeh, Martine Hoursi, Daniel Krewskid, Dave McLeanj, Marie-Elise Parentk, Siegal Sadetzkil,m, Klaus Schlaefern, Brigitte Schlehofern, Joachim Schüzo, Jack Siemiatyckig, Martie van Tongerenp,q and Elisabeth Cardisa-c, on behalf of the INTEROCC Study Groupr
a Barcelona Institute for Global Health (ISGlobal), Barcelona, Spain b Universitat Pompeu Fabra (UPF), Barcelona, Spain c CIBER Epidemiología y Salud Pública (CIBERESP), Madrid, Spaind McLaughlin Centre for Population Health Risk Assessment, University of Ottawa, Ottawa, Canadae National Institute for Occupational Safety and Health (NIOSH), Ohio, USA f Oregon State University (OSU), Corvallis, Oregon, USA g University of Montreal Hospital Research Centre (CRCHUM), Montreal, Canadah School of Public Health and Preventive Medicine, Monash University, Melbourne, Australiai Université de Lyon, Université Lyon1 Claude Bernard, IFSTTAR, Unité Mixte de Recherche Épidémiologique et de Surveillance Transports Travail Environnement, Lyon, Francej Massey University, Wellington, New Zealandk INRS-Institut Armand-Frappier, Université du Québec, Laval, Canadal Cancer and Radiation Epidemiology Unit, Gertner Institute, Chaim Sheba Medical Center, Tel-Hashomer, Israelm Sackler Faculty of Medicine, Tel Aviv University, Tel Aviv, Israeln German Cancer Research Center (DKFZ), Heidelberg, Germanyo International Agency for Research on Cancer (IARC), Section of Environment and Radiation, Lyon, Francep Institute of Occupational Medicine (IOM), Edinburgh, UKq Centre for Occupational and Environmental Health, Centre for Epidemiology, The University of Manchester, UK
1

r INTEROCC Study Group members: International coordination - Elisabeth Cardis (ISGlobal), Laurel Kincl (Oregon State University), Lesley Richardson (University of Montreal Hospital Research Centre); Australia - Geza Benke (Monash University); Canada - Jérôme Lavoué and Jack Siemiatycki (University of Montreal Hospital Research Centre), Daniel Krewski (University of Ottawa); Marie-Elise Parent (INRS-Institut Armand-Frappier); France - Martine Hours (IFSTTAR); Germany - Brigitte Schlehofer and Klaus Schlaefer (DKFZ); Joachim Schüz (now at IARC), Maria Blettner (IMBEI, University of Mainz); Israel - Siegal Sadetzki (Gertner Institute, Chaim Sheba Medical Center and Tel Aviv University); New Zealand - Dave McLean (Massey University); UK - Sarah Fleming (University of Leeds), Martie van Tongeren (Institute of Occupational Medicine – IOM & University of Manchester); USA - Joseph D Bowman (NIOSH).
Corresponding author: Javier Vila – ISGlobal - Barcelona Institute for Global Health. Parc de Recerca Biomèdica de Barcelona, Doctor Aiguader, 88 | 08003 Barcelona, Spain. Tel.: +34 932147358| Fax +34 932147302, E-mail: [email protected]
Abbreviated title: High-frequency EMF and brain tumor risk
Word count - Abstract: 289Word count - Main text: 5,859Total number of tables and figures: 7
2

Financial support: This work was funded by the European Commission grant 603794 (GERoNiMO project). The conduct of the INTEROCC study was funded by the National Institutes for Health (NIH) Grant No. 1R01CA124759-01. The work on the French occupational data was in part funded by AFSSET (Convention N° ST-2005-004). The INTERPHONE study was supported by funding from the European Fifth Framework Program, ‘Quality of Life and Management of Living Resources’ (contract 100 QLK4-CT-1999901563) and the International Union against Cancer (UICC). The UICC received funds for this purpose from the Mobile Manufacturers’ Forum (MMF), now Mobile & Wireless Forum (MWF), and the GSM Association. Provision of funds to the INTERPHONE study investigators via the UICC was governed by agreements that guaranteed INTERPHONE's complete scientific independence (http://interphone.iarc.fr/interphone_funding.php). In Australia, funding was received from the Australian National Health and Medical Research Council (EME Grant 219129) with funds originally derived from mobile phone service licence fees; a University of Sydney Medical Foundation Program; the Cancer Council NSW and The Cancer Council Victoria. In Montreal, Canada, funding was received from the Canadian Institutes of Health Research (project MOP-42525); the Canada Research Chair programme; the Guzzo-CRS Chair in Environment and Cancer; the Fonds de la recherche en santé du Quebec; the Société de recherche sur le cancer; in Ottawa and Vancouver, Canada, from the Canadian Institutes of Health Research (CIHR), the latter including partial support from the Canadian Wireless Telecommunications Association; the NSERC/SSHRC/McLaughlin Chair in Population Health Risk Assessment at the University of Ottawa. In France, funding was received by l’Association pour la Recherche sur le Cancer (ARC) (Contrat N85142) and three network operators (Orange, SFR, Bouygues Telecom). In Germany, funding was received from the German Mobile Phone Research Program (Deutsches Mobilfunkforschungsprogramm) of the German Federal Ministry for the Environment, Nuclear Safety, and Nature Protection; the Ministry for the Environment and Traffic of the state of Baden- Wurttemberg; the Ministry for the Environment of the state of North Rhine-Westphalia; the MAIFOR Program (Mainzer Forschungsforderungsprogramm) of the University of Mainz. In New Zealand, funding was provided by the Health Research Council, Hawkes Bay Medical Research Foundation, the Wellington Medical Research Foundation, the Waikato Medical Research Foundation and the Cancer Society of New Zealand. Additional funding for the UK study was received from the Mobile Telecommunications, Health and Research (MTHR) program, funding from the Health and Safety Executive, the Department of Health, the UK Network Operators (O2, Orange, T-Mobile, Vodafone, ‘3’) and the Scottish Executive. All industry funding was governed by contracts guaranteeing the complete scientific independence of the investigators. MCT was funded by the Departament de Salut, Generalitat de Catalunya (SLT002/16/00232). ISGlobal is a member of the CERCA Programme, Generalitat de Catalunya.
Conflict of interest: The authors have no conflicts of interest to declare.
3

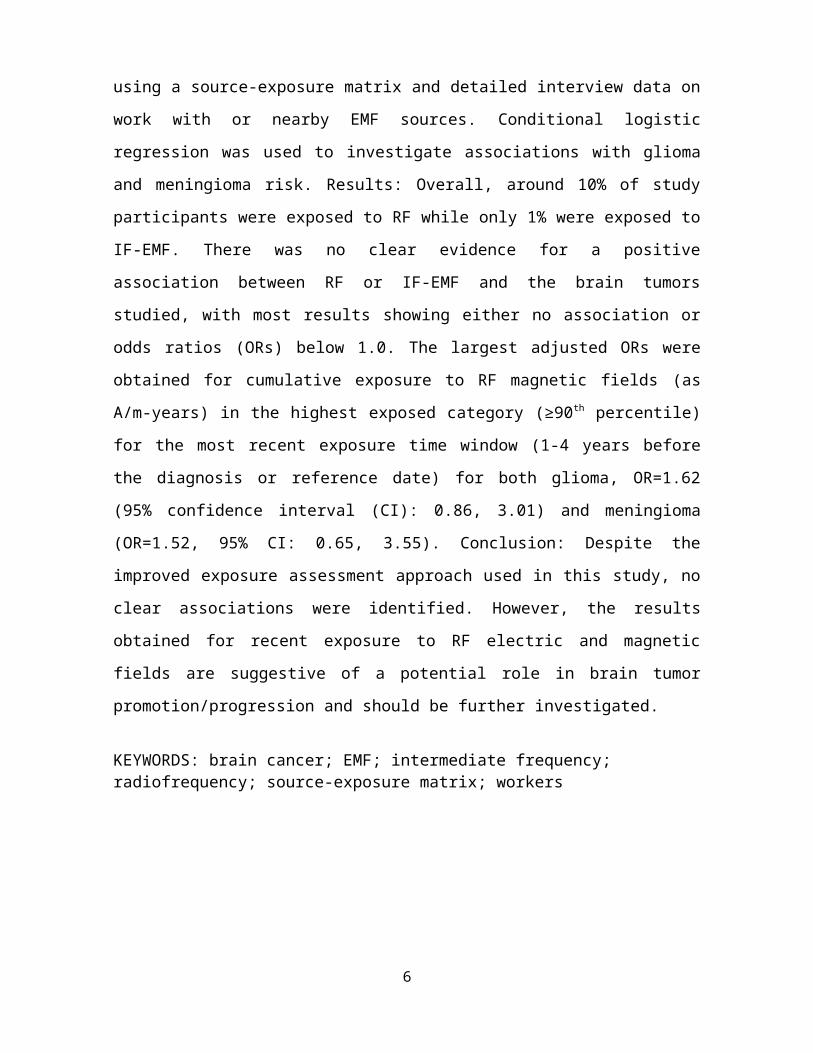
ABSTRACT
Introduction: In 2011, the International Agency for Research on Cancer classified
radiofrequency (RF) electromagnetic fields (EMF) as possibly carcinogenic to humans
(group 2B), although the epidemiological evidence for the association between
occupational exposure to RF-EMF and cancer was judged to be inadequate, due in part to
limitations in exposure assessment. This study examines the relation between occupational
RF and intermediate frequency (IF) EMF exposure and brain tumor (glioma and
meningioma) risk in the INTEROCC multinational population-based case-control study
(with nearly 4,000 cases and over 5,000 controls), using a novel exposure assessment
approach. Methods: Individual indices of cumulative exposure to RF and IF-EMF (overall
and in specific exposure time windows) were assigned to study participants using a source-
exposure matrix and detailed interview data on work with or nearby EMF sources.
Conditional logistic regression was used to investigate associations with glioma and
meningioma risk. Results: Overall, around 10% of study participants were exposed to RF
while only 1% were exposed to IF-EMF. There was no clear evidence for a positive
association between RF or IF-EMF and the brain tumors studied, with most results showing
either no association or odds ratios (ORs) below 1.0. The largest adjusted ORs were
obtained for cumulative exposure to RF magnetic fields (as A/m-years) in the highest
exposed category (≥90th percentile) for the most recent exposure time window (1-4 years
before the diagnosis or reference date) for both glioma, OR=1.62 (95% confidence interval
(CI): 0.86, 3.01) and meningioma (OR=1.52, 95% CI: 0.65, 3.55). Conclusion: Despite the
improved exposure assessment approach used in this study, no clear associations were
identified. However, the results obtained for recent exposure to RF electric and magnetic
fields are suggestive of a potential role in brain tumor promotion/progression and should be
further investigated.
KEYWORDS: brain cancer; EMF; intermediate frequency; radiofrequency; source-exposure matrix; workers
4

INTRODUCTION
Glioma and meningioma are the most frequent primary brain tumor types in adults.
Gliomas originate in the glial tissue and are mostly malignant, representing around 80% of
all malignant brain tumors (Bondy et al., 2008; Schwartzbaum et al., 2006; Wiemels et al.,
2010). Meningiomas are commonly benign, although approximately 5% are malignant
(Wiemels et al., 2010). The etiologies of these diseases remain largely unknown. The only
well-established risk factors, ionizing radiation and genetic disorders, account for a small
portion of cases (Bondy et al., 2008; Ostrom et al., 2014). The current evidence for other
possible risk factors, such as non-ionizing radiation (mostly for extremely-low frequency
and radiofrequency electromagnetic fields) and certain chemicals, is inconclusive (Bondy et
al., 2008; Braganza et al., 2012; Quach et al., 2016; SCENIHR, 2015).
High-frequency electromagnetic fields (EMF) are a form of non-ionizing radiation and
comprise, as defined in the international INTEROCC study, intermediate frequency (IF)
EMF, between 3 kHz and 10 MHz, and radiofrequency (RF) EMF, between 10 MHz and
300 GHz. The International Agency for Research on Cancer (IARC) classified RF-EMF as
possibly carcinogenic to humans (group 2B) in 2011, based on limited animal evidence,
mostly from co-carcinogenicity experiments, and limited epidemiological evidence, mainly
based on associations between use of cellular telephones and glioma and acoustic neuroma
risk (IARC, 2013). The limited evidence from animal experiments was partly based on
studies that examined RF-EMF exposure in combination with known carcinogens whose
results, recently replicated (Lerchl et al., 2015), suggested that RF-EMF may act in the
promotion and/or progression of already initiated tumors.
The biophysical mechanism(s) by which RF-EMF might play a role in brain tumors are not
clear. Both thermal effects, caused by the absorption of RF energy at a rate greater than the
body’s cooling mechanism (ICNIRP, 1998), and non-thermal hypotheses (Barnes and
Greenebaum, 2016, 2015; Blackman et al., 1980; Castello et al., 2014; Rao et al., 2008)
have been proposed, including oxidative stress, due to the formation of radical pairs, and
calcium efflux, due to activation of voltage-gated calcium channels. For IF-EMF, only very
limited evidence exists from some available in vivo studies while, to our knowledge, no
5
specific epidemiologic study of IF exposure has been conducted (SCENIHR, 2015;
Sienkiewicz et al., 2010).
Epidemiologic evidence on brain tumor risk from occupational exposure to RF-EMF is
inadequate and few recent studies have been performed (Armstrong et al., 1994; Baldi et
al., 2011; Berg et al., 2006; Degrave et al., 2009; Grayson, 1996; Groves et al., 2002;
Karipidis et al., 2007; Lagorio et al., 1997; Lilienfeld et al., 1978; Morgan et al., 2000;
Robinette et al., 1980; Szmigielski, 1996; Thomas et al., 1987; Tynes et al., 1996).
Exposure assessment in most of these studies was mainly based on exposure surrogates,
such as distance to the source or specific job titles or groups of workers thought to be
exposed to RF fields, using occupational duties, qualitative exposure estimates assigned by
hygienists (Berg et al., 2006) or job-exposure matrices based on expert judgments (Groves
et al., 2002; Karipidis et al., 2007; Morgan et al., 2000; Robinette et al., 1980). Only a few
studies, involving military personnel (Szmigielski, 1996), radio and telegraph operators
(Tynes et al., 1996) or embassy employees (Lilienfeld et al., 1978) used quantitative
exposure estimates based on measurements of RF field intensities. However, exposure
estimates were generally based on a small number of measurements and changes in
exposure levels over time were not considered. Sample sizes in these studies were also
small (Smith and Kriebel, 2010).
As part of the INTEROCC study´s aim to improve upon the exposure assessments in
previous studies, a source-exposure matrix (SEM) was developed (Vila et al., 2017),
containing confidence-weighted mean estimates, based mainly on measurements collected
from the literature (Vila et al., 2016), for the EMF sources reported by the study
participants. In the current paper, we used the SEM, together with detailed information
collected through interviews on work with or nearby occupational EMF sources to derive
individual indices of cumulative RF and IF exposure. These metrics were used to study the
possible association between cumulative occupational exposure to RF or IF-EMF and
glioma or meningioma risk, both overall and in specific exposure time windows.
METHODS
Study population
6

The INTEROCC study comprises data from seven of the thirteen countries included in the
international case-control study on mobile phone use and brain cancer risk, INTERPHONE
(Cardis et al., 2007). In these seven countries, together with the mobile phone-specific data,
detailed occupational information was also collected from study participants. Incident cases
of primary brain tumors (i.e. glioma and meningioma) were identified between 2000 and
2004 in participating hospitals in the study regions of Australia, Canada, France, Germany,
Israel, New Zealand and the United Kingdom. The core INTERPHONE protocol (Cardis et
al., 2007) included cases aged 30 to 59 years of age, though several countries included
cases from a broader age range, including up to 69 years in Germany, 18 years and above in
Israel and 18 to 69 years in the United Kingdom. Controls were randomly selected from
population registries and electoral lists in most countries. Patient lists were used in the UK
and random digit dialing in Ottawa (Canada). To control for potential confounding and
enhance statistical efficiency (Rothman and Greenland, 1998), controls were individually-
matched to cases by age (5-year groups), sex, study region and country. Case-control ratios
were 1:1 in all countries but Germany (1:2). All potential participants identified were
contacted, informed about the study and asked whether they wanted to participate. For
subjects who agreed, a signed informed consent was obtained before the interview process.
In total, the INTEROCC study comprises 2,054 glioma cases, 1,924 meningioma cases, and
5,601 controls. Overall participation rates for cases in INTERPHONE were 65% for glioma
and 78% for meningioma cases, although numbers varied by tumor type and center.
Participation among glioma cases for low- and high-grade tumors was similar (71% and
67%, respectively). The participation rate among controls was lower (53%) than among
cases. The most frequent reasons for non-participation were refusal (64%) and inability to
contact (27%), including physician refusal to contact (5% of glioma, 2% of meningioma
cases). Most participants were interviewed in person and only a few subjects were
interviewed by telephone (5% and 6%, for controls and cases respectively). Proxy
respondents were allowed (e.g. 13% for glioma cases overall) if the subject had died or was
unable to participate. A computer-assisted personal interview (CAPI) system was used
during the interviews. Further details of the questionnaire and the interview process can be
found elsewhere (Cardis et al., 2007; Vila et al., 2016). Ethics approval was obtained from
7

IARC´s Ethics Committee and appropriate ethics committees in all participating countries
for the INTERPHONE study, as well as from the Ethics Committee of the Municipal
Institute for Medical Investigation (IMIM) in Barcelona, Spain, for use of the anonymised
INTERPHONE and INTEROCC data.
Data collection
Detailed occupational-specific data were collected in seven of the thirteen INTERPHONE
countries, which comprise the INTEROCC data. Study interviews took place between 2000
and 2004 and lifetime occupational history data were collected. A full occupational
calendar for all jobs held for at least six months (including job title, start and stop date, and
company name and description) was completed. In addition, the occupational questionnaire
included screening questions designed to identify subjects with potential high levels of
EMF exposure. The screening questions focused on work with or in the proximity of
specific EMF sources with frequencies from 0 Hz to 300 GHz. A positive response to any
of the screening questions led to more specific questions concerning the job in which this
exposure occurred, including the tasks (e.g. broadcasting, heating), materials (e.g. metals,
rubber), process schemes (e.g. automation), and other work organization details, as well as
start and stop years, and the number of hours per week/month worked with/nearby the EMF
sources reported. A detailed description of the screening questions is available elsewhere
(Vila et al., 2016).
Exposure assessment
The source-exposure matrix (SEM) was used to assign average exposure levels to each RF
and IF source reported by the study participants. Of the twelve occupational sections in the
questionnaire, seven of them entailed work with sources of RF and/or IF-EMF. These
sections involved work with or nearby 1) radars, 2) telecommunication antennas, 3)
transmitters (e.g. walkie-talkies), or equipment for 4) semiconductors manufacturing, 5)
medical diagnosis and treatment (e.g. hyperthermia), 6) industrial heating (e.g. induction
furnaces) or 7) food heating (e.g. microwave drying ovens). The remaining five sections
entailed exposure to extremely-low frequency (ELF) EMF only and will be considered
elsewhere. Extensive details of the twelve occupational sections, including a summary of
the questionnaire, have already been published (Vila et al., 2016).
8

To combine exposures from different-frequency sources within each frequency band (i.e.
RF or IF), field intensities for each EMF source in the SEM were weighted using the
frequency-dependent reference levels (RLs) issued by the International Commission on
Non-Ionizing Radiation Protection (ICNIRP) for occupational exposure (ICNIRP, 1998).
For RF sources with different frequency ranges, E- and H-fields were weighted by the
corresponding ICNIRP RLs. ICNIRP reference levels for frequencies above 10 MHz are
obtained from basic restrictions for Specific Absorption Rate (SAR). Since the potential for
biological effects is associated with the power or energy deposition and the squares of
electric and magnetic fields are proportional to power (Hitchcock, 2015), we calculated
squared ratios for RF E- and H-fields using available data from the SEM. Thus, RF electric
and magnetic field squared ratios (equation 1) can be assumed to correlate with SAR, and
their cumulative exposure over time correlates with the specific absorbed energy. For IF
sources, RLs for frequencies below 10 MHz were obtained from basic restrictions for
current density (in mA/m2) (and SAR above 100 kHz). Therefore, we calculated (linear)
ICNIRP ratios obtained from IF H-fields which may be considered proportional to current
density (equation 2). Moreover, since the fields emitted by many IF sources tend to be
purely magnetic in nature and there is negligible propagating field (ICNIRP, 2004; Joseph
et al., 2012), only H-fields were used to assess exposures to IF sources.
22\*
MERGEFORMAT ()
33\*
MERGEFORMAT ()
where represent the mean electric field strength (E, in V/m) for the RF source s from the
SEM; represents the mean magnetic field strength (H, in A/m) for the IF or RF source s
from the SEM; and are the ICNIRP's frequency-dependent reference levels for
occupational exposure (ICNIRP, 1998) ; and f is the frequency.
In addition, since internal magnetic fields are proportional to incident magnetic fields and
their penetration into the body has little frequency dependence (Barnes and Greenebaum,
9

2015), to account for potential non-thermal effects we also used (frequency-unweighted)
RF H-fields in our analyses as an alternative metric to assess cumulative exposure to RF
magnetic fields.
Cumulative exposure (in ICNIRP ratio- or squared ratio-years) was calculated by using the
confidence-weighted (arithmetic) mean exposure level of each reported RF or IF source(s)
from the SEM. This was adjusted by information on distance to the source, automation and
other modifiers depending on the specific occupational section. Finally, the frequency of
working with or in the proximity of these sources (in hours per day/week) and the duration
(in years) that this exposure took place was used to calculate indices of cumulative
exposure. This detailed information was reported by each INTEROCC participant and
depends on the type of RF or IF source reported. For example, frequency of exposure to
walkie-talkies refers to the number of hours per day/week that the subject used this source
to talk with other co-workers. See Appendix 2 for further details of the methods used to
assess cumulative exposure of study participants to RF or IF-EMF.
The quality of the data collected on EMF sources and ancillary information was assessed
through comparisons with the data in the full occupational histories. Errors identified, such
as incongruent dates or responses not obeying the questionnaire logic, were corrected.
Imputation of missing data on exposure rate was performed using median values from
control participants. Subjects for which imputation or correction of unreliable data was not
possible, and participants with insufficient information to assign an exposure estimate (i.e.
due to unclear EMF source and/or exposure duration), were excluded from the analysis.
Statistical analysis
Although the INTERPHONE study generally included one matched control per case, all
eligible controls (n=5,378) were used in both the glioma and meningioma analyses to
maximize statistical power. The date of diagnosis was the reference date for cases. The
reference date for controls was the date of interview minus the median difference between
diagnosis and the case interview date by country.
Conditional logistic regression models using strata defined by the matching factors were
used to estimate adjusted odds ratios (ORs) and 95% confidence intervals for the
association between cumulative exposure to RF E- or H-fields, or IF H-fields and glioma or
10

meningioma risk. All models were stratified by age (5-year groups), sex, study region and
country, and adjusted for education (Cardis et al., 2007). Associations with lifetime
cumulative exposure (1-year lag), cumulative exposure at 5- and 10-year lags, as well as
cumulative exposure in different time windows defined a priori (1-4, and 5-9 years before
the reference date) were examined. These time windows were chosen to assess the
hypothesis that recent exposures to RF and/or IF-EMF may entail different risks, possibly
related to tumor promotion or progression (Smith and Kriebel, 2010; Turner et al., 2014),
than exposures further in the past.
Both categorical and continuous indicators of RF and IF-EMF cumulative exposure were
examined. Due to skewed distributions of exposure data, irregular cut-points (i.e. 50th, 75th
and 90th percentiles) were used to define categories that spanned the range of the exposure
distribution. For IF, due to the smaller number of exposed subjects (1%), the median value
(i.e. 50th percentile) among exposed subjects was used as the only cut point. The reference
category for the main analysis was subjects never exposed to occupational RF or IF-EMF.
For the continuous analyses, exposure was modelled linearly and departure from linearity
was tested using polynomials and logarithmic transformation of exposure. Models
adequacy, in terms of goodness of fit, was evaluated using the Akaike Information
Criterion (AIC) and the Bayesian Information Criterion (BIC) (Röösli and Vienneau, 2014;
Vrieze, 2012). The symmetry of the log-likelihood function in each model was assessed to
confirm the adequacy of Wald-type confidence intervals (Hosmer et al., 2013). Due to the
small number of subjects exposed to IF fields, the continuous analysis was only performed
using RF E- and H-fields.
Potential confounding by any allergy history (Turner et al., 2013), mobile phone use (never
vs ever regular user) (Cardis et al., 2011) and any medical ionizing radiation (Bondy et al.,
2008) was also examined using a 10% change in the risk estimate criterion (Cardis et al.,
2007; Mickey and Greenland, 1989). Analyses were also conducted for high- and low-
grade glioma types, separately. Potential effect modification by matching variables was
assessed by including in the models cross-product terms between exposure and these
variables and assessing the significance of the likelihood ratio test between models with
and without the interaction term (Hosmer et al., 2013).
11

Sensitivity analyses were performed by using the lowest exposure category rather than the
unexposed group as the reference category, or excluding proxy interviewees, participants
who were judged by the interviewers as non-collaborative, participants aged >60 years,
participants with very high (>99th percentile) or very low (<1st percentile) cumulative
exposure levels, and participants with a history of neurofibromatosis or tuberous sclerosis.
All analyses and graphics were performed using R, version 3.2.3 (R Core Team, 2014).
Regression models were created using the “clogit” function (Therneau, 2015).
RESULTS
In total, 1,943 glioma cases, 1,862 meningioma cases, and 5,387 controls were included in
the analysis. A small number of participants were excluded due to insufficient information
on exposure intensity (i.e. EMF source(s) not clearly identified) and/or exposure duration
(n=355), or missing data on education (n=32). Table 1 describes cases and controls
included in the analysis. Meningioma cases tended to be slightly older on average than
glioma cases, and were mainly (74%) female, compared with only 40% for glioma. The
reported sources with the highest exposure levels were “RF sealers/welders for plastic &
rubber”, for RF, and “Electronic Article Surveillance (EAS) system”, for IF (Table 2). The
RF and IF sources most frequently reported were “walkie-talkie” and “induction heater”,
respectively. Tables S3 and S4 list all the RF and IF sources reported by the study
participants by occupational section and frequency of reporting. The mean (SD) number of
sources per subject was 1.33 (0.83) for glioma cases and 1.31 (0.65) for meningioma cases,
and 1.35 (0.92) for controls. Overall, 10% of participants were ever exposed to RF E- or H-
fields overall (1-year lag), while only 1% were ever exposed to IF H-fields at work.
Figure 1 presents the levels of cumulative exposure to RF E- and H-fields of exposed
subjects overall (1-year lag) and in the 1-4 years exposure time window. Table S1 of the
supplementary material (Appendix 1) contains detailed descriptive statistics for these
metrics. Table S2 and Figure S1 describe the data for IF cumulative exposure of study
participants. Exposure distributions for all fields and exposure lags and time windows were
right-skewed. There was generally little difference in exposure distributions between cases
and controls. Median exposure levels in the 1-4 years exposure time window were slightly
12

higher among cases for RF ICNIRPE2 and H-fields for glioma, and ICNIRPH
2 and H-fields
for meningioma.
There was no clear evidence for a positive association between cumulative exposure to
(frequency-weighted) RF E-fields (Table 3) and H-fields (Table S5) or (frequency-
unweighted) RF H-fields (Table 4) and glioma or meningioma risk overall (1-year lag), or
in any other exposure lags or time windows, using categorical classifications of cumulative
exposure. In all analyses, there were reduced ORs in most exposure categories. There were
no statistically significant elevated ORs for glioma or meningioma observed in any of the
exposure categories. The largest ORs were obtained in the analysis of glioma and
(frequency-unweighted) RF H-fields (A/m-years) in the highest exposed category (>90th
percentile) in the 1-4 years exposure time window, OR=1.62 (95% CI: 0.86, 3.01, based on
19 exposed cases), while results for (frequency-weighted) RF E-fields (ICNIRPE ratio2-
years) and H-fields (ICNIRPH ratio2-years) and the same exposure category and time
window were slightly lower, OR=1.45 (95%CI: 0.77, 2.76) for ICNIRPH2 and OR=1.38
(95%CI: 0.75, 2.54) for ICNIRPE2, based on 19 and 17 exposed cases respectively. ORs for
meningioma were somewhat smaller than for glioma in the same exposure category and
time window, OR=1.52 (95% CI: 0.65, 3.55) for (unweighted) RF H-fields based on 8
exposed cases; OR=1.30 (95% CI: 0.58, 2.91) for ICNIRPE2, based on 9 exposed cases; and
OR=1.17 (95%CI: 0.48, 2.84) for ICNIRPH2, based on 7 exposed cases. Although some
larger ORs for meningioma were found in other exposure groups for ICNIRPH2, these were
inconsistent and more imprecise. There was no clear evidence for a positive exposure-
response trend in any of the exposure lags and time-windows studied for either glioma or
meningioma and the exposure metrics used.
In the continuous analyses, results from polynomials with or without log transformation of
exposure did not indicate evidence of departure from linearity according to model fit. Thus,
results for non-linear models had worse model fit values, based on AIC/BIC results, and/or
less precision. Overall, there were no positive significant associations between cumulative
exposure to (frequency-unweighted) RF H-fields (Table 5), ICNIRPH2 (Table S6) or
ICNIRPE2 (Table S7) and glioma or meningioma risk in any exposure lag or time window
(only results for 1-year lag and 1-4 years exposure time window shown). However, linear
models using (frequency-unweighted) RF H-fields (Table 5) in the 1-4 years exposure time
13

window showed elevated, though imprecise, ORs for both glioma: OR=1.82 (95% CI: 0.75,
4.42), and meningioma: OR=1.46 (95% CI: 0.37, 5.74), per one-unit increase of
(unweighted) RF H-fields cumulative exposure (A/m-years), while results for ICNIRPE2
and ICNIRPH2 were generally null. The log-log model for meningioma and ICNIRPH
2 in the
1-4 years exposure time window, however, gave the best fit values and a weak but more
precise non-significant positive association: OR=1.20 (95% CI: 0.74, 1.94).
Figure 2 shows the exposure-response relationship between RF E-fields (ICNIRPE2)
cumulative exposure (overall and in the 1-4 years exposure time window) for glioma and
meningioma, based on predicted risk estimates from two models (log-linear and translog-
quadratic) as well as the ORs and 95% CIs from the categorical analysis for the same
exposure lag or time window. Results for RF H-fields are presented in Figures S2
(frequency-unweighted) and S3 (frequency-weighted). While predicted ORs in the 1-4
years exposure time window tended to be above 1.0 for both glioma and meningioma, ORs
for overall exposure (1-year lag) were near 1.0 or below. Overall, the patterns using ORs
from the categorical analysis resembled those from the continuous models.
Results for IF H-fields (ICNIRPH-years) showed no clear suggestion of an association with
either glioma or meningioma risk (Table S8) and were based on a small number of exposed
participants (~1%). ORs were generally <1.0 in the lowest exposure category (i.e. <
median) for both glioma and meningioma. ORs above 1.0 were only observed in the highest
exposure categories for the 1-4 and 5-9 years exposure time windows for glioma, while
results for meningioma were not consistent.
In sensitivity analyses, exclusion of unresponsive subjects, subjects aged >60 years,
subjects with very low or very high cumulative exposure levels, proxy interviewees, and
participants with a history of neurofibromatosis or tuberous sclerosis had little effect (<10%
change) on the ORs obtained (data not shown), neither did analysis of high- and low-grade
glioma, separately (Table S9), or stratifying by sex (Table S10). Moreover, there was no
evidence of effect modification or confounding by any of the factors considered, including
mobile phone use, allergy history and exposure to medical ionizing radiation (data not
shown). Restricting the analyses to exposed subjects only, using the lowest exposed
category as the reference group for either RF E- and H-fields (Tables S11 and S12),
14

resulted in positive ORs in most exposure categories, with no evidence of an exposure-
response trend.
DISCUSSION
This study, based on the analysis of nearly 4,000 brain tumor cases and over 5,000 controls,
is the largest case-control study of brain tumors and occupational RF and IF-EMF exposure
to date. The work on exposure assessment, based on a detailed source-based questionnaire
and a source-exposure matrix specifically developed for the project is, to our knowledge,
the most comprehensive effort aimed at estimating occupational exposure to high-
frequency EMF in a large population-based epidemiological study. Overall, despite the
major improvement in exposure assessment, the study provided no evidence for a positive
association between cumulative RF or IF-EMF exposure and either glioma or meningioma
risk, with risk estimates mostly <1.0, and only some non-significant positive ORs in some
exposure time windows for the highest exposed categories.
Previous studies examining associations of brain tumor risk and exposure to RF fields have
not found clear results. A non-significant increase of brain cancer risk was observed in a
study of radio operators (Milham, 1988), while studies of police officers (Finkelstein, 1998)
and naval and aviation personnel (Groves et al., 2002) found non-statistically reduced risks
for brain tumors. However, these studies had small numbers of cases and none of them
looked at risk by level of exposure. In one case-control study (Grayson, 1996), semi-
quantitative exposure estimates were assigned to male air force workers based on a detailed
occupational history obtained through questionnaire. Although no overall association was
found for exposure level and risk of brain cancer, a small excess risk was seen when
comparing ever versus never exposed. Another brain tumor case-control study (Thomas et
al., 1987), in which workers´ exposure was classified by expert industrial hygienists, found
a significant increased risk among men exposed to RF for more than twenty years. A study
in Australia in which researchers assessed glioma and RF exposure data, using a general
job-exposure matrix, observed many reduced ORs (Karipidis et al., 2007).
An INTEROCC sub-study using the German study population (Berg et al., 2006) classified
subjects according to their RF-EMF exposure likelihood based on their job titles. This
study found several non-significant positive associations for occupational RF exposure and
15

brain tumor risk. The OR for glioma in highly exposed subjects was 1.22 (95% CI: 0.69,
2.15) overall and 1.39 (95% CI: 0.67, 2.88) when only jobs conferring high exposure for
more than ten years were considered. Similar results were obtained for meningioma, with
ORs of 1.34 (95% CI: 0.61, 2.96) for overall exposure and 1.55 (95% CI: 0.52, 4.62) for ten
years or more of high exposure jobs. Although our results in the categorical analysis are
similar, with non-significantly increased ORs for highly exposed groups, the German study
observed the increase in the 10+ years exposure group, while we observed an increase only
in the most recent exposure time window.
Little information exists in the literature regarding exposure to high-frequency magnetic
fields (H-fields) and risk of brain or other cancer types (SCENIHR, 2008; Sienkiewicz et
al., 2010). In our analysis, we used both frequency weighted and unweighted RF and IF H
metrics to account for potential thermal and non-thermal effects from exposure to H-fields.
Both RF E- and H-fields are responsible for the energy absorbed in the body and could be
associated with potential thermal effects (Hitchcock and Patterson, 1995). However, radical
pair mechanisms, by which weak RF H-fields together with static fields could be
responsible for the formation of reactive oxygen species, may promote the proliferation of
cancer cells via non-thermal effects (Barnes and Greenebaum, 2016, 2015; Usselman et al.,
2014). Therefore, since the absorbed energy hypothesis alone ignores other possible
mechanisms by which RF and/or IF-EMF could lead to cancer, we also used (frequency-
unweighted) RF H-fields in our analyses. Although results were not significant and
imprecise, ORs for both H and ICNIRPH2 were slightly higher than those obtained using
ICNIRPE2, which could reflect the lack of proportionality between E and H in the near field
(ICNIRP, 1998). These differences are particularly important when assessing RF sources,
such as glue dryers, plastic welding machines or climbing radio/TV towers, for which H are
often the dominate fields (Eriksson and Hansson Mild, 1985; Hansson Mild, 1981; Hansson
Mild and Mattson, 2017). Moreover, the results obtained using the frequency-unweighted
RF H-field metric, although imprecise, provided the largest ORs, highlighting the need for
further investigation. Results for IF H-fields were inconsistent and were based on low
number of exposed subjects (~1%). Moreover, given the skewed exposure distributions,
there was little contrast between exposure categories used.
16

In the statistical analysis, we created conditional logistic regression models to obtain odds
ratios of disease between cases and controls using the frequency-matched strata of the
INTEROCC data. Although this was a significant change of the original individual
matching used in INTERPHONE, we believe that the use of the conditional approach,
recommended for matched data containing many strata with different number of cases and
controls (Breslow and Day, 1980), ensured that valid effect estimates were obtained. For
these analyses, we used both categorical and continuous exposure variables, including
polynomials to test for departure from linearity (Royston et al., 2000). The linear model
provided the best fit for our data based on AIC/BIC criteria (Hastie et al., 2008; Hosmer et
al., 2013). Although more complex models, such as the translog-quadratic, gave worse fit
results and/or wider confidence intervals, the similarities between this model and the results
from the categorical analysis (as shown in Figure 2) may support a J-shaped exposure-
response hypothesis (Vrijheid et al., 2006). For the categorical analysis, considering the
skewed nature of our data, we used irregular cut-points based on the 50th, 75th, and 90th
percentiles of the distribution, as the best way to characterize the spread of the EMF
distribution (Röösli and Vienneau, 2014). This approach allowed us to compare groups of
subjects with similar exposure variability (GSD ≈ 2 in most groups). However, due to the
small number of exposed participants (~10% for RF-EMF), the highest 10% of exposed
subjects (>90th percentile) represents <1% of the study population. This limitation was also
present in the German INTEROCC sub-study (Berg et al., 2006), where only ~11% of
subjects were considered exposed. Moreover, although the German data are included in our
analyses, the number of exposed subjects is still small and statistical power remains limited
(Rothman and Greenland, 1998; Smith and Kriebel, 2010).
Our individualized exposure assessment approach entails an important improvement over
previous efforts to assess high-frequency EMF exposure risks. The use of the recently
constructed SEM (Vila et al., 2017) allowed us to assign estimates of RF and IF-EMF to
each study subject on the basis of the EMF sources reported, increasing between-subject
variability, compared to the use of JEMs (Rothman and Greenland, 1998; Smith and
Kriebel, 2010; Sorahan and Swanson, 2017). Mean electric and magnetic field strength
values in the SEM refer to the average level assigned to an RF or IF source based on
measurements obtained from different countries and measured equipment, which could
17

have different technical characteristics, including different frequency ranges. Therefore, the
SEM mean estimates allowed assigning exposure levels to the EMF sources reported
without knowing the technical characteristics of the equipment used, such as their specific
frequency range, which was not available in INTEROCC. This methodology allows,
therefore, assigning exposure estimates to subjects in other studies in which information on
the EMF sources present in the workplace is available.
Exposure assessment of study participants was aimed at head exposure through the
confidence weighting of the SEM estimates (Vila et al., 2017), which strengthens our
approach to assess brain tumor risk. Thus, in the construction of the SEM, confidence
ratings assigned to available measurements were used to calculate confidence-weighted
mean exposure estimates for each RF or IF source in this matrix. Measurements were
upweighted if they were representative of head exposure. Therefore, although some of the
RF and/or IF sources reported by the study participants may lead to whole-body exposure,
the confidence-weighted mean exposure levels used are our best estimates of local exposure
of the head. However, the availability of measurements representative of head exposure
differed by type of EMF source (Vila et al., 2017). Therefore, it is possible that the
confidence-weighted estimates for some of the sources in the SEM may over- or
underestimate exposure to the head. Nevertheless, it is likely that the potential bias
introduced may have affected all subjects equally leading to non-differential
misclassification and underestimation of effect estimates obtained (Rothman and
Greenland, 1998).
The source-based individual approach used may have other limitations. Since the SEM
does not contain exposure estimates from personal measurements for any RF source,
estimates using other types of dosimetry (i.e. spot, 55%, and operator position, 45%) were
used to calculate individual exposure. The use of such surrogates of personal exposure may
have overestimated the assigned exposure levels, which, in turn, may have underestimated
our risk results. Thus, although individual exposure assessment may reduce between-
subject misclassification (i.e. Berkson error), it can also increase classical error (Kim et al.,
2011; Tielemans et al., 1998). In addition, there is possibly residual Berkson error in our
approach due to group-based exposure estimates in the SEM. These exposure assessment
biases are, however, likely to be non-differential, possibly attenuating ORs towards no
18

effect, although bias away from the null may have occurred from residual Berkson errors,
particularly when considering more than two levels of exposure (Rothman and Greenland,
1998). Further improvements of the individualized EMF exposure assessment used in our
study are, therefore, advisable, including the use of an improved SEM containing only
personal estimates of exposure, when these become available.
Other weaknesses of this study include possible recall and selection biases. It is possible
that our results may have been affected by recall error, particularly with regard to the
impact of the disease on cases’ ability to remember details of past jobs. Unlike the recall
bias on details of past mobile phone use in the INTERPHONE studies (Cardis et al., 2011),
we may assume it was easier for workers to recall the type of machinery used during their
working lifetimes. Moreover, since subjects were generally unaware of exposure levels
associated with the reported EMF sources, any recall bias is probably small, though random
error could occur. Another weakness is the low participation rate among controls (53% vs
65% for glioma and 78% for meningioma cases), raising concerns about potential selection
bias. Control participation was associated with socioeconomic status and with being a
mobile phone user, and both could be associated with exposure to certain EMF sources.
Such biases could be aggravated by the different protocols for subject selection and staff
training among the INTERPHONE countries (Cardis et al., 2007). Selection bias and J-
shaped exposure-response relationships, with reduced ORs at the lowest levels of
cumulative exposure, were observed in the INTERPHONE study (Cardis et al., 2011;
Vrijheid et al., 2009, 2006), and were attributed to under-selection of controls unexposed to
mobile phones (Vrijheid et al., 2006). Although this particular form of selection bias is
unlikely for this occupational EMF study, as discussed above, the reduced ORs obtained in
the low exposure categories for both glioma and meningioma indicates that selection and/or
recall biases could have possibly affected our findings.
Some studies have previously used ICNIRP-based metrics to assess integrated/cumulative
exposure to RF fields (Baste et al., 2010; Heinrich et al., 2010; Thomas et al., 2008).
However, ICNIRP-based exposure indices have several limitations. The term “ICNIRP
ratio” is a metric for compliance with a regulatory limit, rather than an exposure metric
with biophysical meaning, and there is little evidence to support that frequency-adjusted
EMF using ICNIRP reference levels are a relevant exposure metric for cancer. Moreover,
19

for the many different EMF exposure conditions found in workplaces, the cumulative
ICNIRP metric is biased towards higher levels, since exposure limits are based on worst-
case scenarios rather than average exposures (Durney et al., 1986; Hitchcock and Patterson,
1995). Therefore, although ICNIRP linear and squared ratios may be correlated with dose
or dose rate, it is possible that exposure levels assigned to study participants were
overestimated, which may have also contributed to the possible underestimation of our risk
results.
In conclusion, despite the improved quantitative exposure assessment used in this study, the
results do not support a positive association between occupational exposure to high-
frequency EMF and either glioma or meningioma risk. However, given our limited
statistical power, due to the small number of exposed participants, and despite our results´
lack of significance (Greenland et al., 2016; Rothman, 2016; Smith and Kriebel, 2010), our
findings foster the need for further research focusing on RF magnetic fields and tumor
promotion, as well as possible interactions with other frequencies and with chemicals.
Moreover, since most RF studies until now have focused on the effects of electric fields,
more studies of RF magnetic fields are needed, particularly looking at differences between
near-field (e.g. walkie-talkies) and far-field exposures (e.g. radars). Furthermore, the
development of biology-based dose metrics which take into account both electric and
magnetic fields from various sources (Hansson Mild and Mattson, 2017) may provide
further insights on the potential biophysical mechanism(s), other than heating and nerve
electro-stimulation (ICNIRP, 1998; IEEE, 2006), by which long-term exposure to high-
frequency EMF may damage health.
20

Table 1. Distribution of included study participants by age, sex, education, country, region and occupational section. INTEROCC study. Data from Australia, Canada, France, Germany, Israel, New Zealand, and United Kingdom, 2000-2004.
Glioma cases Controls
Meningioma cases Controls
Variable n % n % n % n %
1,943 100 5,387 100 1,862 100 5,387 100
Agea
<35 214 11% 413 8% 82 4% 415 8% 35-39 171 9% 454 8% 97 5% 457 9% 40-44 216 11% 624 12% 166 9% 622 12% 45-49 239 12% 726 14% 269 14% 730 14% 50-54 347 18% 955 18% 370 20% 963 18% 55-59 310 16% 992 18% 319 17% 980 18% 60-64 190 10% 501 9% 189 10% 499 9% 65-69 140 7% 433 8% 170 9% 434 8% 70+ 116 6% 289 5% 200 11% 287 5%Sex
Male 1,162 60% 2,350 44% 485 26% 2,350 44%
Female 781 40% 3,037 56% 1,377 74% 3,037 56%
Educationb
High school or less 1,034 53% 2,914 54% 1,125 60% 2,914 54%
Medium-level technical school 376 19% 1,004 19% 357 19% 1,004 19%
University 533 27% 1,469 27% 380 20% 1,469 27%
Country Region Australia Melbourne 135 15% 305 12% 121 13% 305 12%
Sydney 147 337 120 337 Canada Montreal 63 8% 225 12% 47 5% 225 12%
Ottawa 21 172 14 172Vancouver 78 229 31 229
France Paris 28 5% 112 9% 41 8% 112 9%Lyon 63 351 103 351
Germany Bielefeld 99 18% 438 28% 100 20% 438 28%Heidelberg/Mannheim 179 709 206 709Mainz 77 360 70 360
Israel --c 418 22% 958 18% 722 39% 1,611 18% New Zealand --c 80 4% 158 3% 50 3% 158 3%
United Kingdom
Scotland 139
29%
269
19%
62
13%
269
19%West Yorkshire 121 232 60 232West Midlands 105 182 24 182West Trent 190 350 91 350
Occupational sectiond
Diagnosis & Treatment 12 2% 83 5% 14 4% 83 5%
21

Food & Medical-Dental Heating 75 12% 268 16% 85 22% 268 16% Industrial Heating 160 26% 441 27% 111 29% 441 27% Radars 18 3% 81 5% 19 5% 81 5% Semiconductors 6 1% 17 1% 3 1% 17 1% Telecommunication Antennas 38 6% 61 4% 11 3% 61 4% Transmitters 299 49% 674 41% 137 36% 674 41%
a5-year age groups as used for the matching of cases and controls in the recruitment. bA total of 16 cases and 11 controls were excluded due to missing information for Education. cNo specific regions were considered for these countries. dSubjects not assigned to any section were considered unexposed.
22

Table 2. RF and IF sources most frequently reported by the INTEROCC study participants and sources reported with the highest levels of exposure. INTEROCC study. Data from Australia, Canada, France, Germany, Israel, New Zealand, and United Kingdom, 2000-2004.
Most frequent sources Sources with highest mean exposure levelsa
Radiofrequency (10 MHz - 300 GHz) Intermediate frequency (3 kHz - 10 MHz) Radiofrequency (10 MHz - 300 GHz) Intermediate frequency (3 kHz - 10 MHz)
Source E-field(V/m)a
H-field(A/m)a Nb Source H-field
(A/m)a Nb Source E-field(V/m)a
H-field(A/m)a Nb Source H-field
(A/m)a Nb
walkie-talkie 335 0.20 411 induction heater/furnace for metals 0.73 56 RF sealers/welders for
plastic & rubber 459 0.70 27Electronic Article Surveillance (EAS) 12.3 3
microwave heating 23.4 0.11 174 dielectric heater/plastic & rubber 1.8 28 walkie-talkie 335 0.20 411 plasma etcher/metal
etcher/dry plasma etcher 4.99 9
two-way radio/on motorcycle 14 0.09 174 glue heater curer/wood &
fiber glass 0.19 16 TV/VHF/mast/worked on
310 1.4 1 plasma-enhanced chemical vapor deposition (CVD) 4.99 4
CB radio 202 0.12 153 surgical diathermy equipment/surgeon
5.09 12 continuous short-wave diathermy
299 0.73 12 electrical resistance furnaces/metals 3.1 32
RF sealers/welders for plastic & rubber 459 0.70 27
ultrasound diathermy/ physiotherapist 0.21 12
shuttle tray machine for plastic & rubber
264 0.67 2 dielectric heater/plastic & rubber
1.8 28
Telecomm. and personal services misc./ground /surrounding
11.1 -- 24 plasma etcher/metal etcher/dry plasma etcher 4.99 9 CB radio 202 0.12 168 metal detectors 1.27 4
dielectric heater/ plastic & rubber
102 0.91 22 plasma-enhanced chemical vapor deposition (CVD) 0.26 4 TV/UHF/mast/ worked
on 210 0.28 8 induction heater/furnace for metals 0.73 56
navigation radar/ work surrounded 1.23 -- 20 induction welding/metal 3.55 4 microwave diathermy/
physiotherapist 106 0.32 7 dielectric heater/wood & fiber glass
0.72 1
mobile phone base station antennas /ground /worked on
0.36 -- 16 gluing press/wood & fiber glass 0.72 6 dielectric heater/ plastic
& rubber 102 0.91 28 gluing press/wood & fiber glass 0.72 6
pulsed short wave diathermy
60.1 0.23 16 Electronic Article Surveillance (EAS)
12.3 3 Radio/FM/mast/worked on 92 0.22 1 induction welding/metal 0.72 4
aArithmetic mean exposure levels from the SEM. RF sources organized by E-field exposure level. bN: Number of subjects who reported work with or nearby the EMF source.
23

Figure 1. Cumulative exposure to radiofrequency (RF) electric (E) and magnetic (H) fields (various metrics) by brain tumor type and exposure lag (overall exposure, 1-year lag) and time window (1-4 years exposure time window). Status (1=Cases; 0=Controls).
24

Table 3. Adjusted odds ratios (OR) and 95% confidence intervals for glioma or meningioma risk and cumulative RF E-field exposure (ICNIRPE ratio2-years) for various exposure lags and time windows. INTEROCC study: Data from Australia, Canada, France, Germany, Israel, New Zealand and United Kingdom, 2000-2004.
Glioma MeningiomaRF E-field cumulative exposure (ICNIRP ratio2-years)b
Cases(n)
Controls
(n)ORa (95% CI)
Cases(n)
Controls(n) ORa (95% CI)
1-year lag Non exposedc
<0.63 0.63-6.21 6.22-40.6 ≥40.7
1,718102574024
4,7342771358255
1.00 (ref.)0.75 (0.59, 0.96)0.82 (0.59, 1.14)0.92 (0.62, 1.37)0.87 (0.53, 1.44)
1,74463182013
4,5662511117249
1.00 (ref.)0.84 (0.62, 1.13)0.69 (0.41, 1.16)1.24 (0.73, 2.10)1.08 (0.57, 2.06)
5-year lag Non exposed <0.46 0.46-5.65 5.66-40.6 ≥40.7
1,71882533320
4,7342461227249
1.00 (ref.)0.69 (0.53, 0.90)0.83 (0.59, 1.17)0.89 (0.58, 1.37)0.81 (0.47, 1.39)
1,74454202011
4,5632231036144
1.00 (ref.)0.84 (0.61, 1.15)0.80 (0.48, 1.31)1.51 (0.88, 2.57)1.01 (0.50, 2.03)
10-year lag Non exposed <0.27 0.27-4.92 4.93-34.6 ≥34.7
1,71866383017
4,7342121046343
1.00 (ref.)0.64 (0.48, 0.86)0.73 (0.50, 1.08)0.92 (0.58, 1.45)0.79 (0.44, 1.42)
1,7444718159
4,563191915238
1.00 (ref.)0.86 (0.61, 1.21)0.84 (0.50, 1.43)1.36 (0.74, 2.49)0.95 (0.44, 2.05)
5-9 years Non exposed <0.42 0.42-4.47 4.48-18.8 ≥18.9
1,71858321812
4,721139674027
1.00 (ref.)0.84 (0.61, 1.17)0.93 (0.60, 1.44)0.82 (0.46, 1.47)0.90 (0.44, 1.83)
1,744221886
4,550124533823
1.00 (ref.)0.60 (0.38, 0.97)1.48 (0.84, 2.61)1.08 (0.66, 2.39)1.03 (0.45, 2.63)
1-4 years Non exposed <0.36 0.36-3.45 3.46-13.6 ≥13.7
1,71848301819
4,721139694227
1.00 (ref.)0.69 (0.49, 0.98)0.85 (0.54, 1.35)0.77 (0.44, 1.37)1.38 (0.75, 2.54)
1,744231369
4,553123513726
1.00 (ref.)0.60 (0.38, 0.96)1.13 (0.60, 2.14)0.86 (0.35, 2.13)1.30 (0.58, 2.91)
aOdds ratios (ORs) from conditional logistic regression models, matched by 5-year age group, sex, country, and region, and adjusted by education. Confidence intervals (CIs) based on Wald test. bExposure categories based on irregular quantiles of the cumulative exposure distribution of controls (i.e. 50th, 75th, and 90th percentiles). cNon-exposed cases and controls include only subjects who were never occupationally exposed (i.e. 1-year lag).
25

Table 4. Adjusted odds ratios (OR) and 95% CIs for glioma or meningioma risk and cumulative RF H-field exposure (A/m-years) for various exposure lags and time windows. INTEROCC study: Data from Australia, Canada, France, Germany, Israel, New Zealand and United Kingdom, 2000-2004.
Glioma MeningiomaRF H-field cumulative exposure (A/m-years)b
Cases(n)
Controls
(n)ORa (95% CI)
Cases(n)
Controls(n) ORa (95% CI)
1-year lag Non exposedc
<0.04 0.04-0.18 0.19-0.65 ≥0.66
1,74099522921
4,8032431196949
1.00 (ref.)0.77 (0.60, 1.00)0.85 (0.59, 1.17)0.91 (0.58, 1.43)0.92 (0.54, 1.57)
1,75645232113
4,6292101016445
1.00 (ref.)0.78 (0.56, 1.10)0.87 (0.55, 1.40)1.25 (0.74, 2.09)1.24 (0.64, 2.40)
5-year lag Non exposed <0.04 0.04-0.18 0.19-0.63 ≥0.64
1,74083442914
4,8032131066243
1.00 (ref.)0.74 (0.56, 0.97)0.81 (0.56, 1.17)1.00 (0.63, 1.59)0.75 (0.40, 1.41)
1,75640231811
4,626184935540
1.00 (ref.)0.83 (0.58, 1.19)0.92 (0.57, 1.49)1.24 (0.71, 2.17)1.25 (0.61, 2.55)
10-year lag Non exposed <0.04 0.04-0.16 0.17-0.62 ≥0.63
1,7406930279
4,803182895437
1.00 (ref.)0.75 (0.56, 1.01)0.65 (0.42, 1.01)1.08 (0.67, 1.75)0.54 (0.26, 1.15)
1,7563417178
4,626159774834
1.00 (ref.)0.83 (0.56, 1.23)0.91 (0.52, 1.57)1.34 (0.74, 2.41)0.92 (0.41, 2.09)
5-9 years Non exposed <0.03 0.03-0.09 0.10-0.29 ≥0.30
1,7405725228
4,789124613625
1.00 (ref.)0.90 (0.65, 1.26)0.80 (0.49, 1.30)1.22 (0.71, 2.11)0.72 (0.31, 1.63)
1,756251296
4,616103573223
1.00 (ref.)0.88 (0.56, 1.40)0.89 (0.47, 1.69)1.17 (0.54, 2.54)1.24 (0.48, 3.22)
1-4 years Non exposed <0.02 0.02-0.04 0.05-0.12 ≥0.13
1,74049211719
4,789124653425
1.00 (ref.)0.79 (0.55, 1.11)0.64 (0.38, 1.06)0.94 (0.51, 1.71)1.62 (0.86, 3.01)
1,756181778
4,616100583123
1.00 (ref.)0.61 (0.36, 1.02)1.37 (0.78, 2.43)0.89 (0.37, 2.10)1.52 (0.65, 3.55)
aOdds ratios (ORs) from conditional logistic regression models, matched by 5-year age group, sex, country, and region, and adjusted by education. Confidence intervals (CIs) based on Wald test. bExposure categories based on irregular quantiles of the cumulative exposure distribution of controls (i.e. 50th, 75th, and 90th percentiles). cNon-exposed cases and controls include only subjects who were never occupationally exposed (i.e. 1-year lag).
26

Table 5. Adjusted ORs for glioma and meningioma using continuous RF H-field cumulative exposure for 1-year lag and 1- to 4-year exposure time window, and various polynomial models. INTEROCC study: Data from Australia, Canada, France, Germany, Israel, New Zealand and United Kingdom, 2000-2004.Model # Model form Odds Ratioa 95%CIb AICc BICd
GLIOMARF H-field cumulative exposure (A/m-years), 1-year lag
1 Log-linear 0.91 0.74-1.13 7164.97
7181.69
2 Log-log 0.84 0.51-1.37 7165.58
7182.30
RF H-field cumulative exposure (A/m-years), 1- to 4-years exposure time window
1 Log-linear 1.82 0.75-4.42 7164.44
7181.16
2 Log-log 2.15 0.55-8.46 7164.93
7181.65
MENINGIOMARF H-field cumulative exposure (A/m-years), 1-year lag
1 Log-linear 0.99 0.87-1.13 6752.52
6769.11
2 Log-log 1.10 0.65-1.86 6752.43
6769.02
RF H-field cumulative exposure (A/m-years), 1- to 4-years exposure time window
1 Log-linear 1.46 0.37-5.74 6752.28
6768.87
2 Log-log 1.98 0.29-13.3 6752.09
6768.68
aORs from conditional logistic regression models, stratified by 5-year age group, sex, country, and region, and adjusted by education. bConfidence intervals (CI) based on Wald test. cAIC: Akaike Information Criterion. dBIC: Bayesian Information Criterion. Note: Only results for log-linear and log-log models are shown since more complex models were unstable due to limited data.
27

Figure 2. Exposure-response relationship between risk of glioma and meningioma (ORs based on conditional logistic regression models, matched by 5-year age group, sex, country, and region, and adjusted by education) and (frequency-weighted) RF E-field cumulative exposure (ICNIRPE ratio2-years) for overall exposure (1-year lag) and 1- to 4-year exposure time window. The dashed lines indicate the linear model (black line) and a quadratic model with log-transformed exposure (yellow line). The grey shadow indicates Wald-type 95% CIs for the linear model. Vertical dashed lines on the left side of the plot indicate the cut points used in the categorical analysis (i.e. 50th, 75th and 90th percentiles of the cumulative exposure distribution of controls). Points and error bars indicate adjusted ORs and Wald-type 95% CIs for the exposure categories based on these cut points. The ORs and CIs from the categorical analysis are positioned at the median exposure for each interval. Plot rug are cases (dashed short vertical black lines) and controls (dashed short vertical grey lines). Plots truncated at the 95th percentile of cumulative exposure to improve visibility.
28

ACKNOWLEDGEMENTS
The authors would like to give special thanks to Dr. Dave Conover (deceased), USA, for his contribution in the assignment of RF and IF-EMF sources to study subjects, as well as to Taichi Murata, Japan, and Martin Doczkat, USA, for their work on exposure models for military radars and antennas. We also would like to thank Myles Capstick, UK, and Wout Joseph, Belgium, for their input on the calculation of cumulative exposure to electromagnetic fields. We are also grateful to Patricia McKinney and Sarah Fleming, UK, for supervising data collection and management in the UK.
DISCLAIMER
The findings and conclusions in this paper have not been formally disseminated by the National Institute for Occupational Safety and Health and should not be construed to represent any agency determination or policy.
29

REFERENCES
Armstrong, B., Thériault, G., Guénel, P., Deadman, J., Goldberg, M., Héroux, P., 1994. Association between exposure to pulsed electromagnetic fields and cancer in electric utility workers in Quebec, Canada, and France. Am. J. Epidemiol. 140, 805–20.
Baldi, I., Coureau, G., Jaffré, A., Gruber, A., Ducamp, S., Provost, D., Lebailly, P., Vital, A., Loiseau, H., Salamon, R., 2011. Occupational and residential exposure to electromagnetic fields and risk of brain tumors in adults: A case-control study in Gironde, France. Int. J. Cancer 129, 1477–1484. https://doi.org/10.1002/ijc.25765
Barnes, F., Greenebaum, B., 2016. Some Effects of Weak Magnetic Fields on Biological Systems: RF fields can change radical concentrations and cancer cell growth rates. IEEE Power Electron. Mag. 3, 60–68. https://doi.org/10.1109/MPEL.2015.2508699
Barnes, F.S., Greenebaum, B., 2015. The effects of weak magnetic fields on radical pairs. Bioelectromagnetics 36, 45–54. https://doi.org/10.1002/bem.21883
Baste, V., Hansson Mild, K., Moen, B.E., 2010. Radiofrequency exposure on fast patrol boats in the Royal Norwegian Navy-an approach to a dose assessment. Bioelectromagnetics 31, 350–360. https://doi.org/10.1002/bem.20562
Berg, G., Spallek, J., Schüz, J., Schlehofer, B., Böhler, E., Schlaefer, K., Hettinger, I., Kunna-Grass, K., Wahrendorf, J., Blettner, M., 2006. Occupational exposure to radio frequency/microwave radiation and the risk of brain tumors: Interphone study group, Germany. Am. J. Epidemiol. 164, 538–548. https://doi.org/10.1093/aje/kwj247
Blackman, C.F., Benane, S.G., Elder, J.A., House, D.E., Lampe, J.A., Faulk, J.M., 1980. Induction of calcium-ion efflux from brain tissue by radiofrequency radiation: effect of sample number and modulation frequency on the power-density window. Bioelectromagnetics 1, 35–43.
Bondy, M.L., Scheurer, M.E., Malmer, B., Barnholtz-Sloan, J.S., Davis, F.G., Il’yasova, D., Kruchko, C., McCarthy, B.J., Rajaraman, P., Schwartzbaum, J.A., Sadetzki, S., Schlehofer, B., Tihan, T., Wiemels, J.L., Wrensch, M., Buffler, P.A., 2008. Brain tumor epidemiology: Consensus from the Brain Tumor Epidemiology Consortium. Cancer 113, 1953–1968. https://doi.org/10.1002/cncr.23741
Braganza, M.Z., Kitahara, C.M., Berrington de Gonzalez, A., Inskip, P.D., Johnson, K.J., Rajaraman, P., 2012. Ionizing radiation and the risk of brain and central nervous system tumors: a systematic review. Neuro. Oncol. 14, 1316–1324. https://doi.org/10.1093/neuonc/nos208
Breslow, N.E., Day, N.E., 1980. Statistical methods in cancer research. Volume I - The analysis of case-control studies. IARC Sci. Publ. 5–338.
Cardis, E., Armstrong, B.K., Bowman, J.D., Giles, G.G., Hours, M., Krewski, D., McBride, M., Parent, M.E., Sadetzki, S., Woodward, A., Brown, J., Chetrit, A., Figuerola, J., Hoffmann, C., Jarus-Hakak, A., Montestruq, L., Nadon, L., Richardson, L., Villegas, R., Vrijheid, M., 2011. Risk of brain tumours in relation to estimated RF dose from mobile phones: Results from five interphone countries. Occup. Environ. Med. 68, 631–640. https://doi.org/10.1136/oemed-2011-100155
Cardis, E., Richardson, L., Deltour, I., Armstrong, B., Feychting, M., Johansen, C., Kilkenny, M., McKinney, P., Modan, B., Sadetzki, S., Schüz, J., Swerdlow, A., Vrijheid, M., Auvinen, A., Berg, G., Blettner, M., Bowman, J., Brown, J., Chetrit, A., Christensen, H.C., Cook, A., Hepworth, S., Giles, G., Hours, M., Iavarone, I., Jarus-Hakak, A., Klaeboe, L., Krewski, D., Lagorio, S., Lönn, S., Mann, S., McBride, M., Muir, K., Nadon, L., Parent, M.E., Pearce, N., Salminen, T., Schoemaker, M., Schlehofer, B., Siemiatycki, J., Taki, M., Takebayashi, T., Tynes, T., Van Tongeren, M., Vecchia, P., Wiart, J., Woodward, A., Yamaguchi, N., 2007. The INTERPHONE study: Design, epidemiological methods, and description of the study population. Eur. J. Epidemiol. 22, 647–664. https://doi.org/10.1007/s10654-007-9152-z
Castello, P.R., Hill, I., Sivo, F., Portelli, L., Barnes, F., Usselman, R., Martino, C.F., 2014. Inhibition of cellular proliferation and enhancement of hydrogen peroxide production in fibrosarcoma cell line by weak radio frequency magnetic fields. Bioelectromagnetics 35,
30

598–602. https://doi.org/10.1002/bem.21858Degrave, E., Meeusen, B., Grivegnée, A.-R., Boniol, M., Autier, P., 2009. Causes of death
among Belgian professional military radar operators: a 37-year retrospective cohort study. Int. J. cancer 124, 945–51. https://doi.org/10.1002/ijc.23988
Durney, C.H., Massoudi, H.F., Iskander, M., 1986. Radiofrequency radiation dosimetry handbook, Report AFRL-RH-BR-TR-2010-0065.
Eriksson, A., Hansson Mild, K., 1985. Radiofrequency electromagnetic leakage fields from plastic welding machines. Measurements and reducing measures. J. Microw. Power Electromagn. Energy 20, 95–107.
Finkelstein, M.M., 1998. Cancer incidence among Ontario police officers. Am. J. Ind. Med. 34, 157–162.
Grayson, J.K., 1996. Radiation exposure, socioeconomic status, and brain tumor risk in the US Air Force: a nested case-control study. Am. J. Epidemiol. 143, 480–6.
Greenland, S., Senn, S.J., Rothman, K.J., Carlin, J.B., Poole, C., Goodman, S.N., Altman, D.G., 2016. Statistical tests, P values, confidence intervals, and power: a guide to misinterpretations. Eur. J. Epidemiol. 31, 337–350. https://doi.org/10.1007/s10654-016-0149-3
Groves, F.D., Page, W.F., Gridley, G., Lisimaque, L., Stewart, P.A., Tarone, R.E., Gail, M.H., Boice, J.D., Beebe, G.W., 2002. Cancer in Korean War Navy technicians: Mortality survey after 40 years. Am. J. Epidemiol. 155, 810–818. https://doi.org/10.1093/aje/155.9.810
Hansson Mild, K., 1981. Radiofrequency electromagnetic fields in Swedish radio stations and tall FM/TV towers. Bioelectromagnetics 2, 61–9.
Hansson Mild, K., Mattson, M., 2017. Dose and Exposure in Bioelectromagnetics, in: Markov, M. (Ed.), Dosimetry in Bioelectromagnetics. CRC Press, 6000 Broken Sound Parkway NW, Suite 300, Boca Raton, FL (USA), pp. 101–118. https://doi.org/10.1201/9781315154572
Hastie, T., Tibshirani, R., Friedman, J., 2008. The Elements of Statistical Learning: Data Mining, Inference, and Prediction. Springer, New York.
Heinrich, S., Thomas, S., Heumann, C., von Kries, R., Radon, K., 2010. Association between exposure to radiofrequency electromagnetic fields assessed by dosimetry and acute symptoms in children and adolescents: a population based cross-sectional study. Environ. Heal. 9, 75. https://doi.org/10.1186/1476-069X-9-75
Hitchcock, R., 2015. Radio-Frequency Radiation, in: Hamilton and Hardy’s Industrial Toxicology. Edited by Raymond D. Harbison,Marie M. Bourgeois,Giffe T. Johns. John Wiley and Sons, Inc.
Hitchcock, R.T., Patterson, R.M., 1995. Radio-frequency and ELF Electromagnetic Energies : A Handbook For Health Professionals. Van Nostrand Reinhold, New York.
Hosmer, D., Lemeshow, S., Sturdivant, R., 2013. Applied Logistic Regression, 3rd Edition. Wiley.
IARC, 2013. Non-ionizing radiation, Part 2: Radiofrequency electromagnetic fields., IARC monographs on the evaluation of carcinogenic risks to humans / World Health Organization, International Agency for Research on Cancer.
ICNIRP, 2004. ICNIRP statement related to the use of security and similar devices utilizing electromagnetic fields. Health Phys. 87, 187–96.
ICNIRP, 1998. Guidelines for limiting exposure to time-varying electric, magnetic, and electromagnetic fields (up to 300 GHz). Health Phys., International Commission on Non-Ionizing Radiation Protection 75, 535. https://doi.org/10.1097/HP.0b013e3181aff9db
IEEE, 2006. IEEE Standard for Safety Levels with Respect to Human Exposure to Radio Frequency Electromagnetic Fields, 3 kHz to 300 GHz. IEEE Std C95.1-2005 (Revision IEEE Std C95.1-1991) 1–238. https://doi.org/10.1109/IEEESTD.2006.99501
Joseph, W., Vermeeren, G., Verloock, L., Goeminne, F., 2012. In situ magnetic field exposure and ICNIRP-based safety distances for electronic article surveillance systems. Radiat. Prot. Dosimetry 148, 420–427. https://doi.org/10.1093/rpd/ncr206
Karipidis, K.K., Benke, G., Sim, M.R., Kauppinen, T., Giles, G., 2007. Occupational exposure
31

to ionizing and non-ionizing radiation and risk of glioma. Occup. Med. (Lond). 57, 518–24. https://doi.org/10.1093/occmed/kqm078
Kim, H.-M., Richardson, D., Loomis, D., Van Tongeren, M., Burstyn, I., 2011. Bias in the estimation of exposure effects with individual- or group-based exposure assessment. J. Expo. Sci. Environ. Epidemiol. 21, 212–221. https://doi.org/10.1038/jes.2009.74
Lagorio, S., Rossi, S., Vecchia, P., De Santis, M., Bastianini, L., Fusilli, M., Ferrucci, A., Desideri, E., Comba, P., 1997. Mortality of plastic-ware workers exposed to radiofrequencies. Bioelectromagnetics 18, 418–21. https://doi.org/10.1002/(SICI)1521-186X(1997)18:6<418::AID-BEM3>3.0.CO;2-5 [pii]
Lerchl, A., Klose, M., Grote, K., Wilhelm, A.F.X., Spathmann, O., Fiedler, T., Streckert, J., Hansen, V., Clemens, M., 2015. Tumor promotion by exposure to radiofrequency electromagnetic fields below exposure limits for humans. Biochem. Biophys. Res. Commun. 459, 585–590. https://doi.org/10.1016/j.bbrc.2015.02.151
Lilienfeld, A.M., Tonascia, J., Libaur, C.A., Cauthen, G.M., 1978. Foreign service health status study: evaluation of health status of foreign service and other employees from selected Eastern European posts. Dept. of Epidemiology, School of Hygiene and Public Health, Johns Hopkins University, Baltimore, Md.
Mickey, R.M., Greenland, S., 1989. The impact of confounder selection criteria on effect estimation. Am. J. Epidemiol. 129, 125–37.
Milham, S., 1988. Mortality by license class in amateur radio operators. Am. J. Epidemiol. 128, 1175–1176.
Morgan, R.W., Kelsh, M.A., Zhao, K., Exuzides, K.A., Heringer, S., Negrete, W., 2000. Radiofrequency exposure and mortality from cancer of the brain and lymphatic/hematopoietic systems. Epidemiology 11, 118–27.
Ostrom, Q.T., Bauchet, L., Davis, F.G., Deltour, I., Fisher, J.L., Langer, C.E., Pekmezci, M., Schwartzbaum, J.A., Turner, M.C., Walsh, K.M., Wrensch, M.R., Barnholtz-Sloan, J.S., 2014. The epidemiology of glioma in adults: a “state of the science” review. Neuro. Oncol. 16, 896–913. https://doi.org/10.1093/neuonc/nou087
Quach, P., El Sherif, R., Gomes, J., Krewksi, D., 2016. A systematic review of the risk factors associated with the onset and progression of primary brain tumours. Neurotoxicology 61, 214–232. https://doi.org/10.1016/j.neuro.2016.05.009
R Core Team, 2014. R: A language and environment for statistical computing. R Foundation for Statistical Computing, Vienna, Austria. URL http://www.R-project.org/.
Rao, V.S., Titushkin, I.A., Moros, E.G., Pickard, W.F., Thatte, H.S., Cho, M.R., 2008. Nonthermal Effects of Radiofrequency-Field Exposure on Calcium Dynamics in Stem Cell-Derived Neuronal Cells: Elucidation of Calcium Pathways. Radiat. Res. 169, 319–329. https://doi.org/10.1667/RR1118.1
Robinette, C.D., Silverman, C., Jablon, S., 1980. Effects upon health of occupational exposure to microwave radiation (radar). Am. J. Epidemiol. 112, 39–53.
Röösli, M., Vienneau, D., 2014. Epidemiological Exposure Assessment, in: Epidemiology of Electromagnetic Fields, Biological Effects of Electromagnetics. CRC Press, p. 368.
Rothman, K., Greenland, S., 1998. Modern epidemiology. Lippincott-Raven, Philadelphia.Rothman, K.J., 2016. Disengaging from statistical significance. Eur. J. Epidemiol. 31, 443–444.
https://doi.org/10.1007/s10654-016-0158-2Royston, P., Sauerbrei, W., Altman, D.G., 2000. Modeling the effects of continuous risk factors.
J. Clin. Epidemiol. 53, 219–21.SCENIHR, 2015. Opinion on: Potential health effects of exposure to electromagnetic fields
(EMF). Scientific Committee on Emerging and Newly Identified Health Risks, Luxembourg.
SCENIHR, 2008. Possible effects of electromagnetic fields (EMF) on human health--opinion of the scientific committee on emerging and newly identified health risks (SCENIHR). Toxicology 246, 248–250.
Schwartzbaum, J.A., Fisher, J.L., Aldape, K.D., Wrensch, M., 2006. Epidemiology and molecular pathology of glioma. Nat. Clin. Pract. Neurol. 2, 494–503. https://doi.org/10.1038/ncpneuro0289
32

Sienkiewicz, Z., Schüz, J., Cardis, E., 2010. Risk analysis of human exposure to electromagnetic fields (revised). Deliverable Report D2 of EHFRAN project.
Smith, T.J., Kriebel, D., 2010. A Biological Approach to Environmental Assessment and Epidemiology. Oxford University Press, New York.
Sorahan, T., Swanson, J., 2017. Does “job” predict exposure to magnetic fields? Occup. Environ. Med. https://doi.org/10.1136/oemed-2017-104494
Szmigielski, S., 1996. Cancer morbidity in subjects occupationally exposed to high frequency (radiofrequency and microwave) electromagnetic radiation. Sci. Total Environ. 180, 9–17. https://doi.org/10.1016/0048-9697(95)04915-0
Therneau, T., 2015. A Package for Survival Analysis in S. version 2.38, http://CRAN.R-project.org/package=survival.
Thomas, S., Kühnlein, A., Heinrich, S., Praml, G., Nowak, D., von Kries, R., Radon, K., 2008. Personal exposure to mobile phone frequencies and well-being in adults: A cross-sectional study based on dosimetry. Bioelectromagnetics 29, 463–470. https://doi.org/10.1002/bem.20414
Thomas, T.L., Stolley, P.D., Stemhagen, A., Fontham, E.T., Bleecker, M.L., Stewart, P.A., Hoover, R.N., 1987. Brain tumor mortality risk among men with electrical and electronics jobs: a case-control study. J. Natl. Cancer Inst. 79, 233–238. https://doi.org/10.1093/jnci/79.2.233
Tielemans, E., Kupper, L.L., Kromhout, H., Heederik, D., Houba, R., 1998. Individual-based and group-based occupational exposure assessment: some equations to evaluate different strategies. Ann. Occup. Hyg. 42, 115–119.
Turner, M.C., Benke, G., Bowman, J.D., Figuerola, J., Fleming, S., Hours, M., Kincl, L., Krewski, D., McLean, D., Parent, M.E., Richardson, L., Sadetzki, S., Schlaefer, K., Schlehofer, B., Schüz, J., Siemiatycki, J., Van Tongeren, M., Cardis, E., 2014. Occupational exposure to extremely low-frequency magnetic fields and brain tumor risks in the INTEROCC study. Cancer Epidemiol. Biomarkers Prev. 23, 1863–1872. https://doi.org/10.1158/1055-9965.EPI-14-0102
Turner, M.C., Krewski, D., Armstrong, B.K., Chetrit, A., Giles, G.G., Hours, M., McBride, M.L., Parent, M.É., Sadetzki, S., Siemiatycki, J., Woodward, A., Cardis, E., 2013. Allergy and brain tumors in the INTERPHONE study: Pooled results from Australia, Canada, France, Israel, and New Zealand. Cancer Causes Control 24, 949–960. https://doi.org/10.1007/s10552-013-0171-7
Tynes, T., Hannevik, M., Andersen, A., Vistnes, A.I., Haldorsen, T., 1996. Incidence of breast cancer in Norwegian female radio and telegraph operators. Cancer Causes Control 7, 197–204. https://doi.org/10.1007/BF00051295
Usselman, R.J., Hill, I., Singel, D.J., Martino, C.F., 2014. Spin Biochemistry Modulates Reactive Oxygen Species (ROS) Production by Radio Frequency Magnetic Fields. PLoS One 9. https://doi.org/10.1371/journal.pone.0093065
Vila, J., Bowman, J.D., Figuerola, J., Moriña, D., Kincl, L., Richardson, L., Cardis, E., 2017. Development of a source-exposure matrix for occupational exposure assessment of electromagnetic fields in the INTEROCC study. J. Expo. Sci. Environ. Epidemiol. 27, 398–408. https://doi.org/10.1038/jes.2016.60
Vila, J., Bowman, J.D., Richardson, L., Kincl, L., Conover, D.L., McLean, D., Mann, S., Vecchia, P., van Tongeren, M., Cardis, E., INTEROCC Study Group, 2016. A Source-based Measurement Database for Occupational Exposure Assessment of Electromagnetic Fields in the INTEROCC Study: A Literature Review Approach. Ann. Occup. Hyg. 60, 184–204. https://doi.org/10.1093/annhyg/mev076
Vrieze, S.I., 2012. Model selection and psychological theory: a discussion of the differences between the Akaike information criterion (AIC) and the Bayesian information criterion (BIC). Psychol. Methods 17, 228–243. https://doi.org/10.1037/a0027127
Vrijheid, M., Deltour, I., Krewski, D., Sanchez, M., Cardis, E., 2006. The effects of recall errors and of selection bias in epidemiologic studies of mobile phone use and cancer risk. J. Expo. Sci. Environ. Epidemiol. 16, 371–384. https://doi.org/10.1038/sj.jes.7500509
Vrijheid, M., Richardson, L., Armstrong, B.K., Auvinen, A., Berg, G., Carroll, M., Chetrit, A.,
33

Deltour, I., Feychting, M., Giles, G. g., Hours, M., Iavarone, I., Lagorio, S., Lönn, S., Mcbride, M., Parent, M.E., Sadetzki, S., Salminen, T., Sanchez, M., Schlehofer, B., Schüz, J., Siemiatycki, J., Tynes, T., Woodward, A., Yamaguchi, N., Cardis, E., 2009. Quantifying the Impact of Selection Bias Caused by Nonparticipation in a Case-Control Study of Mobile Phone Use. Ann. Epidemiol. 19, 33–41. https://doi.org/10.1016/j.annepidem.2008.10.006
Wiemels, J., Wrensch, M., Claus, E.B., 2010. Epidemiology and etiology of meningioma. J. Neurooncol. 99, 307–314. https://doi.org/10.1007/s11060-010-0386-3
34