static.cambridge.org€¦ · Web viewONLINE APPENDIX. Appendix . A: Dutch Parliamentary Study,...
30
ONLINE APPENDIX Appendix A: Dutch Parliamentary Study, 2006 Table A1 displays the share of parliamentarians who were included in the sample of the Dutch Parliamentary Study, divided by party. The right-wing VVD and LPF are somewhat underrepresented in the sample. For the economic dimension, this means that, if anything, the sample will be slightly more egalitarian than parliament as a whole. On the cultural dimension, the sample might be slightly more progressive than parliament. However, the differences are quite small, especially for the LPF, whose representativeness would equal the average if only three more of their members of parliament had taken part in the survey. Andeweg and Thomassen, who collected the data, conclude that “non-response is spread more or less evenly across the different political parties. There is therefore no reason to doubt the representativeness of the study” (Andeweg and Thomassen 2007: 11). Table A1. Respresentativeness of DPS, 2006 Party In parliament In sample % in sample CDA 44 37 84.1% PvdA 42 33 78.6% VVD 28 17 60.7% SP 9 7 77.8% LPF 8 3 37.5% D66 6 5 83.3% 1
Transcript of static.cambridge.org€¦ · Web viewONLINE APPENDIX. Appendix . A: Dutch Parliamentary Study,...

ONLINE APPENDIX
Appendix A: Dutch Parliamentary Study, 2006
Table A1 displays the share of parliamentarians who were included in the sample of the
Dutch Parliamentary Study, divided by party. The right-wing VVD and LPF are somewhat
underrepresented in the sample. For the economic dimension, this means that, if anything, the
sample will be slightly more egalitarian than parliament as a whole. On the cultural
dimension, the sample might be slightly more progressive than parliament. However, the
differences are quite small, especially for the LPF, whose representativeness would equal the
average if only three more of their members of parliament had taken part in the survey.
Andeweg and Thomassen, who collected the data, conclude that “non-response is spread
more or less evenly across the different political parties. There is therefore no reason to doubt
the representativeness of the study” (Andeweg and Thomassen 2007: 11).
Table A1. Respresentativeness of DPS, 2006
Party In parliament In sample % in sample
CDA 44 37 84.1%
PvdA 42 33 78.6%
VVD 28 17 60.7%
SP 9 7 77.8%
LPF 8 3 37.5%
D66 6 5 83.3%
Other 13 12 92.3%
Overall 150 114 76%
1

Appendix B: Survey questions
Income equality
“Some people and parties think that the differences in incomes in our country should be
increased (at number 1). Others think that these differences should be decreased (at number
7). Of course, there are also people whose opinion is somewhere in between. Where would
you place yourself on this line?”
European integration
“Some people and parties think that European unification should go further. Others think that
European unification has already gone too far. Suppose the people and parties who think that
European unification should go further are at the beginning of this line (at number 1) and the
people and parties who think European unification has already gone too far are at the end of
the line (at number 7). Where would you place yourself on this line?”
Multiculturalism
“Some people and parties think that foreigners should be able to live in the Netherlands while
preserving all customs of their own culture. Others think that these people, if they stay in the
Netherlands, should completely adjust themselves to Dutch culture. At the beginning of this
line are the people (and parties) who think that foreigners and ethnic minorities should be
able to live in the Netherlands while preserving all customs of their own culture (at number
1); at the end of the line are the people (and parties) who think that these people should fully
adjust themselves to Dutch culture (at number 7). Where would you place yourself on this
line?”
Crime
“People think differently about the way the government fights crime and tries to preserve law
and order. At the beginning of this line are the people (and parties) who think that the
government is acting too tough on crime (at number 1); at the end of this line are the people
(and parties) who think that the government should act tougher on crime (at number 7).
Where would you place yourself on this line?”
2

Euthanasia
“Suppose that the people (and parties) who think that euthanasia should be forbidden are at
the beginning of this line (at number 1) and the people (and parties) who feel that a doctor
should always be allowed to end a life upon a patient’s request are at the end of the line (at
number 7). Where would you place yourself?”
Left-right self-placement
“It is often said of political beliefs that they are left or right. When you think of your own
political beliefs, where would you place yourself on this line? Please mention the number that
applies to you.”
Source: Todosijevíc, Aarts and van der Kaap (2010).
3

Appendix C: Bootstrap
The bootstrap method offers a way of estimating a confidence interval around a statistic when
the conventional methods of doing so cannot be applied (Efron and Tibshirani, 1993). As
Singh and Xie (2009) explain, “[t]he idea (…) is to use the data of a sample study at hand as
a ‘surrogate population’, for the purpose of approximating the sampling distribution of a
statistic; i.e. to resample (with replacement) from the sample data at hand and create a large
number of ‘phantom samples’” (Singh and Xie, 2009: 2).
To see how this works, let us turn to the case at hand. If we want to test whether, for
instance, higher educated citizens have a significantly higher level of congruence with
parliament than less educated citizens on the issue of multiculturalism, we require a
confidence interval to be estimated around the figure of congruence (in this case, 58.7%).
Using the bootstrap method, we first note that the sample of less educated citizens on this
issue consists of 876 observations, while the sample of parliamentarians consists of 111
observations. We then draw a thousand random samples with replacement of 876
observations from the sample of low educated citizens, alongside a thousand random samples
of 111 observations with replacement from the sample of parliamentarians. From this, we
create a thousand frequency distributions for both low educated citizens and members of
parliament, which we can use, in turn, to create a thousand estimates of many-to-many
congruence between low educated citizens and parliament on the issue of multiculturalism.
The standard deviation from the resulting distribution can be used to determine a confidence
interval, which ranges from 52.8% to 64.6% in the example. The mean and standard
deviation can also be used to perform two sample t-tests, after repeating the same procedure
for the sample of higher educated citizens.
Note that the current approach takes a random sample for both members of parliament and
citizens. This makes for a fairly strict test of statistical significance. The group of
parliamentarians is treated as a random sample of a bigger population, even though it
includes a large majority (76%) of all MP’s. Nevertheless, this sample is not free from
measurement error. One could view it as a part of a hypothetical population, consisting of a
large number of parliamentarians. The consequence of this is that the size of the confidence
interval is increased, since the sample of parliamentarians is fairly small. Hence, if there is a
significant difference between two figures of congruence, we can be quite confident that this
is not a type I error.
4

Appendix D: Congruence using three-point scales
Table D1 presents congruence between groups of citizens and representatives when the
seven-point scales are reduced to three-point scales. For reference, the original scores, i.e.
when using the seven-point scales, are presented in table D2. These are the same figures
which are provided in appendix G.
Table D1. Congruence between citizens and representatives using three-point scalesIncome Education
All Low Middle High Low Middle HighIncome diff. 81.4 74.5 79.6 90.7 73.4 83.0 88.7Eur. integration 78.6 74.1 75.8 86.3 66.9 78.5 93.3Multiculturalism 79.8 77.6 81.6 80.0 66.8 79.7 95.7Crime 74.8 73.8 74.6 75.7 67.8 74.3 83.7Euthanasia 74.1 74.8 74.7 72.5 76.9 73.3 73.0Average 77.7 74.9 77.3 81.0 70.4 77.8 86.9Left-right 91.9 93.3 94.9 86.8 91.5 97.7 93.9
Table D2. Congruence between citizens and representatives using seven-point scalesIncome Education
All Low Middle High Low Middle HighIncome diff. 78.4 69.0 77.5 88.8 66.7 80.1 87.1Eur. integration 75.9 69.8 73.4 84.8 64.0 75.9 91.3Multiculturalism 75.3 65.7 77.4 80.0 53.0 76.5 94.1Crime 54.3 47.0 53.7 61.3 36.2 54.8 71.7Euthanasia 57.9 55.1 55.8 62.5 48.4 57.4 65.3Average 68.4 61.3 67.6 75.5 53.7 68.9 81.9Left-right 89.4 87.8 88.0 86.8 78.5 89.7 95.9
5

Appendix E: Average and left-right congruence
Figures E1 presents the average congruence of the five policy issues in table 1, as well as
congruence using the left-right scale, by income terciles. Figure E2 does the same for
education terciles. To obtain a confidence interval for the average, the average standard error
on the five issues was divided by the square root of five.
Figure E1. Congruence for the average of five issues and left-right placement by income
Figure E1. Congruence for the average of five issues and left-right placement by education
6

Appendix F: Control variables
Table F1 lists the gaps in congruence between lower and upper terciles, which is used as a
measure of unequal representation, after controlling for variables like political participation
and gender. The original gap, without any control variables, is given in the top row in
percentage points. The other rows list the size of this gap after controlling for the variables in
the leftward column. Between parentheses, the reduction of the effect in percentages is given.
Note that not every combination of variables is controlled for. This is either because the
variable has such a small effect by itself that further analysis was not needed or because the
combination of variables produces sparse distributions. For instance, if ethnicity is combined
with political participation and education, the sample would contain very few immigrants
with high levels of participation and education. This produces unreliable estimates.
Table F1. Gaps in congruence after controlling for selected variables
Inc. ineq. (i) Inc. ineq. (e) Eur. int. (e) Multicult. (e) Crime (e) Euthan. (e)
None 19.8 20.4 27.3 41.1 35.5 16.9
Income 12.9 (-34%) 16.1 (-21%) 24.2 (-11%) 30.9 (-25%) 34.1 (-4%) 15.2 (-10%)
Participation 19.2 (-3%) 20.3 (-1%) 26.4 (-3%) 27.4 (-33%) 32.1 (-10%) 13.9 (-18%)
Knowledge 17.7 (-11%) 19.6 (-4%) 25.6 (-6%) 34.0 (-17%) 25.6 (-28%) 12.6 (-25%)
Age 18.5 (-7%) 17.0 (-17%) 24.4 (-11%) 36.9 (-10%) 34.5 (-3%) 13.4 (-21%)
Ethnicity 13.9 (-30%) 20.8 (+2%) 27.2 (-1%) 32.2 (-22%) 34.7 (-3%) 8.9 (-47%)
Gender 18.7 (-6%) 16.0 (-22%) 24.9 (-9%) 37.9 (-8%) 35.7 (+0%) 16.9 (+0%)
Inc. + part. 11.7 (-41%) 16.3 (-20%) 23.6 (-14%) 30.9 (-25%) 31.6 (-11%) 12.5 (-26%)
Inc. + know. 9.0 (-54%) 16.5 (-19%) 20.9 (-24%) 31.0 (-25%) 25.6 (-28%) 11.2 (-34%)
Inc. + age 13.1 (-34%) 12.9 (-37%) 22.0 (-20%) 34.6 (-16%) 32.1 (-10%) 11.6 (-31%)
Inc. + ethnic. 11.0 (-44%) 15.3 (-25%) 28.9 (+6%) 31.9 (-22%) 36.6 (+3%) 13.4 (-21%)
Inc. + gender 12.6 (-37%) 14.6 (-29%) 23.2 (-15%) 32.7 (-20%) 34.0 (-4%) 14.7 (-13%)
Part. + age 15.0 (-24%) 15.7 (-23%) 24.6 (-10%) 27.4 (-33%) 27.4 (-23%) 14.2 (-15%)
Part. + know. 16.0 (-19%) 18.1 (-12%) 23.4 (-14%) 32.5 (-21%) 30.7 (-14%) 14.8 (-12%)Note: (i) in the top row stands for income; (e) stands for education. For the income effect regarding income inequality, I could obviously not control for income. Here, I controlled for education. For this effect, the reader should replace the word ‘income’ with ‘education’ in the column with control variables. For instance, I did not control for income and participation but for education and participation, reducing the income effect to 12.4 percentage points.
7

Appendix G: Many-to-many congruence over time
Tables G1-G6 provide many-to-many congruence for income and education terciles over
time on five policy issues and the left-right scale, along with 95% confidence intervals.
Table G1. Congruence regarding income differences, 1989-2006
1989/1990 1998/2001 2006/2006
Overall 85.0[78.6 – 91.3]
85.2[78.2 – 92.3]
78.4[70.2 – 86.7]
Low income 76.1*[69.4 – 82.8]
77.6[71.2 – 83.9]
69.0**[60.7 – 77.4]
Middle income 88.2[81.9 – 94.6]
89.8[83.0 – 96.7]
77.5[68.6 – 86.4]
High income 86.4[79.4 – 93.4]
82.9[75.2 – 90.7]
88.8[81.1 – 96.5]
Low education 78.4*[71.4 – 85.4]
76.8[69.8 – 83.7]
66.7**[58.2 – 75.4]
Middle education 90.8[85.0 - 96.7]
90.0[83.3 – 96.7]
80.1[72.0 – 88.3]
High education 90.2[81.2 – 99.1]
86.0[77.8 – 94.3]
87.1[79.0 – 95.2]
Table G2. Congruence regarding European integration, 1998-2006
1998/2001 2006/2006Overall 81.6
[74.0 – 89.1]75.9
[67.8 – 84.1]Low income 76.9*
[69.1 – 84.7]69.8*
[61.4 – 78.3]Middle income 81.4
[73.4 – 89.4]73.4
[64.2 – 82.6]High income 89.9
[82.4 – 97.4]84.8
[76.5 – 93.1]Low education 71.2**
[62.7 – 79.7]64.0**
[54.9 – 73.0]Middle education 84.0
[76.4 – 91.6]75.9**
[67.6 – 84.3]High education 90.3
[82.9 – 97.7]91.3
[84.2 – 98.3]
8
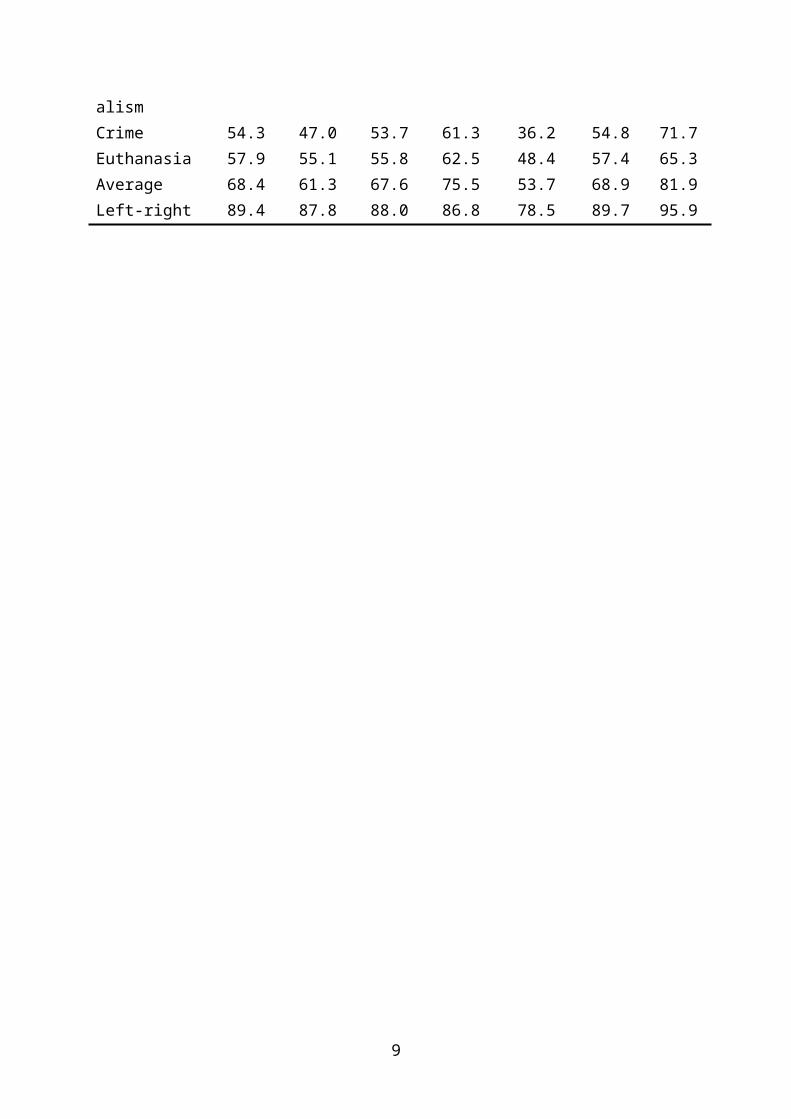
Table G3. Congruence regarding multiculturalism, 1998-2006
1998/2001 2006/2006Overall 79.0
[72.8 – 85.1]75.3
[68.9 – 81.7]Low income 71.5**
[64.6 – 78.4]65.7**
[59.9 – 71.4]Middle income 79.2
[72.2 – 86.1]77.4
[70.2 – 84.7]High income 86.8
[80.4 – 93.0]80.0
[72.4 – 87.6]Low education 64.7**
[58.3 – 71.1]53.0**
[47.0 – 59.0]Middle education 82.8
[76.1 – 89.5]76.5**
[68.8 – 84.3]High education 86.7
[80.0 – 93.3]94.1
[87.5 – 100.7]
Table G4. Congruence regarding crime, 2006
2006/2006Overall 54.2
[49.4 – 59.1]Low income 47.0**
[42.5 – 51.5]Middle income 53.7
[47.7 – 59.7]High income 61.3
[55.1 – 67.6]Low education 36.2**
[31.6 – 40.7]Middle education 54.8**
[49.4 – 60.1]High education 71.7
[63.7 – 79.7]
9

Table G5. Congruence regarding euthanasia, 1989-2006
1989/1990 1998/2001 2006/2006
Overall 89.0[83.5 – 94.5]
84.3[77.5 – 91.2]
57.9[50.8 – 64.9]
Low income 79.7[72.1 – 87.3]
81.1[73.5 – 88.8]
55.1[47.4 – 62.8]
Middle income 88.8[82.8 – 94.7]
82.6[74.6 – 90.6]
55.8[48.6 – 63.0]
High income 88.1[81.7 – 94.6]
86.9[79.6 – 94.3]
62.5[54.4 – 70.7]
Low education 81.0[74.2 – 87.8]
72.6**[64.8 – 80.5]
48.4**[40.6 – 56.3]
Middle education 88.6[82.7 – 94.5]
87.2[80.1 – 94.1]
57.4[49.8 – 65.0]
High education 80.3[70.8 – 89.8]
88.6[80.9 – 96.3]
65.3[55.7 – 74.9]
Table G6. Left-right congruence, 1998-2006
1998/2001 2006/2006Overall 79.9
[72.5 – 87.3]89.4
[82.4 – 96.3]Low income 73.4
[65.0 – 81.7]87.8
[80.4 – 95.2]Middle income 82.3
[74.6 – 90.0]88.0
[80.0 – 95.9]High income 81.4
[73.4 – 89.3]86.8
[78.5 – 95.0]Low education 69.4*
[60.8 – 77.9]78.5**
[70.1 – 87.0]Middle education 79.5
[71.8 – 87.2]89.7
[82.2 – 97.3]High education 83.1
[74.8 – 91.4]95.9
[89.3 – 102.6]Note: For all tables, * p < 0.05; ** p < 0.01. All t-tests compare the low or middle terciles to the highest tercile.
10

Appendix H: Average scores over time
Tables H1-H6 provide average scores for income and education terciles across time on five
policy issues and the left-right scale, respectively. Standard errors are given in parentheses.
Table H1. Average scores on income equality, 1989-2006
1989/1990 1998/2001 2006/2006
Parliamentarians 4.70 (0.113) 4.93 (0.117) 4.64 (0.144)
All respondents 4.80 (0.043) 4.96 (0.035) 5.23 (0.031)
Low income 5.19 (0.083) 5.24 (0.063) 5.51 (0.054)
Middle income 4.87 (0.064) 5.03 (0.059) 5.29 (0.050)
High income 4.31 (0.086) 4.52 (0.063) 4.87 (0.054)
Low education 4.84 (0.050) 5.16 (0.065) 5.59 (0.068)
Middle education 4.73 (0.095) 4.85 (0.050) 5.17 (0.043)
High education 4.53 (0.207) 4.88 (0.067) 4.90 (0.060)
Table H2. Average scores on European integration, 1998-2006
1998/2001 2006/2006
Parliamentarians 3.33 (0.118) 3.99 (0.158)
All respondents 3.87 (0.037) 4.69 (0.035)
Low income 4.04 (0.070) 4.88 (0.064)
Middle income 3.85 (0.068) 4.76 (0.059)
High income 3.59 (0.065) 4.43 (0.060)
Low education 4.16 (0.072) 5.19 (0.077)
Middle education 3.80 (0.052) 4.66 (0.049)
High education 3.59 (0.072) 4.17 (0.068)
11

Table H3. Average scores on multiculturalism, 1998-2006
1998/2001 2006/2006
Parliamentarians 4.35 (0.105) 4.38 (0.136)
All respondents 4.69 (0.036) 5.21 (0.030)
Low income 4.86 (0.066) 5.41 (0.055)
Middle income 4.68 (0.064) 5.12 (0.051)
High income 4.48 (0.064) 5.10 (0.052)
Low education 5.14 (0.066) 5.88 (0.060)
Middle education 4.64 (0.050) 5.14 (0.043)
High education 4.11 (0.070) 4.55 (0.058)
Table H4. Average scores on crime, 2006
2006/2006
Parliamentarians 4.84 (0.095)
All respondents 6.00 (0.024)
Low income 6.12 (0.040)
Middle income 6.00 (0.040)
High income 5.86 (0.042)
Low education 6.40 (0.043)
Middle education 6.01 (0.033)
High education 5.49 (0.051)
12

Table H5. Average scores on euthanasia, 1989-2006
1989/1990 1998/2001 2006/2006
Parliamentarians 4.59 (0.130) 4.93 (0.148) 4.74 (0.153)
All respondents 4.92 (0.050) 5.16 (0.040) 5.90 (0.032)
Low income 4.77 (0.109) 5.01 (0.075) 5.87 (0.058)
Middle income 4.87 (0.078) 5.22 (0.073) 5.91 (0.054)
High income 5.16 (0.086) 5.35 (0.068) 5.90 (0.054)
Low education 4.86 (0.060) 4.99 (0.081) 5.83 (0.077)
Middle education 5.13 (0.105) 5.23 (0.058) 5.94 (0.045)
High education 5.15 (0.212) 5.27 (0.073) 5.83 (0.058)
Table H6. Average scores on left-right self-placement, 1998-2006
1998/2001 2006/2006
Parliamentarians 3.50 (0.112) 3.95 (0.124)
All respondents 3.90 (0.034) 4.17 (0.028)
Low income 3.80 (0.062) 4.13 (0.052)
Middle income 3.89 (0.062) 4.07 (0.048)
High income 3.95 (0.059) 4.33 (0.047)
Low education 4.06 (0.064) 4.34 (0.066)
Middle education 3.96 (0.048) 4.17 (0.040)
High education 3.61 (0.068) 4.05 (0.053)
13

Appendix I: Cumulative congruence
Table I1 contains the cumulative congruence scores between representatives and (groups of)
citizens. The cumulative measure differs from the non-cumulative measures in the sense that
lower scores indicate a close overlap between distributions (see Golder and Stramski 2010).
If we take this into account, the table clearly points towards the same conclusion that was
presented in the main text: the highest income and education terciles are better represented
than the lower terciles on all issues with the exception of euthanasia.
Table I1. Cumulative congruence between citizens and representativesIncome Education
All Low Middle High Low Middle HighIncome diff. 63.4 92.0 68.2 30.6 99.9 56.7 29.8Eur. integration 75.3 96.8 81.1 46.3 125.3 71.6 22.4Multiculturalism 82.3 103.5 73.7 70.9 149.3 75.8 16.1Crime 118.7 131.2 120.4 104.5 158.7 119.3 69.3Euthanasia 119.8 120.0 121.1 118.5 119.2 123.1 109.2Average 91.9 108.7 92.9 74.1 130.5 89.3 49.3Left-right 22.9 21.6 14.0 37.6 41.5 23.0 9.5
More generally, the Pearson correlation between the cumulative scores in table I1 and the
non-cumulative scores in table D2 is -0.96 (p < 0.001, N = 42). If we include the other years
as well, the correlation is -0.93 (p < 0.001, N = 91). Figure I1 below shows the close
association between both ‘many-to-many’ congruence measures for all groups and years.
14

Figure I1. Many-to-many congruence measures across income, education, and time
15

Appendix J: Congruence by party
Tables J1-J3 contain congruence scores for representatives and voters for each of the three
major political parties (CDA, PvdA and VVD). These voters are split up by income and
education terciles. Tables J4-J6 contain the congruence scores when we compare the
representatives of each party with all respondents. To be clear, this means that in table J1 we
compare CDA representatives with, for example, low-educated CDA voters, while in table J4
we compare the same representatives with all low-educated citizens.
Table J1. Congruence between CDA representatives and CDA voters
Income EducationAll Low Middle High Low Middle High
Income diff. 58.8 49.2 60.2 66.0 45.1 59.3 72.9Eur. integration 68.0 62.8 65.7 73.1 49.6 68.6 83.4Multiculturalism 60.7 52.1 59.9 68.3 47.6 60.9 74.0Crime 49.7 41.3 48.8 57.2 36.7 49.1 66.2Euthanasia 30.5 28.8 30.6 31.7 28.7 30.1 33.2Average 53.5 46.8 53.0 59.2 41.5 53.6 65.9
Table J2. Congruence between PvdA representatives and PvdA voters
Income EducationAll Low Middle High Low Middle High
Income diff. 85.5 68.1 86.3 87.3 77.8 85.6 88.1Eur. integration 56.9 50.0 55.0 66.0 40.1 57.0 72.1Multiculturalism 68.2 60.9 69.2 74.2 46.0 69.6 85.2Crime 50.5 42.7 48.6 60.5 27.2 53.1 73.0Euthanasia 61.3 57.6 63.2 62.0 58.4 60.4 71.4Average 64.5 55.8 64.4 70.0 49.9 65.2 78.0
Table J3. Congruence between VVD representatives and VVD voters
Income EducationAll Low Middle High Low Middle High
Income diff. 52.7 48.1 51.2 55.9 45.9 49.6 59.4Eur. integration 76.1 78.6 70.8 75.8 79.4 78.0 70.1Multiculturalism 67.1 64.6 73.8 60.7 57.7 68.7 68.0Crime 58.4 57.4 61.0 57.0 51.0 55.2 63.1Euthanasia 71.4 71.0 69.2 72.7 77.6 63.2 80.9Average 65.2 63.9 65.2 64.4 62.3 63.0 68.3
16

Table J4. Congruence between CDA representatives and all citizens
Income EducationAll Low Middle High Low Middle High
Income diff. 50.6 41.9 50.7 58.9 39.5 52.3 58.1Eur. integration 60.9 54.8 58.3 67.7 48.9 60.9 71.9Multiculturalism 63.1 55.9 64.5 68.0 46.7 64.6 73.4Crime 50.1 44.6 48.3 55.9 33.7 50.3 65.1Euthanasia 37.3 32.3 41.6 36.2 31.1 36.3 42.4Average 52.4 45.9 52.7 57.3 40.0 52.9 62.2
Table J5. Congruence between PvdA representatives and all citizens
Income EducationAll Low Middle High Low Middle High
Income diff. 79.3 80.7 81.1 69.9 76.5 77.7 72.0Eur. integration 54.3 48.2 51.7 63.6 42.3 54.3 69.7Multiculturalism 57.2 50.0 59.4 62.5 38.2 58.7 73.0Crime 44.5 40.6 42.7 50.4 30.9 44.7 60.7Euthanasia 59.6 57.0 57.3 65.0 50.1 59.4 73.0Average 59.0 55.3 58.4 62.3 47.6 58.9 69.7
Table J6. Congruence between VVD representatives and all citizens
Income EducationAll Low Middle High Low Middle High
Income diff. 32.7 26.3 31.4 36.4 25.3 32.7 35.8Eur. integration 75.9 70.2 76.7 78.2 66.2 77.6 74.8Multiculturalism 63.2 57.9 66.9 65.0 48.3 66.5 70.4Crime 55.3 48.7 55.3 62.7 38.6 56.1 71.1Euthanasia 68.9 66.2 66.6 74.2 59.5 68.2 81.3Average 59.2 53.9 59.4 63.3 47.6 60.2 66.7
17