· Web viewEPSF – Kindergarten Entrance Assessment The Early Prevention of School Failure is...
85
Winfield Elementary School Improvement Plan 2014-2017 “Little People, Big Dreams, Bright Future”
Transcript of · Web viewEPSF – Kindergarten Entrance Assessment The Early Prevention of School Failure is...
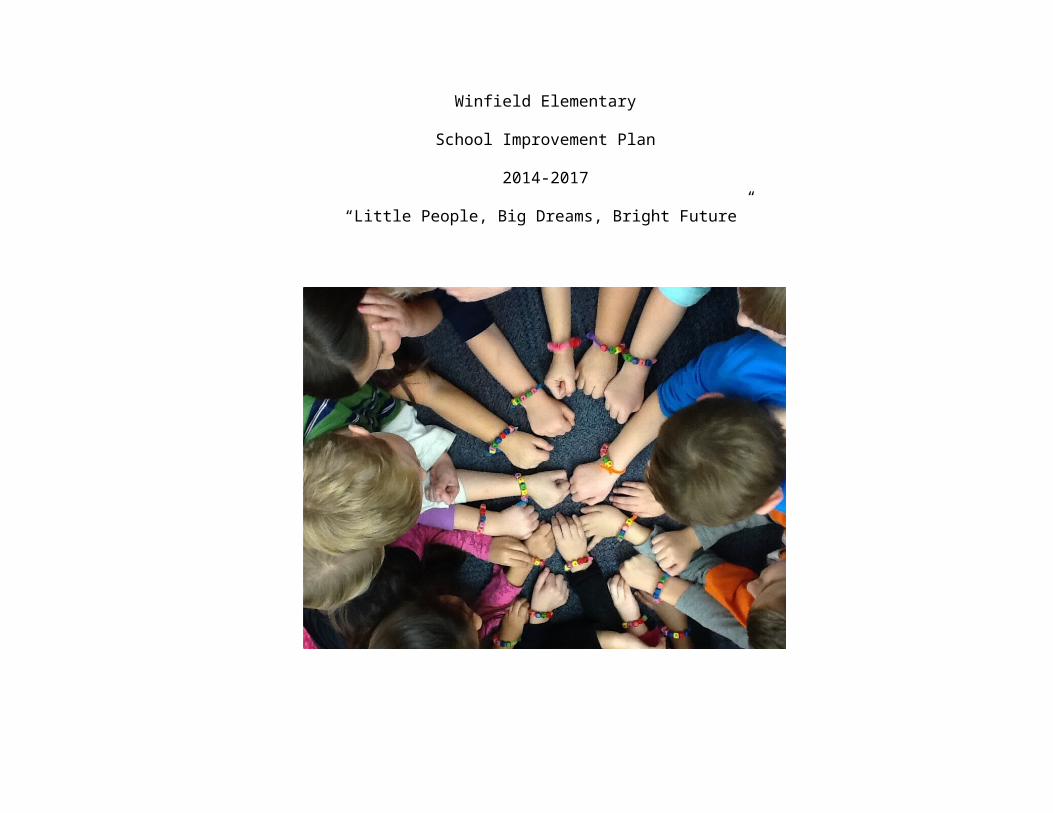
Winfield Elementary
School Improvement Plan
2014-2017
“Little People, Big Dreams, Bright Future”
School Improvement Team
Winfield Elementary School Improvement Committee, in conjunction with the Faculty and Staff, wrote the School Improvement Plan. We studied and analyzed our ISTEP+ achievement scores, IREAD-3 scores, Terra Nova scores, District Assessments, and Winfield Teacher Assessments. We evaluated our programs, services, resources, instructional practices, and professional development program. Based on the results of our study and analysis, we designed our Continuous School Improvement Plan for 2014-2017.
School Improvement Committee Members
Mrs. Jillian Alonzo Principal
Mrs. Melissa Curran Teacher
Mrs. Amanda King Teacher
Mr. Josh Hedl Teacher
Mrs. Amanda Kosiba Teacher
Mrs. Nicole Szypczak Teacher
Mrs. Pam Vickrey Teacher
Mrs. Natalie Henderlong Parent
1. Introduction
Narrative Description of the School
Winfield Elementary School is committed to providing students with an academic program based on high Indiana Academic Standards and high expectations. Our grade configuration of kindergarten through second grade has enabled the faculty to research, study, prepare, and teach to the appropriateness of primary students. The articulation between grade levels has grown stronger as we work and learn collaboratively from each other within three grade levels. We share a vision that continuously focuses on the learning needs of our unique student population.
Winfield Elementary School has many strengths. Our dedicated and professional staff are united in their commitment to meet the potential of every student. The Parent-Teacher Organization works tirelessly to provide academic materials and motivational rewards for the school, as well as organizing events to enhance family involvement. Teachers and parents together have created a strong bond that goes a long way in ensuring the success of each and every child.
Winfield Elementary School currently serves 469 students in grades kindergarten, first, and second. The grade configuration of our school has changed several times over the years as the result of a rising student population. Winfield was originally a K-6 school but changed to a K-3 school when a second elementary school was built to alleviate the overcrowding conditions. In 2005, high enrollment again forced a change in the school makeup. Winfield became a K-2 school.
Winfield Elementary School is the “feeder school” to Jerry Ross Elementary School. Approximately 90% of our students enter Jerry Ross Elementary to complete grades three, four, and five. Assessment results from both Winfield and Jerry Ross are examined to drive curricular decisions and instructional planning.
Winfield Elementary School provides optional breakfast and hot lunches for students in our cafeteria, which is operated by our Cafeteria Manager and four cafeteria assistants. An automated payment system supports parents in their knowledge of student eating habits. In 2010-2011, the Crown Point Community School Corporation implemented a “healthy choice” school lunch program and received a national award from the White House.
Winfield Elementary School is part of the Crown Point Community School Corporation, and is one of seven elementary schools. In January of 2007, the school corporation completed a Long Range Facility Plan to address the continued growth of the entire community. In 2009, the Crown Point Community School Corporation became accredited by the AdvancED/North Central Association Commission of Accreditation and School Improvement. The CPCSC was awarded District Accreditation as a Quality School System. In 2014, the district was again evaluated by AdvancED and earned District Accreditation.
Narrative Description of the Community
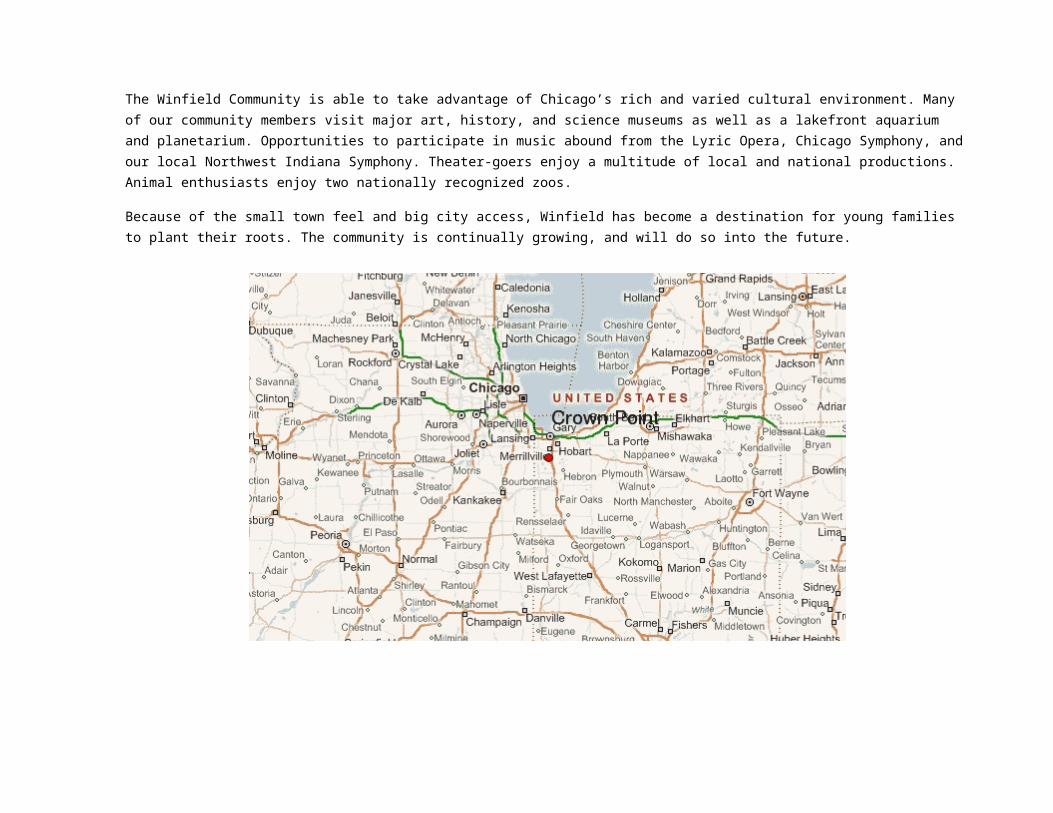
The Town of Winfield is named for General Winfield Scott. The Township of Winfield is located in Crown Point, Indiana and can trace its roots, and name, to the mid 19th century. Organized in 1843, Winfield has a total area of 12.3 square miles and was incorporated into a township in 1993. Winfield Township includes the communities of Leroy, Palmer, and Winfield. It is located seven miles east of Crown Point, Indiana and 36.4 miles east of Chicago, Illinois.
The Winfield Community is able to take advantage of Chicago’s rich and varied cultural environment. Many of our community members visit major art, history, and science museums as well as a lakefront aquarium and planetarium. Opportunities to participate in music abound from the Lyric Opera, Chicago Symphony, and our local Northwest Indiana Symphony. Theater-goers enjoy a multitude of local and national productions. Animal enthusiasts enjoy two nationally recognized zoos.
Because of the small town feel and big city access, Winfield has become a destination for young families to plant their roots. The community is continually growing, and will do so into the future.
Narrative Description
Winfield Elementary School utilizes a variety of educational programs to promote educational excellence. These programs support the development of self-directed lifelong learner, creative problem solvers, and responsible citizens, by facilitating opportunities for students to use their individual abilities to achieve their personal best.
LANGUAGE ARTS Daily Five, Café, Junior Great Books, Journal Writing, Six Trait Writing, Accelerated Reading, Houghton Mifflin Reading Series, Reading A – Z, Raz-Kids, Guided Reading , Weekly Magazines, Drops in the Bucket Reading, Scott Foresman Spelling, Modern Curriculum Press Phonics, Tucker Signing PhonicsLeveled Literacy, Daily Oral Language, Language Arts Software Program (Sight Words and RAZ), Literacy Work Stations, Whole Brain Teaching, BOOK IT
MATHEveryday Math, Inquiry Math Lessons, Computation Software – Math Facts in a Flash, Dreambox Software, Drops in the Bucket Problem Solving, Daily Math Problems, Daily Oral Math, Xtra Math
HEALTHMcGraw Hill Health Series, Hand Washing Presentation, Dental Hygienist Presentation, Field Trips (Tri Town Safety Village)
SOCIAL STUDIES K - Scott Foresman Big Book & Weekly Readers, 1st – Macmillan McGraw Hill Big Book, 2nd – Houghton Mifflin Books, CPCSC Social Studies Performance Task, Guest Speakers, Junior Achievement, Field Trips ( Apple Orchard)
SCIENCE FOSS Science, Lab Experiences, 4-H Embryology, EnvironMobile, Buzz Engram/NIPSCO, Field Trips (Museum, Zoo), Lake County Soil and Water Conservation District
ART Art Textbook Series, Art Displays, Art Website, Creative Arts Fair, Young Rembrandts
MUSIC Music Textbook Series, Grade Level Music Presentations, Creative Arts Fair
PHYSICAL EDUCATION Physical Education Curriculum, Field Day, Jump Rope for Heart, Kiddie 500
TechnologyLab computers (35), 2-3 computers per classroom, mobile iPad lab for Exceptional Learners, Software Programs, Technology-based assessments
2. Statements
VISION
It is the Vision of Winfield Elementary School to
educate every child with quality instruction and high expectations in a nurturing environment.
MISSION
It is the mission of Winfield Elementary School, a partnership of students, staff, families, and community, to provide continuous academic progress in a physically and emotionally safe environment. Winfield School will produce self-directed lifelong learners, creative problem solvers, and responsible citizens by facilitating opportunities for students to use individual abilities to achieve their personal best.
WE BELIEVE…
• Students are our number one priority.
• In the value of the individual.
• That students need to be taught how to learn and how to make decisions.
• In providing opportunities for students to be successful.
• In fostering positive student attitude.
• In comprehensive education that meets the need of the individual student.
• In the worth of teachers and their professional judgment.
• Education is a lifelong process.
• Education is the shared responsibility of the home, school, and community.
• Schools should provide an environment that is safe, healthy, and conducive to learning.
• Schools should teach good citizenship and democratic principles.
• Technology should enhance the learning process.
• Excellence in education is a key to survival of the individual and our nation in the global society.
• In the constant review and revision of the curriculum aligned to the standards.
• In expansion of educational programs outside the school setting.
• In local community-based decision making.
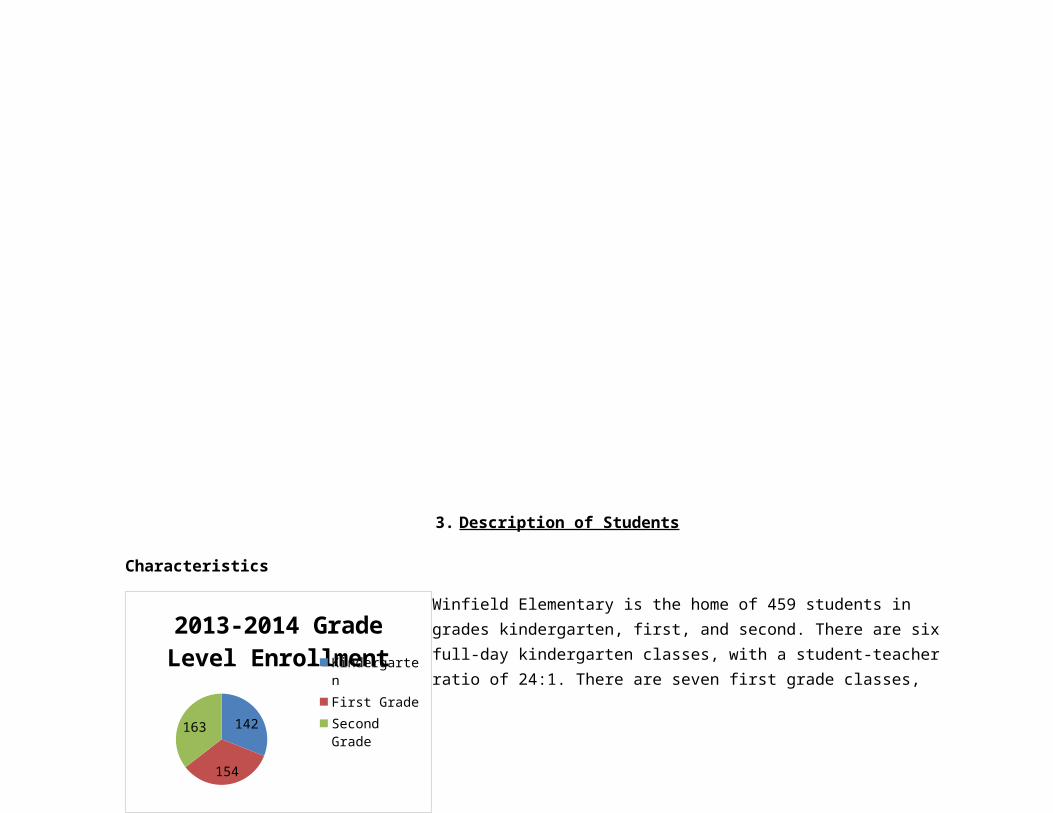
3. Description of Students
Characteristics
Winfield Elementary is the home of 459 students in grades kindergarten, first, and second. There are six full-day kindergarten classes, with a student-teacher ratio of 24:1. There are seven first grade classes, with a student-teacher ratio of 22:1. There are seven second grade classes with a student-teacher ratio of 23:1.
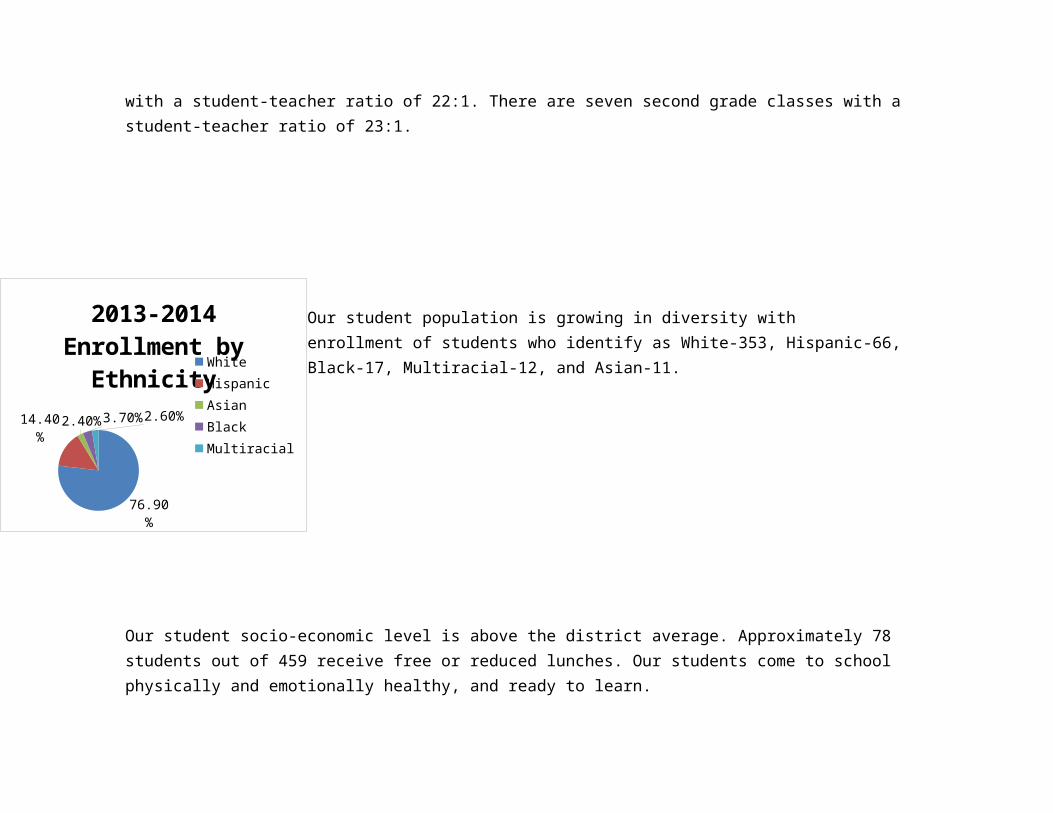
Our student population is growing in diversity with enrollment of students who identify as White-353, Hispanic-66, Black-17, Multiracial-12, and Asian-11.
76.90%
14.40%
2.40% 3.70% 2.60%
2013-2014 Enrollment by Ethnicity
WhiteHispanicAsianBlackMultiracial
142
154
163
2013-2014 Grade Level Enrollment
KindergartenFirst GradeSecond Grade
Our student socio-economic level is above the district average. Approximately 78 students out of 459 receive free or reduced lunches. Our students come to school physically and emotionally healthy, and ready to learn.
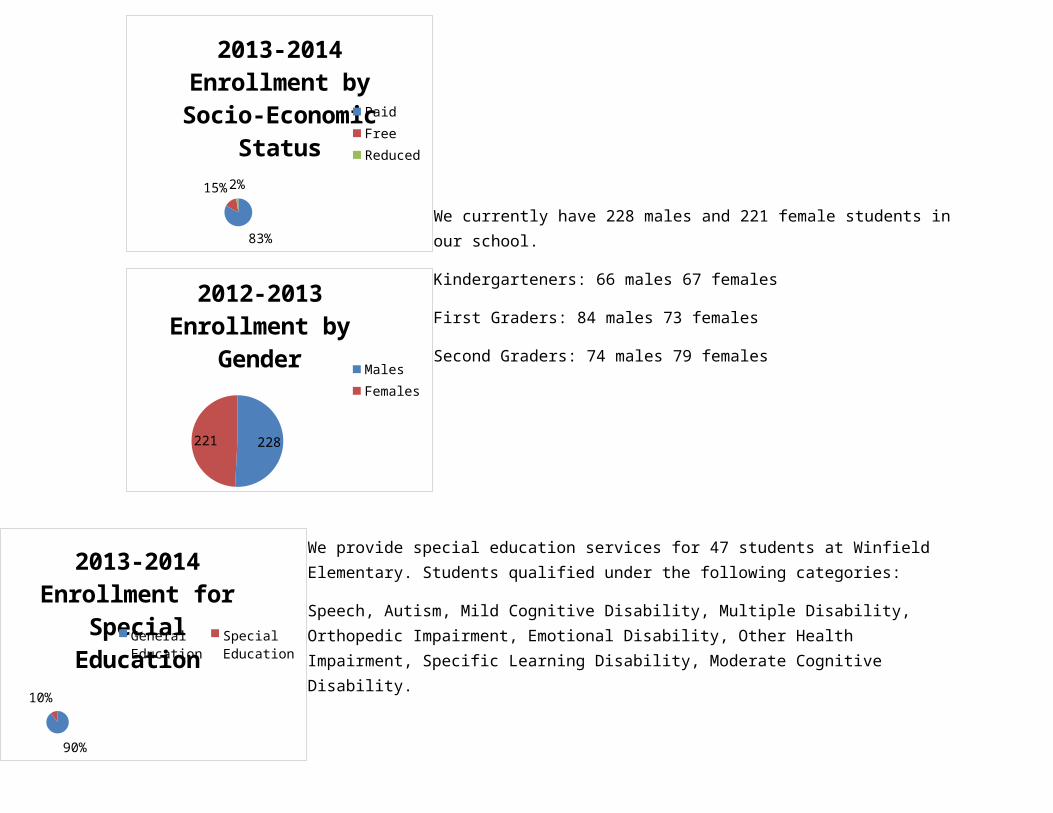
We currently have 228 males and 221 female students in our school.
Kindergarteners: 66 males 67 females
First Graders: 84 males 73 females
Second Graders: 74 males 79 females
83%
15%
2%
2013-2014 Enrollment by Socio-Economic
StatusPaidFreeReduced
228221
2012-2013 Enrollment by Gender
MalesFemales
We provide special education services for 47 students at Winfield Elementary. Students qualified under the following categories:
Speech, Autism, Mild Cognitive Disability, Multiple Disability, Orthopedic Impairment, Emotional Disability, Other Health Impairment, Specific Learning Disability, Moderate Cognitive Disability.
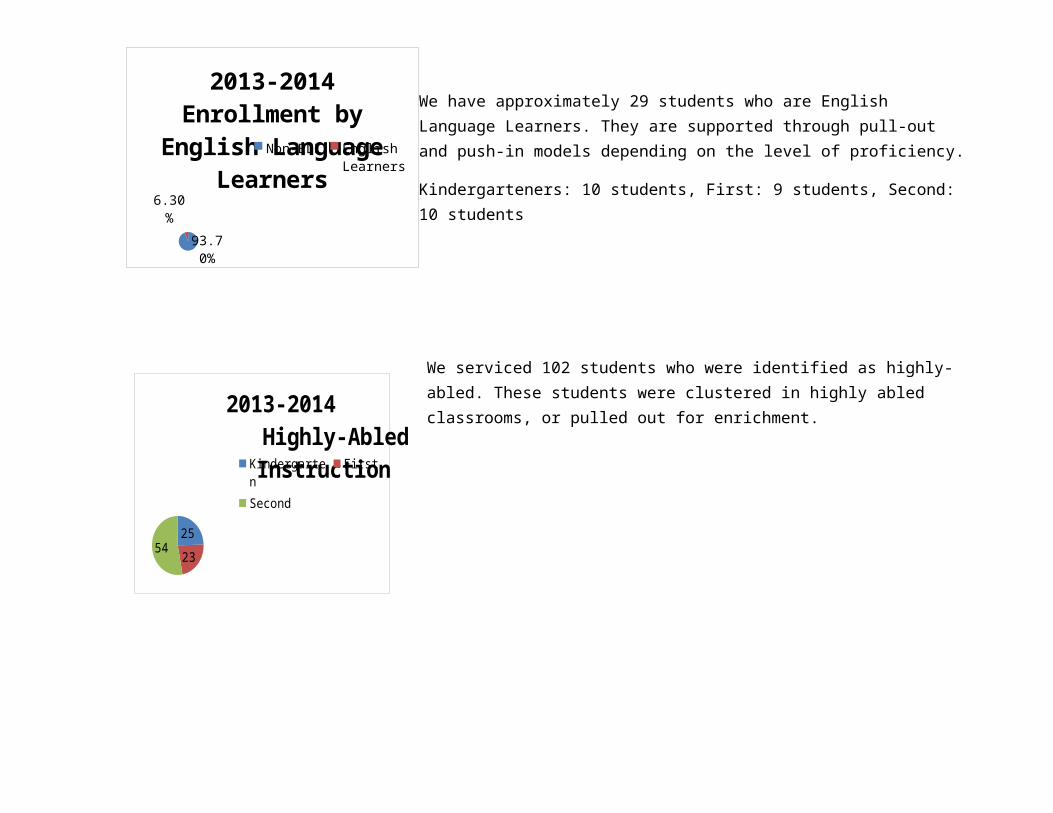
We have approximately 29 students who are English Language Learners. They are supported through pull-out and push-in models depending on the level of proficiency.
Kindergarteners: 10 students, First: 9 students, Second: 10 students
We serviced 102 students who were identified as highly-abled. These students were clustered in highly abled classrooms, or pulled out for enrichment.
93.70%
6.30%
2013-2014 Enrollment by English Language
LearnersNon-ELLEnglish Learners
25
23
54
2013-2014 Highly-Abled Instruction
KindergartenFirstSecond
SPECIAL PROGRAMS
Exceptional Learners - Qualification for special needs services is based on diagnosis, screening, and teacher/parent referral through the RtI Tiered process. All students are assigned to a regular classroom, but may be assisted with small group instruction in a Learning Center or regular classroom. Programs and services are provided on a continuum ranging from consultation with regular education teachers, up through residential placement seven days a week. These programs and services are designed to ensure that appropriate programs are available to all children with disabilities and that the least restrictive program placement for each child is determined based upon the child's unique needs rather than program availability.
Language, Speech, and Hearing Program - A speech and language specialist is assigned to our school to assist students with identified needs. Qualification for speech services is based on diagnosis, screening, and teacher/parent referral through the RtI Tiered process.
Limited English Students (ESL Program) – Students with a home language other than English are tested for placement in a pull-out Language Instruction Educational Program. Our goal is for the student to become proficient in the English language and display achievement of the Standards (Indiana and Core). Each student has an Individual Learning Plan which is updated annually. Techniques and strategies such as controlled vocabulary, use of visual aids, hands-on activities, and primary language support to help students succeed in strengthening and learning English is implemented according to student levels. Las Links assessments provide information relative to the child’s proficiency level to assist with planning of instruction.
At-Risk/Title 1 – Students who are performing below the current benchmark are offered additional services to supplement their classroom learning. These remedial services are provided with remediation funding that supports a
classroom interventionist and two paraprofessionals. These instructors work with students in small-groups or one-on-one to fill in the gaps and help students achieve substantial growth.
Highly-Able Students – At each grade level a range of highly-able students are cluster grouped to address their need for a compacted curriculum. We use a variety of assessment tools to determine the groupings for each grade level. There is one clustered group at each grade level. The clusters are flexible to meet the needs of the students and offer challenging, above grade-level curriculum.
4. Student Performance Data
3rd Grade IREAD Achievement Data
Description of Data: This graph displays a 3 year trend for IREAD-3 results.
Analysis of Data: This data indicates an upward trend in passing the IREAD test. Passage of this test is needed to be promoted to 3rd grade. This shows we are promoting more students to third grade due to meeting the benchmark. We are moving towards 100% proficiency.
2011-2012 2012-2013 2013-201480
82
84
86
88
90
92
94
96
98
100
85.7
91.4 90.8
93.9
98.3 98.2
95.6
98.898.1
IndianaCPCSCJerry Ross
90%
10%
2013-2014 Enrollment for Special Education
General Edu-cationSpecial Education
3rd Grade ISTEP+ Achievement Data
4 Year Trend-All Students
2011 2012 2013 2014English Language Arts
94.9% 98.1% 97.6% 88.1%
Math 90.3% 92.3% 92.4% 88.2%Passing Both 88.6% 92.3% 91.8% 85%
Description of Data: This chart displays a 3 year trend of passing rates for 3rd grade ISTEP+ Language Arts and Math tests. These tests are administered in the spring.
Analysis of Data: This data indicates a decline in both Math and English Language Arts performance. The number of students passing both sub-tests has dipped below the 90th percentile, which is a benchmark.
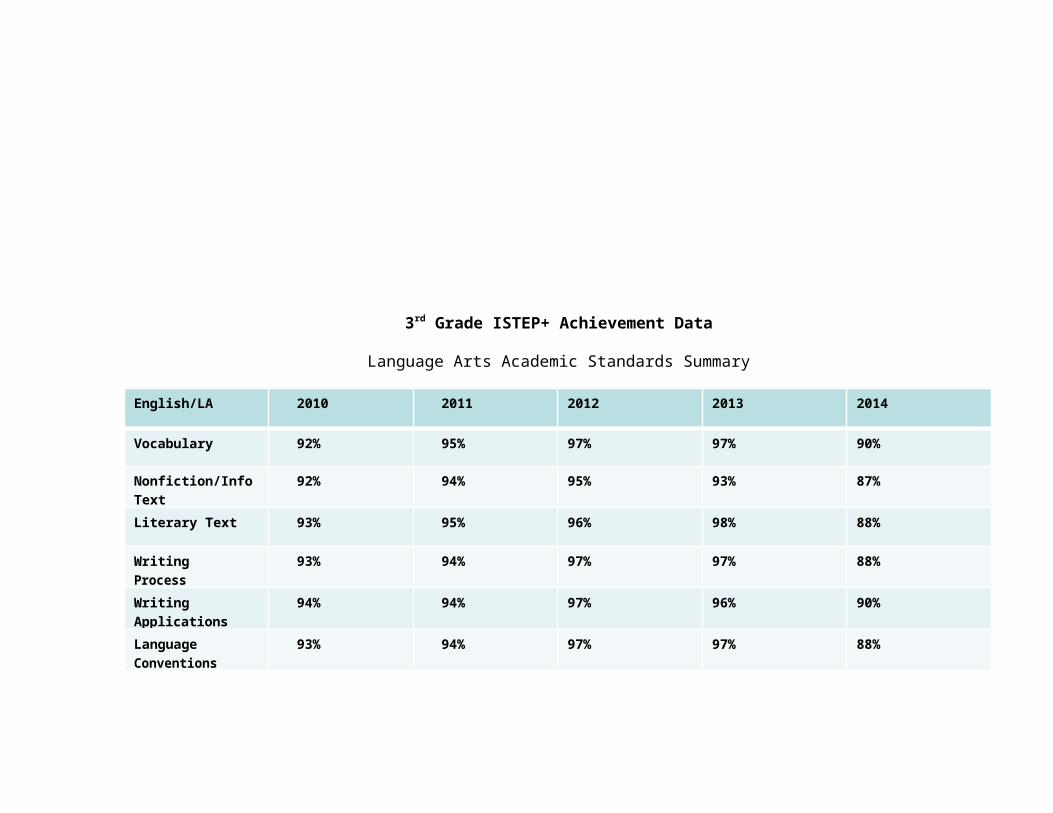
3rd Grade ISTEP+ Achievement Data
Language Arts Academic Standards Summary
English/LA 2010 2011 2012 2013 2014
Vocabulary 92% 95% 97% 97% 90%
Nonfiction/Info Text
92% 94% 95% 93% 87%
Literary Text 93% 95% 96% 98% 88%
Writing Process 93% 94% 97% 97% 88%
Writing Applications
94% 94% 97% 96% 90%
Language Conventions
93% 94% 97% 97% 88%
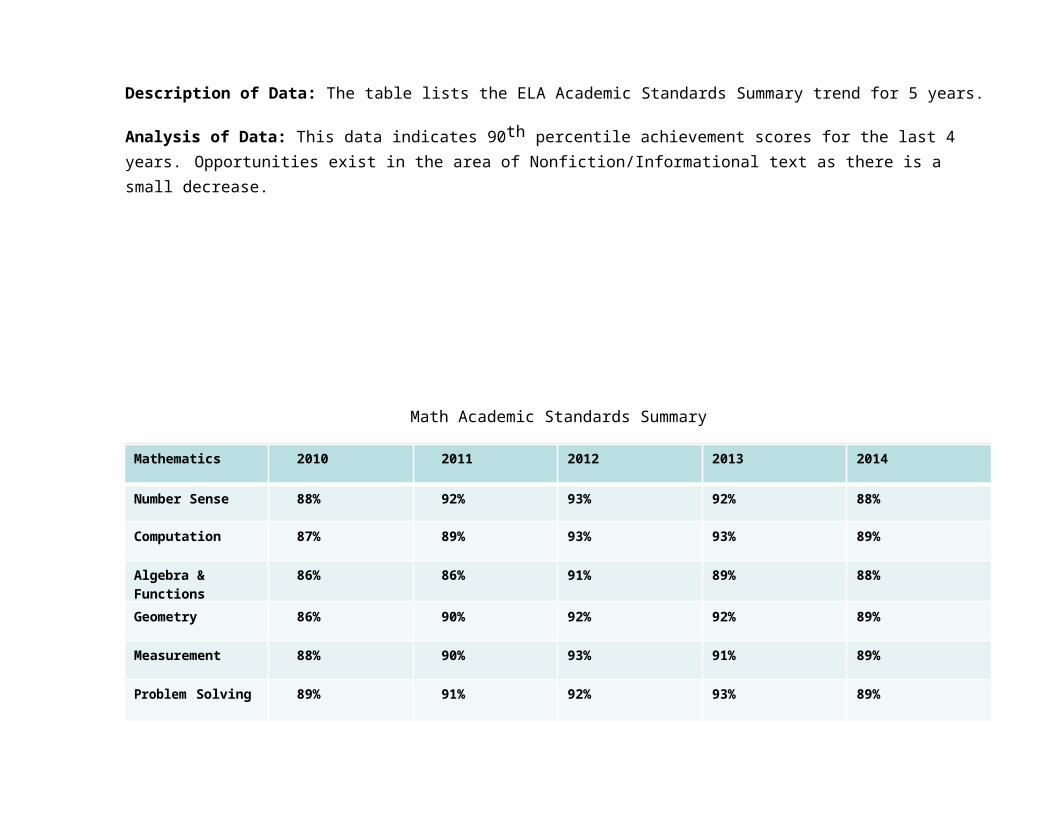
Description of Data: The table lists the ELA Academic Standards Summary trend for 5 years.
Analysis of Data: This data indicates 90th percentile achievement scores for the last 4 years. Opportunities exist in the area of Nonfiction/Informational text as there is a small decrease.
Math Academic Standards Summary
Mathematics 2010 2011 2012 2013 2014
Number Sense 88% 92% 93% 92% 88%
Computation 87% 89% 93% 93% 89%
Algebra & Functions
86% 86% 91% 89% 88%
Geometry 86% 90% 92% 92% 89%
Measurement 88% 90% 93% 91% 89%
Problem Solving 89% 91% 92% 93% 89%
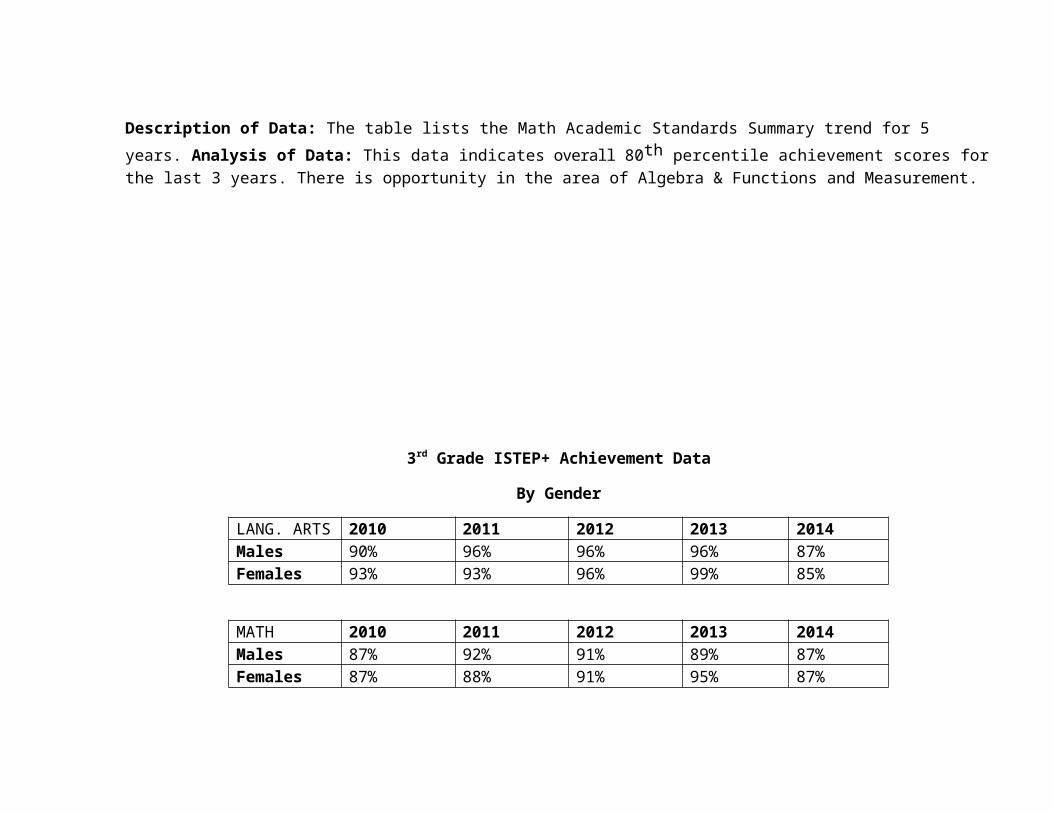
Description of Data: The table lists the Math Academic Standards Summary trend for 5 years. Analysis of Data: This data indicates overall 80th percentile achievement scores for the last 3 years. There is opportunity in the area of Algebra & Functions and Measurement.
3rd Grade ISTEP+ Achievement Data
By Gender
LANG. ARTS 2010 2011 2012 2013 2014Males 90% 96% 96% 96% 87%Females 93% 93% 96% 99% 85%
MATH 2010 2011 2012 2013 2014Males 87% 92% 91% 89% 87%Females 87% 88% 91% 95% 87%
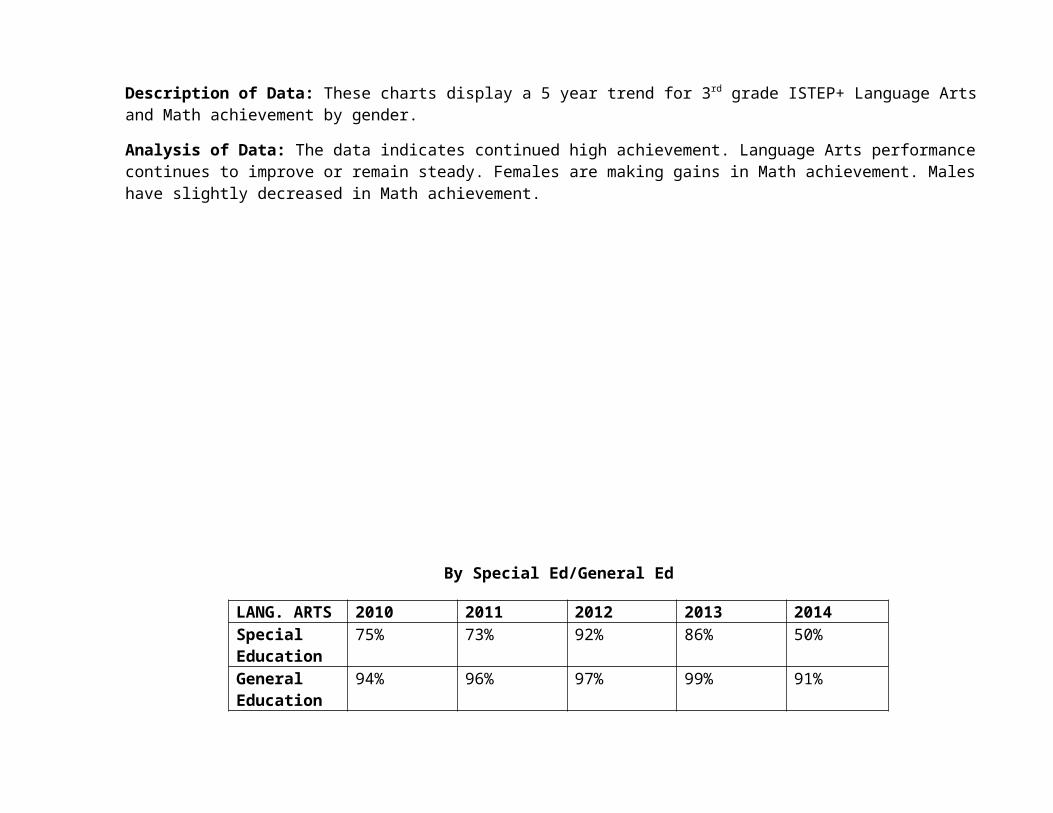
Description of Data: These charts display a 5 year trend for 3rd grade ISTEP+ Language Arts and Math achievement by gender.
Analysis of Data: The data indicates continued high achievement. Language Arts performance continues to improve or remain steady. Females are making gains in Math achievement. Males have slightly decreased in Math achievement.
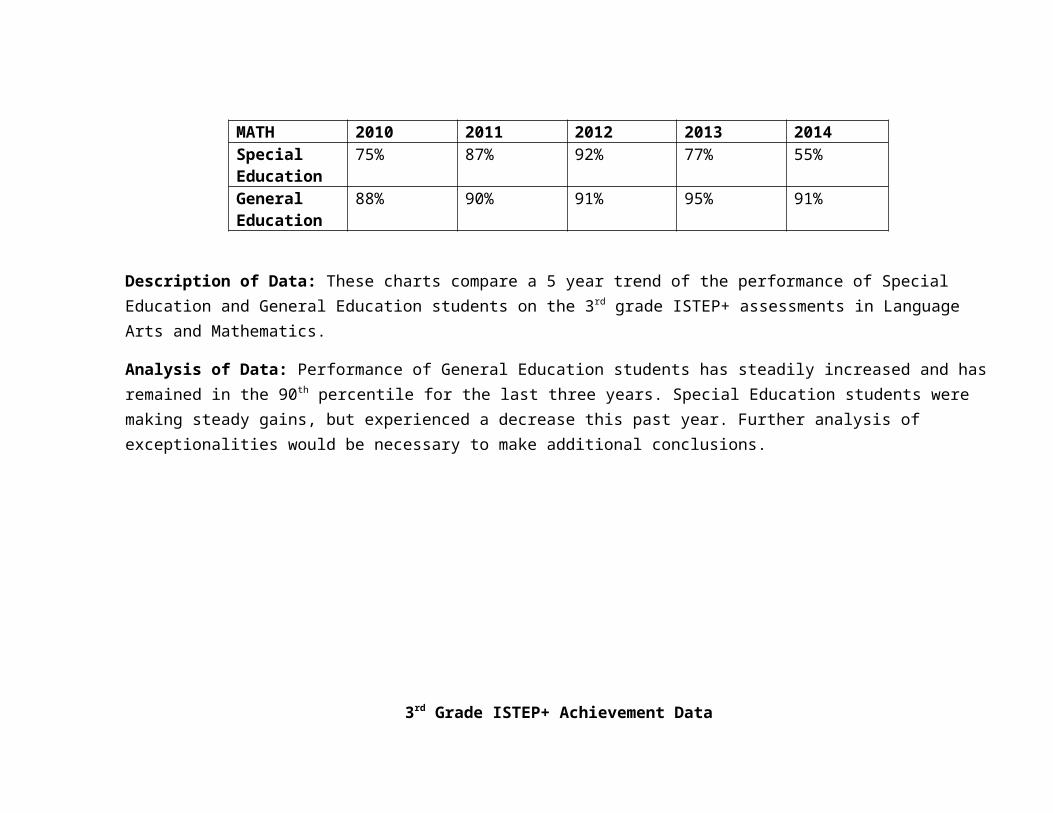
By Special Ed/General Ed
LANG. ARTS 2010 2011 2012 2013 2014Special Education
75% 73% 92% 86% 50%
General Education
94% 96% 97% 99% 91%
MATH 2010 2011 2012 2013 2014Special Education
75% 87% 92% 77% 55%
General Education
88% 90% 91% 95% 91%
Description of Data: These charts compare a 5 year trend of the performance of Special Education and General Education students on the 3rd grade ISTEP+ assessments in Language Arts and Mathematics.
Analysis of Data: Performance of General Education students has steadily increased and has remained in the 90 th percentile for the last three years. Special Education students were making steady gains, but experienced a decrease this past year. Further analysis of exceptionalities would be necessary to make additional conclusions.
3rd Grade ISTEP+ Achievement Data
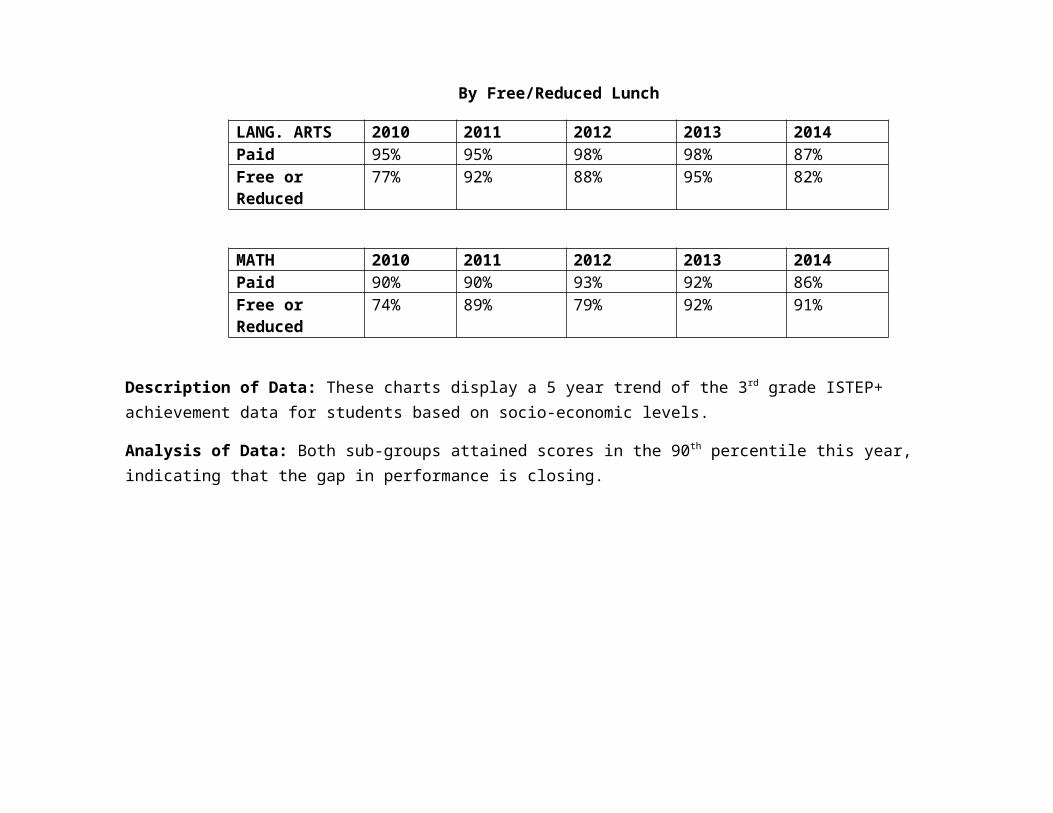
By Free/Reduced Lunch
LANG. ARTS 2010 2011 2012 2013 2014Paid 95% 95% 98% 98% 87%Free or Reduced
77% 92% 88% 95% 82%
MATH 2010 2011 2012 2013 2014Paid 90% 90% 93% 92% 86%Free or Reduced
74% 89% 79% 92% 91%
Description of Data: These charts display a 5 year trend of the 3rd grade ISTEP+ achievement data for students based on socio-economic levels.
Analysis of Data: Both sub-groups attained scores in the 90th percentile this year, indicating that the gap in performance is closing.
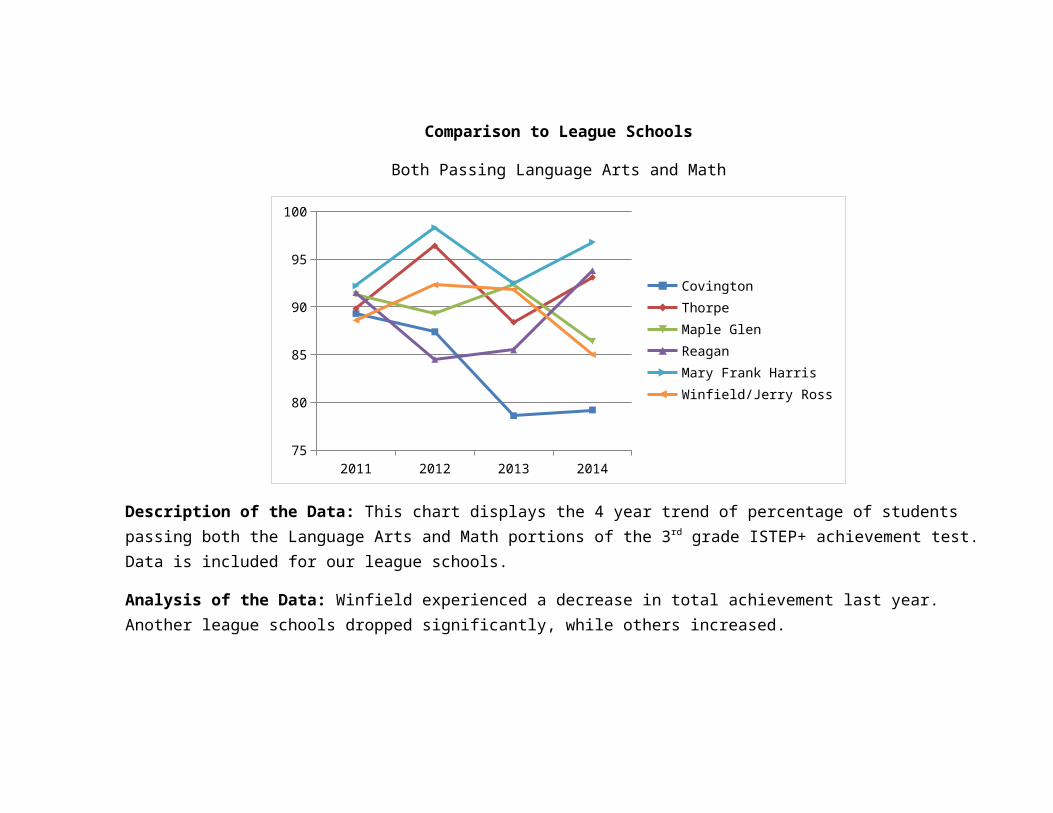
Comparison to League Schools
Both Passing Language Arts and Math
2011 2012 2013 201475
80
85
90
95
100
CovingtonThorpeMaple GlenReaganMary Frank HarrisWinfield/Jerry Ross
Description of the Data: This chart displays the 4 year trend of percentage of students passing both the Language Arts and Math portions of the 3rd grade ISTEP+ achievement test. Data is included for our league schools.
Analysis of the Data: Winfield experienced a decrease in total achievement last year. Another league schools dropped significantly, while others increased.
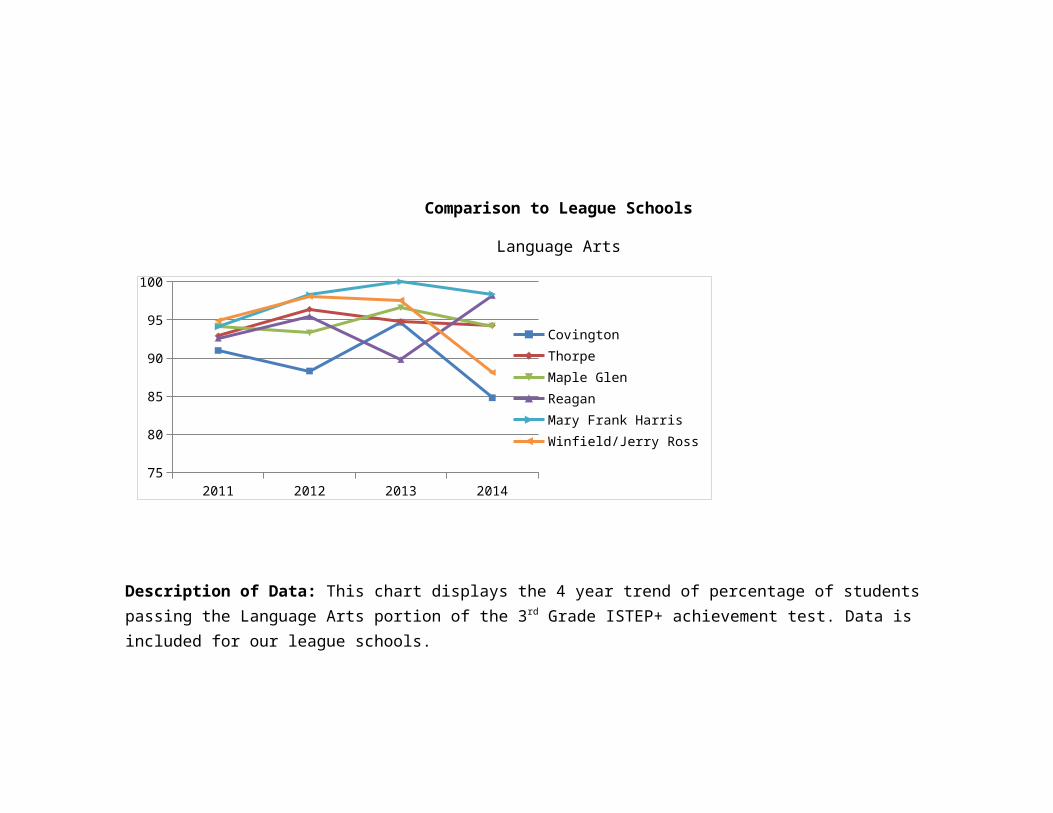
Comparison to League Schools
Language Arts
Description of Data: This chart displays the 4 year trend of percentage of students passing the Language Arts portion of the 3rd Grade ISTEP+ achievement test. Data is included for our league schools.
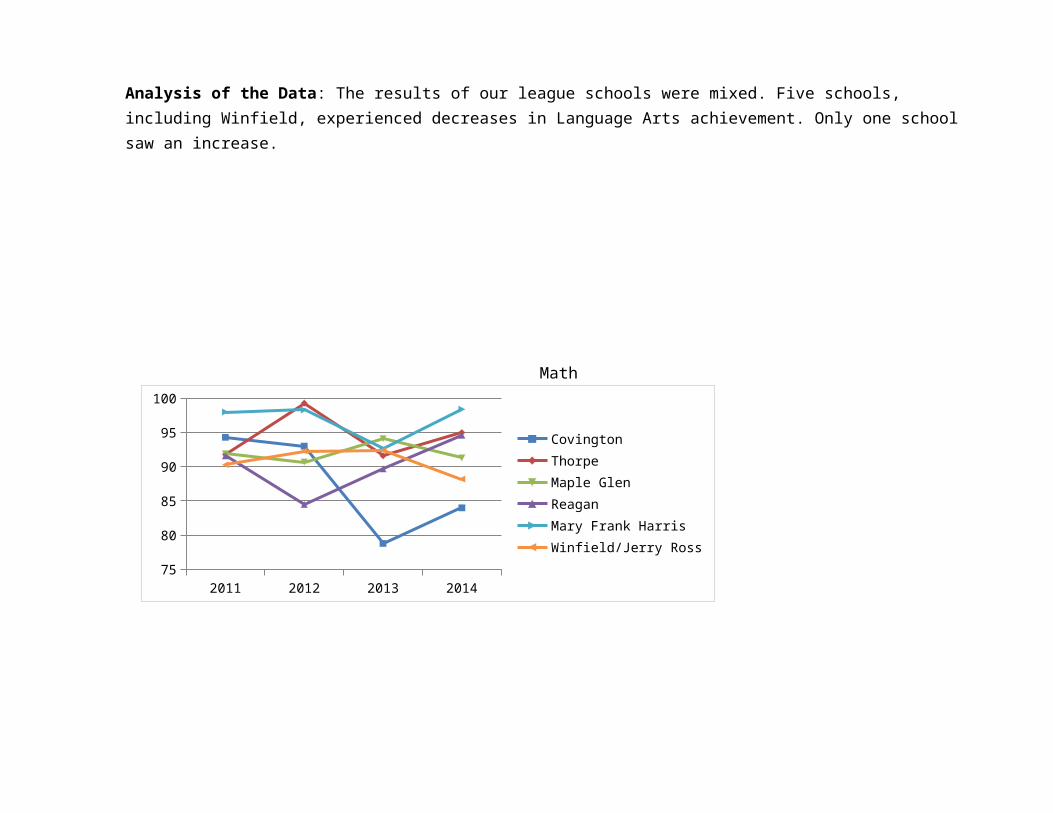
Analysis of the Data: The results of our league schools were mixed. Five schools, including Winfield, experienced decreases in Language Arts achievement. Only one school saw an increase.
Math
2011 2012 2013 201475
80
85
90
95
100
CovingtonThorpeMaple GlenReaganMary Frank HarrisWinfield/Jerry Ross
2011 2012 2013 201475
80
85
90
95
100
CovingtonThorpeMaple GlenReaganMary Frank HarrisWinfield/Jerry Ross
Description of the Data: This chart displays the 4 year trend data for the percentage of students passing the math portion of the 3rd Grade ISTEP+ achievement test. Data for our league schools is included.
Analysis of Data: Our performance was in the middle of our league. Two schools decreased, and four improved.
1st Grade Terra Nova-Language Arts
2011 2012 2013 201475
80
85
90
95
100
CovingtonThorpeMaple GlenReaganMary Frank HarrisWinfield/Jerry Ross
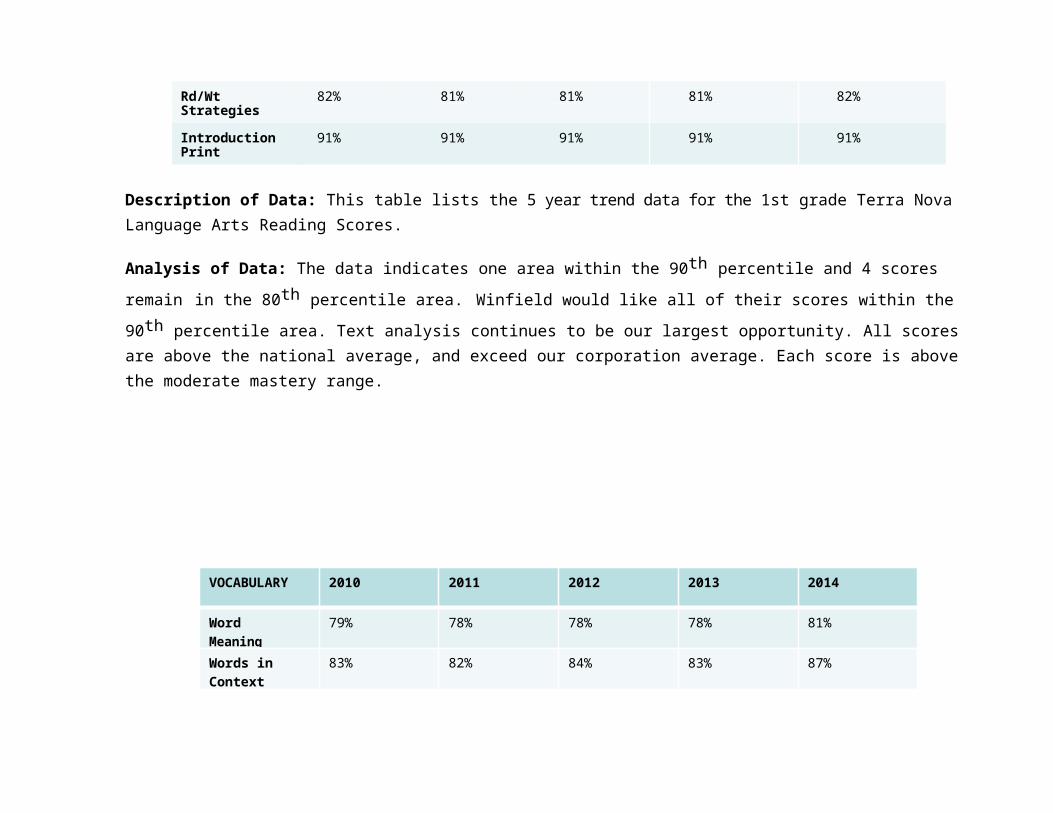
READING 2010 2011 2012 2013 2014
Oral 86% 86% 86% 85% 87%Comprehension
Basic 89% 90% 90% 89% 89%Understanding
Analyze 81% 80% 80% 80% 81%Text
Rd/Wt 82% 81% 81% 81% 82%Strategies
Introduction to 91% 91% 91% 91% 91%Print
Description of Data: This table lists the 5 year trend data for the 1st grade Terra Nova Language Arts Reading Scores.
Analysis of Data: The data indicates one area within the 90th percentile and 4 scores remain in the 80th percentile area.
Winfield would like all of their scores within the 90th percentile area. Text analysis continues to be our largest opportunity. All scores are above the national average, and exceed our corporation average. Each score is above the moderate mastery range.
VOCABULARY 2010 2011 2012 2013 2014
Word Meaning
79% 78% 78% 78% 81%
Words in Context
83% 82% 84% 83% 87%
Description of Data: The table lists the 5 year trend data for the 1st grade Terra Nova Language Arts Vocabulary Scores.
Analysis of Data: The data indicates significant growth from the previous years, and both scores are above the national average and above the moderate mastery range. Both scores are five year highs.
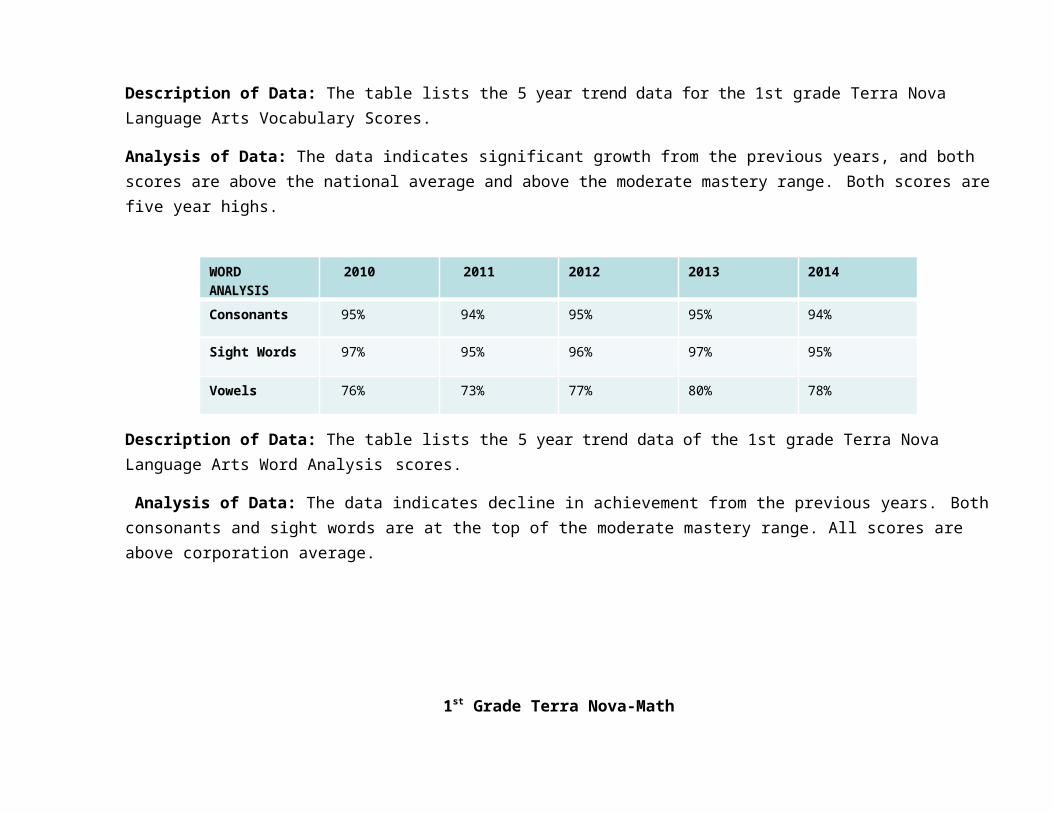
Description of Data: The table lists the 5 year trend data of the 1st grade Terra Nova Language Arts Word Analysis scores.
Analysis of Data: The data indicates decline in achievement from the previous years. Both consonants and sight words are at the top of the moderate mastery range. All scores are above corporation average.
1st Grade Terra Nova-Math
WORD ANALYSIS
2010 2011 2012 2013 2014
Consonants 95% 94% 95% 95% 94%
Sight Words 97% 95% 96% 97% 95%
Vowels 76% 73% 77% 80% 78%
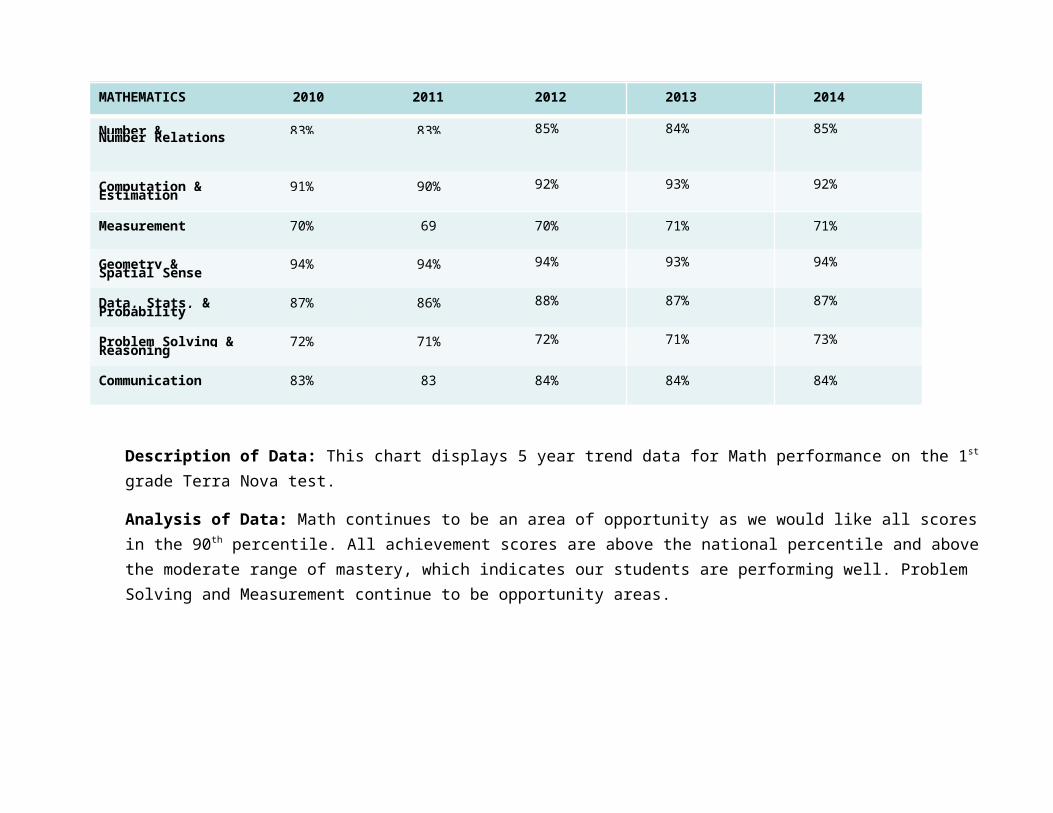
MATHEMATICS 2010 2011 2012 2013 2014
Number & 83% 83% 85% 84% 85%Number Relations
Computation & 91% 90% 92% 93% 92%Estimation
Measurement 70% 69 70% 71% 71%
Geometry & 94% 94% 94% 93% 94%Spatial Sense
Data, Stats, & 87% 86% 88% 87% 87%Probability
Problem Solving & 72% 71% 72% 71% 73%Reasoning
Communication 83% 83 84% 84% 84%
Description of Data: This chart displays 5 year trend data for Math performance on the 1st grade Terra Nova test.
Analysis of Data: Math continues to be an area of opportunity as we would like all scores in the 90 th percentile. All achievement scores are above the national percentile and above the moderate range of mastery, which indicates our students are performing well. Problem Solving and Measurement continue to be opportunity areas.
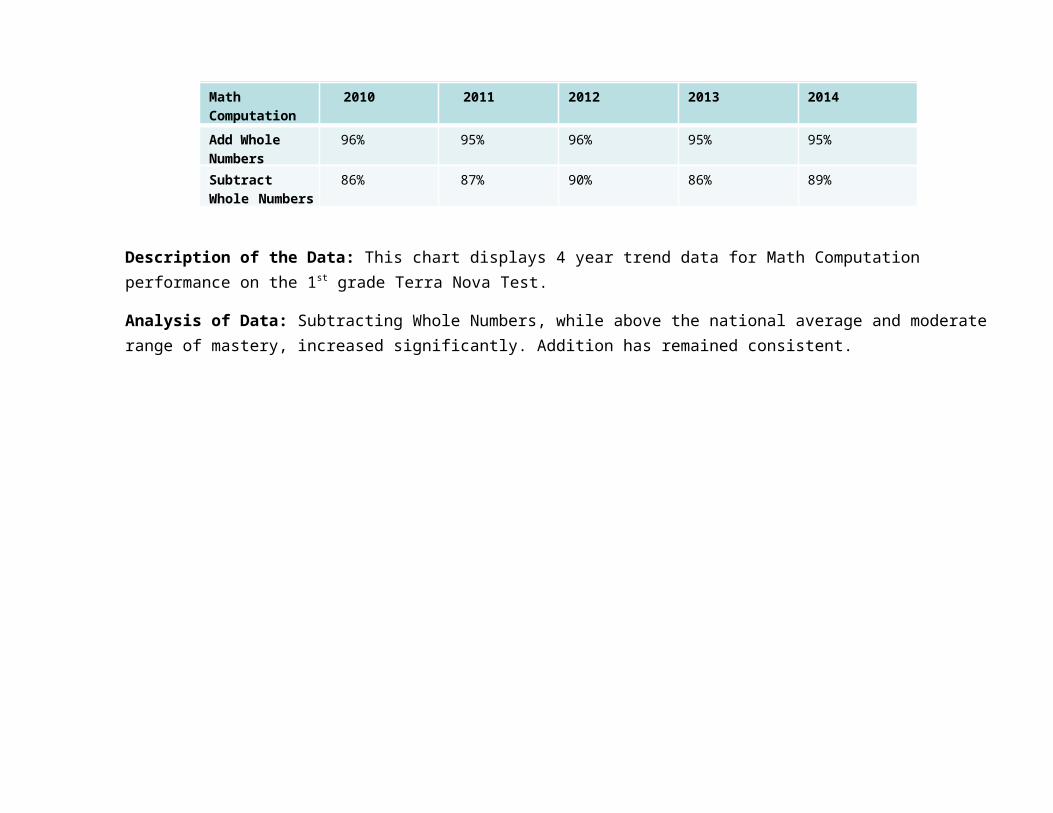
Math Computation
2010 2011 2012 2013 2014

Add Whole Numbers
96% 95% 96% 95% 95%
Subtract Whole Numbers
86% 87% 90% 86% 89%
Description of the Data: This chart displays 4 year trend data for Math Computation performance on the 1st grade Terra Nova Test.
Analysis of Data: Subtracting Whole Numbers, while above the national average and moderate range of mastery, increased significantly. Addition has remained consistent.
STAR Early Literacy- Kindergarten
Description of Data: This chart lists a 5 year trend data for the STAR Early Literacy scores for Probable, Transitional, and Emergent Readers for Full Day Kindergarten.
Analysis of Data: The data indicates large increase in the number of students who are Probable Readers. This may be a function of offering only full day kindergarten.
Kindergarten 2010 2011 2012 2013 2014
Probable Reader
13% 20% 9% 38% 49%
Transitional Reader
53% 40% 44% 47% 39%
Emergent Reader
34% 40% 47% 13% 12%
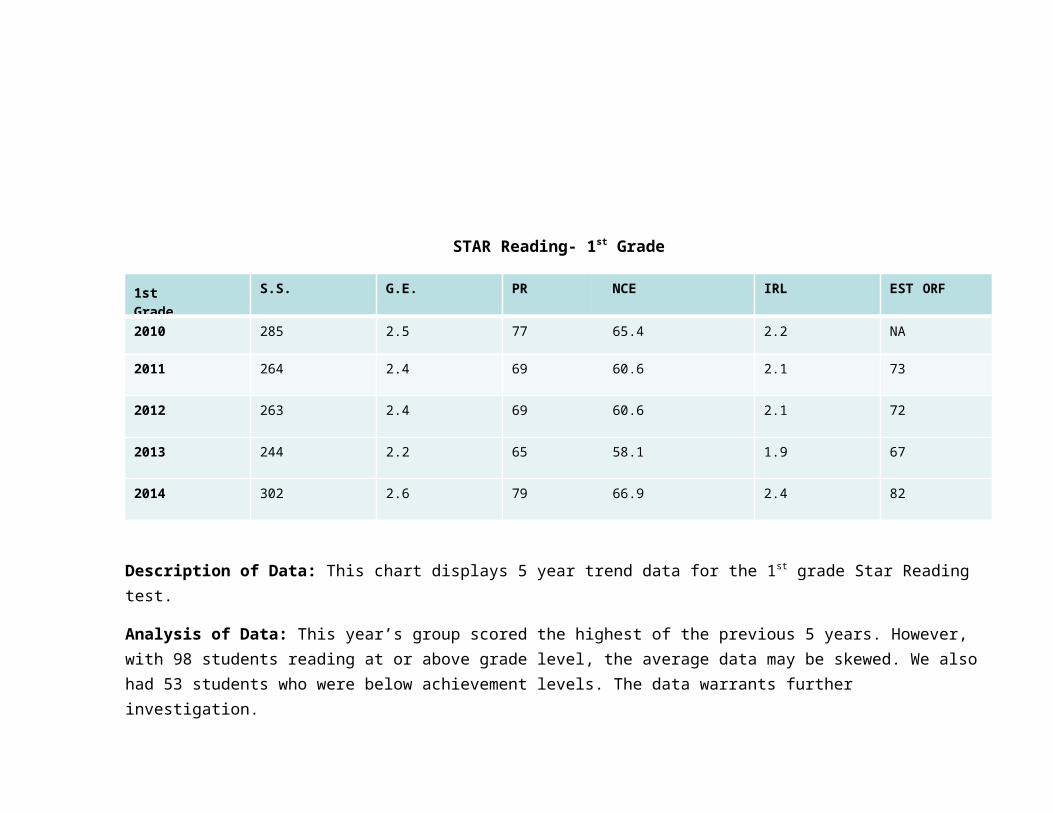
STAR Reading- 1st Grade
1stGrade
S.S. G.E. PR NCE IRL EST ORF
2010 285 2.5 77 65.4 2.2 NA
2011 264 2.4 69 60.6 2.1 73
2012 263 2.4 69 60.6 2.1 72
2013 244 2.2 65 58.1 1.9 67
2014 302 2.6 79 66.9 2.4 82
Description of Data: This chart displays 5 year trend data for the 1st grade Star Reading test.
Analysis of Data: This year’s group scored the highest of the previous 5 years. However, with 98 students reading at or above grade level, the average data may be skewed. We also had 53 students who were below achievement levels. The data warrants further investigation.
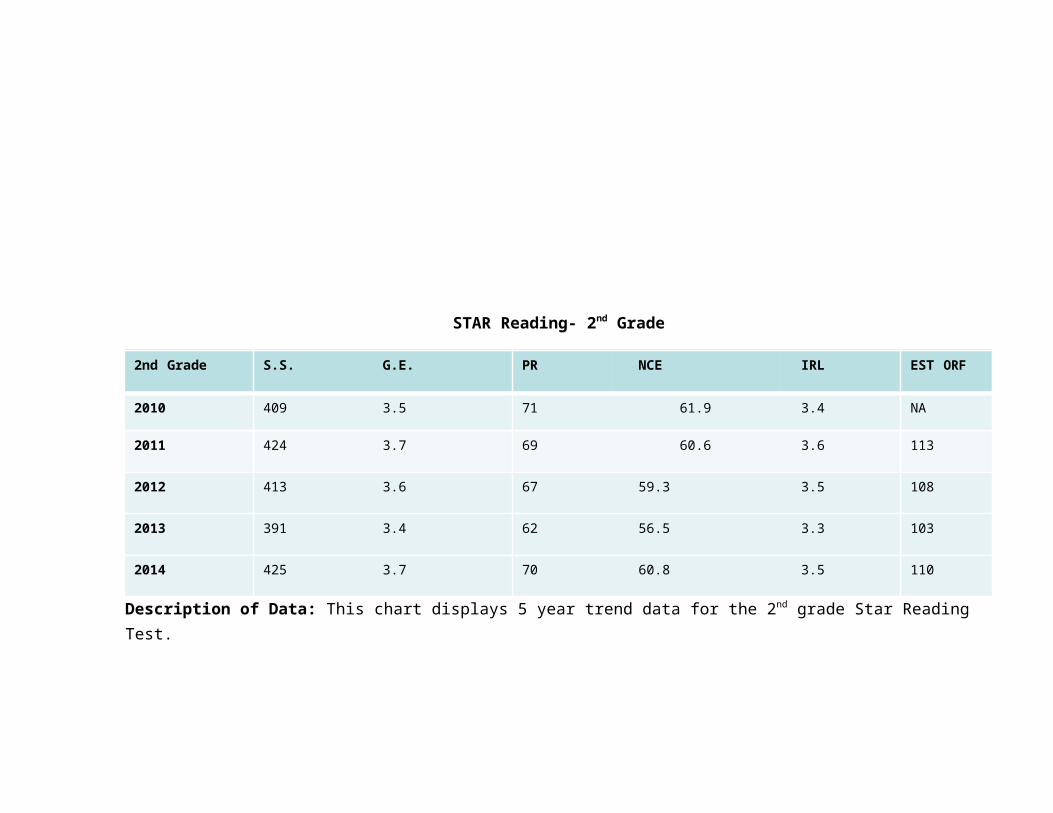
STAR Reading- 2nd Grade
2nd Grade S.S. G.E. PR NCE IRL EST ORF
2010 409 3.5 71 61.9 3.4 NA
2011 424 3.7 69 60.6 3.6 113
2012 413 3.6 67 59.3 3.5 108
2013 391 3.4 62 56.5 3.3 103
2014 425 3.7 70 60.8 3.5 110
Description of Data: This chart displays 5 year trend data for the 2nd grade Star Reading Test.
Analysis of Data: On average, grade 2 students returned to the achievement levels of 2011 and 2012. We had 120 students reading at or above grade level, and 38 who were below the benchmark.
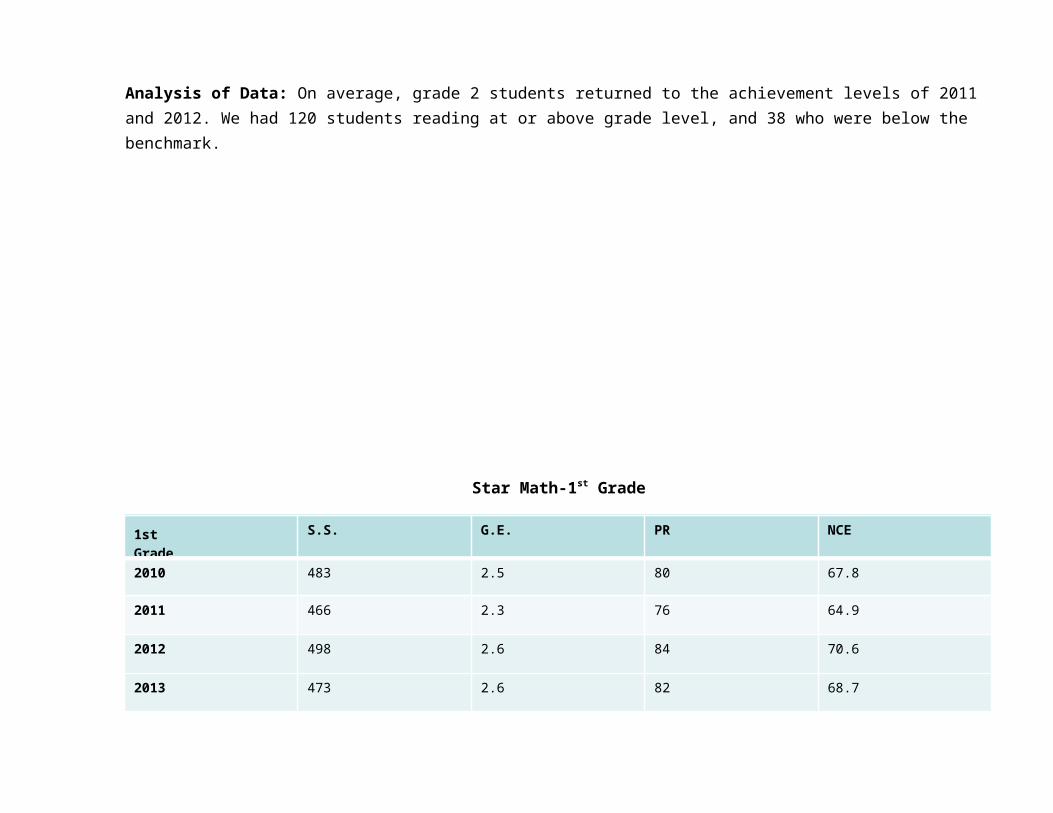
Star Math-1st Grade
1stGrade
S.S. G.E. PR NCE
2010 483 2.5 80 67.8
2011 466 2.3 76 64.9
2012 498 2.6 84 70.6
2013 473 2.6 82 68.7
2014 491 2.7 85 72
Description of Data: This chart displays a 5 year trend of math performance on the Star Math assessment for first graders.
Analysis of Data: This year’s achievement levels were the highest in the past 5 years. The benchmark for end of first grade is G.E. of 1.9. We are exceeding that goal. 20 students were below the benchmark, and 132 were at or above the benchmark.

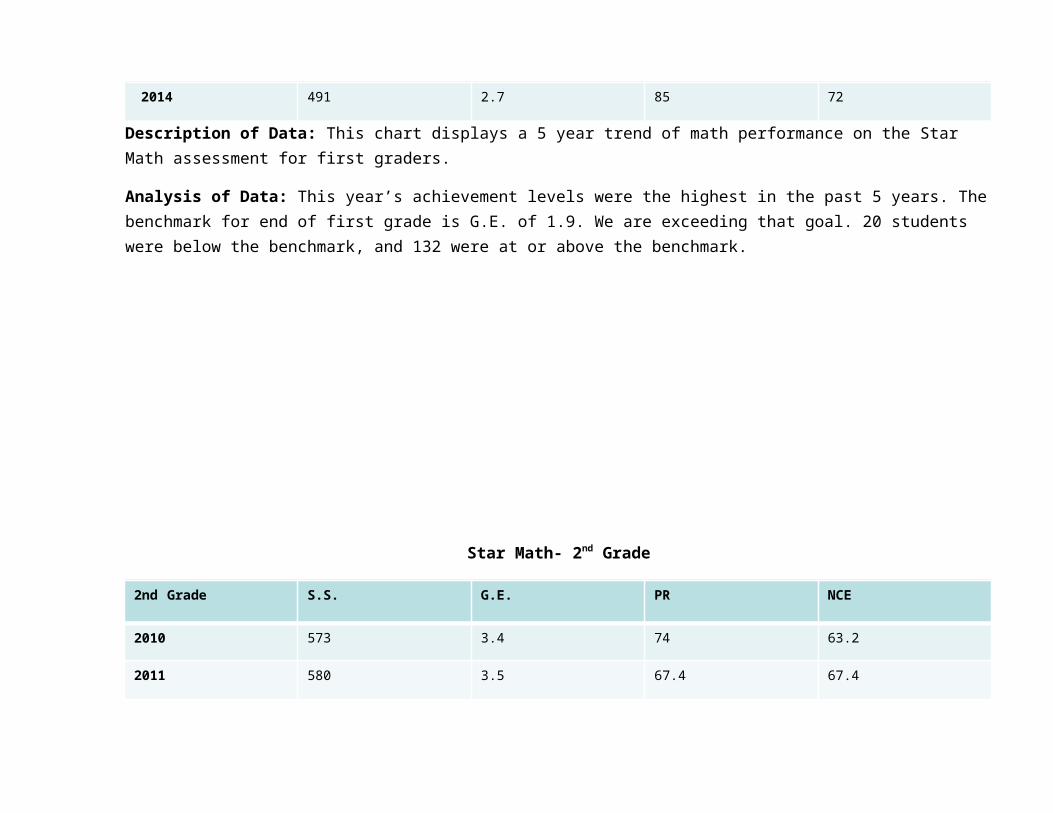
Star Math- 2nd Grade
2nd Grade S.S. G.E. PR NCE
2010 573 3.4 74 63.2
2011 580 3.5 67.4 67.4
2012 608 3.8 85 71.9
2013 588 3.8 84 70.8
2014 608 4.1 89 75.4
Description of Data: This chart displays a 5 year trend in math performance on the Star Math assessment for second graders.
Analysis of Data: Our achievement levels are the highest they’ve been in 5 years. The benchmark for end of second grade is G.E. of 2.9. We are exceeding that goal with 154 students at or above the benchmark.
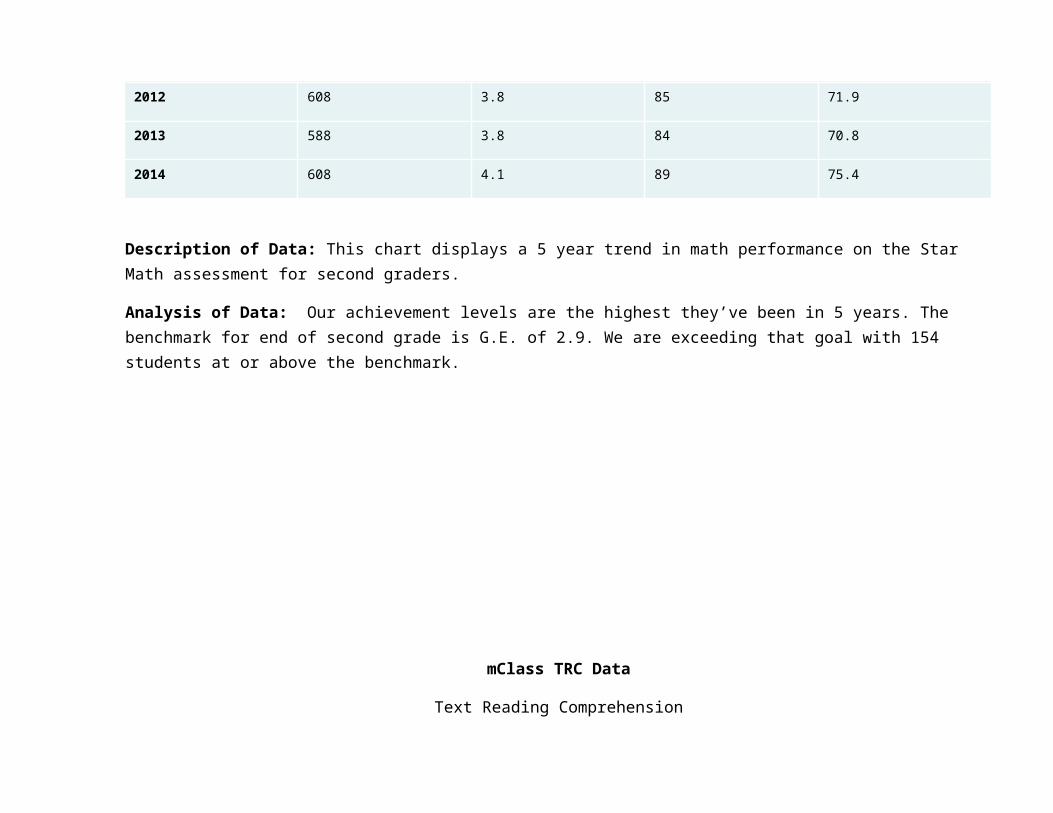
mClass TRC Data
Text Reading Comprehension
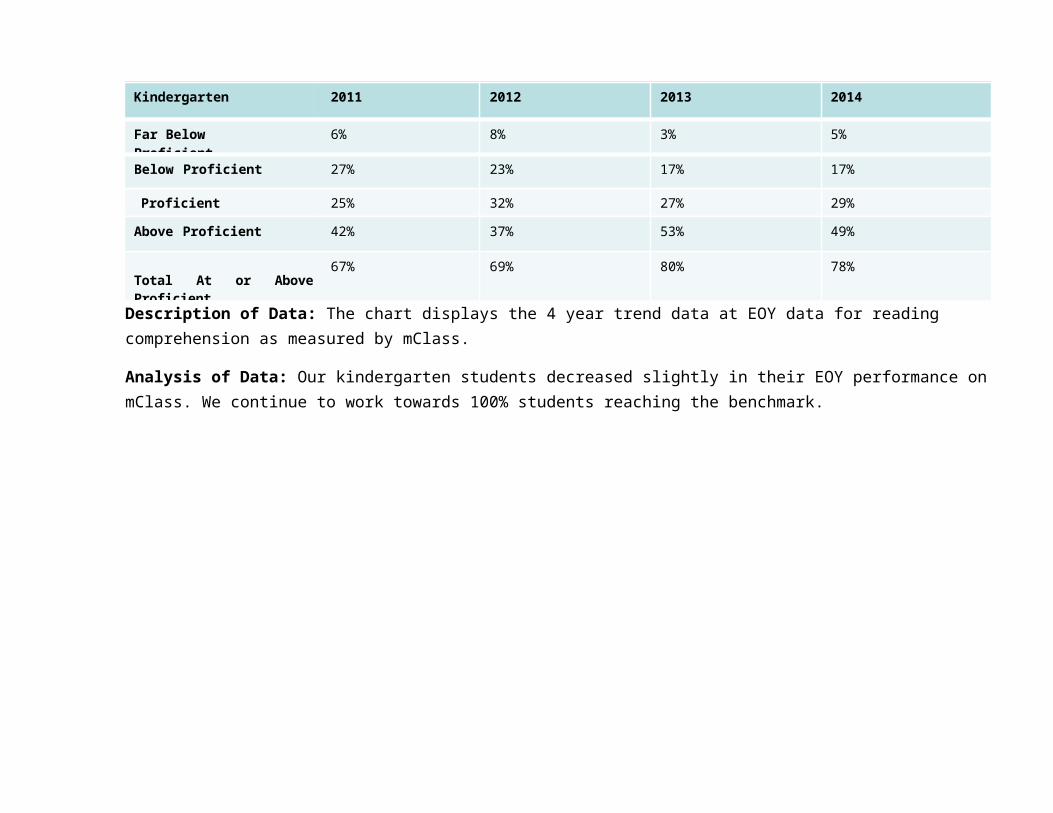
Kindergarten 2011 2012 2013 2014
Far Below Proficient 6% 8% 3% 5%
Below Proficient 27% 23% 17% 17%
Proficient 25% 32% 27% 29%
Above Proficient 42% 37% 53% 49%
Total At or Above Proficient67% 69% 80% 78%
Description of Data: The chart displays the 4 year trend data at EOY data for reading comprehension as measured by mClass.
Analysis of Data: Our kindergarten students decreased slightly in their EOY performance on mClass. We continue to work towards 100% students reaching the benchmark.
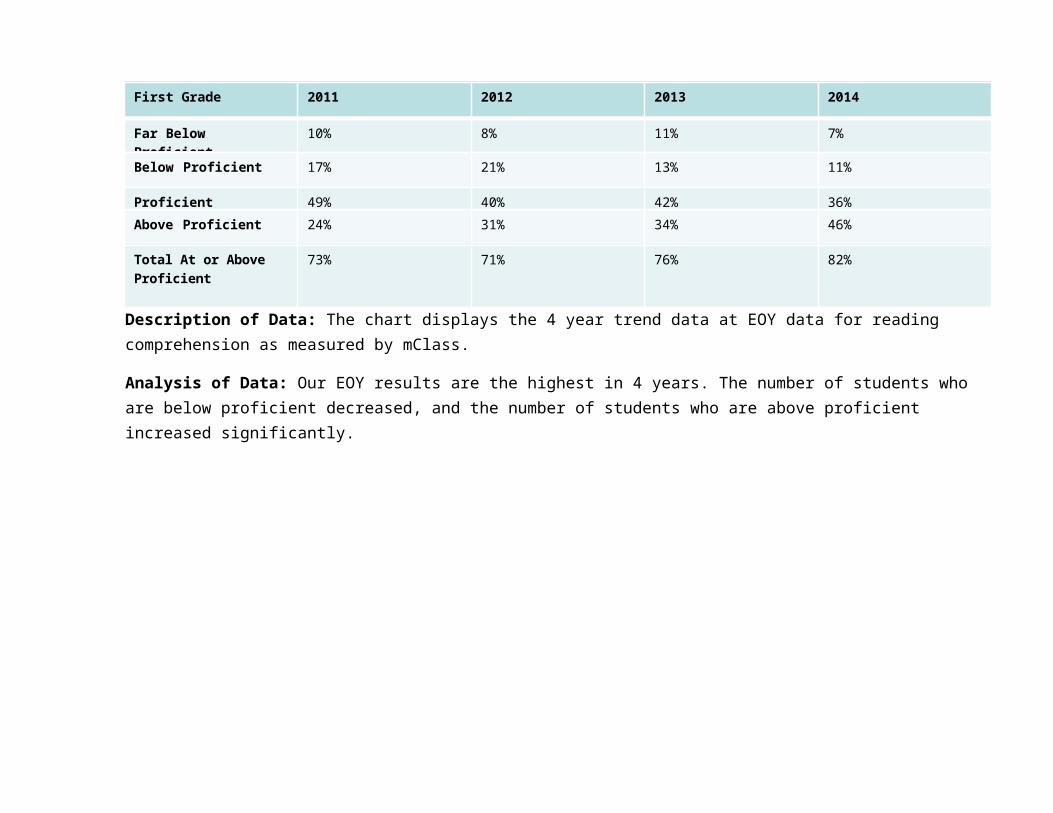
First Grade 2011 2012 2013 2014
Far Below Proficient 10% 8% 11% 7%
Below Proficient 17% 21% 13% 11%
Proficient 49% 40% 42% 36%
Above Proficient 24% 31% 34% 46%
Total At or Above Proficient
73% 71% 76% 82%
Description of Data: The chart displays the 4 year trend data at EOY data for reading comprehension as measured by mClass.
Analysis of Data: Our EOY results are the highest in 4 years. The number of students who are below proficient decreased, and the number of students who are above proficient increased significantly.
Second Grade 2011 2012 2013 2014
Far Below Proficient 4% 8% 8% 11%
Below Proficient 24% 30% 31% 26%
Proficient 12% 11% 16% 14%
Above Proficient 60% 51% 45% 49%
Total At or Above Proficient
72% 66% 61% 63%
Description of Data: This chart displays the 4 year trend data at EOY data for reading comprehension in second grade.
Analysis of Data: The total number of students meeting or exceeding the benchmark increased from last year, but not to earlier achievement levels. We must continue to investigate ways to improve reading comprehension at the second grade level.
RETENTIONS
2009 2010 2011 2012 2013 2014
2nd Grade 0 1 0 0 1 0
1st Grade 3 3 2 2 3 2
Kindergarten 1 0 3/TK1 1/TK1 1 1
Attendance Data
Comparison to League Schools
2010-2011 2011-2012 2012-2013 2013-2014
Covington 97.4% 97.3% 97.2% 96.3%
Thorpe 97.2% 97.0% 96.4% 97.2%
Maple Glen 96.9% 97.1% 96.6 % 97.7%
Reagan 97.0% 97.5% 97.3% 97.7%
M Frank Harris 97.0% 97.1% 96.4% 97.0%
Winfield 96.3% 96.8% 96.0% 96.6%
Description of Data: This chart displays 3 year trend data for attendance at Winfield and league schools.
Analysis of Data: Winfield attendance is the lowest of the league schools. The grade configuration, K-2, is unique to Winfield. We find that younger students have poorer attendance. Parents are more apt to keep children home for minor ailments. We have planning to do to improve our school attendance rate.
5. School Data
Description and Location of Curriculum
The Crown Point Community School Corporation previously developed the curriculum vertically and horizontally to the Indiana Standards but is currently revising the curriculum to meet the Common Core Standards. The curriculum will then be articulated through the Content Standards and Essential Understandings which define the important knowledge and skills that all students must acquire at each grade level.
District textbook selection and adoption schedules now follow the Indiana Standards and CommonCore Standards for textbook adoption. The state approved textbooks are displayed at central office. A committee of teachers, administrators, and parents review and evaluate textbook materials. When a selection is completed, a recommendation is sent to the Crown Point Corporation School Board.
Language Arts – The Language Arts Curriculum involves the student in lifetime learning skills such as reading, writing, speaking, and listening. A variety of resources are used including: state adopted textbook series, student journals, writing portfolios, newspaper, and community resource people. Student activities may include reading buddies, guided reading groups, and opportunities for public speaking. Student needs are met with a variety of basic, average, and challenging reading and writing materials. Students participate in the Accelerated Reading Program and Reading and Writing Assessments throughout the school year.
Mathematics – The Mathematics Curriculum prepares students for a lifetime of learning with a variety of resources – computer software programs, calculators, economy units, textbook series, and hands-on materials. Basic math skills are developed in all students with a variety of techniques. Critical problem solving is also developed through inquiry-based instructional practices.
Social Studies – The Social Studies Curriculum develops citizenship, positive values, and beliefs through the studies of information provided in the state adopted textbooks, supplemental materials, videos, speakers, presentations, and field trips. Each student is required to complete a Social Studies Performance Task.
Science – The Science Curriculum uses a “hands-on” approach with FOSS Modules. The students demonstrate their learning in a variety of ways that require many dimensions of cognitive performance. In addition, community programs such as the EnvironMobile support environmental life skills.
Health – The Health Curriculum provides our students with the skills that should lead them to responsible health behaviors. Our students develop both knowledge and skills to avoid health risks now and in the future. The students are presented with information from the state adopted textbook, health videos, and community safety programs. Community health centers present real life demonstrations on hand washing, germ control, dental care, and general body care.
Music – The Music Curriculum provides a variety of experiences that allow students to experience the many facets of musical skills such as singing, playing instruments, listening, creating, and performing. The sequential progression of music education provides for the understanding and appreciation of music concepts such as rhythm, melody, harmony, form, an expressive elements. Students culminate their learning with musical performances. The curriculum is supported by a textbook series and video programming.
Art – The Art Curriculum provides for the progression and sequence of skills and the promotion of the understanding of the elements and principles of art. The students have their work displayed within the school, central office, and local community art centers. The curriculum is supported by a textbook series and video programming.
Physical Education – The Physical Education Curriculum fosters the sequential progression of motor, cognitive, emotional, and social development. Our program is flexible and designed to accommodate individual differences. Planned programs and instructional strategies are used to provide success-oriented experiences.
The Crown Point Community School Corporation curriculum is available for review on the Corporation Web Site. All subject areas K – 12 are available to the public.
Description of Resources Used
LANGUAGE ARTS Daily Five, Café, Junior Great Books, Journal Writing, Six Trait Writing, Accelerated Reading, Houghton Mifflin Reading Series, Reading A – Z, Raz-Kids, Guided Reading , Weekly Magazines, Drops in the Bucket Reading, Scott Foresman Spelling, Modern Curriculum Press Phonics, Tucker Signing PhonicsLeveled Literacy, Daily Oral Language, Language Arts Software Program (Sight Words and RAZ), Literacy Work Stations, Whole Brain Teaching, BOOK ITMATHEveryday Math, Inquiry Math Lessons, Computation Software – Math Facts in a Flash, Dreambox Software, Drops in the Bucket Problem Solving, Daily Math
Problems, Daily Oral Math, Xtra Math
HEALTHMcGraw Hill Health Series, Hand Washing Presentation, Dental Hygienist Presentation, Field Trips (Tri Town Safety Village)
SOCIAL STUDIES K - Scott Foresman Big Book & Weekly Readers, 1st – Macmillan McGraw Hill Big Book, 2nd – Houghton Mifflin Books, CPCSC Social Studies Performance Task, Guest Speakers, Junior Achievement, Field Trips ( Apple Orchard)
SCIENCE FOSS Science, Lab Experiences, 4-H Embryology, EnvironMobile, Buzz Engram/NIPSCO, Field Trips (Museum, Zoo), Lake County Soil and Water Conservation District
ART Art Textbook Series, Art Displays, Art Website, Creative Arts Fair, Young Rembrandts
MUSIC Music Textbook Series, Grade Level Music Presentations, Creative Arts Fair
PHYSICAL EDUCATION Physical Education Curriculum, Field Day, Jump Rope for Heart, Kiddie 500
Description of PBIS
PBIS Paraprofessional – Our school has a PBIS Paraprofessional on site every day. The paraprofessional promotes, maintains, and provides direct lines of communications between the home and school personnel with regard to the social, interpersonal, safety, and general well-being of our students.
PAWS – PAWS is an evidenced based plan for improving discipline and behavior within our school. It includes a way to teach, support, and acknowledge positive behavior expectations that are embedded in the school culture. The plan uses a graduated discipline system to ensure that serious behaviors that may threaten school safety are met with severe consequences, but more minor misbehavior and disruption is dealt with through less severe interventions. The program is supported by a PBIS paraprofessional who is directly responsible for the implementation of our Tiered behavioral process.
Description of Assessments
FORMATIVE ASSESSMENT
mClass:Reading 3D and mClass Math assessments provide early screening for Grades K-2. These assessments are predictors to ISTEP+ achievement success.
STANDARDIZED TESTS The Terra Nova Multiple Assessment is taken by first graders in the spring of the school year. These assessment
results are used to: Provide a comprehensive record of the student’s achievement. Provide a source of information for instructional planning specific to the student. Describe achievement in terms of National Percentiles. Determine areas of strength and need. Provide a record for students in a class. Evaluate individual and group achievement compared to the nation and the local program. Provide analysis of group objectives mastery using the percent of students mastering each objective and
average Objectives Performance Indexes (OPI). Analyze curriculum strengths and areas of need. Gives administrators narrative and graphical information to evaluate the overall effectiveness of the
educational program. Provide information about group performance in norm-referenced terms for instructional planning.
SCHOOL ASSESSMENTS School assessments are taken by students during the School year Star Reader Computerized Assessment – Grades one and two. Reports: Reading
Range/Diagnostic/Growth/Snapshot/Parent Each Star Test is tailored to the student and selectively adjusts each question to the student’s ability level.
The Snapshot Report groups students into low, average, and high groups. The Growth Report delineates pre and post test scores with graphical growth data.
Star Math Computerized Assessment – First and Second Grade.
Reports: Math Range/Diagnostic/Growth/Snapshot/Parent
Star Early Literacy Computerized Assessment – Kindergarten and First Grade.The Star Early Literacy for Reading Readiness is used during the School year and identifies three levels of young readers: Emergent; Transitional; Probable. These assessments are used to measure progress and refine instruction. Seven areas are assessed: General Readiness; Graphophonemic; Knowledge; Phonemic Awareness; Phonics; Structural Analysis; Vocabulary; Comprehension.
Content Assessment – Grades kindergarten to two. Textbook Assessments are given at appropriate times to measure proficiency of skills.
EPSF – Kindergarten Entrance Assessment
The Early Prevention of School Failure is designed to encourage School success for all kindergarten students. This screening test is administered in the spring prior to the student’s kindergarten year. The screening program assesses five important skill areas: Gross Motor; Fine Motor; Visual; Auditory; Language.
Teacher Assessments – Kindergarten, First and Second Grade Performance Tasks – Kindergarten, First and Second Grade Peabody Assessment – Kindergarten and TK1 Placement. Writing Prompts – Kindergarten, First and Second Grade Math Assessments – Kindergarten, First and Second Grade District Social Studies Performance Tasks – Kindergarten, First and Second

Description of Instructional Practices
Direct Instruction
Lecture Drill and Practice Guided Instruction Shared Instruction Whole Group Small Group
Indirect Instruction
Inquiry Concept Formation
Experiential
Role Playing Field Trips Assemblies
Interactive
Brainstorming Peer Partner Learning Think Pair Share Brain-Based Learning Problem Solving
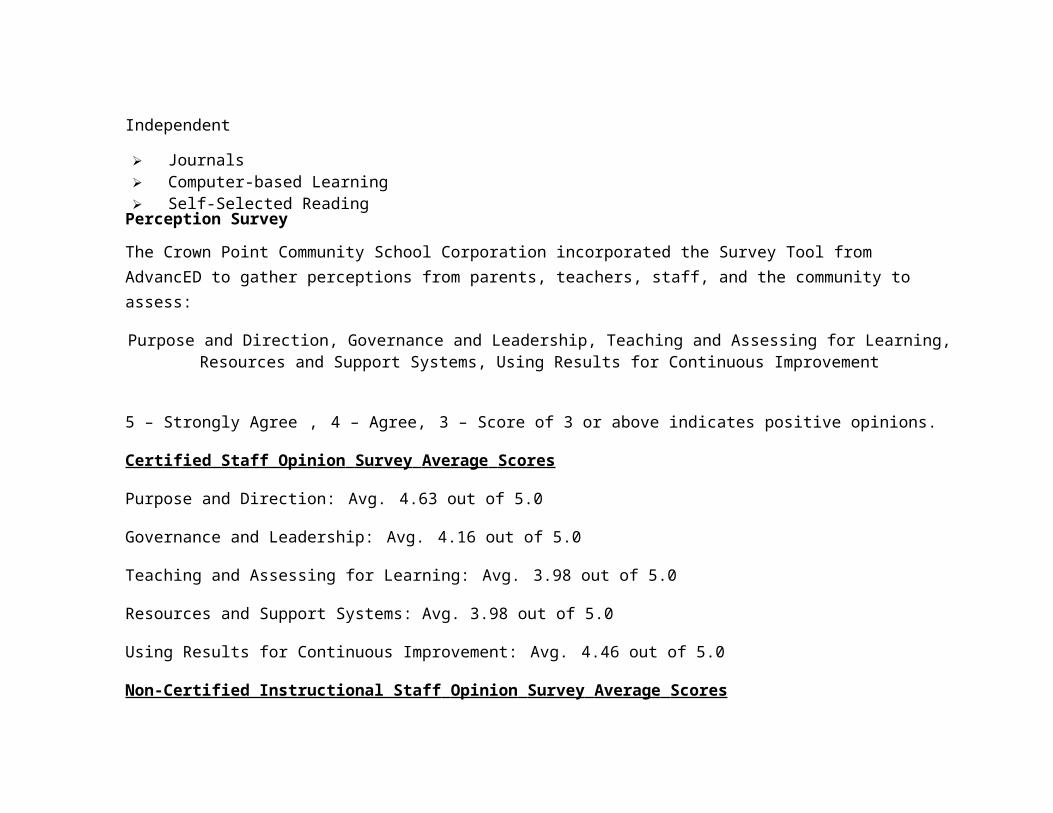
Independent
Journals Computer-based Learning Self-Selected Reading
Perception Survey
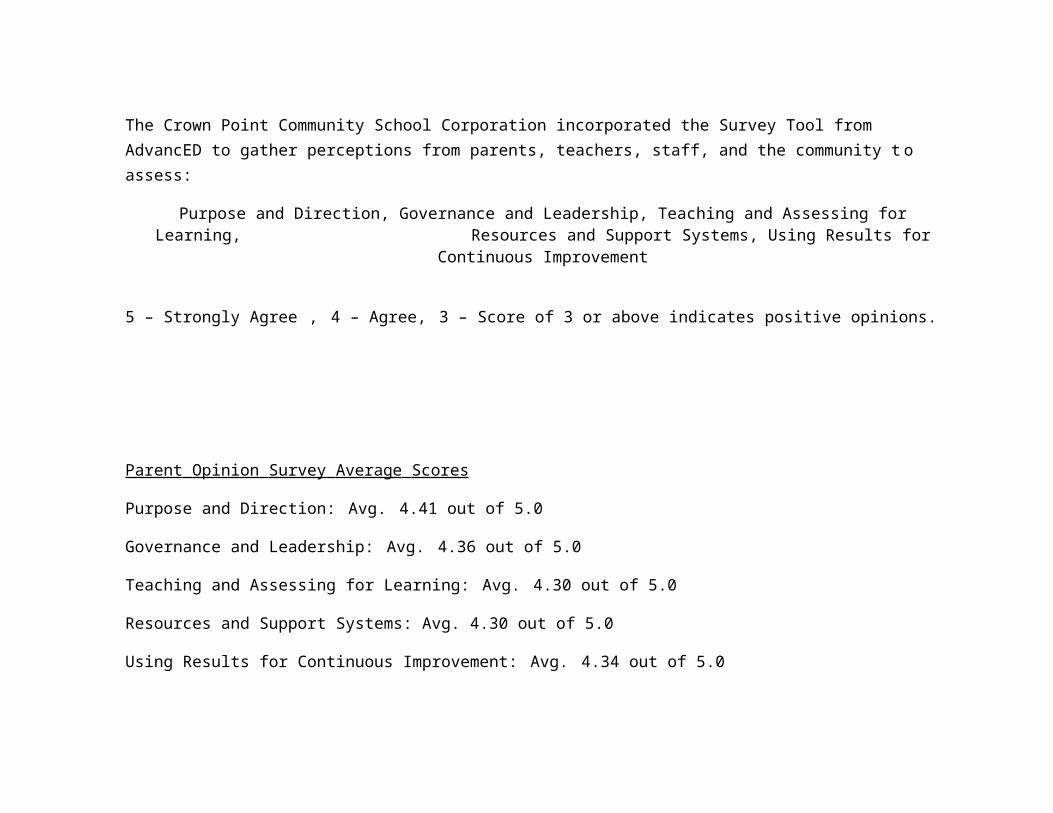
The Crown Point Community School Corporation incorporated the Survey Tool from AdvancED to gather perceptions from parents, teachers, staff, and the community to assess:
Purpose and Direction, Governance and Leadership, Teaching and Assessing for Learning, Resources and Support Systems, Using Results for Continuous Improvement
5 – Strongly Agree , 4 – Agree, 3 – Score of 3 or above indicates positive opinions.
Certified Staff Opinion Survey Average Scores
Purpose and Direction: Avg. 4.63 out of 5.0
Governance and Leadership: Avg. 4.16 out of 5.0
Teaching and Assessing for Learning: Avg. 3.98 out of 5.0
Resources and Support Systems: Avg. 3.98 out of 5.0
Using Results for Continuous Improvement: Avg. 4.46 out of 5.0
Non-Certified Instructional Staff Opinion Survey Average Scores
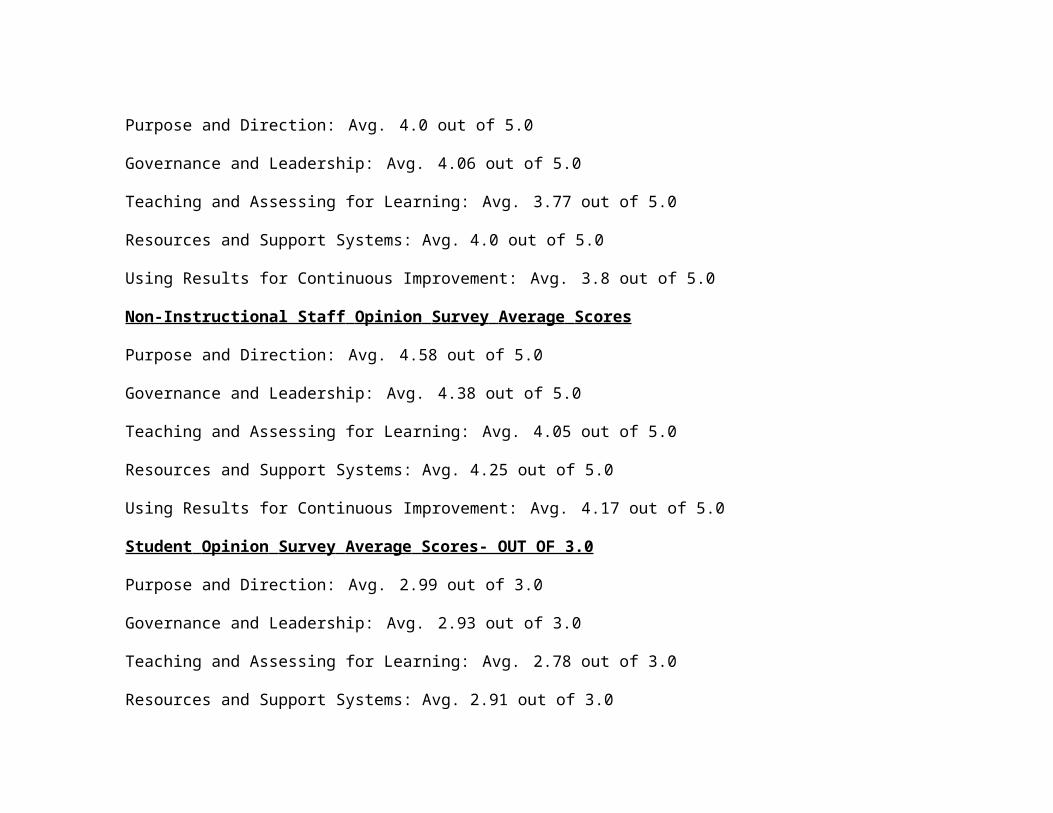
Purpose and Direction: Avg. 4.0 out of 5.0
Governance and Leadership: Avg. 4.06 out of 5.0
Teaching and Assessing for Learning: Avg. 3.77 out of 5.0
Resources and Support Systems: Avg. 4.0 out of 5.0
Using Results for Continuous Improvement: Avg. 3.8 out of 5.0
Non-Instructional Staff Opinion Survey Average Scores
Purpose and Direction: Avg. 4.58 out of 5.0
Governance and Leadership: Avg. 4.38 out of 5.0
Teaching and Assessing for Learning: Avg. 4.05 out of 5.0
Resources and Support Systems: Avg. 4.25 out of 5.0
Using Results for Continuous Improvement: Avg. 4.17 out of 5.0
Student Opinion Survey Average Scores- OUT OF 3.0
Purpose and Direction: Avg. 2.99 out of 3.0
Governance and Leadership: Avg. 2.93 out of 3.0
Teaching and Assessing for Learning: Avg. 2.78 out of 3.0
Resources and Support Systems: Avg. 2.91 out of 3.0
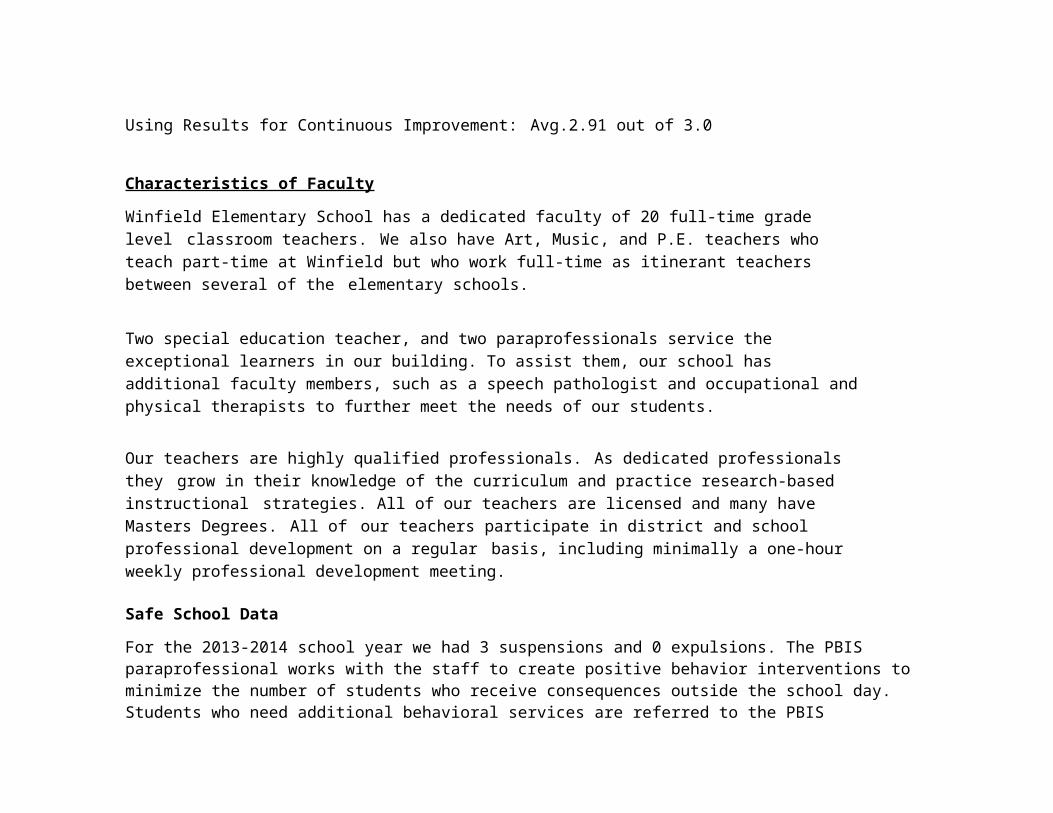
Using Results for Continuous Improvement: Avg.2.91 out of 3.0
Characteristics of Faculty
Winfield Elementary School has a dedicated faculty of 20 full-time grade level classroom teachers. We also have Art, Music, and P.E. teachers who teach part-time at Winfield but who work full-time as itinerant teachers between several of the elementary schools.
Two special education teacher, and two paraprofessionals service the exceptional learners in our building. To assist them, our school has additional faculty members, such as a speech pathologist and occupational and physical therapists to further meet the needs of our students.

Our teachers are highly qualified professionals. As dedicated professionals they grow in their knowledge of the curriculum and practice research-based instructional strategies. All of our teachers are licensed and many have Masters Degrees. All of our teachers participate in district and school professional development on a regular basis, including minimally a one-hour weekly professional development meeting.
Safe School Data
For the 2013-2014 school year we had 3 suspensions and 0 expulsions. The PBIS paraprofessional works with the staff to create positive behavior interventions to minimize the number of students who receive consequences outside the school day. Students who need additional behavioral services are referred to the PBIS paraprofessional through a referral process. The Problem Solving Team will then meet to discuss the child and make appropriate suggestions for improved behavior. The PBIS paraprofessional collects data on the number of students she regularly services. Some students receive her services as needed, and others are on her regular caseload.

6. Family and Community Data
Communication between School and Stakeholders
TEACHER COMMUNICATION
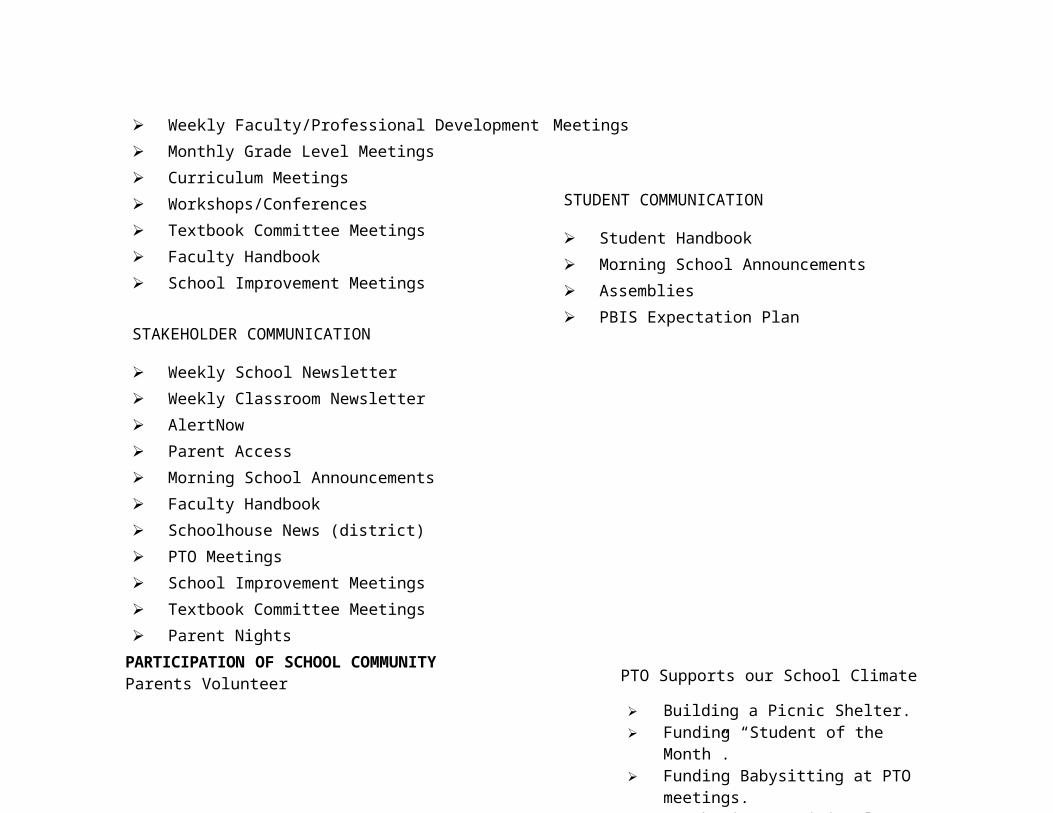
Weekly Faculty/Professional Development Meetings Monthly Grade Level Meetings Curriculum Meetings Workshops/Conferences Textbook Committee Meetings Faculty Handbook School Improvement Meetings
STAKEHOLDER COMMUNICATION
Weekly School Newsletter Weekly Classroom Newsletter AlertNow Parent Access Morning School Announcements Faculty Handbook Schoolhouse News (district) PTO Meetings School Improvement Meetings Textbook Committee Meetings Parent Nights
STUDENT COMMUNICATION
Student Handbook Morning School Announcements Assemblies PBIS Expectation Plan
PARTICIPATION OF SCHOOL COMMUNITYParents Volunteer
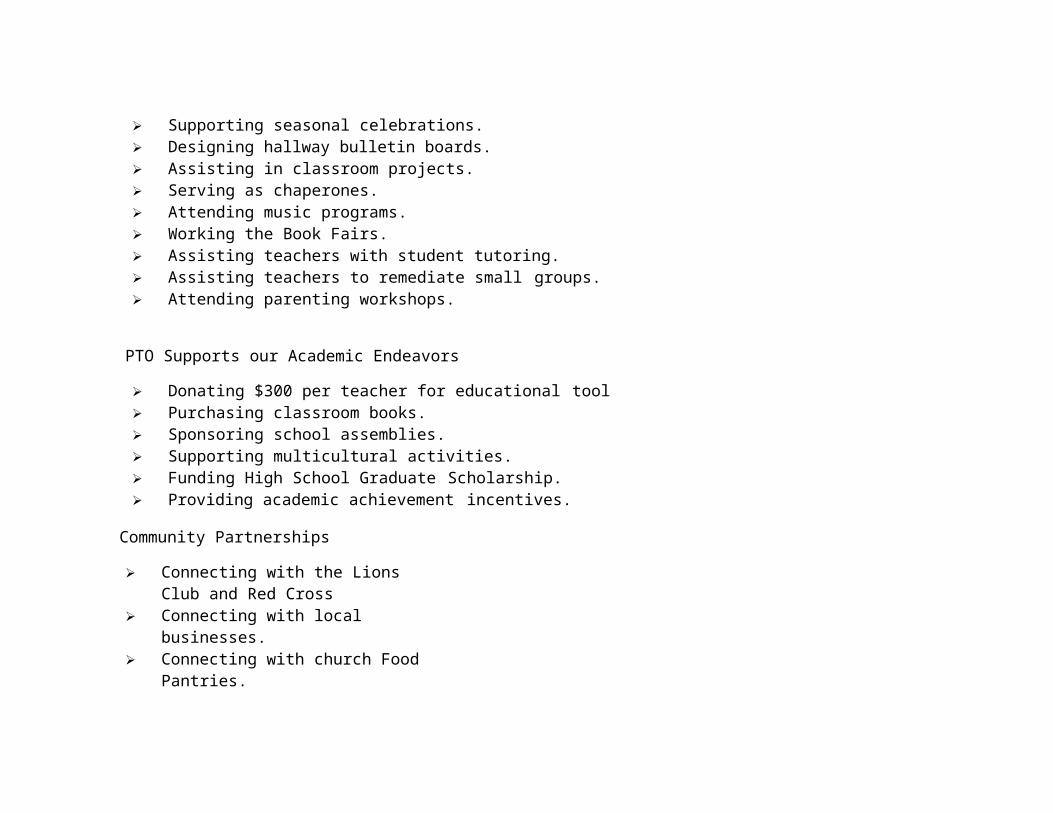
Supporting seasonal celebrations. Designing hallway bulletin boards. Assisting in classroom projects. Serving as chaperones. Attending music programs. Working the Book Fairs. Assisting teachers with student tutoring. Assisting teachers to remediate small groups. Attending parenting workshops.
PTO Supports our Academic Endeavors
Donating $300 per teacher for educational tools. Purchasing classroom books. Sponsoring school assemblies. Supporting multicultural activities. Funding High School Graduate Scholarship. Providing academic achievement incentives.
PTO Supports our School Climate
Building a Picnic Shelter. Funding “Student of the Month”. Funding Babysitting at PTO meetings. Purchasing nutritional treats and
pencils during standardized testing. Organizing and funding “Red Ribbon
Week”. Funding magnetic school calendars. Organizing and funding School
Directory. Organizing and funding “Special
Someones Day”. Funding of “Field Day”. Funding landscaping projects. Funding outdoor school signage. Organizing and running “Winterfest”. Funding free Family Fun Nights.
Community Partnerships
Connecting with the Lions Club and Red Cross
Connecting with local businesses. Connecting with church Food
Pantries.
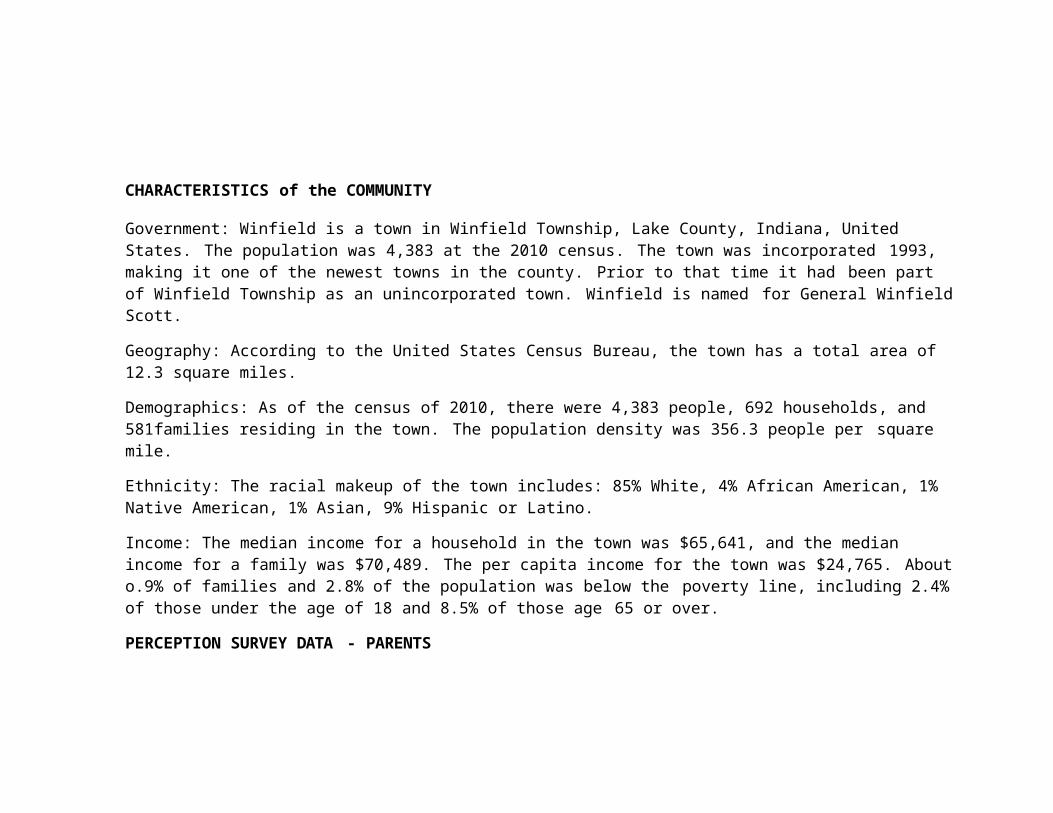
CHARACTERISTICS of the COMMUNITY
Government: Winfield is a town in Winfield Township, Lake County, Indiana, United States. The population was 4,383 at the 2010 census. The town was incorporated 1993, making it one of the newest towns in the county. Prior to that time it had been part of Winfield Township as an unincorporated town. Winfield is named for General Winfield Scott.
Geography: According to the United States Census Bureau, the town has a total area of 12.3 square miles.
Demographics: As of the census of 2010, there were 4,383 people, 692 households, and 581families residing in the town. The population density was 356.3 people per square mile.
Ethnicity: The racial makeup of the town includes: 85% White, 4% African American, 1% Native American, 1% Asian, 9% Hispanic or Latino.
Income: The median income for a household in the town was $65,641, and the median income for a family was $70,489. The per capita income for the town was $24,765. About o.9% of families and 2.8% of the population was below the poverty line, including 2.4% of those under the age of 18 and 8.5% of those age 65 or over.
PERCEPTION SURVEY DATA - PARENTS
The Crown Point Community School Corporation incorporated the Survey Tool from AdvancED to gather perceptions from parents, teachers, staff, and the community t o assess:
Purpose and Direction, Governance and Leadership, Teaching and Assessing for Learning, Resources and Support Systems, Using Results for Continuous Improvement
5 – Strongly Agree , 4 – Agree, 3 – Score of 3 or above indicates positive opinions.
Parent Opinion Survey Average Scores
Purpose and Direction: Avg. 4.41 out of 5.0
Governance and Leadership: Avg. 4.36 out of 5.0
Teaching and Assessing for Learning: Avg. 4.30 out of 5.0
Resources and Support Systems: Avg. 4.30 out of 5.0
Using Results for Continuous Improvement: Avg. 4.34 out of 5.0
7. Conclusions
Conclusions about out Curriculum
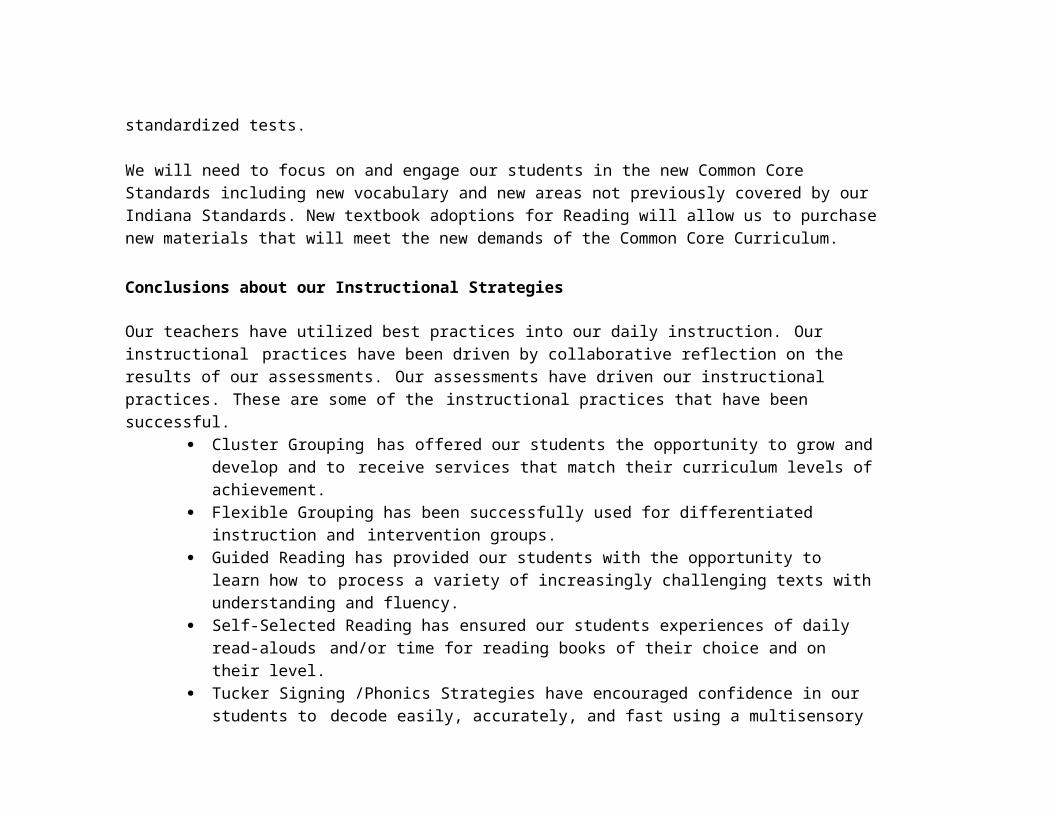
The curriculum utilized by Winfield Elementary School has supported the Indiana Standards through a balanced curriculum approach. Our students have received a balanced curriculum and possess the knowledge, skills, and ability to transfer and connect ideas across disciplines as documented by our successful standardized tests.
We will need to focus on and engage our students in the new Common Core Standards including new vocabulary and new areas not previously covered by our Indiana Standards. New textbook adoptions for Reading will allow us to purchase new materials that will meet the new demands of the Common Core Curriculum.
Conclusions about our Instructional Strategies
Our teachers have utilized best practices into our daily instruction. Our instructional practices have been driven by collaborative reflection on the results of our assessments. Our assessments have driven our instructional practices. These are some of the instructional practices that have been successful.
Cluster Grouping has offered our students the opportunity to grow and develop and to receive services that match their curriculum levels of achievement.
Flexible Grouping has been successfully used for differentiated instruction and intervention groups.
Guided Reading has provided our students with the opportunity to learn how to process a variety of increasingly challenging texts with understanding and fluency.
Self-Selected Reading has ensured our students experiences of daily read-alouds and/or time for reading books of their choice and on their level.
Tucker Signing /Phonics Strategies have encouraged confidence in our students to decode easily, accurately, and fast using a multisensory approach. It has worked especially well with students who struggle with regular reading programs.
Building Blocks and Four Blocks has been utilized to support our balanced literacy program.
Accelerated Reading has built a reading culture throughout our school and made reading practices more effective.
Math Facts in a Flash has ensured that our students gain the automatic recall that problem solving mastery requires.
Conclusions about Student Achievement
IREAD-3 data indicates that performance is steady, and we are trending towards 100% passing. ISTEP+ data indicates that students passing both ELA and Math decreased but remains to its lowest point in 4
years. Further investigation is warranted. ISTEP+ data indicates that ELA and Math achievements have decreased below the 90th percentile. ISTEP+ data indicates that ELA and Math achievement are within the range of our League
Schools. ISTEP+ data indicates that ELA and Math achievement exceeds the state achievement levels. ISTEP+ data in ELA indicates opportunities in non-fiction texts and writing. ISTEP+ data in Math indicates opportunities in Algebra and Functions and Measurement. STAR Early Literacy data indicates an increase in Probable Readers from the Transitional Levels and
fewer Emergent Reader Levels. STAR Reading and STAR Math First Grade data indicates average scores are above grade level. STAR Reading and STAR Math Second Grade data indicates average scores are above grade level. mClass data indicates that ELA TRC levels are improving. 78% of kindergarteners are at or above
proficient. 82% of first graders are at or above proficient. 63% of second graders are at or above proficient.
We will need to consider the fluency levels and stamina levels of our readers. Our students find it difficult to work efficiently with time-constraints and/or with endurance toward completion.
Terra Nova LA data indicates improved achievement levels. However, we have opportunities within text analysis, reading/writing strategies, and word meaning, and vowels. Terra Nova Math data indicates opportunities in the areas of measurement and problem solving.
Winfield has been recognized as a 4 Star, Exemplary, and “A” rated school.
Conclusions about Parental Participation
Parental participation as volunteers and participants at all school functions continues to be high. Parental participation as volunteers and participants at all PTO functions continues to be high. PTO Meeting participation has increased. Volunteer service hours for classroom assistance has reached over 4,700 hours of volunteer
service.
Conclusions about Technology as a Learning Tool
Winfield School has viewed technology as a powerful instructional tool . Technology has extended student knowledge and independence in our K – 2 school. As a dynamic resource, technology has enriched our classroom instruction, extended project-
based learning and facilitated student research. Technology has also enhanced the learning and extension of literacy skills and mathematics
reasoning. Technology has supported our school improvement goals. We continue to look for ways to integrate technology in new and exciting ways.
Conclusions about Safe and Disciplined Learning Environment
Winfield School has implemented a PBIS Discipline Plan (PAWS). Winfield School has a locked doors policy. A video surveillance system is used to identify all visitors. All visitors must sign a visitor’s log and receive a visitor’s pass. Adults taking students out of school must complete a sign-out procedure. Parents must notify the school office if other adults will be picking-up their children. Car riders are picked up in a different location at dismissal for security procedures. Parents may not enter the
building to pick up car-riders. They must remain outside, limiting outsiders in the building. A Crisis Team meets regularly to review Crisis Response Plans and trains with the Safety and
51
Security Officer. Emergency Response Plans are accessible to everyone who works or visits within our school. New visitor procedures have been enacted for lunchtime guests. New stanchions at the front of the school reduce unwanted guests. Winfield conducts all drills as mandated.
Conclusions about Professional Development
In order to accomplish all goals our Professional Development Plan, we relied on workshop/conference presenters; visitations to other schools; local universities; and colleagues within our building and the district.
Built Shared Knowledge: Those teachers who attended workshops/conferences provided mini-workshops to the other teachers during faculty meetings.
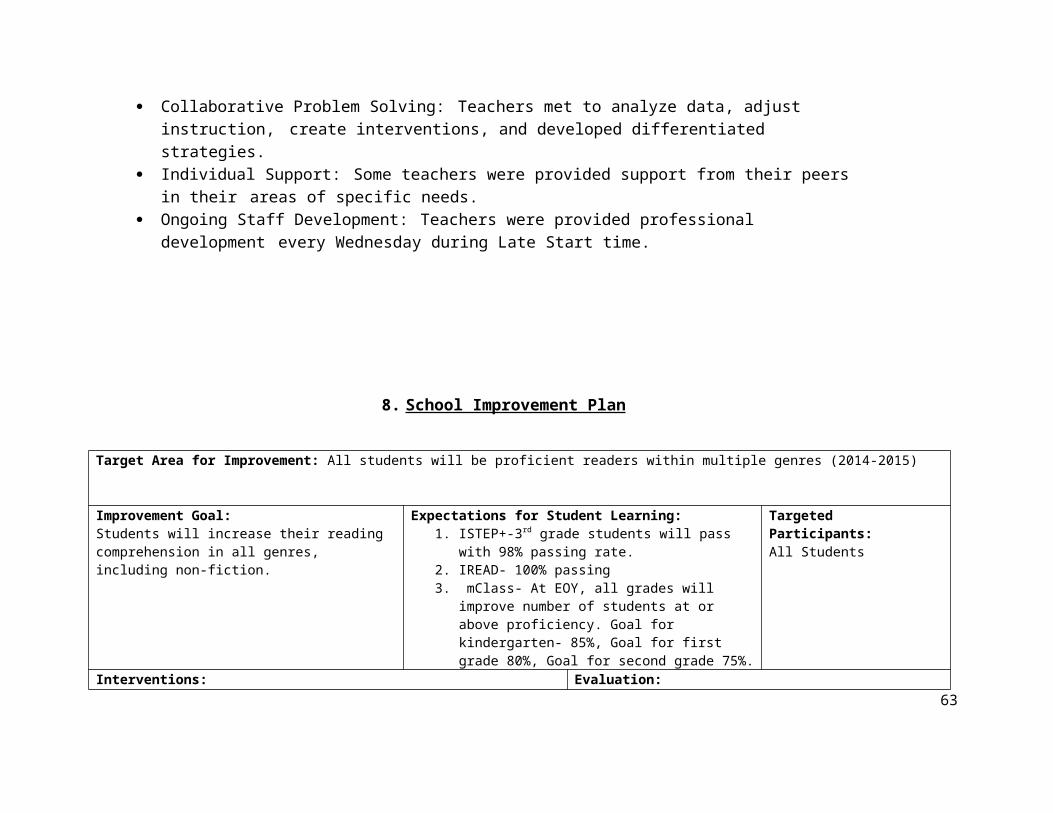
Collaborative Problem Solving: Teachers met to analyze data, adjust instruction, create interventions, and developed differentiated strategies.
Individual Support: Some teachers were provided support from their peers in their areas of specific needs.
Ongoing Staff Development: Teachers were provided professional development every Wednesday during Late Start time.
8. School Improvement Plan
Target Area for Improvement: All students will be proficient readers within multiple genres (2014-2015)
52
Improvement Goal:Students will increase their reading comprehension in all genres, including non-fiction.
Expectations for Student Learning:1. ISTEP+-3rd grade students will pass with 98%
passing rate.2. IREAD- 100% passing3. mClass- At EOY, all grades will improve number
of students at or above proficiency. Goal for kindergarten- 85%, Goal for first grade 80%, Goal for second grade 75%.
Targeted Participants:All Students
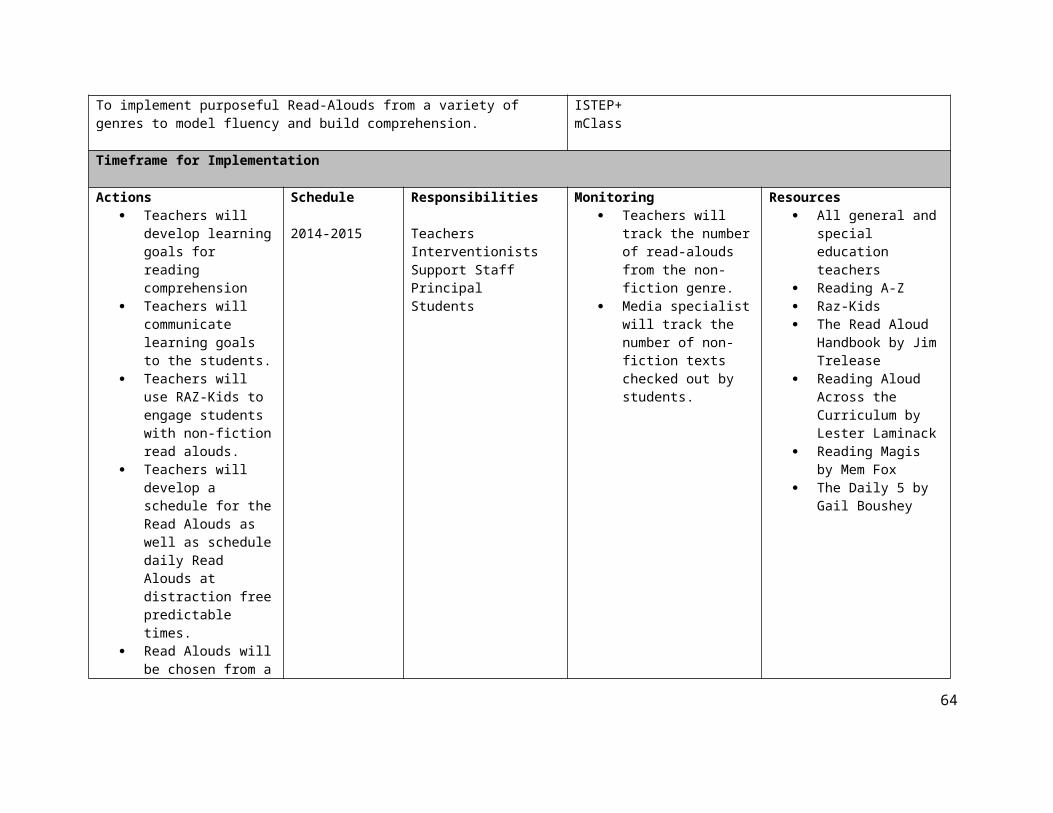
Interventions:To implement purposeful Read-Alouds from a variety of genres to model fluency and build comprehension.
Evaluation:ISTEP+mClass
Timeframe for Implementation
Actions Teachers will develop
learning goals for reading comprehension
Teachers will communicate learning goals to the students.
Teachers will use RAZ-Kids to engage students with non-fiction read alouds.
Teachers will develop a schedule for the Read Alouds as well as schedule daily Read Alouds at distraction free predictable times.
Read Alouds will be chosen from a variety of genres, in particular non-fiction.
Teachers will engage
Schedule
2014-2015
Responsibilities
TeachersInterventionistsSupport StaffPrincipalStudents
Monitoring Teachers will track the
number of read-alouds from the non-fiction genre.
Media specialist will track the number of non-fiction texts checked out by students.
Resources All general and
special education teachers
Reading A-Z Raz-Kids The Read Aloud
Handbook by Jim Trelease
Reading Aloud Across the Curriculum by Lester Laminack
Reading Magis by Mem Fox
The Daily 5 by Gail Boushey
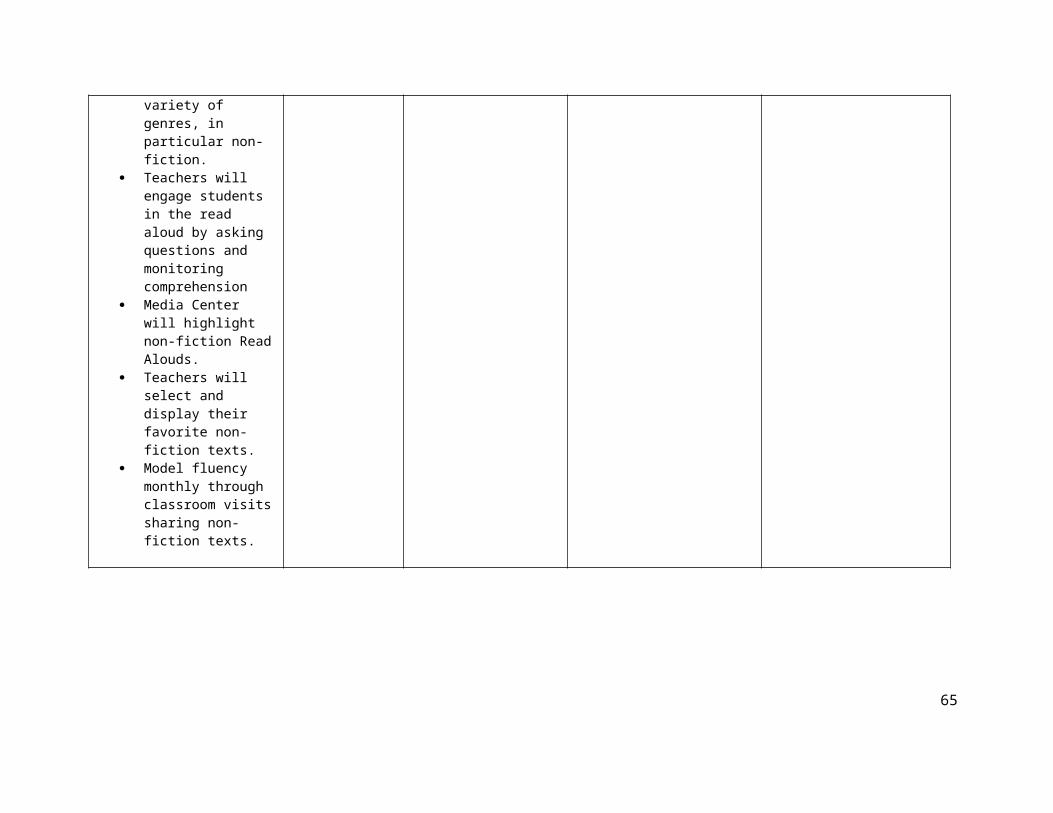
53
students in the read aloud by asking questions and monitoring comprehension
Media Center will highlight non-fiction Read Alouds.
Teachers will select and display their favorite non-fiction texts.
Model fluency monthly through classroom visits sharing non-fiction texts.
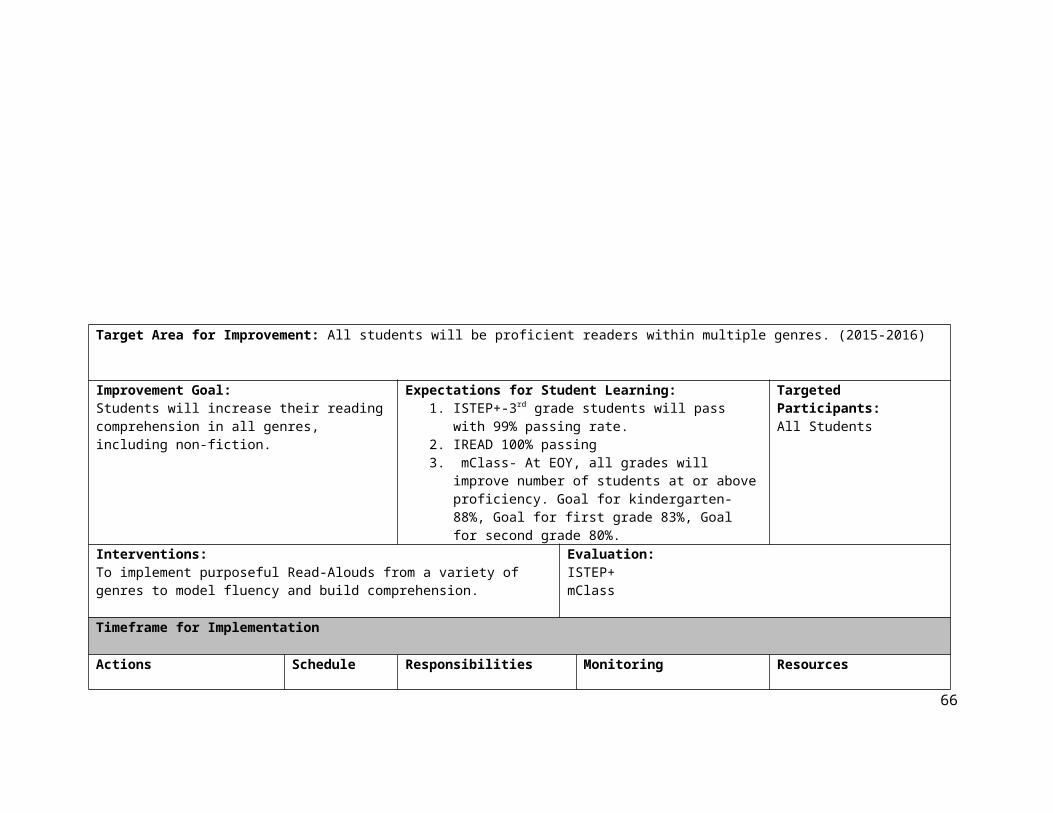
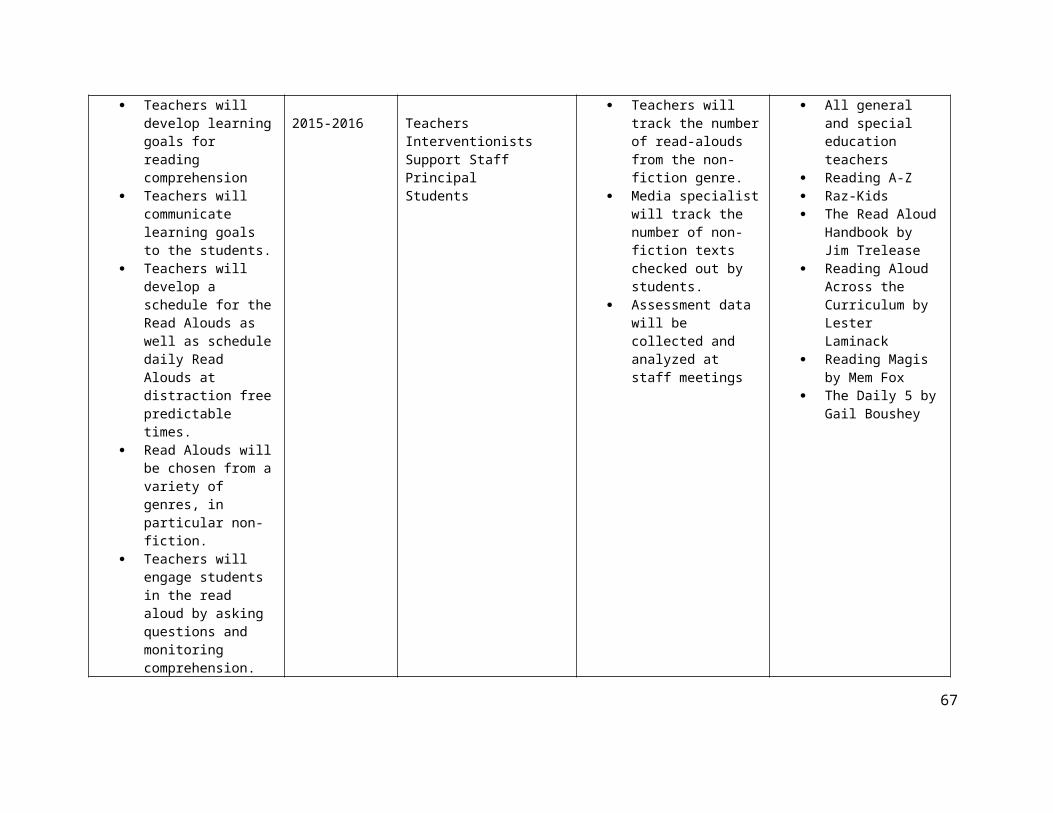
Target Area for Improvement: All students will be proficient readers within multiple genres. (2015-2016)
54
Improvement Goal:Students will increase their reading comprehension in all genres, including non-fiction.
Expectations for Student Learning:1. ISTEP+-3rd grade students will pass with 99%
passing rate.2. IREAD 100% passing3. mClass- At EOY, all grades will improve number of
students at or above proficiency. Goal for kindergarten- 88%, Goal for first grade 83%, Goal for second grade 80%.
Targeted Participants:All Students
Interventions:To implement purposeful Read-Alouds from a variety of genres to model fluency and build comprehension.
Evaluation:ISTEP+mClass
Timeframe for Implementation
Actions Teachers will develop
learning goals for reading comprehension
Teachers will communicate learning goals to the students.
Teachers will develop a schedule for the Read Alouds as well as schedule daily Read Alouds at distraction free predictable times.
Read Alouds will be chosen from a variety of genres, in particular non-fiction.
Teachers will engage students in the read aloud by asking questions and
Schedule
2015-2016
Responsibilities
TeachersInterventionistsSupport StaffPrincipalStudents
Monitoring Teachers will track
the number of read-alouds from the non-fiction genre.
Media specialist will track the number of non-fiction texts checked out by students.
Assessment data will be collected and analyzed at staff meetings
Resources All general and
special education teachers
Reading A-Z Raz-Kids The Read Aloud
Handbook by Jim Trelease
Reading Aloud Across the Curriculum by Lester Laminack
Reading Magis by Mem Fox
The Daily 5 by Gail Boushey
55
monitoring comprehension.
Media Center willhighlight non-fiction Read Alouds.
Students will track reading habits (fiction vs. nonfiction).
Students will read an increased number of non-fiction texts.
Model fluency monthly through classroom visits sharing non-fiction texts.
Target Area for Improvement: All students will be proficient readers within multiple genres. (2016-2017)
Improvement Goal: Expectations for Student Learning: Targeted Participants:
56

Students will increase their reading comprehension in all genres, including non-fiction.
1. ISTEP+-3rd grade students will pass with 100% passing rate.
2. IREAD-100% passing3. mClass- At EOY, all grades will improve number of
students at or above proficiency. Goal for kindergarten- 90%, Goal for first grade 85%, Goal for second grade 83%.
All Students
Interventions:To implement purposeful Read-Alouds from a variety of genres to model fluency and build comprehension.
Evaluation:ISTEP+mClass
Timeframe for Implementation
Actions Teachers will develop
learning goals for reading comprehension.
Teachers will communicate learning goals to the students.
Teachers will develop a schedule for the Read Alouds as well as schedule daily Read Alouds at distraction free predictable times.
Read Alouds will be chosen from a variety of genres, in particular non-fiction.
Teachers will engage students in the read aloud by asking questions and monitoring comprehension.
Media Center willhighlight non-fiction
Schedule
2016-2017
Responsibilities
TeachersInterventionistsSupport StaffPrincipalStudents
Monitoring Teachers will track the
number of read-alouds from the non-fiction genre.
Media specialist will track the number of non-fiction texts checked out by students.
Assessment data will be collected and analyzed at staff meetings
Resources All general and
special education teachers
Reading A-Z Raz-Kids The Read Aloud
Handbook by Jim Trelease
Reading Aloud Across the Curriculum by Lester Laminack
Reading Magis by Mem Fox
The Daily 5 by Gail Boushey
57
Read Alouds. Students will track
reading habits (fiction vs. non-fiction).
Students will read an increased number of non-fiction texts.
Model fluency through classroom visits sharing non-fiction texts.
Target Area for Improvement: Math Achievement (2014-2015)
Improvement Goal:All students will demonstrate measurable growth in
Expectations for Student Learning:1. 90% of students will meet or exceed CPCSC
Targeted Participants:All students K-2
58
mathematics. benchmarks for STAR Testing.2. 90% of students will meet or exceed CPCSC
benchmarks for mCLASSInterventions:
1. Students will increase stamina to problem solve.2. Students will improve computational fluency.
Evaluation:1. Star Math2. mClass Math
Timeframe for Implementation
Actions1. Teachers will
connect the study of mathematics to real-world, age-appropriate contexts.
2. Teachers will provide multiple avenues for representing and solving problems including the use of manipulatives, tools, spoken and written words, pictures, diagrams, and symbols.
3. Teachers will incorporate individual, partner, and small group activities that make it possible for teachers to provide individualized feedback and assistance.
Schedule
2014-2015 School Year
ResponsibilitiesClassroom TeachersParaprofessionalsPrincipal
MonitoringQuarterly Assessments
Grade Level Data Team Meetings
Cross-Grade Level Data Team Meetings
Winfield/Jerry Ross Meetings
RTI/PST Meetings
ResourcesEveryday Math Curriculum
STAR Assessments
mCLASS Assessments
Dreambox
Math Facts in a Flash
59
4. Teachers will encourage risk-taking by establishing a learning environment that respects multiple problem solving strategies.
5. Teachers will provide engaging open-ended activities that can be easily customized to meet the needs of students with a range of abilities.
6. Teachers will implement the Everyday Math curriculum and supplement where necessary
Target Area for Improvement: Math Achievement (2015-2016)
Improvement Goal: Expectations for Student Learning: Targeted Participants:60
All students will demonstrate measurable growth in mathematics.
1. 92% of students will meet or exceed CPCSC benchmarks for STAR Testing.
2. 92% of students will meet or exceed CPCSC benchmarks for mCLASS
All students K-2
Interventions:1. Students will increase stamina to problem solve.2. Students will improve computational fluency.
Evaluation:1. Star Math2. mClass Math
Timeframe for Implementation
Actions1. Teachers will
connect the study of mathematics to real-world, age-appropriate contexts.
2. Teachers will provide multiple avenues for representing and solving problems including the use of manipulatives, tools, spoken and written words, pictures, diagrams, and symbols.
3. Teachers will incorporate individual, partner, and small group activities that make it possible for teachers to provide individualized feedback and
Schedule
2015-2016 School Year
ResponsibilitiesClassroom TeachersParaprofessionalsPrincipal
MonitoringQuarterly Assessments
Grade Level Data Team Meetings
Cross-Grade Level Data Team Meetings
Winfield/Jerry Ross Meetings
RTI/PST Meetings
ResourcesEveryday Math Curriculum
STAR Assessments
mCLASS Assessments
Dreambox
Math Facts in a Flash
61
assistance.4. Teachers will
encourage risk-taking by establishing a learning environment that respects multiple problem solving strategies.
5. Teachers will provide engaging open-ended activities that can be easily customized to meet the needs of students with a range of abilities.
6. Teachers will implement the Everyday Math curriculum and supplement where necessary
62
Target Area for Improvement: Math Achievement (2016-2017)
Improvement Goal:All students will demonstrate measurable growth in mathematics.
Expectations for Student Learning:1. 94% of students will meet or exceed CPCSC
benchmarks for STAR Testing.2. 94% of students will meet or exceed CPCSC
benchmarks for mCLASS
Targeted Participants:All students K-2
Interventions:1. Students will increase stamina to problem solve.2. Students will improve computational fluency.
Evaluation:3. Star Math4. mClass Math
Timeframe for Implementation
Actions1. Teachers will
connect the study of mathematics to real-world, age-appropriate contexts.
2. Teachers will provide multiple avenues for representing and solving problems including the use of manipulatives, tools, spoken and written words, pictures, diagrams, and symbols.
3. Teachers will incorporate individual, partner,
Schedule
2016-2017 School Year
ResponsibilitiesClassroom TeachersParaprofessionalsPrincipal
MonitoringQuarterly Assessments
Grade Level Data Team Meetings
Cross-Grade Level Data Team Meetings
Winfield/Jerry Ross Meetings
RTI/PST Meetings
ResourcesEveryday Math Curriculum
STAR Assessments
mCLASS Assessments
Dreambox
Math Facts in a Flash
63
and small group activities that make it possible for teachers to provide individualized feedback and assistance.
4. Teachers will encourage risk-taking by establishing a learning environment that respects multiple problem solving strategies.
5. Teachers will provide engaging open-ended activities that can be easily customized to meet the needs of students with a range of abilities.
6. Teachers will implement the Everyday Math curriculum and supplement where necessary
64
9. Professional Development Goals
School Name: Winfield Elementary School Year: 2014-2015
Professional Development Goal:All students will be proficient readers.
Teachers will have the knowledge and tools to improve reading comprehension.
MonitoringStudent AchievementData Sources
1.ISTEP+2.IREAD3.mCLASS4. Terra Nova
Benchmark:1. ISTEP+-3rd grade students will pass with 98% passing rate.2. IREAD- 100% passing3. mClass- At EOY, all grades will improve number of students at or above
proficiency. Goal for kindergarten- 85%, Goal for first grade 80%, Goal for second grade 75%.
Teacher ImplementationData Sources
1.STAR Early Literacy2.STAR Reading3.Textbook Assessments
Professional Development Activity Audience Facilitator Financial Resources Target Date(s) of Activity
Teachers will continue training in using learning goals and scales with students.
Teachers will be trained to use and create student scales.
Teachers will be trained and introduced to Elements 17-20 on Marzano’s scale.
Jr. Great Books Staff Share with Literacy Ideas. Peer-Observations Workshop Attendance Training on Analyzing Data Reflecting on the Art and
Science of Teaching- Book and Video Study
CP 2.0 Blended Learning Course
All Teachers Teachers, Principal, District Experts, Central Office Staff, Workshop presenters
Professional Development Funds, PTO Funds, Grant Monies
2014-2015
65
School Name: Winfield Elementary School Year: 2015-2016Professional Development Goal:All students will be proficient readers.
Teachers will have the knowledge and tools to improve reading comprehension.
MonitoringStudent AchievementData Sources
1.ISTEP+2.IREAD3.mCLASS4. Terra Nova
Benchmark:1. ISTEP+-3rd grade students will pass with 98% passing rate.2. IREAD- 100% passing3. mClass- At EOY, all grades will improve number of students at or above
proficiency. Goal for kindergarten- 85%, Goal for first grade 80%, Goal for second grade 75%.
Teacher ImplementationData Sources
1.STAR Early Literacy2.STAR Reading3.Textbook Assessments
Professional Development Activity Audience Facilitator Financial Resources Target Date(s) of
Activity Jr. Great Books Staff Share with
Literacy Ideas. Peer-Observations Workshop Attendance Fall Book Study: Daily
5 by The Two Sisters Spring Book Study:
Visible Learning by John Hattie
Training on Analyzing Data
Training in added elements for Marzano’s iObservation
All Teachers Teachers, Principal, District Experts, Central Office Staff, Workshop presenters
Professional Development Funds, PTO Funds, Grant Monies
2015-2016
66
School Name: Winfield Elementary School Year: 2016-2017
Professional Development Goal:All students will be proficient readers.
Teachers will have the knowledge and tools to improve reading comprehension.
MonitoringStudent AchievementData Sources
1.ISTEP+2.IREAD3.mCLASS4. Terra Nova
Benchmark:1. ISTEP+-3rd grade students will pass with 98% passing rate.2. IREAD- 100% passing3. mClass- At EOY, all grades will improve number of students at or
above proficiency. Goal for kindergarten- 85%, Goal for first grade 80%, Goal for second grade 75%.
Teacher ImplementationData Sources
1.STAR Early Literacy2.STAR Reading3.Textbook Assessments
Professional Development Activity Audience Facilitator Financial Resources Target Date(s) of
Activity Jr. Great Books Staff Share with
Literacy Ideas. Peer-Observations Workshop Attendance Fall Book Study: Café
by The Two Sisters Spring Book Study:
TBD Training in added
elements for Marzano’s iObservation
All Teachers Teachers, Principal, District Experts, Central Office Staff, Workshop presenters
Professional Development Funds, PTO Funds, Grant Monies
2016-2017
67

68