€¦ · Web viewAdd within 100, including adding a two-digit number and a one-digit number, and...
69
Keansburg School District Curriculum Management System 1
Transcript of €¦ · Web viewAdd within 100, including adding a two-digit number and a one-digit number, and...

Keansburg School DistrictCurriculum Management System
Believe Understand and Realize GoalsMathematics Grade 1 - College and Career Ready (CCR)
Board Adopted July 24 2012 Revision Process Ongoing
1
Keansburg School DistrictCurriculum System
Mathematics
Keansburg Public Schools
Board of Education
Mrs Judy Ferraro PresidentMs Kimberly Kelaher-Moran Vice President
Ms Delores A BartramMs Ann Marie BestMs Christine Blum
Ms Ann Commarato
Mr Michael DonaldsonMrs Patricia FrizellMr Robert Ketch
District Administration
Mr Gerald North SuperintendentDr Thomas W Tramaglini Director of Curriculum Instruction amp Funding
Ms Michelle Derpich Secondary Supervisor of Curriculum amp InstructionMrs Donna Glomb Elementary Supervisor of Curriculum amp Instruction
Mrs Michelle Halperin-Krain Supervisor of Data and AssessmentDr Brian Latwis Supervisor of Pupil Personnel Services
Ms Corey Lowell Business Administrator
Curriculum Development CommitteeBarbara AnnuzziElizabeth Castner
Deena CheslerJeanne Corey
Christina DeSoucey
Anne GraceffoNoreen Higgins
Tammie HolcombeAja Kosanke
Meghan McAvoy
Kristen MignoliKimberly Mistretta
Lisa Nigro Christina TripodiDeanne Weitzell
2
Keansburg School DistrictCurriculum System
Mathematics
3
Non-Negotiables
Graduatesthat are
prepared and
inspired to make positive
contributions to society
Believe Understand and Realize Goals
Keansburg School DistrictCurriculum System
Mathematics
MissionVision Statement
The mission of the Keansburg School District developed through relationships with all stakeholders is to identify the unique potential of each individual by creating a relevant and meaningful learning environment that promotes high
academic social and emotional expectations for our students and teachers and leads to graduates that are prepared and inspired to make positive contributions to society
Beliefs
We believe that
All children can learn To meet the challenges of change risk must be taken Every student is entitled to an equal educational opportunity It is our responsibility to enable students to succeed and become the best that they can be All individuals should be treated with dignity and respect The school system should be responsive to the diversity within our total population The degree of commitment and level of involvement in the decision-making processes from the student
community home and school will determine the quality of education Decisions should be based on the needs of the students Achievement will rise to the level of expectation Students should be taught how to learn The educational process should be a coordinated system of services and programs
4
Keansburg School DistrictCurriculum System
MathematicsCurriculum Philosophy
The curriculum philosophy of the Keansburg School District is progressive We embrace the high expectations of our students and community towards success in the 21st Century and beyond At the center of this ideal we believe that all of our students can be successful The following are our core beliefs for all curricula
All district curricula Balances policy driven trends of centralization and standardization with research and what we know is good for our
students Balances the strong emphasis on test success and curriculum standards with how and what our students must
know to be successful in our community Embraces the reality that our students differ in the way they learn and perform and personalizes instruction to
meet the needs of each learner Are aligned to be developmentally appropriate Provides teachers the support and flexibility to be innovative and creative to meet the needs of our students
Mathematics Goals
To deliver a curriculum that is Pertinent for the success of all of our students and useful for teachers in the 21st Century Problem-based where students understand the importance of mathematical concepts and applications Socially emotionally and academically driven with regards to statute and code while focusing on what is best for
each of the students in our school district to achieve successful outcomes Significant in the processes of growth and development and relevant to the students Differentiated with regards to our studentsrsquo abilities and needs Embedded with teaching responsibility respect and the value of hard work and self-pride over time Designed with both content knowledge and experiences which
o Are aligned from one grade level to the next with scaffolded underpinnings of similar concepts for successo Engage our diverse population for positive outcomeso Build and support the language of mathematicso Develop educational and mathematical independence over time
5
Keansburg School DistrictCurriculum System
MathematicsCommon Core Standards for Mathematics
OPERATIONS AND ALGEBRAIC THINKING
Represent and solve problems involving addition and subtraction
1 Use addition and subtraction within 20 to solve word problems involving situations of adding to taking from putting together taking apart and comparing with unknowns in all positions eg by using objects drawings and equations with a symbol for the unknown number to represent the problem
2 Solve word problems that call for addition of three whole numbers whose sum is less than or equal to 20 eg by using objects drawings and equations with a symbol for the unknown number to represent the problem
Understand and apply properties of operations and the relationship between addition and subtraction
3 Apply properties of operations as strategies to add and subtract3 Examples If 8 + 3 = 11 is known then 3 + 8 = 11 is also known (Commutative property of addition) To add 2 + 6 + 4 the second two numbers can be added to make a ten so 2 + 6 + 4 = 2 + 10 = 12 (Associative property of addition)
4 Understand subtraction as an unknown-addend problem For example subtract 10 ndash 8 by finding the number that makes 10 when added to 8
Add and subtract within 20
5 Relate counting to addition and subtraction (eg by counting on 2 to add 2)
6 Add and subtract within 20 demonstrating fluency for addition and subtraction within 10 Use strategies such as counting on making ten (eg 8 + 6 = 8 + 2 + 4 = 10 + 4 = 14) decomposing a number leading to a ten (eg 13 ndash 4 = 13 ndash 3 ndash 1 = 10 ndash 1 = 9) using the relationship between addition and subtraction (eg knowing that 8 + 4 = 12 one knows 12 ndash 8 = 4) and creating equivalent but easier or known sums (eg adding 6 + 7 by creating the known equivalent 6 + 6 + 1 = 12 + 1 = 13)
Work with addition and subtraction equations
7 Understand the meaning of the equal sign and determine if equations involving addition and subtraction are true or false For example which of the following equations are true and which are false 6 = 6 7 = 8 ndash 1 5 + 2 = 2 + 5 4 + 1 = 5 + 2
6
Keansburg School DistrictCurriculum System
Mathematics8 Determine the unknown whole number in an addition or subtraction equation relating three whole numbers For example
determine the unknown number that makes the equation true in each of the equations 8 + = 11 5 = 1048781 ndash 3 6 + 6 = 1048781
NUMBER AND OPERATIONS IN BASE TEN
Extend the counting sequence
1 Count to 120 starting at any number less than 120 In this range read and write numerals and represent a number of objects with a written numeral
Understand place value
2 Understand that the two digits of a two-digit number represent amounts of tens and ones Understand the following as special cases
a 10 can be thought of as a bundle of ten ones mdash called a ldquotenrdquo
b The numbers from 11 to 19 are composed of a ten and one two three four five six seven eight or nine ones
c The numbers 10 20 30 40 50 60 70 80 90 refer to one two three four five six seven eight or nine tens (and 0 ones)
3 Compare two two-digit numbers based on meanings of the tens and ones digits recording the results of comparisons with the symbols gt = and lt
Use place value understanding and properties of operations to add and subtract
4 Add within 100 including adding a two-digit number and a one-digit number and adding a two-digit number and a multiple of 10 using concrete models or drawings and strategies based on place value properties of operations andor the relationship between addition and subtraction relate the strategy to a written method and explain the reasoning used Understand that in adding two-digit numbers one adds tens and tens ones and ones and sometimes it is necessary to compose a ten
5 Given a two-digit number mentally find 10 more or 10 less than the number without having to count explain the reasoning used
6 Subtract multiples of 10 in the range 10-90 from multiples of 10 in the range 10-90 (positive or zero differences) using concrete models or drawings and strategies based on place value properties of operations andor the relationship between addition and subtraction relate the strategy to a written method and explain the reasoning used
7
Keansburg School DistrictCurriculum System
Mathematics
MEASUREMENT AND DATA
Measure lengths indirectly and by iterating length units
1 Order three objects by length compare the lengths of two objects indirectly by using a third object
2 Express the length of an object as a whole number of length units by laying multiple copies of a shorter object (the length unit) end to end understand that the length measurement of an object is the number of same-size length units that span it with no gaps or overlaps Limit to contexts where the object being measured is spanned by a whole number of length units with no gaps or overlaps
Tell and write time
3 Tell and write time in hours and half-hours using analog and digital clocks
Represent and interpret data
4 Organize represent and interpret data with up to three categories ask and answer questions about the total number of data points how many in each category and how many more or less are in one category than in another
GEOMETRY
Reason with shapes and their attributes
1 Distinguish between defining attributes (eg triangles are closed and three-sided) versus non-defining attributes (eg color orientation overall size) build and draw shapes to possess defining attributes
2 Compose two-dimensional shapes (rectangles squares trapezoids triangles half-circles and quarter-circles) or three-dimensional shapes (cubes right rectangular prisms right circular cones and right circular cylinders) to create a composite shape and compose new shapes from the composite shape
3 Partition circles and rectangles into two and four equal shares describe the shares using the words halves fourths and quarters and use the phrases half of fourth of and quarter of Describe the whole as two of or four of the shares Understand for these examples that decomposing into more equal shares creates smaller shares
8
Keansburg School DistrictCurriculum System
Mathematics
Grade 1 Scope and Sequence
SeptemberQuarter 1
Number Sense Numbers 1-20 Number writing Identifying Counting objects (up to 20)
Number 20+ Number Identification Counting 1-100 by ones and tens
OctoberQuarter 1
Operations amp Algebraic Expressions Problem solving with addition and subtraction Properties of operations Add and subtract within 20
NovemberQuarter 2
Measurement amp Data Measure lengths and by iterating length units Tell and write time Represent and interpret data
DecemberQuarter 2
Geometry Reason with shapes and their attributes
JanuaryQuarter 2
Number and Base Ten Extend the counting sequence Understand place value
FebruaryQuarter 3
Operations amp Algebraic Expressions (II) Represent and solve problems involving addition and subtraction Understand and apply properties of operations and the relationship between addition
and subtraction Add and subtract within 20 Work with addition and subtraction equations
MarchQuarter 3
Measurement amp Data (II) Measure lengths and by iterating length units Tell and write time
9
Keansburg School DistrictCurriculum System
Mathematics Represent and interpret data
AprilQuarter 4
Geometry (II) Reason with shapes their attributes
MayQuarter 4
Number and Base Ten Use place value understanding and properties of operations to add and subtract
JuneQuarter 4
Readiness skills for September of Grade 2 Problem solving with all mathematical concepts covered in Grade 1
10
Keansburg School DistrictCurriculum System
Mathematics
Keansburg School DistrictCurriculum Management System
SubjectGradeLevelMathematicsGrade 1
Timeline September-Quarter 1
Topic(s) Number Sense
Significance of Learning Goal(s) To write numbers 0-20
Sugg
este
d D
ays
of
Inst
ruct
ion Content
Standards CPI
Essential Questions
Specific Learning Objective(s)
The Students Will Be Able To
Suggested Activities Instructional Tools Materials Technology Resources Assessments and Assessment Models
CPI KCC1 KCC2 KCC3 KCC6 KOA5 KNBT1
EQ Why is it
important to recognize and write numbers
Concept(s) Kindergarten review of number sense
SWBAT
Identify write and count numbers 0-20
Count objects and represent with a number
Compare and order numbers 0-
Meets Standard Practice counting
numbers 0-20 using nursery rhymes and songs
Order numbers from 0-20 using number cards number tiles (from hundredths board)
Order numbers while understanding words such as before after between Utilize a number line to locate and order numbers
Compare numbers that greater than or less than using games such as Number Line Squeeze
Nursery Rhymes CD Math songs Number cards Number Line Squeeze-number lines Everyday Math cards Straws or popsicle sticks Calendar httpwwwstarfallcomnholidaycalendarloadhtmfampn=main school day count chart weather chart attendance chart class number grid wwwk-5mathteachingresourcescom coins counters
11
Keansburg School DistrictCurriculum System
Mathematics20 through concrete and pictorial models
Count to 100 by ones and tens
Top It and One More One Less Stories
Write numbers from 0-20 Construct numbers 11-19
by bundling groups of ten and then by counting the left over ones
Develop number sense by counting up and counting back using a given number
Incorporate number sense daily through calendar school day count class number grid weather and attendance
Reading counting books Recording tally counts
creating tally charts Find and locate numbers
on the number grid Provide students with
number lines students will need to identify and provide the missing number
Show one more wwwk-5mathteachingresourcescom
Show one less wwwk-5mathteachingresourcescom
One more on the ten frame wwwk-5mathteachingresourcescom
Typical Assessment Question(s) or Task(s) Ask students to count 0-20 Students will be asked to order numbers from 0-20 Compare numbers that greater than or less than Students will display number sense through orally counting up
and counting back using a given number Give students a given number have them identify the given
number on the number grid Have students analyze a tally chart and give the associated
number with this chart
12
Keansburg School DistrictCurriculum System
Mathematics
Exceeds Standard Practice counting
numbers 21-100 Compare numbers
greater than 20 through games
Before and after games Number grid puzzles Counting walk students
estimate step amounts from one location to another Find actual number of steps and compare the two numbers Choose other locations and repeat procedure
Students compose and solve ones and tens riddles
Counting by 5s using nickels
Counting by 10s using dimes
One moreone less scoop wwwk-5mathteachingresourcescom
13
Keansburg School DistrictCurriculum System
Mathematics
Keansburg School DistrictCurriculum Management System
SubjectGradeLevelMathematicsGrade 1
Timeline October-Quarter 1Topic(s) Operations amp Algebraic Expressions
Significance of Learning Goal(s) To solve problems using addition and subtraction within 20
Sugg
este
d
Content Standards CPI Essential
Questions
Specific Learning Objective(s)
The Students Will Be Able To
Suggested ActivitiesInstructional Tools Materials
Technology Resources Assessments and Assessment
Models
CPI 1OA31OA4 1OA5 1OA6 1OA7 1OA8
EQ What questions can
be answered using addition
What strategies can be used to solve problems
How can we tell how many
How does knowing math facts make math easier
How can numbers be helpful
Why do I need to subtract
Concept(s) Working with and solving problems using addition and subtraction within 20
SWBAT
Solve word problems within 20 using real life situations
Understand demonstrate and apply properties of operations for addition
Demonstrate fluency for addition and subtraction within 20 by using strategies to solve
Meets Standard Model a number sentence using
manipulatives and label operation symbols
Use dominoes to create an addition problem and find the sum
Solve addition problems using a number line
Students will develop different ways to solve number stories students will use objects fingers and pictures count onback number line or number grid
Create real life situations in which students will use all number story strategies to solve a problem
Teachers will pose real world number stories to the students students will synthesize pre-existing information that they know to solve the problem
Introduce and devise addition and subtraction number stories posters stating each key word for addition and subtraction operations
Dominoes Number lines Number Grids Number Cards White Boards Dry-Erase markers Pennies
Typical Assessment Question(s) or Task(s)
Students will be asked to solve addition and subtraction problems within 20 within a given time frame
Students will be given a number and be asked to count on from that given number
14
Keansburg School DistrictCurriculum System
Mathematics How do we use
addition and subtraction in our everyday life
Why are fact families important
What strategies can be used to solve problems How is counting on different from just counting to add
What information do you need to know in order to find the total number of something
Why would you need to count back
How are subtraction and addition related
problems Relate counting to
addition by counting on from the higher number
Demonstrate fluency for addition by using strategies such as counting on doubles and doubles plus 1
Combine and mix two sets of 0-10 number cards One partner draws two number cards from the top of the deck students will design and generate a number story using the two numbers Both partners solve the problem in the number story and write the answer on their slate
Use concrete objects to demonstrate the relationship between two addends and the sum
Teacher will model and demonstrate using pictures and objects how objects can be moved around and still come out to equal the same sum
Develop counting on skills by students choosing a number card and partner count on from the given number
Roll two number cubes identify the higher number and count on to find sum
Use technology to show doubles different compliments of 10 songs and raps to help students memorize basic facts Poll students to discover their favorite tune
Play around the world using basic addition facts
Relate addition to subtraction by creating fact families using number cubes dominoes fact family houses etc
Turn around trains wwwk-5mathteachingresourcescom
Domino fact families wwwk-5mathteachingresourcescom
Plus one game wwwk-5mathteachingresourcescom
Students will be given word problems within 20 to solve students will use various strategies and means to solve these problems
15
Keansburg School DistrictCurriculum System
Mathematics One less game wwwk-
5mathteachingresourcescom Doubles facts wwwk-
5mathteachingresourcescom Facts of ten wwwk-
5mathteachingresourcescom Fact family house wwwk-
5mathteachingresourcescom Number sentence math wwwk-
5mathteachingresourcescom Sums of ten wwwk-
5mathteachingresourcescom
Exceeds Standard
In groups or individually students will plan and generate world problems based on real life situations
Teachers will provide pictures of groups of things such as animals people or objects Students will analyze and evaluate the picture and design a number story about the picture
Using number cards or dice create addition sentences draw a picture to represent problem and write an addition number model to correlate with the fact
With 9 10 12 side dice roll two number cubes identify the higher number and count on to find sum
Students will compose their own double facts song
Students create a 4 x 4 double facts mat with double sums Partners roll a 12-sided number cube double the top number showing and X it out on the
16
Keansburg School DistrictCurriculum System
Mathematicsmat First student to get 4 in a row wins
Take two dominoes each representing an addend and have students find the sum
Students use pennies to solve basic addition problems
Students will complete turn around facts Make ten wwwk-
5mathteachingresourcescom Make ten on the ten frame wwwk-
5mathteachingresourcescom What number ishellip wwwk-
5mathteachingresourcescom Make ten square What number ishellip
wwwk-5mathteachingresourcescom Dot card addition What number is
wwwk-5mathteachingresourcescom Addition domino train What number is
wwwk-5mathteachingresourcescom
17
Keansburg School DistrictCurriculum System
MathematicsKeansburg School DistrictCurriculum Management System
SubjectGradeLevelMathematicsGrade 1
Timeline November-Quarter 2
Topic(s) Measurement and Data
Significance of Learning Goal(s) To understand measurement and what tools and used
Sugg
este
d D
ays
of
Inst
ruct
ion Content
Standards CPI Essential Questions
Specific Learning Objective(s)
The Students Will Be Able To
Suggested ActivitiesInstructional Tools Materials
Technology Resources Assessments and Assessment
Models
CPI 1MD1 1MD2 1MD3 1MD4
EQ Why do people
use graphs How is a bar
graph like a tally chart
How would I know if a bar graph correctly shows what is on a tally chart
How could a bar graph answer a question
Concept(s) Understanding what measurement is and what tools are used
SWBAT
Compare and order the length of up to three objects using direct comparisons
Compare the lengths of two objects indirectly by using a third object
Measure objects using non-standard units and express it as a whole number
Draw an object longer or shorter than a given
Meets Standard Teacher will introduce measurement
by holding up objects and the students will examine the objects and explain the size order
o Students will break into groups and compare objects further and classify them depending on their size
Teacher will introduce the ruler Explain to students that the ruler is used to measure objects The students will then explore the classroom and select objects around the room that are smaller and larger than the ruler
Teacher will select specific body parts that the students will use as a personal unit of measurement The students will work in pairs to demonstrate how to measure objects around the room
Rulers Judy Clock Paper Plates Classroom objects Chart paper Jack Hartmann ndash Tick Tock
Song Brainpop Jr White boards Dry Erase markers Clock Concentration
Typical Assessment Question(s) or Task(s)
Analyze a bar graph and answer questions
Create a bar graph using self ndash selected topic
18
Keansburg School DistrictCurriculum System
Mathematics Do bar graphs
make it easier to understand and compare facts Why
What kind of graph should I use to answer questions
Why do I need to tell time
How many hands does a clock have
Are the hands on the clock the same size
How long is a minute
Why do I need to use a calendar
How do we use the clock and the calendar to determine what we will do in school
Why do we need to measure something
What can we use to draw and measure things
What do you think is about 1 inch long
How many steps long do you think it is from
object Organize represent
and interpret data with up to three categories on simple graphs and charts
Analyze and formulate questions based on simple graphs and charts
Identify time to the hour and half hour on both a digital and analog clock
Write time to the hour and half hour on both analog and digital clocks
Draw the hands on an analog clock for a give time to the hour or half hour
Relate times to the half hour to ldquohalf pastrdquo the hour
using their personal unit of measurement
The teacher will select a classroom object and the students will be asked to illustrate objects in the room that are bigger and smaller in size
The students will be able to organize represent and interpret data up to three categories through the use of a bar graph
The teacher will then divide students into heterogeneous groups and encourage the students to explain what they can learn from the graph The students will present findings following activity
Students will choose an object within classroom then find additional objects one being larger the other being shorter using a two-column chart Draw or write the objects in the chart
Create a human clock students will hold 12 numbered plates One student will stand in the middle as the minute and hour hand to model various times
Students will have their own demonstration clocks students will identify and find the hour and minute hands
Students create their own clocks using paper plates students will manipulate hands to identify varying times
Students will listen to Jack Hartman ldquoTick Tockrdquo song
Teachers and students will view clock on videos on brainpopjrcom students
Take 3 objects and order them from smallest to largest and largest to smallest
Read a series of clocks (analog and digital) and tell the time to the hour and half hour
Using blank clocks the students will draw the hands to show a designated time
Use a personal measurement (ie your thumb) to measure the length of an object
19
Keansburg School DistrictCurriculum System
Mathematicsthe front of the classroom to the back
If we measure in footsteps why are some of the measurements different
How is longer and shorter similar to greater and lesser
and teachers can complete quizzes available on website
Teachers will present time on an analog clock students will write the digital time on a white board
Students will play clock concentration
Exceeds Standard
The students will work in pairs to locate objects around the room and compare the lengths against each other The pairs will then work with another pair of students and compare the lengths of their objects with the objects the other pair located
Teacher will introduce the ruler in comparison to the yardstick The students will be encouraged to find objects that in the room that are larger than a ruler and measure using the yardstick
After the teacher introduces units of personal measurement the students will be encouraged to measure object in the room using their own unit of personal measurement and convert it into a standard measurement using a ruler or a yardstick
The teacher will select a classroom object and the students will be asked to illustrate objects in the room that are bigger and smaller by a specific size
The students will be able to organize represent and interpret data up to four
20
Keansburg School DistrictCurriculum System
Mathematicsor more categories through the use of a bar graph
The teacher will then divide students into heterogeneous groups and encourage the students to explain what they can learn from the graph and create a tally chart utilizing the data
Students will create clock flash cards by drawing an analog clock on one side and writing the digital clock time on the other
Give students a clock and a blue number cube ()
21
Keansburg School DistrictCurriculum System
MathematicsKeansburg School DistrictCurriculum Management System
SubjectGradeLevelMathematicsGrade 1
Timeline December-Quarter 2
Topic(s) Geometry
Significance of Learning Goal(s) To identify shapes and their attribures
Sugg
este
d D
ays
of
Inst
ruct
ion Content
Standards CPI Essential
Questions
Specific Learning Objective(s)
The Students Will Be Able To
Suggested Activities
Instructional Tools Materials
Technology Resources
Assessments and Assessment Models
CPI1G1 1G2
EQ Where do
you see shapes in our classroom
Are there different shapes outside
How are geometric figures alike
How can we sort
Concept(s) Identify shapes and their attributes
SWBAT Distinguish
between two and three-dimensional shapes by classifying their attributes For example color shape and size
Compare and contrast shapes based on their attributes
Construct and create shapes
Meets Standard Sorting shapes based on their attributes For example
number of sideso Materials attribute blocks shape card sheet sorting
mat Introduce vocabulary cylinder cube sphere rectangular
prism triangular prism pyramid Classroom shape hunt students go around the room finding shapes within the classroom For example trash can tissue box clock
o Materials shape sheet classroom objects httpilluminationsnctmorgLessonDetailaspxid=L237
Create 3-dimenstion shapes (rectangular prism pyramid cube)
o Straws twist ties shape cards Create 2-dimensional shapes (trapezoid triangle circle
rectangle rhombus)o Pattern block templates attribute blocks pattern
block template stencil geo-boards rubber bands httpilluminationsnctmorgLessonDetailaspx
Attribute blocks Shape card
sheet Sorting mat Twist ties Straws Shape cards Pattern block
templates Attribute blocks Pattern block
template stencil Geo-boards Rubber bands
22
Keansburg School DistrictCurriculum System
Mathematicsobjects of different shapes
How can shapes and solids be described compared and used to make other shapes What are equal parts
What foods do you divide into equal parts
What other items might be divided
How do you know if you have an equal share
possessing certain attributes
Identify and construct two-dimensional shapes
Identify and construct three-dimensional figures
id=L168 Create a drawing using shapes students will create a
picture using the pattern block template stencil (house sun flowers etc)
o Paper pattern block stencil template crayons
Apply understanding of attributes by playing Shape Detective and Attribute Train Game
Demonstrate understanding of 3 Dimensional shapes by playing Whatrsquos My Shape
Exceeds Standard
Introducing and exposing higher vocabulary polyhedronpolyhedra (many faces of a shape) Placing the word onto the word wall
Students read the poem Shapes by Shel Silverstein and create their own illustration of the poem to explore geometric figures and positional words
Materials httpilluminationsnctmorgLessonDetailaspxID=L202
Shapes by Shel Silverstein paper crayons pencils examples of rectangles triangles circles
Compose clues using inferencing to play Guess What Display variety of 3 dimensional shapes Silently choose
an object and give clues about it For example I amsmall I have 2 flat faces and if you trace my faces youwill get circles What am I (tomato can)
Students work together to use pattern blocks to coverother pattern blocks For example how many triangleblocks are needed to cover a hexagon block
Student rotate in groups to visit each geometric solidwhile completing a chart which shows faces sides and
Typical Assessment Question(s) or Task(s)
Ask students how many sides each shape has
Have students classify shapes based on number of sides
Have students identify shapes in the classroom
Have students create 2 and 3 dimensional shapes
Have students design pictures using pattern blockspattern block template
Have students identify and describe assigned shapersquos attributes
Ask students to name 3 dimensional shapes hidden i bag (Whatrsquos my Shape Game)
23
Keansburg School DistrictCurriculum System
Mathematics corners Students compose a shape town by using their pattern
block templates Then students will calculate the totalnumber of each pattern block used
Students will invent new shapes by using three-dimensional shapes
Students will create patterns using three dimensionalshapes
24
Keansburg School DistrictCurriculum System
MathematicsKeansburg School DistrictCurriculum Management System
SubjectGradeLevelMathematicsGrade 1
Timeline January-Quarter 2
Topic(s) Number and Operations in Base Ten
Significance of Learning Goal(s) To recognize compare and understand numbers to 120
Sugg
este
d D
ays
of
Inst
ruct
ion Content
Standards CPI Essential
Questions
Specific Learning Objective(s)
The Students Will Be Able To
Suggested ActivitiesInstructional Tools Materials
Technology Resources Assessments and Assessment
Models
25
Keansburg School DistrictCurriculum System
MathematicsCPI 1NBT1 1NBT2A 1NBT2B 1NBT2C 1NBT3
EQ How do
numbers help us
How can sets of numbers be counted compared and ordered
How can I use numbers to solve problems
How would putting numbers on a chart make it easier to understand information
How can I make it easier to understand numbers when I sort them
What is place value
Concept(s) Recognize compare and understand numbers up to 120
SWBAT Recognize read write
and count 0-120 Understand that a two-
digit number represents amounts of tens and ones
Relate groups of ten to skip counting
Compare two two-digit numbers based on meanings of tens and ones digits using symbols ltgt and =
Meets Standard Teacher will cover up specific numbers
on an enlarged number grid using cover up tape to have students identify numbers before and after Students will come up and write the missing numbers
Students will play ldquoI have__ Who has __ Teacher will create cards using index cards and numbers in which students need further practice with Students will read their cards aloud Variations of game can include identifying specific numbers identifying numbers more or less etc)
Students will use base ten blocks to represent numbers including three digit numbers Students will identify representation of numbers through these manipulatives They may match the representation to the written number
Students will write the number they created using the base ten blocks using their white boards and markers
Students will arrange given digits to create the greatest and lowest possible numbers They can show each number they create using base ten blocks
Students will use the Base Ten Exchange Game to show an
Number grids ldquoI have Who hasrdquo index
cards base ten blocks white boards markers number cards dice ten frame base ten concentration
boards (k-5 math teaching resources)
double ten frame boards (k-5 math teaching resources)
Typical Assessment Question(s) or Task(s)
Recognize numbers 1-120 using flashcards
Write numbers 1-20 using block or graph paper
Build two-digit numbers using tens and ones blocks
Listen and note students skip counting orally by tens to 120
Students compare and label two numbers using relation symbols
26
Keansburg School DistrictCurriculum System
Mathematics Why is place
value important
How can I use place value to compare and order numbers
How can I use the number grid to help me with counting numbers
How many times do you think you can hop in one minute
What does number relationships mean
Why do we need to know how to add
Why do we need to know how to subtract
How are addition and subtraction related
What are doubles
How can
understanding of exchanging ones for tens and tens for hundreds Students can use place value mats base ten blocks (cubes tens and flats) Students can take number of cubes displayed with roll of single die Students will determine when exchanging can be made when reaching ten units
Teens on the ten frame wwwk-5mathteachingresourcescom
Base ten concentration wwwk-5mathteachingresourcescom
Ten frame compare wwwk-5mathteachingresourcescom
Exceeds Standard
Students will create riddles Irsquom thinking of a number that has 4 tens and 13 ones Have students solve the riddle by regrouping the ones to find the answer
-Students use hundreds chart to jump up and down from a number to show 10 more or 10 less
-Students will play Whatrsquos my Number by giving clues based on place value odd or even and number sense For example Irsquom a two digit number The digit in my tens place is 2 more than 4
27
Keansburg School DistrictCurriculum System
Mathematicsdouble facts help us to add and subtract
Does it matter what order you use to add three numbers Why or why not
The digit in my ones place is 3 less than 8 Whatrsquos my number
My double ten frame riddle wwwk-5mathteachingresourcescom
28
Keansburg School DistrictCurriculum System
MathematicsKeansburg School DistrictCurriculum Management System
SubjectGradeLevelMathematicsGrade 1
Timeline February-Quarter 3
Topic(s) Operations amp Algebraic Expressions
Significance of Learning Goal(s) To solve addition and subtraction problems
Sugg
este
d D
ays
of
Inst
ruct
ion Content
Standards CPI
Essential Questions
Specific Learning Objective(s)
The Students Will Be Able To
Suggested ActivitiesInstructional Tools Materials
Technology Resources Assessments and Assessment
Models
CPI1OA31OA4 1OA5 1OA6 1OA7 1OA81OA2
EQ What
questions can be answered using addition
What strategies can be used to solve problems
How can we
Concept(s) Solve addition with and subtraction problems
SWBAT Solve addition problems
with sums up to 20 Use addition within 20 to
solve word problems involving real life situations
Solve word problems that call for addition of three whole numbers up to 20
Solve subtraction problems with difference up to 20
Use subtraction within 20 to solve word problems involving real
Meets Standard Model and have students create their
own individual number sentence using manipulatives and label operation symbols
Students will choose a strategy to solve number stories such as objects fingers and pictures count onback number line or number grid
Create real life situations in which students will use a strategy to solve a number story and create a number model
Review addition and subtraction number stories posters stating each key word for addition and subtraction operations
Combine and mix two sets of 0-20 number cards One partner draws two number cards from the top of the deck students will design and generate a number story using the two numbers
Materials Manipulatives (examples
counting bears connecting cubes pennies counters etc)
Slates dry erase markers erasers
Clear Sheet Protectors Sets of 0-20 number cards Number cards Cardstock Scrabble tiles letter cards
Typical Assessment Question(s) or Task(s)
Students will solve real life
29
Keansburg School DistrictCurriculum System
Mathematicstell how many
How does knowing math facts make math easier
How can numbers be helpful
Why do I need to subtract
How do we use addition and subtraction in our everyday life
Why are fact families important
What strategies can be used to solve problems How is counting on different from just counting to add
What information do you need to know in order to find
life situations Understand subtraction
as an unknown addend problem example subtract 9-5 by finding the number that makes 9 when added to 5
Both partners solve the problem in the number story and write the answer on their slate
Find three cards that have a sum of 12 how many different ways can the student make the sum of 12 using three cards students record work
-Teacher creates real life word problemsinvolving three addends up to 20
Ten frames subtraction wwwk-5mathteachingresourcescom
I have who has wwwk-5mathteachingresourcescom
True or false wwwk-5mathteachingresourcescom
Count to 20 wwwk-5mathteachingresourcescom
Exceeds Standard
Teacher creates multi step word problems for students to solve
Students work with partners or small groups to create real life word problems Compose class book of problems
Three letter addends use scrabble tiles or letter cards with corresponding numbers to make three letter words find
word problems Students will create their
own number sentences own number storiesword problems
Students will create and solve number stories in cooperative learning groups
Students will generate word problems using assigned numbers
30
Keansburg School DistrictCurriculum System
Mathematicsthe total number of something
Why would you need to count back
How are subtraction and addition related
the sum of each word by adding the numbers on the tiles Students will find which words have the greatest or smallest sum
31
Keansburg School DistrictCurriculum System
MathematicsKeansburg School DistrictCurriculum Management System
SubjectGradeLevelMathematicsGrade 1
Timeline March-Quarter 3
Topic(s) Measurement amp Data
Significance of Learning Goal(s) To tell time and compare measurements
Sugg
este
d D
ays
of
Inst
ruct
ion Content
Standards CPI
Essential Questions
Specific Learning Objective(s)
The Students Will Be Able ToSuggested Activities
Instructional Tools Materials Technology Resources
Assessments and Assessment Models
How would I know if a bar graph correctly shows what is on a tally chart
How could a bar graph answer a question
Do bar graphs make it easier to understand and compare facts Why
What kind
Concept(s) Telling time comparing measurements
SWBAT Identify and write time to
the hour and half hour on both a digital and analog clock
Write time to the hour and half-hour on both digital and analog clocks
Draw the hands on the analog clock for a given time to the hour or half-hour
Relate times to the half hour as ldquohalf-pastrdquo the hour
Compare and contrast
Meets Standard Students will have their own
demonstration clocks students will identify and find the hour and minute hands
Students create their own clocks using paper plates students will manipulate hands to identify varying times
Students will listen to Jack Hartman ldquoTick Tockrdquo song
Teachers and students will view clock on videos on brainpopjrcom students and teachers can complete quizzes available on website
Teachers will present time on an analog clock students will write the digital time on a white board
Students will play clock concentration Teacher will introduce measurement by
holding up objects and the students will examine the objects and explain the size
Large Judy Clock Individual student Judy
clocks Wipe off analogdigital clocks Clock stampers Timers Rulers Yardsticks Measuring tapes Sheet protectors Cardstock Paper plates Fasteners Index cards
Typical Assessment Question(s) or Task(s)
Students will be asked to identify and write time to the hour and half hour on both
32
Keansburg School DistrictCurriculum System
Mathematicsof graph should I use to answer questions
Why do I need to tell time
How many hands does a clock have
Are the hands on the clock the same size
How long is a minute
Why do I need to use a calendar
How do we use the clock and the calendar to determine what we will do in school
Why do we need to measure something
What can
objects by length Construct objects at
contrasting lengths
ordero Students will break into groups
and compare objects further and classify them depending on their size
Teacher will introduce the ruler Explain to students that the ruler is used to measure objects The students will then explore the classroom and select objects around the room that are smaller and larger than the ruler
Teacher will select specific body parts that the students will use as a personal unit of measurement The students will work in pairs to demonstrate how to measure objects around the room using their personal unit of measurement
The teacher will select a classroom object and the students will be asked to illustrate objects in the room that are bigger and smaller in size
The students will be able to organize represent and interpret data up to three categories through the use of a bar graph
The teacher will then divide students into heterogeneous groups and encourage the students to explain what they can learn from the graph The students will present findings following activity
Students will choose an object within classroom then find additional objects one being larger the other being shorter using a two-column chart Draw or write the objects in the chart
digital and analog clocks Students will be asked to
identify the parts of a clock students will be asked to draw the hands on an analog clock for a given time to the hour or half-hour
Students will be given various objects and will further be asked to compare and contrast the lengths of these objects
Students will be asked to provide or create objects contrasting lengths to demonstrate understanding of differences in length
33
Keansburg School DistrictCurriculum System
Mathematicswe use to draw and measure things
What do you think is about 1 inch long
How many steps long do you think it is from the front of the classroom to the back
If we measure in footsteps why are some of the measurements different
How is longer and shorter similar to greater and lesser
Exceeds Standard
The students will work in pairs to locate objects around the room and compare the lengths against each other The pairs will then work with another pair of students and compare the lengths of their objects with the objects the other pair located
Teacher will introduce the ruler in comparison to the yardstick The students will be encouraged to find objects that in the room that are larger than a ruler and measure using the yardstick
After the teacher introduces units of personal measurement the students will be encouraged to measure object in the room using their own unit of personal measurement and convert it into a standard measurement using a ruler or a yardstick
The teacher will select a classroom object and the students will be asked to illustrate objects in the room that are bigger and smaller by a specific size
The students will be able to organize represent and interpret data up to four or more categories through the use of a bar graph
The teacher will then divide students into heterogeneous groups and encourage the students to explain what they can learn from the graph and create a tally chart utilizing the data
Students will create clock flash cards by
34
Keansburg School DistrictCurriculum System
Mathematicsdrawing an analog clock on one side and writing the digital clock time on the other Students will include time in five minute intervals
Pose word problems where students have to find elapse time to the hour and half hour
Introduce second hand and conduct activities that are timed in seconds (Examples hopping on 1 foot blinking eyes counting to the highest number)
35
Keansburg School DistrictCurriculum System
MathematicsKeansburg School DistrictCurriculum Management System
SubjectGradeLevelMathematicsGrade 1
Timeline April-Quarter 4
Topic(s) Geometry
Significance of Learning Goal(s) To identify two and three dimensional shapes to understand fractional parts and create equal shares
Sugg
este
d D
ays
of
Inst
ruct
ion Content
Standards CPI Essential
Questions
Specific Learning Objective(s)
The Students Will Be Able To
Suggested ActivitiesInstructional Tools Materials
Technology Resources Assessments and Assessment
Models
Are there different shapes outside
How are geometric figures alike
How can we sort objects of different shapes
How can shapes and solids be described compared and used to make other shapes
Concept(s) Two and three dimensional shapes fractional parts equal shares
SWBAT
Combine two-dimensional or three-dimensional shapes or figures to create a new composite shape and identify the shapes within
Identify fractional parts of circles and rectangles into equal shares while developing vocabulary for halves fourths and quarters
Describe the whole as
Meets Standard
Determine which shape by touch without using their sight
o Materials attribute blocks shape sheet feely box wwwilluminationsnctmorglessondetail
Sorting 3-dimensional objects students will be given cards with 3-dimensional objects (trash can soup can globe ball tissue box box dice) they will sort them based on the 3-dimensional shape they represent
o 3-dimensional object cards sorting mats
Pizza and Cake Fractions students will utilize a pizza and a cake to work on the concept of fractions while developing the vocabulary halves quarters and fourths
o Materials teacher created pizza
Attribute blocks Geometric shapes 3-dimensional object
cards Sorting maps 3-dimensional shapes Solid and lane figures Geo-boards and rubber
bands Fraction circles Sheet protectors 2-dimensional shapes
Typical Assessment Question(s) or Task(s)
Students will be asked to describe and identify
36
Keansburg School DistrictCurriculum System
MathematicsWhat are equal parts
What foods do you divide into equal parts
What other items might be divided
How do you know if you have an equal share
two of or four of the shares Understand for these examples that decomposing into more equal shares creates smaller shares
and cake that are cut into fractions (construction paper)
Students will illustrate a picture of a boat using at least one three dimensional shape in their drawings Shapes include cubes cylinders spheres cones and rectangular prisms
Solid and Plane Figures Name the Face activity Provide three-dimensional objects Have students draw the face for each object as well as name the shape Examples ABC block juice can book party hat
Introduce fractions by having students identify shapes that show equal parts Display cut out shapes using document camera Include some shapes that are divided equally and some that are not divided equally As a whole group sort shapes into two categories Then have students go back to their desks and work with a partner to classify additional shapes
Provide students with shapes that are divided into four parts Include shapes that are divided into four equal parts and others that are unequal Students identify the shapes that are divided into four equal parts and explain their reasoning
Shape Town activity Students will design a shape town using the following shapes
shapes within combined two and three-dimensional shapes
Students will be given circles and rectangles students will be asked to divide these shapes into halves fourths and quarters
Students will be asked to sort shapes that are divided equally and not divided equally
37
Keansburg School DistrictCurriculum System
Mathematicstrapezoid hexagon square triangle and circle Afterwards students will calculate the total number of each shape they included After completing the activity students will present their final product to the class and explain how they decided which shapes to use
Given an array of dots students will draw shapes with specific number of sides and corners and connect the dots to create the shapes Example Draw a shape with 5 sides Draw a shape with 6 corners
Students will create two-dimensional shapes on geoboards Then using different colored rubber bands students will divide the shapes into equal parts Students will transfer their equally divided shapes onto geoboard paper by drawing lines to show their equal parts
Play the Fraction Path Game Materials Fraction circles a circle with frac12 shaded a circle with 13 shaded and a circle with frac14 shaded Gameboard Path consisting of assorted shapes divided into halves thirds and fourths Players Needed 3 Directions Place the fraction circles facedown Players close their eyes and pick one fraction circle Each player follows the path from start to finish Each player looks at each shape on the path and records how many shapes show their fractions Players record
38
Keansburg School DistrictCurriculum System
Mathematicstheir results on paper using tally marks At end of game students compare total number of shapes that show their fraction
Exceeds Standard
39
Keansburg School DistrictCurriculum System
MathematicsKeansburg School DistrictCurriculum Management System
SubjectGradeLevelMathematicsGrade 1
Timeline May-Quarter 4
Topic(s) Number and Operations in Base Ten
Significance of Learning Goal(s) To use place value to add and subtract
Sugg
este
d D
ays
of
Inst
ruct
ion Content
Standards CPI Essential
Questions
Specific Learning Objective(s)
The Students Will Be Able ToSuggested Activities
Instructional Tools Materials Technology Resources
Assessments and Assessment Models
40
Keansburg School DistrictCurriculum System
MathematicsCPI 1NBT4 1NBT5 1NBT6
EQ How do
numbers help us
How can sets of numbers be counted compared and ordered
How can I use numbers to solve problems
How would putting numbers on a chart make it easier to understand information
How can I make it easier to understand numbers when I sort them
What is place value
Why is place value important
How can I
Concept(s) Use place value and properties of operations to add and subtract
SWBAT Use mental math to find
10 more or ten less than a given two-digit number and explain reasoning used within any number to 120
Use place value to add within 100 add a two-digit number to a one-digit number and add a two-digit number to a multiple of ten
Understand when adding two-digit numbers that ones add to the ones and tens add to the tens and sometimes it is necessary to compose a ten by regrouping
For all above objects students will use concrete models and strategies based on place value and relate the strategy to a written method and explain the reasoning used
Subtract multiples of 10 in the range 10-90 from multiples of 10 in the range 10-90 using
Meets Standard
Comparing two digit numbers wwwk-5mathteachingresourcescom
Subtraction split wwwk-5mathteachingresourcescom
Ten more wwwk-5mathteachingresourcescom
Addition split wwwk-5mathteachingresourcescom
Exceeds Standard
Comparing 3-Digit numbers wwwk-5mathteachingresourcescom
What number is wwwk-5mathteachingresourcescom
Students develop addition and subtraction number stories and have partners solve
Create pictures using basendash10 blocks Students trace picture onto paper label the base ten blocks with their value and add total
Solve number grid puzzles by adding and subtraction 10 on the number grid
Number cards Base 10 blocks Counters Number grid puzzles Sleeve protectors wwwk-
5mathteachingresourcescom
Dice
Typical Assessment Question(s) or Task(s)
Recognize numbers 1-120 using flashcards
Write numbers 1-20 using block or graph paper
Build two-digit numbers using tens and ones blocks
Listen and note students skip counting orally by tens to 120
Students compare and label two numbers using relation symbols
41
Keansburg School DistrictCurriculum System
Mathematics
42
Keansburg School DistrictCurriculum System
MathematicsKeansburg School DistrictCurriculum Management System
SubjectGradeLevelMathematicsGrade 1
Timeline June-Quarter 4
Topic(s) Readiness skills for September of Grade 2
Significance of Learning Goal(s) To compare larger numbers add fluently and apply measurement skills
Sugg
este
d D
ays
of
Inst
ruct
ion Content
Standards CPI Essential Questions
Specific Learning Objective(s)
The Students Will Be Able ToSuggested Activities
Instructional Tools Materials Technology Resources
Assessments and Assessment Models
CPI
EQ How can I use
place value to compare and
order numbers in the 100s
How can mastering basic addition and subtraction facts help me compute larger numbers
How can I tie in
Concept(s)Use place value to compare larger numbers fluently add up to 20 apply measurement skills
SWBAT Extend place value into
the hundreds place and re-write and construct models beyond the hundreds
Fluently add and subtract within 20 using mental strategies
Apply measurement skills
Meets Standard Place Value barrier game httpwwwk-
5mathteachingresourcescommath-gameshtml (place value only)
High card
httpwwwlearningboxcomBase10 BaseTenhtml
Time barrier game httpwwwk-5mathteachingresourcescomsupport-filestimebarriergamepdf httpwwwk-5mathteachingresourcescomsupport-filestimebarriergamegridpdf
My favorite time of day writing activity
number cards base ten blocks rulers tape measurer string number relationship mat paper plates cotton balls judy clock digital clock
Typical Assessment Question(s) or Task(s)
Students will solve addition and subtraction problems within 20 in a given time
43
Keansburg School DistrictCurriculum System
Mathematicsmeasurement skills with real life experiences
httpwwwk-5mathteachingresourcescomsupport-filesmy-favorite-time-of-daypdf
Estimating length httpwwwk-5mathteachingresourcescomsupport-filesestimatinglengthpdf
Olympic golf plastic golf clubs cotton balls and tape measurer
Olympic smiles measuring smiles with string and rulers
Olympic Frisbee using paper plates and tape measurer
Olympic airplane students will make paper airplanes measure the distance that they can throw their airplane
Doubles plus 1 game httpwwwk-5mathteachingresourcescomsupport-filesdoubles-plus-onepdf
Eleven more httpwwwk-5mathteachingresourcescomsupport-fileselevenmorepdf
frame Students will be asked to
measure items using inches and centimeters
Identify and create numbers with place values extending into the hundreds place
44
Keansburg School DistrictCurriculum System
Mathematics
Building numbers with base ten blocks pick three cards and arrange them to show a 3-digit number build that number with base ten blocks repeat with the same three cards until no new numbers can be made
Length strength inches httpwwwharcourtschoolcomactivitylength_strength1_inches
Length strength centimeters httpwwwharcourtschoolcomactivitylength_strength1_centi
Exceeds Standard
Number relationship mat wwwk-5mathteachingresourcescom
Place value barrier game httpwwwk-5mathteachingresourcescommath-gameshtml (integrate other skills into place values for example the digit in my 10s place is four doubled)
Measuring the mousersquos path httpwwwk-5mathteachingresourcescomsupport-filespaths1pdf
45
Keansburg School DistrictCurriculum System
Mathematics
Double minus 1 game httpwwwk-5mathteachingresourcescomsupport-filesdoubles-minus-onepdf
Number relationship mat httpwwwk-5mathteachingresourcescomsupport-filesnumberrelationshipmatpdf
46
Keansburg School DistrictCurriculum System
Mathematicsignment Matrices of Common Core State Standards
Grade Strand Standard Standard
Sept
embe
r ndash
Oct
ober
Nov
embe
r ndash
Dec
embe
r
Janu
ary
ndash Fe
brua
ry
Mar
ch ndash
Apr
il
May
- Ju
ne
1 OA 1
CC1OA1 Represent and solve problems involving addition and subtraction Use addition and subtraction within 20 to solve word problems involving situations of adding to taking from putting together taking apart and comparing with unknowns in all positions eg by using objects drawings and equations with a symbol for the unknown number to represent the problem
1 OA 2
CC1OA2 Represent and solve problems involving addition and subtraction Solve word problems that call for addition of three whole numbers whose sum is less than or equal to 20 eg by using objects drawings and equations with a symbol for the unknown number to represent the problem
1 OA 3
CC1OA3 Understand and apply properties of operations and the relationship between addition and subtraction Apply properties of operations as strategies to add and subtract Examples If 8 + 3 = 11 is known then 3 + 8 = 11 is also known (Commutative property of addition) To add 2 + 6 + 4 the second two numbers can be added to make a ten so 2 + 6 + 4 = 2 + 10 = 12 (Associative property of addition) (Students need not use formal terms for these properties)
1 OA 4
CC1OA4 Understand and apply properties of operations and the relationship between addition and subtraction Understand subtraction as an unknown-addend problem For example subtract 10 ndash 8 by finding the number that makes 10 when added to 8
1 OA 5 CC1OA5 Add and subtract within 20 Relate counting to addition and subtraction (eg by counting on 2 to add 2)
1 OA 6 CC1OA6 Add and subtract within 20 Add and subtract within 20 demonstrating fluency for addition and subtraction within 10 Use strategies such as counting on making ten (eg 8 + 6 = 8 + 2 + 4 = 10 + 4 = 14) decomposing a number leading to a ten (eg 13 ndash 4 = 13 ndash 3 ndash 1 = 10 ndash 1 = 9) using the relationship between addition and subtraction (eg knowing that 8 + 4
47
Keansburg School DistrictCurriculum System
Mathematics= 12 one knows 12 ndash 8 = 4) and creating equivalent but easier or known sums (eg adding 6 + 7 by creating the known equivalent 6 + 6 + 1 = 12 + 1 = 13)
1 OA 7
CC1OA7 Work with addition and subtraction equations Understand the meaning of the equal sign and determine if equations involving addition and subtraction are true or false For example which of the following equations are true and which are false 6 = 6 7 = 8 ndash 1 5 + 2 = 2 + 5 4 + 1 = 5 + 2
1 OA 8
CC1OA8 Work with addition and subtraction equations Determine the unknown whole number in an addition or subtraction equation relating three whole numbers For example determine the unknown number that makes the equation true in each of the equations 8 + = 11 5 = _ ndash 3 6 + 6 = _
1 NBT 1
CC1NBT1 Extend the counting sequence Count to 120 starting at any number less than 120 In this range read and write numerals and represent a number of objects with a written numeral
1 NBT 2
CC1NBT2 Understand place value Understand that the two digits of a two-digit number represent amounts of tens and ones Understand the following as special cases -- a 10 can be thought of as a bundle of ten ones mdash called a ldquotenrdquo -- b The numbers from 11 to 19 are composed of a ten and one two three four five six seven eight or nine ones -- c The numbers 10 20 30 40 50 60 70 80 90 refer to one two three four five six seven eight or nine tens (and 0 ones)
1 NBT 3
CC1NBT3 Understand place value Compare two two-digit numbers based on meanings of the tens and ones digits recording the results of comparisons with the symbols gt = and lt
1 NBT 4
CC1NBT4 Use place value understanding and properties of operations to add and subtract Add within 100 including adding a two-digit number and a one-digit number and adding a two-digit number and a multiple of 10 using concrete models or drawings and strategies based on place value properties of operations andor the relationship between addition and subtraction relate the strategy to a written method and explain the reasoning used Understand that in adding two-digit numbers one adds tens and tens ones and ones and sometimes it is necessary to compose a ten
1 NBT 5
CC1NBT5 Use place value understanding and properties of operations to add and subtract Given a two-digit number mentally find 10 more or 10 less than the number without having to count explain the reasoning used
1 NBT 6 CC1NBT6 Use place value understanding and properties of operations to add and subtract Subtract multiples of 10 in the range 10-90 from multiples of 10 in the range 10-90 (positive or zero differences) using concrete models or drawings and strategies based on place value properties of operations andor
48
Keansburg School DistrictCurriculum System
Mathematicsthe relationship between addition and subtraction relate the strategy to a written method and explain the reasoning used
1 MD 1
CC1MD1 Measure lengths indirectly and by iterating length units Order three objects by length compare the lengths of two objects indirectly by using a third object
1 MD 2
CC1MD2 Measure lengths indirectly and by iterating length units Express the length of an object as a whole number of length units by laying multiple copies of a shorter object (the length unit) end to end understand that the length measurement of an object is the number of same-size length units that span it with no gaps or overlaps Limit to contexts where the object being measured is spanned by a whole number of length units with no gaps or overlaps
1 MD 3CC1MD3 Tell and write time Tell and write time in hours and half-hours using analog and digital clocks
1 MD 4
CC1MD4 Represent and interpret data Organize represent and interpret data with up to three categories ask and answer questions about the total number of data points how many in each category and how many more or less are in one category than in another
1 G 1
CC1G1 Reason with shapes and their attributes Distinguish between defining attributes (eg triangles are closed and three-sided) versus non-defining attributes (eg color orientation overall size) for a wide variety of shapes build and draw shapes to possess defining attributes
1 G 2
CC1G2 Reason with shapes and their attributes Compose two-dimensional shapes (rectangles squares trapezoids triangles half-circles and quarter-circles) or three-dimensional shapes (cubes right rectangular prisms right circular cones and right circular cylinders) to create a composite shape and compose new shapes from the composite shape (Students do not need to learn formal names such as ldquoright rectangular prismrdquo)
1 G 3
CC1G3 Reason with shapes and their attributes Partition circles and rectangles into two and four equal shares describe the shares using the words halves fourths and quarters and use the phrases half of fourth of and quarter of Describe the whole as two of or four of the shares Understand for these examples that decomposing into more equal shares creates smaller shares
49
Keansburg School DistrictCurriculum System
Mathematics
Common Core State Standards Vocabulary
Addition and subtraction within 5 10 20 100 or 1000 Addition or subtraction of two whole numbers with whole number answers and with sum or minuend in the range 0-5 0-10 0-20 or 0-100 respectively Example 8 + 2 = 10 is an addition within 10 14 ndash 5 = 9 is a subtraction within 20 and 55 ndash 18 = 37 is a subtraction within 100
Additive inverses Two numbers whose sum is 0 are additive inverses of one another Example 34 and ndash 34 are additive inverses of one another because 34 + (ndash 34) = (ndash 34) + 34 = 0
Associative property of addition See Table 3 in this Glossary
Associative property of multiplication See Table 3 in this Glossary
Bivariate data Pairs of linked numerical observations Example a list of heights and weights for each player on a football team
Box plot A method of visually displaying a distribution of data values by using the median quartiles and extremes of the data set A box shows the middle 50 of the data1
Commutative property See Table 3 in this Glossary
Complex fraction A fraction AB where A andor B are fractions (B nonzero)
Computation algorithm A set of predefined steps applicable to a class of problems that gives the correct result in every case when the steps are carried out correctly See also computation strategy
Computation strategy Purposeful manipulations that may be chosen for specific problems may not have a fixed order and may be aimed at converting one problem into another See also computation algorithm
Congruent Two plane or solid figures are congruent if one can be obtained from the other by rigid motion (a sequence of rotations reflections and translations)
Counting on A strategy for finding the number of objects in a group without having to count every member of the group For example if a stack of books is known to have 8 books and 3 more books are added to the top it is not necessary to count the stack
50
Keansburg School DistrictCurriculum System
Mathematicsall over again One can find the total by counting onmdashpointing to the top book and saying ldquoeightrdquo following this with ldquonine ten eleven There are eleven books nowrdquo
Dot plot See line plot
Dilation A transformation that moves each point along the ray through the point emanating from a fixed center and multiplies distances from the center by a common scale factor
Expanded form A multi-digit number is expressed in expanded form when it is written as a sum of single-digit multiples of powers of ten For example 643 = 600 + 40 + 3
Expected value For a random variable the weighted average of its possible values with weights given by their respective probabilities
First quartile For a data set with median M the first quartile is the median of the data values less than M Example For the data set 1 3 6 7 10 12 14 15 22 120 the first quartile is 62 See also median third quartile interquartile range
Fraction A number expressible in the form ab where a is a whole number and b is a positive whole number (The word fraction in these standards always refers to a non-negative number) See also rational number
Identity property of 0 See Table 3 in this Glossary
Independently combined probability models Two probability models are said to be combined independently if the probability of each ordered pair in the combined model equals the product of the original probabilities of the two individual outcomes in the ordered pair
Integer A number expressible in the form a or ndasha for some whole number a
Interquartile Range A measure of variation in a set of numerical data the interquartile range is the distance between the first and third quartiles of the data set Example For the data set 1 3 6 7 10 12 14 15 22 120 the interquartile range is 15 ndash 6 = 9 See also first quartile third quartile
Line plot A method of visually displaying a distribution of data values where each data value is shown as a dot or mark above a number line Also known as a dot plot3
51
Keansburg School DistrictCurriculum System
MathematicsMean A measure of center in a set of numerical data computed by adding the values in a list and then dividing by the number of values in the list4 Example For the data set 1 3 6 7 10 12 14 15 22 120 the mean is 21
Mean absolute deviation A measure of variation in a set of numerical data computed by adding the distances between each data value and the mean then dividing by the number of data values Example For the data set 2 3 6 7 10 12 14 15 22 120 the mean absolute deviation is 20
Median A measure of center in a set of numerical data The median of a list of values is the value appearing at the center of a sorted version of the listmdashor the mean of the two central values if the list contains an even number of values Example For the data set 2 3 6 7 10 12 14 15 22 90 the median is 11
Midline In the graph of a trigonometric function the horizontal line halfway between its maximum and minimum values
Multiplication and division within 100 Multiplication or division of two whole numbers with whole number answers and with product or dividend in the range 0-100 Example 72 divide 8 = 9
Multiplicative inverses Two numbers whose product is 1 are multiplicative inverses of one another Example 34 and 43 are multiplicative inverses of one another because 34 times 43 = 43 times 34 = 1
Number line diagram A diagram of the number line used to represent numbers and support reasoning about them In a number line diagram for measurement quantities the interval from 0 to 1 on the diagram represents the unit of measure for the quantity
Percent rate of change A rate of change expressed as a percent Example if a population grows from 50 to 55 in a year it grows by 550 = 10 per year
Probability distribution The set of possible values of a random variable with a probability assigned to each
Properties of operations See Table 3 in this Glossary
Properties of equality See Table 4 in this Glossary
Properties of inequality See Table 5 in this Glossary
Properties of operations See Table 3 in this Glossary
52
Keansburg School DistrictCurriculum System
MathematicsProbability A number between 0 and 1 used to quantify likelihood for processes that have uncertain outcomes (such as tossing a coin selecting a person at random from a group of people tossing a ball at a target or testing for a medical condition)
Probability model A probability model is used to assign probabilities to outcomes of a chance process by examining the nature of the process The set of all outcomes is called the sample space and their probabilities sum to 1 See also uniform probability model
Random variable An assignment of a numerical value to each outcome in a sample space
Rational expression A quotient of two polynomials with a non-zero denominator
Rational number A number expressible in the form ab or ndash ab for some fraction ab The rational numbers include the integers
Rectilinear figure A polygon all angles of which are right angles
Rigid motion A transformation of points in space consisting of a sequence of one or more translations reflections andor rotations Rigid motions are here assumed to preserve distances and angle measures
Repeating decimal The decimal form of a rational number See also terminating decimal
Sample space In a probability model for a random process a list of the individual outcomes that are to be considered
Scatter plot A graph in the coordinate plane representing a set of bivariate data For example the heights and weights of a group of people could be displayed on a scatter plot5
Similarity transformation A rigid motion followed by a dilation
Tape diagram A drawing that looks like a segment of tape used to illustrate number relationships Also known as a strip diagram bar model fraction strip or length model
Terminating decimal A decimal is called terminating if its repeating digit is 0
Third quartile For a data set with median M the third quartile is the median of the data values greater than M Example For the data set 2 3 6 7 10 12 14 15 22 120 the third quartile is 15 See also median first quartile interquartile range
Transitivity principle for indirect measurement If the length of object A is greater than the length of object B and the length of object B is greater than the length of object C then the length of object A is greater than the length of object C This principle applies
53
Keansburg School DistrictCurriculum System
Mathematicsto measurement of other quantities as well
Uniform probability model A probability model which assigns equal probability to all outcomes See also probability model
Vector A quantity with magnitude and direction in the plane or in space defined by an ordered pair or triple of real numbers
Visual fraction model A tape diagram number line diagram or area model
Whole numbers The numbers 0 1 2 3 hellip5
54
- MissionVision Statement
- Beliefs
- Measurement amp Data
- Measure lengths and by iterating length units
- Tell and write time
- Represent and interpret data
- Geometry
- Reason with shapes and their attributes
- Number and Base Ten
- Extend the counting sequence
- Understand place value
-
- Measurement amp Data (II)
-
- Measure lengths and by iterating length units
- Tell and write time
-
- Represent and interpret data
- Geometry (II)
- Reason with shapes their attributes
-
- Number and Base Ten
- Use place value understanding and properties of operations to add and subtract
- Teacher will cover up specific numbers on an enlarged number grid using cover up tape to have students identify numbers before and after Students will come up and write the missing numbers
- Students will play ldquoI have__ Who has __ Teacher will create cards using index cards and numbers in which students need further practice with Students will read their cards aloud Variations of game can include identifying specific numbers identifying numbers more or less etc)
- Students will use base ten blocks to represent numbers including three digit numbers Students will identify representation of numbers through these manipulatives They may match the representation to the written number
- Students will write the number they created using the base ten blocks using their white boards and markers
- Students will arrange given digits to create the greatest and lowest possible numbers They can show each number they create using base ten blocks
- Students will use the Base Ten Exchange Game to show an understanding of exchanging ones for tens and tens for hundreds Students can use place value mats base ten blocks (cubes tens and flats) Students can take number of cubes displayed with roll of single die Students will determine when exchanging can be made when reaching ten units
- Base ten concentration wwwk-5mathteachingresourcescom
- Ten frame compare wwwk-5mathteachingresourcescom
-
Keansburg School DistrictCurriculum System
Mathematics
Keansburg Public Schools
Board of Education
Mrs Judy Ferraro PresidentMs Kimberly Kelaher-Moran Vice President
Ms Delores A BartramMs Ann Marie BestMs Christine Blum
Ms Ann Commarato
Mr Michael DonaldsonMrs Patricia FrizellMr Robert Ketch
District Administration
Mr Gerald North SuperintendentDr Thomas W Tramaglini Director of Curriculum Instruction amp Funding
Ms Michelle Derpich Secondary Supervisor of Curriculum amp InstructionMrs Donna Glomb Elementary Supervisor of Curriculum amp Instruction
Mrs Michelle Halperin-Krain Supervisor of Data and AssessmentDr Brian Latwis Supervisor of Pupil Personnel Services
Ms Corey Lowell Business Administrator
Curriculum Development CommitteeBarbara AnnuzziElizabeth Castner
Deena CheslerJeanne Corey
Christina DeSoucey
Anne GraceffoNoreen Higgins
Tammie HolcombeAja Kosanke
Meghan McAvoy
Kristen MignoliKimberly Mistretta
Lisa Nigro Christina TripodiDeanne Weitzell
2
Keansburg School DistrictCurriculum System
Mathematics
3
Non-Negotiables
Graduatesthat are
prepared and
inspired to make positive
contributions to society
Believe Understand and Realize Goals
Keansburg School DistrictCurriculum System
Mathematics
MissionVision Statement
The mission of the Keansburg School District developed through relationships with all stakeholders is to identify the unique potential of each individual by creating a relevant and meaningful learning environment that promotes high
academic social and emotional expectations for our students and teachers and leads to graduates that are prepared and inspired to make positive contributions to society
Beliefs
We believe that
All children can learn To meet the challenges of change risk must be taken Every student is entitled to an equal educational opportunity It is our responsibility to enable students to succeed and become the best that they can be All individuals should be treated with dignity and respect The school system should be responsive to the diversity within our total population The degree of commitment and level of involvement in the decision-making processes from the student
community home and school will determine the quality of education Decisions should be based on the needs of the students Achievement will rise to the level of expectation Students should be taught how to learn The educational process should be a coordinated system of services and programs
4
Keansburg School DistrictCurriculum System
MathematicsCurriculum Philosophy
The curriculum philosophy of the Keansburg School District is progressive We embrace the high expectations of our students and community towards success in the 21st Century and beyond At the center of this ideal we believe that all of our students can be successful The following are our core beliefs for all curricula
All district curricula Balances policy driven trends of centralization and standardization with research and what we know is good for our
students Balances the strong emphasis on test success and curriculum standards with how and what our students must
know to be successful in our community Embraces the reality that our students differ in the way they learn and perform and personalizes instruction to
meet the needs of each learner Are aligned to be developmentally appropriate Provides teachers the support and flexibility to be innovative and creative to meet the needs of our students
Mathematics Goals
To deliver a curriculum that is Pertinent for the success of all of our students and useful for teachers in the 21st Century Problem-based where students understand the importance of mathematical concepts and applications Socially emotionally and academically driven with regards to statute and code while focusing on what is best for
each of the students in our school district to achieve successful outcomes Significant in the processes of growth and development and relevant to the students Differentiated with regards to our studentsrsquo abilities and needs Embedded with teaching responsibility respect and the value of hard work and self-pride over time Designed with both content knowledge and experiences which
o Are aligned from one grade level to the next with scaffolded underpinnings of similar concepts for successo Engage our diverse population for positive outcomeso Build and support the language of mathematicso Develop educational and mathematical independence over time
5
Keansburg School DistrictCurriculum System
MathematicsCommon Core Standards for Mathematics
OPERATIONS AND ALGEBRAIC THINKING
Represent and solve problems involving addition and subtraction
1 Use addition and subtraction within 20 to solve word problems involving situations of adding to taking from putting together taking apart and comparing with unknowns in all positions eg by using objects drawings and equations with a symbol for the unknown number to represent the problem
2 Solve word problems that call for addition of three whole numbers whose sum is less than or equal to 20 eg by using objects drawings and equations with a symbol for the unknown number to represent the problem
Understand and apply properties of operations and the relationship between addition and subtraction
3 Apply properties of operations as strategies to add and subtract3 Examples If 8 + 3 = 11 is known then 3 + 8 = 11 is also known (Commutative property of addition) To add 2 + 6 + 4 the second two numbers can be added to make a ten so 2 + 6 + 4 = 2 + 10 = 12 (Associative property of addition)
4 Understand subtraction as an unknown-addend problem For example subtract 10 ndash 8 by finding the number that makes 10 when added to 8
Add and subtract within 20
5 Relate counting to addition and subtraction (eg by counting on 2 to add 2)
6 Add and subtract within 20 demonstrating fluency for addition and subtraction within 10 Use strategies such as counting on making ten (eg 8 + 6 = 8 + 2 + 4 = 10 + 4 = 14) decomposing a number leading to a ten (eg 13 ndash 4 = 13 ndash 3 ndash 1 = 10 ndash 1 = 9) using the relationship between addition and subtraction (eg knowing that 8 + 4 = 12 one knows 12 ndash 8 = 4) and creating equivalent but easier or known sums (eg adding 6 + 7 by creating the known equivalent 6 + 6 + 1 = 12 + 1 = 13)
Work with addition and subtraction equations
7 Understand the meaning of the equal sign and determine if equations involving addition and subtraction are true or false For example which of the following equations are true and which are false 6 = 6 7 = 8 ndash 1 5 + 2 = 2 + 5 4 + 1 = 5 + 2
6
Keansburg School DistrictCurriculum System
Mathematics8 Determine the unknown whole number in an addition or subtraction equation relating three whole numbers For example
determine the unknown number that makes the equation true in each of the equations 8 + = 11 5 = 1048781 ndash 3 6 + 6 = 1048781
NUMBER AND OPERATIONS IN BASE TEN
Extend the counting sequence
1 Count to 120 starting at any number less than 120 In this range read and write numerals and represent a number of objects with a written numeral
Understand place value
2 Understand that the two digits of a two-digit number represent amounts of tens and ones Understand the following as special cases
a 10 can be thought of as a bundle of ten ones mdash called a ldquotenrdquo
b The numbers from 11 to 19 are composed of a ten and one two three four five six seven eight or nine ones
c The numbers 10 20 30 40 50 60 70 80 90 refer to one two three four five six seven eight or nine tens (and 0 ones)
3 Compare two two-digit numbers based on meanings of the tens and ones digits recording the results of comparisons with the symbols gt = and lt
Use place value understanding and properties of operations to add and subtract
4 Add within 100 including adding a two-digit number and a one-digit number and adding a two-digit number and a multiple of 10 using concrete models or drawings and strategies based on place value properties of operations andor the relationship between addition and subtraction relate the strategy to a written method and explain the reasoning used Understand that in adding two-digit numbers one adds tens and tens ones and ones and sometimes it is necessary to compose a ten
5 Given a two-digit number mentally find 10 more or 10 less than the number without having to count explain the reasoning used
6 Subtract multiples of 10 in the range 10-90 from multiples of 10 in the range 10-90 (positive or zero differences) using concrete models or drawings and strategies based on place value properties of operations andor the relationship between addition and subtraction relate the strategy to a written method and explain the reasoning used
7
Keansburg School DistrictCurriculum System
Mathematics
MEASUREMENT AND DATA
Measure lengths indirectly and by iterating length units
1 Order three objects by length compare the lengths of two objects indirectly by using a third object
2 Express the length of an object as a whole number of length units by laying multiple copies of a shorter object (the length unit) end to end understand that the length measurement of an object is the number of same-size length units that span it with no gaps or overlaps Limit to contexts where the object being measured is spanned by a whole number of length units with no gaps or overlaps
Tell and write time
3 Tell and write time in hours and half-hours using analog and digital clocks
Represent and interpret data
4 Organize represent and interpret data with up to three categories ask and answer questions about the total number of data points how many in each category and how many more or less are in one category than in another
GEOMETRY
Reason with shapes and their attributes
1 Distinguish between defining attributes (eg triangles are closed and three-sided) versus non-defining attributes (eg color orientation overall size) build and draw shapes to possess defining attributes
2 Compose two-dimensional shapes (rectangles squares trapezoids triangles half-circles and quarter-circles) or three-dimensional shapes (cubes right rectangular prisms right circular cones and right circular cylinders) to create a composite shape and compose new shapes from the composite shape
3 Partition circles and rectangles into two and four equal shares describe the shares using the words halves fourths and quarters and use the phrases half of fourth of and quarter of Describe the whole as two of or four of the shares Understand for these examples that decomposing into more equal shares creates smaller shares
8
Keansburg School DistrictCurriculum System
Mathematics
Grade 1 Scope and Sequence
SeptemberQuarter 1
Number Sense Numbers 1-20 Number writing Identifying Counting objects (up to 20)
Number 20+ Number Identification Counting 1-100 by ones and tens
OctoberQuarter 1
Operations amp Algebraic Expressions Problem solving with addition and subtraction Properties of operations Add and subtract within 20
NovemberQuarter 2
Measurement amp Data Measure lengths and by iterating length units Tell and write time Represent and interpret data
DecemberQuarter 2
Geometry Reason with shapes and their attributes
JanuaryQuarter 2
Number and Base Ten Extend the counting sequence Understand place value
FebruaryQuarter 3
Operations amp Algebraic Expressions (II) Represent and solve problems involving addition and subtraction Understand and apply properties of operations and the relationship between addition
and subtraction Add and subtract within 20 Work with addition and subtraction equations
MarchQuarter 3
Measurement amp Data (II) Measure lengths and by iterating length units Tell and write time
9
Keansburg School DistrictCurriculum System
Mathematics Represent and interpret data
AprilQuarter 4
Geometry (II) Reason with shapes their attributes
MayQuarter 4
Number and Base Ten Use place value understanding and properties of operations to add and subtract
JuneQuarter 4
Readiness skills for September of Grade 2 Problem solving with all mathematical concepts covered in Grade 1
10
Keansburg School DistrictCurriculum System
Mathematics
Keansburg School DistrictCurriculum Management System
SubjectGradeLevelMathematicsGrade 1
Timeline September-Quarter 1
Topic(s) Number Sense
Significance of Learning Goal(s) To write numbers 0-20
Sugg
este
d D
ays
of
Inst
ruct
ion Content
Standards CPI
Essential Questions
Specific Learning Objective(s)
The Students Will Be Able To
Suggested Activities Instructional Tools Materials Technology Resources Assessments and Assessment Models
CPI KCC1 KCC2 KCC3 KCC6 KOA5 KNBT1
EQ Why is it
important to recognize and write numbers
Concept(s) Kindergarten review of number sense
SWBAT
Identify write and count numbers 0-20
Count objects and represent with a number
Compare and order numbers 0-
Meets Standard Practice counting
numbers 0-20 using nursery rhymes and songs
Order numbers from 0-20 using number cards number tiles (from hundredths board)
Order numbers while understanding words such as before after between Utilize a number line to locate and order numbers
Compare numbers that greater than or less than using games such as Number Line Squeeze
Nursery Rhymes CD Math songs Number cards Number Line Squeeze-number lines Everyday Math cards Straws or popsicle sticks Calendar httpwwwstarfallcomnholidaycalendarloadhtmfampn=main school day count chart weather chart attendance chart class number grid wwwk-5mathteachingresourcescom coins counters
11
Keansburg School DistrictCurriculum System
Mathematics20 through concrete and pictorial models
Count to 100 by ones and tens
Top It and One More One Less Stories
Write numbers from 0-20 Construct numbers 11-19
by bundling groups of ten and then by counting the left over ones
Develop number sense by counting up and counting back using a given number
Incorporate number sense daily through calendar school day count class number grid weather and attendance
Reading counting books Recording tally counts
creating tally charts Find and locate numbers
on the number grid Provide students with
number lines students will need to identify and provide the missing number
Show one more wwwk-5mathteachingresourcescom
Show one less wwwk-5mathteachingresourcescom
One more on the ten frame wwwk-5mathteachingresourcescom
Typical Assessment Question(s) or Task(s) Ask students to count 0-20 Students will be asked to order numbers from 0-20 Compare numbers that greater than or less than Students will display number sense through orally counting up
and counting back using a given number Give students a given number have them identify the given
number on the number grid Have students analyze a tally chart and give the associated
number with this chart
12
Keansburg School DistrictCurriculum System
Mathematics
Exceeds Standard Practice counting
numbers 21-100 Compare numbers
greater than 20 through games
Before and after games Number grid puzzles Counting walk students
estimate step amounts from one location to another Find actual number of steps and compare the two numbers Choose other locations and repeat procedure
Students compose and solve ones and tens riddles
Counting by 5s using nickels
Counting by 10s using dimes
One moreone less scoop wwwk-5mathteachingresourcescom
13
Keansburg School DistrictCurriculum System
Mathematics
Keansburg School DistrictCurriculum Management System
SubjectGradeLevelMathematicsGrade 1
Timeline October-Quarter 1Topic(s) Operations amp Algebraic Expressions
Significance of Learning Goal(s) To solve problems using addition and subtraction within 20
Sugg
este
d
Content Standards CPI Essential
Questions
Specific Learning Objective(s)
The Students Will Be Able To
Suggested ActivitiesInstructional Tools Materials
Technology Resources Assessments and Assessment
Models
CPI 1OA31OA4 1OA5 1OA6 1OA7 1OA8
EQ What questions can
be answered using addition
What strategies can be used to solve problems
How can we tell how many
How does knowing math facts make math easier
How can numbers be helpful
Why do I need to subtract
Concept(s) Working with and solving problems using addition and subtraction within 20
SWBAT
Solve word problems within 20 using real life situations
Understand demonstrate and apply properties of operations for addition
Demonstrate fluency for addition and subtraction within 20 by using strategies to solve
Meets Standard Model a number sentence using
manipulatives and label operation symbols
Use dominoes to create an addition problem and find the sum
Solve addition problems using a number line
Students will develop different ways to solve number stories students will use objects fingers and pictures count onback number line or number grid
Create real life situations in which students will use all number story strategies to solve a problem
Teachers will pose real world number stories to the students students will synthesize pre-existing information that they know to solve the problem
Introduce and devise addition and subtraction number stories posters stating each key word for addition and subtraction operations
Dominoes Number lines Number Grids Number Cards White Boards Dry-Erase markers Pennies
Typical Assessment Question(s) or Task(s)
Students will be asked to solve addition and subtraction problems within 20 within a given time frame
Students will be given a number and be asked to count on from that given number
14
Keansburg School DistrictCurriculum System
Mathematics How do we use
addition and subtraction in our everyday life
Why are fact families important
What strategies can be used to solve problems How is counting on different from just counting to add
What information do you need to know in order to find the total number of something
Why would you need to count back
How are subtraction and addition related
problems Relate counting to
addition by counting on from the higher number
Demonstrate fluency for addition by using strategies such as counting on doubles and doubles plus 1
Combine and mix two sets of 0-10 number cards One partner draws two number cards from the top of the deck students will design and generate a number story using the two numbers Both partners solve the problem in the number story and write the answer on their slate
Use concrete objects to demonstrate the relationship between two addends and the sum
Teacher will model and demonstrate using pictures and objects how objects can be moved around and still come out to equal the same sum
Develop counting on skills by students choosing a number card and partner count on from the given number
Roll two number cubes identify the higher number and count on to find sum
Use technology to show doubles different compliments of 10 songs and raps to help students memorize basic facts Poll students to discover their favorite tune
Play around the world using basic addition facts
Relate addition to subtraction by creating fact families using number cubes dominoes fact family houses etc
Turn around trains wwwk-5mathteachingresourcescom
Domino fact families wwwk-5mathteachingresourcescom
Plus one game wwwk-5mathteachingresourcescom
Students will be given word problems within 20 to solve students will use various strategies and means to solve these problems
15
Keansburg School DistrictCurriculum System
Mathematics One less game wwwk-
5mathteachingresourcescom Doubles facts wwwk-
5mathteachingresourcescom Facts of ten wwwk-
5mathteachingresourcescom Fact family house wwwk-
5mathteachingresourcescom Number sentence math wwwk-
5mathteachingresourcescom Sums of ten wwwk-
5mathteachingresourcescom
Exceeds Standard
In groups or individually students will plan and generate world problems based on real life situations
Teachers will provide pictures of groups of things such as animals people or objects Students will analyze and evaluate the picture and design a number story about the picture
Using number cards or dice create addition sentences draw a picture to represent problem and write an addition number model to correlate with the fact
With 9 10 12 side dice roll two number cubes identify the higher number and count on to find sum
Students will compose their own double facts song
Students create a 4 x 4 double facts mat with double sums Partners roll a 12-sided number cube double the top number showing and X it out on the
16
Keansburg School DistrictCurriculum System
Mathematicsmat First student to get 4 in a row wins
Take two dominoes each representing an addend and have students find the sum
Students use pennies to solve basic addition problems
Students will complete turn around facts Make ten wwwk-
5mathteachingresourcescom Make ten on the ten frame wwwk-
5mathteachingresourcescom What number ishellip wwwk-
5mathteachingresourcescom Make ten square What number ishellip
wwwk-5mathteachingresourcescom Dot card addition What number is
wwwk-5mathteachingresourcescom Addition domino train What number is
wwwk-5mathteachingresourcescom
17
Keansburg School DistrictCurriculum System
MathematicsKeansburg School DistrictCurriculum Management System
SubjectGradeLevelMathematicsGrade 1
Timeline November-Quarter 2
Topic(s) Measurement and Data
Significance of Learning Goal(s) To understand measurement and what tools and used
Sugg
este
d D
ays
of
Inst
ruct
ion Content
Standards CPI Essential Questions
Specific Learning Objective(s)
The Students Will Be Able To
Suggested ActivitiesInstructional Tools Materials
Technology Resources Assessments and Assessment
Models
CPI 1MD1 1MD2 1MD3 1MD4
EQ Why do people
use graphs How is a bar
graph like a tally chart
How would I know if a bar graph correctly shows what is on a tally chart
How could a bar graph answer a question
Concept(s) Understanding what measurement is and what tools are used
SWBAT
Compare and order the length of up to three objects using direct comparisons
Compare the lengths of two objects indirectly by using a third object
Measure objects using non-standard units and express it as a whole number
Draw an object longer or shorter than a given
Meets Standard Teacher will introduce measurement
by holding up objects and the students will examine the objects and explain the size order
o Students will break into groups and compare objects further and classify them depending on their size
Teacher will introduce the ruler Explain to students that the ruler is used to measure objects The students will then explore the classroom and select objects around the room that are smaller and larger than the ruler
Teacher will select specific body parts that the students will use as a personal unit of measurement The students will work in pairs to demonstrate how to measure objects around the room
Rulers Judy Clock Paper Plates Classroom objects Chart paper Jack Hartmann ndash Tick Tock
Song Brainpop Jr White boards Dry Erase markers Clock Concentration
Typical Assessment Question(s) or Task(s)
Analyze a bar graph and answer questions
Create a bar graph using self ndash selected topic
18
Keansburg School DistrictCurriculum System
Mathematics Do bar graphs
make it easier to understand and compare facts Why
What kind of graph should I use to answer questions
Why do I need to tell time
How many hands does a clock have
Are the hands on the clock the same size
How long is a minute
Why do I need to use a calendar
How do we use the clock and the calendar to determine what we will do in school
Why do we need to measure something
What can we use to draw and measure things
What do you think is about 1 inch long
How many steps long do you think it is from
object Organize represent
and interpret data with up to three categories on simple graphs and charts
Analyze and formulate questions based on simple graphs and charts
Identify time to the hour and half hour on both a digital and analog clock
Write time to the hour and half hour on both analog and digital clocks
Draw the hands on an analog clock for a give time to the hour or half hour
Relate times to the half hour to ldquohalf pastrdquo the hour
using their personal unit of measurement
The teacher will select a classroom object and the students will be asked to illustrate objects in the room that are bigger and smaller in size
The students will be able to organize represent and interpret data up to three categories through the use of a bar graph
The teacher will then divide students into heterogeneous groups and encourage the students to explain what they can learn from the graph The students will present findings following activity
Students will choose an object within classroom then find additional objects one being larger the other being shorter using a two-column chart Draw or write the objects in the chart
Create a human clock students will hold 12 numbered plates One student will stand in the middle as the minute and hour hand to model various times
Students will have their own demonstration clocks students will identify and find the hour and minute hands
Students create their own clocks using paper plates students will manipulate hands to identify varying times
Students will listen to Jack Hartman ldquoTick Tockrdquo song
Teachers and students will view clock on videos on brainpopjrcom students
Take 3 objects and order them from smallest to largest and largest to smallest
Read a series of clocks (analog and digital) and tell the time to the hour and half hour
Using blank clocks the students will draw the hands to show a designated time
Use a personal measurement (ie your thumb) to measure the length of an object
19
Keansburg School DistrictCurriculum System
Mathematicsthe front of the classroom to the back
If we measure in footsteps why are some of the measurements different
How is longer and shorter similar to greater and lesser
and teachers can complete quizzes available on website
Teachers will present time on an analog clock students will write the digital time on a white board
Students will play clock concentration
Exceeds Standard
The students will work in pairs to locate objects around the room and compare the lengths against each other The pairs will then work with another pair of students and compare the lengths of their objects with the objects the other pair located
Teacher will introduce the ruler in comparison to the yardstick The students will be encouraged to find objects that in the room that are larger than a ruler and measure using the yardstick
After the teacher introduces units of personal measurement the students will be encouraged to measure object in the room using their own unit of personal measurement and convert it into a standard measurement using a ruler or a yardstick
The teacher will select a classroom object and the students will be asked to illustrate objects in the room that are bigger and smaller by a specific size
The students will be able to organize represent and interpret data up to four
20
Keansburg School DistrictCurriculum System
Mathematicsor more categories through the use of a bar graph
The teacher will then divide students into heterogeneous groups and encourage the students to explain what they can learn from the graph and create a tally chart utilizing the data
Students will create clock flash cards by drawing an analog clock on one side and writing the digital clock time on the other
Give students a clock and a blue number cube ()
21
Keansburg School DistrictCurriculum System
MathematicsKeansburg School DistrictCurriculum Management System
SubjectGradeLevelMathematicsGrade 1
Timeline December-Quarter 2
Topic(s) Geometry
Significance of Learning Goal(s) To identify shapes and their attribures
Sugg
este
d D
ays
of
Inst
ruct
ion Content
Standards CPI Essential
Questions
Specific Learning Objective(s)
The Students Will Be Able To
Suggested Activities
Instructional Tools Materials
Technology Resources
Assessments and Assessment Models
CPI1G1 1G2
EQ Where do
you see shapes in our classroom
Are there different shapes outside
How are geometric figures alike
How can we sort
Concept(s) Identify shapes and their attributes
SWBAT Distinguish
between two and three-dimensional shapes by classifying their attributes For example color shape and size
Compare and contrast shapes based on their attributes
Construct and create shapes
Meets Standard Sorting shapes based on their attributes For example
number of sideso Materials attribute blocks shape card sheet sorting
mat Introduce vocabulary cylinder cube sphere rectangular
prism triangular prism pyramid Classroom shape hunt students go around the room finding shapes within the classroom For example trash can tissue box clock
o Materials shape sheet classroom objects httpilluminationsnctmorgLessonDetailaspxid=L237
Create 3-dimenstion shapes (rectangular prism pyramid cube)
o Straws twist ties shape cards Create 2-dimensional shapes (trapezoid triangle circle
rectangle rhombus)o Pattern block templates attribute blocks pattern
block template stencil geo-boards rubber bands httpilluminationsnctmorgLessonDetailaspx
Attribute blocks Shape card
sheet Sorting mat Twist ties Straws Shape cards Pattern block
templates Attribute blocks Pattern block
template stencil Geo-boards Rubber bands
22
Keansburg School DistrictCurriculum System
Mathematicsobjects of different shapes
How can shapes and solids be described compared and used to make other shapes What are equal parts
What foods do you divide into equal parts
What other items might be divided
How do you know if you have an equal share
possessing certain attributes
Identify and construct two-dimensional shapes
Identify and construct three-dimensional figures
id=L168 Create a drawing using shapes students will create a
picture using the pattern block template stencil (house sun flowers etc)
o Paper pattern block stencil template crayons
Apply understanding of attributes by playing Shape Detective and Attribute Train Game
Demonstrate understanding of 3 Dimensional shapes by playing Whatrsquos My Shape
Exceeds Standard
Introducing and exposing higher vocabulary polyhedronpolyhedra (many faces of a shape) Placing the word onto the word wall
Students read the poem Shapes by Shel Silverstein and create their own illustration of the poem to explore geometric figures and positional words
Materials httpilluminationsnctmorgLessonDetailaspxID=L202
Shapes by Shel Silverstein paper crayons pencils examples of rectangles triangles circles
Compose clues using inferencing to play Guess What Display variety of 3 dimensional shapes Silently choose
an object and give clues about it For example I amsmall I have 2 flat faces and if you trace my faces youwill get circles What am I (tomato can)
Students work together to use pattern blocks to coverother pattern blocks For example how many triangleblocks are needed to cover a hexagon block
Student rotate in groups to visit each geometric solidwhile completing a chart which shows faces sides and
Typical Assessment Question(s) or Task(s)
Ask students how many sides each shape has
Have students classify shapes based on number of sides
Have students identify shapes in the classroom
Have students create 2 and 3 dimensional shapes
Have students design pictures using pattern blockspattern block template
Have students identify and describe assigned shapersquos attributes
Ask students to name 3 dimensional shapes hidden i bag (Whatrsquos my Shape Game)
23
Keansburg School DistrictCurriculum System
Mathematics corners Students compose a shape town by using their pattern
block templates Then students will calculate the totalnumber of each pattern block used
Students will invent new shapes by using three-dimensional shapes
Students will create patterns using three dimensionalshapes
24
Keansburg School DistrictCurriculum System
MathematicsKeansburg School DistrictCurriculum Management System
SubjectGradeLevelMathematicsGrade 1
Timeline January-Quarter 2
Topic(s) Number and Operations in Base Ten
Significance of Learning Goal(s) To recognize compare and understand numbers to 120
Sugg
este
d D
ays
of
Inst
ruct
ion Content
Standards CPI Essential
Questions
Specific Learning Objective(s)
The Students Will Be Able To
Suggested ActivitiesInstructional Tools Materials
Technology Resources Assessments and Assessment
Models
25
Keansburg School DistrictCurriculum System
MathematicsCPI 1NBT1 1NBT2A 1NBT2B 1NBT2C 1NBT3
EQ How do
numbers help us
How can sets of numbers be counted compared and ordered
How can I use numbers to solve problems
How would putting numbers on a chart make it easier to understand information
How can I make it easier to understand numbers when I sort them
What is place value
Concept(s) Recognize compare and understand numbers up to 120
SWBAT Recognize read write
and count 0-120 Understand that a two-
digit number represents amounts of tens and ones
Relate groups of ten to skip counting
Compare two two-digit numbers based on meanings of tens and ones digits using symbols ltgt and =
Meets Standard Teacher will cover up specific numbers
on an enlarged number grid using cover up tape to have students identify numbers before and after Students will come up and write the missing numbers
Students will play ldquoI have__ Who has __ Teacher will create cards using index cards and numbers in which students need further practice with Students will read their cards aloud Variations of game can include identifying specific numbers identifying numbers more or less etc)
Students will use base ten blocks to represent numbers including three digit numbers Students will identify representation of numbers through these manipulatives They may match the representation to the written number
Students will write the number they created using the base ten blocks using their white boards and markers
Students will arrange given digits to create the greatest and lowest possible numbers They can show each number they create using base ten blocks
Students will use the Base Ten Exchange Game to show an
Number grids ldquoI have Who hasrdquo index
cards base ten blocks white boards markers number cards dice ten frame base ten concentration
boards (k-5 math teaching resources)
double ten frame boards (k-5 math teaching resources)
Typical Assessment Question(s) or Task(s)
Recognize numbers 1-120 using flashcards
Write numbers 1-20 using block or graph paper
Build two-digit numbers using tens and ones blocks
Listen and note students skip counting orally by tens to 120
Students compare and label two numbers using relation symbols
26
Keansburg School DistrictCurriculum System
Mathematics Why is place
value important
How can I use place value to compare and order numbers
How can I use the number grid to help me with counting numbers
How many times do you think you can hop in one minute
What does number relationships mean
Why do we need to know how to add
Why do we need to know how to subtract
How are addition and subtraction related
What are doubles
How can
understanding of exchanging ones for tens and tens for hundreds Students can use place value mats base ten blocks (cubes tens and flats) Students can take number of cubes displayed with roll of single die Students will determine when exchanging can be made when reaching ten units
Teens on the ten frame wwwk-5mathteachingresourcescom
Base ten concentration wwwk-5mathteachingresourcescom
Ten frame compare wwwk-5mathteachingresourcescom
Exceeds Standard
Students will create riddles Irsquom thinking of a number that has 4 tens and 13 ones Have students solve the riddle by regrouping the ones to find the answer
-Students use hundreds chart to jump up and down from a number to show 10 more or 10 less
-Students will play Whatrsquos my Number by giving clues based on place value odd or even and number sense For example Irsquom a two digit number The digit in my tens place is 2 more than 4
27
Keansburg School DistrictCurriculum System
Mathematicsdouble facts help us to add and subtract
Does it matter what order you use to add three numbers Why or why not
The digit in my ones place is 3 less than 8 Whatrsquos my number
My double ten frame riddle wwwk-5mathteachingresourcescom
28
Keansburg School DistrictCurriculum System
MathematicsKeansburg School DistrictCurriculum Management System
SubjectGradeLevelMathematicsGrade 1
Timeline February-Quarter 3
Topic(s) Operations amp Algebraic Expressions
Significance of Learning Goal(s) To solve addition and subtraction problems
Sugg
este
d D
ays
of
Inst
ruct
ion Content
Standards CPI
Essential Questions
Specific Learning Objective(s)
The Students Will Be Able To
Suggested ActivitiesInstructional Tools Materials
Technology Resources Assessments and Assessment
Models
CPI1OA31OA4 1OA5 1OA6 1OA7 1OA81OA2
EQ What
questions can be answered using addition
What strategies can be used to solve problems
How can we
Concept(s) Solve addition with and subtraction problems
SWBAT Solve addition problems
with sums up to 20 Use addition within 20 to
solve word problems involving real life situations
Solve word problems that call for addition of three whole numbers up to 20
Solve subtraction problems with difference up to 20
Use subtraction within 20 to solve word problems involving real
Meets Standard Model and have students create their
own individual number sentence using manipulatives and label operation symbols
Students will choose a strategy to solve number stories such as objects fingers and pictures count onback number line or number grid
Create real life situations in which students will use a strategy to solve a number story and create a number model
Review addition and subtraction number stories posters stating each key word for addition and subtraction operations
Combine and mix two sets of 0-20 number cards One partner draws two number cards from the top of the deck students will design and generate a number story using the two numbers
Materials Manipulatives (examples
counting bears connecting cubes pennies counters etc)
Slates dry erase markers erasers
Clear Sheet Protectors Sets of 0-20 number cards Number cards Cardstock Scrabble tiles letter cards
Typical Assessment Question(s) or Task(s)
Students will solve real life
29
Keansburg School DistrictCurriculum System
Mathematicstell how many
How does knowing math facts make math easier
How can numbers be helpful
Why do I need to subtract
How do we use addition and subtraction in our everyday life
Why are fact families important
What strategies can be used to solve problems How is counting on different from just counting to add
What information do you need to know in order to find
life situations Understand subtraction
as an unknown addend problem example subtract 9-5 by finding the number that makes 9 when added to 5
Both partners solve the problem in the number story and write the answer on their slate
Find three cards that have a sum of 12 how many different ways can the student make the sum of 12 using three cards students record work
-Teacher creates real life word problemsinvolving three addends up to 20
Ten frames subtraction wwwk-5mathteachingresourcescom
I have who has wwwk-5mathteachingresourcescom
True or false wwwk-5mathteachingresourcescom
Count to 20 wwwk-5mathteachingresourcescom
Exceeds Standard
Teacher creates multi step word problems for students to solve
Students work with partners or small groups to create real life word problems Compose class book of problems
Three letter addends use scrabble tiles or letter cards with corresponding numbers to make three letter words find
word problems Students will create their
own number sentences own number storiesword problems
Students will create and solve number stories in cooperative learning groups
Students will generate word problems using assigned numbers
30
Keansburg School DistrictCurriculum System
Mathematicsthe total number of something
Why would you need to count back
How are subtraction and addition related
the sum of each word by adding the numbers on the tiles Students will find which words have the greatest or smallest sum
31
Keansburg School DistrictCurriculum System
MathematicsKeansburg School DistrictCurriculum Management System
SubjectGradeLevelMathematicsGrade 1
Timeline March-Quarter 3
Topic(s) Measurement amp Data
Significance of Learning Goal(s) To tell time and compare measurements
Sugg
este
d D
ays
of
Inst
ruct
ion Content
Standards CPI
Essential Questions
Specific Learning Objective(s)
The Students Will Be Able ToSuggested Activities
Instructional Tools Materials Technology Resources
Assessments and Assessment Models
How would I know if a bar graph correctly shows what is on a tally chart
How could a bar graph answer a question
Do bar graphs make it easier to understand and compare facts Why
What kind
Concept(s) Telling time comparing measurements
SWBAT Identify and write time to
the hour and half hour on both a digital and analog clock
Write time to the hour and half-hour on both digital and analog clocks
Draw the hands on the analog clock for a given time to the hour or half-hour
Relate times to the half hour as ldquohalf-pastrdquo the hour
Compare and contrast
Meets Standard Students will have their own
demonstration clocks students will identify and find the hour and minute hands
Students create their own clocks using paper plates students will manipulate hands to identify varying times
Students will listen to Jack Hartman ldquoTick Tockrdquo song
Teachers and students will view clock on videos on brainpopjrcom students and teachers can complete quizzes available on website
Teachers will present time on an analog clock students will write the digital time on a white board
Students will play clock concentration Teacher will introduce measurement by
holding up objects and the students will examine the objects and explain the size
Large Judy Clock Individual student Judy
clocks Wipe off analogdigital clocks Clock stampers Timers Rulers Yardsticks Measuring tapes Sheet protectors Cardstock Paper plates Fasteners Index cards
Typical Assessment Question(s) or Task(s)
Students will be asked to identify and write time to the hour and half hour on both
32
Keansburg School DistrictCurriculum System
Mathematicsof graph should I use to answer questions
Why do I need to tell time
How many hands does a clock have
Are the hands on the clock the same size
How long is a minute
Why do I need to use a calendar
How do we use the clock and the calendar to determine what we will do in school
Why do we need to measure something
What can
objects by length Construct objects at
contrasting lengths
ordero Students will break into groups
and compare objects further and classify them depending on their size
Teacher will introduce the ruler Explain to students that the ruler is used to measure objects The students will then explore the classroom and select objects around the room that are smaller and larger than the ruler
Teacher will select specific body parts that the students will use as a personal unit of measurement The students will work in pairs to demonstrate how to measure objects around the room using their personal unit of measurement
The teacher will select a classroom object and the students will be asked to illustrate objects in the room that are bigger and smaller in size
The students will be able to organize represent and interpret data up to three categories through the use of a bar graph
The teacher will then divide students into heterogeneous groups and encourage the students to explain what they can learn from the graph The students will present findings following activity
Students will choose an object within classroom then find additional objects one being larger the other being shorter using a two-column chart Draw or write the objects in the chart
digital and analog clocks Students will be asked to
identify the parts of a clock students will be asked to draw the hands on an analog clock for a given time to the hour or half-hour
Students will be given various objects and will further be asked to compare and contrast the lengths of these objects
Students will be asked to provide or create objects contrasting lengths to demonstrate understanding of differences in length
33
Keansburg School DistrictCurriculum System
Mathematicswe use to draw and measure things
What do you think is about 1 inch long
How many steps long do you think it is from the front of the classroom to the back
If we measure in footsteps why are some of the measurements different
How is longer and shorter similar to greater and lesser
Exceeds Standard
The students will work in pairs to locate objects around the room and compare the lengths against each other The pairs will then work with another pair of students and compare the lengths of their objects with the objects the other pair located
Teacher will introduce the ruler in comparison to the yardstick The students will be encouraged to find objects that in the room that are larger than a ruler and measure using the yardstick
After the teacher introduces units of personal measurement the students will be encouraged to measure object in the room using their own unit of personal measurement and convert it into a standard measurement using a ruler or a yardstick
The teacher will select a classroom object and the students will be asked to illustrate objects in the room that are bigger and smaller by a specific size
The students will be able to organize represent and interpret data up to four or more categories through the use of a bar graph
The teacher will then divide students into heterogeneous groups and encourage the students to explain what they can learn from the graph and create a tally chart utilizing the data
Students will create clock flash cards by
34
Keansburg School DistrictCurriculum System
Mathematicsdrawing an analog clock on one side and writing the digital clock time on the other Students will include time in five minute intervals
Pose word problems where students have to find elapse time to the hour and half hour
Introduce second hand and conduct activities that are timed in seconds (Examples hopping on 1 foot blinking eyes counting to the highest number)
35
Keansburg School DistrictCurriculum System
MathematicsKeansburg School DistrictCurriculum Management System
SubjectGradeLevelMathematicsGrade 1
Timeline April-Quarter 4
Topic(s) Geometry
Significance of Learning Goal(s) To identify two and three dimensional shapes to understand fractional parts and create equal shares
Sugg
este
d D
ays
of
Inst
ruct
ion Content
Standards CPI Essential
Questions
Specific Learning Objective(s)
The Students Will Be Able To
Suggested ActivitiesInstructional Tools Materials
Technology Resources Assessments and Assessment
Models
Are there different shapes outside
How are geometric figures alike
How can we sort objects of different shapes
How can shapes and solids be described compared and used to make other shapes
Concept(s) Two and three dimensional shapes fractional parts equal shares
SWBAT
Combine two-dimensional or three-dimensional shapes or figures to create a new composite shape and identify the shapes within
Identify fractional parts of circles and rectangles into equal shares while developing vocabulary for halves fourths and quarters
Describe the whole as
Meets Standard
Determine which shape by touch without using their sight
o Materials attribute blocks shape sheet feely box wwwilluminationsnctmorglessondetail
Sorting 3-dimensional objects students will be given cards with 3-dimensional objects (trash can soup can globe ball tissue box box dice) they will sort them based on the 3-dimensional shape they represent
o 3-dimensional object cards sorting mats
Pizza and Cake Fractions students will utilize a pizza and a cake to work on the concept of fractions while developing the vocabulary halves quarters and fourths
o Materials teacher created pizza
Attribute blocks Geometric shapes 3-dimensional object
cards Sorting maps 3-dimensional shapes Solid and lane figures Geo-boards and rubber
bands Fraction circles Sheet protectors 2-dimensional shapes
Typical Assessment Question(s) or Task(s)
Students will be asked to describe and identify
36
Keansburg School DistrictCurriculum System
MathematicsWhat are equal parts
What foods do you divide into equal parts
What other items might be divided
How do you know if you have an equal share
two of or four of the shares Understand for these examples that decomposing into more equal shares creates smaller shares
and cake that are cut into fractions (construction paper)
Students will illustrate a picture of a boat using at least one three dimensional shape in their drawings Shapes include cubes cylinders spheres cones and rectangular prisms
Solid and Plane Figures Name the Face activity Provide three-dimensional objects Have students draw the face for each object as well as name the shape Examples ABC block juice can book party hat
Introduce fractions by having students identify shapes that show equal parts Display cut out shapes using document camera Include some shapes that are divided equally and some that are not divided equally As a whole group sort shapes into two categories Then have students go back to their desks and work with a partner to classify additional shapes
Provide students with shapes that are divided into four parts Include shapes that are divided into four equal parts and others that are unequal Students identify the shapes that are divided into four equal parts and explain their reasoning
Shape Town activity Students will design a shape town using the following shapes
shapes within combined two and three-dimensional shapes
Students will be given circles and rectangles students will be asked to divide these shapes into halves fourths and quarters
Students will be asked to sort shapes that are divided equally and not divided equally
37
Keansburg School DistrictCurriculum System
Mathematicstrapezoid hexagon square triangle and circle Afterwards students will calculate the total number of each shape they included After completing the activity students will present their final product to the class and explain how they decided which shapes to use
Given an array of dots students will draw shapes with specific number of sides and corners and connect the dots to create the shapes Example Draw a shape with 5 sides Draw a shape with 6 corners
Students will create two-dimensional shapes on geoboards Then using different colored rubber bands students will divide the shapes into equal parts Students will transfer their equally divided shapes onto geoboard paper by drawing lines to show their equal parts
Play the Fraction Path Game Materials Fraction circles a circle with frac12 shaded a circle with 13 shaded and a circle with frac14 shaded Gameboard Path consisting of assorted shapes divided into halves thirds and fourths Players Needed 3 Directions Place the fraction circles facedown Players close their eyes and pick one fraction circle Each player follows the path from start to finish Each player looks at each shape on the path and records how many shapes show their fractions Players record
38
Keansburg School DistrictCurriculum System
Mathematicstheir results on paper using tally marks At end of game students compare total number of shapes that show their fraction
Exceeds Standard
39
Keansburg School DistrictCurriculum System
MathematicsKeansburg School DistrictCurriculum Management System
SubjectGradeLevelMathematicsGrade 1
Timeline May-Quarter 4
Topic(s) Number and Operations in Base Ten
Significance of Learning Goal(s) To use place value to add and subtract
Sugg
este
d D
ays
of
Inst
ruct
ion Content
Standards CPI Essential
Questions
Specific Learning Objective(s)
The Students Will Be Able ToSuggested Activities
Instructional Tools Materials Technology Resources
Assessments and Assessment Models
40
Keansburg School DistrictCurriculum System
MathematicsCPI 1NBT4 1NBT5 1NBT6
EQ How do
numbers help us
How can sets of numbers be counted compared and ordered
How can I use numbers to solve problems
How would putting numbers on a chart make it easier to understand information
How can I make it easier to understand numbers when I sort them
What is place value
Why is place value important
How can I
Concept(s) Use place value and properties of operations to add and subtract
SWBAT Use mental math to find
10 more or ten less than a given two-digit number and explain reasoning used within any number to 120
Use place value to add within 100 add a two-digit number to a one-digit number and add a two-digit number to a multiple of ten
Understand when adding two-digit numbers that ones add to the ones and tens add to the tens and sometimes it is necessary to compose a ten by regrouping
For all above objects students will use concrete models and strategies based on place value and relate the strategy to a written method and explain the reasoning used
Subtract multiples of 10 in the range 10-90 from multiples of 10 in the range 10-90 using
Meets Standard
Comparing two digit numbers wwwk-5mathteachingresourcescom
Subtraction split wwwk-5mathteachingresourcescom
Ten more wwwk-5mathteachingresourcescom
Addition split wwwk-5mathteachingresourcescom
Exceeds Standard
Comparing 3-Digit numbers wwwk-5mathteachingresourcescom
What number is wwwk-5mathteachingresourcescom
Students develop addition and subtraction number stories and have partners solve
Create pictures using basendash10 blocks Students trace picture onto paper label the base ten blocks with their value and add total
Solve number grid puzzles by adding and subtraction 10 on the number grid
Number cards Base 10 blocks Counters Number grid puzzles Sleeve protectors wwwk-
5mathteachingresourcescom
Dice
Typical Assessment Question(s) or Task(s)
Recognize numbers 1-120 using flashcards
Write numbers 1-20 using block or graph paper
Build two-digit numbers using tens and ones blocks
Listen and note students skip counting orally by tens to 120
Students compare and label two numbers using relation symbols
41
Keansburg School DistrictCurriculum System
Mathematics
42
Keansburg School DistrictCurriculum System
MathematicsKeansburg School DistrictCurriculum Management System
SubjectGradeLevelMathematicsGrade 1
Timeline June-Quarter 4
Topic(s) Readiness skills for September of Grade 2
Significance of Learning Goal(s) To compare larger numbers add fluently and apply measurement skills
Sugg
este
d D
ays
of
Inst
ruct
ion Content
Standards CPI Essential Questions
Specific Learning Objective(s)
The Students Will Be Able ToSuggested Activities
Instructional Tools Materials Technology Resources
Assessments and Assessment Models
CPI
EQ How can I use
place value to compare and
order numbers in the 100s
How can mastering basic addition and subtraction facts help me compute larger numbers
How can I tie in
Concept(s)Use place value to compare larger numbers fluently add up to 20 apply measurement skills
SWBAT Extend place value into
the hundreds place and re-write and construct models beyond the hundreds
Fluently add and subtract within 20 using mental strategies
Apply measurement skills
Meets Standard Place Value barrier game httpwwwk-
5mathteachingresourcescommath-gameshtml (place value only)
High card
httpwwwlearningboxcomBase10 BaseTenhtml
Time barrier game httpwwwk-5mathteachingresourcescomsupport-filestimebarriergamepdf httpwwwk-5mathteachingresourcescomsupport-filestimebarriergamegridpdf
My favorite time of day writing activity
number cards base ten blocks rulers tape measurer string number relationship mat paper plates cotton balls judy clock digital clock
Typical Assessment Question(s) or Task(s)
Students will solve addition and subtraction problems within 20 in a given time
43
Keansburg School DistrictCurriculum System
Mathematicsmeasurement skills with real life experiences
httpwwwk-5mathteachingresourcescomsupport-filesmy-favorite-time-of-daypdf
Estimating length httpwwwk-5mathteachingresourcescomsupport-filesestimatinglengthpdf
Olympic golf plastic golf clubs cotton balls and tape measurer
Olympic smiles measuring smiles with string and rulers
Olympic Frisbee using paper plates and tape measurer
Olympic airplane students will make paper airplanes measure the distance that they can throw their airplane
Doubles plus 1 game httpwwwk-5mathteachingresourcescomsupport-filesdoubles-plus-onepdf
Eleven more httpwwwk-5mathteachingresourcescomsupport-fileselevenmorepdf
frame Students will be asked to
measure items using inches and centimeters
Identify and create numbers with place values extending into the hundreds place
44
Keansburg School DistrictCurriculum System
Mathematics
Building numbers with base ten blocks pick three cards and arrange them to show a 3-digit number build that number with base ten blocks repeat with the same three cards until no new numbers can be made
Length strength inches httpwwwharcourtschoolcomactivitylength_strength1_inches
Length strength centimeters httpwwwharcourtschoolcomactivitylength_strength1_centi
Exceeds Standard
Number relationship mat wwwk-5mathteachingresourcescom
Place value barrier game httpwwwk-5mathteachingresourcescommath-gameshtml (integrate other skills into place values for example the digit in my 10s place is four doubled)
Measuring the mousersquos path httpwwwk-5mathteachingresourcescomsupport-filespaths1pdf
45
Keansburg School DistrictCurriculum System
Mathematics
Double minus 1 game httpwwwk-5mathteachingresourcescomsupport-filesdoubles-minus-onepdf
Number relationship mat httpwwwk-5mathteachingresourcescomsupport-filesnumberrelationshipmatpdf
46
Keansburg School DistrictCurriculum System
Mathematicsignment Matrices of Common Core State Standards
Grade Strand Standard Standard
Sept
embe
r ndash
Oct
ober
Nov
embe
r ndash
Dec
embe
r
Janu
ary
ndash Fe
brua
ry
Mar
ch ndash
Apr
il
May
- Ju
ne
1 OA 1
CC1OA1 Represent and solve problems involving addition and subtraction Use addition and subtraction within 20 to solve word problems involving situations of adding to taking from putting together taking apart and comparing with unknowns in all positions eg by using objects drawings and equations with a symbol for the unknown number to represent the problem
1 OA 2
CC1OA2 Represent and solve problems involving addition and subtraction Solve word problems that call for addition of three whole numbers whose sum is less than or equal to 20 eg by using objects drawings and equations with a symbol for the unknown number to represent the problem
1 OA 3
CC1OA3 Understand and apply properties of operations and the relationship between addition and subtraction Apply properties of operations as strategies to add and subtract Examples If 8 + 3 = 11 is known then 3 + 8 = 11 is also known (Commutative property of addition) To add 2 + 6 + 4 the second two numbers can be added to make a ten so 2 + 6 + 4 = 2 + 10 = 12 (Associative property of addition) (Students need not use formal terms for these properties)
1 OA 4
CC1OA4 Understand and apply properties of operations and the relationship between addition and subtraction Understand subtraction as an unknown-addend problem For example subtract 10 ndash 8 by finding the number that makes 10 when added to 8
1 OA 5 CC1OA5 Add and subtract within 20 Relate counting to addition and subtraction (eg by counting on 2 to add 2)
1 OA 6 CC1OA6 Add and subtract within 20 Add and subtract within 20 demonstrating fluency for addition and subtraction within 10 Use strategies such as counting on making ten (eg 8 + 6 = 8 + 2 + 4 = 10 + 4 = 14) decomposing a number leading to a ten (eg 13 ndash 4 = 13 ndash 3 ndash 1 = 10 ndash 1 = 9) using the relationship between addition and subtraction (eg knowing that 8 + 4
47
Keansburg School DistrictCurriculum System
Mathematics= 12 one knows 12 ndash 8 = 4) and creating equivalent but easier or known sums (eg adding 6 + 7 by creating the known equivalent 6 + 6 + 1 = 12 + 1 = 13)
1 OA 7
CC1OA7 Work with addition and subtraction equations Understand the meaning of the equal sign and determine if equations involving addition and subtraction are true or false For example which of the following equations are true and which are false 6 = 6 7 = 8 ndash 1 5 + 2 = 2 + 5 4 + 1 = 5 + 2
1 OA 8
CC1OA8 Work with addition and subtraction equations Determine the unknown whole number in an addition or subtraction equation relating three whole numbers For example determine the unknown number that makes the equation true in each of the equations 8 + = 11 5 = _ ndash 3 6 + 6 = _
1 NBT 1
CC1NBT1 Extend the counting sequence Count to 120 starting at any number less than 120 In this range read and write numerals and represent a number of objects with a written numeral
1 NBT 2
CC1NBT2 Understand place value Understand that the two digits of a two-digit number represent amounts of tens and ones Understand the following as special cases -- a 10 can be thought of as a bundle of ten ones mdash called a ldquotenrdquo -- b The numbers from 11 to 19 are composed of a ten and one two three four five six seven eight or nine ones -- c The numbers 10 20 30 40 50 60 70 80 90 refer to one two three four five six seven eight or nine tens (and 0 ones)
1 NBT 3
CC1NBT3 Understand place value Compare two two-digit numbers based on meanings of the tens and ones digits recording the results of comparisons with the symbols gt = and lt
1 NBT 4
CC1NBT4 Use place value understanding and properties of operations to add and subtract Add within 100 including adding a two-digit number and a one-digit number and adding a two-digit number and a multiple of 10 using concrete models or drawings and strategies based on place value properties of operations andor the relationship between addition and subtraction relate the strategy to a written method and explain the reasoning used Understand that in adding two-digit numbers one adds tens and tens ones and ones and sometimes it is necessary to compose a ten
1 NBT 5
CC1NBT5 Use place value understanding and properties of operations to add and subtract Given a two-digit number mentally find 10 more or 10 less than the number without having to count explain the reasoning used
1 NBT 6 CC1NBT6 Use place value understanding and properties of operations to add and subtract Subtract multiples of 10 in the range 10-90 from multiples of 10 in the range 10-90 (positive or zero differences) using concrete models or drawings and strategies based on place value properties of operations andor
48
Keansburg School DistrictCurriculum System
Mathematicsthe relationship between addition and subtraction relate the strategy to a written method and explain the reasoning used
1 MD 1
CC1MD1 Measure lengths indirectly and by iterating length units Order three objects by length compare the lengths of two objects indirectly by using a third object
1 MD 2
CC1MD2 Measure lengths indirectly and by iterating length units Express the length of an object as a whole number of length units by laying multiple copies of a shorter object (the length unit) end to end understand that the length measurement of an object is the number of same-size length units that span it with no gaps or overlaps Limit to contexts where the object being measured is spanned by a whole number of length units with no gaps or overlaps
1 MD 3CC1MD3 Tell and write time Tell and write time in hours and half-hours using analog and digital clocks
1 MD 4
CC1MD4 Represent and interpret data Organize represent and interpret data with up to three categories ask and answer questions about the total number of data points how many in each category and how many more or less are in one category than in another
1 G 1
CC1G1 Reason with shapes and their attributes Distinguish between defining attributes (eg triangles are closed and three-sided) versus non-defining attributes (eg color orientation overall size) for a wide variety of shapes build and draw shapes to possess defining attributes
1 G 2
CC1G2 Reason with shapes and their attributes Compose two-dimensional shapes (rectangles squares trapezoids triangles half-circles and quarter-circles) or three-dimensional shapes (cubes right rectangular prisms right circular cones and right circular cylinders) to create a composite shape and compose new shapes from the composite shape (Students do not need to learn formal names such as ldquoright rectangular prismrdquo)
1 G 3
CC1G3 Reason with shapes and their attributes Partition circles and rectangles into two and four equal shares describe the shares using the words halves fourths and quarters and use the phrases half of fourth of and quarter of Describe the whole as two of or four of the shares Understand for these examples that decomposing into more equal shares creates smaller shares
49
Keansburg School DistrictCurriculum System
Mathematics
Common Core State Standards Vocabulary
Addition and subtraction within 5 10 20 100 or 1000 Addition or subtraction of two whole numbers with whole number answers and with sum or minuend in the range 0-5 0-10 0-20 or 0-100 respectively Example 8 + 2 = 10 is an addition within 10 14 ndash 5 = 9 is a subtraction within 20 and 55 ndash 18 = 37 is a subtraction within 100
Additive inverses Two numbers whose sum is 0 are additive inverses of one another Example 34 and ndash 34 are additive inverses of one another because 34 + (ndash 34) = (ndash 34) + 34 = 0
Associative property of addition See Table 3 in this Glossary
Associative property of multiplication See Table 3 in this Glossary
Bivariate data Pairs of linked numerical observations Example a list of heights and weights for each player on a football team
Box plot A method of visually displaying a distribution of data values by using the median quartiles and extremes of the data set A box shows the middle 50 of the data1
Commutative property See Table 3 in this Glossary
Complex fraction A fraction AB where A andor B are fractions (B nonzero)
Computation algorithm A set of predefined steps applicable to a class of problems that gives the correct result in every case when the steps are carried out correctly See also computation strategy
Computation strategy Purposeful manipulations that may be chosen for specific problems may not have a fixed order and may be aimed at converting one problem into another See also computation algorithm
Congruent Two plane or solid figures are congruent if one can be obtained from the other by rigid motion (a sequence of rotations reflections and translations)
Counting on A strategy for finding the number of objects in a group without having to count every member of the group For example if a stack of books is known to have 8 books and 3 more books are added to the top it is not necessary to count the stack
50
Keansburg School DistrictCurriculum System
Mathematicsall over again One can find the total by counting onmdashpointing to the top book and saying ldquoeightrdquo following this with ldquonine ten eleven There are eleven books nowrdquo
Dot plot See line plot
Dilation A transformation that moves each point along the ray through the point emanating from a fixed center and multiplies distances from the center by a common scale factor
Expanded form A multi-digit number is expressed in expanded form when it is written as a sum of single-digit multiples of powers of ten For example 643 = 600 + 40 + 3
Expected value For a random variable the weighted average of its possible values with weights given by their respective probabilities
First quartile For a data set with median M the first quartile is the median of the data values less than M Example For the data set 1 3 6 7 10 12 14 15 22 120 the first quartile is 62 See also median third quartile interquartile range
Fraction A number expressible in the form ab where a is a whole number and b is a positive whole number (The word fraction in these standards always refers to a non-negative number) See also rational number
Identity property of 0 See Table 3 in this Glossary
Independently combined probability models Two probability models are said to be combined independently if the probability of each ordered pair in the combined model equals the product of the original probabilities of the two individual outcomes in the ordered pair
Integer A number expressible in the form a or ndasha for some whole number a
Interquartile Range A measure of variation in a set of numerical data the interquartile range is the distance between the first and third quartiles of the data set Example For the data set 1 3 6 7 10 12 14 15 22 120 the interquartile range is 15 ndash 6 = 9 See also first quartile third quartile
Line plot A method of visually displaying a distribution of data values where each data value is shown as a dot or mark above a number line Also known as a dot plot3
51
Keansburg School DistrictCurriculum System
MathematicsMean A measure of center in a set of numerical data computed by adding the values in a list and then dividing by the number of values in the list4 Example For the data set 1 3 6 7 10 12 14 15 22 120 the mean is 21
Mean absolute deviation A measure of variation in a set of numerical data computed by adding the distances between each data value and the mean then dividing by the number of data values Example For the data set 2 3 6 7 10 12 14 15 22 120 the mean absolute deviation is 20
Median A measure of center in a set of numerical data The median of a list of values is the value appearing at the center of a sorted version of the listmdashor the mean of the two central values if the list contains an even number of values Example For the data set 2 3 6 7 10 12 14 15 22 90 the median is 11
Midline In the graph of a trigonometric function the horizontal line halfway between its maximum and minimum values
Multiplication and division within 100 Multiplication or division of two whole numbers with whole number answers and with product or dividend in the range 0-100 Example 72 divide 8 = 9
Multiplicative inverses Two numbers whose product is 1 are multiplicative inverses of one another Example 34 and 43 are multiplicative inverses of one another because 34 times 43 = 43 times 34 = 1
Number line diagram A diagram of the number line used to represent numbers and support reasoning about them In a number line diagram for measurement quantities the interval from 0 to 1 on the diagram represents the unit of measure for the quantity
Percent rate of change A rate of change expressed as a percent Example if a population grows from 50 to 55 in a year it grows by 550 = 10 per year
Probability distribution The set of possible values of a random variable with a probability assigned to each
Properties of operations See Table 3 in this Glossary
Properties of equality See Table 4 in this Glossary
Properties of inequality See Table 5 in this Glossary
Properties of operations See Table 3 in this Glossary
52
Keansburg School DistrictCurriculum System
MathematicsProbability A number between 0 and 1 used to quantify likelihood for processes that have uncertain outcomes (such as tossing a coin selecting a person at random from a group of people tossing a ball at a target or testing for a medical condition)
Probability model A probability model is used to assign probabilities to outcomes of a chance process by examining the nature of the process The set of all outcomes is called the sample space and their probabilities sum to 1 See also uniform probability model
Random variable An assignment of a numerical value to each outcome in a sample space
Rational expression A quotient of two polynomials with a non-zero denominator
Rational number A number expressible in the form ab or ndash ab for some fraction ab The rational numbers include the integers
Rectilinear figure A polygon all angles of which are right angles
Rigid motion A transformation of points in space consisting of a sequence of one or more translations reflections andor rotations Rigid motions are here assumed to preserve distances and angle measures
Repeating decimal The decimal form of a rational number See also terminating decimal
Sample space In a probability model for a random process a list of the individual outcomes that are to be considered
Scatter plot A graph in the coordinate plane representing a set of bivariate data For example the heights and weights of a group of people could be displayed on a scatter plot5
Similarity transformation A rigid motion followed by a dilation
Tape diagram A drawing that looks like a segment of tape used to illustrate number relationships Also known as a strip diagram bar model fraction strip or length model
Terminating decimal A decimal is called terminating if its repeating digit is 0
Third quartile For a data set with median M the third quartile is the median of the data values greater than M Example For the data set 2 3 6 7 10 12 14 15 22 120 the third quartile is 15 See also median first quartile interquartile range
Transitivity principle for indirect measurement If the length of object A is greater than the length of object B and the length of object B is greater than the length of object C then the length of object A is greater than the length of object C This principle applies
53
Keansburg School DistrictCurriculum System
Mathematicsto measurement of other quantities as well
Uniform probability model A probability model which assigns equal probability to all outcomes See also probability model
Vector A quantity with magnitude and direction in the plane or in space defined by an ordered pair or triple of real numbers
Visual fraction model A tape diagram number line diagram or area model
Whole numbers The numbers 0 1 2 3 hellip5
54
- MissionVision Statement
- Beliefs
- Measurement amp Data
- Measure lengths and by iterating length units
- Tell and write time
- Represent and interpret data
- Geometry
- Reason with shapes and their attributes
- Number and Base Ten
- Extend the counting sequence
- Understand place value
-
- Measurement amp Data (II)
-
- Measure lengths and by iterating length units
- Tell and write time
-
- Represent and interpret data
- Geometry (II)
- Reason with shapes their attributes
-
- Number and Base Ten
- Use place value understanding and properties of operations to add and subtract
- Teacher will cover up specific numbers on an enlarged number grid using cover up tape to have students identify numbers before and after Students will come up and write the missing numbers
- Students will play ldquoI have__ Who has __ Teacher will create cards using index cards and numbers in which students need further practice with Students will read their cards aloud Variations of game can include identifying specific numbers identifying numbers more or less etc)
- Students will use base ten blocks to represent numbers including three digit numbers Students will identify representation of numbers through these manipulatives They may match the representation to the written number
- Students will write the number they created using the base ten blocks using their white boards and markers
- Students will arrange given digits to create the greatest and lowest possible numbers They can show each number they create using base ten blocks
- Students will use the Base Ten Exchange Game to show an understanding of exchanging ones for tens and tens for hundreds Students can use place value mats base ten blocks (cubes tens and flats) Students can take number of cubes displayed with roll of single die Students will determine when exchanging can be made when reaching ten units
- Base ten concentration wwwk-5mathteachingresourcescom
- Ten frame compare wwwk-5mathteachingresourcescom
-

Keansburg School DistrictCurriculum System
Mathematics
MissionVision Statement
The mission of the Keansburg School District developed through relationships with all stakeholders is to identify the unique potential of each individual by creating a relevant and meaningful learning environment that promotes high
academic social and emotional expectations for our students and teachers and leads to graduates that are prepared and inspired to make positive contributions to society
Beliefs
We believe that
All children can learn To meet the challenges of change risk must be taken Every student is entitled to an equal educational opportunity It is our responsibility to enable students to succeed and become the best that they can be All individuals should be treated with dignity and respect The school system should be responsive to the diversity within our total population The degree of commitment and level of involvement in the decision-making processes from the student
community home and school will determine the quality of education Decisions should be based on the needs of the students Achievement will rise to the level of expectation Students should be taught how to learn The educational process should be a coordinated system of services and programs
4
Keansburg School DistrictCurriculum System
MathematicsCurriculum Philosophy
The curriculum philosophy of the Keansburg School District is progressive We embrace the high expectations of our students and community towards success in the 21st Century and beyond At the center of this ideal we believe that all of our students can be successful The following are our core beliefs for all curricula
All district curricula Balances policy driven trends of centralization and standardization with research and what we know is good for our
students Balances the strong emphasis on test success and curriculum standards with how and what our students must
know to be successful in our community Embraces the reality that our students differ in the way they learn and perform and personalizes instruction to
meet the needs of each learner Are aligned to be developmentally appropriate Provides teachers the support and flexibility to be innovative and creative to meet the needs of our students
Mathematics Goals
To deliver a curriculum that is Pertinent for the success of all of our students and useful for teachers in the 21st Century Problem-based where students understand the importance of mathematical concepts and applications Socially emotionally and academically driven with regards to statute and code while focusing on what is best for
each of the students in our school district to achieve successful outcomes Significant in the processes of growth and development and relevant to the students Differentiated with regards to our studentsrsquo abilities and needs Embedded with teaching responsibility respect and the value of hard work and self-pride over time Designed with both content knowledge and experiences which
o Are aligned from one grade level to the next with scaffolded underpinnings of similar concepts for successo Engage our diverse population for positive outcomeso Build and support the language of mathematicso Develop educational and mathematical independence over time
5
Keansburg School DistrictCurriculum System
MathematicsCommon Core Standards for Mathematics
OPERATIONS AND ALGEBRAIC THINKING
Represent and solve problems involving addition and subtraction
1 Use addition and subtraction within 20 to solve word problems involving situations of adding to taking from putting together taking apart and comparing with unknowns in all positions eg by using objects drawings and equations with a symbol for the unknown number to represent the problem
2 Solve word problems that call for addition of three whole numbers whose sum is less than or equal to 20 eg by using objects drawings and equations with a symbol for the unknown number to represent the problem
Understand and apply properties of operations and the relationship between addition and subtraction
3 Apply properties of operations as strategies to add and subtract3 Examples If 8 + 3 = 11 is known then 3 + 8 = 11 is also known (Commutative property of addition) To add 2 + 6 + 4 the second two numbers can be added to make a ten so 2 + 6 + 4 = 2 + 10 = 12 (Associative property of addition)
4 Understand subtraction as an unknown-addend problem For example subtract 10 ndash 8 by finding the number that makes 10 when added to 8
Add and subtract within 20
5 Relate counting to addition and subtraction (eg by counting on 2 to add 2)
6 Add and subtract within 20 demonstrating fluency for addition and subtraction within 10 Use strategies such as counting on making ten (eg 8 + 6 = 8 + 2 + 4 = 10 + 4 = 14) decomposing a number leading to a ten (eg 13 ndash 4 = 13 ndash 3 ndash 1 = 10 ndash 1 = 9) using the relationship between addition and subtraction (eg knowing that 8 + 4 = 12 one knows 12 ndash 8 = 4) and creating equivalent but easier or known sums (eg adding 6 + 7 by creating the known equivalent 6 + 6 + 1 = 12 + 1 = 13)
Work with addition and subtraction equations
7 Understand the meaning of the equal sign and determine if equations involving addition and subtraction are true or false For example which of the following equations are true and which are false 6 = 6 7 = 8 ndash 1 5 + 2 = 2 + 5 4 + 1 = 5 + 2
6
Keansburg School DistrictCurriculum System
Mathematics8 Determine the unknown whole number in an addition or subtraction equation relating three whole numbers For example
determine the unknown number that makes the equation true in each of the equations 8 + = 11 5 = 1048781 ndash 3 6 + 6 = 1048781
NUMBER AND OPERATIONS IN BASE TEN
Extend the counting sequence
1 Count to 120 starting at any number less than 120 In this range read and write numerals and represent a number of objects with a written numeral
Understand place value
2 Understand that the two digits of a two-digit number represent amounts of tens and ones Understand the following as special cases
a 10 can be thought of as a bundle of ten ones mdash called a ldquotenrdquo
b The numbers from 11 to 19 are composed of a ten and one two three four five six seven eight or nine ones
c The numbers 10 20 30 40 50 60 70 80 90 refer to one two three four five six seven eight or nine tens (and 0 ones)
3 Compare two two-digit numbers based on meanings of the tens and ones digits recording the results of comparisons with the symbols gt = and lt
Use place value understanding and properties of operations to add and subtract
4 Add within 100 including adding a two-digit number and a one-digit number and adding a two-digit number and a multiple of 10 using concrete models or drawings and strategies based on place value properties of operations andor the relationship between addition and subtraction relate the strategy to a written method and explain the reasoning used Understand that in adding two-digit numbers one adds tens and tens ones and ones and sometimes it is necessary to compose a ten
5 Given a two-digit number mentally find 10 more or 10 less than the number without having to count explain the reasoning used
6 Subtract multiples of 10 in the range 10-90 from multiples of 10 in the range 10-90 (positive or zero differences) using concrete models or drawings and strategies based on place value properties of operations andor the relationship between addition and subtraction relate the strategy to a written method and explain the reasoning used
7
Keansburg School DistrictCurriculum System
Mathematics
MEASUREMENT AND DATA
Measure lengths indirectly and by iterating length units
1 Order three objects by length compare the lengths of two objects indirectly by using a third object
2 Express the length of an object as a whole number of length units by laying multiple copies of a shorter object (the length unit) end to end understand that the length measurement of an object is the number of same-size length units that span it with no gaps or overlaps Limit to contexts where the object being measured is spanned by a whole number of length units with no gaps or overlaps
Tell and write time
3 Tell and write time in hours and half-hours using analog and digital clocks
Represent and interpret data
4 Organize represent and interpret data with up to three categories ask and answer questions about the total number of data points how many in each category and how many more or less are in one category than in another
GEOMETRY
Reason with shapes and their attributes
1 Distinguish between defining attributes (eg triangles are closed and three-sided) versus non-defining attributes (eg color orientation overall size) build and draw shapes to possess defining attributes
2 Compose two-dimensional shapes (rectangles squares trapezoids triangles half-circles and quarter-circles) or three-dimensional shapes (cubes right rectangular prisms right circular cones and right circular cylinders) to create a composite shape and compose new shapes from the composite shape
3 Partition circles and rectangles into two and four equal shares describe the shares using the words halves fourths and quarters and use the phrases half of fourth of and quarter of Describe the whole as two of or four of the shares Understand for these examples that decomposing into more equal shares creates smaller shares
8
Keansburg School DistrictCurriculum System
Mathematics
Grade 1 Scope and Sequence
SeptemberQuarter 1
Number Sense Numbers 1-20 Number writing Identifying Counting objects (up to 20)
Number 20+ Number Identification Counting 1-100 by ones and tens
OctoberQuarter 1
Operations amp Algebraic Expressions Problem solving with addition and subtraction Properties of operations Add and subtract within 20
NovemberQuarter 2
Measurement amp Data Measure lengths and by iterating length units Tell and write time Represent and interpret data
DecemberQuarter 2
Geometry Reason with shapes and their attributes
JanuaryQuarter 2
Number and Base Ten Extend the counting sequence Understand place value
FebruaryQuarter 3
Operations amp Algebraic Expressions (II) Represent and solve problems involving addition and subtraction Understand and apply properties of operations and the relationship between addition
and subtraction Add and subtract within 20 Work with addition and subtraction equations
MarchQuarter 3
Measurement amp Data (II) Measure lengths and by iterating length units Tell and write time
9
Keansburg School DistrictCurriculum System
Mathematics Represent and interpret data
AprilQuarter 4
Geometry (II) Reason with shapes their attributes
MayQuarter 4
Number and Base Ten Use place value understanding and properties of operations to add and subtract
JuneQuarter 4
Readiness skills for September of Grade 2 Problem solving with all mathematical concepts covered in Grade 1
10
Keansburg School DistrictCurriculum System
Mathematics
Keansburg School DistrictCurriculum Management System
SubjectGradeLevelMathematicsGrade 1
Timeline September-Quarter 1
Topic(s) Number Sense
Significance of Learning Goal(s) To write numbers 0-20
Sugg
este
d D
ays
of
Inst
ruct
ion Content
Standards CPI
Essential Questions
Specific Learning Objective(s)
The Students Will Be Able To
Suggested Activities Instructional Tools Materials Technology Resources Assessments and Assessment Models
CPI KCC1 KCC2 KCC3 KCC6 KOA5 KNBT1
EQ Why is it
important to recognize and write numbers
Concept(s) Kindergarten review of number sense
SWBAT
Identify write and count numbers 0-20
Count objects and represent with a number
Compare and order numbers 0-
Meets Standard Practice counting
numbers 0-20 using nursery rhymes and songs
Order numbers from 0-20 using number cards number tiles (from hundredths board)
Order numbers while understanding words such as before after between Utilize a number line to locate and order numbers
Compare numbers that greater than or less than using games such as Number Line Squeeze
Nursery Rhymes CD Math songs Number cards Number Line Squeeze-number lines Everyday Math cards Straws or popsicle sticks Calendar httpwwwstarfallcomnholidaycalendarloadhtmfampn=main school day count chart weather chart attendance chart class number grid wwwk-5mathteachingresourcescom coins counters
11
Keansburg School DistrictCurriculum System
Mathematics20 through concrete and pictorial models
Count to 100 by ones and tens
Top It and One More One Less Stories
Write numbers from 0-20 Construct numbers 11-19
by bundling groups of ten and then by counting the left over ones
Develop number sense by counting up and counting back using a given number
Incorporate number sense daily through calendar school day count class number grid weather and attendance
Reading counting books Recording tally counts
creating tally charts Find and locate numbers
on the number grid Provide students with
number lines students will need to identify and provide the missing number
Show one more wwwk-5mathteachingresourcescom
Show one less wwwk-5mathteachingresourcescom
One more on the ten frame wwwk-5mathteachingresourcescom
Typical Assessment Question(s) or Task(s) Ask students to count 0-20 Students will be asked to order numbers from 0-20 Compare numbers that greater than or less than Students will display number sense through orally counting up
and counting back using a given number Give students a given number have them identify the given
number on the number grid Have students analyze a tally chart and give the associated
number with this chart
12
Keansburg School DistrictCurriculum System
Mathematics
Exceeds Standard Practice counting
numbers 21-100 Compare numbers
greater than 20 through games
Before and after games Number grid puzzles Counting walk students
estimate step amounts from one location to another Find actual number of steps and compare the two numbers Choose other locations and repeat procedure
Students compose and solve ones and tens riddles
Counting by 5s using nickels
Counting by 10s using dimes
One moreone less scoop wwwk-5mathteachingresourcescom
13
Keansburg School DistrictCurriculum System
Mathematics
Keansburg School DistrictCurriculum Management System
SubjectGradeLevelMathematicsGrade 1
Timeline October-Quarter 1Topic(s) Operations amp Algebraic Expressions
Significance of Learning Goal(s) To solve problems using addition and subtraction within 20
Sugg
este
d
Content Standards CPI Essential
Questions
Specific Learning Objective(s)
The Students Will Be Able To
Suggested ActivitiesInstructional Tools Materials
Technology Resources Assessments and Assessment
Models
CPI 1OA31OA4 1OA5 1OA6 1OA7 1OA8
EQ What questions can
be answered using addition
What strategies can be used to solve problems
How can we tell how many
How does knowing math facts make math easier
How can numbers be helpful
Why do I need to subtract
Concept(s) Working with and solving problems using addition and subtraction within 20
SWBAT
Solve word problems within 20 using real life situations
Understand demonstrate and apply properties of operations for addition
Demonstrate fluency for addition and subtraction within 20 by using strategies to solve
Meets Standard Model a number sentence using
manipulatives and label operation symbols
Use dominoes to create an addition problem and find the sum
Solve addition problems using a number line
Students will develop different ways to solve number stories students will use objects fingers and pictures count onback number line or number grid
Create real life situations in which students will use all number story strategies to solve a problem
Teachers will pose real world number stories to the students students will synthesize pre-existing information that they know to solve the problem
Introduce and devise addition and subtraction number stories posters stating each key word for addition and subtraction operations
Dominoes Number lines Number Grids Number Cards White Boards Dry-Erase markers Pennies
Typical Assessment Question(s) or Task(s)
Students will be asked to solve addition and subtraction problems within 20 within a given time frame
Students will be given a number and be asked to count on from that given number
14
Keansburg School DistrictCurriculum System
Mathematics How do we use
addition and subtraction in our everyday life
Why are fact families important
What strategies can be used to solve problems How is counting on different from just counting to add
What information do you need to know in order to find the total number of something
Why would you need to count back
How are subtraction and addition related
problems Relate counting to
addition by counting on from the higher number
Demonstrate fluency for addition by using strategies such as counting on doubles and doubles plus 1
Combine and mix two sets of 0-10 number cards One partner draws two number cards from the top of the deck students will design and generate a number story using the two numbers Both partners solve the problem in the number story and write the answer on their slate
Use concrete objects to demonstrate the relationship between two addends and the sum
Teacher will model and demonstrate using pictures and objects how objects can be moved around and still come out to equal the same sum
Develop counting on skills by students choosing a number card and partner count on from the given number
Roll two number cubes identify the higher number and count on to find sum
Use technology to show doubles different compliments of 10 songs and raps to help students memorize basic facts Poll students to discover their favorite tune
Play around the world using basic addition facts
Relate addition to subtraction by creating fact families using number cubes dominoes fact family houses etc
Turn around trains wwwk-5mathteachingresourcescom
Domino fact families wwwk-5mathteachingresourcescom
Plus one game wwwk-5mathteachingresourcescom
Students will be given word problems within 20 to solve students will use various strategies and means to solve these problems
15
Keansburg School DistrictCurriculum System
Mathematics One less game wwwk-
5mathteachingresourcescom Doubles facts wwwk-
5mathteachingresourcescom Facts of ten wwwk-
5mathteachingresourcescom Fact family house wwwk-
5mathteachingresourcescom Number sentence math wwwk-
5mathteachingresourcescom Sums of ten wwwk-
5mathteachingresourcescom
Exceeds Standard
In groups or individually students will plan and generate world problems based on real life situations
Teachers will provide pictures of groups of things such as animals people or objects Students will analyze and evaluate the picture and design a number story about the picture
Using number cards or dice create addition sentences draw a picture to represent problem and write an addition number model to correlate with the fact
With 9 10 12 side dice roll two number cubes identify the higher number and count on to find sum
Students will compose their own double facts song
Students create a 4 x 4 double facts mat with double sums Partners roll a 12-sided number cube double the top number showing and X it out on the
16
Keansburg School DistrictCurriculum System
Mathematicsmat First student to get 4 in a row wins
Take two dominoes each representing an addend and have students find the sum
Students use pennies to solve basic addition problems
Students will complete turn around facts Make ten wwwk-
5mathteachingresourcescom Make ten on the ten frame wwwk-
5mathteachingresourcescom What number ishellip wwwk-
5mathteachingresourcescom Make ten square What number ishellip
wwwk-5mathteachingresourcescom Dot card addition What number is
wwwk-5mathteachingresourcescom Addition domino train What number is
wwwk-5mathteachingresourcescom
17
Keansburg School DistrictCurriculum System
MathematicsKeansburg School DistrictCurriculum Management System
SubjectGradeLevelMathematicsGrade 1
Timeline November-Quarter 2
Topic(s) Measurement and Data
Significance of Learning Goal(s) To understand measurement and what tools and used
Sugg
este
d D
ays
of
Inst
ruct
ion Content
Standards CPI Essential Questions
Specific Learning Objective(s)
The Students Will Be Able To
Suggested ActivitiesInstructional Tools Materials
Technology Resources Assessments and Assessment
Models
CPI 1MD1 1MD2 1MD3 1MD4
EQ Why do people
use graphs How is a bar
graph like a tally chart
How would I know if a bar graph correctly shows what is on a tally chart
How could a bar graph answer a question
Concept(s) Understanding what measurement is and what tools are used
SWBAT
Compare and order the length of up to three objects using direct comparisons
Compare the lengths of two objects indirectly by using a third object
Measure objects using non-standard units and express it as a whole number
Draw an object longer or shorter than a given
Meets Standard Teacher will introduce measurement
by holding up objects and the students will examine the objects and explain the size order
o Students will break into groups and compare objects further and classify them depending on their size
Teacher will introduce the ruler Explain to students that the ruler is used to measure objects The students will then explore the classroom and select objects around the room that are smaller and larger than the ruler
Teacher will select specific body parts that the students will use as a personal unit of measurement The students will work in pairs to demonstrate how to measure objects around the room
Rulers Judy Clock Paper Plates Classroom objects Chart paper Jack Hartmann ndash Tick Tock
Song Brainpop Jr White boards Dry Erase markers Clock Concentration
Typical Assessment Question(s) or Task(s)
Analyze a bar graph and answer questions
Create a bar graph using self ndash selected topic
18
Keansburg School DistrictCurriculum System
Mathematics Do bar graphs
make it easier to understand and compare facts Why
What kind of graph should I use to answer questions
Why do I need to tell time
How many hands does a clock have
Are the hands on the clock the same size
How long is a minute
Why do I need to use a calendar
How do we use the clock and the calendar to determine what we will do in school
Why do we need to measure something
What can we use to draw and measure things
What do you think is about 1 inch long
How many steps long do you think it is from
object Organize represent
and interpret data with up to three categories on simple graphs and charts
Analyze and formulate questions based on simple graphs and charts
Identify time to the hour and half hour on both a digital and analog clock
Write time to the hour and half hour on both analog and digital clocks
Draw the hands on an analog clock for a give time to the hour or half hour
Relate times to the half hour to ldquohalf pastrdquo the hour
using their personal unit of measurement
The teacher will select a classroom object and the students will be asked to illustrate objects in the room that are bigger and smaller in size
The students will be able to organize represent and interpret data up to three categories through the use of a bar graph
The teacher will then divide students into heterogeneous groups and encourage the students to explain what they can learn from the graph The students will present findings following activity
Students will choose an object within classroom then find additional objects one being larger the other being shorter using a two-column chart Draw or write the objects in the chart
Create a human clock students will hold 12 numbered plates One student will stand in the middle as the minute and hour hand to model various times
Students will have their own demonstration clocks students will identify and find the hour and minute hands
Students create their own clocks using paper plates students will manipulate hands to identify varying times
Students will listen to Jack Hartman ldquoTick Tockrdquo song
Teachers and students will view clock on videos on brainpopjrcom students
Take 3 objects and order them from smallest to largest and largest to smallest
Read a series of clocks (analog and digital) and tell the time to the hour and half hour
Using blank clocks the students will draw the hands to show a designated time
Use a personal measurement (ie your thumb) to measure the length of an object
19
Keansburg School DistrictCurriculum System
Mathematicsthe front of the classroom to the back
If we measure in footsteps why are some of the measurements different
How is longer and shorter similar to greater and lesser
and teachers can complete quizzes available on website
Teachers will present time on an analog clock students will write the digital time on a white board
Students will play clock concentration
Exceeds Standard
The students will work in pairs to locate objects around the room and compare the lengths against each other The pairs will then work with another pair of students and compare the lengths of their objects with the objects the other pair located
Teacher will introduce the ruler in comparison to the yardstick The students will be encouraged to find objects that in the room that are larger than a ruler and measure using the yardstick
After the teacher introduces units of personal measurement the students will be encouraged to measure object in the room using their own unit of personal measurement and convert it into a standard measurement using a ruler or a yardstick
The teacher will select a classroom object and the students will be asked to illustrate objects in the room that are bigger and smaller by a specific size
The students will be able to organize represent and interpret data up to four
20
Keansburg School DistrictCurriculum System
Mathematicsor more categories through the use of a bar graph
The teacher will then divide students into heterogeneous groups and encourage the students to explain what they can learn from the graph and create a tally chart utilizing the data
Students will create clock flash cards by drawing an analog clock on one side and writing the digital clock time on the other
Give students a clock and a blue number cube ()
21
Keansburg School DistrictCurriculum System
MathematicsKeansburg School DistrictCurriculum Management System
SubjectGradeLevelMathematicsGrade 1
Timeline December-Quarter 2
Topic(s) Geometry
Significance of Learning Goal(s) To identify shapes and their attribures
Sugg
este
d D
ays
of
Inst
ruct
ion Content
Standards CPI Essential
Questions
Specific Learning Objective(s)
The Students Will Be Able To
Suggested Activities
Instructional Tools Materials
Technology Resources
Assessments and Assessment Models
CPI1G1 1G2
EQ Where do
you see shapes in our classroom
Are there different shapes outside
How are geometric figures alike
How can we sort
Concept(s) Identify shapes and their attributes
SWBAT Distinguish
between two and three-dimensional shapes by classifying their attributes For example color shape and size
Compare and contrast shapes based on their attributes
Construct and create shapes
Meets Standard Sorting shapes based on their attributes For example
number of sideso Materials attribute blocks shape card sheet sorting
mat Introduce vocabulary cylinder cube sphere rectangular
prism triangular prism pyramid Classroom shape hunt students go around the room finding shapes within the classroom For example trash can tissue box clock
o Materials shape sheet classroom objects httpilluminationsnctmorgLessonDetailaspxid=L237
Create 3-dimenstion shapes (rectangular prism pyramid cube)
o Straws twist ties shape cards Create 2-dimensional shapes (trapezoid triangle circle
rectangle rhombus)o Pattern block templates attribute blocks pattern
block template stencil geo-boards rubber bands httpilluminationsnctmorgLessonDetailaspx
Attribute blocks Shape card
sheet Sorting mat Twist ties Straws Shape cards Pattern block
templates Attribute blocks Pattern block
template stencil Geo-boards Rubber bands
22
Keansburg School DistrictCurriculum System
Mathematicsobjects of different shapes
How can shapes and solids be described compared and used to make other shapes What are equal parts
What foods do you divide into equal parts
What other items might be divided
How do you know if you have an equal share
possessing certain attributes
Identify and construct two-dimensional shapes
Identify and construct three-dimensional figures
id=L168 Create a drawing using shapes students will create a
picture using the pattern block template stencil (house sun flowers etc)
o Paper pattern block stencil template crayons
Apply understanding of attributes by playing Shape Detective and Attribute Train Game
Demonstrate understanding of 3 Dimensional shapes by playing Whatrsquos My Shape
Exceeds Standard
Introducing and exposing higher vocabulary polyhedronpolyhedra (many faces of a shape) Placing the word onto the word wall
Students read the poem Shapes by Shel Silverstein and create their own illustration of the poem to explore geometric figures and positional words
Materials httpilluminationsnctmorgLessonDetailaspxID=L202
Shapes by Shel Silverstein paper crayons pencils examples of rectangles triangles circles
Compose clues using inferencing to play Guess What Display variety of 3 dimensional shapes Silently choose
an object and give clues about it For example I amsmall I have 2 flat faces and if you trace my faces youwill get circles What am I (tomato can)
Students work together to use pattern blocks to coverother pattern blocks For example how many triangleblocks are needed to cover a hexagon block
Student rotate in groups to visit each geometric solidwhile completing a chart which shows faces sides and
Typical Assessment Question(s) or Task(s)
Ask students how many sides each shape has
Have students classify shapes based on number of sides
Have students identify shapes in the classroom
Have students create 2 and 3 dimensional shapes
Have students design pictures using pattern blockspattern block template
Have students identify and describe assigned shapersquos attributes
Ask students to name 3 dimensional shapes hidden i bag (Whatrsquos my Shape Game)
23
Keansburg School DistrictCurriculum System
Mathematics corners Students compose a shape town by using their pattern
block templates Then students will calculate the totalnumber of each pattern block used
Students will invent new shapes by using three-dimensional shapes
Students will create patterns using three dimensionalshapes
24
Keansburg School DistrictCurriculum System
MathematicsKeansburg School DistrictCurriculum Management System
SubjectGradeLevelMathematicsGrade 1
Timeline January-Quarter 2
Topic(s) Number and Operations in Base Ten
Significance of Learning Goal(s) To recognize compare and understand numbers to 120
Sugg
este
d D
ays
of
Inst
ruct
ion Content
Standards CPI Essential
Questions
Specific Learning Objective(s)
The Students Will Be Able To
Suggested ActivitiesInstructional Tools Materials
Technology Resources Assessments and Assessment
Models
25
Keansburg School DistrictCurriculum System
MathematicsCPI 1NBT1 1NBT2A 1NBT2B 1NBT2C 1NBT3
EQ How do
numbers help us
How can sets of numbers be counted compared and ordered
How can I use numbers to solve problems
How would putting numbers on a chart make it easier to understand information
How can I make it easier to understand numbers when I sort them
What is place value
Concept(s) Recognize compare and understand numbers up to 120
SWBAT Recognize read write
and count 0-120 Understand that a two-
digit number represents amounts of tens and ones
Relate groups of ten to skip counting
Compare two two-digit numbers based on meanings of tens and ones digits using symbols ltgt and =
Meets Standard Teacher will cover up specific numbers
on an enlarged number grid using cover up tape to have students identify numbers before and after Students will come up and write the missing numbers
Students will play ldquoI have__ Who has __ Teacher will create cards using index cards and numbers in which students need further practice with Students will read their cards aloud Variations of game can include identifying specific numbers identifying numbers more or less etc)
Students will use base ten blocks to represent numbers including three digit numbers Students will identify representation of numbers through these manipulatives They may match the representation to the written number
Students will write the number they created using the base ten blocks using their white boards and markers
Students will arrange given digits to create the greatest and lowest possible numbers They can show each number they create using base ten blocks
Students will use the Base Ten Exchange Game to show an
Number grids ldquoI have Who hasrdquo index
cards base ten blocks white boards markers number cards dice ten frame base ten concentration
boards (k-5 math teaching resources)
double ten frame boards (k-5 math teaching resources)
Typical Assessment Question(s) or Task(s)
Recognize numbers 1-120 using flashcards
Write numbers 1-20 using block or graph paper
Build two-digit numbers using tens and ones blocks
Listen and note students skip counting orally by tens to 120
Students compare and label two numbers using relation symbols
26
Keansburg School DistrictCurriculum System
Mathematics Why is place
value important
How can I use place value to compare and order numbers
How can I use the number grid to help me with counting numbers
How many times do you think you can hop in one minute
What does number relationships mean
Why do we need to know how to add
Why do we need to know how to subtract
How are addition and subtraction related
What are doubles
How can
understanding of exchanging ones for tens and tens for hundreds Students can use place value mats base ten blocks (cubes tens and flats) Students can take number of cubes displayed with roll of single die Students will determine when exchanging can be made when reaching ten units
Teens on the ten frame wwwk-5mathteachingresourcescom
Base ten concentration wwwk-5mathteachingresourcescom
Ten frame compare wwwk-5mathteachingresourcescom
Exceeds Standard
Students will create riddles Irsquom thinking of a number that has 4 tens and 13 ones Have students solve the riddle by regrouping the ones to find the answer
-Students use hundreds chart to jump up and down from a number to show 10 more or 10 less
-Students will play Whatrsquos my Number by giving clues based on place value odd or even and number sense For example Irsquom a two digit number The digit in my tens place is 2 more than 4
27
Keansburg School DistrictCurriculum System
Mathematicsdouble facts help us to add and subtract
Does it matter what order you use to add three numbers Why or why not
The digit in my ones place is 3 less than 8 Whatrsquos my number
My double ten frame riddle wwwk-5mathteachingresourcescom
28
Keansburg School DistrictCurriculum System
MathematicsKeansburg School DistrictCurriculum Management System
SubjectGradeLevelMathematicsGrade 1
Timeline February-Quarter 3
Topic(s) Operations amp Algebraic Expressions
Significance of Learning Goal(s) To solve addition and subtraction problems
Sugg
este
d D
ays
of
Inst
ruct
ion Content
Standards CPI
Essential Questions
Specific Learning Objective(s)
The Students Will Be Able To
Suggested ActivitiesInstructional Tools Materials
Technology Resources Assessments and Assessment
Models
CPI1OA31OA4 1OA5 1OA6 1OA7 1OA81OA2
EQ What
questions can be answered using addition
What strategies can be used to solve problems
How can we
Concept(s) Solve addition with and subtraction problems
SWBAT Solve addition problems
with sums up to 20 Use addition within 20 to
solve word problems involving real life situations
Solve word problems that call for addition of three whole numbers up to 20
Solve subtraction problems with difference up to 20
Use subtraction within 20 to solve word problems involving real
Meets Standard Model and have students create their
own individual number sentence using manipulatives and label operation symbols
Students will choose a strategy to solve number stories such as objects fingers and pictures count onback number line or number grid
Create real life situations in which students will use a strategy to solve a number story and create a number model
Review addition and subtraction number stories posters stating each key word for addition and subtraction operations
Combine and mix two sets of 0-20 number cards One partner draws two number cards from the top of the deck students will design and generate a number story using the two numbers
Materials Manipulatives (examples
counting bears connecting cubes pennies counters etc)
Slates dry erase markers erasers
Clear Sheet Protectors Sets of 0-20 number cards Number cards Cardstock Scrabble tiles letter cards
Typical Assessment Question(s) or Task(s)
Students will solve real life
29
Keansburg School DistrictCurriculum System
Mathematicstell how many
How does knowing math facts make math easier
How can numbers be helpful
Why do I need to subtract
How do we use addition and subtraction in our everyday life
Why are fact families important
What strategies can be used to solve problems How is counting on different from just counting to add
What information do you need to know in order to find
life situations Understand subtraction
as an unknown addend problem example subtract 9-5 by finding the number that makes 9 when added to 5
Both partners solve the problem in the number story and write the answer on their slate
Find three cards that have a sum of 12 how many different ways can the student make the sum of 12 using three cards students record work
-Teacher creates real life word problemsinvolving three addends up to 20
Ten frames subtraction wwwk-5mathteachingresourcescom
I have who has wwwk-5mathteachingresourcescom
True or false wwwk-5mathteachingresourcescom
Count to 20 wwwk-5mathteachingresourcescom
Exceeds Standard
Teacher creates multi step word problems for students to solve
Students work with partners or small groups to create real life word problems Compose class book of problems
Three letter addends use scrabble tiles or letter cards with corresponding numbers to make three letter words find
word problems Students will create their
own number sentences own number storiesword problems
Students will create and solve number stories in cooperative learning groups
Students will generate word problems using assigned numbers
30
Keansburg School DistrictCurriculum System
Mathematicsthe total number of something
Why would you need to count back
How are subtraction and addition related
the sum of each word by adding the numbers on the tiles Students will find which words have the greatest or smallest sum
31
Keansburg School DistrictCurriculum System
MathematicsKeansburg School DistrictCurriculum Management System
SubjectGradeLevelMathematicsGrade 1
Timeline March-Quarter 3
Topic(s) Measurement amp Data
Significance of Learning Goal(s) To tell time and compare measurements
Sugg
este
d D
ays
of
Inst
ruct
ion Content
Standards CPI
Essential Questions
Specific Learning Objective(s)
The Students Will Be Able ToSuggested Activities
Instructional Tools Materials Technology Resources
Assessments and Assessment Models
How would I know if a bar graph correctly shows what is on a tally chart
How could a bar graph answer a question
Do bar graphs make it easier to understand and compare facts Why
What kind
Concept(s) Telling time comparing measurements
SWBAT Identify and write time to
the hour and half hour on both a digital and analog clock
Write time to the hour and half-hour on both digital and analog clocks
Draw the hands on the analog clock for a given time to the hour or half-hour
Relate times to the half hour as ldquohalf-pastrdquo the hour
Compare and contrast
Meets Standard Students will have their own
demonstration clocks students will identify and find the hour and minute hands
Students create their own clocks using paper plates students will manipulate hands to identify varying times
Students will listen to Jack Hartman ldquoTick Tockrdquo song
Teachers and students will view clock on videos on brainpopjrcom students and teachers can complete quizzes available on website
Teachers will present time on an analog clock students will write the digital time on a white board
Students will play clock concentration Teacher will introduce measurement by
holding up objects and the students will examine the objects and explain the size
Large Judy Clock Individual student Judy
clocks Wipe off analogdigital clocks Clock stampers Timers Rulers Yardsticks Measuring tapes Sheet protectors Cardstock Paper plates Fasteners Index cards
Typical Assessment Question(s) or Task(s)
Students will be asked to identify and write time to the hour and half hour on both
32
Keansburg School DistrictCurriculum System
Mathematicsof graph should I use to answer questions
Why do I need to tell time
How many hands does a clock have
Are the hands on the clock the same size
How long is a minute
Why do I need to use a calendar
How do we use the clock and the calendar to determine what we will do in school
Why do we need to measure something
What can
objects by length Construct objects at
contrasting lengths
ordero Students will break into groups
and compare objects further and classify them depending on their size
Teacher will introduce the ruler Explain to students that the ruler is used to measure objects The students will then explore the classroom and select objects around the room that are smaller and larger than the ruler
Teacher will select specific body parts that the students will use as a personal unit of measurement The students will work in pairs to demonstrate how to measure objects around the room using their personal unit of measurement
The teacher will select a classroom object and the students will be asked to illustrate objects in the room that are bigger and smaller in size
The students will be able to organize represent and interpret data up to three categories through the use of a bar graph
The teacher will then divide students into heterogeneous groups and encourage the students to explain what they can learn from the graph The students will present findings following activity
Students will choose an object within classroom then find additional objects one being larger the other being shorter using a two-column chart Draw or write the objects in the chart
digital and analog clocks Students will be asked to
identify the parts of a clock students will be asked to draw the hands on an analog clock for a given time to the hour or half-hour
Students will be given various objects and will further be asked to compare and contrast the lengths of these objects
Students will be asked to provide or create objects contrasting lengths to demonstrate understanding of differences in length
33
Keansburg School DistrictCurriculum System
Mathematicswe use to draw and measure things
What do you think is about 1 inch long
How many steps long do you think it is from the front of the classroom to the back
If we measure in footsteps why are some of the measurements different
How is longer and shorter similar to greater and lesser
Exceeds Standard
The students will work in pairs to locate objects around the room and compare the lengths against each other The pairs will then work with another pair of students and compare the lengths of their objects with the objects the other pair located
Teacher will introduce the ruler in comparison to the yardstick The students will be encouraged to find objects that in the room that are larger than a ruler and measure using the yardstick
After the teacher introduces units of personal measurement the students will be encouraged to measure object in the room using their own unit of personal measurement and convert it into a standard measurement using a ruler or a yardstick
The teacher will select a classroom object and the students will be asked to illustrate objects in the room that are bigger and smaller by a specific size
The students will be able to organize represent and interpret data up to four or more categories through the use of a bar graph
The teacher will then divide students into heterogeneous groups and encourage the students to explain what they can learn from the graph and create a tally chart utilizing the data
Students will create clock flash cards by
34
Keansburg School DistrictCurriculum System
Mathematicsdrawing an analog clock on one side and writing the digital clock time on the other Students will include time in five minute intervals
Pose word problems where students have to find elapse time to the hour and half hour
Introduce second hand and conduct activities that are timed in seconds (Examples hopping on 1 foot blinking eyes counting to the highest number)
35
Keansburg School DistrictCurriculum System
MathematicsKeansburg School DistrictCurriculum Management System
SubjectGradeLevelMathematicsGrade 1
Timeline April-Quarter 4
Topic(s) Geometry
Significance of Learning Goal(s) To identify two and three dimensional shapes to understand fractional parts and create equal shares
Sugg
este
d D
ays
of
Inst
ruct
ion Content
Standards CPI Essential
Questions
Specific Learning Objective(s)
The Students Will Be Able To
Suggested ActivitiesInstructional Tools Materials
Technology Resources Assessments and Assessment
Models
Are there different shapes outside
How are geometric figures alike
How can we sort objects of different shapes
How can shapes and solids be described compared and used to make other shapes
Concept(s) Two and three dimensional shapes fractional parts equal shares
SWBAT
Combine two-dimensional or three-dimensional shapes or figures to create a new composite shape and identify the shapes within
Identify fractional parts of circles and rectangles into equal shares while developing vocabulary for halves fourths and quarters
Describe the whole as
Meets Standard
Determine which shape by touch without using their sight
o Materials attribute blocks shape sheet feely box wwwilluminationsnctmorglessondetail
Sorting 3-dimensional objects students will be given cards with 3-dimensional objects (trash can soup can globe ball tissue box box dice) they will sort them based on the 3-dimensional shape they represent
o 3-dimensional object cards sorting mats
Pizza and Cake Fractions students will utilize a pizza and a cake to work on the concept of fractions while developing the vocabulary halves quarters and fourths
o Materials teacher created pizza
Attribute blocks Geometric shapes 3-dimensional object
cards Sorting maps 3-dimensional shapes Solid and lane figures Geo-boards and rubber
bands Fraction circles Sheet protectors 2-dimensional shapes
Typical Assessment Question(s) or Task(s)
Students will be asked to describe and identify
36
Keansburg School DistrictCurriculum System
MathematicsWhat are equal parts
What foods do you divide into equal parts
What other items might be divided
How do you know if you have an equal share
two of or four of the shares Understand for these examples that decomposing into more equal shares creates smaller shares
and cake that are cut into fractions (construction paper)
Students will illustrate a picture of a boat using at least one three dimensional shape in their drawings Shapes include cubes cylinders spheres cones and rectangular prisms
Solid and Plane Figures Name the Face activity Provide three-dimensional objects Have students draw the face for each object as well as name the shape Examples ABC block juice can book party hat
Introduce fractions by having students identify shapes that show equal parts Display cut out shapes using document camera Include some shapes that are divided equally and some that are not divided equally As a whole group sort shapes into two categories Then have students go back to their desks and work with a partner to classify additional shapes
Provide students with shapes that are divided into four parts Include shapes that are divided into four equal parts and others that are unequal Students identify the shapes that are divided into four equal parts and explain their reasoning
Shape Town activity Students will design a shape town using the following shapes
shapes within combined two and three-dimensional shapes
Students will be given circles and rectangles students will be asked to divide these shapes into halves fourths and quarters
Students will be asked to sort shapes that are divided equally and not divided equally
37
Keansburg School DistrictCurriculum System
Mathematicstrapezoid hexagon square triangle and circle Afterwards students will calculate the total number of each shape they included After completing the activity students will present their final product to the class and explain how they decided which shapes to use
Given an array of dots students will draw shapes with specific number of sides and corners and connect the dots to create the shapes Example Draw a shape with 5 sides Draw a shape with 6 corners
Students will create two-dimensional shapes on geoboards Then using different colored rubber bands students will divide the shapes into equal parts Students will transfer their equally divided shapes onto geoboard paper by drawing lines to show their equal parts
Play the Fraction Path Game Materials Fraction circles a circle with frac12 shaded a circle with 13 shaded and a circle with frac14 shaded Gameboard Path consisting of assorted shapes divided into halves thirds and fourths Players Needed 3 Directions Place the fraction circles facedown Players close their eyes and pick one fraction circle Each player follows the path from start to finish Each player looks at each shape on the path and records how many shapes show their fractions Players record
38
Keansburg School DistrictCurriculum System
Mathematicstheir results on paper using tally marks At end of game students compare total number of shapes that show their fraction
Exceeds Standard
39
Keansburg School DistrictCurriculum System
MathematicsKeansburg School DistrictCurriculum Management System
SubjectGradeLevelMathematicsGrade 1
Timeline May-Quarter 4
Topic(s) Number and Operations in Base Ten
Significance of Learning Goal(s) To use place value to add and subtract
Sugg
este
d D
ays
of
Inst
ruct
ion Content
Standards CPI Essential
Questions
Specific Learning Objective(s)
The Students Will Be Able ToSuggested Activities
Instructional Tools Materials Technology Resources
Assessments and Assessment Models
40
Keansburg School DistrictCurriculum System
MathematicsCPI 1NBT4 1NBT5 1NBT6
EQ How do
numbers help us
How can sets of numbers be counted compared and ordered
How can I use numbers to solve problems
How would putting numbers on a chart make it easier to understand information
How can I make it easier to understand numbers when I sort them
What is place value
Why is place value important
How can I
Concept(s) Use place value and properties of operations to add and subtract
SWBAT Use mental math to find
10 more or ten less than a given two-digit number and explain reasoning used within any number to 120
Use place value to add within 100 add a two-digit number to a one-digit number and add a two-digit number to a multiple of ten
Understand when adding two-digit numbers that ones add to the ones and tens add to the tens and sometimes it is necessary to compose a ten by regrouping
For all above objects students will use concrete models and strategies based on place value and relate the strategy to a written method and explain the reasoning used
Subtract multiples of 10 in the range 10-90 from multiples of 10 in the range 10-90 using
Meets Standard
Comparing two digit numbers wwwk-5mathteachingresourcescom
Subtraction split wwwk-5mathteachingresourcescom
Ten more wwwk-5mathteachingresourcescom
Addition split wwwk-5mathteachingresourcescom
Exceeds Standard
Comparing 3-Digit numbers wwwk-5mathteachingresourcescom
What number is wwwk-5mathteachingresourcescom
Students develop addition and subtraction number stories and have partners solve
Create pictures using basendash10 blocks Students trace picture onto paper label the base ten blocks with their value and add total
Solve number grid puzzles by adding and subtraction 10 on the number grid
Number cards Base 10 blocks Counters Number grid puzzles Sleeve protectors wwwk-
5mathteachingresourcescom
Dice
Typical Assessment Question(s) or Task(s)
Recognize numbers 1-120 using flashcards
Write numbers 1-20 using block or graph paper
Build two-digit numbers using tens and ones blocks
Listen and note students skip counting orally by tens to 120
Students compare and label two numbers using relation symbols
41
Keansburg School DistrictCurriculum System
Mathematics
42
Keansburg School DistrictCurriculum System
MathematicsKeansburg School DistrictCurriculum Management System
SubjectGradeLevelMathematicsGrade 1
Timeline June-Quarter 4
Topic(s) Readiness skills for September of Grade 2
Significance of Learning Goal(s) To compare larger numbers add fluently and apply measurement skills
Sugg
este
d D
ays
of
Inst
ruct
ion Content
Standards CPI Essential Questions
Specific Learning Objective(s)
The Students Will Be Able ToSuggested Activities
Instructional Tools Materials Technology Resources
Assessments and Assessment Models
CPI
EQ How can I use
place value to compare and
order numbers in the 100s
How can mastering basic addition and subtraction facts help me compute larger numbers
How can I tie in
Concept(s)Use place value to compare larger numbers fluently add up to 20 apply measurement skills
SWBAT Extend place value into
the hundreds place and re-write and construct models beyond the hundreds
Fluently add and subtract within 20 using mental strategies
Apply measurement skills
Meets Standard Place Value barrier game httpwwwk-
5mathteachingresourcescommath-gameshtml (place value only)
High card
httpwwwlearningboxcomBase10 BaseTenhtml
Time barrier game httpwwwk-5mathteachingresourcescomsupport-filestimebarriergamepdf httpwwwk-5mathteachingresourcescomsupport-filestimebarriergamegridpdf
My favorite time of day writing activity
number cards base ten blocks rulers tape measurer string number relationship mat paper plates cotton balls judy clock digital clock
Typical Assessment Question(s) or Task(s)
Students will solve addition and subtraction problems within 20 in a given time
43
Keansburg School DistrictCurriculum System
Mathematicsmeasurement skills with real life experiences
httpwwwk-5mathteachingresourcescomsupport-filesmy-favorite-time-of-daypdf
Estimating length httpwwwk-5mathteachingresourcescomsupport-filesestimatinglengthpdf
Olympic golf plastic golf clubs cotton balls and tape measurer
Olympic smiles measuring smiles with string and rulers
Olympic Frisbee using paper plates and tape measurer
Olympic airplane students will make paper airplanes measure the distance that they can throw their airplane
Doubles plus 1 game httpwwwk-5mathteachingresourcescomsupport-filesdoubles-plus-onepdf
Eleven more httpwwwk-5mathteachingresourcescomsupport-fileselevenmorepdf
frame Students will be asked to
measure items using inches and centimeters
Identify and create numbers with place values extending into the hundreds place
44
Keansburg School DistrictCurriculum System
Mathematics
Building numbers with base ten blocks pick three cards and arrange them to show a 3-digit number build that number with base ten blocks repeat with the same three cards until no new numbers can be made
Length strength inches httpwwwharcourtschoolcomactivitylength_strength1_inches
Length strength centimeters httpwwwharcourtschoolcomactivitylength_strength1_centi
Exceeds Standard
Number relationship mat wwwk-5mathteachingresourcescom
Place value barrier game httpwwwk-5mathteachingresourcescommath-gameshtml (integrate other skills into place values for example the digit in my 10s place is four doubled)
Measuring the mousersquos path httpwwwk-5mathteachingresourcescomsupport-filespaths1pdf
45
Keansburg School DistrictCurriculum System
Mathematics
Double minus 1 game httpwwwk-5mathteachingresourcescomsupport-filesdoubles-minus-onepdf
Number relationship mat httpwwwk-5mathteachingresourcescomsupport-filesnumberrelationshipmatpdf
46
Keansburg School DistrictCurriculum System
Mathematicsignment Matrices of Common Core State Standards
Grade Strand Standard Standard
Sept
embe
r ndash
Oct
ober
Nov
embe
r ndash
Dec
embe
r
Janu
ary
ndash Fe
brua
ry
Mar
ch ndash
Apr
il
May
- Ju
ne
1 OA 1
CC1OA1 Represent and solve problems involving addition and subtraction Use addition and subtraction within 20 to solve word problems involving situations of adding to taking from putting together taking apart and comparing with unknowns in all positions eg by using objects drawings and equations with a symbol for the unknown number to represent the problem
1 OA 2
CC1OA2 Represent and solve problems involving addition and subtraction Solve word problems that call for addition of three whole numbers whose sum is less than or equal to 20 eg by using objects drawings and equations with a symbol for the unknown number to represent the problem
1 OA 3
CC1OA3 Understand and apply properties of operations and the relationship between addition and subtraction Apply properties of operations as strategies to add and subtract Examples If 8 + 3 = 11 is known then 3 + 8 = 11 is also known (Commutative property of addition) To add 2 + 6 + 4 the second two numbers can be added to make a ten so 2 + 6 + 4 = 2 + 10 = 12 (Associative property of addition) (Students need not use formal terms for these properties)
1 OA 4
CC1OA4 Understand and apply properties of operations and the relationship between addition and subtraction Understand subtraction as an unknown-addend problem For example subtract 10 ndash 8 by finding the number that makes 10 when added to 8
1 OA 5 CC1OA5 Add and subtract within 20 Relate counting to addition and subtraction (eg by counting on 2 to add 2)
1 OA 6 CC1OA6 Add and subtract within 20 Add and subtract within 20 demonstrating fluency for addition and subtraction within 10 Use strategies such as counting on making ten (eg 8 + 6 = 8 + 2 + 4 = 10 + 4 = 14) decomposing a number leading to a ten (eg 13 ndash 4 = 13 ndash 3 ndash 1 = 10 ndash 1 = 9) using the relationship between addition and subtraction (eg knowing that 8 + 4
47
Keansburg School DistrictCurriculum System
Mathematics= 12 one knows 12 ndash 8 = 4) and creating equivalent but easier or known sums (eg adding 6 + 7 by creating the known equivalent 6 + 6 + 1 = 12 + 1 = 13)
1 OA 7
CC1OA7 Work with addition and subtraction equations Understand the meaning of the equal sign and determine if equations involving addition and subtraction are true or false For example which of the following equations are true and which are false 6 = 6 7 = 8 ndash 1 5 + 2 = 2 + 5 4 + 1 = 5 + 2
1 OA 8
CC1OA8 Work with addition and subtraction equations Determine the unknown whole number in an addition or subtraction equation relating three whole numbers For example determine the unknown number that makes the equation true in each of the equations 8 + = 11 5 = _ ndash 3 6 + 6 = _
1 NBT 1
CC1NBT1 Extend the counting sequence Count to 120 starting at any number less than 120 In this range read and write numerals and represent a number of objects with a written numeral
1 NBT 2
CC1NBT2 Understand place value Understand that the two digits of a two-digit number represent amounts of tens and ones Understand the following as special cases -- a 10 can be thought of as a bundle of ten ones mdash called a ldquotenrdquo -- b The numbers from 11 to 19 are composed of a ten and one two three four five six seven eight or nine ones -- c The numbers 10 20 30 40 50 60 70 80 90 refer to one two three four five six seven eight or nine tens (and 0 ones)
1 NBT 3
CC1NBT3 Understand place value Compare two two-digit numbers based on meanings of the tens and ones digits recording the results of comparisons with the symbols gt = and lt
1 NBT 4
CC1NBT4 Use place value understanding and properties of operations to add and subtract Add within 100 including adding a two-digit number and a one-digit number and adding a two-digit number and a multiple of 10 using concrete models or drawings and strategies based on place value properties of operations andor the relationship between addition and subtraction relate the strategy to a written method and explain the reasoning used Understand that in adding two-digit numbers one adds tens and tens ones and ones and sometimes it is necessary to compose a ten
1 NBT 5
CC1NBT5 Use place value understanding and properties of operations to add and subtract Given a two-digit number mentally find 10 more or 10 less than the number without having to count explain the reasoning used
1 NBT 6 CC1NBT6 Use place value understanding and properties of operations to add and subtract Subtract multiples of 10 in the range 10-90 from multiples of 10 in the range 10-90 (positive or zero differences) using concrete models or drawings and strategies based on place value properties of operations andor
48
Keansburg School DistrictCurriculum System
Mathematicsthe relationship between addition and subtraction relate the strategy to a written method and explain the reasoning used
1 MD 1
CC1MD1 Measure lengths indirectly and by iterating length units Order three objects by length compare the lengths of two objects indirectly by using a third object
1 MD 2
CC1MD2 Measure lengths indirectly and by iterating length units Express the length of an object as a whole number of length units by laying multiple copies of a shorter object (the length unit) end to end understand that the length measurement of an object is the number of same-size length units that span it with no gaps or overlaps Limit to contexts where the object being measured is spanned by a whole number of length units with no gaps or overlaps
1 MD 3CC1MD3 Tell and write time Tell and write time in hours and half-hours using analog and digital clocks
1 MD 4
CC1MD4 Represent and interpret data Organize represent and interpret data with up to three categories ask and answer questions about the total number of data points how many in each category and how many more or less are in one category than in another
1 G 1
CC1G1 Reason with shapes and their attributes Distinguish between defining attributes (eg triangles are closed and three-sided) versus non-defining attributes (eg color orientation overall size) for a wide variety of shapes build and draw shapes to possess defining attributes
1 G 2
CC1G2 Reason with shapes and their attributes Compose two-dimensional shapes (rectangles squares trapezoids triangles half-circles and quarter-circles) or three-dimensional shapes (cubes right rectangular prisms right circular cones and right circular cylinders) to create a composite shape and compose new shapes from the composite shape (Students do not need to learn formal names such as ldquoright rectangular prismrdquo)
1 G 3
CC1G3 Reason with shapes and their attributes Partition circles and rectangles into two and four equal shares describe the shares using the words halves fourths and quarters and use the phrases half of fourth of and quarter of Describe the whole as two of or four of the shares Understand for these examples that decomposing into more equal shares creates smaller shares
49
Keansburg School DistrictCurriculum System
Mathematics
Common Core State Standards Vocabulary
Addition and subtraction within 5 10 20 100 or 1000 Addition or subtraction of two whole numbers with whole number answers and with sum or minuend in the range 0-5 0-10 0-20 or 0-100 respectively Example 8 + 2 = 10 is an addition within 10 14 ndash 5 = 9 is a subtraction within 20 and 55 ndash 18 = 37 is a subtraction within 100
Additive inverses Two numbers whose sum is 0 are additive inverses of one another Example 34 and ndash 34 are additive inverses of one another because 34 + (ndash 34) = (ndash 34) + 34 = 0
Associative property of addition See Table 3 in this Glossary
Associative property of multiplication See Table 3 in this Glossary
Bivariate data Pairs of linked numerical observations Example a list of heights and weights for each player on a football team
Box plot A method of visually displaying a distribution of data values by using the median quartiles and extremes of the data set A box shows the middle 50 of the data1
Commutative property See Table 3 in this Glossary
Complex fraction A fraction AB where A andor B are fractions (B nonzero)
Computation algorithm A set of predefined steps applicable to a class of problems that gives the correct result in every case when the steps are carried out correctly See also computation strategy
Computation strategy Purposeful manipulations that may be chosen for specific problems may not have a fixed order and may be aimed at converting one problem into another See also computation algorithm
Congruent Two plane or solid figures are congruent if one can be obtained from the other by rigid motion (a sequence of rotations reflections and translations)
Counting on A strategy for finding the number of objects in a group without having to count every member of the group For example if a stack of books is known to have 8 books and 3 more books are added to the top it is not necessary to count the stack
50
Keansburg School DistrictCurriculum System
Mathematicsall over again One can find the total by counting onmdashpointing to the top book and saying ldquoeightrdquo following this with ldquonine ten eleven There are eleven books nowrdquo
Dot plot See line plot
Dilation A transformation that moves each point along the ray through the point emanating from a fixed center and multiplies distances from the center by a common scale factor
Expanded form A multi-digit number is expressed in expanded form when it is written as a sum of single-digit multiples of powers of ten For example 643 = 600 + 40 + 3
Expected value For a random variable the weighted average of its possible values with weights given by their respective probabilities
First quartile For a data set with median M the first quartile is the median of the data values less than M Example For the data set 1 3 6 7 10 12 14 15 22 120 the first quartile is 62 See also median third quartile interquartile range
Fraction A number expressible in the form ab where a is a whole number and b is a positive whole number (The word fraction in these standards always refers to a non-negative number) See also rational number
Identity property of 0 See Table 3 in this Glossary
Independently combined probability models Two probability models are said to be combined independently if the probability of each ordered pair in the combined model equals the product of the original probabilities of the two individual outcomes in the ordered pair
Integer A number expressible in the form a or ndasha for some whole number a
Interquartile Range A measure of variation in a set of numerical data the interquartile range is the distance between the first and third quartiles of the data set Example For the data set 1 3 6 7 10 12 14 15 22 120 the interquartile range is 15 ndash 6 = 9 See also first quartile third quartile
Line plot A method of visually displaying a distribution of data values where each data value is shown as a dot or mark above a number line Also known as a dot plot3
51
Keansburg School DistrictCurriculum System
MathematicsMean A measure of center in a set of numerical data computed by adding the values in a list and then dividing by the number of values in the list4 Example For the data set 1 3 6 7 10 12 14 15 22 120 the mean is 21
Mean absolute deviation A measure of variation in a set of numerical data computed by adding the distances between each data value and the mean then dividing by the number of data values Example For the data set 2 3 6 7 10 12 14 15 22 120 the mean absolute deviation is 20
Median A measure of center in a set of numerical data The median of a list of values is the value appearing at the center of a sorted version of the listmdashor the mean of the two central values if the list contains an even number of values Example For the data set 2 3 6 7 10 12 14 15 22 90 the median is 11
Midline In the graph of a trigonometric function the horizontal line halfway between its maximum and minimum values
Multiplication and division within 100 Multiplication or division of two whole numbers with whole number answers and with product or dividend in the range 0-100 Example 72 divide 8 = 9
Multiplicative inverses Two numbers whose product is 1 are multiplicative inverses of one another Example 34 and 43 are multiplicative inverses of one another because 34 times 43 = 43 times 34 = 1
Number line diagram A diagram of the number line used to represent numbers and support reasoning about them In a number line diagram for measurement quantities the interval from 0 to 1 on the diagram represents the unit of measure for the quantity
Percent rate of change A rate of change expressed as a percent Example if a population grows from 50 to 55 in a year it grows by 550 = 10 per year
Probability distribution The set of possible values of a random variable with a probability assigned to each
Properties of operations See Table 3 in this Glossary
Properties of equality See Table 4 in this Glossary
Properties of inequality See Table 5 in this Glossary
Properties of operations See Table 3 in this Glossary
52
Keansburg School DistrictCurriculum System
MathematicsProbability A number between 0 and 1 used to quantify likelihood for processes that have uncertain outcomes (such as tossing a coin selecting a person at random from a group of people tossing a ball at a target or testing for a medical condition)
Probability model A probability model is used to assign probabilities to outcomes of a chance process by examining the nature of the process The set of all outcomes is called the sample space and their probabilities sum to 1 See also uniform probability model
Random variable An assignment of a numerical value to each outcome in a sample space
Rational expression A quotient of two polynomials with a non-zero denominator
Rational number A number expressible in the form ab or ndash ab for some fraction ab The rational numbers include the integers
Rectilinear figure A polygon all angles of which are right angles
Rigid motion A transformation of points in space consisting of a sequence of one or more translations reflections andor rotations Rigid motions are here assumed to preserve distances and angle measures
Repeating decimal The decimal form of a rational number See also terminating decimal
Sample space In a probability model for a random process a list of the individual outcomes that are to be considered
Scatter plot A graph in the coordinate plane representing a set of bivariate data For example the heights and weights of a group of people could be displayed on a scatter plot5
Similarity transformation A rigid motion followed by a dilation
Tape diagram A drawing that looks like a segment of tape used to illustrate number relationships Also known as a strip diagram bar model fraction strip or length model
Terminating decimal A decimal is called terminating if its repeating digit is 0
Third quartile For a data set with median M the third quartile is the median of the data values greater than M Example For the data set 2 3 6 7 10 12 14 15 22 120 the third quartile is 15 See also median first quartile interquartile range
Transitivity principle for indirect measurement If the length of object A is greater than the length of object B and the length of object B is greater than the length of object C then the length of object A is greater than the length of object C This principle applies
53
Keansburg School DistrictCurriculum System
Mathematicsto measurement of other quantities as well
Uniform probability model A probability model which assigns equal probability to all outcomes See also probability model
Vector A quantity with magnitude and direction in the plane or in space defined by an ordered pair or triple of real numbers
Visual fraction model A tape diagram number line diagram or area model
Whole numbers The numbers 0 1 2 3 hellip5
54
- MissionVision Statement
- Beliefs
- Measurement amp Data
- Measure lengths and by iterating length units
- Tell and write time
- Represent and interpret data
- Geometry
- Reason with shapes and their attributes
- Number and Base Ten
- Extend the counting sequence
- Understand place value
-
- Measurement amp Data (II)
-
- Measure lengths and by iterating length units
- Tell and write time
-
- Represent and interpret data
- Geometry (II)
- Reason with shapes their attributes
-
- Number and Base Ten
- Use place value understanding and properties of operations to add and subtract
- Teacher will cover up specific numbers on an enlarged number grid using cover up tape to have students identify numbers before and after Students will come up and write the missing numbers
- Students will play ldquoI have__ Who has __ Teacher will create cards using index cards and numbers in which students need further practice with Students will read their cards aloud Variations of game can include identifying specific numbers identifying numbers more or less etc)
- Students will use base ten blocks to represent numbers including three digit numbers Students will identify representation of numbers through these manipulatives They may match the representation to the written number
- Students will write the number they created using the base ten blocks using their white boards and markers
- Students will arrange given digits to create the greatest and lowest possible numbers They can show each number they create using base ten blocks
- Students will use the Base Ten Exchange Game to show an understanding of exchanging ones for tens and tens for hundreds Students can use place value mats base ten blocks (cubes tens and flats) Students can take number of cubes displayed with roll of single die Students will determine when exchanging can be made when reaching ten units
- Base ten concentration wwwk-5mathteachingresourcescom
- Ten frame compare wwwk-5mathteachingresourcescom
-
Keansburg School DistrictCurriculum System
MathematicsCurriculum Philosophy
The curriculum philosophy of the Keansburg School District is progressive We embrace the high expectations of our students and community towards success in the 21st Century and beyond At the center of this ideal we believe that all of our students can be successful The following are our core beliefs for all curricula
All district curricula Balances policy driven trends of centralization and standardization with research and what we know is good for our
students Balances the strong emphasis on test success and curriculum standards with how and what our students must
know to be successful in our community Embraces the reality that our students differ in the way they learn and perform and personalizes instruction to
meet the needs of each learner Are aligned to be developmentally appropriate Provides teachers the support and flexibility to be innovative and creative to meet the needs of our students
Mathematics Goals
To deliver a curriculum that is Pertinent for the success of all of our students and useful for teachers in the 21st Century Problem-based where students understand the importance of mathematical concepts and applications Socially emotionally and academically driven with regards to statute and code while focusing on what is best for
each of the students in our school district to achieve successful outcomes Significant in the processes of growth and development and relevant to the students Differentiated with regards to our studentsrsquo abilities and needs Embedded with teaching responsibility respect and the value of hard work and self-pride over time Designed with both content knowledge and experiences which
o Are aligned from one grade level to the next with scaffolded underpinnings of similar concepts for successo Engage our diverse population for positive outcomeso Build and support the language of mathematicso Develop educational and mathematical independence over time
5
Keansburg School DistrictCurriculum System
MathematicsCommon Core Standards for Mathematics
OPERATIONS AND ALGEBRAIC THINKING
Represent and solve problems involving addition and subtraction
1 Use addition and subtraction within 20 to solve word problems involving situations of adding to taking from putting together taking apart and comparing with unknowns in all positions eg by using objects drawings and equations with a symbol for the unknown number to represent the problem
2 Solve word problems that call for addition of three whole numbers whose sum is less than or equal to 20 eg by using objects drawings and equations with a symbol for the unknown number to represent the problem
Understand and apply properties of operations and the relationship between addition and subtraction
3 Apply properties of operations as strategies to add and subtract3 Examples If 8 + 3 = 11 is known then 3 + 8 = 11 is also known (Commutative property of addition) To add 2 + 6 + 4 the second two numbers can be added to make a ten so 2 + 6 + 4 = 2 + 10 = 12 (Associative property of addition)
4 Understand subtraction as an unknown-addend problem For example subtract 10 ndash 8 by finding the number that makes 10 when added to 8
Add and subtract within 20
5 Relate counting to addition and subtraction (eg by counting on 2 to add 2)
6 Add and subtract within 20 demonstrating fluency for addition and subtraction within 10 Use strategies such as counting on making ten (eg 8 + 6 = 8 + 2 + 4 = 10 + 4 = 14) decomposing a number leading to a ten (eg 13 ndash 4 = 13 ndash 3 ndash 1 = 10 ndash 1 = 9) using the relationship between addition and subtraction (eg knowing that 8 + 4 = 12 one knows 12 ndash 8 = 4) and creating equivalent but easier or known sums (eg adding 6 + 7 by creating the known equivalent 6 + 6 + 1 = 12 + 1 = 13)
Work with addition and subtraction equations
7 Understand the meaning of the equal sign and determine if equations involving addition and subtraction are true or false For example which of the following equations are true and which are false 6 = 6 7 = 8 ndash 1 5 + 2 = 2 + 5 4 + 1 = 5 + 2
6
Keansburg School DistrictCurriculum System
Mathematics8 Determine the unknown whole number in an addition or subtraction equation relating three whole numbers For example
determine the unknown number that makes the equation true in each of the equations 8 + = 11 5 = 1048781 ndash 3 6 + 6 = 1048781
NUMBER AND OPERATIONS IN BASE TEN
Extend the counting sequence
1 Count to 120 starting at any number less than 120 In this range read and write numerals and represent a number of objects with a written numeral
Understand place value
2 Understand that the two digits of a two-digit number represent amounts of tens and ones Understand the following as special cases
a 10 can be thought of as a bundle of ten ones mdash called a ldquotenrdquo
b The numbers from 11 to 19 are composed of a ten and one two three four five six seven eight or nine ones
c The numbers 10 20 30 40 50 60 70 80 90 refer to one two three four five six seven eight or nine tens (and 0 ones)
3 Compare two two-digit numbers based on meanings of the tens and ones digits recording the results of comparisons with the symbols gt = and lt
Use place value understanding and properties of operations to add and subtract
4 Add within 100 including adding a two-digit number and a one-digit number and adding a two-digit number and a multiple of 10 using concrete models or drawings and strategies based on place value properties of operations andor the relationship between addition and subtraction relate the strategy to a written method and explain the reasoning used Understand that in adding two-digit numbers one adds tens and tens ones and ones and sometimes it is necessary to compose a ten
5 Given a two-digit number mentally find 10 more or 10 less than the number without having to count explain the reasoning used
6 Subtract multiples of 10 in the range 10-90 from multiples of 10 in the range 10-90 (positive or zero differences) using concrete models or drawings and strategies based on place value properties of operations andor the relationship between addition and subtraction relate the strategy to a written method and explain the reasoning used
7
Keansburg School DistrictCurriculum System
Mathematics
MEASUREMENT AND DATA
Measure lengths indirectly and by iterating length units
1 Order three objects by length compare the lengths of two objects indirectly by using a third object
2 Express the length of an object as a whole number of length units by laying multiple copies of a shorter object (the length unit) end to end understand that the length measurement of an object is the number of same-size length units that span it with no gaps or overlaps Limit to contexts where the object being measured is spanned by a whole number of length units with no gaps or overlaps
Tell and write time
3 Tell and write time in hours and half-hours using analog and digital clocks
Represent and interpret data
4 Organize represent and interpret data with up to three categories ask and answer questions about the total number of data points how many in each category and how many more or less are in one category than in another
GEOMETRY
Reason with shapes and their attributes
1 Distinguish between defining attributes (eg triangles are closed and three-sided) versus non-defining attributes (eg color orientation overall size) build and draw shapes to possess defining attributes
2 Compose two-dimensional shapes (rectangles squares trapezoids triangles half-circles and quarter-circles) or three-dimensional shapes (cubes right rectangular prisms right circular cones and right circular cylinders) to create a composite shape and compose new shapes from the composite shape
3 Partition circles and rectangles into two and four equal shares describe the shares using the words halves fourths and quarters and use the phrases half of fourth of and quarter of Describe the whole as two of or four of the shares Understand for these examples that decomposing into more equal shares creates smaller shares
8
Keansburg School DistrictCurriculum System
Mathematics
Grade 1 Scope and Sequence
SeptemberQuarter 1
Number Sense Numbers 1-20 Number writing Identifying Counting objects (up to 20)
Number 20+ Number Identification Counting 1-100 by ones and tens
OctoberQuarter 1
Operations amp Algebraic Expressions Problem solving with addition and subtraction Properties of operations Add and subtract within 20
NovemberQuarter 2
Measurement amp Data Measure lengths and by iterating length units Tell and write time Represent and interpret data
DecemberQuarter 2
Geometry Reason with shapes and their attributes
JanuaryQuarter 2
Number and Base Ten Extend the counting sequence Understand place value
FebruaryQuarter 3
Operations amp Algebraic Expressions (II) Represent and solve problems involving addition and subtraction Understand and apply properties of operations and the relationship between addition
and subtraction Add and subtract within 20 Work with addition and subtraction equations
MarchQuarter 3
Measurement amp Data (II) Measure lengths and by iterating length units Tell and write time
9
Keansburg School DistrictCurriculum System
Mathematics Represent and interpret data
AprilQuarter 4
Geometry (II) Reason with shapes their attributes
MayQuarter 4
Number and Base Ten Use place value understanding and properties of operations to add and subtract
JuneQuarter 4
Readiness skills for September of Grade 2 Problem solving with all mathematical concepts covered in Grade 1
10
Keansburg School DistrictCurriculum System
Mathematics
Keansburg School DistrictCurriculum Management System
SubjectGradeLevelMathematicsGrade 1
Timeline September-Quarter 1
Topic(s) Number Sense
Significance of Learning Goal(s) To write numbers 0-20
Sugg
este
d D
ays
of
Inst
ruct
ion Content
Standards CPI
Essential Questions
Specific Learning Objective(s)
The Students Will Be Able To
Suggested Activities Instructional Tools Materials Technology Resources Assessments and Assessment Models
CPI KCC1 KCC2 KCC3 KCC6 KOA5 KNBT1
EQ Why is it
important to recognize and write numbers
Concept(s) Kindergarten review of number sense
SWBAT
Identify write and count numbers 0-20
Count objects and represent with a number
Compare and order numbers 0-
Meets Standard Practice counting
numbers 0-20 using nursery rhymes and songs
Order numbers from 0-20 using number cards number tiles (from hundredths board)
Order numbers while understanding words such as before after between Utilize a number line to locate and order numbers
Compare numbers that greater than or less than using games such as Number Line Squeeze
Nursery Rhymes CD Math songs Number cards Number Line Squeeze-number lines Everyday Math cards Straws or popsicle sticks Calendar httpwwwstarfallcomnholidaycalendarloadhtmfampn=main school day count chart weather chart attendance chart class number grid wwwk-5mathteachingresourcescom coins counters
11
Keansburg School DistrictCurriculum System
Mathematics20 through concrete and pictorial models
Count to 100 by ones and tens
Top It and One More One Less Stories
Write numbers from 0-20 Construct numbers 11-19
by bundling groups of ten and then by counting the left over ones
Develop number sense by counting up and counting back using a given number
Incorporate number sense daily through calendar school day count class number grid weather and attendance
Reading counting books Recording tally counts
creating tally charts Find and locate numbers
on the number grid Provide students with
number lines students will need to identify and provide the missing number
Show one more wwwk-5mathteachingresourcescom
Show one less wwwk-5mathteachingresourcescom
One more on the ten frame wwwk-5mathteachingresourcescom
Typical Assessment Question(s) or Task(s) Ask students to count 0-20 Students will be asked to order numbers from 0-20 Compare numbers that greater than or less than Students will display number sense through orally counting up
and counting back using a given number Give students a given number have them identify the given
number on the number grid Have students analyze a tally chart and give the associated
number with this chart
12
Keansburg School DistrictCurriculum System
Mathematics
Exceeds Standard Practice counting
numbers 21-100 Compare numbers
greater than 20 through games
Before and after games Number grid puzzles Counting walk students
estimate step amounts from one location to another Find actual number of steps and compare the two numbers Choose other locations and repeat procedure
Students compose and solve ones and tens riddles
Counting by 5s using nickels
Counting by 10s using dimes
One moreone less scoop wwwk-5mathteachingresourcescom
13
Keansburg School DistrictCurriculum System
Mathematics
Keansburg School DistrictCurriculum Management System
SubjectGradeLevelMathematicsGrade 1
Timeline October-Quarter 1Topic(s) Operations amp Algebraic Expressions
Significance of Learning Goal(s) To solve problems using addition and subtraction within 20
Sugg
este
d
Content Standards CPI Essential
Questions
Specific Learning Objective(s)
The Students Will Be Able To
Suggested ActivitiesInstructional Tools Materials
Technology Resources Assessments and Assessment
Models
CPI 1OA31OA4 1OA5 1OA6 1OA7 1OA8
EQ What questions can
be answered using addition
What strategies can be used to solve problems
How can we tell how many
How does knowing math facts make math easier
How can numbers be helpful
Why do I need to subtract
Concept(s) Working with and solving problems using addition and subtraction within 20
SWBAT
Solve word problems within 20 using real life situations
Understand demonstrate and apply properties of operations for addition
Demonstrate fluency for addition and subtraction within 20 by using strategies to solve
Meets Standard Model a number sentence using
manipulatives and label operation symbols
Use dominoes to create an addition problem and find the sum
Solve addition problems using a number line
Students will develop different ways to solve number stories students will use objects fingers and pictures count onback number line or number grid
Create real life situations in which students will use all number story strategies to solve a problem
Teachers will pose real world number stories to the students students will synthesize pre-existing information that they know to solve the problem
Introduce and devise addition and subtraction number stories posters stating each key word for addition and subtraction operations
Dominoes Number lines Number Grids Number Cards White Boards Dry-Erase markers Pennies
Typical Assessment Question(s) or Task(s)
Students will be asked to solve addition and subtraction problems within 20 within a given time frame
Students will be given a number and be asked to count on from that given number
14
Keansburg School DistrictCurriculum System
Mathematics How do we use
addition and subtraction in our everyday life
Why are fact families important
What strategies can be used to solve problems How is counting on different from just counting to add
What information do you need to know in order to find the total number of something
Why would you need to count back
How are subtraction and addition related
problems Relate counting to
addition by counting on from the higher number
Demonstrate fluency for addition by using strategies such as counting on doubles and doubles plus 1
Combine and mix two sets of 0-10 number cards One partner draws two number cards from the top of the deck students will design and generate a number story using the two numbers Both partners solve the problem in the number story and write the answer on their slate
Use concrete objects to demonstrate the relationship between two addends and the sum
Teacher will model and demonstrate using pictures and objects how objects can be moved around and still come out to equal the same sum
Develop counting on skills by students choosing a number card and partner count on from the given number
Roll two number cubes identify the higher number and count on to find sum
Use technology to show doubles different compliments of 10 songs and raps to help students memorize basic facts Poll students to discover their favorite tune
Play around the world using basic addition facts
Relate addition to subtraction by creating fact families using number cubes dominoes fact family houses etc
Turn around trains wwwk-5mathteachingresourcescom
Domino fact families wwwk-5mathteachingresourcescom
Plus one game wwwk-5mathteachingresourcescom
Students will be given word problems within 20 to solve students will use various strategies and means to solve these problems
15
Keansburg School DistrictCurriculum System
Mathematics One less game wwwk-
5mathteachingresourcescom Doubles facts wwwk-
5mathteachingresourcescom Facts of ten wwwk-
5mathteachingresourcescom Fact family house wwwk-
5mathteachingresourcescom Number sentence math wwwk-
5mathteachingresourcescom Sums of ten wwwk-
5mathteachingresourcescom
Exceeds Standard
In groups or individually students will plan and generate world problems based on real life situations
Teachers will provide pictures of groups of things such as animals people or objects Students will analyze and evaluate the picture and design a number story about the picture
Using number cards or dice create addition sentences draw a picture to represent problem and write an addition number model to correlate with the fact
With 9 10 12 side dice roll two number cubes identify the higher number and count on to find sum
Students will compose their own double facts song
Students create a 4 x 4 double facts mat with double sums Partners roll a 12-sided number cube double the top number showing and X it out on the
16
Keansburg School DistrictCurriculum System
Mathematicsmat First student to get 4 in a row wins
Take two dominoes each representing an addend and have students find the sum
Students use pennies to solve basic addition problems
Students will complete turn around facts Make ten wwwk-
5mathteachingresourcescom Make ten on the ten frame wwwk-
5mathteachingresourcescom What number ishellip wwwk-
5mathteachingresourcescom Make ten square What number ishellip
wwwk-5mathteachingresourcescom Dot card addition What number is
wwwk-5mathteachingresourcescom Addition domino train What number is
wwwk-5mathteachingresourcescom
17
Keansburg School DistrictCurriculum System
MathematicsKeansburg School DistrictCurriculum Management System
SubjectGradeLevelMathematicsGrade 1
Timeline November-Quarter 2
Topic(s) Measurement and Data
Significance of Learning Goal(s) To understand measurement and what tools and used
Sugg
este
d D
ays
of
Inst
ruct
ion Content
Standards CPI Essential Questions
Specific Learning Objective(s)
The Students Will Be Able To
Suggested ActivitiesInstructional Tools Materials
Technology Resources Assessments and Assessment
Models
CPI 1MD1 1MD2 1MD3 1MD4
EQ Why do people
use graphs How is a bar
graph like a tally chart
How would I know if a bar graph correctly shows what is on a tally chart
How could a bar graph answer a question
Concept(s) Understanding what measurement is and what tools are used
SWBAT
Compare and order the length of up to three objects using direct comparisons
Compare the lengths of two objects indirectly by using a third object
Measure objects using non-standard units and express it as a whole number
Draw an object longer or shorter than a given
Meets Standard Teacher will introduce measurement
by holding up objects and the students will examine the objects and explain the size order
o Students will break into groups and compare objects further and classify them depending on their size
Teacher will introduce the ruler Explain to students that the ruler is used to measure objects The students will then explore the classroom and select objects around the room that are smaller and larger than the ruler
Teacher will select specific body parts that the students will use as a personal unit of measurement The students will work in pairs to demonstrate how to measure objects around the room
Rulers Judy Clock Paper Plates Classroom objects Chart paper Jack Hartmann ndash Tick Tock
Song Brainpop Jr White boards Dry Erase markers Clock Concentration
Typical Assessment Question(s) or Task(s)
Analyze a bar graph and answer questions
Create a bar graph using self ndash selected topic
18
Keansburg School DistrictCurriculum System
Mathematics Do bar graphs
make it easier to understand and compare facts Why
What kind of graph should I use to answer questions
Why do I need to tell time
How many hands does a clock have
Are the hands on the clock the same size
How long is a minute
Why do I need to use a calendar
How do we use the clock and the calendar to determine what we will do in school
Why do we need to measure something
What can we use to draw and measure things
What do you think is about 1 inch long
How many steps long do you think it is from
object Organize represent
and interpret data with up to three categories on simple graphs and charts
Analyze and formulate questions based on simple graphs and charts
Identify time to the hour and half hour on both a digital and analog clock
Write time to the hour and half hour on both analog and digital clocks
Draw the hands on an analog clock for a give time to the hour or half hour
Relate times to the half hour to ldquohalf pastrdquo the hour
using their personal unit of measurement
The teacher will select a classroom object and the students will be asked to illustrate objects in the room that are bigger and smaller in size
The students will be able to organize represent and interpret data up to three categories through the use of a bar graph
The teacher will then divide students into heterogeneous groups and encourage the students to explain what they can learn from the graph The students will present findings following activity
Students will choose an object within classroom then find additional objects one being larger the other being shorter using a two-column chart Draw or write the objects in the chart
Create a human clock students will hold 12 numbered plates One student will stand in the middle as the minute and hour hand to model various times
Students will have their own demonstration clocks students will identify and find the hour and minute hands
Students create their own clocks using paper plates students will manipulate hands to identify varying times
Students will listen to Jack Hartman ldquoTick Tockrdquo song
Teachers and students will view clock on videos on brainpopjrcom students
Take 3 objects and order them from smallest to largest and largest to smallest
Read a series of clocks (analog and digital) and tell the time to the hour and half hour
Using blank clocks the students will draw the hands to show a designated time
Use a personal measurement (ie your thumb) to measure the length of an object
19
Keansburg School DistrictCurriculum System
Mathematicsthe front of the classroom to the back
If we measure in footsteps why are some of the measurements different
How is longer and shorter similar to greater and lesser
and teachers can complete quizzes available on website
Teachers will present time on an analog clock students will write the digital time on a white board
Students will play clock concentration
Exceeds Standard
The students will work in pairs to locate objects around the room and compare the lengths against each other The pairs will then work with another pair of students and compare the lengths of their objects with the objects the other pair located
Teacher will introduce the ruler in comparison to the yardstick The students will be encouraged to find objects that in the room that are larger than a ruler and measure using the yardstick
After the teacher introduces units of personal measurement the students will be encouraged to measure object in the room using their own unit of personal measurement and convert it into a standard measurement using a ruler or a yardstick
The teacher will select a classroom object and the students will be asked to illustrate objects in the room that are bigger and smaller by a specific size
The students will be able to organize represent and interpret data up to four
20
Keansburg School DistrictCurriculum System
Mathematicsor more categories through the use of a bar graph
The teacher will then divide students into heterogeneous groups and encourage the students to explain what they can learn from the graph and create a tally chart utilizing the data
Students will create clock flash cards by drawing an analog clock on one side and writing the digital clock time on the other
Give students a clock and a blue number cube ()
21
Keansburg School DistrictCurriculum System
MathematicsKeansburg School DistrictCurriculum Management System
SubjectGradeLevelMathematicsGrade 1
Timeline December-Quarter 2
Topic(s) Geometry
Significance of Learning Goal(s) To identify shapes and their attribures
Sugg
este
d D
ays
of
Inst
ruct
ion Content
Standards CPI Essential
Questions
Specific Learning Objective(s)
The Students Will Be Able To
Suggested Activities
Instructional Tools Materials
Technology Resources
Assessments and Assessment Models
CPI1G1 1G2
EQ Where do
you see shapes in our classroom
Are there different shapes outside
How are geometric figures alike
How can we sort
Concept(s) Identify shapes and their attributes
SWBAT Distinguish
between two and three-dimensional shapes by classifying their attributes For example color shape and size
Compare and contrast shapes based on their attributes
Construct and create shapes
Meets Standard Sorting shapes based on their attributes For example
number of sideso Materials attribute blocks shape card sheet sorting
mat Introduce vocabulary cylinder cube sphere rectangular
prism triangular prism pyramid Classroom shape hunt students go around the room finding shapes within the classroom For example trash can tissue box clock
o Materials shape sheet classroom objects httpilluminationsnctmorgLessonDetailaspxid=L237
Create 3-dimenstion shapes (rectangular prism pyramid cube)
o Straws twist ties shape cards Create 2-dimensional shapes (trapezoid triangle circle
rectangle rhombus)o Pattern block templates attribute blocks pattern
block template stencil geo-boards rubber bands httpilluminationsnctmorgLessonDetailaspx
Attribute blocks Shape card
sheet Sorting mat Twist ties Straws Shape cards Pattern block
templates Attribute blocks Pattern block
template stencil Geo-boards Rubber bands
22
Keansburg School DistrictCurriculum System
Mathematicsobjects of different shapes
How can shapes and solids be described compared and used to make other shapes What are equal parts
What foods do you divide into equal parts
What other items might be divided
How do you know if you have an equal share
possessing certain attributes
Identify and construct two-dimensional shapes
Identify and construct three-dimensional figures
id=L168 Create a drawing using shapes students will create a
picture using the pattern block template stencil (house sun flowers etc)
o Paper pattern block stencil template crayons
Apply understanding of attributes by playing Shape Detective and Attribute Train Game
Demonstrate understanding of 3 Dimensional shapes by playing Whatrsquos My Shape
Exceeds Standard
Introducing and exposing higher vocabulary polyhedronpolyhedra (many faces of a shape) Placing the word onto the word wall
Students read the poem Shapes by Shel Silverstein and create their own illustration of the poem to explore geometric figures and positional words
Materials httpilluminationsnctmorgLessonDetailaspxID=L202
Shapes by Shel Silverstein paper crayons pencils examples of rectangles triangles circles
Compose clues using inferencing to play Guess What Display variety of 3 dimensional shapes Silently choose
an object and give clues about it For example I amsmall I have 2 flat faces and if you trace my faces youwill get circles What am I (tomato can)
Students work together to use pattern blocks to coverother pattern blocks For example how many triangleblocks are needed to cover a hexagon block
Student rotate in groups to visit each geometric solidwhile completing a chart which shows faces sides and
Typical Assessment Question(s) or Task(s)
Ask students how many sides each shape has
Have students classify shapes based on number of sides
Have students identify shapes in the classroom
Have students create 2 and 3 dimensional shapes
Have students design pictures using pattern blockspattern block template
Have students identify and describe assigned shapersquos attributes
Ask students to name 3 dimensional shapes hidden i bag (Whatrsquos my Shape Game)
23
Keansburg School DistrictCurriculum System
Mathematics corners Students compose a shape town by using their pattern
block templates Then students will calculate the totalnumber of each pattern block used
Students will invent new shapes by using three-dimensional shapes
Students will create patterns using three dimensionalshapes
24
Keansburg School DistrictCurriculum System
MathematicsKeansburg School DistrictCurriculum Management System
SubjectGradeLevelMathematicsGrade 1
Timeline January-Quarter 2
Topic(s) Number and Operations in Base Ten
Significance of Learning Goal(s) To recognize compare and understand numbers to 120
Sugg
este
d D
ays
of
Inst
ruct
ion Content
Standards CPI Essential
Questions
Specific Learning Objective(s)
The Students Will Be Able To
Suggested ActivitiesInstructional Tools Materials
Technology Resources Assessments and Assessment
Models
25
Keansburg School DistrictCurriculum System
MathematicsCPI 1NBT1 1NBT2A 1NBT2B 1NBT2C 1NBT3
EQ How do
numbers help us
How can sets of numbers be counted compared and ordered
How can I use numbers to solve problems
How would putting numbers on a chart make it easier to understand information
How can I make it easier to understand numbers when I sort them
What is place value
Concept(s) Recognize compare and understand numbers up to 120
SWBAT Recognize read write
and count 0-120 Understand that a two-
digit number represents amounts of tens and ones
Relate groups of ten to skip counting
Compare two two-digit numbers based on meanings of tens and ones digits using symbols ltgt and =
Meets Standard Teacher will cover up specific numbers
on an enlarged number grid using cover up tape to have students identify numbers before and after Students will come up and write the missing numbers
Students will play ldquoI have__ Who has __ Teacher will create cards using index cards and numbers in which students need further practice with Students will read their cards aloud Variations of game can include identifying specific numbers identifying numbers more or less etc)
Students will use base ten blocks to represent numbers including three digit numbers Students will identify representation of numbers through these manipulatives They may match the representation to the written number
Students will write the number they created using the base ten blocks using their white boards and markers
Students will arrange given digits to create the greatest and lowest possible numbers They can show each number they create using base ten blocks
Students will use the Base Ten Exchange Game to show an
Number grids ldquoI have Who hasrdquo index
cards base ten blocks white boards markers number cards dice ten frame base ten concentration
boards (k-5 math teaching resources)
double ten frame boards (k-5 math teaching resources)
Typical Assessment Question(s) or Task(s)
Recognize numbers 1-120 using flashcards
Write numbers 1-20 using block or graph paper
Build two-digit numbers using tens and ones blocks
Listen and note students skip counting orally by tens to 120
Students compare and label two numbers using relation symbols
26
Keansburg School DistrictCurriculum System
Mathematics Why is place
value important
How can I use place value to compare and order numbers
How can I use the number grid to help me with counting numbers
How many times do you think you can hop in one minute
What does number relationships mean
Why do we need to know how to add
Why do we need to know how to subtract
How are addition and subtraction related
What are doubles
How can
understanding of exchanging ones for tens and tens for hundreds Students can use place value mats base ten blocks (cubes tens and flats) Students can take number of cubes displayed with roll of single die Students will determine when exchanging can be made when reaching ten units
Teens on the ten frame wwwk-5mathteachingresourcescom
Base ten concentration wwwk-5mathteachingresourcescom
Ten frame compare wwwk-5mathteachingresourcescom
Exceeds Standard
Students will create riddles Irsquom thinking of a number that has 4 tens and 13 ones Have students solve the riddle by regrouping the ones to find the answer
-Students use hundreds chart to jump up and down from a number to show 10 more or 10 less
-Students will play Whatrsquos my Number by giving clues based on place value odd or even and number sense For example Irsquom a two digit number The digit in my tens place is 2 more than 4
27
Keansburg School DistrictCurriculum System
Mathematicsdouble facts help us to add and subtract
Does it matter what order you use to add three numbers Why or why not
The digit in my ones place is 3 less than 8 Whatrsquos my number
My double ten frame riddle wwwk-5mathteachingresourcescom
28
Keansburg School DistrictCurriculum System
MathematicsKeansburg School DistrictCurriculum Management System
SubjectGradeLevelMathematicsGrade 1
Timeline February-Quarter 3
Topic(s) Operations amp Algebraic Expressions
Significance of Learning Goal(s) To solve addition and subtraction problems
Sugg
este
d D
ays
of
Inst
ruct
ion Content
Standards CPI
Essential Questions
Specific Learning Objective(s)
The Students Will Be Able To
Suggested ActivitiesInstructional Tools Materials
Technology Resources Assessments and Assessment
Models
CPI1OA31OA4 1OA5 1OA6 1OA7 1OA81OA2
EQ What
questions can be answered using addition
What strategies can be used to solve problems
How can we
Concept(s) Solve addition with and subtraction problems
SWBAT Solve addition problems
with sums up to 20 Use addition within 20 to
solve word problems involving real life situations
Solve word problems that call for addition of three whole numbers up to 20
Solve subtraction problems with difference up to 20
Use subtraction within 20 to solve word problems involving real
Meets Standard Model and have students create their
own individual number sentence using manipulatives and label operation symbols
Students will choose a strategy to solve number stories such as objects fingers and pictures count onback number line or number grid
Create real life situations in which students will use a strategy to solve a number story and create a number model
Review addition and subtraction number stories posters stating each key word for addition and subtraction operations
Combine and mix two sets of 0-20 number cards One partner draws two number cards from the top of the deck students will design and generate a number story using the two numbers
Materials Manipulatives (examples
counting bears connecting cubes pennies counters etc)
Slates dry erase markers erasers
Clear Sheet Protectors Sets of 0-20 number cards Number cards Cardstock Scrabble tiles letter cards
Typical Assessment Question(s) or Task(s)
Students will solve real life
29
Keansburg School DistrictCurriculum System
Mathematicstell how many
How does knowing math facts make math easier
How can numbers be helpful
Why do I need to subtract
How do we use addition and subtraction in our everyday life
Why are fact families important
What strategies can be used to solve problems How is counting on different from just counting to add
What information do you need to know in order to find
life situations Understand subtraction
as an unknown addend problem example subtract 9-5 by finding the number that makes 9 when added to 5
Both partners solve the problem in the number story and write the answer on their slate
Find three cards that have a sum of 12 how many different ways can the student make the sum of 12 using three cards students record work
-Teacher creates real life word problemsinvolving three addends up to 20
Ten frames subtraction wwwk-5mathteachingresourcescom
I have who has wwwk-5mathteachingresourcescom
True or false wwwk-5mathteachingresourcescom
Count to 20 wwwk-5mathteachingresourcescom
Exceeds Standard
Teacher creates multi step word problems for students to solve
Students work with partners or small groups to create real life word problems Compose class book of problems
Three letter addends use scrabble tiles or letter cards with corresponding numbers to make three letter words find
word problems Students will create their
own number sentences own number storiesword problems
Students will create and solve number stories in cooperative learning groups
Students will generate word problems using assigned numbers
30
Keansburg School DistrictCurriculum System
Mathematicsthe total number of something
Why would you need to count back
How are subtraction and addition related
the sum of each word by adding the numbers on the tiles Students will find which words have the greatest or smallest sum
31
Keansburg School DistrictCurriculum System
MathematicsKeansburg School DistrictCurriculum Management System
SubjectGradeLevelMathematicsGrade 1
Timeline March-Quarter 3
Topic(s) Measurement amp Data
Significance of Learning Goal(s) To tell time and compare measurements
Sugg
este
d D
ays
of
Inst
ruct
ion Content
Standards CPI
Essential Questions
Specific Learning Objective(s)
The Students Will Be Able ToSuggested Activities
Instructional Tools Materials Technology Resources
Assessments and Assessment Models
How would I know if a bar graph correctly shows what is on a tally chart
How could a bar graph answer a question
Do bar graphs make it easier to understand and compare facts Why
What kind
Concept(s) Telling time comparing measurements
SWBAT Identify and write time to
the hour and half hour on both a digital and analog clock
Write time to the hour and half-hour on both digital and analog clocks
Draw the hands on the analog clock for a given time to the hour or half-hour
Relate times to the half hour as ldquohalf-pastrdquo the hour
Compare and contrast
Meets Standard Students will have their own
demonstration clocks students will identify and find the hour and minute hands
Students create their own clocks using paper plates students will manipulate hands to identify varying times
Students will listen to Jack Hartman ldquoTick Tockrdquo song
Teachers and students will view clock on videos on brainpopjrcom students and teachers can complete quizzes available on website
Teachers will present time on an analog clock students will write the digital time on a white board
Students will play clock concentration Teacher will introduce measurement by
holding up objects and the students will examine the objects and explain the size
Large Judy Clock Individual student Judy
clocks Wipe off analogdigital clocks Clock stampers Timers Rulers Yardsticks Measuring tapes Sheet protectors Cardstock Paper plates Fasteners Index cards
Typical Assessment Question(s) or Task(s)
Students will be asked to identify and write time to the hour and half hour on both
32
Keansburg School DistrictCurriculum System
Mathematicsof graph should I use to answer questions
Why do I need to tell time
How many hands does a clock have
Are the hands on the clock the same size
How long is a minute
Why do I need to use a calendar
How do we use the clock and the calendar to determine what we will do in school
Why do we need to measure something
What can
objects by length Construct objects at
contrasting lengths
ordero Students will break into groups
and compare objects further and classify them depending on their size
Teacher will introduce the ruler Explain to students that the ruler is used to measure objects The students will then explore the classroom and select objects around the room that are smaller and larger than the ruler
Teacher will select specific body parts that the students will use as a personal unit of measurement The students will work in pairs to demonstrate how to measure objects around the room using their personal unit of measurement
The teacher will select a classroom object and the students will be asked to illustrate objects in the room that are bigger and smaller in size
The students will be able to organize represent and interpret data up to three categories through the use of a bar graph
The teacher will then divide students into heterogeneous groups and encourage the students to explain what they can learn from the graph The students will present findings following activity
Students will choose an object within classroom then find additional objects one being larger the other being shorter using a two-column chart Draw or write the objects in the chart
digital and analog clocks Students will be asked to
identify the parts of a clock students will be asked to draw the hands on an analog clock for a given time to the hour or half-hour
Students will be given various objects and will further be asked to compare and contrast the lengths of these objects
Students will be asked to provide or create objects contrasting lengths to demonstrate understanding of differences in length
33
Keansburg School DistrictCurriculum System
Mathematicswe use to draw and measure things
What do you think is about 1 inch long
How many steps long do you think it is from the front of the classroom to the back
If we measure in footsteps why are some of the measurements different
How is longer and shorter similar to greater and lesser
Exceeds Standard
The students will work in pairs to locate objects around the room and compare the lengths against each other The pairs will then work with another pair of students and compare the lengths of their objects with the objects the other pair located
Teacher will introduce the ruler in comparison to the yardstick The students will be encouraged to find objects that in the room that are larger than a ruler and measure using the yardstick
After the teacher introduces units of personal measurement the students will be encouraged to measure object in the room using their own unit of personal measurement and convert it into a standard measurement using a ruler or a yardstick
The teacher will select a classroom object and the students will be asked to illustrate objects in the room that are bigger and smaller by a specific size
The students will be able to organize represent and interpret data up to four or more categories through the use of a bar graph
The teacher will then divide students into heterogeneous groups and encourage the students to explain what they can learn from the graph and create a tally chart utilizing the data
Students will create clock flash cards by
34
Keansburg School DistrictCurriculum System
Mathematicsdrawing an analog clock on one side and writing the digital clock time on the other Students will include time in five minute intervals
Pose word problems where students have to find elapse time to the hour and half hour
Introduce second hand and conduct activities that are timed in seconds (Examples hopping on 1 foot blinking eyes counting to the highest number)
35
Keansburg School DistrictCurriculum System
MathematicsKeansburg School DistrictCurriculum Management System
SubjectGradeLevelMathematicsGrade 1
Timeline April-Quarter 4
Topic(s) Geometry
Significance of Learning Goal(s) To identify two and three dimensional shapes to understand fractional parts and create equal shares
Sugg
este
d D
ays
of
Inst
ruct
ion Content
Standards CPI Essential
Questions
Specific Learning Objective(s)
The Students Will Be Able To
Suggested ActivitiesInstructional Tools Materials
Technology Resources Assessments and Assessment
Models
Are there different shapes outside
How are geometric figures alike
How can we sort objects of different shapes
How can shapes and solids be described compared and used to make other shapes
Concept(s) Two and three dimensional shapes fractional parts equal shares
SWBAT
Combine two-dimensional or three-dimensional shapes or figures to create a new composite shape and identify the shapes within
Identify fractional parts of circles and rectangles into equal shares while developing vocabulary for halves fourths and quarters
Describe the whole as
Meets Standard
Determine which shape by touch without using their sight
o Materials attribute blocks shape sheet feely box wwwilluminationsnctmorglessondetail
Sorting 3-dimensional objects students will be given cards with 3-dimensional objects (trash can soup can globe ball tissue box box dice) they will sort them based on the 3-dimensional shape they represent
o 3-dimensional object cards sorting mats
Pizza and Cake Fractions students will utilize a pizza and a cake to work on the concept of fractions while developing the vocabulary halves quarters and fourths
o Materials teacher created pizza
Attribute blocks Geometric shapes 3-dimensional object
cards Sorting maps 3-dimensional shapes Solid and lane figures Geo-boards and rubber
bands Fraction circles Sheet protectors 2-dimensional shapes
Typical Assessment Question(s) or Task(s)
Students will be asked to describe and identify
36
Keansburg School DistrictCurriculum System
MathematicsWhat are equal parts
What foods do you divide into equal parts
What other items might be divided
How do you know if you have an equal share
two of or four of the shares Understand for these examples that decomposing into more equal shares creates smaller shares
and cake that are cut into fractions (construction paper)
Students will illustrate a picture of a boat using at least one three dimensional shape in their drawings Shapes include cubes cylinders spheres cones and rectangular prisms
Solid and Plane Figures Name the Face activity Provide three-dimensional objects Have students draw the face for each object as well as name the shape Examples ABC block juice can book party hat
Introduce fractions by having students identify shapes that show equal parts Display cut out shapes using document camera Include some shapes that are divided equally and some that are not divided equally As a whole group sort shapes into two categories Then have students go back to their desks and work with a partner to classify additional shapes
Provide students with shapes that are divided into four parts Include shapes that are divided into four equal parts and others that are unequal Students identify the shapes that are divided into four equal parts and explain their reasoning
Shape Town activity Students will design a shape town using the following shapes
shapes within combined two and three-dimensional shapes
Students will be given circles and rectangles students will be asked to divide these shapes into halves fourths and quarters
Students will be asked to sort shapes that are divided equally and not divided equally
37
Keansburg School DistrictCurriculum System
Mathematicstrapezoid hexagon square triangle and circle Afterwards students will calculate the total number of each shape they included After completing the activity students will present their final product to the class and explain how they decided which shapes to use
Given an array of dots students will draw shapes with specific number of sides and corners and connect the dots to create the shapes Example Draw a shape with 5 sides Draw a shape with 6 corners
Students will create two-dimensional shapes on geoboards Then using different colored rubber bands students will divide the shapes into equal parts Students will transfer their equally divided shapes onto geoboard paper by drawing lines to show their equal parts
Play the Fraction Path Game Materials Fraction circles a circle with frac12 shaded a circle with 13 shaded and a circle with frac14 shaded Gameboard Path consisting of assorted shapes divided into halves thirds and fourths Players Needed 3 Directions Place the fraction circles facedown Players close their eyes and pick one fraction circle Each player follows the path from start to finish Each player looks at each shape on the path and records how many shapes show their fractions Players record
38
Keansburg School DistrictCurriculum System
Mathematicstheir results on paper using tally marks At end of game students compare total number of shapes that show their fraction
Exceeds Standard
39
Keansburg School DistrictCurriculum System
MathematicsKeansburg School DistrictCurriculum Management System
SubjectGradeLevelMathematicsGrade 1
Timeline May-Quarter 4
Topic(s) Number and Operations in Base Ten
Significance of Learning Goal(s) To use place value to add and subtract
Sugg
este
d D
ays
of
Inst
ruct
ion Content
Standards CPI Essential
Questions
Specific Learning Objective(s)
The Students Will Be Able ToSuggested Activities
Instructional Tools Materials Technology Resources
Assessments and Assessment Models
40
Keansburg School DistrictCurriculum System
MathematicsCPI 1NBT4 1NBT5 1NBT6
EQ How do
numbers help us
How can sets of numbers be counted compared and ordered
How can I use numbers to solve problems
How would putting numbers on a chart make it easier to understand information
How can I make it easier to understand numbers when I sort them
What is place value
Why is place value important
How can I
Concept(s) Use place value and properties of operations to add and subtract
SWBAT Use mental math to find
10 more or ten less than a given two-digit number and explain reasoning used within any number to 120
Use place value to add within 100 add a two-digit number to a one-digit number and add a two-digit number to a multiple of ten
Understand when adding two-digit numbers that ones add to the ones and tens add to the tens and sometimes it is necessary to compose a ten by regrouping
For all above objects students will use concrete models and strategies based on place value and relate the strategy to a written method and explain the reasoning used
Subtract multiples of 10 in the range 10-90 from multiples of 10 in the range 10-90 using
Meets Standard
Comparing two digit numbers wwwk-5mathteachingresourcescom
Subtraction split wwwk-5mathteachingresourcescom
Ten more wwwk-5mathteachingresourcescom
Addition split wwwk-5mathteachingresourcescom
Exceeds Standard
Comparing 3-Digit numbers wwwk-5mathteachingresourcescom
What number is wwwk-5mathteachingresourcescom
Students develop addition and subtraction number stories and have partners solve
Create pictures using basendash10 blocks Students trace picture onto paper label the base ten blocks with their value and add total
Solve number grid puzzles by adding and subtraction 10 on the number grid
Number cards Base 10 blocks Counters Number grid puzzles Sleeve protectors wwwk-
5mathteachingresourcescom
Dice
Typical Assessment Question(s) or Task(s)
Recognize numbers 1-120 using flashcards
Write numbers 1-20 using block or graph paper
Build two-digit numbers using tens and ones blocks
Listen and note students skip counting orally by tens to 120
Students compare and label two numbers using relation symbols
41
Keansburg School DistrictCurriculum System
Mathematics
42
Keansburg School DistrictCurriculum System
MathematicsKeansburg School DistrictCurriculum Management System
SubjectGradeLevelMathematicsGrade 1
Timeline June-Quarter 4
Topic(s) Readiness skills for September of Grade 2
Significance of Learning Goal(s) To compare larger numbers add fluently and apply measurement skills
Sugg
este
d D
ays
of
Inst
ruct
ion Content
Standards CPI Essential Questions
Specific Learning Objective(s)
The Students Will Be Able ToSuggested Activities
Instructional Tools Materials Technology Resources
Assessments and Assessment Models
CPI
EQ How can I use
place value to compare and
order numbers in the 100s
How can mastering basic addition and subtraction facts help me compute larger numbers
How can I tie in
Concept(s)Use place value to compare larger numbers fluently add up to 20 apply measurement skills
SWBAT Extend place value into
the hundreds place and re-write and construct models beyond the hundreds
Fluently add and subtract within 20 using mental strategies
Apply measurement skills
Meets Standard Place Value barrier game httpwwwk-
5mathteachingresourcescommath-gameshtml (place value only)
High card
httpwwwlearningboxcomBase10 BaseTenhtml
Time barrier game httpwwwk-5mathteachingresourcescomsupport-filestimebarriergamepdf httpwwwk-5mathteachingresourcescomsupport-filestimebarriergamegridpdf
My favorite time of day writing activity
number cards base ten blocks rulers tape measurer string number relationship mat paper plates cotton balls judy clock digital clock
Typical Assessment Question(s) or Task(s)
Students will solve addition and subtraction problems within 20 in a given time
43
Keansburg School DistrictCurriculum System
Mathematicsmeasurement skills with real life experiences
httpwwwk-5mathteachingresourcescomsupport-filesmy-favorite-time-of-daypdf
Estimating length httpwwwk-5mathteachingresourcescomsupport-filesestimatinglengthpdf
Olympic golf plastic golf clubs cotton balls and tape measurer
Olympic smiles measuring smiles with string and rulers
Olympic Frisbee using paper plates and tape measurer
Olympic airplane students will make paper airplanes measure the distance that they can throw their airplane
Doubles plus 1 game httpwwwk-5mathteachingresourcescomsupport-filesdoubles-plus-onepdf
Eleven more httpwwwk-5mathteachingresourcescomsupport-fileselevenmorepdf
frame Students will be asked to
measure items using inches and centimeters
Identify and create numbers with place values extending into the hundreds place
44
Keansburg School DistrictCurriculum System
Mathematics
Building numbers with base ten blocks pick three cards and arrange them to show a 3-digit number build that number with base ten blocks repeat with the same three cards until no new numbers can be made
Length strength inches httpwwwharcourtschoolcomactivitylength_strength1_inches
Length strength centimeters httpwwwharcourtschoolcomactivitylength_strength1_centi
Exceeds Standard
Number relationship mat wwwk-5mathteachingresourcescom
Place value barrier game httpwwwk-5mathteachingresourcescommath-gameshtml (integrate other skills into place values for example the digit in my 10s place is four doubled)
Measuring the mousersquos path httpwwwk-5mathteachingresourcescomsupport-filespaths1pdf
45
Keansburg School DistrictCurriculum System
Mathematics
Double minus 1 game httpwwwk-5mathteachingresourcescomsupport-filesdoubles-minus-onepdf
Number relationship mat httpwwwk-5mathteachingresourcescomsupport-filesnumberrelationshipmatpdf
46
Keansburg School DistrictCurriculum System
Mathematicsignment Matrices of Common Core State Standards
Grade Strand Standard Standard
Sept
embe
r ndash
Oct
ober
Nov
embe
r ndash
Dec
embe
r
Janu
ary
ndash Fe
brua
ry
Mar
ch ndash
Apr
il
May
- Ju
ne
1 OA 1
CC1OA1 Represent and solve problems involving addition and subtraction Use addition and subtraction within 20 to solve word problems involving situations of adding to taking from putting together taking apart and comparing with unknowns in all positions eg by using objects drawings and equations with a symbol for the unknown number to represent the problem
1 OA 2
CC1OA2 Represent and solve problems involving addition and subtraction Solve word problems that call for addition of three whole numbers whose sum is less than or equal to 20 eg by using objects drawings and equations with a symbol for the unknown number to represent the problem
1 OA 3
CC1OA3 Understand and apply properties of operations and the relationship between addition and subtraction Apply properties of operations as strategies to add and subtract Examples If 8 + 3 = 11 is known then 3 + 8 = 11 is also known (Commutative property of addition) To add 2 + 6 + 4 the second two numbers can be added to make a ten so 2 + 6 + 4 = 2 + 10 = 12 (Associative property of addition) (Students need not use formal terms for these properties)
1 OA 4
CC1OA4 Understand and apply properties of operations and the relationship between addition and subtraction Understand subtraction as an unknown-addend problem For example subtract 10 ndash 8 by finding the number that makes 10 when added to 8
1 OA 5 CC1OA5 Add and subtract within 20 Relate counting to addition and subtraction (eg by counting on 2 to add 2)
1 OA 6 CC1OA6 Add and subtract within 20 Add and subtract within 20 demonstrating fluency for addition and subtraction within 10 Use strategies such as counting on making ten (eg 8 + 6 = 8 + 2 + 4 = 10 + 4 = 14) decomposing a number leading to a ten (eg 13 ndash 4 = 13 ndash 3 ndash 1 = 10 ndash 1 = 9) using the relationship between addition and subtraction (eg knowing that 8 + 4
47
Keansburg School DistrictCurriculum System
Mathematics= 12 one knows 12 ndash 8 = 4) and creating equivalent but easier or known sums (eg adding 6 + 7 by creating the known equivalent 6 + 6 + 1 = 12 + 1 = 13)
1 OA 7
CC1OA7 Work with addition and subtraction equations Understand the meaning of the equal sign and determine if equations involving addition and subtraction are true or false For example which of the following equations are true and which are false 6 = 6 7 = 8 ndash 1 5 + 2 = 2 + 5 4 + 1 = 5 + 2
1 OA 8
CC1OA8 Work with addition and subtraction equations Determine the unknown whole number in an addition or subtraction equation relating three whole numbers For example determine the unknown number that makes the equation true in each of the equations 8 + = 11 5 = _ ndash 3 6 + 6 = _
1 NBT 1
CC1NBT1 Extend the counting sequence Count to 120 starting at any number less than 120 In this range read and write numerals and represent a number of objects with a written numeral
1 NBT 2
CC1NBT2 Understand place value Understand that the two digits of a two-digit number represent amounts of tens and ones Understand the following as special cases -- a 10 can be thought of as a bundle of ten ones mdash called a ldquotenrdquo -- b The numbers from 11 to 19 are composed of a ten and one two three four five six seven eight or nine ones -- c The numbers 10 20 30 40 50 60 70 80 90 refer to one two three four five six seven eight or nine tens (and 0 ones)
1 NBT 3
CC1NBT3 Understand place value Compare two two-digit numbers based on meanings of the tens and ones digits recording the results of comparisons with the symbols gt = and lt
1 NBT 4
CC1NBT4 Use place value understanding and properties of operations to add and subtract Add within 100 including adding a two-digit number and a one-digit number and adding a two-digit number and a multiple of 10 using concrete models or drawings and strategies based on place value properties of operations andor the relationship between addition and subtraction relate the strategy to a written method and explain the reasoning used Understand that in adding two-digit numbers one adds tens and tens ones and ones and sometimes it is necessary to compose a ten
1 NBT 5
CC1NBT5 Use place value understanding and properties of operations to add and subtract Given a two-digit number mentally find 10 more or 10 less than the number without having to count explain the reasoning used
1 NBT 6 CC1NBT6 Use place value understanding and properties of operations to add and subtract Subtract multiples of 10 in the range 10-90 from multiples of 10 in the range 10-90 (positive or zero differences) using concrete models or drawings and strategies based on place value properties of operations andor
48
Keansburg School DistrictCurriculum System
Mathematicsthe relationship between addition and subtraction relate the strategy to a written method and explain the reasoning used
1 MD 1
CC1MD1 Measure lengths indirectly and by iterating length units Order three objects by length compare the lengths of two objects indirectly by using a third object
1 MD 2
CC1MD2 Measure lengths indirectly and by iterating length units Express the length of an object as a whole number of length units by laying multiple copies of a shorter object (the length unit) end to end understand that the length measurement of an object is the number of same-size length units that span it with no gaps or overlaps Limit to contexts where the object being measured is spanned by a whole number of length units with no gaps or overlaps
1 MD 3CC1MD3 Tell and write time Tell and write time in hours and half-hours using analog and digital clocks
1 MD 4
CC1MD4 Represent and interpret data Organize represent and interpret data with up to three categories ask and answer questions about the total number of data points how many in each category and how many more or less are in one category than in another
1 G 1
CC1G1 Reason with shapes and their attributes Distinguish between defining attributes (eg triangles are closed and three-sided) versus non-defining attributes (eg color orientation overall size) for a wide variety of shapes build and draw shapes to possess defining attributes
1 G 2
CC1G2 Reason with shapes and their attributes Compose two-dimensional shapes (rectangles squares trapezoids triangles half-circles and quarter-circles) or three-dimensional shapes (cubes right rectangular prisms right circular cones and right circular cylinders) to create a composite shape and compose new shapes from the composite shape (Students do not need to learn formal names such as ldquoright rectangular prismrdquo)
1 G 3
CC1G3 Reason with shapes and their attributes Partition circles and rectangles into two and four equal shares describe the shares using the words halves fourths and quarters and use the phrases half of fourth of and quarter of Describe the whole as two of or four of the shares Understand for these examples that decomposing into more equal shares creates smaller shares
49
Keansburg School DistrictCurriculum System
Mathematics
Common Core State Standards Vocabulary
Addition and subtraction within 5 10 20 100 or 1000 Addition or subtraction of two whole numbers with whole number answers and with sum or minuend in the range 0-5 0-10 0-20 or 0-100 respectively Example 8 + 2 = 10 is an addition within 10 14 ndash 5 = 9 is a subtraction within 20 and 55 ndash 18 = 37 is a subtraction within 100
Additive inverses Two numbers whose sum is 0 are additive inverses of one another Example 34 and ndash 34 are additive inverses of one another because 34 + (ndash 34) = (ndash 34) + 34 = 0
Associative property of addition See Table 3 in this Glossary
Associative property of multiplication See Table 3 in this Glossary
Bivariate data Pairs of linked numerical observations Example a list of heights and weights for each player on a football team
Box plot A method of visually displaying a distribution of data values by using the median quartiles and extremes of the data set A box shows the middle 50 of the data1
Commutative property See Table 3 in this Glossary
Complex fraction A fraction AB where A andor B are fractions (B nonzero)
Computation algorithm A set of predefined steps applicable to a class of problems that gives the correct result in every case when the steps are carried out correctly See also computation strategy
Computation strategy Purposeful manipulations that may be chosen for specific problems may not have a fixed order and may be aimed at converting one problem into another See also computation algorithm
Congruent Two plane or solid figures are congruent if one can be obtained from the other by rigid motion (a sequence of rotations reflections and translations)
Counting on A strategy for finding the number of objects in a group without having to count every member of the group For example if a stack of books is known to have 8 books and 3 more books are added to the top it is not necessary to count the stack
50
Keansburg School DistrictCurriculum System
Mathematicsall over again One can find the total by counting onmdashpointing to the top book and saying ldquoeightrdquo following this with ldquonine ten eleven There are eleven books nowrdquo
Dot plot See line plot
Dilation A transformation that moves each point along the ray through the point emanating from a fixed center and multiplies distances from the center by a common scale factor
Expanded form A multi-digit number is expressed in expanded form when it is written as a sum of single-digit multiples of powers of ten For example 643 = 600 + 40 + 3
Expected value For a random variable the weighted average of its possible values with weights given by their respective probabilities
First quartile For a data set with median M the first quartile is the median of the data values less than M Example For the data set 1 3 6 7 10 12 14 15 22 120 the first quartile is 62 See also median third quartile interquartile range
Fraction A number expressible in the form ab where a is a whole number and b is a positive whole number (The word fraction in these standards always refers to a non-negative number) See also rational number
Identity property of 0 See Table 3 in this Glossary
Independently combined probability models Two probability models are said to be combined independently if the probability of each ordered pair in the combined model equals the product of the original probabilities of the two individual outcomes in the ordered pair
Integer A number expressible in the form a or ndasha for some whole number a
Interquartile Range A measure of variation in a set of numerical data the interquartile range is the distance between the first and third quartiles of the data set Example For the data set 1 3 6 7 10 12 14 15 22 120 the interquartile range is 15 ndash 6 = 9 See also first quartile third quartile
Line plot A method of visually displaying a distribution of data values where each data value is shown as a dot or mark above a number line Also known as a dot plot3
51
Keansburg School DistrictCurriculum System
MathematicsMean A measure of center in a set of numerical data computed by adding the values in a list and then dividing by the number of values in the list4 Example For the data set 1 3 6 7 10 12 14 15 22 120 the mean is 21
Mean absolute deviation A measure of variation in a set of numerical data computed by adding the distances between each data value and the mean then dividing by the number of data values Example For the data set 2 3 6 7 10 12 14 15 22 120 the mean absolute deviation is 20
Median A measure of center in a set of numerical data The median of a list of values is the value appearing at the center of a sorted version of the listmdashor the mean of the two central values if the list contains an even number of values Example For the data set 2 3 6 7 10 12 14 15 22 90 the median is 11
Midline In the graph of a trigonometric function the horizontal line halfway between its maximum and minimum values
Multiplication and division within 100 Multiplication or division of two whole numbers with whole number answers and with product or dividend in the range 0-100 Example 72 divide 8 = 9
Multiplicative inverses Two numbers whose product is 1 are multiplicative inverses of one another Example 34 and 43 are multiplicative inverses of one another because 34 times 43 = 43 times 34 = 1
Number line diagram A diagram of the number line used to represent numbers and support reasoning about them In a number line diagram for measurement quantities the interval from 0 to 1 on the diagram represents the unit of measure for the quantity
Percent rate of change A rate of change expressed as a percent Example if a population grows from 50 to 55 in a year it grows by 550 = 10 per year
Probability distribution The set of possible values of a random variable with a probability assigned to each
Properties of operations See Table 3 in this Glossary
Properties of equality See Table 4 in this Glossary
Properties of inequality See Table 5 in this Glossary
Properties of operations See Table 3 in this Glossary
52
Keansburg School DistrictCurriculum System
MathematicsProbability A number between 0 and 1 used to quantify likelihood for processes that have uncertain outcomes (such as tossing a coin selecting a person at random from a group of people tossing a ball at a target or testing for a medical condition)
Probability model A probability model is used to assign probabilities to outcomes of a chance process by examining the nature of the process The set of all outcomes is called the sample space and their probabilities sum to 1 See also uniform probability model
Random variable An assignment of a numerical value to each outcome in a sample space
Rational expression A quotient of two polynomials with a non-zero denominator
Rational number A number expressible in the form ab or ndash ab for some fraction ab The rational numbers include the integers
Rectilinear figure A polygon all angles of which are right angles
Rigid motion A transformation of points in space consisting of a sequence of one or more translations reflections andor rotations Rigid motions are here assumed to preserve distances and angle measures
Repeating decimal The decimal form of a rational number See also terminating decimal
Sample space In a probability model for a random process a list of the individual outcomes that are to be considered
Scatter plot A graph in the coordinate plane representing a set of bivariate data For example the heights and weights of a group of people could be displayed on a scatter plot5
Similarity transformation A rigid motion followed by a dilation
Tape diagram A drawing that looks like a segment of tape used to illustrate number relationships Also known as a strip diagram bar model fraction strip or length model
Terminating decimal A decimal is called terminating if its repeating digit is 0
Third quartile For a data set with median M the third quartile is the median of the data values greater than M Example For the data set 2 3 6 7 10 12 14 15 22 120 the third quartile is 15 See also median first quartile interquartile range
Transitivity principle for indirect measurement If the length of object A is greater than the length of object B and the length of object B is greater than the length of object C then the length of object A is greater than the length of object C This principle applies
53
Keansburg School DistrictCurriculum System
Mathematicsto measurement of other quantities as well
Uniform probability model A probability model which assigns equal probability to all outcomes See also probability model
Vector A quantity with magnitude and direction in the plane or in space defined by an ordered pair or triple of real numbers
Visual fraction model A tape diagram number line diagram or area model
Whole numbers The numbers 0 1 2 3 hellip5
54
- MissionVision Statement
- Beliefs
- Measurement amp Data
- Measure lengths and by iterating length units
- Tell and write time
- Represent and interpret data
- Geometry
- Reason with shapes and their attributes
- Number and Base Ten
- Extend the counting sequence
- Understand place value
-
- Measurement amp Data (II)
-
- Measure lengths and by iterating length units
- Tell and write time
-
- Represent and interpret data
- Geometry (II)
- Reason with shapes their attributes
-
- Number and Base Ten
- Use place value understanding and properties of operations to add and subtract
- Teacher will cover up specific numbers on an enlarged number grid using cover up tape to have students identify numbers before and after Students will come up and write the missing numbers
- Students will play ldquoI have__ Who has __ Teacher will create cards using index cards and numbers in which students need further practice with Students will read their cards aloud Variations of game can include identifying specific numbers identifying numbers more or less etc)
- Students will use base ten blocks to represent numbers including three digit numbers Students will identify representation of numbers through these manipulatives They may match the representation to the written number
- Students will write the number they created using the base ten blocks using their white boards and markers
- Students will arrange given digits to create the greatest and lowest possible numbers They can show each number they create using base ten blocks
- Students will use the Base Ten Exchange Game to show an understanding of exchanging ones for tens and tens for hundreds Students can use place value mats base ten blocks (cubes tens and flats) Students can take number of cubes displayed with roll of single die Students will determine when exchanging can be made when reaching ten units
- Base ten concentration wwwk-5mathteachingresourcescom
- Ten frame compare wwwk-5mathteachingresourcescom
-

Keansburg School DistrictCurriculum System
MathematicsCommon Core Standards for Mathematics
OPERATIONS AND ALGEBRAIC THINKING
Represent and solve problems involving addition and subtraction
1 Use addition and subtraction within 20 to solve word problems involving situations of adding to taking from putting together taking apart and comparing with unknowns in all positions eg by using objects drawings and equations with a symbol for the unknown number to represent the problem
2 Solve word problems that call for addition of three whole numbers whose sum is less than or equal to 20 eg by using objects drawings and equations with a symbol for the unknown number to represent the problem
Understand and apply properties of operations and the relationship between addition and subtraction
3 Apply properties of operations as strategies to add and subtract3 Examples If 8 + 3 = 11 is known then 3 + 8 = 11 is also known (Commutative property of addition) To add 2 + 6 + 4 the second two numbers can be added to make a ten so 2 + 6 + 4 = 2 + 10 = 12 (Associative property of addition)
4 Understand subtraction as an unknown-addend problem For example subtract 10 ndash 8 by finding the number that makes 10 when added to 8
Add and subtract within 20
5 Relate counting to addition and subtraction (eg by counting on 2 to add 2)
6 Add and subtract within 20 demonstrating fluency for addition and subtraction within 10 Use strategies such as counting on making ten (eg 8 + 6 = 8 + 2 + 4 = 10 + 4 = 14) decomposing a number leading to a ten (eg 13 ndash 4 = 13 ndash 3 ndash 1 = 10 ndash 1 = 9) using the relationship between addition and subtraction (eg knowing that 8 + 4 = 12 one knows 12 ndash 8 = 4) and creating equivalent but easier or known sums (eg adding 6 + 7 by creating the known equivalent 6 + 6 + 1 = 12 + 1 = 13)
Work with addition and subtraction equations
7 Understand the meaning of the equal sign and determine if equations involving addition and subtraction are true or false For example which of the following equations are true and which are false 6 = 6 7 = 8 ndash 1 5 + 2 = 2 + 5 4 + 1 = 5 + 2
6
Keansburg School DistrictCurriculum System
Mathematics8 Determine the unknown whole number in an addition or subtraction equation relating three whole numbers For example
determine the unknown number that makes the equation true in each of the equations 8 + = 11 5 = 1048781 ndash 3 6 + 6 = 1048781
NUMBER AND OPERATIONS IN BASE TEN
Extend the counting sequence
1 Count to 120 starting at any number less than 120 In this range read and write numerals and represent a number of objects with a written numeral
Understand place value
2 Understand that the two digits of a two-digit number represent amounts of tens and ones Understand the following as special cases
a 10 can be thought of as a bundle of ten ones mdash called a ldquotenrdquo
b The numbers from 11 to 19 are composed of a ten and one two three four five six seven eight or nine ones
c The numbers 10 20 30 40 50 60 70 80 90 refer to one two three four five six seven eight or nine tens (and 0 ones)
3 Compare two two-digit numbers based on meanings of the tens and ones digits recording the results of comparisons with the symbols gt = and lt
Use place value understanding and properties of operations to add and subtract
4 Add within 100 including adding a two-digit number and a one-digit number and adding a two-digit number and a multiple of 10 using concrete models or drawings and strategies based on place value properties of operations andor the relationship between addition and subtraction relate the strategy to a written method and explain the reasoning used Understand that in adding two-digit numbers one adds tens and tens ones and ones and sometimes it is necessary to compose a ten
5 Given a two-digit number mentally find 10 more or 10 less than the number without having to count explain the reasoning used
6 Subtract multiples of 10 in the range 10-90 from multiples of 10 in the range 10-90 (positive or zero differences) using concrete models or drawings and strategies based on place value properties of operations andor the relationship between addition and subtraction relate the strategy to a written method and explain the reasoning used
7
Keansburg School DistrictCurriculum System
Mathematics
MEASUREMENT AND DATA
Measure lengths indirectly and by iterating length units
1 Order three objects by length compare the lengths of two objects indirectly by using a third object
2 Express the length of an object as a whole number of length units by laying multiple copies of a shorter object (the length unit) end to end understand that the length measurement of an object is the number of same-size length units that span it with no gaps or overlaps Limit to contexts where the object being measured is spanned by a whole number of length units with no gaps or overlaps
Tell and write time
3 Tell and write time in hours and half-hours using analog and digital clocks
Represent and interpret data
4 Organize represent and interpret data with up to three categories ask and answer questions about the total number of data points how many in each category and how many more or less are in one category than in another
GEOMETRY
Reason with shapes and their attributes
1 Distinguish between defining attributes (eg triangles are closed and three-sided) versus non-defining attributes (eg color orientation overall size) build and draw shapes to possess defining attributes
2 Compose two-dimensional shapes (rectangles squares trapezoids triangles half-circles and quarter-circles) or three-dimensional shapes (cubes right rectangular prisms right circular cones and right circular cylinders) to create a composite shape and compose new shapes from the composite shape
3 Partition circles and rectangles into two and four equal shares describe the shares using the words halves fourths and quarters and use the phrases half of fourth of and quarter of Describe the whole as two of or four of the shares Understand for these examples that decomposing into more equal shares creates smaller shares
8
Keansburg School DistrictCurriculum System
Mathematics
Grade 1 Scope and Sequence
SeptemberQuarter 1
Number Sense Numbers 1-20 Number writing Identifying Counting objects (up to 20)
Number 20+ Number Identification Counting 1-100 by ones and tens
OctoberQuarter 1
Operations amp Algebraic Expressions Problem solving with addition and subtraction Properties of operations Add and subtract within 20
NovemberQuarter 2
Measurement amp Data Measure lengths and by iterating length units Tell and write time Represent and interpret data
DecemberQuarter 2
Geometry Reason with shapes and their attributes
JanuaryQuarter 2
Number and Base Ten Extend the counting sequence Understand place value
FebruaryQuarter 3
Operations amp Algebraic Expressions (II) Represent and solve problems involving addition and subtraction Understand and apply properties of operations and the relationship between addition
and subtraction Add and subtract within 20 Work with addition and subtraction equations
MarchQuarter 3
Measurement amp Data (II) Measure lengths and by iterating length units Tell and write time
9
Keansburg School DistrictCurriculum System
Mathematics Represent and interpret data
AprilQuarter 4
Geometry (II) Reason with shapes their attributes
MayQuarter 4
Number and Base Ten Use place value understanding and properties of operations to add and subtract
JuneQuarter 4
Readiness skills for September of Grade 2 Problem solving with all mathematical concepts covered in Grade 1
10
Keansburg School DistrictCurriculum System
Mathematics
Keansburg School DistrictCurriculum Management System
SubjectGradeLevelMathematicsGrade 1
Timeline September-Quarter 1
Topic(s) Number Sense
Significance of Learning Goal(s) To write numbers 0-20
Sugg
este
d D
ays
of
Inst
ruct
ion Content
Standards CPI
Essential Questions
Specific Learning Objective(s)
The Students Will Be Able To
Suggested Activities Instructional Tools Materials Technology Resources Assessments and Assessment Models
CPI KCC1 KCC2 KCC3 KCC6 KOA5 KNBT1
EQ Why is it
important to recognize and write numbers
Concept(s) Kindergarten review of number sense
SWBAT
Identify write and count numbers 0-20
Count objects and represent with a number
Compare and order numbers 0-
Meets Standard Practice counting
numbers 0-20 using nursery rhymes and songs
Order numbers from 0-20 using number cards number tiles (from hundredths board)
Order numbers while understanding words such as before after between Utilize a number line to locate and order numbers
Compare numbers that greater than or less than using games such as Number Line Squeeze
Nursery Rhymes CD Math songs Number cards Number Line Squeeze-number lines Everyday Math cards Straws or popsicle sticks Calendar httpwwwstarfallcomnholidaycalendarloadhtmfampn=main school day count chart weather chart attendance chart class number grid wwwk-5mathteachingresourcescom coins counters
11
Keansburg School DistrictCurriculum System
Mathematics20 through concrete and pictorial models
Count to 100 by ones and tens
Top It and One More One Less Stories
Write numbers from 0-20 Construct numbers 11-19
by bundling groups of ten and then by counting the left over ones
Develop number sense by counting up and counting back using a given number
Incorporate number sense daily through calendar school day count class number grid weather and attendance
Reading counting books Recording tally counts
creating tally charts Find and locate numbers
on the number grid Provide students with
number lines students will need to identify and provide the missing number
Show one more wwwk-5mathteachingresourcescom
Show one less wwwk-5mathteachingresourcescom
One more on the ten frame wwwk-5mathteachingresourcescom
Typical Assessment Question(s) or Task(s) Ask students to count 0-20 Students will be asked to order numbers from 0-20 Compare numbers that greater than or less than Students will display number sense through orally counting up
and counting back using a given number Give students a given number have them identify the given
number on the number grid Have students analyze a tally chart and give the associated
number with this chart
12
Keansburg School DistrictCurriculum System
Mathematics
Exceeds Standard Practice counting
numbers 21-100 Compare numbers
greater than 20 through games
Before and after games Number grid puzzles Counting walk students
estimate step amounts from one location to another Find actual number of steps and compare the two numbers Choose other locations and repeat procedure
Students compose and solve ones and tens riddles
Counting by 5s using nickels
Counting by 10s using dimes
One moreone less scoop wwwk-5mathteachingresourcescom
13
Keansburg School DistrictCurriculum System
Mathematics
Keansburg School DistrictCurriculum Management System
SubjectGradeLevelMathematicsGrade 1
Timeline October-Quarter 1Topic(s) Operations amp Algebraic Expressions
Significance of Learning Goal(s) To solve problems using addition and subtraction within 20
Sugg
este
d
Content Standards CPI Essential
Questions
Specific Learning Objective(s)
The Students Will Be Able To
Suggested ActivitiesInstructional Tools Materials
Technology Resources Assessments and Assessment
Models
CPI 1OA31OA4 1OA5 1OA6 1OA7 1OA8
EQ What questions can
be answered using addition
What strategies can be used to solve problems
How can we tell how many
How does knowing math facts make math easier
How can numbers be helpful
Why do I need to subtract
Concept(s) Working with and solving problems using addition and subtraction within 20
SWBAT
Solve word problems within 20 using real life situations
Understand demonstrate and apply properties of operations for addition
Demonstrate fluency for addition and subtraction within 20 by using strategies to solve
Meets Standard Model a number sentence using
manipulatives and label operation symbols
Use dominoes to create an addition problem and find the sum
Solve addition problems using a number line
Students will develop different ways to solve number stories students will use objects fingers and pictures count onback number line or number grid
Create real life situations in which students will use all number story strategies to solve a problem
Teachers will pose real world number stories to the students students will synthesize pre-existing information that they know to solve the problem
Introduce and devise addition and subtraction number stories posters stating each key word for addition and subtraction operations
Dominoes Number lines Number Grids Number Cards White Boards Dry-Erase markers Pennies
Typical Assessment Question(s) or Task(s)
Students will be asked to solve addition and subtraction problems within 20 within a given time frame
Students will be given a number and be asked to count on from that given number
14
Keansburg School DistrictCurriculum System
Mathematics How do we use
addition and subtraction in our everyday life
Why are fact families important
What strategies can be used to solve problems How is counting on different from just counting to add
What information do you need to know in order to find the total number of something
Why would you need to count back
How are subtraction and addition related
problems Relate counting to
addition by counting on from the higher number
Demonstrate fluency for addition by using strategies such as counting on doubles and doubles plus 1
Combine and mix two sets of 0-10 number cards One partner draws two number cards from the top of the deck students will design and generate a number story using the two numbers Both partners solve the problem in the number story and write the answer on their slate
Use concrete objects to demonstrate the relationship between two addends and the sum
Teacher will model and demonstrate using pictures and objects how objects can be moved around and still come out to equal the same sum
Develop counting on skills by students choosing a number card and partner count on from the given number
Roll two number cubes identify the higher number and count on to find sum
Use technology to show doubles different compliments of 10 songs and raps to help students memorize basic facts Poll students to discover their favorite tune
Play around the world using basic addition facts
Relate addition to subtraction by creating fact families using number cubes dominoes fact family houses etc
Turn around trains wwwk-5mathteachingresourcescom
Domino fact families wwwk-5mathteachingresourcescom
Plus one game wwwk-5mathteachingresourcescom
Students will be given word problems within 20 to solve students will use various strategies and means to solve these problems
15
Keansburg School DistrictCurriculum System
Mathematics One less game wwwk-
5mathteachingresourcescom Doubles facts wwwk-
5mathteachingresourcescom Facts of ten wwwk-
5mathteachingresourcescom Fact family house wwwk-
5mathteachingresourcescom Number sentence math wwwk-
5mathteachingresourcescom Sums of ten wwwk-
5mathteachingresourcescom
Exceeds Standard
In groups or individually students will plan and generate world problems based on real life situations
Teachers will provide pictures of groups of things such as animals people or objects Students will analyze and evaluate the picture and design a number story about the picture
Using number cards or dice create addition sentences draw a picture to represent problem and write an addition number model to correlate with the fact
With 9 10 12 side dice roll two number cubes identify the higher number and count on to find sum
Students will compose their own double facts song
Students create a 4 x 4 double facts mat with double sums Partners roll a 12-sided number cube double the top number showing and X it out on the
16
Keansburg School DistrictCurriculum System
Mathematicsmat First student to get 4 in a row wins
Take two dominoes each representing an addend and have students find the sum
Students use pennies to solve basic addition problems
Students will complete turn around facts Make ten wwwk-
5mathteachingresourcescom Make ten on the ten frame wwwk-
5mathteachingresourcescom What number ishellip wwwk-
5mathteachingresourcescom Make ten square What number ishellip
wwwk-5mathteachingresourcescom Dot card addition What number is
wwwk-5mathteachingresourcescom Addition domino train What number is
wwwk-5mathteachingresourcescom
17
Keansburg School DistrictCurriculum System
MathematicsKeansburg School DistrictCurriculum Management System
SubjectGradeLevelMathematicsGrade 1
Timeline November-Quarter 2
Topic(s) Measurement and Data
Significance of Learning Goal(s) To understand measurement and what tools and used
Sugg
este
d D
ays
of
Inst
ruct
ion Content
Standards CPI Essential Questions
Specific Learning Objective(s)
The Students Will Be Able To
Suggested ActivitiesInstructional Tools Materials
Technology Resources Assessments and Assessment
Models
CPI 1MD1 1MD2 1MD3 1MD4
EQ Why do people
use graphs How is a bar
graph like a tally chart
How would I know if a bar graph correctly shows what is on a tally chart
How could a bar graph answer a question
Concept(s) Understanding what measurement is and what tools are used
SWBAT
Compare and order the length of up to three objects using direct comparisons
Compare the lengths of two objects indirectly by using a third object
Measure objects using non-standard units and express it as a whole number
Draw an object longer or shorter than a given
Meets Standard Teacher will introduce measurement
by holding up objects and the students will examine the objects and explain the size order
o Students will break into groups and compare objects further and classify them depending on their size
Teacher will introduce the ruler Explain to students that the ruler is used to measure objects The students will then explore the classroom and select objects around the room that are smaller and larger than the ruler
Teacher will select specific body parts that the students will use as a personal unit of measurement The students will work in pairs to demonstrate how to measure objects around the room
Rulers Judy Clock Paper Plates Classroom objects Chart paper Jack Hartmann ndash Tick Tock
Song Brainpop Jr White boards Dry Erase markers Clock Concentration
Typical Assessment Question(s) or Task(s)
Analyze a bar graph and answer questions
Create a bar graph using self ndash selected topic
18
Keansburg School DistrictCurriculum System
Mathematics Do bar graphs
make it easier to understand and compare facts Why
What kind of graph should I use to answer questions
Why do I need to tell time
How many hands does a clock have
Are the hands on the clock the same size
How long is a minute
Why do I need to use a calendar
How do we use the clock and the calendar to determine what we will do in school
Why do we need to measure something
What can we use to draw and measure things
What do you think is about 1 inch long
How many steps long do you think it is from
object Organize represent
and interpret data with up to three categories on simple graphs and charts
Analyze and formulate questions based on simple graphs and charts
Identify time to the hour and half hour on both a digital and analog clock
Write time to the hour and half hour on both analog and digital clocks
Draw the hands on an analog clock for a give time to the hour or half hour
Relate times to the half hour to ldquohalf pastrdquo the hour
using their personal unit of measurement
The teacher will select a classroom object and the students will be asked to illustrate objects in the room that are bigger and smaller in size
The students will be able to organize represent and interpret data up to three categories through the use of a bar graph
The teacher will then divide students into heterogeneous groups and encourage the students to explain what they can learn from the graph The students will present findings following activity
Students will choose an object within classroom then find additional objects one being larger the other being shorter using a two-column chart Draw or write the objects in the chart
Create a human clock students will hold 12 numbered plates One student will stand in the middle as the minute and hour hand to model various times
Students will have their own demonstration clocks students will identify and find the hour and minute hands
Students create their own clocks using paper plates students will manipulate hands to identify varying times
Students will listen to Jack Hartman ldquoTick Tockrdquo song
Teachers and students will view clock on videos on brainpopjrcom students
Take 3 objects and order them from smallest to largest and largest to smallest
Read a series of clocks (analog and digital) and tell the time to the hour and half hour
Using blank clocks the students will draw the hands to show a designated time
Use a personal measurement (ie your thumb) to measure the length of an object
19
Keansburg School DistrictCurriculum System
Mathematicsthe front of the classroom to the back
If we measure in footsteps why are some of the measurements different
How is longer and shorter similar to greater and lesser
and teachers can complete quizzes available on website
Teachers will present time on an analog clock students will write the digital time on a white board
Students will play clock concentration
Exceeds Standard
The students will work in pairs to locate objects around the room and compare the lengths against each other The pairs will then work with another pair of students and compare the lengths of their objects with the objects the other pair located
Teacher will introduce the ruler in comparison to the yardstick The students will be encouraged to find objects that in the room that are larger than a ruler and measure using the yardstick
After the teacher introduces units of personal measurement the students will be encouraged to measure object in the room using their own unit of personal measurement and convert it into a standard measurement using a ruler or a yardstick
The teacher will select a classroom object and the students will be asked to illustrate objects in the room that are bigger and smaller by a specific size
The students will be able to organize represent and interpret data up to four
20
Keansburg School DistrictCurriculum System
Mathematicsor more categories through the use of a bar graph
The teacher will then divide students into heterogeneous groups and encourage the students to explain what they can learn from the graph and create a tally chart utilizing the data
Students will create clock flash cards by drawing an analog clock on one side and writing the digital clock time on the other
Give students a clock and a blue number cube ()
21
Keansburg School DistrictCurriculum System
MathematicsKeansburg School DistrictCurriculum Management System
SubjectGradeLevelMathematicsGrade 1
Timeline December-Quarter 2
Topic(s) Geometry
Significance of Learning Goal(s) To identify shapes and their attribures
Sugg
este
d D
ays
of
Inst
ruct
ion Content
Standards CPI Essential
Questions
Specific Learning Objective(s)
The Students Will Be Able To
Suggested Activities
Instructional Tools Materials
Technology Resources
Assessments and Assessment Models
CPI1G1 1G2
EQ Where do
you see shapes in our classroom
Are there different shapes outside
How are geometric figures alike
How can we sort
Concept(s) Identify shapes and their attributes
SWBAT Distinguish
between two and three-dimensional shapes by classifying their attributes For example color shape and size
Compare and contrast shapes based on their attributes
Construct and create shapes
Meets Standard Sorting shapes based on their attributes For example
number of sideso Materials attribute blocks shape card sheet sorting
mat Introduce vocabulary cylinder cube sphere rectangular
prism triangular prism pyramid Classroom shape hunt students go around the room finding shapes within the classroom For example trash can tissue box clock
o Materials shape sheet classroom objects httpilluminationsnctmorgLessonDetailaspxid=L237
Create 3-dimenstion shapes (rectangular prism pyramid cube)
o Straws twist ties shape cards Create 2-dimensional shapes (trapezoid triangle circle
rectangle rhombus)o Pattern block templates attribute blocks pattern
block template stencil geo-boards rubber bands httpilluminationsnctmorgLessonDetailaspx
Attribute blocks Shape card
sheet Sorting mat Twist ties Straws Shape cards Pattern block
templates Attribute blocks Pattern block
template stencil Geo-boards Rubber bands
22
Keansburg School DistrictCurriculum System
Mathematicsobjects of different shapes
How can shapes and solids be described compared and used to make other shapes What are equal parts
What foods do you divide into equal parts
What other items might be divided
How do you know if you have an equal share
possessing certain attributes
Identify and construct two-dimensional shapes
Identify and construct three-dimensional figures
id=L168 Create a drawing using shapes students will create a
picture using the pattern block template stencil (house sun flowers etc)
o Paper pattern block stencil template crayons
Apply understanding of attributes by playing Shape Detective and Attribute Train Game
Demonstrate understanding of 3 Dimensional shapes by playing Whatrsquos My Shape
Exceeds Standard
Introducing and exposing higher vocabulary polyhedronpolyhedra (many faces of a shape) Placing the word onto the word wall
Students read the poem Shapes by Shel Silverstein and create their own illustration of the poem to explore geometric figures and positional words
Materials httpilluminationsnctmorgLessonDetailaspxID=L202
Shapes by Shel Silverstein paper crayons pencils examples of rectangles triangles circles
Compose clues using inferencing to play Guess What Display variety of 3 dimensional shapes Silently choose
an object and give clues about it For example I amsmall I have 2 flat faces and if you trace my faces youwill get circles What am I (tomato can)
Students work together to use pattern blocks to coverother pattern blocks For example how many triangleblocks are needed to cover a hexagon block
Student rotate in groups to visit each geometric solidwhile completing a chart which shows faces sides and
Typical Assessment Question(s) or Task(s)
Ask students how many sides each shape has
Have students classify shapes based on number of sides
Have students identify shapes in the classroom
Have students create 2 and 3 dimensional shapes
Have students design pictures using pattern blockspattern block template
Have students identify and describe assigned shapersquos attributes
Ask students to name 3 dimensional shapes hidden i bag (Whatrsquos my Shape Game)
23
Keansburg School DistrictCurriculum System
Mathematics corners Students compose a shape town by using their pattern
block templates Then students will calculate the totalnumber of each pattern block used
Students will invent new shapes by using three-dimensional shapes
Students will create patterns using three dimensionalshapes
24
Keansburg School DistrictCurriculum System
MathematicsKeansburg School DistrictCurriculum Management System
SubjectGradeLevelMathematicsGrade 1
Timeline January-Quarter 2
Topic(s) Number and Operations in Base Ten
Significance of Learning Goal(s) To recognize compare and understand numbers to 120
Sugg
este
d D
ays
of
Inst
ruct
ion Content
Standards CPI Essential
Questions
Specific Learning Objective(s)
The Students Will Be Able To
Suggested ActivitiesInstructional Tools Materials
Technology Resources Assessments and Assessment
Models
25
Keansburg School DistrictCurriculum System
MathematicsCPI 1NBT1 1NBT2A 1NBT2B 1NBT2C 1NBT3
EQ How do
numbers help us
How can sets of numbers be counted compared and ordered
How can I use numbers to solve problems
How would putting numbers on a chart make it easier to understand information
How can I make it easier to understand numbers when I sort them
What is place value
Concept(s) Recognize compare and understand numbers up to 120
SWBAT Recognize read write
and count 0-120 Understand that a two-
digit number represents amounts of tens and ones
Relate groups of ten to skip counting
Compare two two-digit numbers based on meanings of tens and ones digits using symbols ltgt and =
Meets Standard Teacher will cover up specific numbers
on an enlarged number grid using cover up tape to have students identify numbers before and after Students will come up and write the missing numbers
Students will play ldquoI have__ Who has __ Teacher will create cards using index cards and numbers in which students need further practice with Students will read their cards aloud Variations of game can include identifying specific numbers identifying numbers more or less etc)
Students will use base ten blocks to represent numbers including three digit numbers Students will identify representation of numbers through these manipulatives They may match the representation to the written number
Students will write the number they created using the base ten blocks using their white boards and markers
Students will arrange given digits to create the greatest and lowest possible numbers They can show each number they create using base ten blocks
Students will use the Base Ten Exchange Game to show an
Number grids ldquoI have Who hasrdquo index
cards base ten blocks white boards markers number cards dice ten frame base ten concentration
boards (k-5 math teaching resources)
double ten frame boards (k-5 math teaching resources)
Typical Assessment Question(s) or Task(s)
Recognize numbers 1-120 using flashcards
Write numbers 1-20 using block or graph paper
Build two-digit numbers using tens and ones blocks
Listen and note students skip counting orally by tens to 120
Students compare and label two numbers using relation symbols
26
Keansburg School DistrictCurriculum System
Mathematics Why is place
value important
How can I use place value to compare and order numbers
How can I use the number grid to help me with counting numbers
How many times do you think you can hop in one minute
What does number relationships mean
Why do we need to know how to add
Why do we need to know how to subtract
How are addition and subtraction related
What are doubles
How can
understanding of exchanging ones for tens and tens for hundreds Students can use place value mats base ten blocks (cubes tens and flats) Students can take number of cubes displayed with roll of single die Students will determine when exchanging can be made when reaching ten units
Teens on the ten frame wwwk-5mathteachingresourcescom
Base ten concentration wwwk-5mathteachingresourcescom
Ten frame compare wwwk-5mathteachingresourcescom
Exceeds Standard
Students will create riddles Irsquom thinking of a number that has 4 tens and 13 ones Have students solve the riddle by regrouping the ones to find the answer
-Students use hundreds chart to jump up and down from a number to show 10 more or 10 less
-Students will play Whatrsquos my Number by giving clues based on place value odd or even and number sense For example Irsquom a two digit number The digit in my tens place is 2 more than 4
27
Keansburg School DistrictCurriculum System
Mathematicsdouble facts help us to add and subtract
Does it matter what order you use to add three numbers Why or why not
The digit in my ones place is 3 less than 8 Whatrsquos my number
My double ten frame riddle wwwk-5mathteachingresourcescom
28
Keansburg School DistrictCurriculum System
MathematicsKeansburg School DistrictCurriculum Management System
SubjectGradeLevelMathematicsGrade 1
Timeline February-Quarter 3
Topic(s) Operations amp Algebraic Expressions
Significance of Learning Goal(s) To solve addition and subtraction problems
Sugg
este
d D
ays
of
Inst
ruct
ion Content
Standards CPI
Essential Questions
Specific Learning Objective(s)
The Students Will Be Able To
Suggested ActivitiesInstructional Tools Materials
Technology Resources Assessments and Assessment
Models
CPI1OA31OA4 1OA5 1OA6 1OA7 1OA81OA2
EQ What
questions can be answered using addition
What strategies can be used to solve problems
How can we
Concept(s) Solve addition with and subtraction problems
SWBAT Solve addition problems
with sums up to 20 Use addition within 20 to
solve word problems involving real life situations
Solve word problems that call for addition of three whole numbers up to 20
Solve subtraction problems with difference up to 20
Use subtraction within 20 to solve word problems involving real
Meets Standard Model and have students create their
own individual number sentence using manipulatives and label operation symbols
Students will choose a strategy to solve number stories such as objects fingers and pictures count onback number line or number grid
Create real life situations in which students will use a strategy to solve a number story and create a number model
Review addition and subtraction number stories posters stating each key word for addition and subtraction operations
Combine and mix two sets of 0-20 number cards One partner draws two number cards from the top of the deck students will design and generate a number story using the two numbers
Materials Manipulatives (examples
counting bears connecting cubes pennies counters etc)
Slates dry erase markers erasers
Clear Sheet Protectors Sets of 0-20 number cards Number cards Cardstock Scrabble tiles letter cards
Typical Assessment Question(s) or Task(s)
Students will solve real life
29
Keansburg School DistrictCurriculum System
Mathematicstell how many
How does knowing math facts make math easier
How can numbers be helpful
Why do I need to subtract
How do we use addition and subtraction in our everyday life
Why are fact families important
What strategies can be used to solve problems How is counting on different from just counting to add
What information do you need to know in order to find
life situations Understand subtraction
as an unknown addend problem example subtract 9-5 by finding the number that makes 9 when added to 5
Both partners solve the problem in the number story and write the answer on their slate
Find three cards that have a sum of 12 how many different ways can the student make the sum of 12 using three cards students record work
-Teacher creates real life word problemsinvolving three addends up to 20
Ten frames subtraction wwwk-5mathteachingresourcescom
I have who has wwwk-5mathteachingresourcescom
True or false wwwk-5mathteachingresourcescom
Count to 20 wwwk-5mathteachingresourcescom
Exceeds Standard
Teacher creates multi step word problems for students to solve
Students work with partners or small groups to create real life word problems Compose class book of problems
Three letter addends use scrabble tiles or letter cards with corresponding numbers to make three letter words find
word problems Students will create their
own number sentences own number storiesword problems
Students will create and solve number stories in cooperative learning groups
Students will generate word problems using assigned numbers
30
Keansburg School DistrictCurriculum System
Mathematicsthe total number of something
Why would you need to count back
How are subtraction and addition related
the sum of each word by adding the numbers on the tiles Students will find which words have the greatest or smallest sum
31
Keansburg School DistrictCurriculum System
MathematicsKeansburg School DistrictCurriculum Management System
SubjectGradeLevelMathematicsGrade 1
Timeline March-Quarter 3
Topic(s) Measurement amp Data
Significance of Learning Goal(s) To tell time and compare measurements
Sugg
este
d D
ays
of
Inst
ruct
ion Content
Standards CPI
Essential Questions
Specific Learning Objective(s)
The Students Will Be Able ToSuggested Activities
Instructional Tools Materials Technology Resources
Assessments and Assessment Models
How would I know if a bar graph correctly shows what is on a tally chart
How could a bar graph answer a question
Do bar graphs make it easier to understand and compare facts Why
What kind
Concept(s) Telling time comparing measurements
SWBAT Identify and write time to
the hour and half hour on both a digital and analog clock
Write time to the hour and half-hour on both digital and analog clocks
Draw the hands on the analog clock for a given time to the hour or half-hour
Relate times to the half hour as ldquohalf-pastrdquo the hour
Compare and contrast
Meets Standard Students will have their own
demonstration clocks students will identify and find the hour and minute hands
Students create their own clocks using paper plates students will manipulate hands to identify varying times
Students will listen to Jack Hartman ldquoTick Tockrdquo song
Teachers and students will view clock on videos on brainpopjrcom students and teachers can complete quizzes available on website
Teachers will present time on an analog clock students will write the digital time on a white board
Students will play clock concentration Teacher will introduce measurement by
holding up objects and the students will examine the objects and explain the size
Large Judy Clock Individual student Judy
clocks Wipe off analogdigital clocks Clock stampers Timers Rulers Yardsticks Measuring tapes Sheet protectors Cardstock Paper plates Fasteners Index cards
Typical Assessment Question(s) or Task(s)
Students will be asked to identify and write time to the hour and half hour on both
32
Keansburg School DistrictCurriculum System
Mathematicsof graph should I use to answer questions
Why do I need to tell time
How many hands does a clock have
Are the hands on the clock the same size
How long is a minute
Why do I need to use a calendar
How do we use the clock and the calendar to determine what we will do in school
Why do we need to measure something
What can
objects by length Construct objects at
contrasting lengths
ordero Students will break into groups
and compare objects further and classify them depending on their size
Teacher will introduce the ruler Explain to students that the ruler is used to measure objects The students will then explore the classroom and select objects around the room that are smaller and larger than the ruler
Teacher will select specific body parts that the students will use as a personal unit of measurement The students will work in pairs to demonstrate how to measure objects around the room using their personal unit of measurement
The teacher will select a classroom object and the students will be asked to illustrate objects in the room that are bigger and smaller in size
The students will be able to organize represent and interpret data up to three categories through the use of a bar graph
The teacher will then divide students into heterogeneous groups and encourage the students to explain what they can learn from the graph The students will present findings following activity
Students will choose an object within classroom then find additional objects one being larger the other being shorter using a two-column chart Draw or write the objects in the chart
digital and analog clocks Students will be asked to
identify the parts of a clock students will be asked to draw the hands on an analog clock for a given time to the hour or half-hour
Students will be given various objects and will further be asked to compare and contrast the lengths of these objects
Students will be asked to provide or create objects contrasting lengths to demonstrate understanding of differences in length
33
Keansburg School DistrictCurriculum System
Mathematicswe use to draw and measure things
What do you think is about 1 inch long
How many steps long do you think it is from the front of the classroom to the back
If we measure in footsteps why are some of the measurements different
How is longer and shorter similar to greater and lesser
Exceeds Standard
The students will work in pairs to locate objects around the room and compare the lengths against each other The pairs will then work with another pair of students and compare the lengths of their objects with the objects the other pair located
Teacher will introduce the ruler in comparison to the yardstick The students will be encouraged to find objects that in the room that are larger than a ruler and measure using the yardstick
After the teacher introduces units of personal measurement the students will be encouraged to measure object in the room using their own unit of personal measurement and convert it into a standard measurement using a ruler or a yardstick
The teacher will select a classroom object and the students will be asked to illustrate objects in the room that are bigger and smaller by a specific size
The students will be able to organize represent and interpret data up to four or more categories through the use of a bar graph
The teacher will then divide students into heterogeneous groups and encourage the students to explain what they can learn from the graph and create a tally chart utilizing the data
Students will create clock flash cards by
34
Keansburg School DistrictCurriculum System
Mathematicsdrawing an analog clock on one side and writing the digital clock time on the other Students will include time in five minute intervals
Pose word problems where students have to find elapse time to the hour and half hour
Introduce second hand and conduct activities that are timed in seconds (Examples hopping on 1 foot blinking eyes counting to the highest number)
35
Keansburg School DistrictCurriculum System
MathematicsKeansburg School DistrictCurriculum Management System
SubjectGradeLevelMathematicsGrade 1
Timeline April-Quarter 4
Topic(s) Geometry
Significance of Learning Goal(s) To identify two and three dimensional shapes to understand fractional parts and create equal shares
Sugg
este
d D
ays
of
Inst
ruct
ion Content
Standards CPI Essential
Questions
Specific Learning Objective(s)
The Students Will Be Able To
Suggested ActivitiesInstructional Tools Materials
Technology Resources Assessments and Assessment
Models
Are there different shapes outside
How are geometric figures alike
How can we sort objects of different shapes
How can shapes and solids be described compared and used to make other shapes
Concept(s) Two and three dimensional shapes fractional parts equal shares
SWBAT
Combine two-dimensional or three-dimensional shapes or figures to create a new composite shape and identify the shapes within
Identify fractional parts of circles and rectangles into equal shares while developing vocabulary for halves fourths and quarters
Describe the whole as
Meets Standard
Determine which shape by touch without using their sight
o Materials attribute blocks shape sheet feely box wwwilluminationsnctmorglessondetail
Sorting 3-dimensional objects students will be given cards with 3-dimensional objects (trash can soup can globe ball tissue box box dice) they will sort them based on the 3-dimensional shape they represent
o 3-dimensional object cards sorting mats
Pizza and Cake Fractions students will utilize a pizza and a cake to work on the concept of fractions while developing the vocabulary halves quarters and fourths
o Materials teacher created pizza
Attribute blocks Geometric shapes 3-dimensional object
cards Sorting maps 3-dimensional shapes Solid and lane figures Geo-boards and rubber
bands Fraction circles Sheet protectors 2-dimensional shapes
Typical Assessment Question(s) or Task(s)
Students will be asked to describe and identify
36
Keansburg School DistrictCurriculum System
MathematicsWhat are equal parts
What foods do you divide into equal parts
What other items might be divided
How do you know if you have an equal share
two of or four of the shares Understand for these examples that decomposing into more equal shares creates smaller shares
and cake that are cut into fractions (construction paper)
Students will illustrate a picture of a boat using at least one three dimensional shape in their drawings Shapes include cubes cylinders spheres cones and rectangular prisms
Solid and Plane Figures Name the Face activity Provide three-dimensional objects Have students draw the face for each object as well as name the shape Examples ABC block juice can book party hat
Introduce fractions by having students identify shapes that show equal parts Display cut out shapes using document camera Include some shapes that are divided equally and some that are not divided equally As a whole group sort shapes into two categories Then have students go back to their desks and work with a partner to classify additional shapes
Provide students with shapes that are divided into four parts Include shapes that are divided into four equal parts and others that are unequal Students identify the shapes that are divided into four equal parts and explain their reasoning
Shape Town activity Students will design a shape town using the following shapes
shapes within combined two and three-dimensional shapes
Students will be given circles and rectangles students will be asked to divide these shapes into halves fourths and quarters
Students will be asked to sort shapes that are divided equally and not divided equally
37
Keansburg School DistrictCurriculum System
Mathematicstrapezoid hexagon square triangle and circle Afterwards students will calculate the total number of each shape they included After completing the activity students will present their final product to the class and explain how they decided which shapes to use
Given an array of dots students will draw shapes with specific number of sides and corners and connect the dots to create the shapes Example Draw a shape with 5 sides Draw a shape with 6 corners
Students will create two-dimensional shapes on geoboards Then using different colored rubber bands students will divide the shapes into equal parts Students will transfer their equally divided shapes onto geoboard paper by drawing lines to show their equal parts
Play the Fraction Path Game Materials Fraction circles a circle with frac12 shaded a circle with 13 shaded and a circle with frac14 shaded Gameboard Path consisting of assorted shapes divided into halves thirds and fourths Players Needed 3 Directions Place the fraction circles facedown Players close their eyes and pick one fraction circle Each player follows the path from start to finish Each player looks at each shape on the path and records how many shapes show their fractions Players record
38
Keansburg School DistrictCurriculum System
Mathematicstheir results on paper using tally marks At end of game students compare total number of shapes that show their fraction
Exceeds Standard
39
Keansburg School DistrictCurriculum System
MathematicsKeansburg School DistrictCurriculum Management System
SubjectGradeLevelMathematicsGrade 1
Timeline May-Quarter 4
Topic(s) Number and Operations in Base Ten
Significance of Learning Goal(s) To use place value to add and subtract
Sugg
este
d D
ays
of
Inst
ruct
ion Content
Standards CPI Essential
Questions
Specific Learning Objective(s)
The Students Will Be Able ToSuggested Activities
Instructional Tools Materials Technology Resources
Assessments and Assessment Models
40
Keansburg School DistrictCurriculum System
MathematicsCPI 1NBT4 1NBT5 1NBT6
EQ How do
numbers help us
How can sets of numbers be counted compared and ordered
How can I use numbers to solve problems
How would putting numbers on a chart make it easier to understand information
How can I make it easier to understand numbers when I sort them
What is place value
Why is place value important
How can I
Concept(s) Use place value and properties of operations to add and subtract
SWBAT Use mental math to find
10 more or ten less than a given two-digit number and explain reasoning used within any number to 120
Use place value to add within 100 add a two-digit number to a one-digit number and add a two-digit number to a multiple of ten
Understand when adding two-digit numbers that ones add to the ones and tens add to the tens and sometimes it is necessary to compose a ten by regrouping
For all above objects students will use concrete models and strategies based on place value and relate the strategy to a written method and explain the reasoning used
Subtract multiples of 10 in the range 10-90 from multiples of 10 in the range 10-90 using
Meets Standard
Comparing two digit numbers wwwk-5mathteachingresourcescom
Subtraction split wwwk-5mathteachingresourcescom
Ten more wwwk-5mathteachingresourcescom
Addition split wwwk-5mathteachingresourcescom
Exceeds Standard
Comparing 3-Digit numbers wwwk-5mathteachingresourcescom
What number is wwwk-5mathteachingresourcescom
Students develop addition and subtraction number stories and have partners solve
Create pictures using basendash10 blocks Students trace picture onto paper label the base ten blocks with their value and add total
Solve number grid puzzles by adding and subtraction 10 on the number grid
Number cards Base 10 blocks Counters Number grid puzzles Sleeve protectors wwwk-
5mathteachingresourcescom
Dice
Typical Assessment Question(s) or Task(s)
Recognize numbers 1-120 using flashcards
Write numbers 1-20 using block or graph paper
Build two-digit numbers using tens and ones blocks
Listen and note students skip counting orally by tens to 120
Students compare and label two numbers using relation symbols
41
Keansburg School DistrictCurriculum System
Mathematics
42
Keansburg School DistrictCurriculum System
MathematicsKeansburg School DistrictCurriculum Management System
SubjectGradeLevelMathematicsGrade 1
Timeline June-Quarter 4
Topic(s) Readiness skills for September of Grade 2
Significance of Learning Goal(s) To compare larger numbers add fluently and apply measurement skills
Sugg
este
d D
ays
of
Inst
ruct
ion Content
Standards CPI Essential Questions
Specific Learning Objective(s)
The Students Will Be Able ToSuggested Activities
Instructional Tools Materials Technology Resources
Assessments and Assessment Models
CPI
EQ How can I use
place value to compare and
order numbers in the 100s
How can mastering basic addition and subtraction facts help me compute larger numbers
How can I tie in
Concept(s)Use place value to compare larger numbers fluently add up to 20 apply measurement skills
SWBAT Extend place value into
the hundreds place and re-write and construct models beyond the hundreds
Fluently add and subtract within 20 using mental strategies
Apply measurement skills
Meets Standard Place Value barrier game httpwwwk-
5mathteachingresourcescommath-gameshtml (place value only)
High card
httpwwwlearningboxcomBase10 BaseTenhtml
Time barrier game httpwwwk-5mathteachingresourcescomsupport-filestimebarriergamepdf httpwwwk-5mathteachingresourcescomsupport-filestimebarriergamegridpdf
My favorite time of day writing activity
number cards base ten blocks rulers tape measurer string number relationship mat paper plates cotton balls judy clock digital clock
Typical Assessment Question(s) or Task(s)
Students will solve addition and subtraction problems within 20 in a given time
43
Keansburg School DistrictCurriculum System
Mathematicsmeasurement skills with real life experiences
httpwwwk-5mathteachingresourcescomsupport-filesmy-favorite-time-of-daypdf
Estimating length httpwwwk-5mathteachingresourcescomsupport-filesestimatinglengthpdf
Olympic golf plastic golf clubs cotton balls and tape measurer
Olympic smiles measuring smiles with string and rulers
Olympic Frisbee using paper plates and tape measurer
Olympic airplane students will make paper airplanes measure the distance that they can throw their airplane
Doubles plus 1 game httpwwwk-5mathteachingresourcescomsupport-filesdoubles-plus-onepdf
Eleven more httpwwwk-5mathteachingresourcescomsupport-fileselevenmorepdf
frame Students will be asked to
measure items using inches and centimeters
Identify and create numbers with place values extending into the hundreds place
44
Keansburg School DistrictCurriculum System
Mathematics
Building numbers with base ten blocks pick three cards and arrange them to show a 3-digit number build that number with base ten blocks repeat with the same three cards until no new numbers can be made
Length strength inches httpwwwharcourtschoolcomactivitylength_strength1_inches
Length strength centimeters httpwwwharcourtschoolcomactivitylength_strength1_centi
Exceeds Standard
Number relationship mat wwwk-5mathteachingresourcescom
Place value barrier game httpwwwk-5mathteachingresourcescommath-gameshtml (integrate other skills into place values for example the digit in my 10s place is four doubled)
Measuring the mousersquos path httpwwwk-5mathteachingresourcescomsupport-filespaths1pdf
45
Keansburg School DistrictCurriculum System
Mathematics
Double minus 1 game httpwwwk-5mathteachingresourcescomsupport-filesdoubles-minus-onepdf
Number relationship mat httpwwwk-5mathteachingresourcescomsupport-filesnumberrelationshipmatpdf
46
Keansburg School DistrictCurriculum System
Mathematicsignment Matrices of Common Core State Standards
Grade Strand Standard Standard
Sept
embe
r ndash
Oct
ober
Nov
embe
r ndash
Dec
embe
r
Janu
ary
ndash Fe
brua
ry
Mar
ch ndash
Apr
il
May
- Ju
ne
1 OA 1
CC1OA1 Represent and solve problems involving addition and subtraction Use addition and subtraction within 20 to solve word problems involving situations of adding to taking from putting together taking apart and comparing with unknowns in all positions eg by using objects drawings and equations with a symbol for the unknown number to represent the problem
1 OA 2
CC1OA2 Represent and solve problems involving addition and subtraction Solve word problems that call for addition of three whole numbers whose sum is less than or equal to 20 eg by using objects drawings and equations with a symbol for the unknown number to represent the problem
1 OA 3
CC1OA3 Understand and apply properties of operations and the relationship between addition and subtraction Apply properties of operations as strategies to add and subtract Examples If 8 + 3 = 11 is known then 3 + 8 = 11 is also known (Commutative property of addition) To add 2 + 6 + 4 the second two numbers can be added to make a ten so 2 + 6 + 4 = 2 + 10 = 12 (Associative property of addition) (Students need not use formal terms for these properties)
1 OA 4
CC1OA4 Understand and apply properties of operations and the relationship between addition and subtraction Understand subtraction as an unknown-addend problem For example subtract 10 ndash 8 by finding the number that makes 10 when added to 8
1 OA 5 CC1OA5 Add and subtract within 20 Relate counting to addition and subtraction (eg by counting on 2 to add 2)
1 OA 6 CC1OA6 Add and subtract within 20 Add and subtract within 20 demonstrating fluency for addition and subtraction within 10 Use strategies such as counting on making ten (eg 8 + 6 = 8 + 2 + 4 = 10 + 4 = 14) decomposing a number leading to a ten (eg 13 ndash 4 = 13 ndash 3 ndash 1 = 10 ndash 1 = 9) using the relationship between addition and subtraction (eg knowing that 8 + 4
47
Keansburg School DistrictCurriculum System
Mathematics= 12 one knows 12 ndash 8 = 4) and creating equivalent but easier or known sums (eg adding 6 + 7 by creating the known equivalent 6 + 6 + 1 = 12 + 1 = 13)
1 OA 7
CC1OA7 Work with addition and subtraction equations Understand the meaning of the equal sign and determine if equations involving addition and subtraction are true or false For example which of the following equations are true and which are false 6 = 6 7 = 8 ndash 1 5 + 2 = 2 + 5 4 + 1 = 5 + 2
1 OA 8
CC1OA8 Work with addition and subtraction equations Determine the unknown whole number in an addition or subtraction equation relating three whole numbers For example determine the unknown number that makes the equation true in each of the equations 8 + = 11 5 = _ ndash 3 6 + 6 = _
1 NBT 1
CC1NBT1 Extend the counting sequence Count to 120 starting at any number less than 120 In this range read and write numerals and represent a number of objects with a written numeral
1 NBT 2
CC1NBT2 Understand place value Understand that the two digits of a two-digit number represent amounts of tens and ones Understand the following as special cases -- a 10 can be thought of as a bundle of ten ones mdash called a ldquotenrdquo -- b The numbers from 11 to 19 are composed of a ten and one two three four five six seven eight or nine ones -- c The numbers 10 20 30 40 50 60 70 80 90 refer to one two three four five six seven eight or nine tens (and 0 ones)
1 NBT 3
CC1NBT3 Understand place value Compare two two-digit numbers based on meanings of the tens and ones digits recording the results of comparisons with the symbols gt = and lt
1 NBT 4
CC1NBT4 Use place value understanding and properties of operations to add and subtract Add within 100 including adding a two-digit number and a one-digit number and adding a two-digit number and a multiple of 10 using concrete models or drawings and strategies based on place value properties of operations andor the relationship between addition and subtraction relate the strategy to a written method and explain the reasoning used Understand that in adding two-digit numbers one adds tens and tens ones and ones and sometimes it is necessary to compose a ten
1 NBT 5
CC1NBT5 Use place value understanding and properties of operations to add and subtract Given a two-digit number mentally find 10 more or 10 less than the number without having to count explain the reasoning used
1 NBT 6 CC1NBT6 Use place value understanding and properties of operations to add and subtract Subtract multiples of 10 in the range 10-90 from multiples of 10 in the range 10-90 (positive or zero differences) using concrete models or drawings and strategies based on place value properties of operations andor
48
Keansburg School DistrictCurriculum System
Mathematicsthe relationship between addition and subtraction relate the strategy to a written method and explain the reasoning used
1 MD 1
CC1MD1 Measure lengths indirectly and by iterating length units Order three objects by length compare the lengths of two objects indirectly by using a third object
1 MD 2
CC1MD2 Measure lengths indirectly and by iterating length units Express the length of an object as a whole number of length units by laying multiple copies of a shorter object (the length unit) end to end understand that the length measurement of an object is the number of same-size length units that span it with no gaps or overlaps Limit to contexts where the object being measured is spanned by a whole number of length units with no gaps or overlaps
1 MD 3CC1MD3 Tell and write time Tell and write time in hours and half-hours using analog and digital clocks
1 MD 4
CC1MD4 Represent and interpret data Organize represent and interpret data with up to three categories ask and answer questions about the total number of data points how many in each category and how many more or less are in one category than in another
1 G 1
CC1G1 Reason with shapes and their attributes Distinguish between defining attributes (eg triangles are closed and three-sided) versus non-defining attributes (eg color orientation overall size) for a wide variety of shapes build and draw shapes to possess defining attributes
1 G 2
CC1G2 Reason with shapes and their attributes Compose two-dimensional shapes (rectangles squares trapezoids triangles half-circles and quarter-circles) or three-dimensional shapes (cubes right rectangular prisms right circular cones and right circular cylinders) to create a composite shape and compose new shapes from the composite shape (Students do not need to learn formal names such as ldquoright rectangular prismrdquo)
1 G 3
CC1G3 Reason with shapes and their attributes Partition circles and rectangles into two and four equal shares describe the shares using the words halves fourths and quarters and use the phrases half of fourth of and quarter of Describe the whole as two of or four of the shares Understand for these examples that decomposing into more equal shares creates smaller shares
49
Keansburg School DistrictCurriculum System
Mathematics
Common Core State Standards Vocabulary
Addition and subtraction within 5 10 20 100 or 1000 Addition or subtraction of two whole numbers with whole number answers and with sum or minuend in the range 0-5 0-10 0-20 or 0-100 respectively Example 8 + 2 = 10 is an addition within 10 14 ndash 5 = 9 is a subtraction within 20 and 55 ndash 18 = 37 is a subtraction within 100
Additive inverses Two numbers whose sum is 0 are additive inverses of one another Example 34 and ndash 34 are additive inverses of one another because 34 + (ndash 34) = (ndash 34) + 34 = 0
Associative property of addition See Table 3 in this Glossary
Associative property of multiplication See Table 3 in this Glossary
Bivariate data Pairs of linked numerical observations Example a list of heights and weights for each player on a football team
Box plot A method of visually displaying a distribution of data values by using the median quartiles and extremes of the data set A box shows the middle 50 of the data1
Commutative property See Table 3 in this Glossary
Complex fraction A fraction AB where A andor B are fractions (B nonzero)
Computation algorithm A set of predefined steps applicable to a class of problems that gives the correct result in every case when the steps are carried out correctly See also computation strategy
Computation strategy Purposeful manipulations that may be chosen for specific problems may not have a fixed order and may be aimed at converting one problem into another See also computation algorithm
Congruent Two plane or solid figures are congruent if one can be obtained from the other by rigid motion (a sequence of rotations reflections and translations)
Counting on A strategy for finding the number of objects in a group without having to count every member of the group For example if a stack of books is known to have 8 books and 3 more books are added to the top it is not necessary to count the stack
50
Keansburg School DistrictCurriculum System
Mathematicsall over again One can find the total by counting onmdashpointing to the top book and saying ldquoeightrdquo following this with ldquonine ten eleven There are eleven books nowrdquo
Dot plot See line plot
Dilation A transformation that moves each point along the ray through the point emanating from a fixed center and multiplies distances from the center by a common scale factor
Expanded form A multi-digit number is expressed in expanded form when it is written as a sum of single-digit multiples of powers of ten For example 643 = 600 + 40 + 3
Expected value For a random variable the weighted average of its possible values with weights given by their respective probabilities
First quartile For a data set with median M the first quartile is the median of the data values less than M Example For the data set 1 3 6 7 10 12 14 15 22 120 the first quartile is 62 See also median third quartile interquartile range
Fraction A number expressible in the form ab where a is a whole number and b is a positive whole number (The word fraction in these standards always refers to a non-negative number) See also rational number
Identity property of 0 See Table 3 in this Glossary
Independently combined probability models Two probability models are said to be combined independently if the probability of each ordered pair in the combined model equals the product of the original probabilities of the two individual outcomes in the ordered pair
Integer A number expressible in the form a or ndasha for some whole number a
Interquartile Range A measure of variation in a set of numerical data the interquartile range is the distance between the first and third quartiles of the data set Example For the data set 1 3 6 7 10 12 14 15 22 120 the interquartile range is 15 ndash 6 = 9 See also first quartile third quartile
Line plot A method of visually displaying a distribution of data values where each data value is shown as a dot or mark above a number line Also known as a dot plot3
51
Keansburg School DistrictCurriculum System
MathematicsMean A measure of center in a set of numerical data computed by adding the values in a list and then dividing by the number of values in the list4 Example For the data set 1 3 6 7 10 12 14 15 22 120 the mean is 21
Mean absolute deviation A measure of variation in a set of numerical data computed by adding the distances between each data value and the mean then dividing by the number of data values Example For the data set 2 3 6 7 10 12 14 15 22 120 the mean absolute deviation is 20
Median A measure of center in a set of numerical data The median of a list of values is the value appearing at the center of a sorted version of the listmdashor the mean of the two central values if the list contains an even number of values Example For the data set 2 3 6 7 10 12 14 15 22 90 the median is 11
Midline In the graph of a trigonometric function the horizontal line halfway between its maximum and minimum values
Multiplication and division within 100 Multiplication or division of two whole numbers with whole number answers and with product or dividend in the range 0-100 Example 72 divide 8 = 9
Multiplicative inverses Two numbers whose product is 1 are multiplicative inverses of one another Example 34 and 43 are multiplicative inverses of one another because 34 times 43 = 43 times 34 = 1
Number line diagram A diagram of the number line used to represent numbers and support reasoning about them In a number line diagram for measurement quantities the interval from 0 to 1 on the diagram represents the unit of measure for the quantity
Percent rate of change A rate of change expressed as a percent Example if a population grows from 50 to 55 in a year it grows by 550 = 10 per year
Probability distribution The set of possible values of a random variable with a probability assigned to each
Properties of operations See Table 3 in this Glossary
Properties of equality See Table 4 in this Glossary
Properties of inequality See Table 5 in this Glossary
Properties of operations See Table 3 in this Glossary
52
Keansburg School DistrictCurriculum System
MathematicsProbability A number between 0 and 1 used to quantify likelihood for processes that have uncertain outcomes (such as tossing a coin selecting a person at random from a group of people tossing a ball at a target or testing for a medical condition)
Probability model A probability model is used to assign probabilities to outcomes of a chance process by examining the nature of the process The set of all outcomes is called the sample space and their probabilities sum to 1 See also uniform probability model
Random variable An assignment of a numerical value to each outcome in a sample space
Rational expression A quotient of two polynomials with a non-zero denominator
Rational number A number expressible in the form ab or ndash ab for some fraction ab The rational numbers include the integers
Rectilinear figure A polygon all angles of which are right angles
Rigid motion A transformation of points in space consisting of a sequence of one or more translations reflections andor rotations Rigid motions are here assumed to preserve distances and angle measures
Repeating decimal The decimal form of a rational number See also terminating decimal
Sample space In a probability model for a random process a list of the individual outcomes that are to be considered
Scatter plot A graph in the coordinate plane representing a set of bivariate data For example the heights and weights of a group of people could be displayed on a scatter plot5
Similarity transformation A rigid motion followed by a dilation
Tape diagram A drawing that looks like a segment of tape used to illustrate number relationships Also known as a strip diagram bar model fraction strip or length model
Terminating decimal A decimal is called terminating if its repeating digit is 0
Third quartile For a data set with median M the third quartile is the median of the data values greater than M Example For the data set 2 3 6 7 10 12 14 15 22 120 the third quartile is 15 See also median first quartile interquartile range
Transitivity principle for indirect measurement If the length of object A is greater than the length of object B and the length of object B is greater than the length of object C then the length of object A is greater than the length of object C This principle applies
53
Keansburg School DistrictCurriculum System
Mathematicsto measurement of other quantities as well
Uniform probability model A probability model which assigns equal probability to all outcomes See also probability model
Vector A quantity with magnitude and direction in the plane or in space defined by an ordered pair or triple of real numbers
Visual fraction model A tape diagram number line diagram or area model
Whole numbers The numbers 0 1 2 3 hellip5
54
- MissionVision Statement
- Beliefs
- Measurement amp Data
- Measure lengths and by iterating length units
- Tell and write time
- Represent and interpret data
- Geometry
- Reason with shapes and their attributes
- Number and Base Ten
- Extend the counting sequence
- Understand place value
-
- Measurement amp Data (II)
-
- Measure lengths and by iterating length units
- Tell and write time
-
- Represent and interpret data
- Geometry (II)
- Reason with shapes their attributes
-
- Number and Base Ten
- Use place value understanding and properties of operations to add and subtract
- Teacher will cover up specific numbers on an enlarged number grid using cover up tape to have students identify numbers before and after Students will come up and write the missing numbers
- Students will play ldquoI have__ Who has __ Teacher will create cards using index cards and numbers in which students need further practice with Students will read their cards aloud Variations of game can include identifying specific numbers identifying numbers more or less etc)
- Students will use base ten blocks to represent numbers including three digit numbers Students will identify representation of numbers through these manipulatives They may match the representation to the written number
- Students will write the number they created using the base ten blocks using their white boards and markers
- Students will arrange given digits to create the greatest and lowest possible numbers They can show each number they create using base ten blocks
- Students will use the Base Ten Exchange Game to show an understanding of exchanging ones for tens and tens for hundreds Students can use place value mats base ten blocks (cubes tens and flats) Students can take number of cubes displayed with roll of single die Students will determine when exchanging can be made when reaching ten units
- Base ten concentration wwwk-5mathteachingresourcescom
- Ten frame compare wwwk-5mathteachingresourcescom
-
Keansburg School DistrictCurriculum System
Mathematics
Grade 1 Scope and Sequence
SeptemberQuarter 1
Number Sense Numbers 1-20 Number writing Identifying Counting objects (up to 20)
Number 20+ Number Identification Counting 1-100 by ones and tens
OctoberQuarter 1
Operations amp Algebraic Expressions Problem solving with addition and subtraction Properties of operations Add and subtract within 20
NovemberQuarter 2
Measurement amp Data Measure lengths and by iterating length units Tell and write time Represent and interpret data
DecemberQuarter 2
Geometry Reason with shapes and their attributes
JanuaryQuarter 2
Number and Base Ten Extend the counting sequence Understand place value
FebruaryQuarter 3
Operations amp Algebraic Expressions (II) Represent and solve problems involving addition and subtraction Understand and apply properties of operations and the relationship between addition
and subtraction Add and subtract within 20 Work with addition and subtraction equations
MarchQuarter 3
Measurement amp Data (II) Measure lengths and by iterating length units Tell and write time
9
Keansburg School DistrictCurriculum System
Mathematics Represent and interpret data
AprilQuarter 4
Geometry (II) Reason with shapes their attributes
MayQuarter 4
Number and Base Ten Use place value understanding and properties of operations to add and subtract
JuneQuarter 4
Readiness skills for September of Grade 2 Problem solving with all mathematical concepts covered in Grade 1
10
Keansburg School DistrictCurriculum System
Mathematics
Keansburg School DistrictCurriculum Management System
SubjectGradeLevelMathematicsGrade 1
Timeline September-Quarter 1
Topic(s) Number Sense
Significance of Learning Goal(s) To write numbers 0-20
Sugg
este
d D
ays
of
Inst
ruct
ion Content
Standards CPI
Essential Questions
Specific Learning Objective(s)
The Students Will Be Able To
Suggested Activities Instructional Tools Materials Technology Resources Assessments and Assessment Models
CPI KCC1 KCC2 KCC3 KCC6 KOA5 KNBT1
EQ Why is it
important to recognize and write numbers
Concept(s) Kindergarten review of number sense
SWBAT
Identify write and count numbers 0-20
Count objects and represent with a number
Compare and order numbers 0-
Meets Standard Practice counting
numbers 0-20 using nursery rhymes and songs
Order numbers from 0-20 using number cards number tiles (from hundredths board)
Order numbers while understanding words such as before after between Utilize a number line to locate and order numbers
Compare numbers that greater than or less than using games such as Number Line Squeeze
Nursery Rhymes CD Math songs Number cards Number Line Squeeze-number lines Everyday Math cards Straws or popsicle sticks Calendar httpwwwstarfallcomnholidaycalendarloadhtmfampn=main school day count chart weather chart attendance chart class number grid wwwk-5mathteachingresourcescom coins counters
11
Keansburg School DistrictCurriculum System
Mathematics20 through concrete and pictorial models
Count to 100 by ones and tens
Top It and One More One Less Stories
Write numbers from 0-20 Construct numbers 11-19
by bundling groups of ten and then by counting the left over ones
Develop number sense by counting up and counting back using a given number
Incorporate number sense daily through calendar school day count class number grid weather and attendance
Reading counting books Recording tally counts
creating tally charts Find and locate numbers
on the number grid Provide students with
number lines students will need to identify and provide the missing number
Show one more wwwk-5mathteachingresourcescom
Show one less wwwk-5mathteachingresourcescom
One more on the ten frame wwwk-5mathteachingresourcescom
Typical Assessment Question(s) or Task(s) Ask students to count 0-20 Students will be asked to order numbers from 0-20 Compare numbers that greater than or less than Students will display number sense through orally counting up
and counting back using a given number Give students a given number have them identify the given
number on the number grid Have students analyze a tally chart and give the associated
number with this chart
12
Keansburg School DistrictCurriculum System
Mathematics
Exceeds Standard Practice counting
numbers 21-100 Compare numbers
greater than 20 through games
Before and after games Number grid puzzles Counting walk students
estimate step amounts from one location to another Find actual number of steps and compare the two numbers Choose other locations and repeat procedure
Students compose and solve ones and tens riddles
Counting by 5s using nickels
Counting by 10s using dimes
One moreone less scoop wwwk-5mathteachingresourcescom
13
Keansburg School DistrictCurriculum System
Mathematics
Keansburg School DistrictCurriculum Management System
SubjectGradeLevelMathematicsGrade 1
Timeline October-Quarter 1Topic(s) Operations amp Algebraic Expressions
Significance of Learning Goal(s) To solve problems using addition and subtraction within 20
Sugg
este
d
Content Standards CPI Essential
Questions
Specific Learning Objective(s)
The Students Will Be Able To
Suggested ActivitiesInstructional Tools Materials
Technology Resources Assessments and Assessment
Models
CPI 1OA31OA4 1OA5 1OA6 1OA7 1OA8
EQ What questions can
be answered using addition
What strategies can be used to solve problems
How can we tell how many
How does knowing math facts make math easier
How can numbers be helpful
Why do I need to subtract
Concept(s) Working with and solving problems using addition and subtraction within 20
SWBAT
Solve word problems within 20 using real life situations
Understand demonstrate and apply properties of operations for addition
Demonstrate fluency for addition and subtraction within 20 by using strategies to solve
Meets Standard Model a number sentence using
manipulatives and label operation symbols
Use dominoes to create an addition problem and find the sum
Solve addition problems using a number line
Students will develop different ways to solve number stories students will use objects fingers and pictures count onback number line or number grid
Create real life situations in which students will use all number story strategies to solve a problem
Teachers will pose real world number stories to the students students will synthesize pre-existing information that they know to solve the problem
Introduce and devise addition and subtraction number stories posters stating each key word for addition and subtraction operations
Dominoes Number lines Number Grids Number Cards White Boards Dry-Erase markers Pennies
Typical Assessment Question(s) or Task(s)
Students will be asked to solve addition and subtraction problems within 20 within a given time frame
Students will be given a number and be asked to count on from that given number
14
Keansburg School DistrictCurriculum System
Mathematics How do we use
addition and subtraction in our everyday life
Why are fact families important
What strategies can be used to solve problems How is counting on different from just counting to add
What information do you need to know in order to find the total number of something
Why would you need to count back
How are subtraction and addition related
problems Relate counting to
addition by counting on from the higher number
Demonstrate fluency for addition by using strategies such as counting on doubles and doubles plus 1
Combine and mix two sets of 0-10 number cards One partner draws two number cards from the top of the deck students will design and generate a number story using the two numbers Both partners solve the problem in the number story and write the answer on their slate
Use concrete objects to demonstrate the relationship between two addends and the sum
Teacher will model and demonstrate using pictures and objects how objects can be moved around and still come out to equal the same sum
Develop counting on skills by students choosing a number card and partner count on from the given number
Roll two number cubes identify the higher number and count on to find sum
Use technology to show doubles different compliments of 10 songs and raps to help students memorize basic facts Poll students to discover their favorite tune
Play around the world using basic addition facts
Relate addition to subtraction by creating fact families using number cubes dominoes fact family houses etc
Turn around trains wwwk-5mathteachingresourcescom
Domino fact families wwwk-5mathteachingresourcescom
Plus one game wwwk-5mathteachingresourcescom
Students will be given word problems within 20 to solve students will use various strategies and means to solve these problems
15
Keansburg School DistrictCurriculum System
Mathematics One less game wwwk-
5mathteachingresourcescom Doubles facts wwwk-
5mathteachingresourcescom Facts of ten wwwk-
5mathteachingresourcescom Fact family house wwwk-
5mathteachingresourcescom Number sentence math wwwk-
5mathteachingresourcescom Sums of ten wwwk-
5mathteachingresourcescom
Exceeds Standard
In groups or individually students will plan and generate world problems based on real life situations
Teachers will provide pictures of groups of things such as animals people or objects Students will analyze and evaluate the picture and design a number story about the picture
Using number cards or dice create addition sentences draw a picture to represent problem and write an addition number model to correlate with the fact
With 9 10 12 side dice roll two number cubes identify the higher number and count on to find sum
Students will compose their own double facts song
Students create a 4 x 4 double facts mat with double sums Partners roll a 12-sided number cube double the top number showing and X it out on the
16
Keansburg School DistrictCurriculum System
Mathematicsmat First student to get 4 in a row wins
Take two dominoes each representing an addend and have students find the sum
Students use pennies to solve basic addition problems
Students will complete turn around facts Make ten wwwk-
5mathteachingresourcescom Make ten on the ten frame wwwk-
5mathteachingresourcescom What number ishellip wwwk-
5mathteachingresourcescom Make ten square What number ishellip
wwwk-5mathteachingresourcescom Dot card addition What number is
wwwk-5mathteachingresourcescom Addition domino train What number is
wwwk-5mathteachingresourcescom
17
Keansburg School DistrictCurriculum System
MathematicsKeansburg School DistrictCurriculum Management System
SubjectGradeLevelMathematicsGrade 1
Timeline November-Quarter 2
Topic(s) Measurement and Data
Significance of Learning Goal(s) To understand measurement and what tools and used
Sugg
este
d D
ays
of
Inst
ruct
ion Content
Standards CPI Essential Questions
Specific Learning Objective(s)
The Students Will Be Able To
Suggested ActivitiesInstructional Tools Materials
Technology Resources Assessments and Assessment
Models
CPI 1MD1 1MD2 1MD3 1MD4
EQ Why do people
use graphs How is a bar
graph like a tally chart
How would I know if a bar graph correctly shows what is on a tally chart
How could a bar graph answer a question
Concept(s) Understanding what measurement is and what tools are used
SWBAT
Compare and order the length of up to three objects using direct comparisons
Compare the lengths of two objects indirectly by using a third object
Measure objects using non-standard units and express it as a whole number
Draw an object longer or shorter than a given
Meets Standard Teacher will introduce measurement
by holding up objects and the students will examine the objects and explain the size order
o Students will break into groups and compare objects further and classify them depending on their size
Teacher will introduce the ruler Explain to students that the ruler is used to measure objects The students will then explore the classroom and select objects around the room that are smaller and larger than the ruler
Teacher will select specific body parts that the students will use as a personal unit of measurement The students will work in pairs to demonstrate how to measure objects around the room
Rulers Judy Clock Paper Plates Classroom objects Chart paper Jack Hartmann ndash Tick Tock
Song Brainpop Jr White boards Dry Erase markers Clock Concentration
Typical Assessment Question(s) or Task(s)
Analyze a bar graph and answer questions
Create a bar graph using self ndash selected topic
18
Keansburg School DistrictCurriculum System
Mathematics Do bar graphs
make it easier to understand and compare facts Why
What kind of graph should I use to answer questions
Why do I need to tell time
How many hands does a clock have
Are the hands on the clock the same size
How long is a minute
Why do I need to use a calendar
How do we use the clock and the calendar to determine what we will do in school
Why do we need to measure something
What can we use to draw and measure things
What do you think is about 1 inch long
How many steps long do you think it is from
object Organize represent
and interpret data with up to three categories on simple graphs and charts
Analyze and formulate questions based on simple graphs and charts
Identify time to the hour and half hour on both a digital and analog clock
Write time to the hour and half hour on both analog and digital clocks
Draw the hands on an analog clock for a give time to the hour or half hour
Relate times to the half hour to ldquohalf pastrdquo the hour
using their personal unit of measurement
The teacher will select a classroom object and the students will be asked to illustrate objects in the room that are bigger and smaller in size
The students will be able to organize represent and interpret data up to three categories through the use of a bar graph
The teacher will then divide students into heterogeneous groups and encourage the students to explain what they can learn from the graph The students will present findings following activity
Students will choose an object within classroom then find additional objects one being larger the other being shorter using a two-column chart Draw or write the objects in the chart
Create a human clock students will hold 12 numbered plates One student will stand in the middle as the minute and hour hand to model various times
Students will have their own demonstration clocks students will identify and find the hour and minute hands
Students create their own clocks using paper plates students will manipulate hands to identify varying times
Students will listen to Jack Hartman ldquoTick Tockrdquo song
Teachers and students will view clock on videos on brainpopjrcom students
Take 3 objects and order them from smallest to largest and largest to smallest
Read a series of clocks (analog and digital) and tell the time to the hour and half hour
Using blank clocks the students will draw the hands to show a designated time
Use a personal measurement (ie your thumb) to measure the length of an object
19
Keansburg School DistrictCurriculum System
Mathematicsthe front of the classroom to the back
If we measure in footsteps why are some of the measurements different
How is longer and shorter similar to greater and lesser
and teachers can complete quizzes available on website
Teachers will present time on an analog clock students will write the digital time on a white board
Students will play clock concentration
Exceeds Standard
The students will work in pairs to locate objects around the room and compare the lengths against each other The pairs will then work with another pair of students and compare the lengths of their objects with the objects the other pair located
Teacher will introduce the ruler in comparison to the yardstick The students will be encouraged to find objects that in the room that are larger than a ruler and measure using the yardstick
After the teacher introduces units of personal measurement the students will be encouraged to measure object in the room using their own unit of personal measurement and convert it into a standard measurement using a ruler or a yardstick
The teacher will select a classroom object and the students will be asked to illustrate objects in the room that are bigger and smaller by a specific size
The students will be able to organize represent and interpret data up to four
20
Keansburg School DistrictCurriculum System
Mathematicsor more categories through the use of a bar graph
The teacher will then divide students into heterogeneous groups and encourage the students to explain what they can learn from the graph and create a tally chart utilizing the data
Students will create clock flash cards by drawing an analog clock on one side and writing the digital clock time on the other
Give students a clock and a blue number cube ()
21
Keansburg School DistrictCurriculum System
MathematicsKeansburg School DistrictCurriculum Management System
SubjectGradeLevelMathematicsGrade 1
Timeline December-Quarter 2
Topic(s) Geometry
Significance of Learning Goal(s) To identify shapes and their attribures
Sugg
este
d D
ays
of
Inst
ruct
ion Content
Standards CPI Essential
Questions
Specific Learning Objective(s)
The Students Will Be Able To
Suggested Activities
Instructional Tools Materials
Technology Resources
Assessments and Assessment Models
CPI1G1 1G2
EQ Where do
you see shapes in our classroom
Are there different shapes outside
How are geometric figures alike
How can we sort
Concept(s) Identify shapes and their attributes
SWBAT Distinguish
between two and three-dimensional shapes by classifying their attributes For example color shape and size
Compare and contrast shapes based on their attributes
Construct and create shapes
Meets Standard Sorting shapes based on their attributes For example
number of sideso Materials attribute blocks shape card sheet sorting
mat Introduce vocabulary cylinder cube sphere rectangular
prism triangular prism pyramid Classroom shape hunt students go around the room finding shapes within the classroom For example trash can tissue box clock
o Materials shape sheet classroom objects httpilluminationsnctmorgLessonDetailaspxid=L237
Create 3-dimenstion shapes (rectangular prism pyramid cube)
o Straws twist ties shape cards Create 2-dimensional shapes (trapezoid triangle circle
rectangle rhombus)o Pattern block templates attribute blocks pattern
block template stencil geo-boards rubber bands httpilluminationsnctmorgLessonDetailaspx
Attribute blocks Shape card
sheet Sorting mat Twist ties Straws Shape cards Pattern block
templates Attribute blocks Pattern block
template stencil Geo-boards Rubber bands
22
Keansburg School DistrictCurriculum System
Mathematicsobjects of different shapes
How can shapes and solids be described compared and used to make other shapes What are equal parts
What foods do you divide into equal parts
What other items might be divided
How do you know if you have an equal share
possessing certain attributes
Identify and construct two-dimensional shapes
Identify and construct three-dimensional figures
id=L168 Create a drawing using shapes students will create a
picture using the pattern block template stencil (house sun flowers etc)
o Paper pattern block stencil template crayons
Apply understanding of attributes by playing Shape Detective and Attribute Train Game
Demonstrate understanding of 3 Dimensional shapes by playing Whatrsquos My Shape
Exceeds Standard
Introducing and exposing higher vocabulary polyhedronpolyhedra (many faces of a shape) Placing the word onto the word wall
Students read the poem Shapes by Shel Silverstein and create their own illustration of the poem to explore geometric figures and positional words
Materials httpilluminationsnctmorgLessonDetailaspxID=L202
Shapes by Shel Silverstein paper crayons pencils examples of rectangles triangles circles
Compose clues using inferencing to play Guess What Display variety of 3 dimensional shapes Silently choose
an object and give clues about it For example I amsmall I have 2 flat faces and if you trace my faces youwill get circles What am I (tomato can)
Students work together to use pattern blocks to coverother pattern blocks For example how many triangleblocks are needed to cover a hexagon block
Student rotate in groups to visit each geometric solidwhile completing a chart which shows faces sides and
Typical Assessment Question(s) or Task(s)
Ask students how many sides each shape has
Have students classify shapes based on number of sides
Have students identify shapes in the classroom
Have students create 2 and 3 dimensional shapes
Have students design pictures using pattern blockspattern block template
Have students identify and describe assigned shapersquos attributes
Ask students to name 3 dimensional shapes hidden i bag (Whatrsquos my Shape Game)
23
Keansburg School DistrictCurriculum System
Mathematics corners Students compose a shape town by using their pattern
block templates Then students will calculate the totalnumber of each pattern block used
Students will invent new shapes by using three-dimensional shapes
Students will create patterns using three dimensionalshapes
24
Keansburg School DistrictCurriculum System
MathematicsKeansburg School DistrictCurriculum Management System
SubjectGradeLevelMathematicsGrade 1
Timeline January-Quarter 2
Topic(s) Number and Operations in Base Ten
Significance of Learning Goal(s) To recognize compare and understand numbers to 120
Sugg
este
d D
ays
of
Inst
ruct
ion Content
Standards CPI Essential
Questions
Specific Learning Objective(s)
The Students Will Be Able To
Suggested ActivitiesInstructional Tools Materials
Technology Resources Assessments and Assessment
Models
25
Keansburg School DistrictCurriculum System
MathematicsCPI 1NBT1 1NBT2A 1NBT2B 1NBT2C 1NBT3
EQ How do
numbers help us
How can sets of numbers be counted compared and ordered
How can I use numbers to solve problems
How would putting numbers on a chart make it easier to understand information
How can I make it easier to understand numbers when I sort them
What is place value
Concept(s) Recognize compare and understand numbers up to 120
SWBAT Recognize read write
and count 0-120 Understand that a two-
digit number represents amounts of tens and ones
Relate groups of ten to skip counting
Compare two two-digit numbers based on meanings of tens and ones digits using symbols ltgt and =
Meets Standard Teacher will cover up specific numbers
on an enlarged number grid using cover up tape to have students identify numbers before and after Students will come up and write the missing numbers
Students will play ldquoI have__ Who has __ Teacher will create cards using index cards and numbers in which students need further practice with Students will read their cards aloud Variations of game can include identifying specific numbers identifying numbers more or less etc)
Students will use base ten blocks to represent numbers including three digit numbers Students will identify representation of numbers through these manipulatives They may match the representation to the written number
Students will write the number they created using the base ten blocks using their white boards and markers
Students will arrange given digits to create the greatest and lowest possible numbers They can show each number they create using base ten blocks
Students will use the Base Ten Exchange Game to show an
Number grids ldquoI have Who hasrdquo index
cards base ten blocks white boards markers number cards dice ten frame base ten concentration
boards (k-5 math teaching resources)
double ten frame boards (k-5 math teaching resources)
Typical Assessment Question(s) or Task(s)
Recognize numbers 1-120 using flashcards
Write numbers 1-20 using block or graph paper
Build two-digit numbers using tens and ones blocks
Listen and note students skip counting orally by tens to 120
Students compare and label two numbers using relation symbols
26
Keansburg School DistrictCurriculum System
Mathematics Why is place
value important
How can I use place value to compare and order numbers
How can I use the number grid to help me with counting numbers
How many times do you think you can hop in one minute
What does number relationships mean
Why do we need to know how to add
Why do we need to know how to subtract
How are addition and subtraction related
What are doubles
How can
understanding of exchanging ones for tens and tens for hundreds Students can use place value mats base ten blocks (cubes tens and flats) Students can take number of cubes displayed with roll of single die Students will determine when exchanging can be made when reaching ten units
Teens on the ten frame wwwk-5mathteachingresourcescom
Base ten concentration wwwk-5mathteachingresourcescom
Ten frame compare wwwk-5mathteachingresourcescom
Exceeds Standard
Students will create riddles Irsquom thinking of a number that has 4 tens and 13 ones Have students solve the riddle by regrouping the ones to find the answer
-Students use hundreds chart to jump up and down from a number to show 10 more or 10 less
-Students will play Whatrsquos my Number by giving clues based on place value odd or even and number sense For example Irsquom a two digit number The digit in my tens place is 2 more than 4
27
Keansburg School DistrictCurriculum System
Mathematicsdouble facts help us to add and subtract
Does it matter what order you use to add three numbers Why or why not
The digit in my ones place is 3 less than 8 Whatrsquos my number
My double ten frame riddle wwwk-5mathteachingresourcescom
28
Keansburg School DistrictCurriculum System
MathematicsKeansburg School DistrictCurriculum Management System
SubjectGradeLevelMathematicsGrade 1
Timeline February-Quarter 3
Topic(s) Operations amp Algebraic Expressions
Significance of Learning Goal(s) To solve addition and subtraction problems
Sugg
este
d D
ays
of
Inst
ruct
ion Content
Standards CPI
Essential Questions
Specific Learning Objective(s)
The Students Will Be Able To
Suggested ActivitiesInstructional Tools Materials
Technology Resources Assessments and Assessment
Models
CPI1OA31OA4 1OA5 1OA6 1OA7 1OA81OA2
EQ What
questions can be answered using addition
What strategies can be used to solve problems
How can we
Concept(s) Solve addition with and subtraction problems
SWBAT Solve addition problems
with sums up to 20 Use addition within 20 to
solve word problems involving real life situations
Solve word problems that call for addition of three whole numbers up to 20
Solve subtraction problems with difference up to 20
Use subtraction within 20 to solve word problems involving real
Meets Standard Model and have students create their
own individual number sentence using manipulatives and label operation symbols
Students will choose a strategy to solve number stories such as objects fingers and pictures count onback number line or number grid
Create real life situations in which students will use a strategy to solve a number story and create a number model
Review addition and subtraction number stories posters stating each key word for addition and subtraction operations
Combine and mix two sets of 0-20 number cards One partner draws two number cards from the top of the deck students will design and generate a number story using the two numbers
Materials Manipulatives (examples
counting bears connecting cubes pennies counters etc)
Slates dry erase markers erasers
Clear Sheet Protectors Sets of 0-20 number cards Number cards Cardstock Scrabble tiles letter cards
Typical Assessment Question(s) or Task(s)
Students will solve real life
29
Keansburg School DistrictCurriculum System
Mathematicstell how many
How does knowing math facts make math easier
How can numbers be helpful
Why do I need to subtract
How do we use addition and subtraction in our everyday life
Why are fact families important
What strategies can be used to solve problems How is counting on different from just counting to add
What information do you need to know in order to find
life situations Understand subtraction
as an unknown addend problem example subtract 9-5 by finding the number that makes 9 when added to 5
Both partners solve the problem in the number story and write the answer on their slate
Find three cards that have a sum of 12 how many different ways can the student make the sum of 12 using three cards students record work
-Teacher creates real life word problemsinvolving three addends up to 20
Ten frames subtraction wwwk-5mathteachingresourcescom
I have who has wwwk-5mathteachingresourcescom
True or false wwwk-5mathteachingresourcescom
Count to 20 wwwk-5mathteachingresourcescom
Exceeds Standard
Teacher creates multi step word problems for students to solve
Students work with partners or small groups to create real life word problems Compose class book of problems
Three letter addends use scrabble tiles or letter cards with corresponding numbers to make three letter words find
word problems Students will create their
own number sentences own number storiesword problems
Students will create and solve number stories in cooperative learning groups
Students will generate word problems using assigned numbers
30
Keansburg School DistrictCurriculum System
Mathematicsthe total number of something
Why would you need to count back
How are subtraction and addition related
the sum of each word by adding the numbers on the tiles Students will find which words have the greatest or smallest sum
31
Keansburg School DistrictCurriculum System
MathematicsKeansburg School DistrictCurriculum Management System
SubjectGradeLevelMathematicsGrade 1
Timeline March-Quarter 3
Topic(s) Measurement amp Data
Significance of Learning Goal(s) To tell time and compare measurements
Sugg
este
d D
ays
of
Inst
ruct
ion Content
Standards CPI
Essential Questions
Specific Learning Objective(s)
The Students Will Be Able ToSuggested Activities
Instructional Tools Materials Technology Resources
Assessments and Assessment Models
How would I know if a bar graph correctly shows what is on a tally chart
How could a bar graph answer a question
Do bar graphs make it easier to understand and compare facts Why
What kind
Concept(s) Telling time comparing measurements
SWBAT Identify and write time to
the hour and half hour on both a digital and analog clock
Write time to the hour and half-hour on both digital and analog clocks
Draw the hands on the analog clock for a given time to the hour or half-hour
Relate times to the half hour as ldquohalf-pastrdquo the hour
Compare and contrast
Meets Standard Students will have their own
demonstration clocks students will identify and find the hour and minute hands
Students create their own clocks using paper plates students will manipulate hands to identify varying times
Students will listen to Jack Hartman ldquoTick Tockrdquo song
Teachers and students will view clock on videos on brainpopjrcom students and teachers can complete quizzes available on website
Teachers will present time on an analog clock students will write the digital time on a white board
Students will play clock concentration Teacher will introduce measurement by
holding up objects and the students will examine the objects and explain the size
Large Judy Clock Individual student Judy
clocks Wipe off analogdigital clocks Clock stampers Timers Rulers Yardsticks Measuring tapes Sheet protectors Cardstock Paper plates Fasteners Index cards
Typical Assessment Question(s) or Task(s)
Students will be asked to identify and write time to the hour and half hour on both
32
Keansburg School DistrictCurriculum System
Mathematicsof graph should I use to answer questions
Why do I need to tell time
How many hands does a clock have
Are the hands on the clock the same size
How long is a minute
Why do I need to use a calendar
How do we use the clock and the calendar to determine what we will do in school
Why do we need to measure something
What can
objects by length Construct objects at
contrasting lengths
ordero Students will break into groups
and compare objects further and classify them depending on their size
Teacher will introduce the ruler Explain to students that the ruler is used to measure objects The students will then explore the classroom and select objects around the room that are smaller and larger than the ruler
Teacher will select specific body parts that the students will use as a personal unit of measurement The students will work in pairs to demonstrate how to measure objects around the room using their personal unit of measurement
The teacher will select a classroom object and the students will be asked to illustrate objects in the room that are bigger and smaller in size
The students will be able to organize represent and interpret data up to three categories through the use of a bar graph
The teacher will then divide students into heterogeneous groups and encourage the students to explain what they can learn from the graph The students will present findings following activity
Students will choose an object within classroom then find additional objects one being larger the other being shorter using a two-column chart Draw or write the objects in the chart
digital and analog clocks Students will be asked to
identify the parts of a clock students will be asked to draw the hands on an analog clock for a given time to the hour or half-hour
Students will be given various objects and will further be asked to compare and contrast the lengths of these objects
Students will be asked to provide or create objects contrasting lengths to demonstrate understanding of differences in length
33
Keansburg School DistrictCurriculum System
Mathematicswe use to draw and measure things
What do you think is about 1 inch long
How many steps long do you think it is from the front of the classroom to the back
If we measure in footsteps why are some of the measurements different
How is longer and shorter similar to greater and lesser
Exceeds Standard
The students will work in pairs to locate objects around the room and compare the lengths against each other The pairs will then work with another pair of students and compare the lengths of their objects with the objects the other pair located
Teacher will introduce the ruler in comparison to the yardstick The students will be encouraged to find objects that in the room that are larger than a ruler and measure using the yardstick
After the teacher introduces units of personal measurement the students will be encouraged to measure object in the room using their own unit of personal measurement and convert it into a standard measurement using a ruler or a yardstick
The teacher will select a classroom object and the students will be asked to illustrate objects in the room that are bigger and smaller by a specific size
The students will be able to organize represent and interpret data up to four or more categories through the use of a bar graph
The teacher will then divide students into heterogeneous groups and encourage the students to explain what they can learn from the graph and create a tally chart utilizing the data
Students will create clock flash cards by
34
Keansburg School DistrictCurriculum System
Mathematicsdrawing an analog clock on one side and writing the digital clock time on the other Students will include time in five minute intervals
Pose word problems where students have to find elapse time to the hour and half hour
Introduce second hand and conduct activities that are timed in seconds (Examples hopping on 1 foot blinking eyes counting to the highest number)
35
Keansburg School DistrictCurriculum System
MathematicsKeansburg School DistrictCurriculum Management System
SubjectGradeLevelMathematicsGrade 1
Timeline April-Quarter 4
Topic(s) Geometry
Significance of Learning Goal(s) To identify two and three dimensional shapes to understand fractional parts and create equal shares
Sugg
este
d D
ays
of
Inst
ruct
ion Content
Standards CPI Essential
Questions
Specific Learning Objective(s)
The Students Will Be Able To
Suggested ActivitiesInstructional Tools Materials
Technology Resources Assessments and Assessment
Models
Are there different shapes outside
How are geometric figures alike
How can we sort objects of different shapes
How can shapes and solids be described compared and used to make other shapes
Concept(s) Two and three dimensional shapes fractional parts equal shares
SWBAT
Combine two-dimensional or three-dimensional shapes or figures to create a new composite shape and identify the shapes within
Identify fractional parts of circles and rectangles into equal shares while developing vocabulary for halves fourths and quarters
Describe the whole as
Meets Standard
Determine which shape by touch without using their sight
o Materials attribute blocks shape sheet feely box wwwilluminationsnctmorglessondetail
Sorting 3-dimensional objects students will be given cards with 3-dimensional objects (trash can soup can globe ball tissue box box dice) they will sort them based on the 3-dimensional shape they represent
o 3-dimensional object cards sorting mats
Pizza and Cake Fractions students will utilize a pizza and a cake to work on the concept of fractions while developing the vocabulary halves quarters and fourths
o Materials teacher created pizza
Attribute blocks Geometric shapes 3-dimensional object
cards Sorting maps 3-dimensional shapes Solid and lane figures Geo-boards and rubber
bands Fraction circles Sheet protectors 2-dimensional shapes
Typical Assessment Question(s) or Task(s)
Students will be asked to describe and identify
36
Keansburg School DistrictCurriculum System
MathematicsWhat are equal parts
What foods do you divide into equal parts
What other items might be divided
How do you know if you have an equal share
two of or four of the shares Understand for these examples that decomposing into more equal shares creates smaller shares
and cake that are cut into fractions (construction paper)
Students will illustrate a picture of a boat using at least one three dimensional shape in their drawings Shapes include cubes cylinders spheres cones and rectangular prisms
Solid and Plane Figures Name the Face activity Provide three-dimensional objects Have students draw the face for each object as well as name the shape Examples ABC block juice can book party hat
Introduce fractions by having students identify shapes that show equal parts Display cut out shapes using document camera Include some shapes that are divided equally and some that are not divided equally As a whole group sort shapes into two categories Then have students go back to their desks and work with a partner to classify additional shapes
Provide students with shapes that are divided into four parts Include shapes that are divided into four equal parts and others that are unequal Students identify the shapes that are divided into four equal parts and explain their reasoning
Shape Town activity Students will design a shape town using the following shapes
shapes within combined two and three-dimensional shapes
Students will be given circles and rectangles students will be asked to divide these shapes into halves fourths and quarters
Students will be asked to sort shapes that are divided equally and not divided equally
37
Keansburg School DistrictCurriculum System
Mathematicstrapezoid hexagon square triangle and circle Afterwards students will calculate the total number of each shape they included After completing the activity students will present their final product to the class and explain how they decided which shapes to use
Given an array of dots students will draw shapes with specific number of sides and corners and connect the dots to create the shapes Example Draw a shape with 5 sides Draw a shape with 6 corners
Students will create two-dimensional shapes on geoboards Then using different colored rubber bands students will divide the shapes into equal parts Students will transfer their equally divided shapes onto geoboard paper by drawing lines to show their equal parts
Play the Fraction Path Game Materials Fraction circles a circle with frac12 shaded a circle with 13 shaded and a circle with frac14 shaded Gameboard Path consisting of assorted shapes divided into halves thirds and fourths Players Needed 3 Directions Place the fraction circles facedown Players close their eyes and pick one fraction circle Each player follows the path from start to finish Each player looks at each shape on the path and records how many shapes show their fractions Players record
38
Keansburg School DistrictCurriculum System
Mathematicstheir results on paper using tally marks At end of game students compare total number of shapes that show their fraction
Exceeds Standard
39
Keansburg School DistrictCurriculum System
MathematicsKeansburg School DistrictCurriculum Management System
SubjectGradeLevelMathematicsGrade 1
Timeline May-Quarter 4
Topic(s) Number and Operations in Base Ten
Significance of Learning Goal(s) To use place value to add and subtract
Sugg
este
d D
ays
of
Inst
ruct
ion Content
Standards CPI Essential
Questions
Specific Learning Objective(s)
The Students Will Be Able ToSuggested Activities
Instructional Tools Materials Technology Resources
Assessments and Assessment Models
40
Keansburg School DistrictCurriculum System
MathematicsCPI 1NBT4 1NBT5 1NBT6
EQ How do
numbers help us
How can sets of numbers be counted compared and ordered
How can I use numbers to solve problems
How would putting numbers on a chart make it easier to understand information
How can I make it easier to understand numbers when I sort them
What is place value
Why is place value important
How can I
Concept(s) Use place value and properties of operations to add and subtract
SWBAT Use mental math to find
10 more or ten less than a given two-digit number and explain reasoning used within any number to 120
Use place value to add within 100 add a two-digit number to a one-digit number and add a two-digit number to a multiple of ten
Understand when adding two-digit numbers that ones add to the ones and tens add to the tens and sometimes it is necessary to compose a ten by regrouping
For all above objects students will use concrete models and strategies based on place value and relate the strategy to a written method and explain the reasoning used
Subtract multiples of 10 in the range 10-90 from multiples of 10 in the range 10-90 using
Meets Standard
Comparing two digit numbers wwwk-5mathteachingresourcescom
Subtraction split wwwk-5mathteachingresourcescom
Ten more wwwk-5mathteachingresourcescom
Addition split wwwk-5mathteachingresourcescom
Exceeds Standard
Comparing 3-Digit numbers wwwk-5mathteachingresourcescom
What number is wwwk-5mathteachingresourcescom
Students develop addition and subtraction number stories and have partners solve
Create pictures using basendash10 blocks Students trace picture onto paper label the base ten blocks with their value and add total
Solve number grid puzzles by adding and subtraction 10 on the number grid
Number cards Base 10 blocks Counters Number grid puzzles Sleeve protectors wwwk-
5mathteachingresourcescom
Dice
Typical Assessment Question(s) or Task(s)
Recognize numbers 1-120 using flashcards
Write numbers 1-20 using block or graph paper
Build two-digit numbers using tens and ones blocks
Listen and note students skip counting orally by tens to 120
Students compare and label two numbers using relation symbols
41
Keansburg School DistrictCurriculum System
Mathematics
42
Keansburg School DistrictCurriculum System
MathematicsKeansburg School DistrictCurriculum Management System
SubjectGradeLevelMathematicsGrade 1
Timeline June-Quarter 4
Topic(s) Readiness skills for September of Grade 2
Significance of Learning Goal(s) To compare larger numbers add fluently and apply measurement skills
Sugg
este
d D
ays
of
Inst
ruct
ion Content
Standards CPI Essential Questions
Specific Learning Objective(s)
The Students Will Be Able ToSuggested Activities
Instructional Tools Materials Technology Resources
Assessments and Assessment Models
CPI
EQ How can I use
place value to compare and
order numbers in the 100s
How can mastering basic addition and subtraction facts help me compute larger numbers
How can I tie in
Concept(s)Use place value to compare larger numbers fluently add up to 20 apply measurement skills
SWBAT Extend place value into
the hundreds place and re-write and construct models beyond the hundreds
Fluently add and subtract within 20 using mental strategies
Apply measurement skills
Meets Standard Place Value barrier game httpwwwk-
5mathteachingresourcescommath-gameshtml (place value only)
High card
httpwwwlearningboxcomBase10 BaseTenhtml
Time barrier game httpwwwk-5mathteachingresourcescomsupport-filestimebarriergamepdf httpwwwk-5mathteachingresourcescomsupport-filestimebarriergamegridpdf
My favorite time of day writing activity
number cards base ten blocks rulers tape measurer string number relationship mat paper plates cotton balls judy clock digital clock
Typical Assessment Question(s) or Task(s)
Students will solve addition and subtraction problems within 20 in a given time
43
Keansburg School DistrictCurriculum System
Mathematicsmeasurement skills with real life experiences
httpwwwk-5mathteachingresourcescomsupport-filesmy-favorite-time-of-daypdf
Estimating length httpwwwk-5mathteachingresourcescomsupport-filesestimatinglengthpdf
Olympic golf plastic golf clubs cotton balls and tape measurer
Olympic smiles measuring smiles with string and rulers
Olympic Frisbee using paper plates and tape measurer
Olympic airplane students will make paper airplanes measure the distance that they can throw their airplane
Doubles plus 1 game httpwwwk-5mathteachingresourcescomsupport-filesdoubles-plus-onepdf
Eleven more httpwwwk-5mathteachingresourcescomsupport-fileselevenmorepdf
frame Students will be asked to
measure items using inches and centimeters
Identify and create numbers with place values extending into the hundreds place
44
Keansburg School DistrictCurriculum System
Mathematics
Building numbers with base ten blocks pick three cards and arrange them to show a 3-digit number build that number with base ten blocks repeat with the same three cards until no new numbers can be made
Length strength inches httpwwwharcourtschoolcomactivitylength_strength1_inches
Length strength centimeters httpwwwharcourtschoolcomactivitylength_strength1_centi
Exceeds Standard
Number relationship mat wwwk-5mathteachingresourcescom
Place value barrier game httpwwwk-5mathteachingresourcescommath-gameshtml (integrate other skills into place values for example the digit in my 10s place is four doubled)
Measuring the mousersquos path httpwwwk-5mathteachingresourcescomsupport-filespaths1pdf
45
Keansburg School DistrictCurriculum System
Mathematics
Double minus 1 game httpwwwk-5mathteachingresourcescomsupport-filesdoubles-minus-onepdf
Number relationship mat httpwwwk-5mathteachingresourcescomsupport-filesnumberrelationshipmatpdf
46
Keansburg School DistrictCurriculum System
Mathematicsignment Matrices of Common Core State Standards
Grade Strand Standard Standard
Sept
embe
r ndash
Oct
ober
Nov
embe
r ndash
Dec
embe
r
Janu
ary
ndash Fe
brua
ry
Mar
ch ndash
Apr
il
May
- Ju
ne
1 OA 1
CC1OA1 Represent and solve problems involving addition and subtraction Use addition and subtraction within 20 to solve word problems involving situations of adding to taking from putting together taking apart and comparing with unknowns in all positions eg by using objects drawings and equations with a symbol for the unknown number to represent the problem
1 OA 2
CC1OA2 Represent and solve problems involving addition and subtraction Solve word problems that call for addition of three whole numbers whose sum is less than or equal to 20 eg by using objects drawings and equations with a symbol for the unknown number to represent the problem
1 OA 3
CC1OA3 Understand and apply properties of operations and the relationship between addition and subtraction Apply properties of operations as strategies to add and subtract Examples If 8 + 3 = 11 is known then 3 + 8 = 11 is also known (Commutative property of addition) To add 2 + 6 + 4 the second two numbers can be added to make a ten so 2 + 6 + 4 = 2 + 10 = 12 (Associative property of addition) (Students need not use formal terms for these properties)
1 OA 4
CC1OA4 Understand and apply properties of operations and the relationship between addition and subtraction Understand subtraction as an unknown-addend problem For example subtract 10 ndash 8 by finding the number that makes 10 when added to 8
1 OA 5 CC1OA5 Add and subtract within 20 Relate counting to addition and subtraction (eg by counting on 2 to add 2)
1 OA 6 CC1OA6 Add and subtract within 20 Add and subtract within 20 demonstrating fluency for addition and subtraction within 10 Use strategies such as counting on making ten (eg 8 + 6 = 8 + 2 + 4 = 10 + 4 = 14) decomposing a number leading to a ten (eg 13 ndash 4 = 13 ndash 3 ndash 1 = 10 ndash 1 = 9) using the relationship between addition and subtraction (eg knowing that 8 + 4
47
Keansburg School DistrictCurriculum System
Mathematics= 12 one knows 12 ndash 8 = 4) and creating equivalent but easier or known sums (eg adding 6 + 7 by creating the known equivalent 6 + 6 + 1 = 12 + 1 = 13)
1 OA 7
CC1OA7 Work with addition and subtraction equations Understand the meaning of the equal sign and determine if equations involving addition and subtraction are true or false For example which of the following equations are true and which are false 6 = 6 7 = 8 ndash 1 5 + 2 = 2 + 5 4 + 1 = 5 + 2
1 OA 8
CC1OA8 Work with addition and subtraction equations Determine the unknown whole number in an addition or subtraction equation relating three whole numbers For example determine the unknown number that makes the equation true in each of the equations 8 + = 11 5 = _ ndash 3 6 + 6 = _
1 NBT 1
CC1NBT1 Extend the counting sequence Count to 120 starting at any number less than 120 In this range read and write numerals and represent a number of objects with a written numeral
1 NBT 2
CC1NBT2 Understand place value Understand that the two digits of a two-digit number represent amounts of tens and ones Understand the following as special cases -- a 10 can be thought of as a bundle of ten ones mdash called a ldquotenrdquo -- b The numbers from 11 to 19 are composed of a ten and one two three four five six seven eight or nine ones -- c The numbers 10 20 30 40 50 60 70 80 90 refer to one two three four five six seven eight or nine tens (and 0 ones)
1 NBT 3
CC1NBT3 Understand place value Compare two two-digit numbers based on meanings of the tens and ones digits recording the results of comparisons with the symbols gt = and lt
1 NBT 4
CC1NBT4 Use place value understanding and properties of operations to add and subtract Add within 100 including adding a two-digit number and a one-digit number and adding a two-digit number and a multiple of 10 using concrete models or drawings and strategies based on place value properties of operations andor the relationship between addition and subtraction relate the strategy to a written method and explain the reasoning used Understand that in adding two-digit numbers one adds tens and tens ones and ones and sometimes it is necessary to compose a ten
1 NBT 5
CC1NBT5 Use place value understanding and properties of operations to add and subtract Given a two-digit number mentally find 10 more or 10 less than the number without having to count explain the reasoning used
1 NBT 6 CC1NBT6 Use place value understanding and properties of operations to add and subtract Subtract multiples of 10 in the range 10-90 from multiples of 10 in the range 10-90 (positive or zero differences) using concrete models or drawings and strategies based on place value properties of operations andor
48
Keansburg School DistrictCurriculum System
Mathematicsthe relationship between addition and subtraction relate the strategy to a written method and explain the reasoning used
1 MD 1
CC1MD1 Measure lengths indirectly and by iterating length units Order three objects by length compare the lengths of two objects indirectly by using a third object
1 MD 2
CC1MD2 Measure lengths indirectly and by iterating length units Express the length of an object as a whole number of length units by laying multiple copies of a shorter object (the length unit) end to end understand that the length measurement of an object is the number of same-size length units that span it with no gaps or overlaps Limit to contexts where the object being measured is spanned by a whole number of length units with no gaps or overlaps
1 MD 3CC1MD3 Tell and write time Tell and write time in hours and half-hours using analog and digital clocks
1 MD 4
CC1MD4 Represent and interpret data Organize represent and interpret data with up to three categories ask and answer questions about the total number of data points how many in each category and how many more or less are in one category than in another
1 G 1
CC1G1 Reason with shapes and their attributes Distinguish between defining attributes (eg triangles are closed and three-sided) versus non-defining attributes (eg color orientation overall size) for a wide variety of shapes build and draw shapes to possess defining attributes
1 G 2
CC1G2 Reason with shapes and their attributes Compose two-dimensional shapes (rectangles squares trapezoids triangles half-circles and quarter-circles) or three-dimensional shapes (cubes right rectangular prisms right circular cones and right circular cylinders) to create a composite shape and compose new shapes from the composite shape (Students do not need to learn formal names such as ldquoright rectangular prismrdquo)
1 G 3
CC1G3 Reason with shapes and their attributes Partition circles and rectangles into two and four equal shares describe the shares using the words halves fourths and quarters and use the phrases half of fourth of and quarter of Describe the whole as two of or four of the shares Understand for these examples that decomposing into more equal shares creates smaller shares
49
Keansburg School DistrictCurriculum System
Mathematics
Common Core State Standards Vocabulary
Addition and subtraction within 5 10 20 100 or 1000 Addition or subtraction of two whole numbers with whole number answers and with sum or minuend in the range 0-5 0-10 0-20 or 0-100 respectively Example 8 + 2 = 10 is an addition within 10 14 ndash 5 = 9 is a subtraction within 20 and 55 ndash 18 = 37 is a subtraction within 100
Additive inverses Two numbers whose sum is 0 are additive inverses of one another Example 34 and ndash 34 are additive inverses of one another because 34 + (ndash 34) = (ndash 34) + 34 = 0
Associative property of addition See Table 3 in this Glossary
Associative property of multiplication See Table 3 in this Glossary
Bivariate data Pairs of linked numerical observations Example a list of heights and weights for each player on a football team
Box plot A method of visually displaying a distribution of data values by using the median quartiles and extremes of the data set A box shows the middle 50 of the data1
Commutative property See Table 3 in this Glossary
Complex fraction A fraction AB where A andor B are fractions (B nonzero)
Computation algorithm A set of predefined steps applicable to a class of problems that gives the correct result in every case when the steps are carried out correctly See also computation strategy
Computation strategy Purposeful manipulations that may be chosen for specific problems may not have a fixed order and may be aimed at converting one problem into another See also computation algorithm
Congruent Two plane or solid figures are congruent if one can be obtained from the other by rigid motion (a sequence of rotations reflections and translations)
Counting on A strategy for finding the number of objects in a group without having to count every member of the group For example if a stack of books is known to have 8 books and 3 more books are added to the top it is not necessary to count the stack
50
Keansburg School DistrictCurriculum System
Mathematicsall over again One can find the total by counting onmdashpointing to the top book and saying ldquoeightrdquo following this with ldquonine ten eleven There are eleven books nowrdquo
Dot plot See line plot
Dilation A transformation that moves each point along the ray through the point emanating from a fixed center and multiplies distances from the center by a common scale factor
Expanded form A multi-digit number is expressed in expanded form when it is written as a sum of single-digit multiples of powers of ten For example 643 = 600 + 40 + 3
Expected value For a random variable the weighted average of its possible values with weights given by their respective probabilities
First quartile For a data set with median M the first quartile is the median of the data values less than M Example For the data set 1 3 6 7 10 12 14 15 22 120 the first quartile is 62 See also median third quartile interquartile range
Fraction A number expressible in the form ab where a is a whole number and b is a positive whole number (The word fraction in these standards always refers to a non-negative number) See also rational number
Identity property of 0 See Table 3 in this Glossary
Independently combined probability models Two probability models are said to be combined independently if the probability of each ordered pair in the combined model equals the product of the original probabilities of the two individual outcomes in the ordered pair
Integer A number expressible in the form a or ndasha for some whole number a
Interquartile Range A measure of variation in a set of numerical data the interquartile range is the distance between the first and third quartiles of the data set Example For the data set 1 3 6 7 10 12 14 15 22 120 the interquartile range is 15 ndash 6 = 9 See also first quartile third quartile
Line plot A method of visually displaying a distribution of data values where each data value is shown as a dot or mark above a number line Also known as a dot plot3
51
Keansburg School DistrictCurriculum System
MathematicsMean A measure of center in a set of numerical data computed by adding the values in a list and then dividing by the number of values in the list4 Example For the data set 1 3 6 7 10 12 14 15 22 120 the mean is 21
Mean absolute deviation A measure of variation in a set of numerical data computed by adding the distances between each data value and the mean then dividing by the number of data values Example For the data set 2 3 6 7 10 12 14 15 22 120 the mean absolute deviation is 20
Median A measure of center in a set of numerical data The median of a list of values is the value appearing at the center of a sorted version of the listmdashor the mean of the two central values if the list contains an even number of values Example For the data set 2 3 6 7 10 12 14 15 22 90 the median is 11
Midline In the graph of a trigonometric function the horizontal line halfway between its maximum and minimum values
Multiplication and division within 100 Multiplication or division of two whole numbers with whole number answers and with product or dividend in the range 0-100 Example 72 divide 8 = 9
Multiplicative inverses Two numbers whose product is 1 are multiplicative inverses of one another Example 34 and 43 are multiplicative inverses of one another because 34 times 43 = 43 times 34 = 1
Number line diagram A diagram of the number line used to represent numbers and support reasoning about them In a number line diagram for measurement quantities the interval from 0 to 1 on the diagram represents the unit of measure for the quantity
Percent rate of change A rate of change expressed as a percent Example if a population grows from 50 to 55 in a year it grows by 550 = 10 per year
Probability distribution The set of possible values of a random variable with a probability assigned to each
Properties of operations See Table 3 in this Glossary
Properties of equality See Table 4 in this Glossary
Properties of inequality See Table 5 in this Glossary
Properties of operations See Table 3 in this Glossary
52
Keansburg School DistrictCurriculum System
MathematicsProbability A number between 0 and 1 used to quantify likelihood for processes that have uncertain outcomes (such as tossing a coin selecting a person at random from a group of people tossing a ball at a target or testing for a medical condition)
Probability model A probability model is used to assign probabilities to outcomes of a chance process by examining the nature of the process The set of all outcomes is called the sample space and their probabilities sum to 1 See also uniform probability model
Random variable An assignment of a numerical value to each outcome in a sample space
Rational expression A quotient of two polynomials with a non-zero denominator
Rational number A number expressible in the form ab or ndash ab for some fraction ab The rational numbers include the integers
Rectilinear figure A polygon all angles of which are right angles
Rigid motion A transformation of points in space consisting of a sequence of one or more translations reflections andor rotations Rigid motions are here assumed to preserve distances and angle measures
Repeating decimal The decimal form of a rational number See also terminating decimal
Sample space In a probability model for a random process a list of the individual outcomes that are to be considered
Scatter plot A graph in the coordinate plane representing a set of bivariate data For example the heights and weights of a group of people could be displayed on a scatter plot5
Similarity transformation A rigid motion followed by a dilation
Tape diagram A drawing that looks like a segment of tape used to illustrate number relationships Also known as a strip diagram bar model fraction strip or length model
Terminating decimal A decimal is called terminating if its repeating digit is 0
Third quartile For a data set with median M the third quartile is the median of the data values greater than M Example For the data set 2 3 6 7 10 12 14 15 22 120 the third quartile is 15 See also median first quartile interquartile range
Transitivity principle for indirect measurement If the length of object A is greater than the length of object B and the length of object B is greater than the length of object C then the length of object A is greater than the length of object C This principle applies
53
Keansburg School DistrictCurriculum System
Mathematicsto measurement of other quantities as well
Uniform probability model A probability model which assigns equal probability to all outcomes See also probability model
Vector A quantity with magnitude and direction in the plane or in space defined by an ordered pair or triple of real numbers
Visual fraction model A tape diagram number line diagram or area model
Whole numbers The numbers 0 1 2 3 hellip5
54
- MissionVision Statement
- Beliefs
- Measurement amp Data
- Measure lengths and by iterating length units
- Tell and write time
- Represent and interpret data
- Geometry
- Reason with shapes and their attributes
- Number and Base Ten
- Extend the counting sequence
- Understand place value
-
- Measurement amp Data (II)
-
- Measure lengths and by iterating length units
- Tell and write time
-
- Represent and interpret data
- Geometry (II)
- Reason with shapes their attributes
-
- Number and Base Ten
- Use place value understanding and properties of operations to add and subtract
- Teacher will cover up specific numbers on an enlarged number grid using cover up tape to have students identify numbers before and after Students will come up and write the missing numbers
- Students will play ldquoI have__ Who has __ Teacher will create cards using index cards and numbers in which students need further practice with Students will read their cards aloud Variations of game can include identifying specific numbers identifying numbers more or less etc)
- Students will use base ten blocks to represent numbers including three digit numbers Students will identify representation of numbers through these manipulatives They may match the representation to the written number
- Students will write the number they created using the base ten blocks using their white boards and markers
- Students will arrange given digits to create the greatest and lowest possible numbers They can show each number they create using base ten blocks
- Students will use the Base Ten Exchange Game to show an understanding of exchanging ones for tens and tens for hundreds Students can use place value mats base ten blocks (cubes tens and flats) Students can take number of cubes displayed with roll of single die Students will determine when exchanging can be made when reaching ten units
- Base ten concentration wwwk-5mathteachingresourcescom
- Ten frame compare wwwk-5mathteachingresourcescom
-
Keansburg School DistrictCurriculum System
Mathematics Represent and interpret data
AprilQuarter 4
Geometry (II) Reason with shapes their attributes
MayQuarter 4
Number and Base Ten Use place value understanding and properties of operations to add and subtract
JuneQuarter 4
Readiness skills for September of Grade 2 Problem solving with all mathematical concepts covered in Grade 1
10
Keansburg School DistrictCurriculum System
Mathematics
Keansburg School DistrictCurriculum Management System
SubjectGradeLevelMathematicsGrade 1
Timeline September-Quarter 1
Topic(s) Number Sense
Significance of Learning Goal(s) To write numbers 0-20
Sugg
este
d D
ays
of
Inst
ruct
ion Content
Standards CPI
Essential Questions
Specific Learning Objective(s)
The Students Will Be Able To
Suggested Activities Instructional Tools Materials Technology Resources Assessments and Assessment Models
CPI KCC1 KCC2 KCC3 KCC6 KOA5 KNBT1
EQ Why is it
important to recognize and write numbers
Concept(s) Kindergarten review of number sense
SWBAT
Identify write and count numbers 0-20
Count objects and represent with a number
Compare and order numbers 0-
Meets Standard Practice counting
numbers 0-20 using nursery rhymes and songs
Order numbers from 0-20 using number cards number tiles (from hundredths board)
Order numbers while understanding words such as before after between Utilize a number line to locate and order numbers
Compare numbers that greater than or less than using games such as Number Line Squeeze
Nursery Rhymes CD Math songs Number cards Number Line Squeeze-number lines Everyday Math cards Straws or popsicle sticks Calendar httpwwwstarfallcomnholidaycalendarloadhtmfampn=main school day count chart weather chart attendance chart class number grid wwwk-5mathteachingresourcescom coins counters
11
Keansburg School DistrictCurriculum System
Mathematics20 through concrete and pictorial models
Count to 100 by ones and tens
Top It and One More One Less Stories
Write numbers from 0-20 Construct numbers 11-19
by bundling groups of ten and then by counting the left over ones
Develop number sense by counting up and counting back using a given number
Incorporate number sense daily through calendar school day count class number grid weather and attendance
Reading counting books Recording tally counts
creating tally charts Find and locate numbers
on the number grid Provide students with
number lines students will need to identify and provide the missing number
Show one more wwwk-5mathteachingresourcescom
Show one less wwwk-5mathteachingresourcescom
One more on the ten frame wwwk-5mathteachingresourcescom
Typical Assessment Question(s) or Task(s) Ask students to count 0-20 Students will be asked to order numbers from 0-20 Compare numbers that greater than or less than Students will display number sense through orally counting up
and counting back using a given number Give students a given number have them identify the given
number on the number grid Have students analyze a tally chart and give the associated
number with this chart
12
Keansburg School DistrictCurriculum System
Mathematics
Exceeds Standard Practice counting
numbers 21-100 Compare numbers
greater than 20 through games
Before and after games Number grid puzzles Counting walk students
estimate step amounts from one location to another Find actual number of steps and compare the two numbers Choose other locations and repeat procedure
Students compose and solve ones and tens riddles
Counting by 5s using nickels
Counting by 10s using dimes
One moreone less scoop wwwk-5mathteachingresourcescom
13
Keansburg School DistrictCurriculum System
Mathematics
Keansburg School DistrictCurriculum Management System
SubjectGradeLevelMathematicsGrade 1
Timeline October-Quarter 1Topic(s) Operations amp Algebraic Expressions
Significance of Learning Goal(s) To solve problems using addition and subtraction within 20
Sugg
este
d
Content Standards CPI Essential
Questions
Specific Learning Objective(s)
The Students Will Be Able To
Suggested ActivitiesInstructional Tools Materials
Technology Resources Assessments and Assessment
Models
CPI 1OA31OA4 1OA5 1OA6 1OA7 1OA8
EQ What questions can
be answered using addition
What strategies can be used to solve problems
How can we tell how many
How does knowing math facts make math easier
How can numbers be helpful
Why do I need to subtract
Concept(s) Working with and solving problems using addition and subtraction within 20
SWBAT
Solve word problems within 20 using real life situations
Understand demonstrate and apply properties of operations for addition
Demonstrate fluency for addition and subtraction within 20 by using strategies to solve
Meets Standard Model a number sentence using
manipulatives and label operation symbols
Use dominoes to create an addition problem and find the sum
Solve addition problems using a number line
Students will develop different ways to solve number stories students will use objects fingers and pictures count onback number line or number grid
Create real life situations in which students will use all number story strategies to solve a problem
Teachers will pose real world number stories to the students students will synthesize pre-existing information that they know to solve the problem
Introduce and devise addition and subtraction number stories posters stating each key word for addition and subtraction operations
Dominoes Number lines Number Grids Number Cards White Boards Dry-Erase markers Pennies
Typical Assessment Question(s) or Task(s)
Students will be asked to solve addition and subtraction problems within 20 within a given time frame
Students will be given a number and be asked to count on from that given number
14
Keansburg School DistrictCurriculum System
Mathematics How do we use
addition and subtraction in our everyday life
Why are fact families important
What strategies can be used to solve problems How is counting on different from just counting to add
What information do you need to know in order to find the total number of something
Why would you need to count back
How are subtraction and addition related
problems Relate counting to
addition by counting on from the higher number
Demonstrate fluency for addition by using strategies such as counting on doubles and doubles plus 1
Combine and mix two sets of 0-10 number cards One partner draws two number cards from the top of the deck students will design and generate a number story using the two numbers Both partners solve the problem in the number story and write the answer on their slate
Use concrete objects to demonstrate the relationship between two addends and the sum
Teacher will model and demonstrate using pictures and objects how objects can be moved around and still come out to equal the same sum
Develop counting on skills by students choosing a number card and partner count on from the given number
Roll two number cubes identify the higher number and count on to find sum
Use technology to show doubles different compliments of 10 songs and raps to help students memorize basic facts Poll students to discover their favorite tune
Play around the world using basic addition facts
Relate addition to subtraction by creating fact families using number cubes dominoes fact family houses etc
Turn around trains wwwk-5mathteachingresourcescom
Domino fact families wwwk-5mathteachingresourcescom
Plus one game wwwk-5mathteachingresourcescom
Students will be given word problems within 20 to solve students will use various strategies and means to solve these problems
15
Keansburg School DistrictCurriculum System
Mathematics One less game wwwk-
5mathteachingresourcescom Doubles facts wwwk-
5mathteachingresourcescom Facts of ten wwwk-
5mathteachingresourcescom Fact family house wwwk-
5mathteachingresourcescom Number sentence math wwwk-
5mathteachingresourcescom Sums of ten wwwk-
5mathteachingresourcescom
Exceeds Standard
In groups or individually students will plan and generate world problems based on real life situations
Teachers will provide pictures of groups of things such as animals people or objects Students will analyze and evaluate the picture and design a number story about the picture
Using number cards or dice create addition sentences draw a picture to represent problem and write an addition number model to correlate with the fact
With 9 10 12 side dice roll two number cubes identify the higher number and count on to find sum
Students will compose their own double facts song
Students create a 4 x 4 double facts mat with double sums Partners roll a 12-sided number cube double the top number showing and X it out on the
16
Keansburg School DistrictCurriculum System
Mathematicsmat First student to get 4 in a row wins
Take two dominoes each representing an addend and have students find the sum
Students use pennies to solve basic addition problems
Students will complete turn around facts Make ten wwwk-
5mathteachingresourcescom Make ten on the ten frame wwwk-
5mathteachingresourcescom What number ishellip wwwk-
5mathteachingresourcescom Make ten square What number ishellip
wwwk-5mathteachingresourcescom Dot card addition What number is
wwwk-5mathteachingresourcescom Addition domino train What number is
wwwk-5mathteachingresourcescom
17
Keansburg School DistrictCurriculum System
MathematicsKeansburg School DistrictCurriculum Management System
SubjectGradeLevelMathematicsGrade 1
Timeline November-Quarter 2
Topic(s) Measurement and Data
Significance of Learning Goal(s) To understand measurement and what tools and used
Sugg
este
d D
ays
of
Inst
ruct
ion Content
Standards CPI Essential Questions
Specific Learning Objective(s)
The Students Will Be Able To
Suggested ActivitiesInstructional Tools Materials
Technology Resources Assessments and Assessment
Models
CPI 1MD1 1MD2 1MD3 1MD4
EQ Why do people
use graphs How is a bar
graph like a tally chart
How would I know if a bar graph correctly shows what is on a tally chart
How could a bar graph answer a question
Concept(s) Understanding what measurement is and what tools are used
SWBAT
Compare and order the length of up to three objects using direct comparisons
Compare the lengths of two objects indirectly by using a third object
Measure objects using non-standard units and express it as a whole number
Draw an object longer or shorter than a given
Meets Standard Teacher will introduce measurement
by holding up objects and the students will examine the objects and explain the size order
o Students will break into groups and compare objects further and classify them depending on their size
Teacher will introduce the ruler Explain to students that the ruler is used to measure objects The students will then explore the classroom and select objects around the room that are smaller and larger than the ruler
Teacher will select specific body parts that the students will use as a personal unit of measurement The students will work in pairs to demonstrate how to measure objects around the room
Rulers Judy Clock Paper Plates Classroom objects Chart paper Jack Hartmann ndash Tick Tock
Song Brainpop Jr White boards Dry Erase markers Clock Concentration
Typical Assessment Question(s) or Task(s)
Analyze a bar graph and answer questions
Create a bar graph using self ndash selected topic
18
Keansburg School DistrictCurriculum System
Mathematics Do bar graphs
make it easier to understand and compare facts Why
What kind of graph should I use to answer questions
Why do I need to tell time
How many hands does a clock have
Are the hands on the clock the same size
How long is a minute
Why do I need to use a calendar
How do we use the clock and the calendar to determine what we will do in school
Why do we need to measure something
What can we use to draw and measure things
What do you think is about 1 inch long
How many steps long do you think it is from
object Organize represent
and interpret data with up to three categories on simple graphs and charts
Analyze and formulate questions based on simple graphs and charts
Identify time to the hour and half hour on both a digital and analog clock
Write time to the hour and half hour on both analog and digital clocks
Draw the hands on an analog clock for a give time to the hour or half hour
Relate times to the half hour to ldquohalf pastrdquo the hour
using their personal unit of measurement
The teacher will select a classroom object and the students will be asked to illustrate objects in the room that are bigger and smaller in size
The students will be able to organize represent and interpret data up to three categories through the use of a bar graph
The teacher will then divide students into heterogeneous groups and encourage the students to explain what they can learn from the graph The students will present findings following activity
Students will choose an object within classroom then find additional objects one being larger the other being shorter using a two-column chart Draw or write the objects in the chart
Create a human clock students will hold 12 numbered plates One student will stand in the middle as the minute and hour hand to model various times
Students will have their own demonstration clocks students will identify and find the hour and minute hands
Students create their own clocks using paper plates students will manipulate hands to identify varying times
Students will listen to Jack Hartman ldquoTick Tockrdquo song
Teachers and students will view clock on videos on brainpopjrcom students
Take 3 objects and order them from smallest to largest and largest to smallest
Read a series of clocks (analog and digital) and tell the time to the hour and half hour
Using blank clocks the students will draw the hands to show a designated time
Use a personal measurement (ie your thumb) to measure the length of an object
19
Keansburg School DistrictCurriculum System
Mathematicsthe front of the classroom to the back
If we measure in footsteps why are some of the measurements different
How is longer and shorter similar to greater and lesser
and teachers can complete quizzes available on website
Teachers will present time on an analog clock students will write the digital time on a white board
Students will play clock concentration
Exceeds Standard
The students will work in pairs to locate objects around the room and compare the lengths against each other The pairs will then work with another pair of students and compare the lengths of their objects with the objects the other pair located
Teacher will introduce the ruler in comparison to the yardstick The students will be encouraged to find objects that in the room that are larger than a ruler and measure using the yardstick
After the teacher introduces units of personal measurement the students will be encouraged to measure object in the room using their own unit of personal measurement and convert it into a standard measurement using a ruler or a yardstick
The teacher will select a classroom object and the students will be asked to illustrate objects in the room that are bigger and smaller by a specific size
The students will be able to organize represent and interpret data up to four
20
Keansburg School DistrictCurriculum System
Mathematicsor more categories through the use of a bar graph
The teacher will then divide students into heterogeneous groups and encourage the students to explain what they can learn from the graph and create a tally chart utilizing the data
Students will create clock flash cards by drawing an analog clock on one side and writing the digital clock time on the other
Give students a clock and a blue number cube ()
21
Keansburg School DistrictCurriculum System
MathematicsKeansburg School DistrictCurriculum Management System
SubjectGradeLevelMathematicsGrade 1
Timeline December-Quarter 2
Topic(s) Geometry
Significance of Learning Goal(s) To identify shapes and their attribures
Sugg
este
d D
ays
of
Inst
ruct
ion Content
Standards CPI Essential
Questions
Specific Learning Objective(s)
The Students Will Be Able To
Suggested Activities
Instructional Tools Materials
Technology Resources
Assessments and Assessment Models
CPI1G1 1G2
EQ Where do
you see shapes in our classroom
Are there different shapes outside
How are geometric figures alike
How can we sort
Concept(s) Identify shapes and their attributes
SWBAT Distinguish
between two and three-dimensional shapes by classifying their attributes For example color shape and size
Compare and contrast shapes based on their attributes
Construct and create shapes
Meets Standard Sorting shapes based on their attributes For example
number of sideso Materials attribute blocks shape card sheet sorting
mat Introduce vocabulary cylinder cube sphere rectangular
prism triangular prism pyramid Classroom shape hunt students go around the room finding shapes within the classroom For example trash can tissue box clock
o Materials shape sheet classroom objects httpilluminationsnctmorgLessonDetailaspxid=L237
Create 3-dimenstion shapes (rectangular prism pyramid cube)
o Straws twist ties shape cards Create 2-dimensional shapes (trapezoid triangle circle
rectangle rhombus)o Pattern block templates attribute blocks pattern
block template stencil geo-boards rubber bands httpilluminationsnctmorgLessonDetailaspx
Attribute blocks Shape card
sheet Sorting mat Twist ties Straws Shape cards Pattern block
templates Attribute blocks Pattern block
template stencil Geo-boards Rubber bands
22
Keansburg School DistrictCurriculum System
Mathematicsobjects of different shapes
How can shapes and solids be described compared and used to make other shapes What are equal parts
What foods do you divide into equal parts
What other items might be divided
How do you know if you have an equal share
possessing certain attributes
Identify and construct two-dimensional shapes
Identify and construct three-dimensional figures
id=L168 Create a drawing using shapes students will create a
picture using the pattern block template stencil (house sun flowers etc)
o Paper pattern block stencil template crayons
Apply understanding of attributes by playing Shape Detective and Attribute Train Game
Demonstrate understanding of 3 Dimensional shapes by playing Whatrsquos My Shape
Exceeds Standard
Introducing and exposing higher vocabulary polyhedronpolyhedra (many faces of a shape) Placing the word onto the word wall
Students read the poem Shapes by Shel Silverstein and create their own illustration of the poem to explore geometric figures and positional words
Materials httpilluminationsnctmorgLessonDetailaspxID=L202
Shapes by Shel Silverstein paper crayons pencils examples of rectangles triangles circles
Compose clues using inferencing to play Guess What Display variety of 3 dimensional shapes Silently choose
an object and give clues about it For example I amsmall I have 2 flat faces and if you trace my faces youwill get circles What am I (tomato can)
Students work together to use pattern blocks to coverother pattern blocks For example how many triangleblocks are needed to cover a hexagon block
Student rotate in groups to visit each geometric solidwhile completing a chart which shows faces sides and
Typical Assessment Question(s) or Task(s)
Ask students how many sides each shape has
Have students classify shapes based on number of sides
Have students identify shapes in the classroom
Have students create 2 and 3 dimensional shapes
Have students design pictures using pattern blockspattern block template
Have students identify and describe assigned shapersquos attributes
Ask students to name 3 dimensional shapes hidden i bag (Whatrsquos my Shape Game)
23
Keansburg School DistrictCurriculum System
Mathematics corners Students compose a shape town by using their pattern
block templates Then students will calculate the totalnumber of each pattern block used
Students will invent new shapes by using three-dimensional shapes
Students will create patterns using three dimensionalshapes
24
Keansburg School DistrictCurriculum System
MathematicsKeansburg School DistrictCurriculum Management System
SubjectGradeLevelMathematicsGrade 1
Timeline January-Quarter 2
Topic(s) Number and Operations in Base Ten
Significance of Learning Goal(s) To recognize compare and understand numbers to 120
Sugg
este
d D
ays
of
Inst
ruct
ion Content
Standards CPI Essential
Questions
Specific Learning Objective(s)
The Students Will Be Able To
Suggested ActivitiesInstructional Tools Materials
Technology Resources Assessments and Assessment
Models
25
Keansburg School DistrictCurriculum System
MathematicsCPI 1NBT1 1NBT2A 1NBT2B 1NBT2C 1NBT3
EQ How do
numbers help us
How can sets of numbers be counted compared and ordered
How can I use numbers to solve problems
How would putting numbers on a chart make it easier to understand information
How can I make it easier to understand numbers when I sort them
What is place value
Concept(s) Recognize compare and understand numbers up to 120
SWBAT Recognize read write
and count 0-120 Understand that a two-
digit number represents amounts of tens and ones
Relate groups of ten to skip counting
Compare two two-digit numbers based on meanings of tens and ones digits using symbols ltgt and =
Meets Standard Teacher will cover up specific numbers
on an enlarged number grid using cover up tape to have students identify numbers before and after Students will come up and write the missing numbers
Students will play ldquoI have__ Who has __ Teacher will create cards using index cards and numbers in which students need further practice with Students will read their cards aloud Variations of game can include identifying specific numbers identifying numbers more or less etc)
Students will use base ten blocks to represent numbers including three digit numbers Students will identify representation of numbers through these manipulatives They may match the representation to the written number
Students will write the number they created using the base ten blocks using their white boards and markers
Students will arrange given digits to create the greatest and lowest possible numbers They can show each number they create using base ten blocks
Students will use the Base Ten Exchange Game to show an
Number grids ldquoI have Who hasrdquo index
cards base ten blocks white boards markers number cards dice ten frame base ten concentration
boards (k-5 math teaching resources)
double ten frame boards (k-5 math teaching resources)
Typical Assessment Question(s) or Task(s)
Recognize numbers 1-120 using flashcards
Write numbers 1-20 using block or graph paper
Build two-digit numbers using tens and ones blocks
Listen and note students skip counting orally by tens to 120
Students compare and label two numbers using relation symbols
26
Keansburg School DistrictCurriculum System
Mathematics Why is place
value important
How can I use place value to compare and order numbers
How can I use the number grid to help me with counting numbers
How many times do you think you can hop in one minute
What does number relationships mean
Why do we need to know how to add
Why do we need to know how to subtract
How are addition and subtraction related
What are doubles
How can
understanding of exchanging ones for tens and tens for hundreds Students can use place value mats base ten blocks (cubes tens and flats) Students can take number of cubes displayed with roll of single die Students will determine when exchanging can be made when reaching ten units
Teens on the ten frame wwwk-5mathteachingresourcescom
Base ten concentration wwwk-5mathteachingresourcescom
Ten frame compare wwwk-5mathteachingresourcescom
Exceeds Standard
Students will create riddles Irsquom thinking of a number that has 4 tens and 13 ones Have students solve the riddle by regrouping the ones to find the answer
-Students use hundreds chart to jump up and down from a number to show 10 more or 10 less
-Students will play Whatrsquos my Number by giving clues based on place value odd or even and number sense For example Irsquom a two digit number The digit in my tens place is 2 more than 4
27
Keansburg School DistrictCurriculum System
Mathematicsdouble facts help us to add and subtract
Does it matter what order you use to add three numbers Why or why not
The digit in my ones place is 3 less than 8 Whatrsquos my number
My double ten frame riddle wwwk-5mathteachingresourcescom
28
Keansburg School DistrictCurriculum System
MathematicsKeansburg School DistrictCurriculum Management System
SubjectGradeLevelMathematicsGrade 1
Timeline February-Quarter 3
Topic(s) Operations amp Algebraic Expressions
Significance of Learning Goal(s) To solve addition and subtraction problems
Sugg
este
d D
ays
of
Inst
ruct
ion Content
Standards CPI
Essential Questions
Specific Learning Objective(s)
The Students Will Be Able To
Suggested ActivitiesInstructional Tools Materials
Technology Resources Assessments and Assessment
Models
CPI1OA31OA4 1OA5 1OA6 1OA7 1OA81OA2
EQ What
questions can be answered using addition
What strategies can be used to solve problems
How can we
Concept(s) Solve addition with and subtraction problems
SWBAT Solve addition problems
with sums up to 20 Use addition within 20 to
solve word problems involving real life situations
Solve word problems that call for addition of three whole numbers up to 20
Solve subtraction problems with difference up to 20
Use subtraction within 20 to solve word problems involving real
Meets Standard Model and have students create their
own individual number sentence using manipulatives and label operation symbols
Students will choose a strategy to solve number stories such as objects fingers and pictures count onback number line or number grid
Create real life situations in which students will use a strategy to solve a number story and create a number model
Review addition and subtraction number stories posters stating each key word for addition and subtraction operations
Combine and mix two sets of 0-20 number cards One partner draws two number cards from the top of the deck students will design and generate a number story using the two numbers
Materials Manipulatives (examples
counting bears connecting cubes pennies counters etc)
Slates dry erase markers erasers
Clear Sheet Protectors Sets of 0-20 number cards Number cards Cardstock Scrabble tiles letter cards
Typical Assessment Question(s) or Task(s)
Students will solve real life
29
Keansburg School DistrictCurriculum System
Mathematicstell how many
How does knowing math facts make math easier
How can numbers be helpful
Why do I need to subtract
How do we use addition and subtraction in our everyday life
Why are fact families important
What strategies can be used to solve problems How is counting on different from just counting to add
What information do you need to know in order to find
life situations Understand subtraction
as an unknown addend problem example subtract 9-5 by finding the number that makes 9 when added to 5
Both partners solve the problem in the number story and write the answer on their slate
Find three cards that have a sum of 12 how many different ways can the student make the sum of 12 using three cards students record work
-Teacher creates real life word problemsinvolving three addends up to 20
Ten frames subtraction wwwk-5mathteachingresourcescom
I have who has wwwk-5mathteachingresourcescom
True or false wwwk-5mathteachingresourcescom
Count to 20 wwwk-5mathteachingresourcescom
Exceeds Standard
Teacher creates multi step word problems for students to solve
Students work with partners or small groups to create real life word problems Compose class book of problems
Three letter addends use scrabble tiles or letter cards with corresponding numbers to make three letter words find
word problems Students will create their
own number sentences own number storiesword problems
Students will create and solve number stories in cooperative learning groups
Students will generate word problems using assigned numbers
30
Keansburg School DistrictCurriculum System
Mathematicsthe total number of something
Why would you need to count back
How are subtraction and addition related
the sum of each word by adding the numbers on the tiles Students will find which words have the greatest or smallest sum
31
Keansburg School DistrictCurriculum System
MathematicsKeansburg School DistrictCurriculum Management System
SubjectGradeLevelMathematicsGrade 1
Timeline March-Quarter 3
Topic(s) Measurement amp Data
Significance of Learning Goal(s) To tell time and compare measurements
Sugg
este
d D
ays
of
Inst
ruct
ion Content
Standards CPI
Essential Questions
Specific Learning Objective(s)
The Students Will Be Able ToSuggested Activities
Instructional Tools Materials Technology Resources
Assessments and Assessment Models
How would I know if a bar graph correctly shows what is on a tally chart
How could a bar graph answer a question
Do bar graphs make it easier to understand and compare facts Why
What kind
Concept(s) Telling time comparing measurements
SWBAT Identify and write time to
the hour and half hour on both a digital and analog clock
Write time to the hour and half-hour on both digital and analog clocks
Draw the hands on the analog clock for a given time to the hour or half-hour
Relate times to the half hour as ldquohalf-pastrdquo the hour
Compare and contrast
Meets Standard Students will have their own
demonstration clocks students will identify and find the hour and minute hands
Students create their own clocks using paper plates students will manipulate hands to identify varying times
Students will listen to Jack Hartman ldquoTick Tockrdquo song
Teachers and students will view clock on videos on brainpopjrcom students and teachers can complete quizzes available on website
Teachers will present time on an analog clock students will write the digital time on a white board
Students will play clock concentration Teacher will introduce measurement by
holding up objects and the students will examine the objects and explain the size
Large Judy Clock Individual student Judy
clocks Wipe off analogdigital clocks Clock stampers Timers Rulers Yardsticks Measuring tapes Sheet protectors Cardstock Paper plates Fasteners Index cards
Typical Assessment Question(s) or Task(s)
Students will be asked to identify and write time to the hour and half hour on both
32
Keansburg School DistrictCurriculum System
Mathematicsof graph should I use to answer questions
Why do I need to tell time
How many hands does a clock have
Are the hands on the clock the same size
How long is a minute
Why do I need to use a calendar
How do we use the clock and the calendar to determine what we will do in school
Why do we need to measure something
What can
objects by length Construct objects at
contrasting lengths
ordero Students will break into groups
and compare objects further and classify them depending on their size
Teacher will introduce the ruler Explain to students that the ruler is used to measure objects The students will then explore the classroom and select objects around the room that are smaller and larger than the ruler
Teacher will select specific body parts that the students will use as a personal unit of measurement The students will work in pairs to demonstrate how to measure objects around the room using their personal unit of measurement
The teacher will select a classroom object and the students will be asked to illustrate objects in the room that are bigger and smaller in size
The students will be able to organize represent and interpret data up to three categories through the use of a bar graph
The teacher will then divide students into heterogeneous groups and encourage the students to explain what they can learn from the graph The students will present findings following activity
Students will choose an object within classroom then find additional objects one being larger the other being shorter using a two-column chart Draw or write the objects in the chart
digital and analog clocks Students will be asked to
identify the parts of a clock students will be asked to draw the hands on an analog clock for a given time to the hour or half-hour
Students will be given various objects and will further be asked to compare and contrast the lengths of these objects
Students will be asked to provide or create objects contrasting lengths to demonstrate understanding of differences in length
33
Keansburg School DistrictCurriculum System
Mathematicswe use to draw and measure things
What do you think is about 1 inch long
How many steps long do you think it is from the front of the classroom to the back
If we measure in footsteps why are some of the measurements different
How is longer and shorter similar to greater and lesser
Exceeds Standard
The students will work in pairs to locate objects around the room and compare the lengths against each other The pairs will then work with another pair of students and compare the lengths of their objects with the objects the other pair located
Teacher will introduce the ruler in comparison to the yardstick The students will be encouraged to find objects that in the room that are larger than a ruler and measure using the yardstick
After the teacher introduces units of personal measurement the students will be encouraged to measure object in the room using their own unit of personal measurement and convert it into a standard measurement using a ruler or a yardstick
The teacher will select a classroom object and the students will be asked to illustrate objects in the room that are bigger and smaller by a specific size
The students will be able to organize represent and interpret data up to four or more categories through the use of a bar graph
The teacher will then divide students into heterogeneous groups and encourage the students to explain what they can learn from the graph and create a tally chart utilizing the data
Students will create clock flash cards by
34
Keansburg School DistrictCurriculum System
Mathematicsdrawing an analog clock on one side and writing the digital clock time on the other Students will include time in five minute intervals
Pose word problems where students have to find elapse time to the hour and half hour
Introduce second hand and conduct activities that are timed in seconds (Examples hopping on 1 foot blinking eyes counting to the highest number)
35
Keansburg School DistrictCurriculum System
MathematicsKeansburg School DistrictCurriculum Management System
SubjectGradeLevelMathematicsGrade 1
Timeline April-Quarter 4
Topic(s) Geometry
Significance of Learning Goal(s) To identify two and three dimensional shapes to understand fractional parts and create equal shares
Sugg
este
d D
ays
of
Inst
ruct
ion Content
Standards CPI Essential
Questions
Specific Learning Objective(s)
The Students Will Be Able To
Suggested ActivitiesInstructional Tools Materials
Technology Resources Assessments and Assessment
Models
Are there different shapes outside
How are geometric figures alike
How can we sort objects of different shapes
How can shapes and solids be described compared and used to make other shapes
Concept(s) Two and three dimensional shapes fractional parts equal shares
SWBAT
Combine two-dimensional or three-dimensional shapes or figures to create a new composite shape and identify the shapes within
Identify fractional parts of circles and rectangles into equal shares while developing vocabulary for halves fourths and quarters
Describe the whole as
Meets Standard
Determine which shape by touch without using their sight
o Materials attribute blocks shape sheet feely box wwwilluminationsnctmorglessondetail
Sorting 3-dimensional objects students will be given cards with 3-dimensional objects (trash can soup can globe ball tissue box box dice) they will sort them based on the 3-dimensional shape they represent
o 3-dimensional object cards sorting mats
Pizza and Cake Fractions students will utilize a pizza and a cake to work on the concept of fractions while developing the vocabulary halves quarters and fourths
o Materials teacher created pizza
Attribute blocks Geometric shapes 3-dimensional object
cards Sorting maps 3-dimensional shapes Solid and lane figures Geo-boards and rubber
bands Fraction circles Sheet protectors 2-dimensional shapes
Typical Assessment Question(s) or Task(s)
Students will be asked to describe and identify
36
Keansburg School DistrictCurriculum System
MathematicsWhat are equal parts
What foods do you divide into equal parts
What other items might be divided
How do you know if you have an equal share
two of or four of the shares Understand for these examples that decomposing into more equal shares creates smaller shares
and cake that are cut into fractions (construction paper)
Students will illustrate a picture of a boat using at least one three dimensional shape in their drawings Shapes include cubes cylinders spheres cones and rectangular prisms
Solid and Plane Figures Name the Face activity Provide three-dimensional objects Have students draw the face for each object as well as name the shape Examples ABC block juice can book party hat
Introduce fractions by having students identify shapes that show equal parts Display cut out shapes using document camera Include some shapes that are divided equally and some that are not divided equally As a whole group sort shapes into two categories Then have students go back to their desks and work with a partner to classify additional shapes
Provide students with shapes that are divided into four parts Include shapes that are divided into four equal parts and others that are unequal Students identify the shapes that are divided into four equal parts and explain their reasoning
Shape Town activity Students will design a shape town using the following shapes
shapes within combined two and three-dimensional shapes
Students will be given circles and rectangles students will be asked to divide these shapes into halves fourths and quarters
Students will be asked to sort shapes that are divided equally and not divided equally
37
Keansburg School DistrictCurriculum System
Mathematicstrapezoid hexagon square triangle and circle Afterwards students will calculate the total number of each shape they included After completing the activity students will present their final product to the class and explain how they decided which shapes to use
Given an array of dots students will draw shapes with specific number of sides and corners and connect the dots to create the shapes Example Draw a shape with 5 sides Draw a shape with 6 corners
Students will create two-dimensional shapes on geoboards Then using different colored rubber bands students will divide the shapes into equal parts Students will transfer their equally divided shapes onto geoboard paper by drawing lines to show their equal parts
Play the Fraction Path Game Materials Fraction circles a circle with frac12 shaded a circle with 13 shaded and a circle with frac14 shaded Gameboard Path consisting of assorted shapes divided into halves thirds and fourths Players Needed 3 Directions Place the fraction circles facedown Players close their eyes and pick one fraction circle Each player follows the path from start to finish Each player looks at each shape on the path and records how many shapes show their fractions Players record
38
Keansburg School DistrictCurriculum System
Mathematicstheir results on paper using tally marks At end of game students compare total number of shapes that show their fraction
Exceeds Standard
39
Keansburg School DistrictCurriculum System
MathematicsKeansburg School DistrictCurriculum Management System
SubjectGradeLevelMathematicsGrade 1
Timeline May-Quarter 4
Topic(s) Number and Operations in Base Ten
Significance of Learning Goal(s) To use place value to add and subtract
Sugg
este
d D
ays
of
Inst
ruct
ion Content
Standards CPI Essential
Questions
Specific Learning Objective(s)
The Students Will Be Able ToSuggested Activities
Instructional Tools Materials Technology Resources
Assessments and Assessment Models
40
Keansburg School DistrictCurriculum System
MathematicsCPI 1NBT4 1NBT5 1NBT6
EQ How do
numbers help us
How can sets of numbers be counted compared and ordered
How can I use numbers to solve problems
How would putting numbers on a chart make it easier to understand information
How can I make it easier to understand numbers when I sort them
What is place value
Why is place value important
How can I
Concept(s) Use place value and properties of operations to add and subtract
SWBAT Use mental math to find
10 more or ten less than a given two-digit number and explain reasoning used within any number to 120
Use place value to add within 100 add a two-digit number to a one-digit number and add a two-digit number to a multiple of ten
Understand when adding two-digit numbers that ones add to the ones and tens add to the tens and sometimes it is necessary to compose a ten by regrouping
For all above objects students will use concrete models and strategies based on place value and relate the strategy to a written method and explain the reasoning used
Subtract multiples of 10 in the range 10-90 from multiples of 10 in the range 10-90 using
Meets Standard
Comparing two digit numbers wwwk-5mathteachingresourcescom
Subtraction split wwwk-5mathteachingresourcescom
Ten more wwwk-5mathteachingresourcescom
Addition split wwwk-5mathteachingresourcescom
Exceeds Standard
Comparing 3-Digit numbers wwwk-5mathteachingresourcescom
What number is wwwk-5mathteachingresourcescom
Students develop addition and subtraction number stories and have partners solve
Create pictures using basendash10 blocks Students trace picture onto paper label the base ten blocks with their value and add total
Solve number grid puzzles by adding and subtraction 10 on the number grid
Number cards Base 10 blocks Counters Number grid puzzles Sleeve protectors wwwk-
5mathteachingresourcescom
Dice
Typical Assessment Question(s) or Task(s)
Recognize numbers 1-120 using flashcards
Write numbers 1-20 using block or graph paper
Build two-digit numbers using tens and ones blocks
Listen and note students skip counting orally by tens to 120
Students compare and label two numbers using relation symbols
41
Keansburg School DistrictCurriculum System
Mathematics
42
Keansburg School DistrictCurriculum System
MathematicsKeansburg School DistrictCurriculum Management System
SubjectGradeLevelMathematicsGrade 1
Timeline June-Quarter 4
Topic(s) Readiness skills for September of Grade 2
Significance of Learning Goal(s) To compare larger numbers add fluently and apply measurement skills
Sugg
este
d D
ays
of
Inst
ruct
ion Content
Standards CPI Essential Questions
Specific Learning Objective(s)
The Students Will Be Able ToSuggested Activities
Instructional Tools Materials Technology Resources
Assessments and Assessment Models
CPI
EQ How can I use
place value to compare and
order numbers in the 100s
How can mastering basic addition and subtraction facts help me compute larger numbers
How can I tie in
Concept(s)Use place value to compare larger numbers fluently add up to 20 apply measurement skills
SWBAT Extend place value into
the hundreds place and re-write and construct models beyond the hundreds
Fluently add and subtract within 20 using mental strategies
Apply measurement skills
Meets Standard Place Value barrier game httpwwwk-
5mathteachingresourcescommath-gameshtml (place value only)
High card
httpwwwlearningboxcomBase10 BaseTenhtml
Time barrier game httpwwwk-5mathteachingresourcescomsupport-filestimebarriergamepdf httpwwwk-5mathteachingresourcescomsupport-filestimebarriergamegridpdf
My favorite time of day writing activity
number cards base ten blocks rulers tape measurer string number relationship mat paper plates cotton balls judy clock digital clock
Typical Assessment Question(s) or Task(s)
Students will solve addition and subtraction problems within 20 in a given time
43
Keansburg School DistrictCurriculum System
Mathematicsmeasurement skills with real life experiences
httpwwwk-5mathteachingresourcescomsupport-filesmy-favorite-time-of-daypdf
Estimating length httpwwwk-5mathteachingresourcescomsupport-filesestimatinglengthpdf
Olympic golf plastic golf clubs cotton balls and tape measurer
Olympic smiles measuring smiles with string and rulers
Olympic Frisbee using paper plates and tape measurer
Olympic airplane students will make paper airplanes measure the distance that they can throw their airplane
Doubles plus 1 game httpwwwk-5mathteachingresourcescomsupport-filesdoubles-plus-onepdf
Eleven more httpwwwk-5mathteachingresourcescomsupport-fileselevenmorepdf
frame Students will be asked to
measure items using inches and centimeters
Identify and create numbers with place values extending into the hundreds place
44
Keansburg School DistrictCurriculum System
Mathematics
Building numbers with base ten blocks pick three cards and arrange them to show a 3-digit number build that number with base ten blocks repeat with the same three cards until no new numbers can be made
Length strength inches httpwwwharcourtschoolcomactivitylength_strength1_inches
Length strength centimeters httpwwwharcourtschoolcomactivitylength_strength1_centi
Exceeds Standard
Number relationship mat wwwk-5mathteachingresourcescom
Place value barrier game httpwwwk-5mathteachingresourcescommath-gameshtml (integrate other skills into place values for example the digit in my 10s place is four doubled)
Measuring the mousersquos path httpwwwk-5mathteachingresourcescomsupport-filespaths1pdf
45
Keansburg School DistrictCurriculum System
Mathematics
Double minus 1 game httpwwwk-5mathteachingresourcescomsupport-filesdoubles-minus-onepdf
Number relationship mat httpwwwk-5mathteachingresourcescomsupport-filesnumberrelationshipmatpdf
46
Keansburg School DistrictCurriculum System
Mathematicsignment Matrices of Common Core State Standards
Grade Strand Standard Standard
Sept
embe
r ndash
Oct
ober
Nov
embe
r ndash
Dec
embe
r
Janu
ary
ndash Fe
brua
ry
Mar
ch ndash
Apr
il
May
- Ju
ne
1 OA 1
CC1OA1 Represent and solve problems involving addition and subtraction Use addition and subtraction within 20 to solve word problems involving situations of adding to taking from putting together taking apart and comparing with unknowns in all positions eg by using objects drawings and equations with a symbol for the unknown number to represent the problem
1 OA 2
CC1OA2 Represent and solve problems involving addition and subtraction Solve word problems that call for addition of three whole numbers whose sum is less than or equal to 20 eg by using objects drawings and equations with a symbol for the unknown number to represent the problem
1 OA 3
CC1OA3 Understand and apply properties of operations and the relationship between addition and subtraction Apply properties of operations as strategies to add and subtract Examples If 8 + 3 = 11 is known then 3 + 8 = 11 is also known (Commutative property of addition) To add 2 + 6 + 4 the second two numbers can be added to make a ten so 2 + 6 + 4 = 2 + 10 = 12 (Associative property of addition) (Students need not use formal terms for these properties)
1 OA 4
CC1OA4 Understand and apply properties of operations and the relationship between addition and subtraction Understand subtraction as an unknown-addend problem For example subtract 10 ndash 8 by finding the number that makes 10 when added to 8
1 OA 5 CC1OA5 Add and subtract within 20 Relate counting to addition and subtraction (eg by counting on 2 to add 2)
1 OA 6 CC1OA6 Add and subtract within 20 Add and subtract within 20 demonstrating fluency for addition and subtraction within 10 Use strategies such as counting on making ten (eg 8 + 6 = 8 + 2 + 4 = 10 + 4 = 14) decomposing a number leading to a ten (eg 13 ndash 4 = 13 ndash 3 ndash 1 = 10 ndash 1 = 9) using the relationship between addition and subtraction (eg knowing that 8 + 4
47
Keansburg School DistrictCurriculum System
Mathematics= 12 one knows 12 ndash 8 = 4) and creating equivalent but easier or known sums (eg adding 6 + 7 by creating the known equivalent 6 + 6 + 1 = 12 + 1 = 13)
1 OA 7
CC1OA7 Work with addition and subtraction equations Understand the meaning of the equal sign and determine if equations involving addition and subtraction are true or false For example which of the following equations are true and which are false 6 = 6 7 = 8 ndash 1 5 + 2 = 2 + 5 4 + 1 = 5 + 2
1 OA 8
CC1OA8 Work with addition and subtraction equations Determine the unknown whole number in an addition or subtraction equation relating three whole numbers For example determine the unknown number that makes the equation true in each of the equations 8 + = 11 5 = _ ndash 3 6 + 6 = _
1 NBT 1
CC1NBT1 Extend the counting sequence Count to 120 starting at any number less than 120 In this range read and write numerals and represent a number of objects with a written numeral
1 NBT 2
CC1NBT2 Understand place value Understand that the two digits of a two-digit number represent amounts of tens and ones Understand the following as special cases -- a 10 can be thought of as a bundle of ten ones mdash called a ldquotenrdquo -- b The numbers from 11 to 19 are composed of a ten and one two three four five six seven eight or nine ones -- c The numbers 10 20 30 40 50 60 70 80 90 refer to one two three four five six seven eight or nine tens (and 0 ones)
1 NBT 3
CC1NBT3 Understand place value Compare two two-digit numbers based on meanings of the tens and ones digits recording the results of comparisons with the symbols gt = and lt
1 NBT 4
CC1NBT4 Use place value understanding and properties of operations to add and subtract Add within 100 including adding a two-digit number and a one-digit number and adding a two-digit number and a multiple of 10 using concrete models or drawings and strategies based on place value properties of operations andor the relationship between addition and subtraction relate the strategy to a written method and explain the reasoning used Understand that in adding two-digit numbers one adds tens and tens ones and ones and sometimes it is necessary to compose a ten
1 NBT 5
CC1NBT5 Use place value understanding and properties of operations to add and subtract Given a two-digit number mentally find 10 more or 10 less than the number without having to count explain the reasoning used
1 NBT 6 CC1NBT6 Use place value understanding and properties of operations to add and subtract Subtract multiples of 10 in the range 10-90 from multiples of 10 in the range 10-90 (positive or zero differences) using concrete models or drawings and strategies based on place value properties of operations andor
48
Keansburg School DistrictCurriculum System
Mathematicsthe relationship between addition and subtraction relate the strategy to a written method and explain the reasoning used
1 MD 1
CC1MD1 Measure lengths indirectly and by iterating length units Order three objects by length compare the lengths of two objects indirectly by using a third object
1 MD 2
CC1MD2 Measure lengths indirectly and by iterating length units Express the length of an object as a whole number of length units by laying multiple copies of a shorter object (the length unit) end to end understand that the length measurement of an object is the number of same-size length units that span it with no gaps or overlaps Limit to contexts where the object being measured is spanned by a whole number of length units with no gaps or overlaps
1 MD 3CC1MD3 Tell and write time Tell and write time in hours and half-hours using analog and digital clocks
1 MD 4
CC1MD4 Represent and interpret data Organize represent and interpret data with up to three categories ask and answer questions about the total number of data points how many in each category and how many more or less are in one category than in another
1 G 1
CC1G1 Reason with shapes and their attributes Distinguish between defining attributes (eg triangles are closed and three-sided) versus non-defining attributes (eg color orientation overall size) for a wide variety of shapes build and draw shapes to possess defining attributes
1 G 2
CC1G2 Reason with shapes and their attributes Compose two-dimensional shapes (rectangles squares trapezoids triangles half-circles and quarter-circles) or three-dimensional shapes (cubes right rectangular prisms right circular cones and right circular cylinders) to create a composite shape and compose new shapes from the composite shape (Students do not need to learn formal names such as ldquoright rectangular prismrdquo)
1 G 3
CC1G3 Reason with shapes and their attributes Partition circles and rectangles into two and four equal shares describe the shares using the words halves fourths and quarters and use the phrases half of fourth of and quarter of Describe the whole as two of or four of the shares Understand for these examples that decomposing into more equal shares creates smaller shares
49
Keansburg School DistrictCurriculum System
Mathematics
Common Core State Standards Vocabulary
Addition and subtraction within 5 10 20 100 or 1000 Addition or subtraction of two whole numbers with whole number answers and with sum or minuend in the range 0-5 0-10 0-20 or 0-100 respectively Example 8 + 2 = 10 is an addition within 10 14 ndash 5 = 9 is a subtraction within 20 and 55 ndash 18 = 37 is a subtraction within 100
Additive inverses Two numbers whose sum is 0 are additive inverses of one another Example 34 and ndash 34 are additive inverses of one another because 34 + (ndash 34) = (ndash 34) + 34 = 0
Associative property of addition See Table 3 in this Glossary
Associative property of multiplication See Table 3 in this Glossary
Bivariate data Pairs of linked numerical observations Example a list of heights and weights for each player on a football team
Box plot A method of visually displaying a distribution of data values by using the median quartiles and extremes of the data set A box shows the middle 50 of the data1
Commutative property See Table 3 in this Glossary
Complex fraction A fraction AB where A andor B are fractions (B nonzero)
Computation algorithm A set of predefined steps applicable to a class of problems that gives the correct result in every case when the steps are carried out correctly See also computation strategy
Computation strategy Purposeful manipulations that may be chosen for specific problems may not have a fixed order and may be aimed at converting one problem into another See also computation algorithm
Congruent Two plane or solid figures are congruent if one can be obtained from the other by rigid motion (a sequence of rotations reflections and translations)
Counting on A strategy for finding the number of objects in a group without having to count every member of the group For example if a stack of books is known to have 8 books and 3 more books are added to the top it is not necessary to count the stack
50
Keansburg School DistrictCurriculum System
Mathematicsall over again One can find the total by counting onmdashpointing to the top book and saying ldquoeightrdquo following this with ldquonine ten eleven There are eleven books nowrdquo
Dot plot See line plot
Dilation A transformation that moves each point along the ray through the point emanating from a fixed center and multiplies distances from the center by a common scale factor
Expanded form A multi-digit number is expressed in expanded form when it is written as a sum of single-digit multiples of powers of ten For example 643 = 600 + 40 + 3
Expected value For a random variable the weighted average of its possible values with weights given by their respective probabilities
First quartile For a data set with median M the first quartile is the median of the data values less than M Example For the data set 1 3 6 7 10 12 14 15 22 120 the first quartile is 62 See also median third quartile interquartile range
Fraction A number expressible in the form ab where a is a whole number and b is a positive whole number (The word fraction in these standards always refers to a non-negative number) See also rational number
Identity property of 0 See Table 3 in this Glossary
Independently combined probability models Two probability models are said to be combined independently if the probability of each ordered pair in the combined model equals the product of the original probabilities of the two individual outcomes in the ordered pair
Integer A number expressible in the form a or ndasha for some whole number a
Interquartile Range A measure of variation in a set of numerical data the interquartile range is the distance between the first and third quartiles of the data set Example For the data set 1 3 6 7 10 12 14 15 22 120 the interquartile range is 15 ndash 6 = 9 See also first quartile third quartile
Line plot A method of visually displaying a distribution of data values where each data value is shown as a dot or mark above a number line Also known as a dot plot3
51
Keansburg School DistrictCurriculum System
MathematicsMean A measure of center in a set of numerical data computed by adding the values in a list and then dividing by the number of values in the list4 Example For the data set 1 3 6 7 10 12 14 15 22 120 the mean is 21
Mean absolute deviation A measure of variation in a set of numerical data computed by adding the distances between each data value and the mean then dividing by the number of data values Example For the data set 2 3 6 7 10 12 14 15 22 120 the mean absolute deviation is 20
Median A measure of center in a set of numerical data The median of a list of values is the value appearing at the center of a sorted version of the listmdashor the mean of the two central values if the list contains an even number of values Example For the data set 2 3 6 7 10 12 14 15 22 90 the median is 11
Midline In the graph of a trigonometric function the horizontal line halfway between its maximum and minimum values
Multiplication and division within 100 Multiplication or division of two whole numbers with whole number answers and with product or dividend in the range 0-100 Example 72 divide 8 = 9
Multiplicative inverses Two numbers whose product is 1 are multiplicative inverses of one another Example 34 and 43 are multiplicative inverses of one another because 34 times 43 = 43 times 34 = 1
Number line diagram A diagram of the number line used to represent numbers and support reasoning about them In a number line diagram for measurement quantities the interval from 0 to 1 on the diagram represents the unit of measure for the quantity
Percent rate of change A rate of change expressed as a percent Example if a population grows from 50 to 55 in a year it grows by 550 = 10 per year
Probability distribution The set of possible values of a random variable with a probability assigned to each
Properties of operations See Table 3 in this Glossary
Properties of equality See Table 4 in this Glossary
Properties of inequality See Table 5 in this Glossary
Properties of operations See Table 3 in this Glossary
52
Keansburg School DistrictCurriculum System
MathematicsProbability A number between 0 and 1 used to quantify likelihood for processes that have uncertain outcomes (such as tossing a coin selecting a person at random from a group of people tossing a ball at a target or testing for a medical condition)
Probability model A probability model is used to assign probabilities to outcomes of a chance process by examining the nature of the process The set of all outcomes is called the sample space and their probabilities sum to 1 See also uniform probability model
Random variable An assignment of a numerical value to each outcome in a sample space
Rational expression A quotient of two polynomials with a non-zero denominator
Rational number A number expressible in the form ab or ndash ab for some fraction ab The rational numbers include the integers
Rectilinear figure A polygon all angles of which are right angles
Rigid motion A transformation of points in space consisting of a sequence of one or more translations reflections andor rotations Rigid motions are here assumed to preserve distances and angle measures
Repeating decimal The decimal form of a rational number See also terminating decimal
Sample space In a probability model for a random process a list of the individual outcomes that are to be considered
Scatter plot A graph in the coordinate plane representing a set of bivariate data For example the heights and weights of a group of people could be displayed on a scatter plot5
Similarity transformation A rigid motion followed by a dilation
Tape diagram A drawing that looks like a segment of tape used to illustrate number relationships Also known as a strip diagram bar model fraction strip or length model
Terminating decimal A decimal is called terminating if its repeating digit is 0
Third quartile For a data set with median M the third quartile is the median of the data values greater than M Example For the data set 2 3 6 7 10 12 14 15 22 120 the third quartile is 15 See also median first quartile interquartile range
Transitivity principle for indirect measurement If the length of object A is greater than the length of object B and the length of object B is greater than the length of object C then the length of object A is greater than the length of object C This principle applies
53
Keansburg School DistrictCurriculum System
Mathematicsto measurement of other quantities as well
Uniform probability model A probability model which assigns equal probability to all outcomes See also probability model
Vector A quantity with magnitude and direction in the plane or in space defined by an ordered pair or triple of real numbers
Visual fraction model A tape diagram number line diagram or area model
Whole numbers The numbers 0 1 2 3 hellip5
54
- MissionVision Statement
- Beliefs
- Measurement amp Data
- Measure lengths and by iterating length units
- Tell and write time
- Represent and interpret data
- Geometry
- Reason with shapes and their attributes
- Number and Base Ten
- Extend the counting sequence
- Understand place value
-
- Measurement amp Data (II)
-
- Measure lengths and by iterating length units
- Tell and write time
-
- Represent and interpret data
- Geometry (II)
- Reason with shapes their attributes
-
- Number and Base Ten
- Use place value understanding and properties of operations to add and subtract
- Teacher will cover up specific numbers on an enlarged number grid using cover up tape to have students identify numbers before and after Students will come up and write the missing numbers
- Students will play ldquoI have__ Who has __ Teacher will create cards using index cards and numbers in which students need further practice with Students will read their cards aloud Variations of game can include identifying specific numbers identifying numbers more or less etc)
- Students will use base ten blocks to represent numbers including three digit numbers Students will identify representation of numbers through these manipulatives They may match the representation to the written number
- Students will write the number they created using the base ten blocks using their white boards and markers
- Students will arrange given digits to create the greatest and lowest possible numbers They can show each number they create using base ten blocks
- Students will use the Base Ten Exchange Game to show an understanding of exchanging ones for tens and tens for hundreds Students can use place value mats base ten blocks (cubes tens and flats) Students can take number of cubes displayed with roll of single die Students will determine when exchanging can be made when reaching ten units
- Base ten concentration wwwk-5mathteachingresourcescom
- Ten frame compare wwwk-5mathteachingresourcescom
-
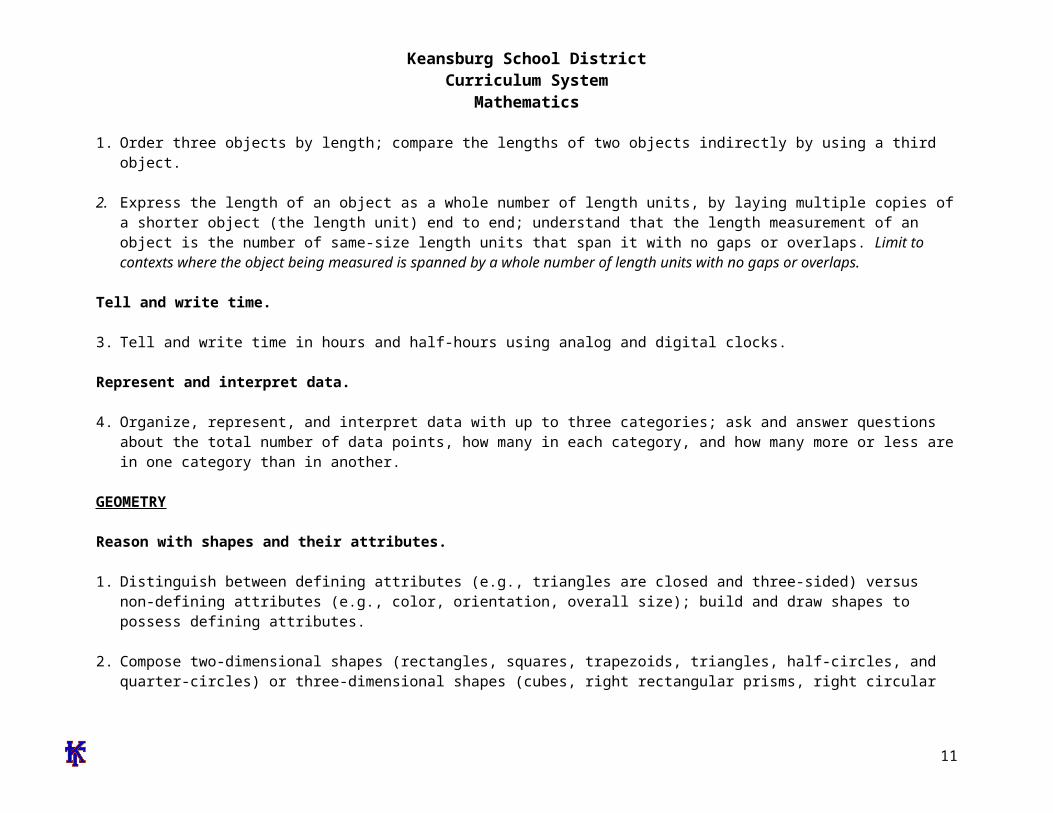
Keansburg School DistrictCurriculum System
Mathematics
Keansburg School DistrictCurriculum Management System
SubjectGradeLevelMathematicsGrade 1
Timeline September-Quarter 1
Topic(s) Number Sense
Significance of Learning Goal(s) To write numbers 0-20
Sugg
este
d D
ays
of
Inst
ruct
ion Content
Standards CPI
Essential Questions
Specific Learning Objective(s)
The Students Will Be Able To
Suggested Activities Instructional Tools Materials Technology Resources Assessments and Assessment Models
CPI KCC1 KCC2 KCC3 KCC6 KOA5 KNBT1
EQ Why is it
important to recognize and write numbers
Concept(s) Kindergarten review of number sense
SWBAT
Identify write and count numbers 0-20
Count objects and represent with a number
Compare and order numbers 0-
Meets Standard Practice counting
numbers 0-20 using nursery rhymes and songs
Order numbers from 0-20 using number cards number tiles (from hundredths board)
Order numbers while understanding words such as before after between Utilize a number line to locate and order numbers
Compare numbers that greater than or less than using games such as Number Line Squeeze
Nursery Rhymes CD Math songs Number cards Number Line Squeeze-number lines Everyday Math cards Straws or popsicle sticks Calendar httpwwwstarfallcomnholidaycalendarloadhtmfampn=main school day count chart weather chart attendance chart class number grid wwwk-5mathteachingresourcescom coins counters
11
Keansburg School DistrictCurriculum System
Mathematics20 through concrete and pictorial models
Count to 100 by ones and tens
Top It and One More One Less Stories
Write numbers from 0-20 Construct numbers 11-19
by bundling groups of ten and then by counting the left over ones
Develop number sense by counting up and counting back using a given number
Incorporate number sense daily through calendar school day count class number grid weather and attendance
Reading counting books Recording tally counts
creating tally charts Find and locate numbers
on the number grid Provide students with
number lines students will need to identify and provide the missing number
Show one more wwwk-5mathteachingresourcescom
Show one less wwwk-5mathteachingresourcescom
One more on the ten frame wwwk-5mathteachingresourcescom
Typical Assessment Question(s) or Task(s) Ask students to count 0-20 Students will be asked to order numbers from 0-20 Compare numbers that greater than or less than Students will display number sense through orally counting up
and counting back using a given number Give students a given number have them identify the given
number on the number grid Have students analyze a tally chart and give the associated
number with this chart
12
Keansburg School DistrictCurriculum System
Mathematics
Exceeds Standard Practice counting
numbers 21-100 Compare numbers
greater than 20 through games
Before and after games Number grid puzzles Counting walk students
estimate step amounts from one location to another Find actual number of steps and compare the two numbers Choose other locations and repeat procedure
Students compose and solve ones and tens riddles
Counting by 5s using nickels
Counting by 10s using dimes
One moreone less scoop wwwk-5mathteachingresourcescom
13
Keansburg School DistrictCurriculum System
Mathematics
Keansburg School DistrictCurriculum Management System
SubjectGradeLevelMathematicsGrade 1
Timeline October-Quarter 1Topic(s) Operations amp Algebraic Expressions
Significance of Learning Goal(s) To solve problems using addition and subtraction within 20
Sugg
este
d
Content Standards CPI Essential
Questions
Specific Learning Objective(s)
The Students Will Be Able To
Suggested ActivitiesInstructional Tools Materials
Technology Resources Assessments and Assessment
Models
CPI 1OA31OA4 1OA5 1OA6 1OA7 1OA8
EQ What questions can
be answered using addition
What strategies can be used to solve problems
How can we tell how many
How does knowing math facts make math easier
How can numbers be helpful
Why do I need to subtract
Concept(s) Working with and solving problems using addition and subtraction within 20
SWBAT
Solve word problems within 20 using real life situations
Understand demonstrate and apply properties of operations for addition
Demonstrate fluency for addition and subtraction within 20 by using strategies to solve
Meets Standard Model a number sentence using
manipulatives and label operation symbols
Use dominoes to create an addition problem and find the sum
Solve addition problems using a number line
Students will develop different ways to solve number stories students will use objects fingers and pictures count onback number line or number grid
Create real life situations in which students will use all number story strategies to solve a problem
Teachers will pose real world number stories to the students students will synthesize pre-existing information that they know to solve the problem
Introduce and devise addition and subtraction number stories posters stating each key word for addition and subtraction operations
Dominoes Number lines Number Grids Number Cards White Boards Dry-Erase markers Pennies
Typical Assessment Question(s) or Task(s)
Students will be asked to solve addition and subtraction problems within 20 within a given time frame
Students will be given a number and be asked to count on from that given number
14
Keansburg School DistrictCurriculum System
Mathematics How do we use
addition and subtraction in our everyday life
Why are fact families important
What strategies can be used to solve problems How is counting on different from just counting to add
What information do you need to know in order to find the total number of something
Why would you need to count back
How are subtraction and addition related
problems Relate counting to
addition by counting on from the higher number
Demonstrate fluency for addition by using strategies such as counting on doubles and doubles plus 1
Combine and mix two sets of 0-10 number cards One partner draws two number cards from the top of the deck students will design and generate a number story using the two numbers Both partners solve the problem in the number story and write the answer on their slate
Use concrete objects to demonstrate the relationship between two addends and the sum
Teacher will model and demonstrate using pictures and objects how objects can be moved around and still come out to equal the same sum
Develop counting on skills by students choosing a number card and partner count on from the given number
Roll two number cubes identify the higher number and count on to find sum
Use technology to show doubles different compliments of 10 songs and raps to help students memorize basic facts Poll students to discover their favorite tune
Play around the world using basic addition facts
Relate addition to subtraction by creating fact families using number cubes dominoes fact family houses etc
Turn around trains wwwk-5mathteachingresourcescom
Domino fact families wwwk-5mathteachingresourcescom
Plus one game wwwk-5mathteachingresourcescom
Students will be given word problems within 20 to solve students will use various strategies and means to solve these problems
15
Keansburg School DistrictCurriculum System
Mathematics One less game wwwk-
5mathteachingresourcescom Doubles facts wwwk-
5mathteachingresourcescom Facts of ten wwwk-
5mathteachingresourcescom Fact family house wwwk-
5mathteachingresourcescom Number sentence math wwwk-
5mathteachingresourcescom Sums of ten wwwk-
5mathteachingresourcescom
Exceeds Standard
In groups or individually students will plan and generate world problems based on real life situations
Teachers will provide pictures of groups of things such as animals people or objects Students will analyze and evaluate the picture and design a number story about the picture
Using number cards or dice create addition sentences draw a picture to represent problem and write an addition number model to correlate with the fact
With 9 10 12 side dice roll two number cubes identify the higher number and count on to find sum
Students will compose their own double facts song
Students create a 4 x 4 double facts mat with double sums Partners roll a 12-sided number cube double the top number showing and X it out on the
16
Keansburg School DistrictCurriculum System
Mathematicsmat First student to get 4 in a row wins
Take two dominoes each representing an addend and have students find the sum
Students use pennies to solve basic addition problems
Students will complete turn around facts Make ten wwwk-
5mathteachingresourcescom Make ten on the ten frame wwwk-
5mathteachingresourcescom What number ishellip wwwk-
5mathteachingresourcescom Make ten square What number ishellip
wwwk-5mathteachingresourcescom Dot card addition What number is
wwwk-5mathteachingresourcescom Addition domino train What number is
wwwk-5mathteachingresourcescom
17
Keansburg School DistrictCurriculum System
MathematicsKeansburg School DistrictCurriculum Management System
SubjectGradeLevelMathematicsGrade 1
Timeline November-Quarter 2
Topic(s) Measurement and Data
Significance of Learning Goal(s) To understand measurement and what tools and used
Sugg
este
d D
ays
of
Inst
ruct
ion Content
Standards CPI Essential Questions
Specific Learning Objective(s)
The Students Will Be Able To
Suggested ActivitiesInstructional Tools Materials
Technology Resources Assessments and Assessment
Models
CPI 1MD1 1MD2 1MD3 1MD4
EQ Why do people
use graphs How is a bar
graph like a tally chart
How would I know if a bar graph correctly shows what is on a tally chart
How could a bar graph answer a question
Concept(s) Understanding what measurement is and what tools are used
SWBAT
Compare and order the length of up to three objects using direct comparisons
Compare the lengths of two objects indirectly by using a third object
Measure objects using non-standard units and express it as a whole number
Draw an object longer or shorter than a given
Meets Standard Teacher will introduce measurement
by holding up objects and the students will examine the objects and explain the size order
o Students will break into groups and compare objects further and classify them depending on their size
Teacher will introduce the ruler Explain to students that the ruler is used to measure objects The students will then explore the classroom and select objects around the room that are smaller and larger than the ruler
Teacher will select specific body parts that the students will use as a personal unit of measurement The students will work in pairs to demonstrate how to measure objects around the room
Rulers Judy Clock Paper Plates Classroom objects Chart paper Jack Hartmann ndash Tick Tock
Song Brainpop Jr White boards Dry Erase markers Clock Concentration
Typical Assessment Question(s) or Task(s)
Analyze a bar graph and answer questions
Create a bar graph using self ndash selected topic
18
Keansburg School DistrictCurriculum System
Mathematics Do bar graphs
make it easier to understand and compare facts Why
What kind of graph should I use to answer questions
Why do I need to tell time
How many hands does a clock have
Are the hands on the clock the same size
How long is a minute
Why do I need to use a calendar
How do we use the clock and the calendar to determine what we will do in school
Why do we need to measure something
What can we use to draw and measure things
What do you think is about 1 inch long
How many steps long do you think it is from
object Organize represent
and interpret data with up to three categories on simple graphs and charts
Analyze and formulate questions based on simple graphs and charts
Identify time to the hour and half hour on both a digital and analog clock
Write time to the hour and half hour on both analog and digital clocks
Draw the hands on an analog clock for a give time to the hour or half hour
Relate times to the half hour to ldquohalf pastrdquo the hour
using their personal unit of measurement
The teacher will select a classroom object and the students will be asked to illustrate objects in the room that are bigger and smaller in size
The students will be able to organize represent and interpret data up to three categories through the use of a bar graph
The teacher will then divide students into heterogeneous groups and encourage the students to explain what they can learn from the graph The students will present findings following activity
Students will choose an object within classroom then find additional objects one being larger the other being shorter using a two-column chart Draw or write the objects in the chart
Create a human clock students will hold 12 numbered plates One student will stand in the middle as the minute and hour hand to model various times
Students will have their own demonstration clocks students will identify and find the hour and minute hands
Students create their own clocks using paper plates students will manipulate hands to identify varying times
Students will listen to Jack Hartman ldquoTick Tockrdquo song
Teachers and students will view clock on videos on brainpopjrcom students
Take 3 objects and order them from smallest to largest and largest to smallest
Read a series of clocks (analog and digital) and tell the time to the hour and half hour
Using blank clocks the students will draw the hands to show a designated time
Use a personal measurement (ie your thumb) to measure the length of an object
19
Keansburg School DistrictCurriculum System
Mathematicsthe front of the classroom to the back
If we measure in footsteps why are some of the measurements different
How is longer and shorter similar to greater and lesser
and teachers can complete quizzes available on website
Teachers will present time on an analog clock students will write the digital time on a white board
Students will play clock concentration
Exceeds Standard
The students will work in pairs to locate objects around the room and compare the lengths against each other The pairs will then work with another pair of students and compare the lengths of their objects with the objects the other pair located
Teacher will introduce the ruler in comparison to the yardstick The students will be encouraged to find objects that in the room that are larger than a ruler and measure using the yardstick
After the teacher introduces units of personal measurement the students will be encouraged to measure object in the room using their own unit of personal measurement and convert it into a standard measurement using a ruler or a yardstick
The teacher will select a classroom object and the students will be asked to illustrate objects in the room that are bigger and smaller by a specific size
The students will be able to organize represent and interpret data up to four
20
Keansburg School DistrictCurriculum System
Mathematicsor more categories through the use of a bar graph
The teacher will then divide students into heterogeneous groups and encourage the students to explain what they can learn from the graph and create a tally chart utilizing the data
Students will create clock flash cards by drawing an analog clock on one side and writing the digital clock time on the other
Give students a clock and a blue number cube ()
21
Keansburg School DistrictCurriculum System
MathematicsKeansburg School DistrictCurriculum Management System
SubjectGradeLevelMathematicsGrade 1
Timeline December-Quarter 2
Topic(s) Geometry
Significance of Learning Goal(s) To identify shapes and their attribures
Sugg
este
d D
ays
of
Inst
ruct
ion Content
Standards CPI Essential
Questions
Specific Learning Objective(s)
The Students Will Be Able To
Suggested Activities
Instructional Tools Materials
Technology Resources
Assessments and Assessment Models
CPI1G1 1G2
EQ Where do
you see shapes in our classroom
Are there different shapes outside
How are geometric figures alike
How can we sort
Concept(s) Identify shapes and their attributes
SWBAT Distinguish
between two and three-dimensional shapes by classifying their attributes For example color shape and size
Compare and contrast shapes based on their attributes
Construct and create shapes
Meets Standard Sorting shapes based on their attributes For example
number of sideso Materials attribute blocks shape card sheet sorting
mat Introduce vocabulary cylinder cube sphere rectangular
prism triangular prism pyramid Classroom shape hunt students go around the room finding shapes within the classroom For example trash can tissue box clock
o Materials shape sheet classroom objects httpilluminationsnctmorgLessonDetailaspxid=L237
Create 3-dimenstion shapes (rectangular prism pyramid cube)
o Straws twist ties shape cards Create 2-dimensional shapes (trapezoid triangle circle
rectangle rhombus)o Pattern block templates attribute blocks pattern
block template stencil geo-boards rubber bands httpilluminationsnctmorgLessonDetailaspx
Attribute blocks Shape card
sheet Sorting mat Twist ties Straws Shape cards Pattern block
templates Attribute blocks Pattern block
template stencil Geo-boards Rubber bands
22
Keansburg School DistrictCurriculum System
Mathematicsobjects of different shapes
How can shapes and solids be described compared and used to make other shapes What are equal parts
What foods do you divide into equal parts
What other items might be divided
How do you know if you have an equal share
possessing certain attributes
Identify and construct two-dimensional shapes
Identify and construct three-dimensional figures
id=L168 Create a drawing using shapes students will create a
picture using the pattern block template stencil (house sun flowers etc)
o Paper pattern block stencil template crayons
Apply understanding of attributes by playing Shape Detective and Attribute Train Game
Demonstrate understanding of 3 Dimensional shapes by playing Whatrsquos My Shape
Exceeds Standard
Introducing and exposing higher vocabulary polyhedronpolyhedra (many faces of a shape) Placing the word onto the word wall
Students read the poem Shapes by Shel Silverstein and create their own illustration of the poem to explore geometric figures and positional words
Materials httpilluminationsnctmorgLessonDetailaspxID=L202
Shapes by Shel Silverstein paper crayons pencils examples of rectangles triangles circles
Compose clues using inferencing to play Guess What Display variety of 3 dimensional shapes Silently choose
an object and give clues about it For example I amsmall I have 2 flat faces and if you trace my faces youwill get circles What am I (tomato can)
Students work together to use pattern blocks to coverother pattern blocks For example how many triangleblocks are needed to cover a hexagon block
Student rotate in groups to visit each geometric solidwhile completing a chart which shows faces sides and
Typical Assessment Question(s) or Task(s)
Ask students how many sides each shape has
Have students classify shapes based on number of sides
Have students identify shapes in the classroom
Have students create 2 and 3 dimensional shapes
Have students design pictures using pattern blockspattern block template
Have students identify and describe assigned shapersquos attributes
Ask students to name 3 dimensional shapes hidden i bag (Whatrsquos my Shape Game)
23
Keansburg School DistrictCurriculum System
Mathematics corners Students compose a shape town by using their pattern
block templates Then students will calculate the totalnumber of each pattern block used
Students will invent new shapes by using three-dimensional shapes
Students will create patterns using three dimensionalshapes
24
Keansburg School DistrictCurriculum System
MathematicsKeansburg School DistrictCurriculum Management System
SubjectGradeLevelMathematicsGrade 1
Timeline January-Quarter 2
Topic(s) Number and Operations in Base Ten
Significance of Learning Goal(s) To recognize compare and understand numbers to 120
Sugg
este
d D
ays
of
Inst
ruct
ion Content
Standards CPI Essential
Questions
Specific Learning Objective(s)
The Students Will Be Able To
Suggested ActivitiesInstructional Tools Materials
Technology Resources Assessments and Assessment
Models
25
Keansburg School DistrictCurriculum System
MathematicsCPI 1NBT1 1NBT2A 1NBT2B 1NBT2C 1NBT3
EQ How do
numbers help us
How can sets of numbers be counted compared and ordered
How can I use numbers to solve problems
How would putting numbers on a chart make it easier to understand information
How can I make it easier to understand numbers when I sort them
What is place value
Concept(s) Recognize compare and understand numbers up to 120
SWBAT Recognize read write
and count 0-120 Understand that a two-
digit number represents amounts of tens and ones
Relate groups of ten to skip counting
Compare two two-digit numbers based on meanings of tens and ones digits using symbols ltgt and =
Meets Standard Teacher will cover up specific numbers
on an enlarged number grid using cover up tape to have students identify numbers before and after Students will come up and write the missing numbers
Students will play ldquoI have__ Who has __ Teacher will create cards using index cards and numbers in which students need further practice with Students will read their cards aloud Variations of game can include identifying specific numbers identifying numbers more or less etc)
Students will use base ten blocks to represent numbers including three digit numbers Students will identify representation of numbers through these manipulatives They may match the representation to the written number
Students will write the number they created using the base ten blocks using their white boards and markers
Students will arrange given digits to create the greatest and lowest possible numbers They can show each number they create using base ten blocks
Students will use the Base Ten Exchange Game to show an
Number grids ldquoI have Who hasrdquo index
cards base ten blocks white boards markers number cards dice ten frame base ten concentration
boards (k-5 math teaching resources)
double ten frame boards (k-5 math teaching resources)
Typical Assessment Question(s) or Task(s)
Recognize numbers 1-120 using flashcards
Write numbers 1-20 using block or graph paper
Build two-digit numbers using tens and ones blocks
Listen and note students skip counting orally by tens to 120
Students compare and label two numbers using relation symbols
26
Keansburg School DistrictCurriculum System
Mathematics Why is place
value important
How can I use place value to compare and order numbers
How can I use the number grid to help me with counting numbers
How many times do you think you can hop in one minute
What does number relationships mean
Why do we need to know how to add
Why do we need to know how to subtract
How are addition and subtraction related
What are doubles
How can
understanding of exchanging ones for tens and tens for hundreds Students can use place value mats base ten blocks (cubes tens and flats) Students can take number of cubes displayed with roll of single die Students will determine when exchanging can be made when reaching ten units
Teens on the ten frame wwwk-5mathteachingresourcescom
Base ten concentration wwwk-5mathteachingresourcescom
Ten frame compare wwwk-5mathteachingresourcescom
Exceeds Standard
Students will create riddles Irsquom thinking of a number that has 4 tens and 13 ones Have students solve the riddle by regrouping the ones to find the answer
-Students use hundreds chart to jump up and down from a number to show 10 more or 10 less
-Students will play Whatrsquos my Number by giving clues based on place value odd or even and number sense For example Irsquom a two digit number The digit in my tens place is 2 more than 4
27
Keansburg School DistrictCurriculum System
Mathematicsdouble facts help us to add and subtract
Does it matter what order you use to add three numbers Why or why not
The digit in my ones place is 3 less than 8 Whatrsquos my number
My double ten frame riddle wwwk-5mathteachingresourcescom
28
Keansburg School DistrictCurriculum System
MathematicsKeansburg School DistrictCurriculum Management System
SubjectGradeLevelMathematicsGrade 1
Timeline February-Quarter 3
Topic(s) Operations amp Algebraic Expressions
Significance of Learning Goal(s) To solve addition and subtraction problems
Sugg
este
d D
ays
of
Inst
ruct
ion Content
Standards CPI
Essential Questions
Specific Learning Objective(s)
The Students Will Be Able To
Suggested ActivitiesInstructional Tools Materials
Technology Resources Assessments and Assessment
Models
CPI1OA31OA4 1OA5 1OA6 1OA7 1OA81OA2
EQ What
questions can be answered using addition
What strategies can be used to solve problems
How can we
Concept(s) Solve addition with and subtraction problems
SWBAT Solve addition problems
with sums up to 20 Use addition within 20 to
solve word problems involving real life situations
Solve word problems that call for addition of three whole numbers up to 20
Solve subtraction problems with difference up to 20
Use subtraction within 20 to solve word problems involving real
Meets Standard Model and have students create their
own individual number sentence using manipulatives and label operation symbols
Students will choose a strategy to solve number stories such as objects fingers and pictures count onback number line or number grid
Create real life situations in which students will use a strategy to solve a number story and create a number model
Review addition and subtraction number stories posters stating each key word for addition and subtraction operations
Combine and mix two sets of 0-20 number cards One partner draws two number cards from the top of the deck students will design and generate a number story using the two numbers
Materials Manipulatives (examples
counting bears connecting cubes pennies counters etc)
Slates dry erase markers erasers
Clear Sheet Protectors Sets of 0-20 number cards Number cards Cardstock Scrabble tiles letter cards
Typical Assessment Question(s) or Task(s)
Students will solve real life
29
Keansburg School DistrictCurriculum System
Mathematicstell how many
How does knowing math facts make math easier
How can numbers be helpful
Why do I need to subtract
How do we use addition and subtraction in our everyday life
Why are fact families important
What strategies can be used to solve problems How is counting on different from just counting to add
What information do you need to know in order to find
life situations Understand subtraction
as an unknown addend problem example subtract 9-5 by finding the number that makes 9 when added to 5
Both partners solve the problem in the number story and write the answer on their slate
Find three cards that have a sum of 12 how many different ways can the student make the sum of 12 using three cards students record work
-Teacher creates real life word problemsinvolving three addends up to 20
Ten frames subtraction wwwk-5mathteachingresourcescom
I have who has wwwk-5mathteachingresourcescom
True or false wwwk-5mathteachingresourcescom
Count to 20 wwwk-5mathteachingresourcescom
Exceeds Standard
Teacher creates multi step word problems for students to solve
Students work with partners or small groups to create real life word problems Compose class book of problems
Three letter addends use scrabble tiles or letter cards with corresponding numbers to make three letter words find
word problems Students will create their
own number sentences own number storiesword problems
Students will create and solve number stories in cooperative learning groups
Students will generate word problems using assigned numbers
30
Keansburg School DistrictCurriculum System
Mathematicsthe total number of something
Why would you need to count back
How are subtraction and addition related
the sum of each word by adding the numbers on the tiles Students will find which words have the greatest or smallest sum
31
Keansburg School DistrictCurriculum System
MathematicsKeansburg School DistrictCurriculum Management System
SubjectGradeLevelMathematicsGrade 1
Timeline March-Quarter 3
Topic(s) Measurement amp Data
Significance of Learning Goal(s) To tell time and compare measurements
Sugg
este
d D
ays
of
Inst
ruct
ion Content
Standards CPI
Essential Questions
Specific Learning Objective(s)
The Students Will Be Able ToSuggested Activities
Instructional Tools Materials Technology Resources
Assessments and Assessment Models
How would I know if a bar graph correctly shows what is on a tally chart
How could a bar graph answer a question
Do bar graphs make it easier to understand and compare facts Why
What kind
Concept(s) Telling time comparing measurements
SWBAT Identify and write time to
the hour and half hour on both a digital and analog clock
Write time to the hour and half-hour on both digital and analog clocks
Draw the hands on the analog clock for a given time to the hour or half-hour
Relate times to the half hour as ldquohalf-pastrdquo the hour
Compare and contrast
Meets Standard Students will have their own
demonstration clocks students will identify and find the hour and minute hands
Students create their own clocks using paper plates students will manipulate hands to identify varying times
Students will listen to Jack Hartman ldquoTick Tockrdquo song
Teachers and students will view clock on videos on brainpopjrcom students and teachers can complete quizzes available on website
Teachers will present time on an analog clock students will write the digital time on a white board
Students will play clock concentration Teacher will introduce measurement by
holding up objects and the students will examine the objects and explain the size
Large Judy Clock Individual student Judy
clocks Wipe off analogdigital clocks Clock stampers Timers Rulers Yardsticks Measuring tapes Sheet protectors Cardstock Paper plates Fasteners Index cards
Typical Assessment Question(s) or Task(s)
Students will be asked to identify and write time to the hour and half hour on both
32
Keansburg School DistrictCurriculum System
Mathematicsof graph should I use to answer questions
Why do I need to tell time
How many hands does a clock have
Are the hands on the clock the same size
How long is a minute
Why do I need to use a calendar
How do we use the clock and the calendar to determine what we will do in school
Why do we need to measure something
What can
objects by length Construct objects at
contrasting lengths
ordero Students will break into groups
and compare objects further and classify them depending on their size
Teacher will introduce the ruler Explain to students that the ruler is used to measure objects The students will then explore the classroom and select objects around the room that are smaller and larger than the ruler
Teacher will select specific body parts that the students will use as a personal unit of measurement The students will work in pairs to demonstrate how to measure objects around the room using their personal unit of measurement
The teacher will select a classroom object and the students will be asked to illustrate objects in the room that are bigger and smaller in size
The students will be able to organize represent and interpret data up to three categories through the use of a bar graph
The teacher will then divide students into heterogeneous groups and encourage the students to explain what they can learn from the graph The students will present findings following activity
Students will choose an object within classroom then find additional objects one being larger the other being shorter using a two-column chart Draw or write the objects in the chart
digital and analog clocks Students will be asked to
identify the parts of a clock students will be asked to draw the hands on an analog clock for a given time to the hour or half-hour
Students will be given various objects and will further be asked to compare and contrast the lengths of these objects
Students will be asked to provide or create objects contrasting lengths to demonstrate understanding of differences in length
33
Keansburg School DistrictCurriculum System
Mathematicswe use to draw and measure things
What do you think is about 1 inch long
How many steps long do you think it is from the front of the classroom to the back
If we measure in footsteps why are some of the measurements different
How is longer and shorter similar to greater and lesser
Exceeds Standard
The students will work in pairs to locate objects around the room and compare the lengths against each other The pairs will then work with another pair of students and compare the lengths of their objects with the objects the other pair located
Teacher will introduce the ruler in comparison to the yardstick The students will be encouraged to find objects that in the room that are larger than a ruler and measure using the yardstick
After the teacher introduces units of personal measurement the students will be encouraged to measure object in the room using their own unit of personal measurement and convert it into a standard measurement using a ruler or a yardstick
The teacher will select a classroom object and the students will be asked to illustrate objects in the room that are bigger and smaller by a specific size
The students will be able to organize represent and interpret data up to four or more categories through the use of a bar graph
The teacher will then divide students into heterogeneous groups and encourage the students to explain what they can learn from the graph and create a tally chart utilizing the data
Students will create clock flash cards by
34
Keansburg School DistrictCurriculum System
Mathematicsdrawing an analog clock on one side and writing the digital clock time on the other Students will include time in five minute intervals
Pose word problems where students have to find elapse time to the hour and half hour
Introduce second hand and conduct activities that are timed in seconds (Examples hopping on 1 foot blinking eyes counting to the highest number)
35
Keansburg School DistrictCurriculum System
MathematicsKeansburg School DistrictCurriculum Management System
SubjectGradeLevelMathematicsGrade 1
Timeline April-Quarter 4
Topic(s) Geometry
Significance of Learning Goal(s) To identify two and three dimensional shapes to understand fractional parts and create equal shares
Sugg
este
d D
ays
of
Inst
ruct
ion Content
Standards CPI Essential
Questions
Specific Learning Objective(s)
The Students Will Be Able To
Suggested ActivitiesInstructional Tools Materials
Technology Resources Assessments and Assessment
Models
Are there different shapes outside
How are geometric figures alike
How can we sort objects of different shapes
How can shapes and solids be described compared and used to make other shapes
Concept(s) Two and three dimensional shapes fractional parts equal shares
SWBAT
Combine two-dimensional or three-dimensional shapes or figures to create a new composite shape and identify the shapes within
Identify fractional parts of circles and rectangles into equal shares while developing vocabulary for halves fourths and quarters
Describe the whole as
Meets Standard
Determine which shape by touch without using their sight
o Materials attribute blocks shape sheet feely box wwwilluminationsnctmorglessondetail
Sorting 3-dimensional objects students will be given cards with 3-dimensional objects (trash can soup can globe ball tissue box box dice) they will sort them based on the 3-dimensional shape they represent
o 3-dimensional object cards sorting mats
Pizza and Cake Fractions students will utilize a pizza and a cake to work on the concept of fractions while developing the vocabulary halves quarters and fourths
o Materials teacher created pizza
Attribute blocks Geometric shapes 3-dimensional object
cards Sorting maps 3-dimensional shapes Solid and lane figures Geo-boards and rubber
bands Fraction circles Sheet protectors 2-dimensional shapes
Typical Assessment Question(s) or Task(s)
Students will be asked to describe and identify
36
Keansburg School DistrictCurriculum System
MathematicsWhat are equal parts
What foods do you divide into equal parts
What other items might be divided
How do you know if you have an equal share
two of or four of the shares Understand for these examples that decomposing into more equal shares creates smaller shares
and cake that are cut into fractions (construction paper)
Students will illustrate a picture of a boat using at least one three dimensional shape in their drawings Shapes include cubes cylinders spheres cones and rectangular prisms
Solid and Plane Figures Name the Face activity Provide three-dimensional objects Have students draw the face for each object as well as name the shape Examples ABC block juice can book party hat
Introduce fractions by having students identify shapes that show equal parts Display cut out shapes using document camera Include some shapes that are divided equally and some that are not divided equally As a whole group sort shapes into two categories Then have students go back to their desks and work with a partner to classify additional shapes
Provide students with shapes that are divided into four parts Include shapes that are divided into four equal parts and others that are unequal Students identify the shapes that are divided into four equal parts and explain their reasoning
Shape Town activity Students will design a shape town using the following shapes
shapes within combined two and three-dimensional shapes
Students will be given circles and rectangles students will be asked to divide these shapes into halves fourths and quarters
Students will be asked to sort shapes that are divided equally and not divided equally
37
Keansburg School DistrictCurriculum System
Mathematicstrapezoid hexagon square triangle and circle Afterwards students will calculate the total number of each shape they included After completing the activity students will present their final product to the class and explain how they decided which shapes to use
Given an array of dots students will draw shapes with specific number of sides and corners and connect the dots to create the shapes Example Draw a shape with 5 sides Draw a shape with 6 corners
Students will create two-dimensional shapes on geoboards Then using different colored rubber bands students will divide the shapes into equal parts Students will transfer their equally divided shapes onto geoboard paper by drawing lines to show their equal parts
Play the Fraction Path Game Materials Fraction circles a circle with frac12 shaded a circle with 13 shaded and a circle with frac14 shaded Gameboard Path consisting of assorted shapes divided into halves thirds and fourths Players Needed 3 Directions Place the fraction circles facedown Players close their eyes and pick one fraction circle Each player follows the path from start to finish Each player looks at each shape on the path and records how many shapes show their fractions Players record
38
Keansburg School DistrictCurriculum System
Mathematicstheir results on paper using tally marks At end of game students compare total number of shapes that show their fraction
Exceeds Standard
39
Keansburg School DistrictCurriculum System
MathematicsKeansburg School DistrictCurriculum Management System
SubjectGradeLevelMathematicsGrade 1
Timeline May-Quarter 4
Topic(s) Number and Operations in Base Ten
Significance of Learning Goal(s) To use place value to add and subtract
Sugg
este
d D
ays
of
Inst
ruct
ion Content
Standards CPI Essential
Questions
Specific Learning Objective(s)
The Students Will Be Able ToSuggested Activities
Instructional Tools Materials Technology Resources
Assessments and Assessment Models
40
Keansburg School DistrictCurriculum System
MathematicsCPI 1NBT4 1NBT5 1NBT6
EQ How do
numbers help us
How can sets of numbers be counted compared and ordered
How can I use numbers to solve problems
How would putting numbers on a chart make it easier to understand information
How can I make it easier to understand numbers when I sort them
What is place value
Why is place value important
How can I
Concept(s) Use place value and properties of operations to add and subtract
SWBAT Use mental math to find
10 more or ten less than a given two-digit number and explain reasoning used within any number to 120
Use place value to add within 100 add a two-digit number to a one-digit number and add a two-digit number to a multiple of ten
Understand when adding two-digit numbers that ones add to the ones and tens add to the tens and sometimes it is necessary to compose a ten by regrouping
For all above objects students will use concrete models and strategies based on place value and relate the strategy to a written method and explain the reasoning used
Subtract multiples of 10 in the range 10-90 from multiples of 10 in the range 10-90 using
Meets Standard
Comparing two digit numbers wwwk-5mathteachingresourcescom
Subtraction split wwwk-5mathteachingresourcescom
Ten more wwwk-5mathteachingresourcescom
Addition split wwwk-5mathteachingresourcescom
Exceeds Standard
Comparing 3-Digit numbers wwwk-5mathteachingresourcescom
What number is wwwk-5mathteachingresourcescom
Students develop addition and subtraction number stories and have partners solve
Create pictures using basendash10 blocks Students trace picture onto paper label the base ten blocks with their value and add total
Solve number grid puzzles by adding and subtraction 10 on the number grid
Number cards Base 10 blocks Counters Number grid puzzles Sleeve protectors wwwk-
5mathteachingresourcescom
Dice
Typical Assessment Question(s) or Task(s)
Recognize numbers 1-120 using flashcards
Write numbers 1-20 using block or graph paper
Build two-digit numbers using tens and ones blocks
Listen and note students skip counting orally by tens to 120
Students compare and label two numbers using relation symbols
41
Keansburg School DistrictCurriculum System
Mathematics
42
Keansburg School DistrictCurriculum System
MathematicsKeansburg School DistrictCurriculum Management System
SubjectGradeLevelMathematicsGrade 1
Timeline June-Quarter 4
Topic(s) Readiness skills for September of Grade 2
Significance of Learning Goal(s) To compare larger numbers add fluently and apply measurement skills
Sugg
este
d D
ays
of
Inst
ruct
ion Content
Standards CPI Essential Questions
Specific Learning Objective(s)
The Students Will Be Able ToSuggested Activities
Instructional Tools Materials Technology Resources
Assessments and Assessment Models
CPI
EQ How can I use
place value to compare and
order numbers in the 100s
How can mastering basic addition and subtraction facts help me compute larger numbers
How can I tie in
Concept(s)Use place value to compare larger numbers fluently add up to 20 apply measurement skills
SWBAT Extend place value into
the hundreds place and re-write and construct models beyond the hundreds
Fluently add and subtract within 20 using mental strategies
Apply measurement skills
Meets Standard Place Value barrier game httpwwwk-
5mathteachingresourcescommath-gameshtml (place value only)
High card
httpwwwlearningboxcomBase10 BaseTenhtml
Time barrier game httpwwwk-5mathteachingresourcescomsupport-filestimebarriergamepdf httpwwwk-5mathteachingresourcescomsupport-filestimebarriergamegridpdf
My favorite time of day writing activity
number cards base ten blocks rulers tape measurer string number relationship mat paper plates cotton balls judy clock digital clock
Typical Assessment Question(s) or Task(s)
Students will solve addition and subtraction problems within 20 in a given time
43
Keansburg School DistrictCurriculum System
Mathematicsmeasurement skills with real life experiences
httpwwwk-5mathteachingresourcescomsupport-filesmy-favorite-time-of-daypdf
Estimating length httpwwwk-5mathteachingresourcescomsupport-filesestimatinglengthpdf
Olympic golf plastic golf clubs cotton balls and tape measurer
Olympic smiles measuring smiles with string and rulers
Olympic Frisbee using paper plates and tape measurer
Olympic airplane students will make paper airplanes measure the distance that they can throw their airplane
Doubles plus 1 game httpwwwk-5mathteachingresourcescomsupport-filesdoubles-plus-onepdf
Eleven more httpwwwk-5mathteachingresourcescomsupport-fileselevenmorepdf
frame Students will be asked to
measure items using inches and centimeters
Identify and create numbers with place values extending into the hundreds place
44
Keansburg School DistrictCurriculum System
Mathematics
Building numbers with base ten blocks pick three cards and arrange them to show a 3-digit number build that number with base ten blocks repeat with the same three cards until no new numbers can be made
Length strength inches httpwwwharcourtschoolcomactivitylength_strength1_inches
Length strength centimeters httpwwwharcourtschoolcomactivitylength_strength1_centi
Exceeds Standard
Number relationship mat wwwk-5mathteachingresourcescom
Place value barrier game httpwwwk-5mathteachingresourcescommath-gameshtml (integrate other skills into place values for example the digit in my 10s place is four doubled)
Measuring the mousersquos path httpwwwk-5mathteachingresourcescomsupport-filespaths1pdf
45
Keansburg School DistrictCurriculum System
Mathematics
Double minus 1 game httpwwwk-5mathteachingresourcescomsupport-filesdoubles-minus-onepdf
Number relationship mat httpwwwk-5mathteachingresourcescomsupport-filesnumberrelationshipmatpdf
46
Keansburg School DistrictCurriculum System
Mathematicsignment Matrices of Common Core State Standards
Grade Strand Standard Standard
Sept
embe
r ndash
Oct
ober
Nov
embe
r ndash
Dec
embe
r
Janu
ary
ndash Fe
brua
ry
Mar
ch ndash
Apr
il
May
- Ju
ne
1 OA 1
CC1OA1 Represent and solve problems involving addition and subtraction Use addition and subtraction within 20 to solve word problems involving situations of adding to taking from putting together taking apart and comparing with unknowns in all positions eg by using objects drawings and equations with a symbol for the unknown number to represent the problem
1 OA 2
CC1OA2 Represent and solve problems involving addition and subtraction Solve word problems that call for addition of three whole numbers whose sum is less than or equal to 20 eg by using objects drawings and equations with a symbol for the unknown number to represent the problem
1 OA 3
CC1OA3 Understand and apply properties of operations and the relationship between addition and subtraction Apply properties of operations as strategies to add and subtract Examples If 8 + 3 = 11 is known then 3 + 8 = 11 is also known (Commutative property of addition) To add 2 + 6 + 4 the second two numbers can be added to make a ten so 2 + 6 + 4 = 2 + 10 = 12 (Associative property of addition) (Students need not use formal terms for these properties)
1 OA 4
CC1OA4 Understand and apply properties of operations and the relationship between addition and subtraction Understand subtraction as an unknown-addend problem For example subtract 10 ndash 8 by finding the number that makes 10 when added to 8
1 OA 5 CC1OA5 Add and subtract within 20 Relate counting to addition and subtraction (eg by counting on 2 to add 2)
1 OA 6 CC1OA6 Add and subtract within 20 Add and subtract within 20 demonstrating fluency for addition and subtraction within 10 Use strategies such as counting on making ten (eg 8 + 6 = 8 + 2 + 4 = 10 + 4 = 14) decomposing a number leading to a ten (eg 13 ndash 4 = 13 ndash 3 ndash 1 = 10 ndash 1 = 9) using the relationship between addition and subtraction (eg knowing that 8 + 4
47
Keansburg School DistrictCurriculum System
Mathematics= 12 one knows 12 ndash 8 = 4) and creating equivalent but easier or known sums (eg adding 6 + 7 by creating the known equivalent 6 + 6 + 1 = 12 + 1 = 13)
1 OA 7
CC1OA7 Work with addition and subtraction equations Understand the meaning of the equal sign and determine if equations involving addition and subtraction are true or false For example which of the following equations are true and which are false 6 = 6 7 = 8 ndash 1 5 + 2 = 2 + 5 4 + 1 = 5 + 2
1 OA 8
CC1OA8 Work with addition and subtraction equations Determine the unknown whole number in an addition or subtraction equation relating three whole numbers For example determine the unknown number that makes the equation true in each of the equations 8 + = 11 5 = _ ndash 3 6 + 6 = _
1 NBT 1
CC1NBT1 Extend the counting sequence Count to 120 starting at any number less than 120 In this range read and write numerals and represent a number of objects with a written numeral
1 NBT 2
CC1NBT2 Understand place value Understand that the two digits of a two-digit number represent amounts of tens and ones Understand the following as special cases -- a 10 can be thought of as a bundle of ten ones mdash called a ldquotenrdquo -- b The numbers from 11 to 19 are composed of a ten and one two three four five six seven eight or nine ones -- c The numbers 10 20 30 40 50 60 70 80 90 refer to one two three four five six seven eight or nine tens (and 0 ones)
1 NBT 3
CC1NBT3 Understand place value Compare two two-digit numbers based on meanings of the tens and ones digits recording the results of comparisons with the symbols gt = and lt
1 NBT 4
CC1NBT4 Use place value understanding and properties of operations to add and subtract Add within 100 including adding a two-digit number and a one-digit number and adding a two-digit number and a multiple of 10 using concrete models or drawings and strategies based on place value properties of operations andor the relationship between addition and subtraction relate the strategy to a written method and explain the reasoning used Understand that in adding two-digit numbers one adds tens and tens ones and ones and sometimes it is necessary to compose a ten
1 NBT 5
CC1NBT5 Use place value understanding and properties of operations to add and subtract Given a two-digit number mentally find 10 more or 10 less than the number without having to count explain the reasoning used
1 NBT 6 CC1NBT6 Use place value understanding and properties of operations to add and subtract Subtract multiples of 10 in the range 10-90 from multiples of 10 in the range 10-90 (positive or zero differences) using concrete models or drawings and strategies based on place value properties of operations andor
48
Keansburg School DistrictCurriculum System
Mathematicsthe relationship between addition and subtraction relate the strategy to a written method and explain the reasoning used
1 MD 1
CC1MD1 Measure lengths indirectly and by iterating length units Order three objects by length compare the lengths of two objects indirectly by using a third object
1 MD 2
CC1MD2 Measure lengths indirectly and by iterating length units Express the length of an object as a whole number of length units by laying multiple copies of a shorter object (the length unit) end to end understand that the length measurement of an object is the number of same-size length units that span it with no gaps or overlaps Limit to contexts where the object being measured is spanned by a whole number of length units with no gaps or overlaps
1 MD 3CC1MD3 Tell and write time Tell and write time in hours and half-hours using analog and digital clocks
1 MD 4
CC1MD4 Represent and interpret data Organize represent and interpret data with up to three categories ask and answer questions about the total number of data points how many in each category and how many more or less are in one category than in another
1 G 1
CC1G1 Reason with shapes and their attributes Distinguish between defining attributes (eg triangles are closed and three-sided) versus non-defining attributes (eg color orientation overall size) for a wide variety of shapes build and draw shapes to possess defining attributes
1 G 2
CC1G2 Reason with shapes and their attributes Compose two-dimensional shapes (rectangles squares trapezoids triangles half-circles and quarter-circles) or three-dimensional shapes (cubes right rectangular prisms right circular cones and right circular cylinders) to create a composite shape and compose new shapes from the composite shape (Students do not need to learn formal names such as ldquoright rectangular prismrdquo)
1 G 3
CC1G3 Reason with shapes and their attributes Partition circles and rectangles into two and four equal shares describe the shares using the words halves fourths and quarters and use the phrases half of fourth of and quarter of Describe the whole as two of or four of the shares Understand for these examples that decomposing into more equal shares creates smaller shares
49
Keansburg School DistrictCurriculum System
Mathematics
Common Core State Standards Vocabulary
Addition and subtraction within 5 10 20 100 or 1000 Addition or subtraction of two whole numbers with whole number answers and with sum or minuend in the range 0-5 0-10 0-20 or 0-100 respectively Example 8 + 2 = 10 is an addition within 10 14 ndash 5 = 9 is a subtraction within 20 and 55 ndash 18 = 37 is a subtraction within 100
Additive inverses Two numbers whose sum is 0 are additive inverses of one another Example 34 and ndash 34 are additive inverses of one another because 34 + (ndash 34) = (ndash 34) + 34 = 0
Associative property of addition See Table 3 in this Glossary
Associative property of multiplication See Table 3 in this Glossary
Bivariate data Pairs of linked numerical observations Example a list of heights and weights for each player on a football team
Box plot A method of visually displaying a distribution of data values by using the median quartiles and extremes of the data set A box shows the middle 50 of the data1
Commutative property See Table 3 in this Glossary
Complex fraction A fraction AB where A andor B are fractions (B nonzero)
Computation algorithm A set of predefined steps applicable to a class of problems that gives the correct result in every case when the steps are carried out correctly See also computation strategy
Computation strategy Purposeful manipulations that may be chosen for specific problems may not have a fixed order and may be aimed at converting one problem into another See also computation algorithm
Congruent Two plane or solid figures are congruent if one can be obtained from the other by rigid motion (a sequence of rotations reflections and translations)
Counting on A strategy for finding the number of objects in a group without having to count every member of the group For example if a stack of books is known to have 8 books and 3 more books are added to the top it is not necessary to count the stack
50
Keansburg School DistrictCurriculum System
Mathematicsall over again One can find the total by counting onmdashpointing to the top book and saying ldquoeightrdquo following this with ldquonine ten eleven There are eleven books nowrdquo
Dot plot See line plot
Dilation A transformation that moves each point along the ray through the point emanating from a fixed center and multiplies distances from the center by a common scale factor
Expanded form A multi-digit number is expressed in expanded form when it is written as a sum of single-digit multiples of powers of ten For example 643 = 600 + 40 + 3
Expected value For a random variable the weighted average of its possible values with weights given by their respective probabilities
First quartile For a data set with median M the first quartile is the median of the data values less than M Example For the data set 1 3 6 7 10 12 14 15 22 120 the first quartile is 62 See also median third quartile interquartile range
Fraction A number expressible in the form ab where a is a whole number and b is a positive whole number (The word fraction in these standards always refers to a non-negative number) See also rational number
Identity property of 0 See Table 3 in this Glossary
Independently combined probability models Two probability models are said to be combined independently if the probability of each ordered pair in the combined model equals the product of the original probabilities of the two individual outcomes in the ordered pair
Integer A number expressible in the form a or ndasha for some whole number a
Interquartile Range A measure of variation in a set of numerical data the interquartile range is the distance between the first and third quartiles of the data set Example For the data set 1 3 6 7 10 12 14 15 22 120 the interquartile range is 15 ndash 6 = 9 See also first quartile third quartile
Line plot A method of visually displaying a distribution of data values where each data value is shown as a dot or mark above a number line Also known as a dot plot3
51
Keansburg School DistrictCurriculum System
MathematicsMean A measure of center in a set of numerical data computed by adding the values in a list and then dividing by the number of values in the list4 Example For the data set 1 3 6 7 10 12 14 15 22 120 the mean is 21
Mean absolute deviation A measure of variation in a set of numerical data computed by adding the distances between each data value and the mean then dividing by the number of data values Example For the data set 2 3 6 7 10 12 14 15 22 120 the mean absolute deviation is 20
Median A measure of center in a set of numerical data The median of a list of values is the value appearing at the center of a sorted version of the listmdashor the mean of the two central values if the list contains an even number of values Example For the data set 2 3 6 7 10 12 14 15 22 90 the median is 11
Midline In the graph of a trigonometric function the horizontal line halfway between its maximum and minimum values
Multiplication and division within 100 Multiplication or division of two whole numbers with whole number answers and with product or dividend in the range 0-100 Example 72 divide 8 = 9
Multiplicative inverses Two numbers whose product is 1 are multiplicative inverses of one another Example 34 and 43 are multiplicative inverses of one another because 34 times 43 = 43 times 34 = 1
Number line diagram A diagram of the number line used to represent numbers and support reasoning about them In a number line diagram for measurement quantities the interval from 0 to 1 on the diagram represents the unit of measure for the quantity
Percent rate of change A rate of change expressed as a percent Example if a population grows from 50 to 55 in a year it grows by 550 = 10 per year
Probability distribution The set of possible values of a random variable with a probability assigned to each
Properties of operations See Table 3 in this Glossary
Properties of equality See Table 4 in this Glossary
Properties of inequality See Table 5 in this Glossary
Properties of operations See Table 3 in this Glossary
52
Keansburg School DistrictCurriculum System
MathematicsProbability A number between 0 and 1 used to quantify likelihood for processes that have uncertain outcomes (such as tossing a coin selecting a person at random from a group of people tossing a ball at a target or testing for a medical condition)
Probability model A probability model is used to assign probabilities to outcomes of a chance process by examining the nature of the process The set of all outcomes is called the sample space and their probabilities sum to 1 See also uniform probability model
Random variable An assignment of a numerical value to each outcome in a sample space
Rational expression A quotient of two polynomials with a non-zero denominator
Rational number A number expressible in the form ab or ndash ab for some fraction ab The rational numbers include the integers
Rectilinear figure A polygon all angles of which are right angles
Rigid motion A transformation of points in space consisting of a sequence of one or more translations reflections andor rotations Rigid motions are here assumed to preserve distances and angle measures
Repeating decimal The decimal form of a rational number See also terminating decimal
Sample space In a probability model for a random process a list of the individual outcomes that are to be considered
Scatter plot A graph in the coordinate plane representing a set of bivariate data For example the heights and weights of a group of people could be displayed on a scatter plot5
Similarity transformation A rigid motion followed by a dilation
Tape diagram A drawing that looks like a segment of tape used to illustrate number relationships Also known as a strip diagram bar model fraction strip or length model
Terminating decimal A decimal is called terminating if its repeating digit is 0
Third quartile For a data set with median M the third quartile is the median of the data values greater than M Example For the data set 2 3 6 7 10 12 14 15 22 120 the third quartile is 15 See also median first quartile interquartile range
Transitivity principle for indirect measurement If the length of object A is greater than the length of object B and the length of object B is greater than the length of object C then the length of object A is greater than the length of object C This principle applies
53
Keansburg School DistrictCurriculum System
Mathematicsto measurement of other quantities as well
Uniform probability model A probability model which assigns equal probability to all outcomes See also probability model
Vector A quantity with magnitude and direction in the plane or in space defined by an ordered pair or triple of real numbers
Visual fraction model A tape diagram number line diagram or area model
Whole numbers The numbers 0 1 2 3 hellip5
54
- MissionVision Statement
- Beliefs
- Measurement amp Data
- Measure lengths and by iterating length units
- Tell and write time
- Represent and interpret data
- Geometry
- Reason with shapes and their attributes
- Number and Base Ten
- Extend the counting sequence
- Understand place value
-
- Measurement amp Data (II)
-
- Measure lengths and by iterating length units
- Tell and write time
-
- Represent and interpret data
- Geometry (II)
- Reason with shapes their attributes
-
- Number and Base Ten
- Use place value understanding and properties of operations to add and subtract
- Teacher will cover up specific numbers on an enlarged number grid using cover up tape to have students identify numbers before and after Students will come up and write the missing numbers
- Students will play ldquoI have__ Who has __ Teacher will create cards using index cards and numbers in which students need further practice with Students will read their cards aloud Variations of game can include identifying specific numbers identifying numbers more or less etc)
- Students will use base ten blocks to represent numbers including three digit numbers Students will identify representation of numbers through these manipulatives They may match the representation to the written number
- Students will write the number they created using the base ten blocks using their white boards and markers
- Students will arrange given digits to create the greatest and lowest possible numbers They can show each number they create using base ten blocks
- Students will use the Base Ten Exchange Game to show an understanding of exchanging ones for tens and tens for hundreds Students can use place value mats base ten blocks (cubes tens and flats) Students can take number of cubes displayed with roll of single die Students will determine when exchanging can be made when reaching ten units
- Base ten concentration wwwk-5mathteachingresourcescom
- Ten frame compare wwwk-5mathteachingresourcescom
-
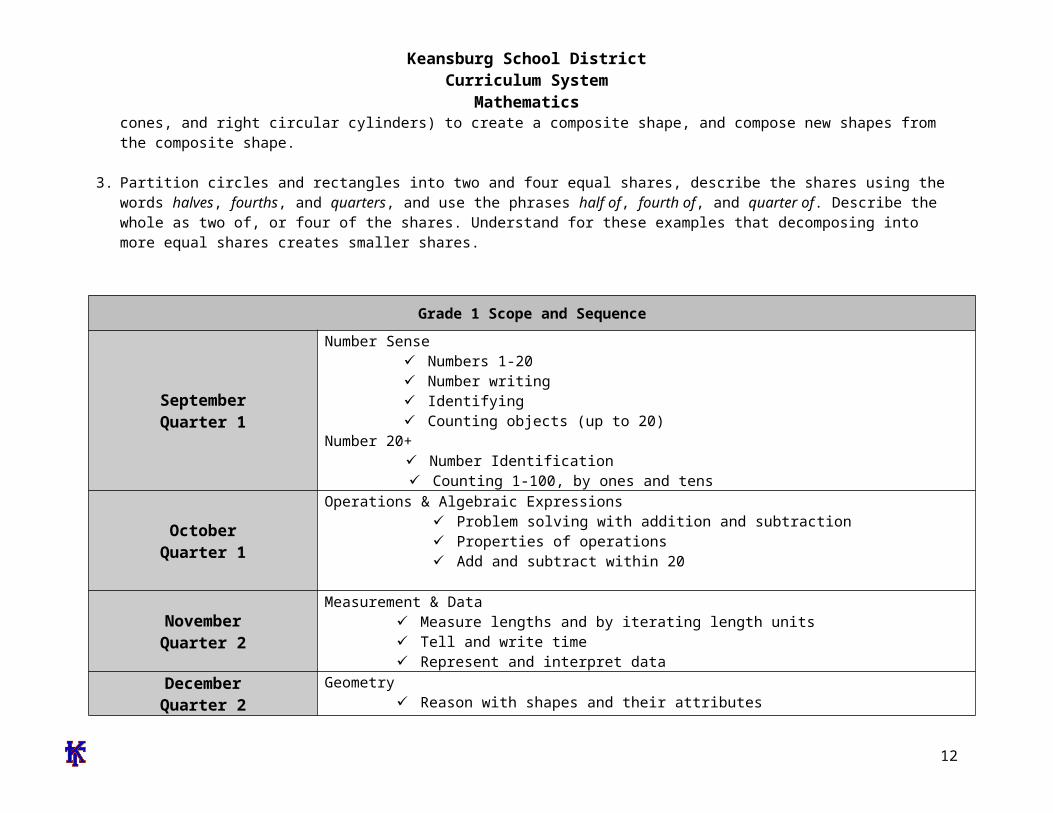
Keansburg School DistrictCurriculum System
Mathematics20 through concrete and pictorial models
Count to 100 by ones and tens
Top It and One More One Less Stories
Write numbers from 0-20 Construct numbers 11-19
by bundling groups of ten and then by counting the left over ones
Develop number sense by counting up and counting back using a given number
Incorporate number sense daily through calendar school day count class number grid weather and attendance
Reading counting books Recording tally counts
creating tally charts Find and locate numbers
on the number grid Provide students with
number lines students will need to identify and provide the missing number
Show one more wwwk-5mathteachingresourcescom
Show one less wwwk-5mathteachingresourcescom
One more on the ten frame wwwk-5mathteachingresourcescom
Typical Assessment Question(s) or Task(s) Ask students to count 0-20 Students will be asked to order numbers from 0-20 Compare numbers that greater than or less than Students will display number sense through orally counting up
and counting back using a given number Give students a given number have them identify the given
number on the number grid Have students analyze a tally chart and give the associated
number with this chart
12
Keansburg School DistrictCurriculum System
Mathematics
Exceeds Standard Practice counting
numbers 21-100 Compare numbers
greater than 20 through games
Before and after games Number grid puzzles Counting walk students
estimate step amounts from one location to another Find actual number of steps and compare the two numbers Choose other locations and repeat procedure
Students compose and solve ones and tens riddles
Counting by 5s using nickels
Counting by 10s using dimes
One moreone less scoop wwwk-5mathteachingresourcescom
13
Keansburg School DistrictCurriculum System
Mathematics
Keansburg School DistrictCurriculum Management System
SubjectGradeLevelMathematicsGrade 1
Timeline October-Quarter 1Topic(s) Operations amp Algebraic Expressions
Significance of Learning Goal(s) To solve problems using addition and subtraction within 20
Sugg
este
d
Content Standards CPI Essential
Questions
Specific Learning Objective(s)
The Students Will Be Able To
Suggested ActivitiesInstructional Tools Materials
Technology Resources Assessments and Assessment
Models
CPI 1OA31OA4 1OA5 1OA6 1OA7 1OA8
EQ What questions can
be answered using addition
What strategies can be used to solve problems
How can we tell how many
How does knowing math facts make math easier
How can numbers be helpful
Why do I need to subtract
Concept(s) Working with and solving problems using addition and subtraction within 20
SWBAT
Solve word problems within 20 using real life situations
Understand demonstrate and apply properties of operations for addition
Demonstrate fluency for addition and subtraction within 20 by using strategies to solve
Meets Standard Model a number sentence using
manipulatives and label operation symbols
Use dominoes to create an addition problem and find the sum
Solve addition problems using a number line
Students will develop different ways to solve number stories students will use objects fingers and pictures count onback number line or number grid
Create real life situations in which students will use all number story strategies to solve a problem
Teachers will pose real world number stories to the students students will synthesize pre-existing information that they know to solve the problem
Introduce and devise addition and subtraction number stories posters stating each key word for addition and subtraction operations
Dominoes Number lines Number Grids Number Cards White Boards Dry-Erase markers Pennies
Typical Assessment Question(s) or Task(s)
Students will be asked to solve addition and subtraction problems within 20 within a given time frame
Students will be given a number and be asked to count on from that given number
14
Keansburg School DistrictCurriculum System
Mathematics How do we use
addition and subtraction in our everyday life
Why are fact families important
What strategies can be used to solve problems How is counting on different from just counting to add
What information do you need to know in order to find the total number of something
Why would you need to count back
How are subtraction and addition related
problems Relate counting to
addition by counting on from the higher number
Demonstrate fluency for addition by using strategies such as counting on doubles and doubles plus 1
Combine and mix two sets of 0-10 number cards One partner draws two number cards from the top of the deck students will design and generate a number story using the two numbers Both partners solve the problem in the number story and write the answer on their slate
Use concrete objects to demonstrate the relationship between two addends and the sum
Teacher will model and demonstrate using pictures and objects how objects can be moved around and still come out to equal the same sum
Develop counting on skills by students choosing a number card and partner count on from the given number
Roll two number cubes identify the higher number and count on to find sum
Use technology to show doubles different compliments of 10 songs and raps to help students memorize basic facts Poll students to discover their favorite tune
Play around the world using basic addition facts
Relate addition to subtraction by creating fact families using number cubes dominoes fact family houses etc
Turn around trains wwwk-5mathteachingresourcescom
Domino fact families wwwk-5mathteachingresourcescom
Plus one game wwwk-5mathteachingresourcescom
Students will be given word problems within 20 to solve students will use various strategies and means to solve these problems
15
Keansburg School DistrictCurriculum System
Mathematics One less game wwwk-
5mathteachingresourcescom Doubles facts wwwk-
5mathteachingresourcescom Facts of ten wwwk-
5mathteachingresourcescom Fact family house wwwk-
5mathteachingresourcescom Number sentence math wwwk-
5mathteachingresourcescom Sums of ten wwwk-
5mathteachingresourcescom
Exceeds Standard
In groups or individually students will plan and generate world problems based on real life situations
Teachers will provide pictures of groups of things such as animals people or objects Students will analyze and evaluate the picture and design a number story about the picture
Using number cards or dice create addition sentences draw a picture to represent problem and write an addition number model to correlate with the fact
With 9 10 12 side dice roll two number cubes identify the higher number and count on to find sum
Students will compose their own double facts song
Students create a 4 x 4 double facts mat with double sums Partners roll a 12-sided number cube double the top number showing and X it out on the
16
Keansburg School DistrictCurriculum System
Mathematicsmat First student to get 4 in a row wins
Take two dominoes each representing an addend and have students find the sum
Students use pennies to solve basic addition problems
Students will complete turn around facts Make ten wwwk-
5mathteachingresourcescom Make ten on the ten frame wwwk-
5mathteachingresourcescom What number ishellip wwwk-
5mathteachingresourcescom Make ten square What number ishellip
wwwk-5mathteachingresourcescom Dot card addition What number is
wwwk-5mathteachingresourcescom Addition domino train What number is
wwwk-5mathteachingresourcescom
17
Keansburg School DistrictCurriculum System
MathematicsKeansburg School DistrictCurriculum Management System
SubjectGradeLevelMathematicsGrade 1
Timeline November-Quarter 2
Topic(s) Measurement and Data
Significance of Learning Goal(s) To understand measurement and what tools and used
Sugg
este
d D
ays
of
Inst
ruct
ion Content
Standards CPI Essential Questions
Specific Learning Objective(s)
The Students Will Be Able To
Suggested ActivitiesInstructional Tools Materials
Technology Resources Assessments and Assessment
Models
CPI 1MD1 1MD2 1MD3 1MD4
EQ Why do people
use graphs How is a bar
graph like a tally chart
How would I know if a bar graph correctly shows what is on a tally chart
How could a bar graph answer a question
Concept(s) Understanding what measurement is and what tools are used
SWBAT
Compare and order the length of up to three objects using direct comparisons
Compare the lengths of two objects indirectly by using a third object
Measure objects using non-standard units and express it as a whole number
Draw an object longer or shorter than a given
Meets Standard Teacher will introduce measurement
by holding up objects and the students will examine the objects and explain the size order
o Students will break into groups and compare objects further and classify them depending on their size
Teacher will introduce the ruler Explain to students that the ruler is used to measure objects The students will then explore the classroom and select objects around the room that are smaller and larger than the ruler
Teacher will select specific body parts that the students will use as a personal unit of measurement The students will work in pairs to demonstrate how to measure objects around the room
Rulers Judy Clock Paper Plates Classroom objects Chart paper Jack Hartmann ndash Tick Tock
Song Brainpop Jr White boards Dry Erase markers Clock Concentration
Typical Assessment Question(s) or Task(s)
Analyze a bar graph and answer questions
Create a bar graph using self ndash selected topic
18
Keansburg School DistrictCurriculum System
Mathematics Do bar graphs
make it easier to understand and compare facts Why
What kind of graph should I use to answer questions
Why do I need to tell time
How many hands does a clock have
Are the hands on the clock the same size
How long is a minute
Why do I need to use a calendar
How do we use the clock and the calendar to determine what we will do in school
Why do we need to measure something
What can we use to draw and measure things
What do you think is about 1 inch long
How many steps long do you think it is from
object Organize represent
and interpret data with up to three categories on simple graphs and charts
Analyze and formulate questions based on simple graphs and charts
Identify time to the hour and half hour on both a digital and analog clock
Write time to the hour and half hour on both analog and digital clocks
Draw the hands on an analog clock for a give time to the hour or half hour
Relate times to the half hour to ldquohalf pastrdquo the hour
using their personal unit of measurement
The teacher will select a classroom object and the students will be asked to illustrate objects in the room that are bigger and smaller in size
The students will be able to organize represent and interpret data up to three categories through the use of a bar graph
The teacher will then divide students into heterogeneous groups and encourage the students to explain what they can learn from the graph The students will present findings following activity
Students will choose an object within classroom then find additional objects one being larger the other being shorter using a two-column chart Draw or write the objects in the chart
Create a human clock students will hold 12 numbered plates One student will stand in the middle as the minute and hour hand to model various times
Students will have their own demonstration clocks students will identify and find the hour and minute hands
Students create their own clocks using paper plates students will manipulate hands to identify varying times
Students will listen to Jack Hartman ldquoTick Tockrdquo song
Teachers and students will view clock on videos on brainpopjrcom students
Take 3 objects and order them from smallest to largest and largest to smallest
Read a series of clocks (analog and digital) and tell the time to the hour and half hour
Using blank clocks the students will draw the hands to show a designated time
Use a personal measurement (ie your thumb) to measure the length of an object
19
Keansburg School DistrictCurriculum System
Mathematicsthe front of the classroom to the back
If we measure in footsteps why are some of the measurements different
How is longer and shorter similar to greater and lesser
and teachers can complete quizzes available on website
Teachers will present time on an analog clock students will write the digital time on a white board
Students will play clock concentration
Exceeds Standard
The students will work in pairs to locate objects around the room and compare the lengths against each other The pairs will then work with another pair of students and compare the lengths of their objects with the objects the other pair located
Teacher will introduce the ruler in comparison to the yardstick The students will be encouraged to find objects that in the room that are larger than a ruler and measure using the yardstick
After the teacher introduces units of personal measurement the students will be encouraged to measure object in the room using their own unit of personal measurement and convert it into a standard measurement using a ruler or a yardstick
The teacher will select a classroom object and the students will be asked to illustrate objects in the room that are bigger and smaller by a specific size
The students will be able to organize represent and interpret data up to four
20
Keansburg School DistrictCurriculum System
Mathematicsor more categories through the use of a bar graph
The teacher will then divide students into heterogeneous groups and encourage the students to explain what they can learn from the graph and create a tally chart utilizing the data
Students will create clock flash cards by drawing an analog clock on one side and writing the digital clock time on the other
Give students a clock and a blue number cube ()
21
Keansburg School DistrictCurriculum System
MathematicsKeansburg School DistrictCurriculum Management System
SubjectGradeLevelMathematicsGrade 1
Timeline December-Quarter 2
Topic(s) Geometry
Significance of Learning Goal(s) To identify shapes and their attribures
Sugg
este
d D
ays
of
Inst
ruct
ion Content
Standards CPI Essential
Questions
Specific Learning Objective(s)
The Students Will Be Able To
Suggested Activities
Instructional Tools Materials
Technology Resources
Assessments and Assessment Models
CPI1G1 1G2
EQ Where do
you see shapes in our classroom
Are there different shapes outside
How are geometric figures alike
How can we sort
Concept(s) Identify shapes and their attributes
SWBAT Distinguish
between two and three-dimensional shapes by classifying their attributes For example color shape and size
Compare and contrast shapes based on their attributes
Construct and create shapes
Meets Standard Sorting shapes based on their attributes For example
number of sideso Materials attribute blocks shape card sheet sorting
mat Introduce vocabulary cylinder cube sphere rectangular
prism triangular prism pyramid Classroom shape hunt students go around the room finding shapes within the classroom For example trash can tissue box clock
o Materials shape sheet classroom objects httpilluminationsnctmorgLessonDetailaspxid=L237
Create 3-dimenstion shapes (rectangular prism pyramid cube)
o Straws twist ties shape cards Create 2-dimensional shapes (trapezoid triangle circle
rectangle rhombus)o Pattern block templates attribute blocks pattern
block template stencil geo-boards rubber bands httpilluminationsnctmorgLessonDetailaspx
Attribute blocks Shape card
sheet Sorting mat Twist ties Straws Shape cards Pattern block
templates Attribute blocks Pattern block
template stencil Geo-boards Rubber bands
22
Keansburg School DistrictCurriculum System
Mathematicsobjects of different shapes
How can shapes and solids be described compared and used to make other shapes What are equal parts
What foods do you divide into equal parts
What other items might be divided
How do you know if you have an equal share
possessing certain attributes
Identify and construct two-dimensional shapes
Identify and construct three-dimensional figures
id=L168 Create a drawing using shapes students will create a
picture using the pattern block template stencil (house sun flowers etc)
o Paper pattern block stencil template crayons
Apply understanding of attributes by playing Shape Detective and Attribute Train Game
Demonstrate understanding of 3 Dimensional shapes by playing Whatrsquos My Shape
Exceeds Standard
Introducing and exposing higher vocabulary polyhedronpolyhedra (many faces of a shape) Placing the word onto the word wall
Students read the poem Shapes by Shel Silverstein and create their own illustration of the poem to explore geometric figures and positional words
Materials httpilluminationsnctmorgLessonDetailaspxID=L202
Shapes by Shel Silverstein paper crayons pencils examples of rectangles triangles circles
Compose clues using inferencing to play Guess What Display variety of 3 dimensional shapes Silently choose
an object and give clues about it For example I amsmall I have 2 flat faces and if you trace my faces youwill get circles What am I (tomato can)
Students work together to use pattern blocks to coverother pattern blocks For example how many triangleblocks are needed to cover a hexagon block
Student rotate in groups to visit each geometric solidwhile completing a chart which shows faces sides and
Typical Assessment Question(s) or Task(s)
Ask students how many sides each shape has
Have students classify shapes based on number of sides
Have students identify shapes in the classroom
Have students create 2 and 3 dimensional shapes
Have students design pictures using pattern blockspattern block template
Have students identify and describe assigned shapersquos attributes
Ask students to name 3 dimensional shapes hidden i bag (Whatrsquos my Shape Game)
23
Keansburg School DistrictCurriculum System
Mathematics corners Students compose a shape town by using their pattern
block templates Then students will calculate the totalnumber of each pattern block used
Students will invent new shapes by using three-dimensional shapes
Students will create patterns using three dimensionalshapes
24
Keansburg School DistrictCurriculum System
MathematicsKeansburg School DistrictCurriculum Management System
SubjectGradeLevelMathematicsGrade 1
Timeline January-Quarter 2
Topic(s) Number and Operations in Base Ten
Significance of Learning Goal(s) To recognize compare and understand numbers to 120
Sugg
este
d D
ays
of
Inst
ruct
ion Content
Standards CPI Essential
Questions
Specific Learning Objective(s)
The Students Will Be Able To
Suggested ActivitiesInstructional Tools Materials
Technology Resources Assessments and Assessment
Models
25
Keansburg School DistrictCurriculum System
MathematicsCPI 1NBT1 1NBT2A 1NBT2B 1NBT2C 1NBT3
EQ How do
numbers help us
How can sets of numbers be counted compared and ordered
How can I use numbers to solve problems
How would putting numbers on a chart make it easier to understand information
How can I make it easier to understand numbers when I sort them
What is place value
Concept(s) Recognize compare and understand numbers up to 120
SWBAT Recognize read write
and count 0-120 Understand that a two-
digit number represents amounts of tens and ones
Relate groups of ten to skip counting
Compare two two-digit numbers based on meanings of tens and ones digits using symbols ltgt and =
Meets Standard Teacher will cover up specific numbers
on an enlarged number grid using cover up tape to have students identify numbers before and after Students will come up and write the missing numbers
Students will play ldquoI have__ Who has __ Teacher will create cards using index cards and numbers in which students need further practice with Students will read their cards aloud Variations of game can include identifying specific numbers identifying numbers more or less etc)
Students will use base ten blocks to represent numbers including three digit numbers Students will identify representation of numbers through these manipulatives They may match the representation to the written number
Students will write the number they created using the base ten blocks using their white boards and markers
Students will arrange given digits to create the greatest and lowest possible numbers They can show each number they create using base ten blocks
Students will use the Base Ten Exchange Game to show an
Number grids ldquoI have Who hasrdquo index
cards base ten blocks white boards markers number cards dice ten frame base ten concentration
boards (k-5 math teaching resources)
double ten frame boards (k-5 math teaching resources)
Typical Assessment Question(s) or Task(s)
Recognize numbers 1-120 using flashcards
Write numbers 1-20 using block or graph paper
Build two-digit numbers using tens and ones blocks
Listen and note students skip counting orally by tens to 120
Students compare and label two numbers using relation symbols
26
Keansburg School DistrictCurriculum System
Mathematics Why is place
value important
How can I use place value to compare and order numbers
How can I use the number grid to help me with counting numbers
How many times do you think you can hop in one minute
What does number relationships mean
Why do we need to know how to add
Why do we need to know how to subtract
How are addition and subtraction related
What are doubles
How can
understanding of exchanging ones for tens and tens for hundreds Students can use place value mats base ten blocks (cubes tens and flats) Students can take number of cubes displayed with roll of single die Students will determine when exchanging can be made when reaching ten units
Teens on the ten frame wwwk-5mathteachingresourcescom
Base ten concentration wwwk-5mathteachingresourcescom
Ten frame compare wwwk-5mathteachingresourcescom
Exceeds Standard
Students will create riddles Irsquom thinking of a number that has 4 tens and 13 ones Have students solve the riddle by regrouping the ones to find the answer
-Students use hundreds chart to jump up and down from a number to show 10 more or 10 less
-Students will play Whatrsquos my Number by giving clues based on place value odd or even and number sense For example Irsquom a two digit number The digit in my tens place is 2 more than 4
27
Keansburg School DistrictCurriculum System
Mathematicsdouble facts help us to add and subtract
Does it matter what order you use to add three numbers Why or why not
The digit in my ones place is 3 less than 8 Whatrsquos my number
My double ten frame riddle wwwk-5mathteachingresourcescom
28
Keansburg School DistrictCurriculum System
MathematicsKeansburg School DistrictCurriculum Management System
SubjectGradeLevelMathematicsGrade 1
Timeline February-Quarter 3
Topic(s) Operations amp Algebraic Expressions
Significance of Learning Goal(s) To solve addition and subtraction problems
Sugg
este
d D
ays
of
Inst
ruct
ion Content
Standards CPI
Essential Questions
Specific Learning Objective(s)
The Students Will Be Able To
Suggested ActivitiesInstructional Tools Materials
Technology Resources Assessments and Assessment
Models
CPI1OA31OA4 1OA5 1OA6 1OA7 1OA81OA2
EQ What
questions can be answered using addition
What strategies can be used to solve problems
How can we
Concept(s) Solve addition with and subtraction problems
SWBAT Solve addition problems
with sums up to 20 Use addition within 20 to
solve word problems involving real life situations
Solve word problems that call for addition of three whole numbers up to 20
Solve subtraction problems with difference up to 20
Use subtraction within 20 to solve word problems involving real
Meets Standard Model and have students create their
own individual number sentence using manipulatives and label operation symbols
Students will choose a strategy to solve number stories such as objects fingers and pictures count onback number line or number grid
Create real life situations in which students will use a strategy to solve a number story and create a number model
Review addition and subtraction number stories posters stating each key word for addition and subtraction operations
Combine and mix two sets of 0-20 number cards One partner draws two number cards from the top of the deck students will design and generate a number story using the two numbers
Materials Manipulatives (examples
counting bears connecting cubes pennies counters etc)
Slates dry erase markers erasers
Clear Sheet Protectors Sets of 0-20 number cards Number cards Cardstock Scrabble tiles letter cards
Typical Assessment Question(s) or Task(s)
Students will solve real life
29
Keansburg School DistrictCurriculum System
Mathematicstell how many
How does knowing math facts make math easier
How can numbers be helpful
Why do I need to subtract
How do we use addition and subtraction in our everyday life
Why are fact families important
What strategies can be used to solve problems How is counting on different from just counting to add
What information do you need to know in order to find
life situations Understand subtraction
as an unknown addend problem example subtract 9-5 by finding the number that makes 9 when added to 5
Both partners solve the problem in the number story and write the answer on their slate
Find three cards that have a sum of 12 how many different ways can the student make the sum of 12 using three cards students record work
-Teacher creates real life word problemsinvolving three addends up to 20
Ten frames subtraction wwwk-5mathteachingresourcescom
I have who has wwwk-5mathteachingresourcescom
True or false wwwk-5mathteachingresourcescom
Count to 20 wwwk-5mathteachingresourcescom
Exceeds Standard
Teacher creates multi step word problems for students to solve
Students work with partners or small groups to create real life word problems Compose class book of problems
Three letter addends use scrabble tiles or letter cards with corresponding numbers to make three letter words find
word problems Students will create their
own number sentences own number storiesword problems
Students will create and solve number stories in cooperative learning groups
Students will generate word problems using assigned numbers
30
Keansburg School DistrictCurriculum System
Mathematicsthe total number of something
Why would you need to count back
How are subtraction and addition related
the sum of each word by adding the numbers on the tiles Students will find which words have the greatest or smallest sum
31
Keansburg School DistrictCurriculum System
MathematicsKeansburg School DistrictCurriculum Management System
SubjectGradeLevelMathematicsGrade 1
Timeline March-Quarter 3
Topic(s) Measurement amp Data
Significance of Learning Goal(s) To tell time and compare measurements
Sugg
este
d D
ays
of
Inst
ruct
ion Content
Standards CPI
Essential Questions
Specific Learning Objective(s)
The Students Will Be Able ToSuggested Activities
Instructional Tools Materials Technology Resources
Assessments and Assessment Models
How would I know if a bar graph correctly shows what is on a tally chart
How could a bar graph answer a question
Do bar graphs make it easier to understand and compare facts Why
What kind
Concept(s) Telling time comparing measurements
SWBAT Identify and write time to
the hour and half hour on both a digital and analog clock
Write time to the hour and half-hour on both digital and analog clocks
Draw the hands on the analog clock for a given time to the hour or half-hour
Relate times to the half hour as ldquohalf-pastrdquo the hour
Compare and contrast
Meets Standard Students will have their own
demonstration clocks students will identify and find the hour and minute hands
Students create their own clocks using paper plates students will manipulate hands to identify varying times
Students will listen to Jack Hartman ldquoTick Tockrdquo song
Teachers and students will view clock on videos on brainpopjrcom students and teachers can complete quizzes available on website
Teachers will present time on an analog clock students will write the digital time on a white board
Students will play clock concentration Teacher will introduce measurement by
holding up objects and the students will examine the objects and explain the size
Large Judy Clock Individual student Judy
clocks Wipe off analogdigital clocks Clock stampers Timers Rulers Yardsticks Measuring tapes Sheet protectors Cardstock Paper plates Fasteners Index cards
Typical Assessment Question(s) or Task(s)
Students will be asked to identify and write time to the hour and half hour on both
32
Keansburg School DistrictCurriculum System
Mathematicsof graph should I use to answer questions
Why do I need to tell time
How many hands does a clock have
Are the hands on the clock the same size
How long is a minute
Why do I need to use a calendar
How do we use the clock and the calendar to determine what we will do in school
Why do we need to measure something
What can
objects by length Construct objects at
contrasting lengths
ordero Students will break into groups
and compare objects further and classify them depending on their size
Teacher will introduce the ruler Explain to students that the ruler is used to measure objects The students will then explore the classroom and select objects around the room that are smaller and larger than the ruler
Teacher will select specific body parts that the students will use as a personal unit of measurement The students will work in pairs to demonstrate how to measure objects around the room using their personal unit of measurement
The teacher will select a classroom object and the students will be asked to illustrate objects in the room that are bigger and smaller in size
The students will be able to organize represent and interpret data up to three categories through the use of a bar graph
The teacher will then divide students into heterogeneous groups and encourage the students to explain what they can learn from the graph The students will present findings following activity
Students will choose an object within classroom then find additional objects one being larger the other being shorter using a two-column chart Draw or write the objects in the chart
digital and analog clocks Students will be asked to
identify the parts of a clock students will be asked to draw the hands on an analog clock for a given time to the hour or half-hour
Students will be given various objects and will further be asked to compare and contrast the lengths of these objects
Students will be asked to provide or create objects contrasting lengths to demonstrate understanding of differences in length
33
Keansburg School DistrictCurriculum System
Mathematicswe use to draw and measure things
What do you think is about 1 inch long
How many steps long do you think it is from the front of the classroom to the back
If we measure in footsteps why are some of the measurements different
How is longer and shorter similar to greater and lesser
Exceeds Standard
The students will work in pairs to locate objects around the room and compare the lengths against each other The pairs will then work with another pair of students and compare the lengths of their objects with the objects the other pair located
Teacher will introduce the ruler in comparison to the yardstick The students will be encouraged to find objects that in the room that are larger than a ruler and measure using the yardstick
After the teacher introduces units of personal measurement the students will be encouraged to measure object in the room using their own unit of personal measurement and convert it into a standard measurement using a ruler or a yardstick
The teacher will select a classroom object and the students will be asked to illustrate objects in the room that are bigger and smaller by a specific size
The students will be able to organize represent and interpret data up to four or more categories through the use of a bar graph
The teacher will then divide students into heterogeneous groups and encourage the students to explain what they can learn from the graph and create a tally chart utilizing the data
Students will create clock flash cards by
34
Keansburg School DistrictCurriculum System
Mathematicsdrawing an analog clock on one side and writing the digital clock time on the other Students will include time in five minute intervals
Pose word problems where students have to find elapse time to the hour and half hour
Introduce second hand and conduct activities that are timed in seconds (Examples hopping on 1 foot blinking eyes counting to the highest number)
35
Keansburg School DistrictCurriculum System
MathematicsKeansburg School DistrictCurriculum Management System
SubjectGradeLevelMathematicsGrade 1
Timeline April-Quarter 4
Topic(s) Geometry
Significance of Learning Goal(s) To identify two and three dimensional shapes to understand fractional parts and create equal shares
Sugg
este
d D
ays
of
Inst
ruct
ion Content
Standards CPI Essential
Questions
Specific Learning Objective(s)
The Students Will Be Able To
Suggested ActivitiesInstructional Tools Materials
Technology Resources Assessments and Assessment
Models
Are there different shapes outside
How are geometric figures alike
How can we sort objects of different shapes
How can shapes and solids be described compared and used to make other shapes
Concept(s) Two and three dimensional shapes fractional parts equal shares
SWBAT
Combine two-dimensional or three-dimensional shapes or figures to create a new composite shape and identify the shapes within
Identify fractional parts of circles and rectangles into equal shares while developing vocabulary for halves fourths and quarters
Describe the whole as
Meets Standard
Determine which shape by touch without using their sight
o Materials attribute blocks shape sheet feely box wwwilluminationsnctmorglessondetail
Sorting 3-dimensional objects students will be given cards with 3-dimensional objects (trash can soup can globe ball tissue box box dice) they will sort them based on the 3-dimensional shape they represent
o 3-dimensional object cards sorting mats
Pizza and Cake Fractions students will utilize a pizza and a cake to work on the concept of fractions while developing the vocabulary halves quarters and fourths
o Materials teacher created pizza
Attribute blocks Geometric shapes 3-dimensional object
cards Sorting maps 3-dimensional shapes Solid and lane figures Geo-boards and rubber
bands Fraction circles Sheet protectors 2-dimensional shapes
Typical Assessment Question(s) or Task(s)
Students will be asked to describe and identify
36
Keansburg School DistrictCurriculum System
MathematicsWhat are equal parts
What foods do you divide into equal parts
What other items might be divided
How do you know if you have an equal share
two of or four of the shares Understand for these examples that decomposing into more equal shares creates smaller shares
and cake that are cut into fractions (construction paper)
Students will illustrate a picture of a boat using at least one three dimensional shape in their drawings Shapes include cubes cylinders spheres cones and rectangular prisms
Solid and Plane Figures Name the Face activity Provide three-dimensional objects Have students draw the face for each object as well as name the shape Examples ABC block juice can book party hat
Introduce fractions by having students identify shapes that show equal parts Display cut out shapes using document camera Include some shapes that are divided equally and some that are not divided equally As a whole group sort shapes into two categories Then have students go back to their desks and work with a partner to classify additional shapes
Provide students with shapes that are divided into four parts Include shapes that are divided into four equal parts and others that are unequal Students identify the shapes that are divided into four equal parts and explain their reasoning
Shape Town activity Students will design a shape town using the following shapes
shapes within combined two and three-dimensional shapes
Students will be given circles and rectangles students will be asked to divide these shapes into halves fourths and quarters
Students will be asked to sort shapes that are divided equally and not divided equally
37
Keansburg School DistrictCurriculum System
Mathematicstrapezoid hexagon square triangle and circle Afterwards students will calculate the total number of each shape they included After completing the activity students will present their final product to the class and explain how they decided which shapes to use
Given an array of dots students will draw shapes with specific number of sides and corners and connect the dots to create the shapes Example Draw a shape with 5 sides Draw a shape with 6 corners
Students will create two-dimensional shapes on geoboards Then using different colored rubber bands students will divide the shapes into equal parts Students will transfer their equally divided shapes onto geoboard paper by drawing lines to show their equal parts
Play the Fraction Path Game Materials Fraction circles a circle with frac12 shaded a circle with 13 shaded and a circle with frac14 shaded Gameboard Path consisting of assorted shapes divided into halves thirds and fourths Players Needed 3 Directions Place the fraction circles facedown Players close their eyes and pick one fraction circle Each player follows the path from start to finish Each player looks at each shape on the path and records how many shapes show their fractions Players record
38
Keansburg School DistrictCurriculum System
Mathematicstheir results on paper using tally marks At end of game students compare total number of shapes that show their fraction
Exceeds Standard
39
Keansburg School DistrictCurriculum System
MathematicsKeansburg School DistrictCurriculum Management System
SubjectGradeLevelMathematicsGrade 1
Timeline May-Quarter 4
Topic(s) Number and Operations in Base Ten
Significance of Learning Goal(s) To use place value to add and subtract
Sugg
este
d D
ays
of
Inst
ruct
ion Content
Standards CPI Essential
Questions
Specific Learning Objective(s)
The Students Will Be Able ToSuggested Activities
Instructional Tools Materials Technology Resources
Assessments and Assessment Models
40
Keansburg School DistrictCurriculum System
MathematicsCPI 1NBT4 1NBT5 1NBT6
EQ How do
numbers help us
How can sets of numbers be counted compared and ordered
How can I use numbers to solve problems
How would putting numbers on a chart make it easier to understand information
How can I make it easier to understand numbers when I sort them
What is place value
Why is place value important
How can I
Concept(s) Use place value and properties of operations to add and subtract
SWBAT Use mental math to find
10 more or ten less than a given two-digit number and explain reasoning used within any number to 120
Use place value to add within 100 add a two-digit number to a one-digit number and add a two-digit number to a multiple of ten
Understand when adding two-digit numbers that ones add to the ones and tens add to the tens and sometimes it is necessary to compose a ten by regrouping
For all above objects students will use concrete models and strategies based on place value and relate the strategy to a written method and explain the reasoning used
Subtract multiples of 10 in the range 10-90 from multiples of 10 in the range 10-90 using
Meets Standard
Comparing two digit numbers wwwk-5mathteachingresourcescom
Subtraction split wwwk-5mathteachingresourcescom
Ten more wwwk-5mathteachingresourcescom
Addition split wwwk-5mathteachingresourcescom
Exceeds Standard
Comparing 3-Digit numbers wwwk-5mathteachingresourcescom
What number is wwwk-5mathteachingresourcescom
Students develop addition and subtraction number stories and have partners solve
Create pictures using basendash10 blocks Students trace picture onto paper label the base ten blocks with their value and add total
Solve number grid puzzles by adding and subtraction 10 on the number grid
Number cards Base 10 blocks Counters Number grid puzzles Sleeve protectors wwwk-
5mathteachingresourcescom
Dice
Typical Assessment Question(s) or Task(s)
Recognize numbers 1-120 using flashcards
Write numbers 1-20 using block or graph paper
Build two-digit numbers using tens and ones blocks
Listen and note students skip counting orally by tens to 120
Students compare and label two numbers using relation symbols
41
Keansburg School DistrictCurriculum System
Mathematics
42
Keansburg School DistrictCurriculum System
MathematicsKeansburg School DistrictCurriculum Management System
SubjectGradeLevelMathematicsGrade 1
Timeline June-Quarter 4
Topic(s) Readiness skills for September of Grade 2
Significance of Learning Goal(s) To compare larger numbers add fluently and apply measurement skills
Sugg
este
d D
ays
of
Inst
ruct
ion Content
Standards CPI Essential Questions
Specific Learning Objective(s)
The Students Will Be Able ToSuggested Activities
Instructional Tools Materials Technology Resources
Assessments and Assessment Models
CPI
EQ How can I use
place value to compare and
order numbers in the 100s
How can mastering basic addition and subtraction facts help me compute larger numbers
How can I tie in
Concept(s)Use place value to compare larger numbers fluently add up to 20 apply measurement skills
SWBAT Extend place value into
the hundreds place and re-write and construct models beyond the hundreds
Fluently add and subtract within 20 using mental strategies
Apply measurement skills
Meets Standard Place Value barrier game httpwwwk-
5mathteachingresourcescommath-gameshtml (place value only)
High card
httpwwwlearningboxcomBase10 BaseTenhtml
Time barrier game httpwwwk-5mathteachingresourcescomsupport-filestimebarriergamepdf httpwwwk-5mathteachingresourcescomsupport-filestimebarriergamegridpdf
My favorite time of day writing activity
number cards base ten blocks rulers tape measurer string number relationship mat paper plates cotton balls judy clock digital clock
Typical Assessment Question(s) or Task(s)
Students will solve addition and subtraction problems within 20 in a given time
43
Keansburg School DistrictCurriculum System
Mathematicsmeasurement skills with real life experiences
httpwwwk-5mathteachingresourcescomsupport-filesmy-favorite-time-of-daypdf
Estimating length httpwwwk-5mathteachingresourcescomsupport-filesestimatinglengthpdf
Olympic golf plastic golf clubs cotton balls and tape measurer
Olympic smiles measuring smiles with string and rulers
Olympic Frisbee using paper plates and tape measurer
Olympic airplane students will make paper airplanes measure the distance that they can throw their airplane
Doubles plus 1 game httpwwwk-5mathteachingresourcescomsupport-filesdoubles-plus-onepdf
Eleven more httpwwwk-5mathteachingresourcescomsupport-fileselevenmorepdf
frame Students will be asked to
measure items using inches and centimeters
Identify and create numbers with place values extending into the hundreds place
44
Keansburg School DistrictCurriculum System
Mathematics
Building numbers with base ten blocks pick three cards and arrange them to show a 3-digit number build that number with base ten blocks repeat with the same three cards until no new numbers can be made
Length strength inches httpwwwharcourtschoolcomactivitylength_strength1_inches
Length strength centimeters httpwwwharcourtschoolcomactivitylength_strength1_centi
Exceeds Standard
Number relationship mat wwwk-5mathteachingresourcescom
Place value barrier game httpwwwk-5mathteachingresourcescommath-gameshtml (integrate other skills into place values for example the digit in my 10s place is four doubled)
Measuring the mousersquos path httpwwwk-5mathteachingresourcescomsupport-filespaths1pdf
45
Keansburg School DistrictCurriculum System
Mathematics
Double minus 1 game httpwwwk-5mathteachingresourcescomsupport-filesdoubles-minus-onepdf
Number relationship mat httpwwwk-5mathteachingresourcescomsupport-filesnumberrelationshipmatpdf
46
Keansburg School DistrictCurriculum System
Mathematicsignment Matrices of Common Core State Standards
Grade Strand Standard Standard
Sept
embe
r ndash
Oct
ober
Nov
embe
r ndash
Dec
embe
r
Janu
ary
ndash Fe
brua
ry
Mar
ch ndash
Apr
il
May
- Ju
ne
1 OA 1
CC1OA1 Represent and solve problems involving addition and subtraction Use addition and subtraction within 20 to solve word problems involving situations of adding to taking from putting together taking apart and comparing with unknowns in all positions eg by using objects drawings and equations with a symbol for the unknown number to represent the problem
1 OA 2
CC1OA2 Represent and solve problems involving addition and subtraction Solve word problems that call for addition of three whole numbers whose sum is less than or equal to 20 eg by using objects drawings and equations with a symbol for the unknown number to represent the problem
1 OA 3
CC1OA3 Understand and apply properties of operations and the relationship between addition and subtraction Apply properties of operations as strategies to add and subtract Examples If 8 + 3 = 11 is known then 3 + 8 = 11 is also known (Commutative property of addition) To add 2 + 6 + 4 the second two numbers can be added to make a ten so 2 + 6 + 4 = 2 + 10 = 12 (Associative property of addition) (Students need not use formal terms for these properties)
1 OA 4
CC1OA4 Understand and apply properties of operations and the relationship between addition and subtraction Understand subtraction as an unknown-addend problem For example subtract 10 ndash 8 by finding the number that makes 10 when added to 8
1 OA 5 CC1OA5 Add and subtract within 20 Relate counting to addition and subtraction (eg by counting on 2 to add 2)
1 OA 6 CC1OA6 Add and subtract within 20 Add and subtract within 20 demonstrating fluency for addition and subtraction within 10 Use strategies such as counting on making ten (eg 8 + 6 = 8 + 2 + 4 = 10 + 4 = 14) decomposing a number leading to a ten (eg 13 ndash 4 = 13 ndash 3 ndash 1 = 10 ndash 1 = 9) using the relationship between addition and subtraction (eg knowing that 8 + 4
47
Keansburg School DistrictCurriculum System
Mathematics= 12 one knows 12 ndash 8 = 4) and creating equivalent but easier or known sums (eg adding 6 + 7 by creating the known equivalent 6 + 6 + 1 = 12 + 1 = 13)
1 OA 7
CC1OA7 Work with addition and subtraction equations Understand the meaning of the equal sign and determine if equations involving addition and subtraction are true or false For example which of the following equations are true and which are false 6 = 6 7 = 8 ndash 1 5 + 2 = 2 + 5 4 + 1 = 5 + 2
1 OA 8
CC1OA8 Work with addition and subtraction equations Determine the unknown whole number in an addition or subtraction equation relating three whole numbers For example determine the unknown number that makes the equation true in each of the equations 8 + = 11 5 = _ ndash 3 6 + 6 = _
1 NBT 1
CC1NBT1 Extend the counting sequence Count to 120 starting at any number less than 120 In this range read and write numerals and represent a number of objects with a written numeral
1 NBT 2
CC1NBT2 Understand place value Understand that the two digits of a two-digit number represent amounts of tens and ones Understand the following as special cases -- a 10 can be thought of as a bundle of ten ones mdash called a ldquotenrdquo -- b The numbers from 11 to 19 are composed of a ten and one two three four five six seven eight or nine ones -- c The numbers 10 20 30 40 50 60 70 80 90 refer to one two three four five six seven eight or nine tens (and 0 ones)
1 NBT 3
CC1NBT3 Understand place value Compare two two-digit numbers based on meanings of the tens and ones digits recording the results of comparisons with the symbols gt = and lt
1 NBT 4
CC1NBT4 Use place value understanding and properties of operations to add and subtract Add within 100 including adding a two-digit number and a one-digit number and adding a two-digit number and a multiple of 10 using concrete models or drawings and strategies based on place value properties of operations andor the relationship between addition and subtraction relate the strategy to a written method and explain the reasoning used Understand that in adding two-digit numbers one adds tens and tens ones and ones and sometimes it is necessary to compose a ten
1 NBT 5
CC1NBT5 Use place value understanding and properties of operations to add and subtract Given a two-digit number mentally find 10 more or 10 less than the number without having to count explain the reasoning used
1 NBT 6 CC1NBT6 Use place value understanding and properties of operations to add and subtract Subtract multiples of 10 in the range 10-90 from multiples of 10 in the range 10-90 (positive or zero differences) using concrete models or drawings and strategies based on place value properties of operations andor
48
Keansburg School DistrictCurriculum System
Mathematicsthe relationship between addition and subtraction relate the strategy to a written method and explain the reasoning used
1 MD 1
CC1MD1 Measure lengths indirectly and by iterating length units Order three objects by length compare the lengths of two objects indirectly by using a third object
1 MD 2
CC1MD2 Measure lengths indirectly and by iterating length units Express the length of an object as a whole number of length units by laying multiple copies of a shorter object (the length unit) end to end understand that the length measurement of an object is the number of same-size length units that span it with no gaps or overlaps Limit to contexts where the object being measured is spanned by a whole number of length units with no gaps or overlaps
1 MD 3CC1MD3 Tell and write time Tell and write time in hours and half-hours using analog and digital clocks
1 MD 4
CC1MD4 Represent and interpret data Organize represent and interpret data with up to three categories ask and answer questions about the total number of data points how many in each category and how many more or less are in one category than in another
1 G 1
CC1G1 Reason with shapes and their attributes Distinguish between defining attributes (eg triangles are closed and three-sided) versus non-defining attributes (eg color orientation overall size) for a wide variety of shapes build and draw shapes to possess defining attributes
1 G 2
CC1G2 Reason with shapes and their attributes Compose two-dimensional shapes (rectangles squares trapezoids triangles half-circles and quarter-circles) or three-dimensional shapes (cubes right rectangular prisms right circular cones and right circular cylinders) to create a composite shape and compose new shapes from the composite shape (Students do not need to learn formal names such as ldquoright rectangular prismrdquo)
1 G 3
CC1G3 Reason with shapes and their attributes Partition circles and rectangles into two and four equal shares describe the shares using the words halves fourths and quarters and use the phrases half of fourth of and quarter of Describe the whole as two of or four of the shares Understand for these examples that decomposing into more equal shares creates smaller shares
49
Keansburg School DistrictCurriculum System
Mathematics
Common Core State Standards Vocabulary
Addition and subtraction within 5 10 20 100 or 1000 Addition or subtraction of two whole numbers with whole number answers and with sum or minuend in the range 0-5 0-10 0-20 or 0-100 respectively Example 8 + 2 = 10 is an addition within 10 14 ndash 5 = 9 is a subtraction within 20 and 55 ndash 18 = 37 is a subtraction within 100
Additive inverses Two numbers whose sum is 0 are additive inverses of one another Example 34 and ndash 34 are additive inverses of one another because 34 + (ndash 34) = (ndash 34) + 34 = 0
Associative property of addition See Table 3 in this Glossary
Associative property of multiplication See Table 3 in this Glossary
Bivariate data Pairs of linked numerical observations Example a list of heights and weights for each player on a football team
Box plot A method of visually displaying a distribution of data values by using the median quartiles and extremes of the data set A box shows the middle 50 of the data1
Commutative property See Table 3 in this Glossary
Complex fraction A fraction AB where A andor B are fractions (B nonzero)
Computation algorithm A set of predefined steps applicable to a class of problems that gives the correct result in every case when the steps are carried out correctly See also computation strategy
Computation strategy Purposeful manipulations that may be chosen for specific problems may not have a fixed order and may be aimed at converting one problem into another See also computation algorithm
Congruent Two plane or solid figures are congruent if one can be obtained from the other by rigid motion (a sequence of rotations reflections and translations)
Counting on A strategy for finding the number of objects in a group without having to count every member of the group For example if a stack of books is known to have 8 books and 3 more books are added to the top it is not necessary to count the stack
50
Keansburg School DistrictCurriculum System
Mathematicsall over again One can find the total by counting onmdashpointing to the top book and saying ldquoeightrdquo following this with ldquonine ten eleven There are eleven books nowrdquo
Dot plot See line plot
Dilation A transformation that moves each point along the ray through the point emanating from a fixed center and multiplies distances from the center by a common scale factor
Expanded form A multi-digit number is expressed in expanded form when it is written as a sum of single-digit multiples of powers of ten For example 643 = 600 + 40 + 3
Expected value For a random variable the weighted average of its possible values with weights given by their respective probabilities
First quartile For a data set with median M the first quartile is the median of the data values less than M Example For the data set 1 3 6 7 10 12 14 15 22 120 the first quartile is 62 See also median third quartile interquartile range
Fraction A number expressible in the form ab where a is a whole number and b is a positive whole number (The word fraction in these standards always refers to a non-negative number) See also rational number
Identity property of 0 See Table 3 in this Glossary
Independently combined probability models Two probability models are said to be combined independently if the probability of each ordered pair in the combined model equals the product of the original probabilities of the two individual outcomes in the ordered pair
Integer A number expressible in the form a or ndasha for some whole number a
Interquartile Range A measure of variation in a set of numerical data the interquartile range is the distance between the first and third quartiles of the data set Example For the data set 1 3 6 7 10 12 14 15 22 120 the interquartile range is 15 ndash 6 = 9 See also first quartile third quartile
Line plot A method of visually displaying a distribution of data values where each data value is shown as a dot or mark above a number line Also known as a dot plot3
51
Keansburg School DistrictCurriculum System
MathematicsMean A measure of center in a set of numerical data computed by adding the values in a list and then dividing by the number of values in the list4 Example For the data set 1 3 6 7 10 12 14 15 22 120 the mean is 21
Mean absolute deviation A measure of variation in a set of numerical data computed by adding the distances between each data value and the mean then dividing by the number of data values Example For the data set 2 3 6 7 10 12 14 15 22 120 the mean absolute deviation is 20
Median A measure of center in a set of numerical data The median of a list of values is the value appearing at the center of a sorted version of the listmdashor the mean of the two central values if the list contains an even number of values Example For the data set 2 3 6 7 10 12 14 15 22 90 the median is 11
Midline In the graph of a trigonometric function the horizontal line halfway between its maximum and minimum values
Multiplication and division within 100 Multiplication or division of two whole numbers with whole number answers and with product or dividend in the range 0-100 Example 72 divide 8 = 9
Multiplicative inverses Two numbers whose product is 1 are multiplicative inverses of one another Example 34 and 43 are multiplicative inverses of one another because 34 times 43 = 43 times 34 = 1
Number line diagram A diagram of the number line used to represent numbers and support reasoning about them In a number line diagram for measurement quantities the interval from 0 to 1 on the diagram represents the unit of measure for the quantity
Percent rate of change A rate of change expressed as a percent Example if a population grows from 50 to 55 in a year it grows by 550 = 10 per year
Probability distribution The set of possible values of a random variable with a probability assigned to each
Properties of operations See Table 3 in this Glossary
Properties of equality See Table 4 in this Glossary
Properties of inequality See Table 5 in this Glossary
Properties of operations See Table 3 in this Glossary
52
Keansburg School DistrictCurriculum System
MathematicsProbability A number between 0 and 1 used to quantify likelihood for processes that have uncertain outcomes (such as tossing a coin selecting a person at random from a group of people tossing a ball at a target or testing for a medical condition)
Probability model A probability model is used to assign probabilities to outcomes of a chance process by examining the nature of the process The set of all outcomes is called the sample space and their probabilities sum to 1 See also uniform probability model
Random variable An assignment of a numerical value to each outcome in a sample space
Rational expression A quotient of two polynomials with a non-zero denominator
Rational number A number expressible in the form ab or ndash ab for some fraction ab The rational numbers include the integers
Rectilinear figure A polygon all angles of which are right angles
Rigid motion A transformation of points in space consisting of a sequence of one or more translations reflections andor rotations Rigid motions are here assumed to preserve distances and angle measures
Repeating decimal The decimal form of a rational number See also terminating decimal
Sample space In a probability model for a random process a list of the individual outcomes that are to be considered
Scatter plot A graph in the coordinate plane representing a set of bivariate data For example the heights and weights of a group of people could be displayed on a scatter plot5
Similarity transformation A rigid motion followed by a dilation
Tape diagram A drawing that looks like a segment of tape used to illustrate number relationships Also known as a strip diagram bar model fraction strip or length model
Terminating decimal A decimal is called terminating if its repeating digit is 0
Third quartile For a data set with median M the third quartile is the median of the data values greater than M Example For the data set 2 3 6 7 10 12 14 15 22 120 the third quartile is 15 See also median first quartile interquartile range
Transitivity principle for indirect measurement If the length of object A is greater than the length of object B and the length of object B is greater than the length of object C then the length of object A is greater than the length of object C This principle applies
53
Keansburg School DistrictCurriculum System
Mathematicsto measurement of other quantities as well
Uniform probability model A probability model which assigns equal probability to all outcomes See also probability model
Vector A quantity with magnitude and direction in the plane or in space defined by an ordered pair or triple of real numbers
Visual fraction model A tape diagram number line diagram or area model
Whole numbers The numbers 0 1 2 3 hellip5
54
- MissionVision Statement
- Beliefs
- Measurement amp Data
- Measure lengths and by iterating length units
- Tell and write time
- Represent and interpret data
- Geometry
- Reason with shapes and their attributes
- Number and Base Ten
- Extend the counting sequence
- Understand place value
-
- Measurement amp Data (II)
-
- Measure lengths and by iterating length units
- Tell and write time
-
- Represent and interpret data
- Geometry (II)
- Reason with shapes their attributes
-
- Number and Base Ten
- Use place value understanding and properties of operations to add and subtract
- Teacher will cover up specific numbers on an enlarged number grid using cover up tape to have students identify numbers before and after Students will come up and write the missing numbers
- Students will play ldquoI have__ Who has __ Teacher will create cards using index cards and numbers in which students need further practice with Students will read their cards aloud Variations of game can include identifying specific numbers identifying numbers more or less etc)
- Students will use base ten blocks to represent numbers including three digit numbers Students will identify representation of numbers through these manipulatives They may match the representation to the written number
- Students will write the number they created using the base ten blocks using their white boards and markers
- Students will arrange given digits to create the greatest and lowest possible numbers They can show each number they create using base ten blocks
- Students will use the Base Ten Exchange Game to show an understanding of exchanging ones for tens and tens for hundreds Students can use place value mats base ten blocks (cubes tens and flats) Students can take number of cubes displayed with roll of single die Students will determine when exchanging can be made when reaching ten units
- Base ten concentration wwwk-5mathteachingresourcescom
- Ten frame compare wwwk-5mathteachingresourcescom
-
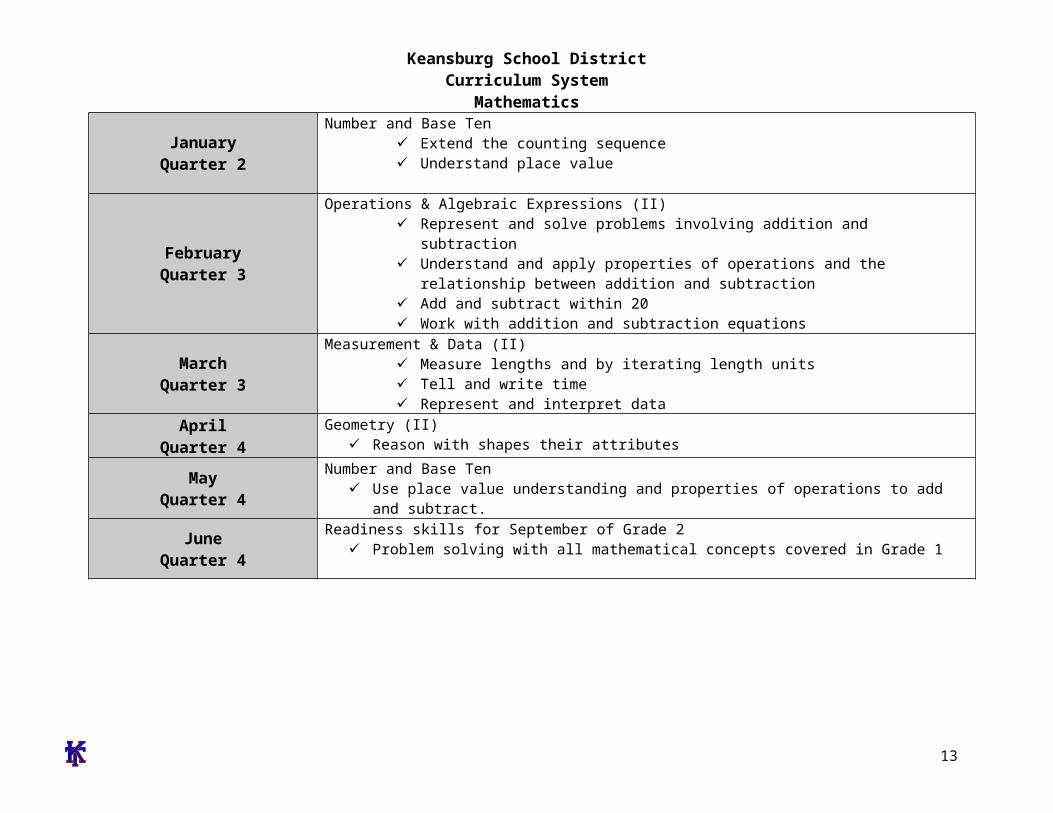
Keansburg School DistrictCurriculum System
Mathematics
Keansburg School DistrictCurriculum Management System
SubjectGradeLevelMathematicsGrade 1
Timeline October-Quarter 1Topic(s) Operations amp Algebraic Expressions
Significance of Learning Goal(s) To solve problems using addition and subtraction within 20
Sugg
este
d
Content Standards CPI Essential
Questions
Specific Learning Objective(s)
The Students Will Be Able To
Suggested ActivitiesInstructional Tools Materials
Technology Resources Assessments and Assessment
Models
CPI 1OA31OA4 1OA5 1OA6 1OA7 1OA8
EQ What questions can
be answered using addition
What strategies can be used to solve problems
How can we tell how many
How does knowing math facts make math easier
How can numbers be helpful
Why do I need to subtract
Concept(s) Working with and solving problems using addition and subtraction within 20
SWBAT
Solve word problems within 20 using real life situations
Understand demonstrate and apply properties of operations for addition
Demonstrate fluency for addition and subtraction within 20 by using strategies to solve
Meets Standard Model a number sentence using
manipulatives and label operation symbols
Use dominoes to create an addition problem and find the sum
Solve addition problems using a number line
Students will develop different ways to solve number stories students will use objects fingers and pictures count onback number line or number grid
Create real life situations in which students will use all number story strategies to solve a problem
Teachers will pose real world number stories to the students students will synthesize pre-existing information that they know to solve the problem
Introduce and devise addition and subtraction number stories posters stating each key word for addition and subtraction operations
Dominoes Number lines Number Grids Number Cards White Boards Dry-Erase markers Pennies
Typical Assessment Question(s) or Task(s)
Students will be asked to solve addition and subtraction problems within 20 within a given time frame
Students will be given a number and be asked to count on from that given number
14
Keansburg School DistrictCurriculum System
Mathematics How do we use
addition and subtraction in our everyday life
Why are fact families important
What strategies can be used to solve problems How is counting on different from just counting to add
What information do you need to know in order to find the total number of something
Why would you need to count back
How are subtraction and addition related
problems Relate counting to
addition by counting on from the higher number
Demonstrate fluency for addition by using strategies such as counting on doubles and doubles plus 1
Combine and mix two sets of 0-10 number cards One partner draws two number cards from the top of the deck students will design and generate a number story using the two numbers Both partners solve the problem in the number story and write the answer on their slate
Use concrete objects to demonstrate the relationship between two addends and the sum
Teacher will model and demonstrate using pictures and objects how objects can be moved around and still come out to equal the same sum
Develop counting on skills by students choosing a number card and partner count on from the given number
Roll two number cubes identify the higher number and count on to find sum
Use technology to show doubles different compliments of 10 songs and raps to help students memorize basic facts Poll students to discover their favorite tune
Play around the world using basic addition facts
Relate addition to subtraction by creating fact families using number cubes dominoes fact family houses etc
Turn around trains wwwk-5mathteachingresourcescom
Domino fact families wwwk-5mathteachingresourcescom
Plus one game wwwk-5mathteachingresourcescom
Students will be given word problems within 20 to solve students will use various strategies and means to solve these problems
15
Keansburg School DistrictCurriculum System
Mathematics One less game wwwk-
5mathteachingresourcescom Doubles facts wwwk-
5mathteachingresourcescom Facts of ten wwwk-
5mathteachingresourcescom Fact family house wwwk-
5mathteachingresourcescom Number sentence math wwwk-
5mathteachingresourcescom Sums of ten wwwk-
5mathteachingresourcescom
Exceeds Standard
In groups or individually students will plan and generate world problems based on real life situations
Teachers will provide pictures of groups of things such as animals people or objects Students will analyze and evaluate the picture and design a number story about the picture
Using number cards or dice create addition sentences draw a picture to represent problem and write an addition number model to correlate with the fact
With 9 10 12 side dice roll two number cubes identify the higher number and count on to find sum
Students will compose their own double facts song
Students create a 4 x 4 double facts mat with double sums Partners roll a 12-sided number cube double the top number showing and X it out on the
16
Keansburg School DistrictCurriculum System
Mathematicsmat First student to get 4 in a row wins
Take two dominoes each representing an addend and have students find the sum
Students use pennies to solve basic addition problems
Students will complete turn around facts Make ten wwwk-
5mathteachingresourcescom Make ten on the ten frame wwwk-
5mathteachingresourcescom What number ishellip wwwk-
5mathteachingresourcescom Make ten square What number ishellip
wwwk-5mathteachingresourcescom Dot card addition What number is
wwwk-5mathteachingresourcescom Addition domino train What number is
wwwk-5mathteachingresourcescom
17
Keansburg School DistrictCurriculum System
MathematicsKeansburg School DistrictCurriculum Management System
SubjectGradeLevelMathematicsGrade 1
Timeline November-Quarter 2
Topic(s) Measurement and Data
Significance of Learning Goal(s) To understand measurement and what tools and used
Sugg
este
d D
ays
of
Inst
ruct
ion Content
Standards CPI Essential Questions
Specific Learning Objective(s)
The Students Will Be Able To
Suggested ActivitiesInstructional Tools Materials
Technology Resources Assessments and Assessment
Models
CPI 1MD1 1MD2 1MD3 1MD4
EQ Why do people
use graphs How is a bar
graph like a tally chart
How would I know if a bar graph correctly shows what is on a tally chart
How could a bar graph answer a question
Concept(s) Understanding what measurement is and what tools are used
SWBAT
Compare and order the length of up to three objects using direct comparisons
Compare the lengths of two objects indirectly by using a third object
Measure objects using non-standard units and express it as a whole number
Draw an object longer or shorter than a given
Meets Standard Teacher will introduce measurement
by holding up objects and the students will examine the objects and explain the size order
o Students will break into groups and compare objects further and classify them depending on their size
Teacher will introduce the ruler Explain to students that the ruler is used to measure objects The students will then explore the classroom and select objects around the room that are smaller and larger than the ruler
Teacher will select specific body parts that the students will use as a personal unit of measurement The students will work in pairs to demonstrate how to measure objects around the room
Rulers Judy Clock Paper Plates Classroom objects Chart paper Jack Hartmann ndash Tick Tock
Song Brainpop Jr White boards Dry Erase markers Clock Concentration
Typical Assessment Question(s) or Task(s)
Analyze a bar graph and answer questions
Create a bar graph using self ndash selected topic
18
Keansburg School DistrictCurriculum System
Mathematics Do bar graphs
make it easier to understand and compare facts Why
What kind of graph should I use to answer questions
Why do I need to tell time
How many hands does a clock have
Are the hands on the clock the same size
How long is a minute
Why do I need to use a calendar
How do we use the clock and the calendar to determine what we will do in school
Why do we need to measure something
What can we use to draw and measure things
What do you think is about 1 inch long
How many steps long do you think it is from
object Organize represent
and interpret data with up to three categories on simple graphs and charts
Analyze and formulate questions based on simple graphs and charts
Identify time to the hour and half hour on both a digital and analog clock
Write time to the hour and half hour on both analog and digital clocks
Draw the hands on an analog clock for a give time to the hour or half hour
Relate times to the half hour to ldquohalf pastrdquo the hour
using their personal unit of measurement
The teacher will select a classroom object and the students will be asked to illustrate objects in the room that are bigger and smaller in size
The students will be able to organize represent and interpret data up to three categories through the use of a bar graph
The teacher will then divide students into heterogeneous groups and encourage the students to explain what they can learn from the graph The students will present findings following activity
Students will choose an object within classroom then find additional objects one being larger the other being shorter using a two-column chart Draw or write the objects in the chart
Create a human clock students will hold 12 numbered plates One student will stand in the middle as the minute and hour hand to model various times
Students will have their own demonstration clocks students will identify and find the hour and minute hands
Students create their own clocks using paper plates students will manipulate hands to identify varying times
Students will listen to Jack Hartman ldquoTick Tockrdquo song
Teachers and students will view clock on videos on brainpopjrcom students
Take 3 objects and order them from smallest to largest and largest to smallest
Read a series of clocks (analog and digital) and tell the time to the hour and half hour
Using blank clocks the students will draw the hands to show a designated time
Use a personal measurement (ie your thumb) to measure the length of an object
19
Keansburg School DistrictCurriculum System
Mathematicsthe front of the classroom to the back
If we measure in footsteps why are some of the measurements different
How is longer and shorter similar to greater and lesser
and teachers can complete quizzes available on website
Teachers will present time on an analog clock students will write the digital time on a white board
Students will play clock concentration
Exceeds Standard
The students will work in pairs to locate objects around the room and compare the lengths against each other The pairs will then work with another pair of students and compare the lengths of their objects with the objects the other pair located
Teacher will introduce the ruler in comparison to the yardstick The students will be encouraged to find objects that in the room that are larger than a ruler and measure using the yardstick
After the teacher introduces units of personal measurement the students will be encouraged to measure object in the room using their own unit of personal measurement and convert it into a standard measurement using a ruler or a yardstick
The teacher will select a classroom object and the students will be asked to illustrate objects in the room that are bigger and smaller by a specific size
The students will be able to organize represent and interpret data up to four
20
Keansburg School DistrictCurriculum System
Mathematicsor more categories through the use of a bar graph
The teacher will then divide students into heterogeneous groups and encourage the students to explain what they can learn from the graph and create a tally chart utilizing the data
Students will create clock flash cards by drawing an analog clock on one side and writing the digital clock time on the other
Give students a clock and a blue number cube ()
21
Keansburg School DistrictCurriculum System
MathematicsKeansburg School DistrictCurriculum Management System
SubjectGradeLevelMathematicsGrade 1
Timeline December-Quarter 2
Topic(s) Geometry
Significance of Learning Goal(s) To identify shapes and their attribures
Sugg
este
d D
ays
of
Inst
ruct
ion Content
Standards CPI Essential
Questions
Specific Learning Objective(s)
The Students Will Be Able To
Suggested Activities
Instructional Tools Materials
Technology Resources
Assessments and Assessment Models
CPI1G1 1G2
EQ Where do
you see shapes in our classroom
Are there different shapes outside
How are geometric figures alike
How can we sort
Concept(s) Identify shapes and their attributes
SWBAT Distinguish
between two and three-dimensional shapes by classifying their attributes For example color shape and size
Compare and contrast shapes based on their attributes
Construct and create shapes
Meets Standard Sorting shapes based on their attributes For example
number of sideso Materials attribute blocks shape card sheet sorting
mat Introduce vocabulary cylinder cube sphere rectangular
prism triangular prism pyramid Classroom shape hunt students go around the room finding shapes within the classroom For example trash can tissue box clock
o Materials shape sheet classroom objects httpilluminationsnctmorgLessonDetailaspxid=L237
Create 3-dimenstion shapes (rectangular prism pyramid cube)
o Straws twist ties shape cards Create 2-dimensional shapes (trapezoid triangle circle
rectangle rhombus)o Pattern block templates attribute blocks pattern
block template stencil geo-boards rubber bands httpilluminationsnctmorgLessonDetailaspx
Attribute blocks Shape card
sheet Sorting mat Twist ties Straws Shape cards Pattern block
templates Attribute blocks Pattern block
template stencil Geo-boards Rubber bands
22
Keansburg School DistrictCurriculum System
Mathematicsobjects of different shapes
How can shapes and solids be described compared and used to make other shapes What are equal parts
What foods do you divide into equal parts
What other items might be divided
How do you know if you have an equal share
possessing certain attributes
Identify and construct two-dimensional shapes
Identify and construct three-dimensional figures
id=L168 Create a drawing using shapes students will create a
picture using the pattern block template stencil (house sun flowers etc)
o Paper pattern block stencil template crayons
Apply understanding of attributes by playing Shape Detective and Attribute Train Game
Demonstrate understanding of 3 Dimensional shapes by playing Whatrsquos My Shape
Exceeds Standard
Introducing and exposing higher vocabulary polyhedronpolyhedra (many faces of a shape) Placing the word onto the word wall
Students read the poem Shapes by Shel Silverstein and create their own illustration of the poem to explore geometric figures and positional words
Materials httpilluminationsnctmorgLessonDetailaspxID=L202
Shapes by Shel Silverstein paper crayons pencils examples of rectangles triangles circles
Compose clues using inferencing to play Guess What Display variety of 3 dimensional shapes Silently choose
an object and give clues about it For example I amsmall I have 2 flat faces and if you trace my faces youwill get circles What am I (tomato can)
Students work together to use pattern blocks to coverother pattern blocks For example how many triangleblocks are needed to cover a hexagon block
Student rotate in groups to visit each geometric solidwhile completing a chart which shows faces sides and
Typical Assessment Question(s) or Task(s)
Ask students how many sides each shape has
Have students classify shapes based on number of sides
Have students identify shapes in the classroom
Have students create 2 and 3 dimensional shapes
Have students design pictures using pattern blockspattern block template
Have students identify and describe assigned shapersquos attributes
Ask students to name 3 dimensional shapes hidden i bag (Whatrsquos my Shape Game)
23
Keansburg School DistrictCurriculum System
Mathematics corners Students compose a shape town by using their pattern
block templates Then students will calculate the totalnumber of each pattern block used
Students will invent new shapes by using three-dimensional shapes
Students will create patterns using three dimensionalshapes
24
Keansburg School DistrictCurriculum System
MathematicsKeansburg School DistrictCurriculum Management System
SubjectGradeLevelMathematicsGrade 1
Timeline January-Quarter 2
Topic(s) Number and Operations in Base Ten
Significance of Learning Goal(s) To recognize compare and understand numbers to 120
Sugg
este
d D
ays
of
Inst
ruct
ion Content
Standards CPI Essential
Questions
Specific Learning Objective(s)
The Students Will Be Able To
Suggested ActivitiesInstructional Tools Materials
Technology Resources Assessments and Assessment
Models
25
Keansburg School DistrictCurriculum System
MathematicsCPI 1NBT1 1NBT2A 1NBT2B 1NBT2C 1NBT3
EQ How do
numbers help us
How can sets of numbers be counted compared and ordered
How can I use numbers to solve problems
How would putting numbers on a chart make it easier to understand information
How can I make it easier to understand numbers when I sort them
What is place value
Concept(s) Recognize compare and understand numbers up to 120
SWBAT Recognize read write
and count 0-120 Understand that a two-
digit number represents amounts of tens and ones
Relate groups of ten to skip counting
Compare two two-digit numbers based on meanings of tens and ones digits using symbols ltgt and =
Meets Standard Teacher will cover up specific numbers
on an enlarged number grid using cover up tape to have students identify numbers before and after Students will come up and write the missing numbers
Students will play ldquoI have__ Who has __ Teacher will create cards using index cards and numbers in which students need further practice with Students will read their cards aloud Variations of game can include identifying specific numbers identifying numbers more or less etc)
Students will use base ten blocks to represent numbers including three digit numbers Students will identify representation of numbers through these manipulatives They may match the representation to the written number
Students will write the number they created using the base ten blocks using their white boards and markers
Students will arrange given digits to create the greatest and lowest possible numbers They can show each number they create using base ten blocks
Students will use the Base Ten Exchange Game to show an
Number grids ldquoI have Who hasrdquo index
cards base ten blocks white boards markers number cards dice ten frame base ten concentration
boards (k-5 math teaching resources)
double ten frame boards (k-5 math teaching resources)
Typical Assessment Question(s) or Task(s)
Recognize numbers 1-120 using flashcards
Write numbers 1-20 using block or graph paper
Build two-digit numbers using tens and ones blocks
Listen and note students skip counting orally by tens to 120
Students compare and label two numbers using relation symbols
26
Keansburg School DistrictCurriculum System
Mathematics Why is place
value important
How can I use place value to compare and order numbers
How can I use the number grid to help me with counting numbers
How many times do you think you can hop in one minute
What does number relationships mean
Why do we need to know how to add
Why do we need to know how to subtract
How are addition and subtraction related
What are doubles
How can
understanding of exchanging ones for tens and tens for hundreds Students can use place value mats base ten blocks (cubes tens and flats) Students can take number of cubes displayed with roll of single die Students will determine when exchanging can be made when reaching ten units
Teens on the ten frame wwwk-5mathteachingresourcescom
Base ten concentration wwwk-5mathteachingresourcescom
Ten frame compare wwwk-5mathteachingresourcescom
Exceeds Standard
Students will create riddles Irsquom thinking of a number that has 4 tens and 13 ones Have students solve the riddle by regrouping the ones to find the answer
-Students use hundreds chart to jump up and down from a number to show 10 more or 10 less
-Students will play Whatrsquos my Number by giving clues based on place value odd or even and number sense For example Irsquom a two digit number The digit in my tens place is 2 more than 4
27
Keansburg School DistrictCurriculum System
Mathematicsdouble facts help us to add and subtract
Does it matter what order you use to add three numbers Why or why not
The digit in my ones place is 3 less than 8 Whatrsquos my number
My double ten frame riddle wwwk-5mathteachingresourcescom
28
Keansburg School DistrictCurriculum System
MathematicsKeansburg School DistrictCurriculum Management System
SubjectGradeLevelMathematicsGrade 1
Timeline February-Quarter 3
Topic(s) Operations amp Algebraic Expressions
Significance of Learning Goal(s) To solve addition and subtraction problems
Sugg
este
d D
ays
of
Inst
ruct
ion Content
Standards CPI
Essential Questions
Specific Learning Objective(s)
The Students Will Be Able To
Suggested ActivitiesInstructional Tools Materials
Technology Resources Assessments and Assessment
Models
CPI1OA31OA4 1OA5 1OA6 1OA7 1OA81OA2
EQ What
questions can be answered using addition
What strategies can be used to solve problems
How can we
Concept(s) Solve addition with and subtraction problems
SWBAT Solve addition problems
with sums up to 20 Use addition within 20 to
solve word problems involving real life situations
Solve word problems that call for addition of three whole numbers up to 20
Solve subtraction problems with difference up to 20
Use subtraction within 20 to solve word problems involving real
Meets Standard Model and have students create their
own individual number sentence using manipulatives and label operation symbols
Students will choose a strategy to solve number stories such as objects fingers and pictures count onback number line or number grid
Create real life situations in which students will use a strategy to solve a number story and create a number model
Review addition and subtraction number stories posters stating each key word for addition and subtraction operations
Combine and mix two sets of 0-20 number cards One partner draws two number cards from the top of the deck students will design and generate a number story using the two numbers
Materials Manipulatives (examples
counting bears connecting cubes pennies counters etc)
Slates dry erase markers erasers
Clear Sheet Protectors Sets of 0-20 number cards Number cards Cardstock Scrabble tiles letter cards
Typical Assessment Question(s) or Task(s)
Students will solve real life
29
Keansburg School DistrictCurriculum System
Mathematicstell how many
How does knowing math facts make math easier
How can numbers be helpful
Why do I need to subtract
How do we use addition and subtraction in our everyday life
Why are fact families important
What strategies can be used to solve problems How is counting on different from just counting to add
What information do you need to know in order to find
life situations Understand subtraction
as an unknown addend problem example subtract 9-5 by finding the number that makes 9 when added to 5
Both partners solve the problem in the number story and write the answer on their slate
Find three cards that have a sum of 12 how many different ways can the student make the sum of 12 using three cards students record work
-Teacher creates real life word problemsinvolving three addends up to 20
Ten frames subtraction wwwk-5mathteachingresourcescom
I have who has wwwk-5mathteachingresourcescom
True or false wwwk-5mathteachingresourcescom
Count to 20 wwwk-5mathteachingresourcescom
Exceeds Standard
Teacher creates multi step word problems for students to solve
Students work with partners or small groups to create real life word problems Compose class book of problems
Three letter addends use scrabble tiles or letter cards with corresponding numbers to make three letter words find
word problems Students will create their
own number sentences own number storiesword problems
Students will create and solve number stories in cooperative learning groups
Students will generate word problems using assigned numbers
30
Keansburg School DistrictCurriculum System
Mathematicsthe total number of something
Why would you need to count back
How are subtraction and addition related
the sum of each word by adding the numbers on the tiles Students will find which words have the greatest or smallest sum
31
Keansburg School DistrictCurriculum System
MathematicsKeansburg School DistrictCurriculum Management System
SubjectGradeLevelMathematicsGrade 1
Timeline March-Quarter 3
Topic(s) Measurement amp Data
Significance of Learning Goal(s) To tell time and compare measurements
Sugg
este
d D
ays
of
Inst
ruct
ion Content
Standards CPI
Essential Questions
Specific Learning Objective(s)
The Students Will Be Able ToSuggested Activities
Instructional Tools Materials Technology Resources
Assessments and Assessment Models
How would I know if a bar graph correctly shows what is on a tally chart
How could a bar graph answer a question
Do bar graphs make it easier to understand and compare facts Why
What kind
Concept(s) Telling time comparing measurements
SWBAT Identify and write time to
the hour and half hour on both a digital and analog clock
Write time to the hour and half-hour on both digital and analog clocks
Draw the hands on the analog clock for a given time to the hour or half-hour
Relate times to the half hour as ldquohalf-pastrdquo the hour
Compare and contrast
Meets Standard Students will have their own
demonstration clocks students will identify and find the hour and minute hands
Students create their own clocks using paper plates students will manipulate hands to identify varying times
Students will listen to Jack Hartman ldquoTick Tockrdquo song
Teachers and students will view clock on videos on brainpopjrcom students and teachers can complete quizzes available on website
Teachers will present time on an analog clock students will write the digital time on a white board
Students will play clock concentration Teacher will introduce measurement by
holding up objects and the students will examine the objects and explain the size
Large Judy Clock Individual student Judy
clocks Wipe off analogdigital clocks Clock stampers Timers Rulers Yardsticks Measuring tapes Sheet protectors Cardstock Paper plates Fasteners Index cards
Typical Assessment Question(s) or Task(s)
Students will be asked to identify and write time to the hour and half hour on both
32
Keansburg School DistrictCurriculum System
Mathematicsof graph should I use to answer questions
Why do I need to tell time
How many hands does a clock have
Are the hands on the clock the same size
How long is a minute
Why do I need to use a calendar
How do we use the clock and the calendar to determine what we will do in school
Why do we need to measure something
What can
objects by length Construct objects at
contrasting lengths
ordero Students will break into groups
and compare objects further and classify them depending on their size
Teacher will introduce the ruler Explain to students that the ruler is used to measure objects The students will then explore the classroom and select objects around the room that are smaller and larger than the ruler
Teacher will select specific body parts that the students will use as a personal unit of measurement The students will work in pairs to demonstrate how to measure objects around the room using their personal unit of measurement
The teacher will select a classroom object and the students will be asked to illustrate objects in the room that are bigger and smaller in size
The students will be able to organize represent and interpret data up to three categories through the use of a bar graph
The teacher will then divide students into heterogeneous groups and encourage the students to explain what they can learn from the graph The students will present findings following activity
Students will choose an object within classroom then find additional objects one being larger the other being shorter using a two-column chart Draw or write the objects in the chart
digital and analog clocks Students will be asked to
identify the parts of a clock students will be asked to draw the hands on an analog clock for a given time to the hour or half-hour
Students will be given various objects and will further be asked to compare and contrast the lengths of these objects
Students will be asked to provide or create objects contrasting lengths to demonstrate understanding of differences in length
33
Keansburg School DistrictCurriculum System
Mathematicswe use to draw and measure things
What do you think is about 1 inch long
How many steps long do you think it is from the front of the classroom to the back
If we measure in footsteps why are some of the measurements different
How is longer and shorter similar to greater and lesser
Exceeds Standard
The students will work in pairs to locate objects around the room and compare the lengths against each other The pairs will then work with another pair of students and compare the lengths of their objects with the objects the other pair located
Teacher will introduce the ruler in comparison to the yardstick The students will be encouraged to find objects that in the room that are larger than a ruler and measure using the yardstick
After the teacher introduces units of personal measurement the students will be encouraged to measure object in the room using their own unit of personal measurement and convert it into a standard measurement using a ruler or a yardstick
The teacher will select a classroom object and the students will be asked to illustrate objects in the room that are bigger and smaller by a specific size
The students will be able to organize represent and interpret data up to four or more categories through the use of a bar graph
The teacher will then divide students into heterogeneous groups and encourage the students to explain what they can learn from the graph and create a tally chart utilizing the data
Students will create clock flash cards by
34
Keansburg School DistrictCurriculum System
Mathematicsdrawing an analog clock on one side and writing the digital clock time on the other Students will include time in five minute intervals
Pose word problems where students have to find elapse time to the hour and half hour
Introduce second hand and conduct activities that are timed in seconds (Examples hopping on 1 foot blinking eyes counting to the highest number)
35
Keansburg School DistrictCurriculum System
MathematicsKeansburg School DistrictCurriculum Management System
SubjectGradeLevelMathematicsGrade 1
Timeline April-Quarter 4
Topic(s) Geometry
Significance of Learning Goal(s) To identify two and three dimensional shapes to understand fractional parts and create equal shares
Sugg
este
d D
ays
of
Inst
ruct
ion Content
Standards CPI Essential
Questions
Specific Learning Objective(s)
The Students Will Be Able To
Suggested ActivitiesInstructional Tools Materials
Technology Resources Assessments and Assessment
Models
Are there different shapes outside
How are geometric figures alike
How can we sort objects of different shapes
How can shapes and solids be described compared and used to make other shapes
Concept(s) Two and three dimensional shapes fractional parts equal shares
SWBAT
Combine two-dimensional or three-dimensional shapes or figures to create a new composite shape and identify the shapes within
Identify fractional parts of circles and rectangles into equal shares while developing vocabulary for halves fourths and quarters
Describe the whole as
Meets Standard
Determine which shape by touch without using their sight
o Materials attribute blocks shape sheet feely box wwwilluminationsnctmorglessondetail
Sorting 3-dimensional objects students will be given cards with 3-dimensional objects (trash can soup can globe ball tissue box box dice) they will sort them based on the 3-dimensional shape they represent
o 3-dimensional object cards sorting mats
Pizza and Cake Fractions students will utilize a pizza and a cake to work on the concept of fractions while developing the vocabulary halves quarters and fourths
o Materials teacher created pizza
Attribute blocks Geometric shapes 3-dimensional object
cards Sorting maps 3-dimensional shapes Solid and lane figures Geo-boards and rubber
bands Fraction circles Sheet protectors 2-dimensional shapes
Typical Assessment Question(s) or Task(s)
Students will be asked to describe and identify
36
Keansburg School DistrictCurriculum System
MathematicsWhat are equal parts
What foods do you divide into equal parts
What other items might be divided
How do you know if you have an equal share
two of or four of the shares Understand for these examples that decomposing into more equal shares creates smaller shares
and cake that are cut into fractions (construction paper)
Students will illustrate a picture of a boat using at least one three dimensional shape in their drawings Shapes include cubes cylinders spheres cones and rectangular prisms
Solid and Plane Figures Name the Face activity Provide three-dimensional objects Have students draw the face for each object as well as name the shape Examples ABC block juice can book party hat
Introduce fractions by having students identify shapes that show equal parts Display cut out shapes using document camera Include some shapes that are divided equally and some that are not divided equally As a whole group sort shapes into two categories Then have students go back to their desks and work with a partner to classify additional shapes
Provide students with shapes that are divided into four parts Include shapes that are divided into four equal parts and others that are unequal Students identify the shapes that are divided into four equal parts and explain their reasoning
Shape Town activity Students will design a shape town using the following shapes
shapes within combined two and three-dimensional shapes
Students will be given circles and rectangles students will be asked to divide these shapes into halves fourths and quarters
Students will be asked to sort shapes that are divided equally and not divided equally
37
Keansburg School DistrictCurriculum System
Mathematicstrapezoid hexagon square triangle and circle Afterwards students will calculate the total number of each shape they included After completing the activity students will present their final product to the class and explain how they decided which shapes to use
Given an array of dots students will draw shapes with specific number of sides and corners and connect the dots to create the shapes Example Draw a shape with 5 sides Draw a shape with 6 corners
Students will create two-dimensional shapes on geoboards Then using different colored rubber bands students will divide the shapes into equal parts Students will transfer their equally divided shapes onto geoboard paper by drawing lines to show their equal parts
Play the Fraction Path Game Materials Fraction circles a circle with frac12 shaded a circle with 13 shaded and a circle with frac14 shaded Gameboard Path consisting of assorted shapes divided into halves thirds and fourths Players Needed 3 Directions Place the fraction circles facedown Players close their eyes and pick one fraction circle Each player follows the path from start to finish Each player looks at each shape on the path and records how many shapes show their fractions Players record
38
Keansburg School DistrictCurriculum System
Mathematicstheir results on paper using tally marks At end of game students compare total number of shapes that show their fraction
Exceeds Standard
39
Keansburg School DistrictCurriculum System
MathematicsKeansburg School DistrictCurriculum Management System
SubjectGradeLevelMathematicsGrade 1
Timeline May-Quarter 4
Topic(s) Number and Operations in Base Ten
Significance of Learning Goal(s) To use place value to add and subtract
Sugg
este
d D
ays
of
Inst
ruct
ion Content
Standards CPI Essential
Questions
Specific Learning Objective(s)
The Students Will Be Able ToSuggested Activities
Instructional Tools Materials Technology Resources
Assessments and Assessment Models
40
Keansburg School DistrictCurriculum System
MathematicsCPI 1NBT4 1NBT5 1NBT6
EQ How do
numbers help us
How can sets of numbers be counted compared and ordered
How can I use numbers to solve problems
How would putting numbers on a chart make it easier to understand information
How can I make it easier to understand numbers when I sort them
What is place value
Why is place value important
How can I
Concept(s) Use place value and properties of operations to add and subtract
SWBAT Use mental math to find
10 more or ten less than a given two-digit number and explain reasoning used within any number to 120
Use place value to add within 100 add a two-digit number to a one-digit number and add a two-digit number to a multiple of ten
Understand when adding two-digit numbers that ones add to the ones and tens add to the tens and sometimes it is necessary to compose a ten by regrouping
For all above objects students will use concrete models and strategies based on place value and relate the strategy to a written method and explain the reasoning used
Subtract multiples of 10 in the range 10-90 from multiples of 10 in the range 10-90 using
Meets Standard
Comparing two digit numbers wwwk-5mathteachingresourcescom
Subtraction split wwwk-5mathteachingresourcescom
Ten more wwwk-5mathteachingresourcescom
Addition split wwwk-5mathteachingresourcescom
Exceeds Standard
Comparing 3-Digit numbers wwwk-5mathteachingresourcescom
What number is wwwk-5mathteachingresourcescom
Students develop addition and subtraction number stories and have partners solve
Create pictures using basendash10 blocks Students trace picture onto paper label the base ten blocks with their value and add total
Solve number grid puzzles by adding and subtraction 10 on the number grid
Number cards Base 10 blocks Counters Number grid puzzles Sleeve protectors wwwk-
5mathteachingresourcescom
Dice
Typical Assessment Question(s) or Task(s)
Recognize numbers 1-120 using flashcards
Write numbers 1-20 using block or graph paper
Build two-digit numbers using tens and ones blocks
Listen and note students skip counting orally by tens to 120
Students compare and label two numbers using relation symbols
41
Keansburg School DistrictCurriculum System
Mathematics
42
Keansburg School DistrictCurriculum System
MathematicsKeansburg School DistrictCurriculum Management System
SubjectGradeLevelMathematicsGrade 1
Timeline June-Quarter 4
Topic(s) Readiness skills for September of Grade 2
Significance of Learning Goal(s) To compare larger numbers add fluently and apply measurement skills
Sugg
este
d D
ays
of
Inst
ruct
ion Content
Standards CPI Essential Questions
Specific Learning Objective(s)
The Students Will Be Able ToSuggested Activities
Instructional Tools Materials Technology Resources
Assessments and Assessment Models
CPI
EQ How can I use
place value to compare and
order numbers in the 100s
How can mastering basic addition and subtraction facts help me compute larger numbers
How can I tie in
Concept(s)Use place value to compare larger numbers fluently add up to 20 apply measurement skills
SWBAT Extend place value into
the hundreds place and re-write and construct models beyond the hundreds
Fluently add and subtract within 20 using mental strategies
Apply measurement skills
Meets Standard Place Value barrier game httpwwwk-
5mathteachingresourcescommath-gameshtml (place value only)
High card
httpwwwlearningboxcomBase10 BaseTenhtml
Time barrier game httpwwwk-5mathteachingresourcescomsupport-filestimebarriergamepdf httpwwwk-5mathteachingresourcescomsupport-filestimebarriergamegridpdf
My favorite time of day writing activity
number cards base ten blocks rulers tape measurer string number relationship mat paper plates cotton balls judy clock digital clock
Typical Assessment Question(s) or Task(s)
Students will solve addition and subtraction problems within 20 in a given time
43
Keansburg School DistrictCurriculum System
Mathematicsmeasurement skills with real life experiences
httpwwwk-5mathteachingresourcescomsupport-filesmy-favorite-time-of-daypdf
Estimating length httpwwwk-5mathteachingresourcescomsupport-filesestimatinglengthpdf
Olympic golf plastic golf clubs cotton balls and tape measurer
Olympic smiles measuring smiles with string and rulers
Olympic Frisbee using paper plates and tape measurer
Olympic airplane students will make paper airplanes measure the distance that they can throw their airplane
Doubles plus 1 game httpwwwk-5mathteachingresourcescomsupport-filesdoubles-plus-onepdf
Eleven more httpwwwk-5mathteachingresourcescomsupport-fileselevenmorepdf
frame Students will be asked to
measure items using inches and centimeters
Identify and create numbers with place values extending into the hundreds place
44
Keansburg School DistrictCurriculum System
Mathematics
Building numbers with base ten blocks pick three cards and arrange them to show a 3-digit number build that number with base ten blocks repeat with the same three cards until no new numbers can be made
Length strength inches httpwwwharcourtschoolcomactivitylength_strength1_inches
Length strength centimeters httpwwwharcourtschoolcomactivitylength_strength1_centi
Exceeds Standard
Number relationship mat wwwk-5mathteachingresourcescom
Place value barrier game httpwwwk-5mathteachingresourcescommath-gameshtml (integrate other skills into place values for example the digit in my 10s place is four doubled)
Measuring the mousersquos path httpwwwk-5mathteachingresourcescomsupport-filespaths1pdf
45
Keansburg School DistrictCurriculum System
Mathematics
Double minus 1 game httpwwwk-5mathteachingresourcescomsupport-filesdoubles-minus-onepdf
Number relationship mat httpwwwk-5mathteachingresourcescomsupport-filesnumberrelationshipmatpdf
46
Keansburg School DistrictCurriculum System
Mathematicsignment Matrices of Common Core State Standards
Grade Strand Standard Standard
Sept
embe
r ndash
Oct
ober
Nov
embe
r ndash
Dec
embe
r
Janu
ary
ndash Fe
brua
ry
Mar
ch ndash
Apr
il
May
- Ju
ne
1 OA 1
CC1OA1 Represent and solve problems involving addition and subtraction Use addition and subtraction within 20 to solve word problems involving situations of adding to taking from putting together taking apart and comparing with unknowns in all positions eg by using objects drawings and equations with a symbol for the unknown number to represent the problem
1 OA 2
CC1OA2 Represent and solve problems involving addition and subtraction Solve word problems that call for addition of three whole numbers whose sum is less than or equal to 20 eg by using objects drawings and equations with a symbol for the unknown number to represent the problem
1 OA 3
CC1OA3 Understand and apply properties of operations and the relationship between addition and subtraction Apply properties of operations as strategies to add and subtract Examples If 8 + 3 = 11 is known then 3 + 8 = 11 is also known (Commutative property of addition) To add 2 + 6 + 4 the second two numbers can be added to make a ten so 2 + 6 + 4 = 2 + 10 = 12 (Associative property of addition) (Students need not use formal terms for these properties)
1 OA 4
CC1OA4 Understand and apply properties of operations and the relationship between addition and subtraction Understand subtraction as an unknown-addend problem For example subtract 10 ndash 8 by finding the number that makes 10 when added to 8
1 OA 5 CC1OA5 Add and subtract within 20 Relate counting to addition and subtraction (eg by counting on 2 to add 2)
1 OA 6 CC1OA6 Add and subtract within 20 Add and subtract within 20 demonstrating fluency for addition and subtraction within 10 Use strategies such as counting on making ten (eg 8 + 6 = 8 + 2 + 4 = 10 + 4 = 14) decomposing a number leading to a ten (eg 13 ndash 4 = 13 ndash 3 ndash 1 = 10 ndash 1 = 9) using the relationship between addition and subtraction (eg knowing that 8 + 4
47
Keansburg School DistrictCurriculum System
Mathematics= 12 one knows 12 ndash 8 = 4) and creating equivalent but easier or known sums (eg adding 6 + 7 by creating the known equivalent 6 + 6 + 1 = 12 + 1 = 13)
1 OA 7
CC1OA7 Work with addition and subtraction equations Understand the meaning of the equal sign and determine if equations involving addition and subtraction are true or false For example which of the following equations are true and which are false 6 = 6 7 = 8 ndash 1 5 + 2 = 2 + 5 4 + 1 = 5 + 2
1 OA 8
CC1OA8 Work with addition and subtraction equations Determine the unknown whole number in an addition or subtraction equation relating three whole numbers For example determine the unknown number that makes the equation true in each of the equations 8 + = 11 5 = _ ndash 3 6 + 6 = _
1 NBT 1
CC1NBT1 Extend the counting sequence Count to 120 starting at any number less than 120 In this range read and write numerals and represent a number of objects with a written numeral
1 NBT 2
CC1NBT2 Understand place value Understand that the two digits of a two-digit number represent amounts of tens and ones Understand the following as special cases -- a 10 can be thought of as a bundle of ten ones mdash called a ldquotenrdquo -- b The numbers from 11 to 19 are composed of a ten and one two three four five six seven eight or nine ones -- c The numbers 10 20 30 40 50 60 70 80 90 refer to one two three four five six seven eight or nine tens (and 0 ones)
1 NBT 3
CC1NBT3 Understand place value Compare two two-digit numbers based on meanings of the tens and ones digits recording the results of comparisons with the symbols gt = and lt
1 NBT 4
CC1NBT4 Use place value understanding and properties of operations to add and subtract Add within 100 including adding a two-digit number and a one-digit number and adding a two-digit number and a multiple of 10 using concrete models or drawings and strategies based on place value properties of operations andor the relationship between addition and subtraction relate the strategy to a written method and explain the reasoning used Understand that in adding two-digit numbers one adds tens and tens ones and ones and sometimes it is necessary to compose a ten
1 NBT 5
CC1NBT5 Use place value understanding and properties of operations to add and subtract Given a two-digit number mentally find 10 more or 10 less than the number without having to count explain the reasoning used
1 NBT 6 CC1NBT6 Use place value understanding and properties of operations to add and subtract Subtract multiples of 10 in the range 10-90 from multiples of 10 in the range 10-90 (positive or zero differences) using concrete models or drawings and strategies based on place value properties of operations andor
48
Keansburg School DistrictCurriculum System
Mathematicsthe relationship between addition and subtraction relate the strategy to a written method and explain the reasoning used
1 MD 1
CC1MD1 Measure lengths indirectly and by iterating length units Order three objects by length compare the lengths of two objects indirectly by using a third object
1 MD 2
CC1MD2 Measure lengths indirectly and by iterating length units Express the length of an object as a whole number of length units by laying multiple copies of a shorter object (the length unit) end to end understand that the length measurement of an object is the number of same-size length units that span it with no gaps or overlaps Limit to contexts where the object being measured is spanned by a whole number of length units with no gaps or overlaps
1 MD 3CC1MD3 Tell and write time Tell and write time in hours and half-hours using analog and digital clocks
1 MD 4
CC1MD4 Represent and interpret data Organize represent and interpret data with up to three categories ask and answer questions about the total number of data points how many in each category and how many more or less are in one category than in another
1 G 1
CC1G1 Reason with shapes and their attributes Distinguish between defining attributes (eg triangles are closed and three-sided) versus non-defining attributes (eg color orientation overall size) for a wide variety of shapes build and draw shapes to possess defining attributes
1 G 2
CC1G2 Reason with shapes and their attributes Compose two-dimensional shapes (rectangles squares trapezoids triangles half-circles and quarter-circles) or three-dimensional shapes (cubes right rectangular prisms right circular cones and right circular cylinders) to create a composite shape and compose new shapes from the composite shape (Students do not need to learn formal names such as ldquoright rectangular prismrdquo)
1 G 3
CC1G3 Reason with shapes and their attributes Partition circles and rectangles into two and four equal shares describe the shares using the words halves fourths and quarters and use the phrases half of fourth of and quarter of Describe the whole as two of or four of the shares Understand for these examples that decomposing into more equal shares creates smaller shares
49
Keansburg School DistrictCurriculum System
Mathematics
Common Core State Standards Vocabulary
Addition and subtraction within 5 10 20 100 or 1000 Addition or subtraction of two whole numbers with whole number answers and with sum or minuend in the range 0-5 0-10 0-20 or 0-100 respectively Example 8 + 2 = 10 is an addition within 10 14 ndash 5 = 9 is a subtraction within 20 and 55 ndash 18 = 37 is a subtraction within 100
Additive inverses Two numbers whose sum is 0 are additive inverses of one another Example 34 and ndash 34 are additive inverses of one another because 34 + (ndash 34) = (ndash 34) + 34 = 0
Associative property of addition See Table 3 in this Glossary
Associative property of multiplication See Table 3 in this Glossary
Bivariate data Pairs of linked numerical observations Example a list of heights and weights for each player on a football team
Box plot A method of visually displaying a distribution of data values by using the median quartiles and extremes of the data set A box shows the middle 50 of the data1
Commutative property See Table 3 in this Glossary
Complex fraction A fraction AB where A andor B are fractions (B nonzero)
Computation algorithm A set of predefined steps applicable to a class of problems that gives the correct result in every case when the steps are carried out correctly See also computation strategy
Computation strategy Purposeful manipulations that may be chosen for specific problems may not have a fixed order and may be aimed at converting one problem into another See also computation algorithm
Congruent Two plane or solid figures are congruent if one can be obtained from the other by rigid motion (a sequence of rotations reflections and translations)
Counting on A strategy for finding the number of objects in a group without having to count every member of the group For example if a stack of books is known to have 8 books and 3 more books are added to the top it is not necessary to count the stack
50
Keansburg School DistrictCurriculum System
Mathematicsall over again One can find the total by counting onmdashpointing to the top book and saying ldquoeightrdquo following this with ldquonine ten eleven There are eleven books nowrdquo
Dot plot See line plot
Dilation A transformation that moves each point along the ray through the point emanating from a fixed center and multiplies distances from the center by a common scale factor
Expanded form A multi-digit number is expressed in expanded form when it is written as a sum of single-digit multiples of powers of ten For example 643 = 600 + 40 + 3
Expected value For a random variable the weighted average of its possible values with weights given by their respective probabilities
First quartile For a data set with median M the first quartile is the median of the data values less than M Example For the data set 1 3 6 7 10 12 14 15 22 120 the first quartile is 62 See also median third quartile interquartile range
Fraction A number expressible in the form ab where a is a whole number and b is a positive whole number (The word fraction in these standards always refers to a non-negative number) See also rational number
Identity property of 0 See Table 3 in this Glossary
Independently combined probability models Two probability models are said to be combined independently if the probability of each ordered pair in the combined model equals the product of the original probabilities of the two individual outcomes in the ordered pair
Integer A number expressible in the form a or ndasha for some whole number a
Interquartile Range A measure of variation in a set of numerical data the interquartile range is the distance between the first and third quartiles of the data set Example For the data set 1 3 6 7 10 12 14 15 22 120 the interquartile range is 15 ndash 6 = 9 See also first quartile third quartile
Line plot A method of visually displaying a distribution of data values where each data value is shown as a dot or mark above a number line Also known as a dot plot3
51
Keansburg School DistrictCurriculum System
MathematicsMean A measure of center in a set of numerical data computed by adding the values in a list and then dividing by the number of values in the list4 Example For the data set 1 3 6 7 10 12 14 15 22 120 the mean is 21
Mean absolute deviation A measure of variation in a set of numerical data computed by adding the distances between each data value and the mean then dividing by the number of data values Example For the data set 2 3 6 7 10 12 14 15 22 120 the mean absolute deviation is 20
Median A measure of center in a set of numerical data The median of a list of values is the value appearing at the center of a sorted version of the listmdashor the mean of the two central values if the list contains an even number of values Example For the data set 2 3 6 7 10 12 14 15 22 90 the median is 11
Midline In the graph of a trigonometric function the horizontal line halfway between its maximum and minimum values
Multiplication and division within 100 Multiplication or division of two whole numbers with whole number answers and with product or dividend in the range 0-100 Example 72 divide 8 = 9
Multiplicative inverses Two numbers whose product is 1 are multiplicative inverses of one another Example 34 and 43 are multiplicative inverses of one another because 34 times 43 = 43 times 34 = 1
Number line diagram A diagram of the number line used to represent numbers and support reasoning about them In a number line diagram for measurement quantities the interval from 0 to 1 on the diagram represents the unit of measure for the quantity
Percent rate of change A rate of change expressed as a percent Example if a population grows from 50 to 55 in a year it grows by 550 = 10 per year
Probability distribution The set of possible values of a random variable with a probability assigned to each
Properties of operations See Table 3 in this Glossary
Properties of equality See Table 4 in this Glossary
Properties of inequality See Table 5 in this Glossary
Properties of operations See Table 3 in this Glossary
52
Keansburg School DistrictCurriculum System
MathematicsProbability A number between 0 and 1 used to quantify likelihood for processes that have uncertain outcomes (such as tossing a coin selecting a person at random from a group of people tossing a ball at a target or testing for a medical condition)
Probability model A probability model is used to assign probabilities to outcomes of a chance process by examining the nature of the process The set of all outcomes is called the sample space and their probabilities sum to 1 See also uniform probability model
Random variable An assignment of a numerical value to each outcome in a sample space
Rational expression A quotient of two polynomials with a non-zero denominator
Rational number A number expressible in the form ab or ndash ab for some fraction ab The rational numbers include the integers
Rectilinear figure A polygon all angles of which are right angles
Rigid motion A transformation of points in space consisting of a sequence of one or more translations reflections andor rotations Rigid motions are here assumed to preserve distances and angle measures
Repeating decimal The decimal form of a rational number See also terminating decimal
Sample space In a probability model for a random process a list of the individual outcomes that are to be considered
Scatter plot A graph in the coordinate plane representing a set of bivariate data For example the heights and weights of a group of people could be displayed on a scatter plot5
Similarity transformation A rigid motion followed by a dilation
Tape diagram A drawing that looks like a segment of tape used to illustrate number relationships Also known as a strip diagram bar model fraction strip or length model
Terminating decimal A decimal is called terminating if its repeating digit is 0
Third quartile For a data set with median M the third quartile is the median of the data values greater than M Example For the data set 2 3 6 7 10 12 14 15 22 120 the third quartile is 15 See also median first quartile interquartile range
Transitivity principle for indirect measurement If the length of object A is greater than the length of object B and the length of object B is greater than the length of object C then the length of object A is greater than the length of object C This principle applies
53
Keansburg School DistrictCurriculum System
Mathematicsto measurement of other quantities as well
Uniform probability model A probability model which assigns equal probability to all outcomes See also probability model
Vector A quantity with magnitude and direction in the plane or in space defined by an ordered pair or triple of real numbers
Visual fraction model A tape diagram number line diagram or area model
Whole numbers The numbers 0 1 2 3 hellip5
54
- MissionVision Statement
- Beliefs
- Measurement amp Data
- Measure lengths and by iterating length units
- Tell and write time
- Represent and interpret data
- Geometry
- Reason with shapes and their attributes
- Number and Base Ten
- Extend the counting sequence
- Understand place value
-
- Measurement amp Data (II)
-
- Measure lengths and by iterating length units
- Tell and write time
-
- Represent and interpret data
- Geometry (II)
- Reason with shapes their attributes
-
- Number and Base Ten
- Use place value understanding and properties of operations to add and subtract
- Teacher will cover up specific numbers on an enlarged number grid using cover up tape to have students identify numbers before and after Students will come up and write the missing numbers
- Students will play ldquoI have__ Who has __ Teacher will create cards using index cards and numbers in which students need further practice with Students will read their cards aloud Variations of game can include identifying specific numbers identifying numbers more or less etc)
- Students will use base ten blocks to represent numbers including three digit numbers Students will identify representation of numbers through these manipulatives They may match the representation to the written number
- Students will write the number they created using the base ten blocks using their white boards and markers
- Students will arrange given digits to create the greatest and lowest possible numbers They can show each number they create using base ten blocks
- Students will use the Base Ten Exchange Game to show an understanding of exchanging ones for tens and tens for hundreds Students can use place value mats base ten blocks (cubes tens and flats) Students can take number of cubes displayed with roll of single die Students will determine when exchanging can be made when reaching ten units
- Base ten concentration wwwk-5mathteachingresourcescom
- Ten frame compare wwwk-5mathteachingresourcescom
-
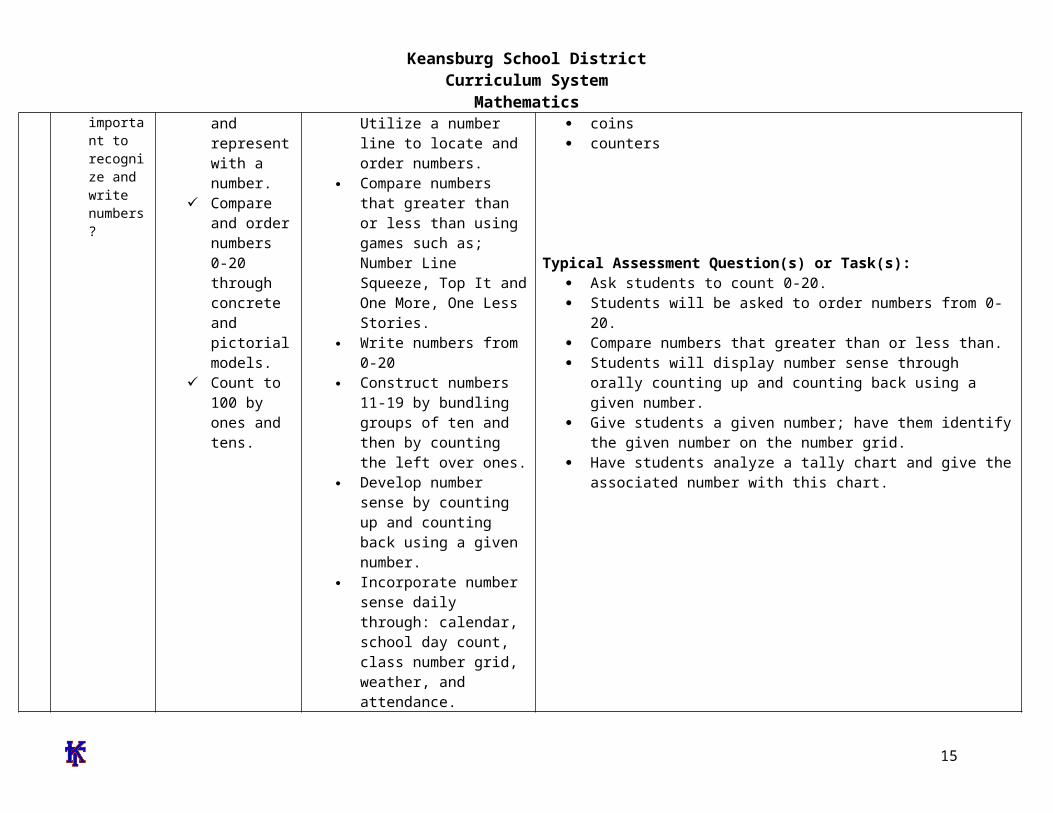
Keansburg School DistrictCurriculum System
Mathematics How do we use
addition and subtraction in our everyday life
Why are fact families important
What strategies can be used to solve problems How is counting on different from just counting to add
What information do you need to know in order to find the total number of something
Why would you need to count back
How are subtraction and addition related
problems Relate counting to
addition by counting on from the higher number
Demonstrate fluency for addition by using strategies such as counting on doubles and doubles plus 1
Combine and mix two sets of 0-10 number cards One partner draws two number cards from the top of the deck students will design and generate a number story using the two numbers Both partners solve the problem in the number story and write the answer on their slate
Use concrete objects to demonstrate the relationship between two addends and the sum
Teacher will model and demonstrate using pictures and objects how objects can be moved around and still come out to equal the same sum
Develop counting on skills by students choosing a number card and partner count on from the given number
Roll two number cubes identify the higher number and count on to find sum
Use technology to show doubles different compliments of 10 songs and raps to help students memorize basic facts Poll students to discover their favorite tune
Play around the world using basic addition facts
Relate addition to subtraction by creating fact families using number cubes dominoes fact family houses etc
Turn around trains wwwk-5mathteachingresourcescom
Domino fact families wwwk-5mathteachingresourcescom
Plus one game wwwk-5mathteachingresourcescom
Students will be given word problems within 20 to solve students will use various strategies and means to solve these problems
15
Keansburg School DistrictCurriculum System
Mathematics One less game wwwk-
5mathteachingresourcescom Doubles facts wwwk-
5mathteachingresourcescom Facts of ten wwwk-
5mathteachingresourcescom Fact family house wwwk-
5mathteachingresourcescom Number sentence math wwwk-
5mathteachingresourcescom Sums of ten wwwk-
5mathteachingresourcescom
Exceeds Standard
In groups or individually students will plan and generate world problems based on real life situations
Teachers will provide pictures of groups of things such as animals people or objects Students will analyze and evaluate the picture and design a number story about the picture
Using number cards or dice create addition sentences draw a picture to represent problem and write an addition number model to correlate with the fact
With 9 10 12 side dice roll two number cubes identify the higher number and count on to find sum
Students will compose their own double facts song
Students create a 4 x 4 double facts mat with double sums Partners roll a 12-sided number cube double the top number showing and X it out on the
16
Keansburg School DistrictCurriculum System
Mathematicsmat First student to get 4 in a row wins
Take two dominoes each representing an addend and have students find the sum
Students use pennies to solve basic addition problems
Students will complete turn around facts Make ten wwwk-
5mathteachingresourcescom Make ten on the ten frame wwwk-
5mathteachingresourcescom What number ishellip wwwk-
5mathteachingresourcescom Make ten square What number ishellip
wwwk-5mathteachingresourcescom Dot card addition What number is
wwwk-5mathteachingresourcescom Addition domino train What number is
wwwk-5mathteachingresourcescom
17
Keansburg School DistrictCurriculum System
MathematicsKeansburg School DistrictCurriculum Management System
SubjectGradeLevelMathematicsGrade 1
Timeline November-Quarter 2
Topic(s) Measurement and Data
Significance of Learning Goal(s) To understand measurement and what tools and used
Sugg
este
d D
ays
of
Inst
ruct
ion Content
Standards CPI Essential Questions
Specific Learning Objective(s)
The Students Will Be Able To
Suggested ActivitiesInstructional Tools Materials
Technology Resources Assessments and Assessment
Models
CPI 1MD1 1MD2 1MD3 1MD4
EQ Why do people
use graphs How is a bar
graph like a tally chart
How would I know if a bar graph correctly shows what is on a tally chart
How could a bar graph answer a question
Concept(s) Understanding what measurement is and what tools are used
SWBAT
Compare and order the length of up to three objects using direct comparisons
Compare the lengths of two objects indirectly by using a third object
Measure objects using non-standard units and express it as a whole number
Draw an object longer or shorter than a given
Meets Standard Teacher will introduce measurement
by holding up objects and the students will examine the objects and explain the size order
o Students will break into groups and compare objects further and classify them depending on their size
Teacher will introduce the ruler Explain to students that the ruler is used to measure objects The students will then explore the classroom and select objects around the room that are smaller and larger than the ruler
Teacher will select specific body parts that the students will use as a personal unit of measurement The students will work in pairs to demonstrate how to measure objects around the room
Rulers Judy Clock Paper Plates Classroom objects Chart paper Jack Hartmann ndash Tick Tock
Song Brainpop Jr White boards Dry Erase markers Clock Concentration
Typical Assessment Question(s) or Task(s)
Analyze a bar graph and answer questions
Create a bar graph using self ndash selected topic
18
Keansburg School DistrictCurriculum System
Mathematics Do bar graphs
make it easier to understand and compare facts Why
What kind of graph should I use to answer questions
Why do I need to tell time
How many hands does a clock have
Are the hands on the clock the same size
How long is a minute
Why do I need to use a calendar
How do we use the clock and the calendar to determine what we will do in school
Why do we need to measure something
What can we use to draw and measure things
What do you think is about 1 inch long
How many steps long do you think it is from
object Organize represent
and interpret data with up to three categories on simple graphs and charts
Analyze and formulate questions based on simple graphs and charts
Identify time to the hour and half hour on both a digital and analog clock
Write time to the hour and half hour on both analog and digital clocks
Draw the hands on an analog clock for a give time to the hour or half hour
Relate times to the half hour to ldquohalf pastrdquo the hour
using their personal unit of measurement
The teacher will select a classroom object and the students will be asked to illustrate objects in the room that are bigger and smaller in size
The students will be able to organize represent and interpret data up to three categories through the use of a bar graph
The teacher will then divide students into heterogeneous groups and encourage the students to explain what they can learn from the graph The students will present findings following activity
Students will choose an object within classroom then find additional objects one being larger the other being shorter using a two-column chart Draw or write the objects in the chart
Create a human clock students will hold 12 numbered plates One student will stand in the middle as the minute and hour hand to model various times
Students will have their own demonstration clocks students will identify and find the hour and minute hands
Students create their own clocks using paper plates students will manipulate hands to identify varying times
Students will listen to Jack Hartman ldquoTick Tockrdquo song
Teachers and students will view clock on videos on brainpopjrcom students
Take 3 objects and order them from smallest to largest and largest to smallest
Read a series of clocks (analog and digital) and tell the time to the hour and half hour
Using blank clocks the students will draw the hands to show a designated time
Use a personal measurement (ie your thumb) to measure the length of an object
19
Keansburg School DistrictCurriculum System
Mathematicsthe front of the classroom to the back
If we measure in footsteps why are some of the measurements different
How is longer and shorter similar to greater and lesser
and teachers can complete quizzes available on website
Teachers will present time on an analog clock students will write the digital time on a white board
Students will play clock concentration
Exceeds Standard
The students will work in pairs to locate objects around the room and compare the lengths against each other The pairs will then work with another pair of students and compare the lengths of their objects with the objects the other pair located
Teacher will introduce the ruler in comparison to the yardstick The students will be encouraged to find objects that in the room that are larger than a ruler and measure using the yardstick
After the teacher introduces units of personal measurement the students will be encouraged to measure object in the room using their own unit of personal measurement and convert it into a standard measurement using a ruler or a yardstick
The teacher will select a classroom object and the students will be asked to illustrate objects in the room that are bigger and smaller by a specific size
The students will be able to organize represent and interpret data up to four
20
Keansburg School DistrictCurriculum System
Mathematicsor more categories through the use of a bar graph
The teacher will then divide students into heterogeneous groups and encourage the students to explain what they can learn from the graph and create a tally chart utilizing the data
Students will create clock flash cards by drawing an analog clock on one side and writing the digital clock time on the other
Give students a clock and a blue number cube ()
21
Keansburg School DistrictCurriculum System
MathematicsKeansburg School DistrictCurriculum Management System
SubjectGradeLevelMathematicsGrade 1
Timeline December-Quarter 2
Topic(s) Geometry
Significance of Learning Goal(s) To identify shapes and their attribures
Sugg
este
d D
ays
of
Inst
ruct
ion Content
Standards CPI Essential
Questions
Specific Learning Objective(s)
The Students Will Be Able To
Suggested Activities
Instructional Tools Materials
Technology Resources
Assessments and Assessment Models
CPI1G1 1G2
EQ Where do
you see shapes in our classroom
Are there different shapes outside
How are geometric figures alike
How can we sort
Concept(s) Identify shapes and their attributes
SWBAT Distinguish
between two and three-dimensional shapes by classifying their attributes For example color shape and size
Compare and contrast shapes based on their attributes
Construct and create shapes
Meets Standard Sorting shapes based on their attributes For example
number of sideso Materials attribute blocks shape card sheet sorting
mat Introduce vocabulary cylinder cube sphere rectangular
prism triangular prism pyramid Classroom shape hunt students go around the room finding shapes within the classroom For example trash can tissue box clock
o Materials shape sheet classroom objects httpilluminationsnctmorgLessonDetailaspxid=L237
Create 3-dimenstion shapes (rectangular prism pyramid cube)
o Straws twist ties shape cards Create 2-dimensional shapes (trapezoid triangle circle
rectangle rhombus)o Pattern block templates attribute blocks pattern
block template stencil geo-boards rubber bands httpilluminationsnctmorgLessonDetailaspx
Attribute blocks Shape card
sheet Sorting mat Twist ties Straws Shape cards Pattern block
templates Attribute blocks Pattern block
template stencil Geo-boards Rubber bands
22
Keansburg School DistrictCurriculum System
Mathematicsobjects of different shapes
How can shapes and solids be described compared and used to make other shapes What are equal parts
What foods do you divide into equal parts
What other items might be divided
How do you know if you have an equal share
possessing certain attributes
Identify and construct two-dimensional shapes
Identify and construct three-dimensional figures
id=L168 Create a drawing using shapes students will create a
picture using the pattern block template stencil (house sun flowers etc)
o Paper pattern block stencil template crayons
Apply understanding of attributes by playing Shape Detective and Attribute Train Game
Demonstrate understanding of 3 Dimensional shapes by playing Whatrsquos My Shape
Exceeds Standard
Introducing and exposing higher vocabulary polyhedronpolyhedra (many faces of a shape) Placing the word onto the word wall
Students read the poem Shapes by Shel Silverstein and create their own illustration of the poem to explore geometric figures and positional words
Materials httpilluminationsnctmorgLessonDetailaspxID=L202
Shapes by Shel Silverstein paper crayons pencils examples of rectangles triangles circles
Compose clues using inferencing to play Guess What Display variety of 3 dimensional shapes Silently choose
an object and give clues about it For example I amsmall I have 2 flat faces and if you trace my faces youwill get circles What am I (tomato can)
Students work together to use pattern blocks to coverother pattern blocks For example how many triangleblocks are needed to cover a hexagon block
Student rotate in groups to visit each geometric solidwhile completing a chart which shows faces sides and
Typical Assessment Question(s) or Task(s)
Ask students how many sides each shape has
Have students classify shapes based on number of sides
Have students identify shapes in the classroom
Have students create 2 and 3 dimensional shapes
Have students design pictures using pattern blockspattern block template
Have students identify and describe assigned shapersquos attributes
Ask students to name 3 dimensional shapes hidden i bag (Whatrsquos my Shape Game)
23
Keansburg School DistrictCurriculum System
Mathematics corners Students compose a shape town by using their pattern
block templates Then students will calculate the totalnumber of each pattern block used
Students will invent new shapes by using three-dimensional shapes
Students will create patterns using three dimensionalshapes
24
Keansburg School DistrictCurriculum System
MathematicsKeansburg School DistrictCurriculum Management System
SubjectGradeLevelMathematicsGrade 1
Timeline January-Quarter 2
Topic(s) Number and Operations in Base Ten
Significance of Learning Goal(s) To recognize compare and understand numbers to 120
Sugg
este
d D
ays
of
Inst
ruct
ion Content
Standards CPI Essential
Questions
Specific Learning Objective(s)
The Students Will Be Able To
Suggested ActivitiesInstructional Tools Materials
Technology Resources Assessments and Assessment
Models
25
Keansburg School DistrictCurriculum System
MathematicsCPI 1NBT1 1NBT2A 1NBT2B 1NBT2C 1NBT3
EQ How do
numbers help us
How can sets of numbers be counted compared and ordered
How can I use numbers to solve problems
How would putting numbers on a chart make it easier to understand information
How can I make it easier to understand numbers when I sort them
What is place value
Concept(s) Recognize compare and understand numbers up to 120
SWBAT Recognize read write
and count 0-120 Understand that a two-
digit number represents amounts of tens and ones
Relate groups of ten to skip counting
Compare two two-digit numbers based on meanings of tens and ones digits using symbols ltgt and =
Meets Standard Teacher will cover up specific numbers
on an enlarged number grid using cover up tape to have students identify numbers before and after Students will come up and write the missing numbers
Students will play ldquoI have__ Who has __ Teacher will create cards using index cards and numbers in which students need further practice with Students will read their cards aloud Variations of game can include identifying specific numbers identifying numbers more or less etc)
Students will use base ten blocks to represent numbers including three digit numbers Students will identify representation of numbers through these manipulatives They may match the representation to the written number
Students will write the number they created using the base ten blocks using their white boards and markers
Students will arrange given digits to create the greatest and lowest possible numbers They can show each number they create using base ten blocks
Students will use the Base Ten Exchange Game to show an
Number grids ldquoI have Who hasrdquo index
cards base ten blocks white boards markers number cards dice ten frame base ten concentration
boards (k-5 math teaching resources)
double ten frame boards (k-5 math teaching resources)
Typical Assessment Question(s) or Task(s)
Recognize numbers 1-120 using flashcards
Write numbers 1-20 using block or graph paper
Build two-digit numbers using tens and ones blocks
Listen and note students skip counting orally by tens to 120
Students compare and label two numbers using relation symbols
26
Keansburg School DistrictCurriculum System
Mathematics Why is place
value important
How can I use place value to compare and order numbers
How can I use the number grid to help me with counting numbers
How many times do you think you can hop in one minute
What does number relationships mean
Why do we need to know how to add
Why do we need to know how to subtract
How are addition and subtraction related
What are doubles
How can
understanding of exchanging ones for tens and tens for hundreds Students can use place value mats base ten blocks (cubes tens and flats) Students can take number of cubes displayed with roll of single die Students will determine when exchanging can be made when reaching ten units
Teens on the ten frame wwwk-5mathteachingresourcescom
Base ten concentration wwwk-5mathteachingresourcescom
Ten frame compare wwwk-5mathteachingresourcescom
Exceeds Standard
Students will create riddles Irsquom thinking of a number that has 4 tens and 13 ones Have students solve the riddle by regrouping the ones to find the answer
-Students use hundreds chart to jump up and down from a number to show 10 more or 10 less
-Students will play Whatrsquos my Number by giving clues based on place value odd or even and number sense For example Irsquom a two digit number The digit in my tens place is 2 more than 4
27
Keansburg School DistrictCurriculum System
Mathematicsdouble facts help us to add and subtract
Does it matter what order you use to add three numbers Why or why not
The digit in my ones place is 3 less than 8 Whatrsquos my number
My double ten frame riddle wwwk-5mathteachingresourcescom
28
Keansburg School DistrictCurriculum System
MathematicsKeansburg School DistrictCurriculum Management System
SubjectGradeLevelMathematicsGrade 1
Timeline February-Quarter 3
Topic(s) Operations amp Algebraic Expressions
Significance of Learning Goal(s) To solve addition and subtraction problems
Sugg
este
d D
ays
of
Inst
ruct
ion Content
Standards CPI
Essential Questions
Specific Learning Objective(s)
The Students Will Be Able To
Suggested ActivitiesInstructional Tools Materials
Technology Resources Assessments and Assessment
Models
CPI1OA31OA4 1OA5 1OA6 1OA7 1OA81OA2
EQ What
questions can be answered using addition
What strategies can be used to solve problems
How can we
Concept(s) Solve addition with and subtraction problems
SWBAT Solve addition problems
with sums up to 20 Use addition within 20 to
solve word problems involving real life situations
Solve word problems that call for addition of three whole numbers up to 20
Solve subtraction problems with difference up to 20
Use subtraction within 20 to solve word problems involving real
Meets Standard Model and have students create their
own individual number sentence using manipulatives and label operation symbols
Students will choose a strategy to solve number stories such as objects fingers and pictures count onback number line or number grid
Create real life situations in which students will use a strategy to solve a number story and create a number model
Review addition and subtraction number stories posters stating each key word for addition and subtraction operations
Combine and mix two sets of 0-20 number cards One partner draws two number cards from the top of the deck students will design and generate a number story using the two numbers
Materials Manipulatives (examples
counting bears connecting cubes pennies counters etc)
Slates dry erase markers erasers
Clear Sheet Protectors Sets of 0-20 number cards Number cards Cardstock Scrabble tiles letter cards
Typical Assessment Question(s) or Task(s)
Students will solve real life
29
Keansburg School DistrictCurriculum System
Mathematicstell how many
How does knowing math facts make math easier
How can numbers be helpful
Why do I need to subtract
How do we use addition and subtraction in our everyday life
Why are fact families important
What strategies can be used to solve problems How is counting on different from just counting to add
What information do you need to know in order to find
life situations Understand subtraction
as an unknown addend problem example subtract 9-5 by finding the number that makes 9 when added to 5
Both partners solve the problem in the number story and write the answer on their slate
Find three cards that have a sum of 12 how many different ways can the student make the sum of 12 using three cards students record work
-Teacher creates real life word problemsinvolving three addends up to 20
Ten frames subtraction wwwk-5mathteachingresourcescom
I have who has wwwk-5mathteachingresourcescom
True or false wwwk-5mathteachingresourcescom
Count to 20 wwwk-5mathteachingresourcescom
Exceeds Standard
Teacher creates multi step word problems for students to solve
Students work with partners or small groups to create real life word problems Compose class book of problems
Three letter addends use scrabble tiles or letter cards with corresponding numbers to make three letter words find
word problems Students will create their
own number sentences own number storiesword problems
Students will create and solve number stories in cooperative learning groups
Students will generate word problems using assigned numbers
30
Keansburg School DistrictCurriculum System
Mathematicsthe total number of something
Why would you need to count back
How are subtraction and addition related
the sum of each word by adding the numbers on the tiles Students will find which words have the greatest or smallest sum
31
Keansburg School DistrictCurriculum System
MathematicsKeansburg School DistrictCurriculum Management System
SubjectGradeLevelMathematicsGrade 1
Timeline March-Quarter 3
Topic(s) Measurement amp Data
Significance of Learning Goal(s) To tell time and compare measurements
Sugg
este
d D
ays
of
Inst
ruct
ion Content
Standards CPI
Essential Questions
Specific Learning Objective(s)
The Students Will Be Able ToSuggested Activities
Instructional Tools Materials Technology Resources
Assessments and Assessment Models
How would I know if a bar graph correctly shows what is on a tally chart
How could a bar graph answer a question
Do bar graphs make it easier to understand and compare facts Why
What kind
Concept(s) Telling time comparing measurements
SWBAT Identify and write time to
the hour and half hour on both a digital and analog clock
Write time to the hour and half-hour on both digital and analog clocks
Draw the hands on the analog clock for a given time to the hour or half-hour
Relate times to the half hour as ldquohalf-pastrdquo the hour
Compare and contrast
Meets Standard Students will have their own
demonstration clocks students will identify and find the hour and minute hands
Students create their own clocks using paper plates students will manipulate hands to identify varying times
Students will listen to Jack Hartman ldquoTick Tockrdquo song
Teachers and students will view clock on videos on brainpopjrcom students and teachers can complete quizzes available on website
Teachers will present time on an analog clock students will write the digital time on a white board
Students will play clock concentration Teacher will introduce measurement by
holding up objects and the students will examine the objects and explain the size
Large Judy Clock Individual student Judy
clocks Wipe off analogdigital clocks Clock stampers Timers Rulers Yardsticks Measuring tapes Sheet protectors Cardstock Paper plates Fasteners Index cards
Typical Assessment Question(s) or Task(s)
Students will be asked to identify and write time to the hour and half hour on both
32
Keansburg School DistrictCurriculum System
Mathematicsof graph should I use to answer questions
Why do I need to tell time
How many hands does a clock have
Are the hands on the clock the same size
How long is a minute
Why do I need to use a calendar
How do we use the clock and the calendar to determine what we will do in school
Why do we need to measure something
What can
objects by length Construct objects at
contrasting lengths
ordero Students will break into groups
and compare objects further and classify them depending on their size
Teacher will introduce the ruler Explain to students that the ruler is used to measure objects The students will then explore the classroom and select objects around the room that are smaller and larger than the ruler
Teacher will select specific body parts that the students will use as a personal unit of measurement The students will work in pairs to demonstrate how to measure objects around the room using their personal unit of measurement
The teacher will select a classroom object and the students will be asked to illustrate objects in the room that are bigger and smaller in size
The students will be able to organize represent and interpret data up to three categories through the use of a bar graph
The teacher will then divide students into heterogeneous groups and encourage the students to explain what they can learn from the graph The students will present findings following activity
Students will choose an object within classroom then find additional objects one being larger the other being shorter using a two-column chart Draw or write the objects in the chart
digital and analog clocks Students will be asked to
identify the parts of a clock students will be asked to draw the hands on an analog clock for a given time to the hour or half-hour
Students will be given various objects and will further be asked to compare and contrast the lengths of these objects
Students will be asked to provide or create objects contrasting lengths to demonstrate understanding of differences in length
33
Keansburg School DistrictCurriculum System
Mathematicswe use to draw and measure things
What do you think is about 1 inch long
How many steps long do you think it is from the front of the classroom to the back
If we measure in footsteps why are some of the measurements different
How is longer and shorter similar to greater and lesser
Exceeds Standard
The students will work in pairs to locate objects around the room and compare the lengths against each other The pairs will then work with another pair of students and compare the lengths of their objects with the objects the other pair located
Teacher will introduce the ruler in comparison to the yardstick The students will be encouraged to find objects that in the room that are larger than a ruler and measure using the yardstick
After the teacher introduces units of personal measurement the students will be encouraged to measure object in the room using their own unit of personal measurement and convert it into a standard measurement using a ruler or a yardstick
The teacher will select a classroom object and the students will be asked to illustrate objects in the room that are bigger and smaller by a specific size
The students will be able to organize represent and interpret data up to four or more categories through the use of a bar graph
The teacher will then divide students into heterogeneous groups and encourage the students to explain what they can learn from the graph and create a tally chart utilizing the data
Students will create clock flash cards by
34
Keansburg School DistrictCurriculum System
Mathematicsdrawing an analog clock on one side and writing the digital clock time on the other Students will include time in five minute intervals
Pose word problems where students have to find elapse time to the hour and half hour
Introduce second hand and conduct activities that are timed in seconds (Examples hopping on 1 foot blinking eyes counting to the highest number)
35
Keansburg School DistrictCurriculum System
MathematicsKeansburg School DistrictCurriculum Management System
SubjectGradeLevelMathematicsGrade 1
Timeline April-Quarter 4
Topic(s) Geometry
Significance of Learning Goal(s) To identify two and three dimensional shapes to understand fractional parts and create equal shares
Sugg
este
d D
ays
of
Inst
ruct
ion Content
Standards CPI Essential
Questions
Specific Learning Objective(s)
The Students Will Be Able To
Suggested ActivitiesInstructional Tools Materials
Technology Resources Assessments and Assessment
Models
Are there different shapes outside
How are geometric figures alike
How can we sort objects of different shapes
How can shapes and solids be described compared and used to make other shapes
Concept(s) Two and three dimensional shapes fractional parts equal shares
SWBAT
Combine two-dimensional or three-dimensional shapes or figures to create a new composite shape and identify the shapes within
Identify fractional parts of circles and rectangles into equal shares while developing vocabulary for halves fourths and quarters
Describe the whole as
Meets Standard
Determine which shape by touch without using their sight
o Materials attribute blocks shape sheet feely box wwwilluminationsnctmorglessondetail
Sorting 3-dimensional objects students will be given cards with 3-dimensional objects (trash can soup can globe ball tissue box box dice) they will sort them based on the 3-dimensional shape they represent
o 3-dimensional object cards sorting mats
Pizza and Cake Fractions students will utilize a pizza and a cake to work on the concept of fractions while developing the vocabulary halves quarters and fourths
o Materials teacher created pizza
Attribute blocks Geometric shapes 3-dimensional object
cards Sorting maps 3-dimensional shapes Solid and lane figures Geo-boards and rubber
bands Fraction circles Sheet protectors 2-dimensional shapes
Typical Assessment Question(s) or Task(s)
Students will be asked to describe and identify
36
Keansburg School DistrictCurriculum System
MathematicsWhat are equal parts
What foods do you divide into equal parts
What other items might be divided
How do you know if you have an equal share
two of or four of the shares Understand for these examples that decomposing into more equal shares creates smaller shares
and cake that are cut into fractions (construction paper)
Students will illustrate a picture of a boat using at least one three dimensional shape in their drawings Shapes include cubes cylinders spheres cones and rectangular prisms
Solid and Plane Figures Name the Face activity Provide three-dimensional objects Have students draw the face for each object as well as name the shape Examples ABC block juice can book party hat
Introduce fractions by having students identify shapes that show equal parts Display cut out shapes using document camera Include some shapes that are divided equally and some that are not divided equally As a whole group sort shapes into two categories Then have students go back to their desks and work with a partner to classify additional shapes
Provide students with shapes that are divided into four parts Include shapes that are divided into four equal parts and others that are unequal Students identify the shapes that are divided into four equal parts and explain their reasoning
Shape Town activity Students will design a shape town using the following shapes
shapes within combined two and three-dimensional shapes
Students will be given circles and rectangles students will be asked to divide these shapes into halves fourths and quarters
Students will be asked to sort shapes that are divided equally and not divided equally
37
Keansburg School DistrictCurriculum System
Mathematicstrapezoid hexagon square triangle and circle Afterwards students will calculate the total number of each shape they included After completing the activity students will present their final product to the class and explain how they decided which shapes to use
Given an array of dots students will draw shapes with specific number of sides and corners and connect the dots to create the shapes Example Draw a shape with 5 sides Draw a shape with 6 corners
Students will create two-dimensional shapes on geoboards Then using different colored rubber bands students will divide the shapes into equal parts Students will transfer their equally divided shapes onto geoboard paper by drawing lines to show their equal parts
Play the Fraction Path Game Materials Fraction circles a circle with frac12 shaded a circle with 13 shaded and a circle with frac14 shaded Gameboard Path consisting of assorted shapes divided into halves thirds and fourths Players Needed 3 Directions Place the fraction circles facedown Players close their eyes and pick one fraction circle Each player follows the path from start to finish Each player looks at each shape on the path and records how many shapes show their fractions Players record
38
Keansburg School DistrictCurriculum System
Mathematicstheir results on paper using tally marks At end of game students compare total number of shapes that show their fraction
Exceeds Standard
39
Keansburg School DistrictCurriculum System
MathematicsKeansburg School DistrictCurriculum Management System
SubjectGradeLevelMathematicsGrade 1
Timeline May-Quarter 4
Topic(s) Number and Operations in Base Ten
Significance of Learning Goal(s) To use place value to add and subtract
Sugg
este
d D
ays
of
Inst
ruct
ion Content
Standards CPI Essential
Questions
Specific Learning Objective(s)
The Students Will Be Able ToSuggested Activities
Instructional Tools Materials Technology Resources
Assessments and Assessment Models
40
Keansburg School DistrictCurriculum System
MathematicsCPI 1NBT4 1NBT5 1NBT6
EQ How do
numbers help us
How can sets of numbers be counted compared and ordered
How can I use numbers to solve problems
How would putting numbers on a chart make it easier to understand information
How can I make it easier to understand numbers when I sort them
What is place value
Why is place value important
How can I
Concept(s) Use place value and properties of operations to add and subtract
SWBAT Use mental math to find
10 more or ten less than a given two-digit number and explain reasoning used within any number to 120
Use place value to add within 100 add a two-digit number to a one-digit number and add a two-digit number to a multiple of ten
Understand when adding two-digit numbers that ones add to the ones and tens add to the tens and sometimes it is necessary to compose a ten by regrouping
For all above objects students will use concrete models and strategies based on place value and relate the strategy to a written method and explain the reasoning used
Subtract multiples of 10 in the range 10-90 from multiples of 10 in the range 10-90 using
Meets Standard
Comparing two digit numbers wwwk-5mathteachingresourcescom
Subtraction split wwwk-5mathteachingresourcescom
Ten more wwwk-5mathteachingresourcescom
Addition split wwwk-5mathteachingresourcescom
Exceeds Standard
Comparing 3-Digit numbers wwwk-5mathteachingresourcescom
What number is wwwk-5mathteachingresourcescom
Students develop addition and subtraction number stories and have partners solve
Create pictures using basendash10 blocks Students trace picture onto paper label the base ten blocks with their value and add total
Solve number grid puzzles by adding and subtraction 10 on the number grid
Number cards Base 10 blocks Counters Number grid puzzles Sleeve protectors wwwk-
5mathteachingresourcescom
Dice
Typical Assessment Question(s) or Task(s)
Recognize numbers 1-120 using flashcards
Write numbers 1-20 using block or graph paper
Build two-digit numbers using tens and ones blocks
Listen and note students skip counting orally by tens to 120
Students compare and label two numbers using relation symbols
41
Keansburg School DistrictCurriculum System
Mathematics
42
Keansburg School DistrictCurriculum System
MathematicsKeansburg School DistrictCurriculum Management System
SubjectGradeLevelMathematicsGrade 1
Timeline June-Quarter 4
Topic(s) Readiness skills for September of Grade 2
Significance of Learning Goal(s) To compare larger numbers add fluently and apply measurement skills
Sugg
este
d D
ays
of
Inst
ruct
ion Content
Standards CPI Essential Questions
Specific Learning Objective(s)
The Students Will Be Able ToSuggested Activities
Instructional Tools Materials Technology Resources
Assessments and Assessment Models
CPI
EQ How can I use
place value to compare and
order numbers in the 100s
How can mastering basic addition and subtraction facts help me compute larger numbers
How can I tie in
Concept(s)Use place value to compare larger numbers fluently add up to 20 apply measurement skills
SWBAT Extend place value into
the hundreds place and re-write and construct models beyond the hundreds
Fluently add and subtract within 20 using mental strategies
Apply measurement skills
Meets Standard Place Value barrier game httpwwwk-
5mathteachingresourcescommath-gameshtml (place value only)
High card
httpwwwlearningboxcomBase10 BaseTenhtml
Time barrier game httpwwwk-5mathteachingresourcescomsupport-filestimebarriergamepdf httpwwwk-5mathteachingresourcescomsupport-filestimebarriergamegridpdf
My favorite time of day writing activity
number cards base ten blocks rulers tape measurer string number relationship mat paper plates cotton balls judy clock digital clock
Typical Assessment Question(s) or Task(s)
Students will solve addition and subtraction problems within 20 in a given time
43
Keansburg School DistrictCurriculum System
Mathematicsmeasurement skills with real life experiences
httpwwwk-5mathteachingresourcescomsupport-filesmy-favorite-time-of-daypdf
Estimating length httpwwwk-5mathteachingresourcescomsupport-filesestimatinglengthpdf
Olympic golf plastic golf clubs cotton balls and tape measurer
Olympic smiles measuring smiles with string and rulers
Olympic Frisbee using paper plates and tape measurer
Olympic airplane students will make paper airplanes measure the distance that they can throw their airplane
Doubles plus 1 game httpwwwk-5mathteachingresourcescomsupport-filesdoubles-plus-onepdf
Eleven more httpwwwk-5mathteachingresourcescomsupport-fileselevenmorepdf
frame Students will be asked to
measure items using inches and centimeters
Identify and create numbers with place values extending into the hundreds place
44
Keansburg School DistrictCurriculum System
Mathematics
Building numbers with base ten blocks pick three cards and arrange them to show a 3-digit number build that number with base ten blocks repeat with the same three cards until no new numbers can be made
Length strength inches httpwwwharcourtschoolcomactivitylength_strength1_inches
Length strength centimeters httpwwwharcourtschoolcomactivitylength_strength1_centi
Exceeds Standard
Number relationship mat wwwk-5mathteachingresourcescom
Place value barrier game httpwwwk-5mathteachingresourcescommath-gameshtml (integrate other skills into place values for example the digit in my 10s place is four doubled)
Measuring the mousersquos path httpwwwk-5mathteachingresourcescomsupport-filespaths1pdf
45
Keansburg School DistrictCurriculum System
Mathematics
Double minus 1 game httpwwwk-5mathteachingresourcescomsupport-filesdoubles-minus-onepdf
Number relationship mat httpwwwk-5mathteachingresourcescomsupport-filesnumberrelationshipmatpdf
46
Keansburg School DistrictCurriculum System
Mathematicsignment Matrices of Common Core State Standards
Grade Strand Standard Standard
Sept
embe
r ndash
Oct
ober
Nov
embe
r ndash
Dec
embe
r
Janu
ary
ndash Fe
brua
ry
Mar
ch ndash
Apr
il
May
- Ju
ne
1 OA 1
CC1OA1 Represent and solve problems involving addition and subtraction Use addition and subtraction within 20 to solve word problems involving situations of adding to taking from putting together taking apart and comparing with unknowns in all positions eg by using objects drawings and equations with a symbol for the unknown number to represent the problem
1 OA 2
CC1OA2 Represent and solve problems involving addition and subtraction Solve word problems that call for addition of three whole numbers whose sum is less than or equal to 20 eg by using objects drawings and equations with a symbol for the unknown number to represent the problem
1 OA 3
CC1OA3 Understand and apply properties of operations and the relationship between addition and subtraction Apply properties of operations as strategies to add and subtract Examples If 8 + 3 = 11 is known then 3 + 8 = 11 is also known (Commutative property of addition) To add 2 + 6 + 4 the second two numbers can be added to make a ten so 2 + 6 + 4 = 2 + 10 = 12 (Associative property of addition) (Students need not use formal terms for these properties)
1 OA 4
CC1OA4 Understand and apply properties of operations and the relationship between addition and subtraction Understand subtraction as an unknown-addend problem For example subtract 10 ndash 8 by finding the number that makes 10 when added to 8
1 OA 5 CC1OA5 Add and subtract within 20 Relate counting to addition and subtraction (eg by counting on 2 to add 2)
1 OA 6 CC1OA6 Add and subtract within 20 Add and subtract within 20 demonstrating fluency for addition and subtraction within 10 Use strategies such as counting on making ten (eg 8 + 6 = 8 + 2 + 4 = 10 + 4 = 14) decomposing a number leading to a ten (eg 13 ndash 4 = 13 ndash 3 ndash 1 = 10 ndash 1 = 9) using the relationship between addition and subtraction (eg knowing that 8 + 4
47
Keansburg School DistrictCurriculum System
Mathematics= 12 one knows 12 ndash 8 = 4) and creating equivalent but easier or known sums (eg adding 6 + 7 by creating the known equivalent 6 + 6 + 1 = 12 + 1 = 13)
1 OA 7
CC1OA7 Work with addition and subtraction equations Understand the meaning of the equal sign and determine if equations involving addition and subtraction are true or false For example which of the following equations are true and which are false 6 = 6 7 = 8 ndash 1 5 + 2 = 2 + 5 4 + 1 = 5 + 2
1 OA 8
CC1OA8 Work with addition and subtraction equations Determine the unknown whole number in an addition or subtraction equation relating three whole numbers For example determine the unknown number that makes the equation true in each of the equations 8 + = 11 5 = _ ndash 3 6 + 6 = _
1 NBT 1
CC1NBT1 Extend the counting sequence Count to 120 starting at any number less than 120 In this range read and write numerals and represent a number of objects with a written numeral
1 NBT 2
CC1NBT2 Understand place value Understand that the two digits of a two-digit number represent amounts of tens and ones Understand the following as special cases -- a 10 can be thought of as a bundle of ten ones mdash called a ldquotenrdquo -- b The numbers from 11 to 19 are composed of a ten and one two three four five six seven eight or nine ones -- c The numbers 10 20 30 40 50 60 70 80 90 refer to one two three four five six seven eight or nine tens (and 0 ones)
1 NBT 3
CC1NBT3 Understand place value Compare two two-digit numbers based on meanings of the tens and ones digits recording the results of comparisons with the symbols gt = and lt
1 NBT 4
CC1NBT4 Use place value understanding and properties of operations to add and subtract Add within 100 including adding a two-digit number and a one-digit number and adding a two-digit number and a multiple of 10 using concrete models or drawings and strategies based on place value properties of operations andor the relationship between addition and subtraction relate the strategy to a written method and explain the reasoning used Understand that in adding two-digit numbers one adds tens and tens ones and ones and sometimes it is necessary to compose a ten
1 NBT 5
CC1NBT5 Use place value understanding and properties of operations to add and subtract Given a two-digit number mentally find 10 more or 10 less than the number without having to count explain the reasoning used
1 NBT 6 CC1NBT6 Use place value understanding and properties of operations to add and subtract Subtract multiples of 10 in the range 10-90 from multiples of 10 in the range 10-90 (positive or zero differences) using concrete models or drawings and strategies based on place value properties of operations andor
48
Keansburg School DistrictCurriculum System
Mathematicsthe relationship between addition and subtraction relate the strategy to a written method and explain the reasoning used
1 MD 1
CC1MD1 Measure lengths indirectly and by iterating length units Order three objects by length compare the lengths of two objects indirectly by using a third object
1 MD 2
CC1MD2 Measure lengths indirectly and by iterating length units Express the length of an object as a whole number of length units by laying multiple copies of a shorter object (the length unit) end to end understand that the length measurement of an object is the number of same-size length units that span it with no gaps or overlaps Limit to contexts where the object being measured is spanned by a whole number of length units with no gaps or overlaps
1 MD 3CC1MD3 Tell and write time Tell and write time in hours and half-hours using analog and digital clocks
1 MD 4
CC1MD4 Represent and interpret data Organize represent and interpret data with up to three categories ask and answer questions about the total number of data points how many in each category and how many more or less are in one category than in another
1 G 1
CC1G1 Reason with shapes and their attributes Distinguish between defining attributes (eg triangles are closed and three-sided) versus non-defining attributes (eg color orientation overall size) for a wide variety of shapes build and draw shapes to possess defining attributes
1 G 2
CC1G2 Reason with shapes and their attributes Compose two-dimensional shapes (rectangles squares trapezoids triangles half-circles and quarter-circles) or three-dimensional shapes (cubes right rectangular prisms right circular cones and right circular cylinders) to create a composite shape and compose new shapes from the composite shape (Students do not need to learn formal names such as ldquoright rectangular prismrdquo)
1 G 3
CC1G3 Reason with shapes and their attributes Partition circles and rectangles into two and four equal shares describe the shares using the words halves fourths and quarters and use the phrases half of fourth of and quarter of Describe the whole as two of or four of the shares Understand for these examples that decomposing into more equal shares creates smaller shares
49
Keansburg School DistrictCurriculum System
Mathematics
Common Core State Standards Vocabulary
Addition and subtraction within 5 10 20 100 or 1000 Addition or subtraction of two whole numbers with whole number answers and with sum or minuend in the range 0-5 0-10 0-20 or 0-100 respectively Example 8 + 2 = 10 is an addition within 10 14 ndash 5 = 9 is a subtraction within 20 and 55 ndash 18 = 37 is a subtraction within 100
Additive inverses Two numbers whose sum is 0 are additive inverses of one another Example 34 and ndash 34 are additive inverses of one another because 34 + (ndash 34) = (ndash 34) + 34 = 0
Associative property of addition See Table 3 in this Glossary
Associative property of multiplication See Table 3 in this Glossary
Bivariate data Pairs of linked numerical observations Example a list of heights and weights for each player on a football team
Box plot A method of visually displaying a distribution of data values by using the median quartiles and extremes of the data set A box shows the middle 50 of the data1
Commutative property See Table 3 in this Glossary
Complex fraction A fraction AB where A andor B are fractions (B nonzero)
Computation algorithm A set of predefined steps applicable to a class of problems that gives the correct result in every case when the steps are carried out correctly See also computation strategy
Computation strategy Purposeful manipulations that may be chosen for specific problems may not have a fixed order and may be aimed at converting one problem into another See also computation algorithm
Congruent Two plane or solid figures are congruent if one can be obtained from the other by rigid motion (a sequence of rotations reflections and translations)
Counting on A strategy for finding the number of objects in a group without having to count every member of the group For example if a stack of books is known to have 8 books and 3 more books are added to the top it is not necessary to count the stack
50
Keansburg School DistrictCurriculum System
Mathematicsall over again One can find the total by counting onmdashpointing to the top book and saying ldquoeightrdquo following this with ldquonine ten eleven There are eleven books nowrdquo
Dot plot See line plot
Dilation A transformation that moves each point along the ray through the point emanating from a fixed center and multiplies distances from the center by a common scale factor
Expanded form A multi-digit number is expressed in expanded form when it is written as a sum of single-digit multiples of powers of ten For example 643 = 600 + 40 + 3
Expected value For a random variable the weighted average of its possible values with weights given by their respective probabilities
First quartile For a data set with median M the first quartile is the median of the data values less than M Example For the data set 1 3 6 7 10 12 14 15 22 120 the first quartile is 62 See also median third quartile interquartile range
Fraction A number expressible in the form ab where a is a whole number and b is a positive whole number (The word fraction in these standards always refers to a non-negative number) See also rational number
Identity property of 0 See Table 3 in this Glossary
Independently combined probability models Two probability models are said to be combined independently if the probability of each ordered pair in the combined model equals the product of the original probabilities of the two individual outcomes in the ordered pair
Integer A number expressible in the form a or ndasha for some whole number a
Interquartile Range A measure of variation in a set of numerical data the interquartile range is the distance between the first and third quartiles of the data set Example For the data set 1 3 6 7 10 12 14 15 22 120 the interquartile range is 15 ndash 6 = 9 See also first quartile third quartile
Line plot A method of visually displaying a distribution of data values where each data value is shown as a dot or mark above a number line Also known as a dot plot3
51
Keansburg School DistrictCurriculum System
MathematicsMean A measure of center in a set of numerical data computed by adding the values in a list and then dividing by the number of values in the list4 Example For the data set 1 3 6 7 10 12 14 15 22 120 the mean is 21
Mean absolute deviation A measure of variation in a set of numerical data computed by adding the distances between each data value and the mean then dividing by the number of data values Example For the data set 2 3 6 7 10 12 14 15 22 120 the mean absolute deviation is 20
Median A measure of center in a set of numerical data The median of a list of values is the value appearing at the center of a sorted version of the listmdashor the mean of the two central values if the list contains an even number of values Example For the data set 2 3 6 7 10 12 14 15 22 90 the median is 11
Midline In the graph of a trigonometric function the horizontal line halfway between its maximum and minimum values
Multiplication and division within 100 Multiplication or division of two whole numbers with whole number answers and with product or dividend in the range 0-100 Example 72 divide 8 = 9
Multiplicative inverses Two numbers whose product is 1 are multiplicative inverses of one another Example 34 and 43 are multiplicative inverses of one another because 34 times 43 = 43 times 34 = 1
Number line diagram A diagram of the number line used to represent numbers and support reasoning about them In a number line diagram for measurement quantities the interval from 0 to 1 on the diagram represents the unit of measure for the quantity
Percent rate of change A rate of change expressed as a percent Example if a population grows from 50 to 55 in a year it grows by 550 = 10 per year
Probability distribution The set of possible values of a random variable with a probability assigned to each
Properties of operations See Table 3 in this Glossary
Properties of equality See Table 4 in this Glossary
Properties of inequality See Table 5 in this Glossary
Properties of operations See Table 3 in this Glossary
52
Keansburg School DistrictCurriculum System
MathematicsProbability A number between 0 and 1 used to quantify likelihood for processes that have uncertain outcomes (such as tossing a coin selecting a person at random from a group of people tossing a ball at a target or testing for a medical condition)
Probability model A probability model is used to assign probabilities to outcomes of a chance process by examining the nature of the process The set of all outcomes is called the sample space and their probabilities sum to 1 See also uniform probability model
Random variable An assignment of a numerical value to each outcome in a sample space
Rational expression A quotient of two polynomials with a non-zero denominator
Rational number A number expressible in the form ab or ndash ab for some fraction ab The rational numbers include the integers
Rectilinear figure A polygon all angles of which are right angles
Rigid motion A transformation of points in space consisting of a sequence of one or more translations reflections andor rotations Rigid motions are here assumed to preserve distances and angle measures
Repeating decimal The decimal form of a rational number See also terminating decimal
Sample space In a probability model for a random process a list of the individual outcomes that are to be considered
Scatter plot A graph in the coordinate plane representing a set of bivariate data For example the heights and weights of a group of people could be displayed on a scatter plot5
Similarity transformation A rigid motion followed by a dilation
Tape diagram A drawing that looks like a segment of tape used to illustrate number relationships Also known as a strip diagram bar model fraction strip or length model
Terminating decimal A decimal is called terminating if its repeating digit is 0
Third quartile For a data set with median M the third quartile is the median of the data values greater than M Example For the data set 2 3 6 7 10 12 14 15 22 120 the third quartile is 15 See also median first quartile interquartile range
Transitivity principle for indirect measurement If the length of object A is greater than the length of object B and the length of object B is greater than the length of object C then the length of object A is greater than the length of object C This principle applies
53
Keansburg School DistrictCurriculum System
Mathematicsto measurement of other quantities as well
Uniform probability model A probability model which assigns equal probability to all outcomes See also probability model
Vector A quantity with magnitude and direction in the plane or in space defined by an ordered pair or triple of real numbers
Visual fraction model A tape diagram number line diagram or area model
Whole numbers The numbers 0 1 2 3 hellip5
54
- MissionVision Statement
- Beliefs
- Measurement amp Data
- Measure lengths and by iterating length units
- Tell and write time
- Represent and interpret data
- Geometry
- Reason with shapes and their attributes
- Number and Base Ten
- Extend the counting sequence
- Understand place value
-
- Measurement amp Data (II)
-
- Measure lengths and by iterating length units
- Tell and write time
-
- Represent and interpret data
- Geometry (II)
- Reason with shapes their attributes
-
- Number and Base Ten
- Use place value understanding and properties of operations to add and subtract
- Teacher will cover up specific numbers on an enlarged number grid using cover up tape to have students identify numbers before and after Students will come up and write the missing numbers
- Students will play ldquoI have__ Who has __ Teacher will create cards using index cards and numbers in which students need further practice with Students will read their cards aloud Variations of game can include identifying specific numbers identifying numbers more or less etc)
- Students will use base ten blocks to represent numbers including three digit numbers Students will identify representation of numbers through these manipulatives They may match the representation to the written number
- Students will write the number they created using the base ten blocks using their white boards and markers
- Students will arrange given digits to create the greatest and lowest possible numbers They can show each number they create using base ten blocks
- Students will use the Base Ten Exchange Game to show an understanding of exchanging ones for tens and tens for hundreds Students can use place value mats base ten blocks (cubes tens and flats) Students can take number of cubes displayed with roll of single die Students will determine when exchanging can be made when reaching ten units
- Base ten concentration wwwk-5mathteachingresourcescom
- Ten frame compare wwwk-5mathteachingresourcescom
-
Keansburg School DistrictCurriculum System
MathematicsKeansburg School DistrictCurriculum Management System
SubjectGradeLevelMathematicsGrade 1
Timeline November-Quarter 2
Topic(s) Measurement and Data
Significance of Learning Goal(s) To understand measurement and what tools and used
Sugg
este
d D
ays
of
Inst
ruct
ion Content
Standards CPI Essential Questions
Specific Learning Objective(s)
The Students Will Be Able To
Suggested ActivitiesInstructional Tools Materials
Technology Resources Assessments and Assessment
Models
CPI 1MD1 1MD2 1MD3 1MD4
EQ Why do people
use graphs How is a bar
graph like a tally chart
How would I know if a bar graph correctly shows what is on a tally chart
How could a bar graph answer a question
Concept(s) Understanding what measurement is and what tools are used
SWBAT
Compare and order the length of up to three objects using direct comparisons
Compare the lengths of two objects indirectly by using a third object
Measure objects using non-standard units and express it as a whole number
Draw an object longer or shorter than a given
Meets Standard Teacher will introduce measurement
by holding up objects and the students will examine the objects and explain the size order
o Students will break into groups and compare objects further and classify them depending on their size
Teacher will introduce the ruler Explain to students that the ruler is used to measure objects The students will then explore the classroom and select objects around the room that are smaller and larger than the ruler
Teacher will select specific body parts that the students will use as a personal unit of measurement The students will work in pairs to demonstrate how to measure objects around the room
Rulers Judy Clock Paper Plates Classroom objects Chart paper Jack Hartmann ndash Tick Tock
Song Brainpop Jr White boards Dry Erase markers Clock Concentration
Typical Assessment Question(s) or Task(s)
Analyze a bar graph and answer questions
Create a bar graph using self ndash selected topic
18
Keansburg School DistrictCurriculum System
Mathematics Do bar graphs
make it easier to understand and compare facts Why
What kind of graph should I use to answer questions
Why do I need to tell time
How many hands does a clock have
Are the hands on the clock the same size
How long is a minute
Why do I need to use a calendar
How do we use the clock and the calendar to determine what we will do in school
Why do we need to measure something
What can we use to draw and measure things
What do you think is about 1 inch long
How many steps long do you think it is from
object Organize represent
and interpret data with up to three categories on simple graphs and charts
Analyze and formulate questions based on simple graphs and charts
Identify time to the hour and half hour on both a digital and analog clock
Write time to the hour and half hour on both analog and digital clocks
Draw the hands on an analog clock for a give time to the hour or half hour
Relate times to the half hour to ldquohalf pastrdquo the hour
using their personal unit of measurement
The teacher will select a classroom object and the students will be asked to illustrate objects in the room that are bigger and smaller in size
The students will be able to organize represent and interpret data up to three categories through the use of a bar graph
The teacher will then divide students into heterogeneous groups and encourage the students to explain what they can learn from the graph The students will present findings following activity
Students will choose an object within classroom then find additional objects one being larger the other being shorter using a two-column chart Draw or write the objects in the chart
Create a human clock students will hold 12 numbered plates One student will stand in the middle as the minute and hour hand to model various times
Students will have their own demonstration clocks students will identify and find the hour and minute hands
Students create their own clocks using paper plates students will manipulate hands to identify varying times
Students will listen to Jack Hartman ldquoTick Tockrdquo song
Teachers and students will view clock on videos on brainpopjrcom students
Take 3 objects and order them from smallest to largest and largest to smallest
Read a series of clocks (analog and digital) and tell the time to the hour and half hour
Using blank clocks the students will draw the hands to show a designated time
Use a personal measurement (ie your thumb) to measure the length of an object
19
Keansburg School DistrictCurriculum System
Mathematicsthe front of the classroom to the back
If we measure in footsteps why are some of the measurements different
How is longer and shorter similar to greater and lesser
and teachers can complete quizzes available on website
Teachers will present time on an analog clock students will write the digital time on a white board
Students will play clock concentration
Exceeds Standard
The students will work in pairs to locate objects around the room and compare the lengths against each other The pairs will then work with another pair of students and compare the lengths of their objects with the objects the other pair located
Teacher will introduce the ruler in comparison to the yardstick The students will be encouraged to find objects that in the room that are larger than a ruler and measure using the yardstick
After the teacher introduces units of personal measurement the students will be encouraged to measure object in the room using their own unit of personal measurement and convert it into a standard measurement using a ruler or a yardstick
The teacher will select a classroom object and the students will be asked to illustrate objects in the room that are bigger and smaller by a specific size
The students will be able to organize represent and interpret data up to four
20
Keansburg School DistrictCurriculum System
Mathematicsor more categories through the use of a bar graph
The teacher will then divide students into heterogeneous groups and encourage the students to explain what they can learn from the graph and create a tally chart utilizing the data
Students will create clock flash cards by drawing an analog clock on one side and writing the digital clock time on the other
Give students a clock and a blue number cube ()
21
Keansburg School DistrictCurriculum System
MathematicsKeansburg School DistrictCurriculum Management System
SubjectGradeLevelMathematicsGrade 1
Timeline December-Quarter 2
Topic(s) Geometry
Significance of Learning Goal(s) To identify shapes and their attribures
Sugg
este
d D
ays
of
Inst
ruct
ion Content
Standards CPI Essential
Questions
Specific Learning Objective(s)
The Students Will Be Able To
Suggested Activities
Instructional Tools Materials
Technology Resources
Assessments and Assessment Models
CPI1G1 1G2
EQ Where do
you see shapes in our classroom
Are there different shapes outside
How are geometric figures alike
How can we sort
Concept(s) Identify shapes and their attributes
SWBAT Distinguish
between two and three-dimensional shapes by classifying their attributes For example color shape and size
Compare and contrast shapes based on their attributes
Construct and create shapes
Meets Standard Sorting shapes based on their attributes For example
number of sideso Materials attribute blocks shape card sheet sorting
mat Introduce vocabulary cylinder cube sphere rectangular
prism triangular prism pyramid Classroom shape hunt students go around the room finding shapes within the classroom For example trash can tissue box clock
o Materials shape sheet classroom objects httpilluminationsnctmorgLessonDetailaspxid=L237
Create 3-dimenstion shapes (rectangular prism pyramid cube)
o Straws twist ties shape cards Create 2-dimensional shapes (trapezoid triangle circle
rectangle rhombus)o Pattern block templates attribute blocks pattern
block template stencil geo-boards rubber bands httpilluminationsnctmorgLessonDetailaspx
Attribute blocks Shape card
sheet Sorting mat Twist ties Straws Shape cards Pattern block
templates Attribute blocks Pattern block
template stencil Geo-boards Rubber bands
22
Keansburg School DistrictCurriculum System
Mathematicsobjects of different shapes
How can shapes and solids be described compared and used to make other shapes What are equal parts
What foods do you divide into equal parts
What other items might be divided
How do you know if you have an equal share
possessing certain attributes
Identify and construct two-dimensional shapes
Identify and construct three-dimensional figures
id=L168 Create a drawing using shapes students will create a
picture using the pattern block template stencil (house sun flowers etc)
o Paper pattern block stencil template crayons
Apply understanding of attributes by playing Shape Detective and Attribute Train Game
Demonstrate understanding of 3 Dimensional shapes by playing Whatrsquos My Shape
Exceeds Standard
Introducing and exposing higher vocabulary polyhedronpolyhedra (many faces of a shape) Placing the word onto the word wall
Students read the poem Shapes by Shel Silverstein and create their own illustration of the poem to explore geometric figures and positional words
Materials httpilluminationsnctmorgLessonDetailaspxID=L202
Shapes by Shel Silverstein paper crayons pencils examples of rectangles triangles circles
Compose clues using inferencing to play Guess What Display variety of 3 dimensional shapes Silently choose
an object and give clues about it For example I amsmall I have 2 flat faces and if you trace my faces youwill get circles What am I (tomato can)
Students work together to use pattern blocks to coverother pattern blocks For example how many triangleblocks are needed to cover a hexagon block
Student rotate in groups to visit each geometric solidwhile completing a chart which shows faces sides and
Typical Assessment Question(s) or Task(s)
Ask students how many sides each shape has
Have students classify shapes based on number of sides
Have students identify shapes in the classroom
Have students create 2 and 3 dimensional shapes
Have students design pictures using pattern blockspattern block template
Have students identify and describe assigned shapersquos attributes
Ask students to name 3 dimensional shapes hidden i bag (Whatrsquos my Shape Game)
23
Keansburg School DistrictCurriculum System
Mathematics corners Students compose a shape town by using their pattern
block templates Then students will calculate the totalnumber of each pattern block used
Students will invent new shapes by using three-dimensional shapes
Students will create patterns using three dimensionalshapes
24
Keansburg School DistrictCurriculum System
MathematicsKeansburg School DistrictCurriculum Management System
SubjectGradeLevelMathematicsGrade 1
Timeline January-Quarter 2
Topic(s) Number and Operations in Base Ten
Significance of Learning Goal(s) To recognize compare and understand numbers to 120
Sugg
este
d D
ays
of
Inst
ruct
ion Content
Standards CPI Essential
Questions
Specific Learning Objective(s)
The Students Will Be Able To
Suggested ActivitiesInstructional Tools Materials
Technology Resources Assessments and Assessment
Models
25
Keansburg School DistrictCurriculum System
MathematicsCPI 1NBT1 1NBT2A 1NBT2B 1NBT2C 1NBT3
EQ How do
numbers help us
How can sets of numbers be counted compared and ordered
How can I use numbers to solve problems
How would putting numbers on a chart make it easier to understand information
How can I make it easier to understand numbers when I sort them
What is place value
Concept(s) Recognize compare and understand numbers up to 120
SWBAT Recognize read write
and count 0-120 Understand that a two-
digit number represents amounts of tens and ones
Relate groups of ten to skip counting
Compare two two-digit numbers based on meanings of tens and ones digits using symbols ltgt and =
Meets Standard Teacher will cover up specific numbers
on an enlarged number grid using cover up tape to have students identify numbers before and after Students will come up and write the missing numbers
Students will play ldquoI have__ Who has __ Teacher will create cards using index cards and numbers in which students need further practice with Students will read their cards aloud Variations of game can include identifying specific numbers identifying numbers more or less etc)
Students will use base ten blocks to represent numbers including three digit numbers Students will identify representation of numbers through these manipulatives They may match the representation to the written number
Students will write the number they created using the base ten blocks using their white boards and markers
Students will arrange given digits to create the greatest and lowest possible numbers They can show each number they create using base ten blocks
Students will use the Base Ten Exchange Game to show an
Number grids ldquoI have Who hasrdquo index
cards base ten blocks white boards markers number cards dice ten frame base ten concentration
boards (k-5 math teaching resources)
double ten frame boards (k-5 math teaching resources)
Typical Assessment Question(s) or Task(s)
Recognize numbers 1-120 using flashcards
Write numbers 1-20 using block or graph paper
Build two-digit numbers using tens and ones blocks
Listen and note students skip counting orally by tens to 120
Students compare and label two numbers using relation symbols
26
Keansburg School DistrictCurriculum System
Mathematics Why is place
value important
How can I use place value to compare and order numbers
How can I use the number grid to help me with counting numbers
How many times do you think you can hop in one minute
What does number relationships mean
Why do we need to know how to add
Why do we need to know how to subtract
How are addition and subtraction related
What are doubles
How can
understanding of exchanging ones for tens and tens for hundreds Students can use place value mats base ten blocks (cubes tens and flats) Students can take number of cubes displayed with roll of single die Students will determine when exchanging can be made when reaching ten units
Teens on the ten frame wwwk-5mathteachingresourcescom
Base ten concentration wwwk-5mathteachingresourcescom
Ten frame compare wwwk-5mathteachingresourcescom
Exceeds Standard
Students will create riddles Irsquom thinking of a number that has 4 tens and 13 ones Have students solve the riddle by regrouping the ones to find the answer
-Students use hundreds chart to jump up and down from a number to show 10 more or 10 less
-Students will play Whatrsquos my Number by giving clues based on place value odd or even and number sense For example Irsquom a two digit number The digit in my tens place is 2 more than 4
27
Keansburg School DistrictCurriculum System
Mathematicsdouble facts help us to add and subtract
Does it matter what order you use to add three numbers Why or why not
The digit in my ones place is 3 less than 8 Whatrsquos my number
My double ten frame riddle wwwk-5mathteachingresourcescom
28
Keansburg School DistrictCurriculum System
MathematicsKeansburg School DistrictCurriculum Management System
SubjectGradeLevelMathematicsGrade 1
Timeline February-Quarter 3
Topic(s) Operations amp Algebraic Expressions
Significance of Learning Goal(s) To solve addition and subtraction problems
Sugg
este
d D
ays
of
Inst
ruct
ion Content
Standards CPI
Essential Questions
Specific Learning Objective(s)
The Students Will Be Able To
Suggested ActivitiesInstructional Tools Materials
Technology Resources Assessments and Assessment
Models
CPI1OA31OA4 1OA5 1OA6 1OA7 1OA81OA2
EQ What
questions can be answered using addition
What strategies can be used to solve problems
How can we
Concept(s) Solve addition with and subtraction problems
SWBAT Solve addition problems
with sums up to 20 Use addition within 20 to
solve word problems involving real life situations
Solve word problems that call for addition of three whole numbers up to 20
Solve subtraction problems with difference up to 20
Use subtraction within 20 to solve word problems involving real
Meets Standard Model and have students create their
own individual number sentence using manipulatives and label operation symbols
Students will choose a strategy to solve number stories such as objects fingers and pictures count onback number line or number grid
Create real life situations in which students will use a strategy to solve a number story and create a number model
Review addition and subtraction number stories posters stating each key word for addition and subtraction operations
Combine and mix two sets of 0-20 number cards One partner draws two number cards from the top of the deck students will design and generate a number story using the two numbers
Materials Manipulatives (examples
counting bears connecting cubes pennies counters etc)
Slates dry erase markers erasers
Clear Sheet Protectors Sets of 0-20 number cards Number cards Cardstock Scrabble tiles letter cards
Typical Assessment Question(s) or Task(s)
Students will solve real life
29
Keansburg School DistrictCurriculum System
Mathematicstell how many
How does knowing math facts make math easier
How can numbers be helpful
Why do I need to subtract
How do we use addition and subtraction in our everyday life
Why are fact families important
What strategies can be used to solve problems How is counting on different from just counting to add
What information do you need to know in order to find
life situations Understand subtraction
as an unknown addend problem example subtract 9-5 by finding the number that makes 9 when added to 5
Both partners solve the problem in the number story and write the answer on their slate
Find three cards that have a sum of 12 how many different ways can the student make the sum of 12 using three cards students record work
-Teacher creates real life word problemsinvolving three addends up to 20
Ten frames subtraction wwwk-5mathteachingresourcescom
I have who has wwwk-5mathteachingresourcescom
True or false wwwk-5mathteachingresourcescom
Count to 20 wwwk-5mathteachingresourcescom
Exceeds Standard
Teacher creates multi step word problems for students to solve
Students work with partners or small groups to create real life word problems Compose class book of problems
Three letter addends use scrabble tiles or letter cards with corresponding numbers to make three letter words find
word problems Students will create their
own number sentences own number storiesword problems
Students will create and solve number stories in cooperative learning groups
Students will generate word problems using assigned numbers
30
Keansburg School DistrictCurriculum System
Mathematicsthe total number of something
Why would you need to count back
How are subtraction and addition related
the sum of each word by adding the numbers on the tiles Students will find which words have the greatest or smallest sum
31
Keansburg School DistrictCurriculum System
MathematicsKeansburg School DistrictCurriculum Management System
SubjectGradeLevelMathematicsGrade 1
Timeline March-Quarter 3
Topic(s) Measurement amp Data
Significance of Learning Goal(s) To tell time and compare measurements
Sugg
este
d D
ays
of
Inst
ruct
ion Content
Standards CPI
Essential Questions
Specific Learning Objective(s)
The Students Will Be Able ToSuggested Activities
Instructional Tools Materials Technology Resources
Assessments and Assessment Models
How would I know if a bar graph correctly shows what is on a tally chart
How could a bar graph answer a question
Do bar graphs make it easier to understand and compare facts Why
What kind
Concept(s) Telling time comparing measurements
SWBAT Identify and write time to
the hour and half hour on both a digital and analog clock
Write time to the hour and half-hour on both digital and analog clocks
Draw the hands on the analog clock for a given time to the hour or half-hour
Relate times to the half hour as ldquohalf-pastrdquo the hour
Compare and contrast
Meets Standard Students will have their own
demonstration clocks students will identify and find the hour and minute hands
Students create their own clocks using paper plates students will manipulate hands to identify varying times
Students will listen to Jack Hartman ldquoTick Tockrdquo song
Teachers and students will view clock on videos on brainpopjrcom students and teachers can complete quizzes available on website
Teachers will present time on an analog clock students will write the digital time on a white board
Students will play clock concentration Teacher will introduce measurement by
holding up objects and the students will examine the objects and explain the size
Large Judy Clock Individual student Judy
clocks Wipe off analogdigital clocks Clock stampers Timers Rulers Yardsticks Measuring tapes Sheet protectors Cardstock Paper plates Fasteners Index cards
Typical Assessment Question(s) or Task(s)
Students will be asked to identify and write time to the hour and half hour on both
32
Keansburg School DistrictCurriculum System
Mathematicsof graph should I use to answer questions
Why do I need to tell time
How many hands does a clock have
Are the hands on the clock the same size
How long is a minute
Why do I need to use a calendar
How do we use the clock and the calendar to determine what we will do in school
Why do we need to measure something
What can
objects by length Construct objects at
contrasting lengths
ordero Students will break into groups
and compare objects further and classify them depending on their size
Teacher will introduce the ruler Explain to students that the ruler is used to measure objects The students will then explore the classroom and select objects around the room that are smaller and larger than the ruler
Teacher will select specific body parts that the students will use as a personal unit of measurement The students will work in pairs to demonstrate how to measure objects around the room using their personal unit of measurement
The teacher will select a classroom object and the students will be asked to illustrate objects in the room that are bigger and smaller in size
The students will be able to organize represent and interpret data up to three categories through the use of a bar graph
The teacher will then divide students into heterogeneous groups and encourage the students to explain what they can learn from the graph The students will present findings following activity
Students will choose an object within classroom then find additional objects one being larger the other being shorter using a two-column chart Draw or write the objects in the chart
digital and analog clocks Students will be asked to
identify the parts of a clock students will be asked to draw the hands on an analog clock for a given time to the hour or half-hour
Students will be given various objects and will further be asked to compare and contrast the lengths of these objects
Students will be asked to provide or create objects contrasting lengths to demonstrate understanding of differences in length
33
Keansburg School DistrictCurriculum System
Mathematicswe use to draw and measure things
What do you think is about 1 inch long
How many steps long do you think it is from the front of the classroom to the back
If we measure in footsteps why are some of the measurements different
How is longer and shorter similar to greater and lesser
Exceeds Standard
The students will work in pairs to locate objects around the room and compare the lengths against each other The pairs will then work with another pair of students and compare the lengths of their objects with the objects the other pair located
Teacher will introduce the ruler in comparison to the yardstick The students will be encouraged to find objects that in the room that are larger than a ruler and measure using the yardstick
After the teacher introduces units of personal measurement the students will be encouraged to measure object in the room using their own unit of personal measurement and convert it into a standard measurement using a ruler or a yardstick
The teacher will select a classroom object and the students will be asked to illustrate objects in the room that are bigger and smaller by a specific size
The students will be able to organize represent and interpret data up to four or more categories through the use of a bar graph
The teacher will then divide students into heterogeneous groups and encourage the students to explain what they can learn from the graph and create a tally chart utilizing the data
Students will create clock flash cards by
34
Keansburg School DistrictCurriculum System
Mathematicsdrawing an analog clock on one side and writing the digital clock time on the other Students will include time in five minute intervals
Pose word problems where students have to find elapse time to the hour and half hour
Introduce second hand and conduct activities that are timed in seconds (Examples hopping on 1 foot blinking eyes counting to the highest number)
35
Keansburg School DistrictCurriculum System
MathematicsKeansburg School DistrictCurriculum Management System
SubjectGradeLevelMathematicsGrade 1
Timeline April-Quarter 4
Topic(s) Geometry
Significance of Learning Goal(s) To identify two and three dimensional shapes to understand fractional parts and create equal shares
Sugg
este
d D
ays
of
Inst
ruct
ion Content
Standards CPI Essential
Questions
Specific Learning Objective(s)
The Students Will Be Able To
Suggested ActivitiesInstructional Tools Materials
Technology Resources Assessments and Assessment
Models
Are there different shapes outside
How are geometric figures alike
How can we sort objects of different shapes
How can shapes and solids be described compared and used to make other shapes
Concept(s) Two and three dimensional shapes fractional parts equal shares
SWBAT
Combine two-dimensional or three-dimensional shapes or figures to create a new composite shape and identify the shapes within
Identify fractional parts of circles and rectangles into equal shares while developing vocabulary for halves fourths and quarters
Describe the whole as
Meets Standard
Determine which shape by touch without using their sight
o Materials attribute blocks shape sheet feely box wwwilluminationsnctmorglessondetail
Sorting 3-dimensional objects students will be given cards with 3-dimensional objects (trash can soup can globe ball tissue box box dice) they will sort them based on the 3-dimensional shape they represent
o 3-dimensional object cards sorting mats
Pizza and Cake Fractions students will utilize a pizza and a cake to work on the concept of fractions while developing the vocabulary halves quarters and fourths
o Materials teacher created pizza
Attribute blocks Geometric shapes 3-dimensional object
cards Sorting maps 3-dimensional shapes Solid and lane figures Geo-boards and rubber
bands Fraction circles Sheet protectors 2-dimensional shapes
Typical Assessment Question(s) or Task(s)
Students will be asked to describe and identify
36
Keansburg School DistrictCurriculum System
MathematicsWhat are equal parts
What foods do you divide into equal parts
What other items might be divided
How do you know if you have an equal share
two of or four of the shares Understand for these examples that decomposing into more equal shares creates smaller shares
and cake that are cut into fractions (construction paper)
Students will illustrate a picture of a boat using at least one three dimensional shape in their drawings Shapes include cubes cylinders spheres cones and rectangular prisms
Solid and Plane Figures Name the Face activity Provide three-dimensional objects Have students draw the face for each object as well as name the shape Examples ABC block juice can book party hat
Introduce fractions by having students identify shapes that show equal parts Display cut out shapes using document camera Include some shapes that are divided equally and some that are not divided equally As a whole group sort shapes into two categories Then have students go back to their desks and work with a partner to classify additional shapes
Provide students with shapes that are divided into four parts Include shapes that are divided into four equal parts and others that are unequal Students identify the shapes that are divided into four equal parts and explain their reasoning
Shape Town activity Students will design a shape town using the following shapes
shapes within combined two and three-dimensional shapes
Students will be given circles and rectangles students will be asked to divide these shapes into halves fourths and quarters
Students will be asked to sort shapes that are divided equally and not divided equally
37
Keansburg School DistrictCurriculum System
Mathematicstrapezoid hexagon square triangle and circle Afterwards students will calculate the total number of each shape they included After completing the activity students will present their final product to the class and explain how they decided which shapes to use
Given an array of dots students will draw shapes with specific number of sides and corners and connect the dots to create the shapes Example Draw a shape with 5 sides Draw a shape with 6 corners
Students will create two-dimensional shapes on geoboards Then using different colored rubber bands students will divide the shapes into equal parts Students will transfer their equally divided shapes onto geoboard paper by drawing lines to show their equal parts
Play the Fraction Path Game Materials Fraction circles a circle with frac12 shaded a circle with 13 shaded and a circle with frac14 shaded Gameboard Path consisting of assorted shapes divided into halves thirds and fourths Players Needed 3 Directions Place the fraction circles facedown Players close their eyes and pick one fraction circle Each player follows the path from start to finish Each player looks at each shape on the path and records how many shapes show their fractions Players record
38
Keansburg School DistrictCurriculum System
Mathematicstheir results on paper using tally marks At end of game students compare total number of shapes that show their fraction
Exceeds Standard
39
Keansburg School DistrictCurriculum System
MathematicsKeansburg School DistrictCurriculum Management System
SubjectGradeLevelMathematicsGrade 1
Timeline May-Quarter 4
Topic(s) Number and Operations in Base Ten
Significance of Learning Goal(s) To use place value to add and subtract
Sugg
este
d D
ays
of
Inst
ruct
ion Content
Standards CPI Essential
Questions
Specific Learning Objective(s)
The Students Will Be Able ToSuggested Activities
Instructional Tools Materials Technology Resources
Assessments and Assessment Models
40
Keansburg School DistrictCurriculum System
MathematicsCPI 1NBT4 1NBT5 1NBT6
EQ How do
numbers help us
How can sets of numbers be counted compared and ordered
How can I use numbers to solve problems
How would putting numbers on a chart make it easier to understand information
How can I make it easier to understand numbers when I sort them
What is place value
Why is place value important
How can I
Concept(s) Use place value and properties of operations to add and subtract
SWBAT Use mental math to find
10 more or ten less than a given two-digit number and explain reasoning used within any number to 120
Use place value to add within 100 add a two-digit number to a one-digit number and add a two-digit number to a multiple of ten
Understand when adding two-digit numbers that ones add to the ones and tens add to the tens and sometimes it is necessary to compose a ten by regrouping
For all above objects students will use concrete models and strategies based on place value and relate the strategy to a written method and explain the reasoning used
Subtract multiples of 10 in the range 10-90 from multiples of 10 in the range 10-90 using
Meets Standard
Comparing two digit numbers wwwk-5mathteachingresourcescom
Subtraction split wwwk-5mathteachingresourcescom
Ten more wwwk-5mathteachingresourcescom
Addition split wwwk-5mathteachingresourcescom
Exceeds Standard
Comparing 3-Digit numbers wwwk-5mathteachingresourcescom
What number is wwwk-5mathteachingresourcescom
Students develop addition and subtraction number stories and have partners solve
Create pictures using basendash10 blocks Students trace picture onto paper label the base ten blocks with their value and add total
Solve number grid puzzles by adding and subtraction 10 on the number grid
Number cards Base 10 blocks Counters Number grid puzzles Sleeve protectors wwwk-
5mathteachingresourcescom
Dice
Typical Assessment Question(s) or Task(s)
Recognize numbers 1-120 using flashcards
Write numbers 1-20 using block or graph paper
Build two-digit numbers using tens and ones blocks
Listen and note students skip counting orally by tens to 120
Students compare and label two numbers using relation symbols
41
Keansburg School DistrictCurriculum System
Mathematics
42
Keansburg School DistrictCurriculum System
MathematicsKeansburg School DistrictCurriculum Management System
SubjectGradeLevelMathematicsGrade 1
Timeline June-Quarter 4
Topic(s) Readiness skills for September of Grade 2
Significance of Learning Goal(s) To compare larger numbers add fluently and apply measurement skills
Sugg
este
d D
ays
of
Inst
ruct
ion Content
Standards CPI Essential Questions
Specific Learning Objective(s)
The Students Will Be Able ToSuggested Activities
Instructional Tools Materials Technology Resources
Assessments and Assessment Models
CPI
EQ How can I use
place value to compare and
order numbers in the 100s
How can mastering basic addition and subtraction facts help me compute larger numbers
How can I tie in
Concept(s)Use place value to compare larger numbers fluently add up to 20 apply measurement skills
SWBAT Extend place value into
the hundreds place and re-write and construct models beyond the hundreds
Fluently add and subtract within 20 using mental strategies
Apply measurement skills
Meets Standard Place Value barrier game httpwwwk-
5mathteachingresourcescommath-gameshtml (place value only)
High card
httpwwwlearningboxcomBase10 BaseTenhtml
Time barrier game httpwwwk-5mathteachingresourcescomsupport-filestimebarriergamepdf httpwwwk-5mathteachingresourcescomsupport-filestimebarriergamegridpdf
My favorite time of day writing activity
number cards base ten blocks rulers tape measurer string number relationship mat paper plates cotton balls judy clock digital clock
Typical Assessment Question(s) or Task(s)
Students will solve addition and subtraction problems within 20 in a given time
43
Keansburg School DistrictCurriculum System
Mathematicsmeasurement skills with real life experiences
httpwwwk-5mathteachingresourcescomsupport-filesmy-favorite-time-of-daypdf
Estimating length httpwwwk-5mathteachingresourcescomsupport-filesestimatinglengthpdf
Olympic golf plastic golf clubs cotton balls and tape measurer
Olympic smiles measuring smiles with string and rulers
Olympic Frisbee using paper plates and tape measurer
Olympic airplane students will make paper airplanes measure the distance that they can throw their airplane
Doubles plus 1 game httpwwwk-5mathteachingresourcescomsupport-filesdoubles-plus-onepdf
Eleven more httpwwwk-5mathteachingresourcescomsupport-fileselevenmorepdf
frame Students will be asked to
measure items using inches and centimeters
Identify and create numbers with place values extending into the hundreds place
44
Keansburg School DistrictCurriculum System
Mathematics
Building numbers with base ten blocks pick three cards and arrange them to show a 3-digit number build that number with base ten blocks repeat with the same three cards until no new numbers can be made
Length strength inches httpwwwharcourtschoolcomactivitylength_strength1_inches
Length strength centimeters httpwwwharcourtschoolcomactivitylength_strength1_centi
Exceeds Standard
Number relationship mat wwwk-5mathteachingresourcescom
Place value barrier game httpwwwk-5mathteachingresourcescommath-gameshtml (integrate other skills into place values for example the digit in my 10s place is four doubled)
Measuring the mousersquos path httpwwwk-5mathteachingresourcescomsupport-filespaths1pdf
45
Keansburg School DistrictCurriculum System
Mathematics
Double minus 1 game httpwwwk-5mathteachingresourcescomsupport-filesdoubles-minus-onepdf
Number relationship mat httpwwwk-5mathteachingresourcescomsupport-filesnumberrelationshipmatpdf
46
Keansburg School DistrictCurriculum System
Mathematicsignment Matrices of Common Core State Standards
Grade Strand Standard Standard
Sept
embe
r ndash
Oct
ober
Nov
embe
r ndash
Dec
embe
r
Janu
ary
ndash Fe
brua
ry
Mar
ch ndash
Apr
il
May
- Ju
ne
1 OA 1
CC1OA1 Represent and solve problems involving addition and subtraction Use addition and subtraction within 20 to solve word problems involving situations of adding to taking from putting together taking apart and comparing with unknowns in all positions eg by using objects drawings and equations with a symbol for the unknown number to represent the problem
1 OA 2
CC1OA2 Represent and solve problems involving addition and subtraction Solve word problems that call for addition of three whole numbers whose sum is less than or equal to 20 eg by using objects drawings and equations with a symbol for the unknown number to represent the problem
1 OA 3
CC1OA3 Understand and apply properties of operations and the relationship between addition and subtraction Apply properties of operations as strategies to add and subtract Examples If 8 + 3 = 11 is known then 3 + 8 = 11 is also known (Commutative property of addition) To add 2 + 6 + 4 the second two numbers can be added to make a ten so 2 + 6 + 4 = 2 + 10 = 12 (Associative property of addition) (Students need not use formal terms for these properties)
1 OA 4
CC1OA4 Understand and apply properties of operations and the relationship between addition and subtraction Understand subtraction as an unknown-addend problem For example subtract 10 ndash 8 by finding the number that makes 10 when added to 8
1 OA 5 CC1OA5 Add and subtract within 20 Relate counting to addition and subtraction (eg by counting on 2 to add 2)
1 OA 6 CC1OA6 Add and subtract within 20 Add and subtract within 20 demonstrating fluency for addition and subtraction within 10 Use strategies such as counting on making ten (eg 8 + 6 = 8 + 2 + 4 = 10 + 4 = 14) decomposing a number leading to a ten (eg 13 ndash 4 = 13 ndash 3 ndash 1 = 10 ndash 1 = 9) using the relationship between addition and subtraction (eg knowing that 8 + 4
47
Keansburg School DistrictCurriculum System
Mathematics= 12 one knows 12 ndash 8 = 4) and creating equivalent but easier or known sums (eg adding 6 + 7 by creating the known equivalent 6 + 6 + 1 = 12 + 1 = 13)
1 OA 7
CC1OA7 Work with addition and subtraction equations Understand the meaning of the equal sign and determine if equations involving addition and subtraction are true or false For example which of the following equations are true and which are false 6 = 6 7 = 8 ndash 1 5 + 2 = 2 + 5 4 + 1 = 5 + 2
1 OA 8
CC1OA8 Work with addition and subtraction equations Determine the unknown whole number in an addition or subtraction equation relating three whole numbers For example determine the unknown number that makes the equation true in each of the equations 8 + = 11 5 = _ ndash 3 6 + 6 = _
1 NBT 1
CC1NBT1 Extend the counting sequence Count to 120 starting at any number less than 120 In this range read and write numerals and represent a number of objects with a written numeral
1 NBT 2
CC1NBT2 Understand place value Understand that the two digits of a two-digit number represent amounts of tens and ones Understand the following as special cases -- a 10 can be thought of as a bundle of ten ones mdash called a ldquotenrdquo -- b The numbers from 11 to 19 are composed of a ten and one two three four five six seven eight or nine ones -- c The numbers 10 20 30 40 50 60 70 80 90 refer to one two three four five six seven eight or nine tens (and 0 ones)
1 NBT 3
CC1NBT3 Understand place value Compare two two-digit numbers based on meanings of the tens and ones digits recording the results of comparisons with the symbols gt = and lt
1 NBT 4
CC1NBT4 Use place value understanding and properties of operations to add and subtract Add within 100 including adding a two-digit number and a one-digit number and adding a two-digit number and a multiple of 10 using concrete models or drawings and strategies based on place value properties of operations andor the relationship between addition and subtraction relate the strategy to a written method and explain the reasoning used Understand that in adding two-digit numbers one adds tens and tens ones and ones and sometimes it is necessary to compose a ten
1 NBT 5
CC1NBT5 Use place value understanding and properties of operations to add and subtract Given a two-digit number mentally find 10 more or 10 less than the number without having to count explain the reasoning used
1 NBT 6 CC1NBT6 Use place value understanding and properties of operations to add and subtract Subtract multiples of 10 in the range 10-90 from multiples of 10 in the range 10-90 (positive or zero differences) using concrete models or drawings and strategies based on place value properties of operations andor
48
Keansburg School DistrictCurriculum System
Mathematicsthe relationship between addition and subtraction relate the strategy to a written method and explain the reasoning used
1 MD 1
CC1MD1 Measure lengths indirectly and by iterating length units Order three objects by length compare the lengths of two objects indirectly by using a third object
1 MD 2
CC1MD2 Measure lengths indirectly and by iterating length units Express the length of an object as a whole number of length units by laying multiple copies of a shorter object (the length unit) end to end understand that the length measurement of an object is the number of same-size length units that span it with no gaps or overlaps Limit to contexts where the object being measured is spanned by a whole number of length units with no gaps or overlaps
1 MD 3CC1MD3 Tell and write time Tell and write time in hours and half-hours using analog and digital clocks
1 MD 4
CC1MD4 Represent and interpret data Organize represent and interpret data with up to three categories ask and answer questions about the total number of data points how many in each category and how many more or less are in one category than in another
1 G 1
CC1G1 Reason with shapes and their attributes Distinguish between defining attributes (eg triangles are closed and three-sided) versus non-defining attributes (eg color orientation overall size) for a wide variety of shapes build and draw shapes to possess defining attributes
1 G 2
CC1G2 Reason with shapes and their attributes Compose two-dimensional shapes (rectangles squares trapezoids triangles half-circles and quarter-circles) or three-dimensional shapes (cubes right rectangular prisms right circular cones and right circular cylinders) to create a composite shape and compose new shapes from the composite shape (Students do not need to learn formal names such as ldquoright rectangular prismrdquo)
1 G 3
CC1G3 Reason with shapes and their attributes Partition circles and rectangles into two and four equal shares describe the shares using the words halves fourths and quarters and use the phrases half of fourth of and quarter of Describe the whole as two of or four of the shares Understand for these examples that decomposing into more equal shares creates smaller shares
49
Keansburg School DistrictCurriculum System
Mathematics
Common Core State Standards Vocabulary
Addition and subtraction within 5 10 20 100 or 1000 Addition or subtraction of two whole numbers with whole number answers and with sum or minuend in the range 0-5 0-10 0-20 or 0-100 respectively Example 8 + 2 = 10 is an addition within 10 14 ndash 5 = 9 is a subtraction within 20 and 55 ndash 18 = 37 is a subtraction within 100
Additive inverses Two numbers whose sum is 0 are additive inverses of one another Example 34 and ndash 34 are additive inverses of one another because 34 + (ndash 34) = (ndash 34) + 34 = 0
Associative property of addition See Table 3 in this Glossary
Associative property of multiplication See Table 3 in this Glossary
Bivariate data Pairs of linked numerical observations Example a list of heights and weights for each player on a football team
Box plot A method of visually displaying a distribution of data values by using the median quartiles and extremes of the data set A box shows the middle 50 of the data1
Commutative property See Table 3 in this Glossary
Complex fraction A fraction AB where A andor B are fractions (B nonzero)
Computation algorithm A set of predefined steps applicable to a class of problems that gives the correct result in every case when the steps are carried out correctly See also computation strategy
Computation strategy Purposeful manipulations that may be chosen for specific problems may not have a fixed order and may be aimed at converting one problem into another See also computation algorithm
Congruent Two plane or solid figures are congruent if one can be obtained from the other by rigid motion (a sequence of rotations reflections and translations)
Counting on A strategy for finding the number of objects in a group without having to count every member of the group For example if a stack of books is known to have 8 books and 3 more books are added to the top it is not necessary to count the stack
50
Keansburg School DistrictCurriculum System
Mathematicsall over again One can find the total by counting onmdashpointing to the top book and saying ldquoeightrdquo following this with ldquonine ten eleven There are eleven books nowrdquo
Dot plot See line plot
Dilation A transformation that moves each point along the ray through the point emanating from a fixed center and multiplies distances from the center by a common scale factor
Expanded form A multi-digit number is expressed in expanded form when it is written as a sum of single-digit multiples of powers of ten For example 643 = 600 + 40 + 3
Expected value For a random variable the weighted average of its possible values with weights given by their respective probabilities
First quartile For a data set with median M the first quartile is the median of the data values less than M Example For the data set 1 3 6 7 10 12 14 15 22 120 the first quartile is 62 See also median third quartile interquartile range
Fraction A number expressible in the form ab where a is a whole number and b is a positive whole number (The word fraction in these standards always refers to a non-negative number) See also rational number
Identity property of 0 See Table 3 in this Glossary
Independently combined probability models Two probability models are said to be combined independently if the probability of each ordered pair in the combined model equals the product of the original probabilities of the two individual outcomes in the ordered pair
Integer A number expressible in the form a or ndasha for some whole number a
Interquartile Range A measure of variation in a set of numerical data the interquartile range is the distance between the first and third quartiles of the data set Example For the data set 1 3 6 7 10 12 14 15 22 120 the interquartile range is 15 ndash 6 = 9 See also first quartile third quartile
Line plot A method of visually displaying a distribution of data values where each data value is shown as a dot or mark above a number line Also known as a dot plot3
51
Keansburg School DistrictCurriculum System
MathematicsMean A measure of center in a set of numerical data computed by adding the values in a list and then dividing by the number of values in the list4 Example For the data set 1 3 6 7 10 12 14 15 22 120 the mean is 21
Mean absolute deviation A measure of variation in a set of numerical data computed by adding the distances between each data value and the mean then dividing by the number of data values Example For the data set 2 3 6 7 10 12 14 15 22 120 the mean absolute deviation is 20
Median A measure of center in a set of numerical data The median of a list of values is the value appearing at the center of a sorted version of the listmdashor the mean of the two central values if the list contains an even number of values Example For the data set 2 3 6 7 10 12 14 15 22 90 the median is 11
Midline In the graph of a trigonometric function the horizontal line halfway between its maximum and minimum values
Multiplication and division within 100 Multiplication or division of two whole numbers with whole number answers and with product or dividend in the range 0-100 Example 72 divide 8 = 9
Multiplicative inverses Two numbers whose product is 1 are multiplicative inverses of one another Example 34 and 43 are multiplicative inverses of one another because 34 times 43 = 43 times 34 = 1
Number line diagram A diagram of the number line used to represent numbers and support reasoning about them In a number line diagram for measurement quantities the interval from 0 to 1 on the diagram represents the unit of measure for the quantity
Percent rate of change A rate of change expressed as a percent Example if a population grows from 50 to 55 in a year it grows by 550 = 10 per year
Probability distribution The set of possible values of a random variable with a probability assigned to each
Properties of operations See Table 3 in this Glossary
Properties of equality See Table 4 in this Glossary
Properties of inequality See Table 5 in this Glossary
Properties of operations See Table 3 in this Glossary
52
Keansburg School DistrictCurriculum System
MathematicsProbability A number between 0 and 1 used to quantify likelihood for processes that have uncertain outcomes (such as tossing a coin selecting a person at random from a group of people tossing a ball at a target or testing for a medical condition)
Probability model A probability model is used to assign probabilities to outcomes of a chance process by examining the nature of the process The set of all outcomes is called the sample space and their probabilities sum to 1 See also uniform probability model
Random variable An assignment of a numerical value to each outcome in a sample space
Rational expression A quotient of two polynomials with a non-zero denominator
Rational number A number expressible in the form ab or ndash ab for some fraction ab The rational numbers include the integers
Rectilinear figure A polygon all angles of which are right angles
Rigid motion A transformation of points in space consisting of a sequence of one or more translations reflections andor rotations Rigid motions are here assumed to preserve distances and angle measures
Repeating decimal The decimal form of a rational number See also terminating decimal
Sample space In a probability model for a random process a list of the individual outcomes that are to be considered
Scatter plot A graph in the coordinate plane representing a set of bivariate data For example the heights and weights of a group of people could be displayed on a scatter plot5
Similarity transformation A rigid motion followed by a dilation
Tape diagram A drawing that looks like a segment of tape used to illustrate number relationships Also known as a strip diagram bar model fraction strip or length model
Terminating decimal A decimal is called terminating if its repeating digit is 0
Third quartile For a data set with median M the third quartile is the median of the data values greater than M Example For the data set 2 3 6 7 10 12 14 15 22 120 the third quartile is 15 See also median first quartile interquartile range
Transitivity principle for indirect measurement If the length of object A is greater than the length of object B and the length of object B is greater than the length of object C then the length of object A is greater than the length of object C This principle applies
53
Keansburg School DistrictCurriculum System
Mathematicsto measurement of other quantities as well
Uniform probability model A probability model which assigns equal probability to all outcomes See also probability model
Vector A quantity with magnitude and direction in the plane or in space defined by an ordered pair or triple of real numbers
Visual fraction model A tape diagram number line diagram or area model
Whole numbers The numbers 0 1 2 3 hellip5
54
- MissionVision Statement
- Beliefs
- Measurement amp Data
- Measure lengths and by iterating length units
- Tell and write time
- Represent and interpret data
- Geometry
- Reason with shapes and their attributes
- Number and Base Ten
- Extend the counting sequence
- Understand place value
-
- Measurement amp Data (II)
-
- Measure lengths and by iterating length units
- Tell and write time
-
- Represent and interpret data
- Geometry (II)
- Reason with shapes their attributes
-
- Number and Base Ten
- Use place value understanding and properties of operations to add and subtract
- Teacher will cover up specific numbers on an enlarged number grid using cover up tape to have students identify numbers before and after Students will come up and write the missing numbers
- Students will play ldquoI have__ Who has __ Teacher will create cards using index cards and numbers in which students need further practice with Students will read their cards aloud Variations of game can include identifying specific numbers identifying numbers more or less etc)
- Students will use base ten blocks to represent numbers including three digit numbers Students will identify representation of numbers through these manipulatives They may match the representation to the written number
- Students will write the number they created using the base ten blocks using their white boards and markers
- Students will arrange given digits to create the greatest and lowest possible numbers They can show each number they create using base ten blocks
- Students will use the Base Ten Exchange Game to show an understanding of exchanging ones for tens and tens for hundreds Students can use place value mats base ten blocks (cubes tens and flats) Students can take number of cubes displayed with roll of single die Students will determine when exchanging can be made when reaching ten units
- Base ten concentration wwwk-5mathteachingresourcescom
- Ten frame compare wwwk-5mathteachingresourcescom
-
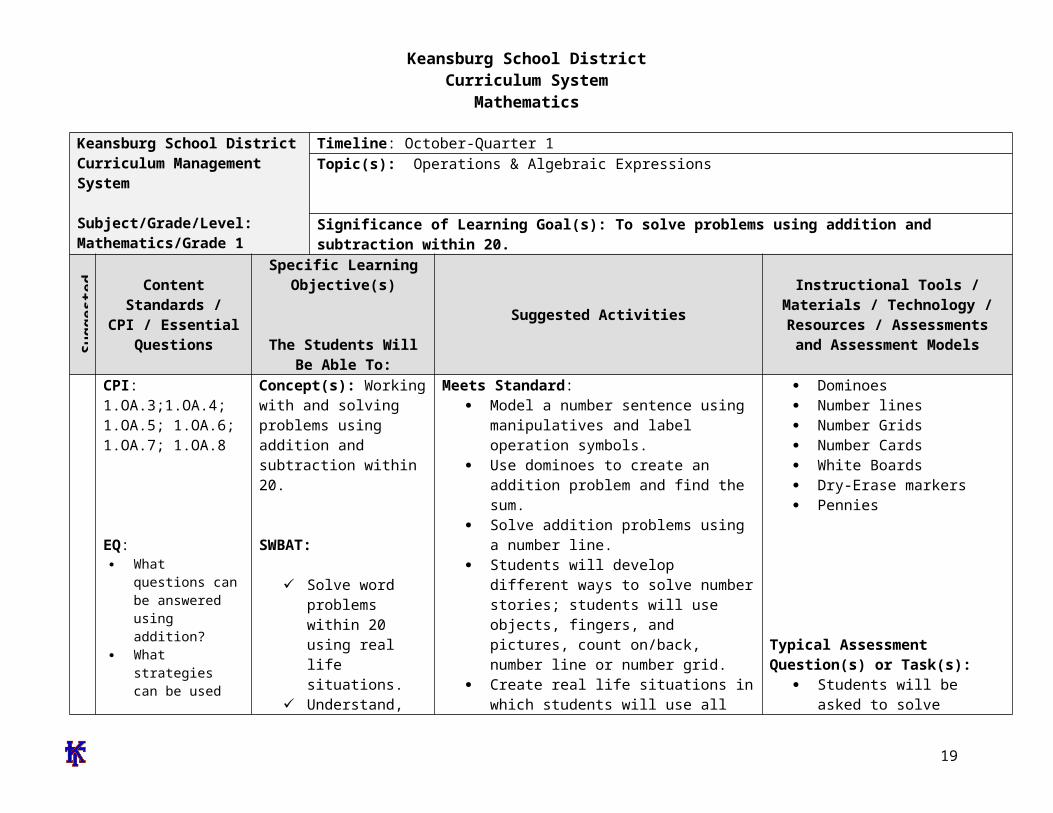
Keansburg School DistrictCurriculum System
Mathematics Do bar graphs
make it easier to understand and compare facts Why
What kind of graph should I use to answer questions
Why do I need to tell time
How many hands does a clock have
Are the hands on the clock the same size
How long is a minute
Why do I need to use a calendar
How do we use the clock and the calendar to determine what we will do in school
Why do we need to measure something
What can we use to draw and measure things
What do you think is about 1 inch long
How many steps long do you think it is from
object Organize represent
and interpret data with up to three categories on simple graphs and charts
Analyze and formulate questions based on simple graphs and charts
Identify time to the hour and half hour on both a digital and analog clock
Write time to the hour and half hour on both analog and digital clocks
Draw the hands on an analog clock for a give time to the hour or half hour
Relate times to the half hour to ldquohalf pastrdquo the hour
using their personal unit of measurement
The teacher will select a classroom object and the students will be asked to illustrate objects in the room that are bigger and smaller in size
The students will be able to organize represent and interpret data up to three categories through the use of a bar graph
The teacher will then divide students into heterogeneous groups and encourage the students to explain what they can learn from the graph The students will present findings following activity
Students will choose an object within classroom then find additional objects one being larger the other being shorter using a two-column chart Draw or write the objects in the chart
Create a human clock students will hold 12 numbered plates One student will stand in the middle as the minute and hour hand to model various times
Students will have their own demonstration clocks students will identify and find the hour and minute hands
Students create their own clocks using paper plates students will manipulate hands to identify varying times
Students will listen to Jack Hartman ldquoTick Tockrdquo song
Teachers and students will view clock on videos on brainpopjrcom students
Take 3 objects and order them from smallest to largest and largest to smallest
Read a series of clocks (analog and digital) and tell the time to the hour and half hour
Using blank clocks the students will draw the hands to show a designated time
Use a personal measurement (ie your thumb) to measure the length of an object
19
Keansburg School DistrictCurriculum System
Mathematicsthe front of the classroom to the back
If we measure in footsteps why are some of the measurements different
How is longer and shorter similar to greater and lesser
and teachers can complete quizzes available on website
Teachers will present time on an analog clock students will write the digital time on a white board
Students will play clock concentration
Exceeds Standard
The students will work in pairs to locate objects around the room and compare the lengths against each other The pairs will then work with another pair of students and compare the lengths of their objects with the objects the other pair located
Teacher will introduce the ruler in comparison to the yardstick The students will be encouraged to find objects that in the room that are larger than a ruler and measure using the yardstick
After the teacher introduces units of personal measurement the students will be encouraged to measure object in the room using their own unit of personal measurement and convert it into a standard measurement using a ruler or a yardstick
The teacher will select a classroom object and the students will be asked to illustrate objects in the room that are bigger and smaller by a specific size
The students will be able to organize represent and interpret data up to four
20
Keansburg School DistrictCurriculum System
Mathematicsor more categories through the use of a bar graph
The teacher will then divide students into heterogeneous groups and encourage the students to explain what they can learn from the graph and create a tally chart utilizing the data
Students will create clock flash cards by drawing an analog clock on one side and writing the digital clock time on the other
Give students a clock and a blue number cube ()
21
Keansburg School DistrictCurriculum System
MathematicsKeansburg School DistrictCurriculum Management System
SubjectGradeLevelMathematicsGrade 1
Timeline December-Quarter 2
Topic(s) Geometry
Significance of Learning Goal(s) To identify shapes and their attribures
Sugg
este
d D
ays
of
Inst
ruct
ion Content
Standards CPI Essential
Questions
Specific Learning Objective(s)
The Students Will Be Able To
Suggested Activities
Instructional Tools Materials
Technology Resources
Assessments and Assessment Models
CPI1G1 1G2
EQ Where do
you see shapes in our classroom
Are there different shapes outside
How are geometric figures alike
How can we sort
Concept(s) Identify shapes and their attributes
SWBAT Distinguish
between two and three-dimensional shapes by classifying their attributes For example color shape and size
Compare and contrast shapes based on their attributes
Construct and create shapes
Meets Standard Sorting shapes based on their attributes For example
number of sideso Materials attribute blocks shape card sheet sorting
mat Introduce vocabulary cylinder cube sphere rectangular
prism triangular prism pyramid Classroom shape hunt students go around the room finding shapes within the classroom For example trash can tissue box clock
o Materials shape sheet classroom objects httpilluminationsnctmorgLessonDetailaspxid=L237
Create 3-dimenstion shapes (rectangular prism pyramid cube)
o Straws twist ties shape cards Create 2-dimensional shapes (trapezoid triangle circle
rectangle rhombus)o Pattern block templates attribute blocks pattern
block template stencil geo-boards rubber bands httpilluminationsnctmorgLessonDetailaspx
Attribute blocks Shape card
sheet Sorting mat Twist ties Straws Shape cards Pattern block
templates Attribute blocks Pattern block
template stencil Geo-boards Rubber bands
22
Keansburg School DistrictCurriculum System
Mathematicsobjects of different shapes
How can shapes and solids be described compared and used to make other shapes What are equal parts
What foods do you divide into equal parts
What other items might be divided
How do you know if you have an equal share
possessing certain attributes
Identify and construct two-dimensional shapes
Identify and construct three-dimensional figures
id=L168 Create a drawing using shapes students will create a
picture using the pattern block template stencil (house sun flowers etc)
o Paper pattern block stencil template crayons
Apply understanding of attributes by playing Shape Detective and Attribute Train Game
Demonstrate understanding of 3 Dimensional shapes by playing Whatrsquos My Shape
Exceeds Standard
Introducing and exposing higher vocabulary polyhedronpolyhedra (many faces of a shape) Placing the word onto the word wall
Students read the poem Shapes by Shel Silverstein and create their own illustration of the poem to explore geometric figures and positional words
Materials httpilluminationsnctmorgLessonDetailaspxID=L202
Shapes by Shel Silverstein paper crayons pencils examples of rectangles triangles circles
Compose clues using inferencing to play Guess What Display variety of 3 dimensional shapes Silently choose
an object and give clues about it For example I amsmall I have 2 flat faces and if you trace my faces youwill get circles What am I (tomato can)
Students work together to use pattern blocks to coverother pattern blocks For example how many triangleblocks are needed to cover a hexagon block
Student rotate in groups to visit each geometric solidwhile completing a chart which shows faces sides and
Typical Assessment Question(s) or Task(s)
Ask students how many sides each shape has
Have students classify shapes based on number of sides
Have students identify shapes in the classroom
Have students create 2 and 3 dimensional shapes
Have students design pictures using pattern blockspattern block template
Have students identify and describe assigned shapersquos attributes
Ask students to name 3 dimensional shapes hidden i bag (Whatrsquos my Shape Game)
23
Keansburg School DistrictCurriculum System
Mathematics corners Students compose a shape town by using their pattern
block templates Then students will calculate the totalnumber of each pattern block used
Students will invent new shapes by using three-dimensional shapes
Students will create patterns using three dimensionalshapes
24
Keansburg School DistrictCurriculum System
MathematicsKeansburg School DistrictCurriculum Management System
SubjectGradeLevelMathematicsGrade 1
Timeline January-Quarter 2
Topic(s) Number and Operations in Base Ten
Significance of Learning Goal(s) To recognize compare and understand numbers to 120
Sugg
este
d D
ays
of
Inst
ruct
ion Content
Standards CPI Essential
Questions
Specific Learning Objective(s)
The Students Will Be Able To
Suggested ActivitiesInstructional Tools Materials
Technology Resources Assessments and Assessment
Models
25
Keansburg School DistrictCurriculum System
MathematicsCPI 1NBT1 1NBT2A 1NBT2B 1NBT2C 1NBT3
EQ How do
numbers help us
How can sets of numbers be counted compared and ordered
How can I use numbers to solve problems
How would putting numbers on a chart make it easier to understand information
How can I make it easier to understand numbers when I sort them
What is place value
Concept(s) Recognize compare and understand numbers up to 120
SWBAT Recognize read write
and count 0-120 Understand that a two-
digit number represents amounts of tens and ones
Relate groups of ten to skip counting
Compare two two-digit numbers based on meanings of tens and ones digits using symbols ltgt and =
Meets Standard Teacher will cover up specific numbers
on an enlarged number grid using cover up tape to have students identify numbers before and after Students will come up and write the missing numbers
Students will play ldquoI have__ Who has __ Teacher will create cards using index cards and numbers in which students need further practice with Students will read their cards aloud Variations of game can include identifying specific numbers identifying numbers more or less etc)
Students will use base ten blocks to represent numbers including three digit numbers Students will identify representation of numbers through these manipulatives They may match the representation to the written number
Students will write the number they created using the base ten blocks using their white boards and markers
Students will arrange given digits to create the greatest and lowest possible numbers They can show each number they create using base ten blocks
Students will use the Base Ten Exchange Game to show an
Number grids ldquoI have Who hasrdquo index
cards base ten blocks white boards markers number cards dice ten frame base ten concentration
boards (k-5 math teaching resources)
double ten frame boards (k-5 math teaching resources)
Typical Assessment Question(s) or Task(s)
Recognize numbers 1-120 using flashcards
Write numbers 1-20 using block or graph paper
Build two-digit numbers using tens and ones blocks
Listen and note students skip counting orally by tens to 120
Students compare and label two numbers using relation symbols
26
Keansburg School DistrictCurriculum System
Mathematics Why is place
value important
How can I use place value to compare and order numbers
How can I use the number grid to help me with counting numbers
How many times do you think you can hop in one minute
What does number relationships mean
Why do we need to know how to add
Why do we need to know how to subtract
How are addition and subtraction related
What are doubles
How can
understanding of exchanging ones for tens and tens for hundreds Students can use place value mats base ten blocks (cubes tens and flats) Students can take number of cubes displayed with roll of single die Students will determine when exchanging can be made when reaching ten units
Teens on the ten frame wwwk-5mathteachingresourcescom
Base ten concentration wwwk-5mathteachingresourcescom
Ten frame compare wwwk-5mathteachingresourcescom
Exceeds Standard
Students will create riddles Irsquom thinking of a number that has 4 tens and 13 ones Have students solve the riddle by regrouping the ones to find the answer
-Students use hundreds chart to jump up and down from a number to show 10 more or 10 less
-Students will play Whatrsquos my Number by giving clues based on place value odd or even and number sense For example Irsquom a two digit number The digit in my tens place is 2 more than 4
27
Keansburg School DistrictCurriculum System
Mathematicsdouble facts help us to add and subtract
Does it matter what order you use to add three numbers Why or why not
The digit in my ones place is 3 less than 8 Whatrsquos my number
My double ten frame riddle wwwk-5mathteachingresourcescom
28
Keansburg School DistrictCurriculum System
MathematicsKeansburg School DistrictCurriculum Management System
SubjectGradeLevelMathematicsGrade 1
Timeline February-Quarter 3
Topic(s) Operations amp Algebraic Expressions
Significance of Learning Goal(s) To solve addition and subtraction problems
Sugg
este
d D
ays
of
Inst
ruct
ion Content
Standards CPI
Essential Questions
Specific Learning Objective(s)
The Students Will Be Able To
Suggested ActivitiesInstructional Tools Materials
Technology Resources Assessments and Assessment
Models
CPI1OA31OA4 1OA5 1OA6 1OA7 1OA81OA2
EQ What
questions can be answered using addition
What strategies can be used to solve problems
How can we
Concept(s) Solve addition with and subtraction problems
SWBAT Solve addition problems
with sums up to 20 Use addition within 20 to
solve word problems involving real life situations
Solve word problems that call for addition of three whole numbers up to 20
Solve subtraction problems with difference up to 20
Use subtraction within 20 to solve word problems involving real
Meets Standard Model and have students create their
own individual number sentence using manipulatives and label operation symbols
Students will choose a strategy to solve number stories such as objects fingers and pictures count onback number line or number grid
Create real life situations in which students will use a strategy to solve a number story and create a number model
Review addition and subtraction number stories posters stating each key word for addition and subtraction operations
Combine and mix two sets of 0-20 number cards One partner draws two number cards from the top of the deck students will design and generate a number story using the two numbers
Materials Manipulatives (examples
counting bears connecting cubes pennies counters etc)
Slates dry erase markers erasers
Clear Sheet Protectors Sets of 0-20 number cards Number cards Cardstock Scrabble tiles letter cards
Typical Assessment Question(s) or Task(s)
Students will solve real life
29
Keansburg School DistrictCurriculum System
Mathematicstell how many
How does knowing math facts make math easier
How can numbers be helpful
Why do I need to subtract
How do we use addition and subtraction in our everyday life
Why are fact families important
What strategies can be used to solve problems How is counting on different from just counting to add
What information do you need to know in order to find
life situations Understand subtraction
as an unknown addend problem example subtract 9-5 by finding the number that makes 9 when added to 5
Both partners solve the problem in the number story and write the answer on their slate
Find three cards that have a sum of 12 how many different ways can the student make the sum of 12 using three cards students record work
-Teacher creates real life word problemsinvolving three addends up to 20
Ten frames subtraction wwwk-5mathteachingresourcescom
I have who has wwwk-5mathteachingresourcescom
True or false wwwk-5mathteachingresourcescom
Count to 20 wwwk-5mathteachingresourcescom
Exceeds Standard
Teacher creates multi step word problems for students to solve
Students work with partners or small groups to create real life word problems Compose class book of problems
Three letter addends use scrabble tiles or letter cards with corresponding numbers to make three letter words find
word problems Students will create their
own number sentences own number storiesword problems
Students will create and solve number stories in cooperative learning groups
Students will generate word problems using assigned numbers
30
Keansburg School DistrictCurriculum System
Mathematicsthe total number of something
Why would you need to count back
How are subtraction and addition related
the sum of each word by adding the numbers on the tiles Students will find which words have the greatest or smallest sum
31
Keansburg School DistrictCurriculum System
MathematicsKeansburg School DistrictCurriculum Management System
SubjectGradeLevelMathematicsGrade 1
Timeline March-Quarter 3
Topic(s) Measurement amp Data
Significance of Learning Goal(s) To tell time and compare measurements
Sugg
este
d D
ays
of
Inst
ruct
ion Content
Standards CPI
Essential Questions
Specific Learning Objective(s)
The Students Will Be Able ToSuggested Activities
Instructional Tools Materials Technology Resources
Assessments and Assessment Models
How would I know if a bar graph correctly shows what is on a tally chart
How could a bar graph answer a question
Do bar graphs make it easier to understand and compare facts Why
What kind
Concept(s) Telling time comparing measurements
SWBAT Identify and write time to
the hour and half hour on both a digital and analog clock
Write time to the hour and half-hour on both digital and analog clocks
Draw the hands on the analog clock for a given time to the hour or half-hour
Relate times to the half hour as ldquohalf-pastrdquo the hour
Compare and contrast
Meets Standard Students will have their own
demonstration clocks students will identify and find the hour and minute hands
Students create their own clocks using paper plates students will manipulate hands to identify varying times
Students will listen to Jack Hartman ldquoTick Tockrdquo song
Teachers and students will view clock on videos on brainpopjrcom students and teachers can complete quizzes available on website
Teachers will present time on an analog clock students will write the digital time on a white board
Students will play clock concentration Teacher will introduce measurement by
holding up objects and the students will examine the objects and explain the size
Large Judy Clock Individual student Judy
clocks Wipe off analogdigital clocks Clock stampers Timers Rulers Yardsticks Measuring tapes Sheet protectors Cardstock Paper plates Fasteners Index cards
Typical Assessment Question(s) or Task(s)
Students will be asked to identify and write time to the hour and half hour on both
32
Keansburg School DistrictCurriculum System
Mathematicsof graph should I use to answer questions
Why do I need to tell time
How many hands does a clock have
Are the hands on the clock the same size
How long is a minute
Why do I need to use a calendar
How do we use the clock and the calendar to determine what we will do in school
Why do we need to measure something
What can
objects by length Construct objects at
contrasting lengths
ordero Students will break into groups
and compare objects further and classify them depending on their size
Teacher will introduce the ruler Explain to students that the ruler is used to measure objects The students will then explore the classroom and select objects around the room that are smaller and larger than the ruler
Teacher will select specific body parts that the students will use as a personal unit of measurement The students will work in pairs to demonstrate how to measure objects around the room using their personal unit of measurement
The teacher will select a classroom object and the students will be asked to illustrate objects in the room that are bigger and smaller in size
The students will be able to organize represent and interpret data up to three categories through the use of a bar graph
The teacher will then divide students into heterogeneous groups and encourage the students to explain what they can learn from the graph The students will present findings following activity
Students will choose an object within classroom then find additional objects one being larger the other being shorter using a two-column chart Draw or write the objects in the chart
digital and analog clocks Students will be asked to
identify the parts of a clock students will be asked to draw the hands on an analog clock for a given time to the hour or half-hour
Students will be given various objects and will further be asked to compare and contrast the lengths of these objects
Students will be asked to provide or create objects contrasting lengths to demonstrate understanding of differences in length
33
Keansburg School DistrictCurriculum System
Mathematicswe use to draw and measure things
What do you think is about 1 inch long
How many steps long do you think it is from the front of the classroom to the back
If we measure in footsteps why are some of the measurements different
How is longer and shorter similar to greater and lesser
Exceeds Standard
The students will work in pairs to locate objects around the room and compare the lengths against each other The pairs will then work with another pair of students and compare the lengths of their objects with the objects the other pair located
Teacher will introduce the ruler in comparison to the yardstick The students will be encouraged to find objects that in the room that are larger than a ruler and measure using the yardstick
After the teacher introduces units of personal measurement the students will be encouraged to measure object in the room using their own unit of personal measurement and convert it into a standard measurement using a ruler or a yardstick
The teacher will select a classroom object and the students will be asked to illustrate objects in the room that are bigger and smaller by a specific size
The students will be able to organize represent and interpret data up to four or more categories through the use of a bar graph
The teacher will then divide students into heterogeneous groups and encourage the students to explain what they can learn from the graph and create a tally chart utilizing the data
Students will create clock flash cards by
34
Keansburg School DistrictCurriculum System
Mathematicsdrawing an analog clock on one side and writing the digital clock time on the other Students will include time in five minute intervals
Pose word problems where students have to find elapse time to the hour and half hour
Introduce second hand and conduct activities that are timed in seconds (Examples hopping on 1 foot blinking eyes counting to the highest number)
35
Keansburg School DistrictCurriculum System
MathematicsKeansburg School DistrictCurriculum Management System
SubjectGradeLevelMathematicsGrade 1
Timeline April-Quarter 4
Topic(s) Geometry
Significance of Learning Goal(s) To identify two and three dimensional shapes to understand fractional parts and create equal shares
Sugg
este
d D
ays
of
Inst
ruct
ion Content
Standards CPI Essential
Questions
Specific Learning Objective(s)
The Students Will Be Able To
Suggested ActivitiesInstructional Tools Materials
Technology Resources Assessments and Assessment
Models
Are there different shapes outside
How are geometric figures alike
How can we sort objects of different shapes
How can shapes and solids be described compared and used to make other shapes
Concept(s) Two and three dimensional shapes fractional parts equal shares
SWBAT
Combine two-dimensional or three-dimensional shapes or figures to create a new composite shape and identify the shapes within
Identify fractional parts of circles and rectangles into equal shares while developing vocabulary for halves fourths and quarters
Describe the whole as
Meets Standard
Determine which shape by touch without using their sight
o Materials attribute blocks shape sheet feely box wwwilluminationsnctmorglessondetail
Sorting 3-dimensional objects students will be given cards with 3-dimensional objects (trash can soup can globe ball tissue box box dice) they will sort them based on the 3-dimensional shape they represent
o 3-dimensional object cards sorting mats
Pizza and Cake Fractions students will utilize a pizza and a cake to work on the concept of fractions while developing the vocabulary halves quarters and fourths
o Materials teacher created pizza
Attribute blocks Geometric shapes 3-dimensional object
cards Sorting maps 3-dimensional shapes Solid and lane figures Geo-boards and rubber
bands Fraction circles Sheet protectors 2-dimensional shapes
Typical Assessment Question(s) or Task(s)
Students will be asked to describe and identify
36
Keansburg School DistrictCurriculum System
MathematicsWhat are equal parts
What foods do you divide into equal parts
What other items might be divided
How do you know if you have an equal share
two of or four of the shares Understand for these examples that decomposing into more equal shares creates smaller shares
and cake that are cut into fractions (construction paper)
Students will illustrate a picture of a boat using at least one three dimensional shape in their drawings Shapes include cubes cylinders spheres cones and rectangular prisms
Solid and Plane Figures Name the Face activity Provide three-dimensional objects Have students draw the face for each object as well as name the shape Examples ABC block juice can book party hat
Introduce fractions by having students identify shapes that show equal parts Display cut out shapes using document camera Include some shapes that are divided equally and some that are not divided equally As a whole group sort shapes into two categories Then have students go back to their desks and work with a partner to classify additional shapes
Provide students with shapes that are divided into four parts Include shapes that are divided into four equal parts and others that are unequal Students identify the shapes that are divided into four equal parts and explain their reasoning
Shape Town activity Students will design a shape town using the following shapes
shapes within combined two and three-dimensional shapes
Students will be given circles and rectangles students will be asked to divide these shapes into halves fourths and quarters
Students will be asked to sort shapes that are divided equally and not divided equally
37
Keansburg School DistrictCurriculum System
Mathematicstrapezoid hexagon square triangle and circle Afterwards students will calculate the total number of each shape they included After completing the activity students will present their final product to the class and explain how they decided which shapes to use
Given an array of dots students will draw shapes with specific number of sides and corners and connect the dots to create the shapes Example Draw a shape with 5 sides Draw a shape with 6 corners
Students will create two-dimensional shapes on geoboards Then using different colored rubber bands students will divide the shapes into equal parts Students will transfer their equally divided shapes onto geoboard paper by drawing lines to show their equal parts
Play the Fraction Path Game Materials Fraction circles a circle with frac12 shaded a circle with 13 shaded and a circle with frac14 shaded Gameboard Path consisting of assorted shapes divided into halves thirds and fourths Players Needed 3 Directions Place the fraction circles facedown Players close their eyes and pick one fraction circle Each player follows the path from start to finish Each player looks at each shape on the path and records how many shapes show their fractions Players record
38
Keansburg School DistrictCurriculum System
Mathematicstheir results on paper using tally marks At end of game students compare total number of shapes that show their fraction
Exceeds Standard
39
Keansburg School DistrictCurriculum System
MathematicsKeansburg School DistrictCurriculum Management System
SubjectGradeLevelMathematicsGrade 1
Timeline May-Quarter 4
Topic(s) Number and Operations in Base Ten
Significance of Learning Goal(s) To use place value to add and subtract
Sugg
este
d D
ays
of
Inst
ruct
ion Content
Standards CPI Essential
Questions
Specific Learning Objective(s)
The Students Will Be Able ToSuggested Activities
Instructional Tools Materials Technology Resources
Assessments and Assessment Models
40
Keansburg School DistrictCurriculum System
MathematicsCPI 1NBT4 1NBT5 1NBT6
EQ How do
numbers help us
How can sets of numbers be counted compared and ordered
How can I use numbers to solve problems
How would putting numbers on a chart make it easier to understand information
How can I make it easier to understand numbers when I sort them
What is place value
Why is place value important
How can I
Concept(s) Use place value and properties of operations to add and subtract
SWBAT Use mental math to find
10 more or ten less than a given two-digit number and explain reasoning used within any number to 120
Use place value to add within 100 add a two-digit number to a one-digit number and add a two-digit number to a multiple of ten
Understand when adding two-digit numbers that ones add to the ones and tens add to the tens and sometimes it is necessary to compose a ten by regrouping
For all above objects students will use concrete models and strategies based on place value and relate the strategy to a written method and explain the reasoning used
Subtract multiples of 10 in the range 10-90 from multiples of 10 in the range 10-90 using
Meets Standard
Comparing two digit numbers wwwk-5mathteachingresourcescom
Subtraction split wwwk-5mathteachingresourcescom
Ten more wwwk-5mathteachingresourcescom
Addition split wwwk-5mathteachingresourcescom
Exceeds Standard
Comparing 3-Digit numbers wwwk-5mathteachingresourcescom
What number is wwwk-5mathteachingresourcescom
Students develop addition and subtraction number stories and have partners solve
Create pictures using basendash10 blocks Students trace picture onto paper label the base ten blocks with their value and add total
Solve number grid puzzles by adding and subtraction 10 on the number grid
Number cards Base 10 blocks Counters Number grid puzzles Sleeve protectors wwwk-
5mathteachingresourcescom
Dice
Typical Assessment Question(s) or Task(s)
Recognize numbers 1-120 using flashcards
Write numbers 1-20 using block or graph paper
Build two-digit numbers using tens and ones blocks
Listen and note students skip counting orally by tens to 120
Students compare and label two numbers using relation symbols
41
Keansburg School DistrictCurriculum System
Mathematics
42
Keansburg School DistrictCurriculum System
MathematicsKeansburg School DistrictCurriculum Management System
SubjectGradeLevelMathematicsGrade 1
Timeline June-Quarter 4
Topic(s) Readiness skills for September of Grade 2
Significance of Learning Goal(s) To compare larger numbers add fluently and apply measurement skills
Sugg
este
d D
ays
of
Inst
ruct
ion Content
Standards CPI Essential Questions
Specific Learning Objective(s)
The Students Will Be Able ToSuggested Activities
Instructional Tools Materials Technology Resources
Assessments and Assessment Models
CPI
EQ How can I use
place value to compare and
order numbers in the 100s
How can mastering basic addition and subtraction facts help me compute larger numbers
How can I tie in
Concept(s)Use place value to compare larger numbers fluently add up to 20 apply measurement skills
SWBAT Extend place value into
the hundreds place and re-write and construct models beyond the hundreds
Fluently add and subtract within 20 using mental strategies
Apply measurement skills
Meets Standard Place Value barrier game httpwwwk-
5mathteachingresourcescommath-gameshtml (place value only)
High card
httpwwwlearningboxcomBase10 BaseTenhtml
Time barrier game httpwwwk-5mathteachingresourcescomsupport-filestimebarriergamepdf httpwwwk-5mathteachingresourcescomsupport-filestimebarriergamegridpdf
My favorite time of day writing activity
number cards base ten blocks rulers tape measurer string number relationship mat paper plates cotton balls judy clock digital clock
Typical Assessment Question(s) or Task(s)
Students will solve addition and subtraction problems within 20 in a given time
43
Keansburg School DistrictCurriculum System
Mathematicsmeasurement skills with real life experiences
httpwwwk-5mathteachingresourcescomsupport-filesmy-favorite-time-of-daypdf
Estimating length httpwwwk-5mathteachingresourcescomsupport-filesestimatinglengthpdf
Olympic golf plastic golf clubs cotton balls and tape measurer
Olympic smiles measuring smiles with string and rulers
Olympic Frisbee using paper plates and tape measurer
Olympic airplane students will make paper airplanes measure the distance that they can throw their airplane
Doubles plus 1 game httpwwwk-5mathteachingresourcescomsupport-filesdoubles-plus-onepdf
Eleven more httpwwwk-5mathteachingresourcescomsupport-fileselevenmorepdf
frame Students will be asked to
measure items using inches and centimeters
Identify and create numbers with place values extending into the hundreds place
44
Keansburg School DistrictCurriculum System
Mathematics
Building numbers with base ten blocks pick three cards and arrange them to show a 3-digit number build that number with base ten blocks repeat with the same three cards until no new numbers can be made
Length strength inches httpwwwharcourtschoolcomactivitylength_strength1_inches
Length strength centimeters httpwwwharcourtschoolcomactivitylength_strength1_centi
Exceeds Standard
Number relationship mat wwwk-5mathteachingresourcescom
Place value barrier game httpwwwk-5mathteachingresourcescommath-gameshtml (integrate other skills into place values for example the digit in my 10s place is four doubled)
Measuring the mousersquos path httpwwwk-5mathteachingresourcescomsupport-filespaths1pdf
45
Keansburg School DistrictCurriculum System
Mathematics
Double minus 1 game httpwwwk-5mathteachingresourcescomsupport-filesdoubles-minus-onepdf
Number relationship mat httpwwwk-5mathteachingresourcescomsupport-filesnumberrelationshipmatpdf
46
Keansburg School DistrictCurriculum System
Mathematicsignment Matrices of Common Core State Standards
Grade Strand Standard Standard
Sept
embe
r ndash
Oct
ober
Nov
embe
r ndash
Dec
embe
r
Janu
ary
ndash Fe
brua
ry
Mar
ch ndash
Apr
il
May
- Ju
ne
1 OA 1
CC1OA1 Represent and solve problems involving addition and subtraction Use addition and subtraction within 20 to solve word problems involving situations of adding to taking from putting together taking apart and comparing with unknowns in all positions eg by using objects drawings and equations with a symbol for the unknown number to represent the problem
1 OA 2
CC1OA2 Represent and solve problems involving addition and subtraction Solve word problems that call for addition of three whole numbers whose sum is less than or equal to 20 eg by using objects drawings and equations with a symbol for the unknown number to represent the problem
1 OA 3
CC1OA3 Understand and apply properties of operations and the relationship between addition and subtraction Apply properties of operations as strategies to add and subtract Examples If 8 + 3 = 11 is known then 3 + 8 = 11 is also known (Commutative property of addition) To add 2 + 6 + 4 the second two numbers can be added to make a ten so 2 + 6 + 4 = 2 + 10 = 12 (Associative property of addition) (Students need not use formal terms for these properties)
1 OA 4
CC1OA4 Understand and apply properties of operations and the relationship between addition and subtraction Understand subtraction as an unknown-addend problem For example subtract 10 ndash 8 by finding the number that makes 10 when added to 8
1 OA 5 CC1OA5 Add and subtract within 20 Relate counting to addition and subtraction (eg by counting on 2 to add 2)
1 OA 6 CC1OA6 Add and subtract within 20 Add and subtract within 20 demonstrating fluency for addition and subtraction within 10 Use strategies such as counting on making ten (eg 8 + 6 = 8 + 2 + 4 = 10 + 4 = 14) decomposing a number leading to a ten (eg 13 ndash 4 = 13 ndash 3 ndash 1 = 10 ndash 1 = 9) using the relationship between addition and subtraction (eg knowing that 8 + 4
47
Keansburg School DistrictCurriculum System
Mathematics= 12 one knows 12 ndash 8 = 4) and creating equivalent but easier or known sums (eg adding 6 + 7 by creating the known equivalent 6 + 6 + 1 = 12 + 1 = 13)
1 OA 7
CC1OA7 Work with addition and subtraction equations Understand the meaning of the equal sign and determine if equations involving addition and subtraction are true or false For example which of the following equations are true and which are false 6 = 6 7 = 8 ndash 1 5 + 2 = 2 + 5 4 + 1 = 5 + 2
1 OA 8
CC1OA8 Work with addition and subtraction equations Determine the unknown whole number in an addition or subtraction equation relating three whole numbers For example determine the unknown number that makes the equation true in each of the equations 8 + = 11 5 = _ ndash 3 6 + 6 = _
1 NBT 1
CC1NBT1 Extend the counting sequence Count to 120 starting at any number less than 120 In this range read and write numerals and represent a number of objects with a written numeral
1 NBT 2
CC1NBT2 Understand place value Understand that the two digits of a two-digit number represent amounts of tens and ones Understand the following as special cases -- a 10 can be thought of as a bundle of ten ones mdash called a ldquotenrdquo -- b The numbers from 11 to 19 are composed of a ten and one two three four five six seven eight or nine ones -- c The numbers 10 20 30 40 50 60 70 80 90 refer to one two three four five six seven eight or nine tens (and 0 ones)
1 NBT 3
CC1NBT3 Understand place value Compare two two-digit numbers based on meanings of the tens and ones digits recording the results of comparisons with the symbols gt = and lt
1 NBT 4
CC1NBT4 Use place value understanding and properties of operations to add and subtract Add within 100 including adding a two-digit number and a one-digit number and adding a two-digit number and a multiple of 10 using concrete models or drawings and strategies based on place value properties of operations andor the relationship between addition and subtraction relate the strategy to a written method and explain the reasoning used Understand that in adding two-digit numbers one adds tens and tens ones and ones and sometimes it is necessary to compose a ten
1 NBT 5
CC1NBT5 Use place value understanding and properties of operations to add and subtract Given a two-digit number mentally find 10 more or 10 less than the number without having to count explain the reasoning used
1 NBT 6 CC1NBT6 Use place value understanding and properties of operations to add and subtract Subtract multiples of 10 in the range 10-90 from multiples of 10 in the range 10-90 (positive or zero differences) using concrete models or drawings and strategies based on place value properties of operations andor
48
Keansburg School DistrictCurriculum System
Mathematicsthe relationship between addition and subtraction relate the strategy to a written method and explain the reasoning used
1 MD 1
CC1MD1 Measure lengths indirectly and by iterating length units Order three objects by length compare the lengths of two objects indirectly by using a third object
1 MD 2
CC1MD2 Measure lengths indirectly and by iterating length units Express the length of an object as a whole number of length units by laying multiple copies of a shorter object (the length unit) end to end understand that the length measurement of an object is the number of same-size length units that span it with no gaps or overlaps Limit to contexts where the object being measured is spanned by a whole number of length units with no gaps or overlaps
1 MD 3CC1MD3 Tell and write time Tell and write time in hours and half-hours using analog and digital clocks
1 MD 4
CC1MD4 Represent and interpret data Organize represent and interpret data with up to three categories ask and answer questions about the total number of data points how many in each category and how many more or less are in one category than in another
1 G 1
CC1G1 Reason with shapes and their attributes Distinguish between defining attributes (eg triangles are closed and three-sided) versus non-defining attributes (eg color orientation overall size) for a wide variety of shapes build and draw shapes to possess defining attributes
1 G 2
CC1G2 Reason with shapes and their attributes Compose two-dimensional shapes (rectangles squares trapezoids triangles half-circles and quarter-circles) or three-dimensional shapes (cubes right rectangular prisms right circular cones and right circular cylinders) to create a composite shape and compose new shapes from the composite shape (Students do not need to learn formal names such as ldquoright rectangular prismrdquo)
1 G 3
CC1G3 Reason with shapes and their attributes Partition circles and rectangles into two and four equal shares describe the shares using the words halves fourths and quarters and use the phrases half of fourth of and quarter of Describe the whole as two of or four of the shares Understand for these examples that decomposing into more equal shares creates smaller shares
49
Keansburg School DistrictCurriculum System
Mathematics
Common Core State Standards Vocabulary
Addition and subtraction within 5 10 20 100 or 1000 Addition or subtraction of two whole numbers with whole number answers and with sum or minuend in the range 0-5 0-10 0-20 or 0-100 respectively Example 8 + 2 = 10 is an addition within 10 14 ndash 5 = 9 is a subtraction within 20 and 55 ndash 18 = 37 is a subtraction within 100
Additive inverses Two numbers whose sum is 0 are additive inverses of one another Example 34 and ndash 34 are additive inverses of one another because 34 + (ndash 34) = (ndash 34) + 34 = 0
Associative property of addition See Table 3 in this Glossary
Associative property of multiplication See Table 3 in this Glossary
Bivariate data Pairs of linked numerical observations Example a list of heights and weights for each player on a football team
Box plot A method of visually displaying a distribution of data values by using the median quartiles and extremes of the data set A box shows the middle 50 of the data1
Commutative property See Table 3 in this Glossary
Complex fraction A fraction AB where A andor B are fractions (B nonzero)
Computation algorithm A set of predefined steps applicable to a class of problems that gives the correct result in every case when the steps are carried out correctly See also computation strategy
Computation strategy Purposeful manipulations that may be chosen for specific problems may not have a fixed order and may be aimed at converting one problem into another See also computation algorithm
Congruent Two plane or solid figures are congruent if one can be obtained from the other by rigid motion (a sequence of rotations reflections and translations)
Counting on A strategy for finding the number of objects in a group without having to count every member of the group For example if a stack of books is known to have 8 books and 3 more books are added to the top it is not necessary to count the stack
50
Keansburg School DistrictCurriculum System
Mathematicsall over again One can find the total by counting onmdashpointing to the top book and saying ldquoeightrdquo following this with ldquonine ten eleven There are eleven books nowrdquo
Dot plot See line plot
Dilation A transformation that moves each point along the ray through the point emanating from a fixed center and multiplies distances from the center by a common scale factor
Expanded form A multi-digit number is expressed in expanded form when it is written as a sum of single-digit multiples of powers of ten For example 643 = 600 + 40 + 3
Expected value For a random variable the weighted average of its possible values with weights given by their respective probabilities
First quartile For a data set with median M the first quartile is the median of the data values less than M Example For the data set 1 3 6 7 10 12 14 15 22 120 the first quartile is 62 See also median third quartile interquartile range
Fraction A number expressible in the form ab where a is a whole number and b is a positive whole number (The word fraction in these standards always refers to a non-negative number) See also rational number
Identity property of 0 See Table 3 in this Glossary
Independently combined probability models Two probability models are said to be combined independently if the probability of each ordered pair in the combined model equals the product of the original probabilities of the two individual outcomes in the ordered pair
Integer A number expressible in the form a or ndasha for some whole number a
Interquartile Range A measure of variation in a set of numerical data the interquartile range is the distance between the first and third quartiles of the data set Example For the data set 1 3 6 7 10 12 14 15 22 120 the interquartile range is 15 ndash 6 = 9 See also first quartile third quartile
Line plot A method of visually displaying a distribution of data values where each data value is shown as a dot or mark above a number line Also known as a dot plot3
51
Keansburg School DistrictCurriculum System
MathematicsMean A measure of center in a set of numerical data computed by adding the values in a list and then dividing by the number of values in the list4 Example For the data set 1 3 6 7 10 12 14 15 22 120 the mean is 21
Mean absolute deviation A measure of variation in a set of numerical data computed by adding the distances between each data value and the mean then dividing by the number of data values Example For the data set 2 3 6 7 10 12 14 15 22 120 the mean absolute deviation is 20
Median A measure of center in a set of numerical data The median of a list of values is the value appearing at the center of a sorted version of the listmdashor the mean of the two central values if the list contains an even number of values Example For the data set 2 3 6 7 10 12 14 15 22 90 the median is 11
Midline In the graph of a trigonometric function the horizontal line halfway between its maximum and minimum values
Multiplication and division within 100 Multiplication or division of two whole numbers with whole number answers and with product or dividend in the range 0-100 Example 72 divide 8 = 9
Multiplicative inverses Two numbers whose product is 1 are multiplicative inverses of one another Example 34 and 43 are multiplicative inverses of one another because 34 times 43 = 43 times 34 = 1
Number line diagram A diagram of the number line used to represent numbers and support reasoning about them In a number line diagram for measurement quantities the interval from 0 to 1 on the diagram represents the unit of measure for the quantity
Percent rate of change A rate of change expressed as a percent Example if a population grows from 50 to 55 in a year it grows by 550 = 10 per year
Probability distribution The set of possible values of a random variable with a probability assigned to each
Properties of operations See Table 3 in this Glossary
Properties of equality See Table 4 in this Glossary
Properties of inequality See Table 5 in this Glossary
Properties of operations See Table 3 in this Glossary
52
Keansburg School DistrictCurriculum System
MathematicsProbability A number between 0 and 1 used to quantify likelihood for processes that have uncertain outcomes (such as tossing a coin selecting a person at random from a group of people tossing a ball at a target or testing for a medical condition)
Probability model A probability model is used to assign probabilities to outcomes of a chance process by examining the nature of the process The set of all outcomes is called the sample space and their probabilities sum to 1 See also uniform probability model
Random variable An assignment of a numerical value to each outcome in a sample space
Rational expression A quotient of two polynomials with a non-zero denominator
Rational number A number expressible in the form ab or ndash ab for some fraction ab The rational numbers include the integers
Rectilinear figure A polygon all angles of which are right angles
Rigid motion A transformation of points in space consisting of a sequence of one or more translations reflections andor rotations Rigid motions are here assumed to preserve distances and angle measures
Repeating decimal The decimal form of a rational number See also terminating decimal
Sample space In a probability model for a random process a list of the individual outcomes that are to be considered
Scatter plot A graph in the coordinate plane representing a set of bivariate data For example the heights and weights of a group of people could be displayed on a scatter plot5
Similarity transformation A rigid motion followed by a dilation
Tape diagram A drawing that looks like a segment of tape used to illustrate number relationships Also known as a strip diagram bar model fraction strip or length model
Terminating decimal A decimal is called terminating if its repeating digit is 0
Third quartile For a data set with median M the third quartile is the median of the data values greater than M Example For the data set 2 3 6 7 10 12 14 15 22 120 the third quartile is 15 See also median first quartile interquartile range
Transitivity principle for indirect measurement If the length of object A is greater than the length of object B and the length of object B is greater than the length of object C then the length of object A is greater than the length of object C This principle applies
53
Keansburg School DistrictCurriculum System
Mathematicsto measurement of other quantities as well
Uniform probability model A probability model which assigns equal probability to all outcomes See also probability model
Vector A quantity with magnitude and direction in the plane or in space defined by an ordered pair or triple of real numbers
Visual fraction model A tape diagram number line diagram or area model
Whole numbers The numbers 0 1 2 3 hellip5
54
- MissionVision Statement
- Beliefs
- Measurement amp Data
- Measure lengths and by iterating length units
- Tell and write time
- Represent and interpret data
- Geometry
- Reason with shapes and their attributes
- Number and Base Ten
- Extend the counting sequence
- Understand place value
-
- Measurement amp Data (II)
-
- Measure lengths and by iterating length units
- Tell and write time
-
- Represent and interpret data
- Geometry (II)
- Reason with shapes their attributes
-
- Number and Base Ten
- Use place value understanding and properties of operations to add and subtract
- Teacher will cover up specific numbers on an enlarged number grid using cover up tape to have students identify numbers before and after Students will come up and write the missing numbers
- Students will play ldquoI have__ Who has __ Teacher will create cards using index cards and numbers in which students need further practice with Students will read their cards aloud Variations of game can include identifying specific numbers identifying numbers more or less etc)
- Students will use base ten blocks to represent numbers including three digit numbers Students will identify representation of numbers through these manipulatives They may match the representation to the written number
- Students will write the number they created using the base ten blocks using their white boards and markers
- Students will arrange given digits to create the greatest and lowest possible numbers They can show each number they create using base ten blocks
- Students will use the Base Ten Exchange Game to show an understanding of exchanging ones for tens and tens for hundreds Students can use place value mats base ten blocks (cubes tens and flats) Students can take number of cubes displayed with roll of single die Students will determine when exchanging can be made when reaching ten units
- Base ten concentration wwwk-5mathteachingresourcescom
- Ten frame compare wwwk-5mathteachingresourcescom
-
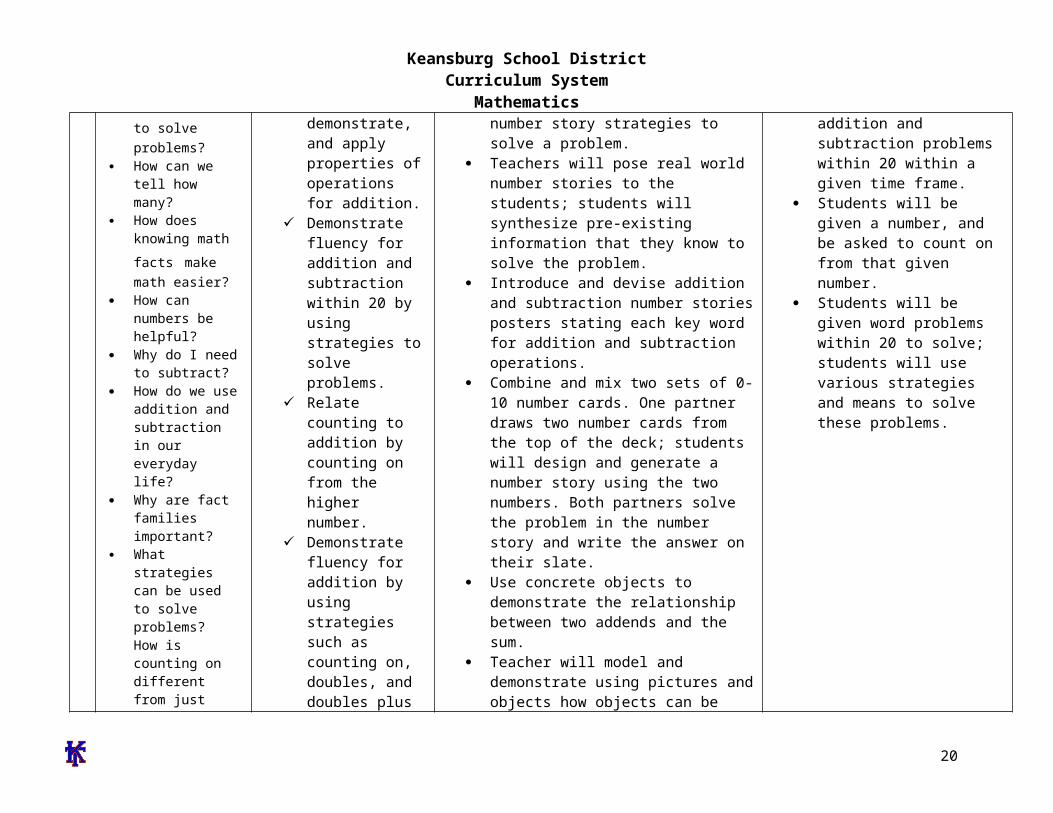
Keansburg School DistrictCurriculum System
Mathematicsthe front of the classroom to the back
If we measure in footsteps why are some of the measurements different
How is longer and shorter similar to greater and lesser
and teachers can complete quizzes available on website
Teachers will present time on an analog clock students will write the digital time on a white board
Students will play clock concentration
Exceeds Standard
The students will work in pairs to locate objects around the room and compare the lengths against each other The pairs will then work with another pair of students and compare the lengths of their objects with the objects the other pair located
Teacher will introduce the ruler in comparison to the yardstick The students will be encouraged to find objects that in the room that are larger than a ruler and measure using the yardstick
After the teacher introduces units of personal measurement the students will be encouraged to measure object in the room using their own unit of personal measurement and convert it into a standard measurement using a ruler or a yardstick
The teacher will select a classroom object and the students will be asked to illustrate objects in the room that are bigger and smaller by a specific size
The students will be able to organize represent and interpret data up to four
20
Keansburg School DistrictCurriculum System
Mathematicsor more categories through the use of a bar graph
The teacher will then divide students into heterogeneous groups and encourage the students to explain what they can learn from the graph and create a tally chart utilizing the data
Students will create clock flash cards by drawing an analog clock on one side and writing the digital clock time on the other
Give students a clock and a blue number cube ()
21
Keansburg School DistrictCurriculum System
MathematicsKeansburg School DistrictCurriculum Management System
SubjectGradeLevelMathematicsGrade 1
Timeline December-Quarter 2
Topic(s) Geometry
Significance of Learning Goal(s) To identify shapes and their attribures
Sugg
este
d D
ays
of
Inst
ruct
ion Content
Standards CPI Essential
Questions
Specific Learning Objective(s)
The Students Will Be Able To
Suggested Activities
Instructional Tools Materials
Technology Resources
Assessments and Assessment Models
CPI1G1 1G2
EQ Where do
you see shapes in our classroom
Are there different shapes outside
How are geometric figures alike
How can we sort
Concept(s) Identify shapes and their attributes
SWBAT Distinguish
between two and three-dimensional shapes by classifying their attributes For example color shape and size
Compare and contrast shapes based on their attributes
Construct and create shapes
Meets Standard Sorting shapes based on their attributes For example
number of sideso Materials attribute blocks shape card sheet sorting
mat Introduce vocabulary cylinder cube sphere rectangular
prism triangular prism pyramid Classroom shape hunt students go around the room finding shapes within the classroom For example trash can tissue box clock
o Materials shape sheet classroom objects httpilluminationsnctmorgLessonDetailaspxid=L237
Create 3-dimenstion shapes (rectangular prism pyramid cube)
o Straws twist ties shape cards Create 2-dimensional shapes (trapezoid triangle circle
rectangle rhombus)o Pattern block templates attribute blocks pattern
block template stencil geo-boards rubber bands httpilluminationsnctmorgLessonDetailaspx
Attribute blocks Shape card
sheet Sorting mat Twist ties Straws Shape cards Pattern block
templates Attribute blocks Pattern block
template stencil Geo-boards Rubber bands
22
Keansburg School DistrictCurriculum System
Mathematicsobjects of different shapes
How can shapes and solids be described compared and used to make other shapes What are equal parts
What foods do you divide into equal parts
What other items might be divided
How do you know if you have an equal share
possessing certain attributes
Identify and construct two-dimensional shapes
Identify and construct three-dimensional figures
id=L168 Create a drawing using shapes students will create a
picture using the pattern block template stencil (house sun flowers etc)
o Paper pattern block stencil template crayons
Apply understanding of attributes by playing Shape Detective and Attribute Train Game
Demonstrate understanding of 3 Dimensional shapes by playing Whatrsquos My Shape
Exceeds Standard
Introducing and exposing higher vocabulary polyhedronpolyhedra (many faces of a shape) Placing the word onto the word wall
Students read the poem Shapes by Shel Silverstein and create their own illustration of the poem to explore geometric figures and positional words
Materials httpilluminationsnctmorgLessonDetailaspxID=L202
Shapes by Shel Silverstein paper crayons pencils examples of rectangles triangles circles
Compose clues using inferencing to play Guess What Display variety of 3 dimensional shapes Silently choose
an object and give clues about it For example I amsmall I have 2 flat faces and if you trace my faces youwill get circles What am I (tomato can)
Students work together to use pattern blocks to coverother pattern blocks For example how many triangleblocks are needed to cover a hexagon block
Student rotate in groups to visit each geometric solidwhile completing a chart which shows faces sides and
Typical Assessment Question(s) or Task(s)
Ask students how many sides each shape has
Have students classify shapes based on number of sides
Have students identify shapes in the classroom
Have students create 2 and 3 dimensional shapes
Have students design pictures using pattern blockspattern block template
Have students identify and describe assigned shapersquos attributes
Ask students to name 3 dimensional shapes hidden i bag (Whatrsquos my Shape Game)
23
Keansburg School DistrictCurriculum System
Mathematics corners Students compose a shape town by using their pattern
block templates Then students will calculate the totalnumber of each pattern block used
Students will invent new shapes by using three-dimensional shapes
Students will create patterns using three dimensionalshapes
24
Keansburg School DistrictCurriculum System
MathematicsKeansburg School DistrictCurriculum Management System
SubjectGradeLevelMathematicsGrade 1
Timeline January-Quarter 2
Topic(s) Number and Operations in Base Ten
Significance of Learning Goal(s) To recognize compare and understand numbers to 120
Sugg
este
d D
ays
of
Inst
ruct
ion Content
Standards CPI Essential
Questions
Specific Learning Objective(s)
The Students Will Be Able To
Suggested ActivitiesInstructional Tools Materials
Technology Resources Assessments and Assessment
Models
25
Keansburg School DistrictCurriculum System
MathematicsCPI 1NBT1 1NBT2A 1NBT2B 1NBT2C 1NBT3
EQ How do
numbers help us
How can sets of numbers be counted compared and ordered
How can I use numbers to solve problems
How would putting numbers on a chart make it easier to understand information
How can I make it easier to understand numbers when I sort them
What is place value
Concept(s) Recognize compare and understand numbers up to 120
SWBAT Recognize read write
and count 0-120 Understand that a two-
digit number represents amounts of tens and ones
Relate groups of ten to skip counting
Compare two two-digit numbers based on meanings of tens and ones digits using symbols ltgt and =
Meets Standard Teacher will cover up specific numbers
on an enlarged number grid using cover up tape to have students identify numbers before and after Students will come up and write the missing numbers
Students will play ldquoI have__ Who has __ Teacher will create cards using index cards and numbers in which students need further practice with Students will read their cards aloud Variations of game can include identifying specific numbers identifying numbers more or less etc)
Students will use base ten blocks to represent numbers including three digit numbers Students will identify representation of numbers through these manipulatives They may match the representation to the written number
Students will write the number they created using the base ten blocks using their white boards and markers
Students will arrange given digits to create the greatest and lowest possible numbers They can show each number they create using base ten blocks
Students will use the Base Ten Exchange Game to show an
Number grids ldquoI have Who hasrdquo index
cards base ten blocks white boards markers number cards dice ten frame base ten concentration
boards (k-5 math teaching resources)
double ten frame boards (k-5 math teaching resources)
Typical Assessment Question(s) or Task(s)
Recognize numbers 1-120 using flashcards
Write numbers 1-20 using block or graph paper
Build two-digit numbers using tens and ones blocks
Listen and note students skip counting orally by tens to 120
Students compare and label two numbers using relation symbols
26
Keansburg School DistrictCurriculum System
Mathematics Why is place
value important
How can I use place value to compare and order numbers
How can I use the number grid to help me with counting numbers
How many times do you think you can hop in one minute
What does number relationships mean
Why do we need to know how to add
Why do we need to know how to subtract
How are addition and subtraction related
What are doubles
How can
understanding of exchanging ones for tens and tens for hundreds Students can use place value mats base ten blocks (cubes tens and flats) Students can take number of cubes displayed with roll of single die Students will determine when exchanging can be made when reaching ten units
Teens on the ten frame wwwk-5mathteachingresourcescom
Base ten concentration wwwk-5mathteachingresourcescom
Ten frame compare wwwk-5mathteachingresourcescom
Exceeds Standard
Students will create riddles Irsquom thinking of a number that has 4 tens and 13 ones Have students solve the riddle by regrouping the ones to find the answer
-Students use hundreds chart to jump up and down from a number to show 10 more or 10 less
-Students will play Whatrsquos my Number by giving clues based on place value odd or even and number sense For example Irsquom a two digit number The digit in my tens place is 2 more than 4
27
Keansburg School DistrictCurriculum System
Mathematicsdouble facts help us to add and subtract
Does it matter what order you use to add three numbers Why or why not
The digit in my ones place is 3 less than 8 Whatrsquos my number
My double ten frame riddle wwwk-5mathteachingresourcescom
28
Keansburg School DistrictCurriculum System
MathematicsKeansburg School DistrictCurriculum Management System
SubjectGradeLevelMathematicsGrade 1
Timeline February-Quarter 3
Topic(s) Operations amp Algebraic Expressions
Significance of Learning Goal(s) To solve addition and subtraction problems
Sugg
este
d D
ays
of
Inst
ruct
ion Content
Standards CPI
Essential Questions
Specific Learning Objective(s)
The Students Will Be Able To
Suggested ActivitiesInstructional Tools Materials
Technology Resources Assessments and Assessment
Models
CPI1OA31OA4 1OA5 1OA6 1OA7 1OA81OA2
EQ What
questions can be answered using addition
What strategies can be used to solve problems
How can we
Concept(s) Solve addition with and subtraction problems
SWBAT Solve addition problems
with sums up to 20 Use addition within 20 to
solve word problems involving real life situations
Solve word problems that call for addition of three whole numbers up to 20
Solve subtraction problems with difference up to 20
Use subtraction within 20 to solve word problems involving real
Meets Standard Model and have students create their
own individual number sentence using manipulatives and label operation symbols
Students will choose a strategy to solve number stories such as objects fingers and pictures count onback number line or number grid
Create real life situations in which students will use a strategy to solve a number story and create a number model
Review addition and subtraction number stories posters stating each key word for addition and subtraction operations
Combine and mix two sets of 0-20 number cards One partner draws two number cards from the top of the deck students will design and generate a number story using the two numbers
Materials Manipulatives (examples
counting bears connecting cubes pennies counters etc)
Slates dry erase markers erasers
Clear Sheet Protectors Sets of 0-20 number cards Number cards Cardstock Scrabble tiles letter cards
Typical Assessment Question(s) or Task(s)
Students will solve real life
29
Keansburg School DistrictCurriculum System
Mathematicstell how many
How does knowing math facts make math easier
How can numbers be helpful
Why do I need to subtract
How do we use addition and subtraction in our everyday life
Why are fact families important
What strategies can be used to solve problems How is counting on different from just counting to add
What information do you need to know in order to find
life situations Understand subtraction
as an unknown addend problem example subtract 9-5 by finding the number that makes 9 when added to 5
Both partners solve the problem in the number story and write the answer on their slate
Find three cards that have a sum of 12 how many different ways can the student make the sum of 12 using three cards students record work
-Teacher creates real life word problemsinvolving three addends up to 20
Ten frames subtraction wwwk-5mathteachingresourcescom
I have who has wwwk-5mathteachingresourcescom
True or false wwwk-5mathteachingresourcescom
Count to 20 wwwk-5mathteachingresourcescom
Exceeds Standard
Teacher creates multi step word problems for students to solve
Students work with partners or small groups to create real life word problems Compose class book of problems
Three letter addends use scrabble tiles or letter cards with corresponding numbers to make three letter words find
word problems Students will create their
own number sentences own number storiesword problems
Students will create and solve number stories in cooperative learning groups
Students will generate word problems using assigned numbers
30
Keansburg School DistrictCurriculum System
Mathematicsthe total number of something
Why would you need to count back
How are subtraction and addition related
the sum of each word by adding the numbers on the tiles Students will find which words have the greatest or smallest sum
31
Keansburg School DistrictCurriculum System
MathematicsKeansburg School DistrictCurriculum Management System
SubjectGradeLevelMathematicsGrade 1
Timeline March-Quarter 3
Topic(s) Measurement amp Data
Significance of Learning Goal(s) To tell time and compare measurements
Sugg
este
d D
ays
of
Inst
ruct
ion Content
Standards CPI
Essential Questions
Specific Learning Objective(s)
The Students Will Be Able ToSuggested Activities
Instructional Tools Materials Technology Resources
Assessments and Assessment Models
How would I know if a bar graph correctly shows what is on a tally chart
How could a bar graph answer a question
Do bar graphs make it easier to understand and compare facts Why
What kind
Concept(s) Telling time comparing measurements
SWBAT Identify and write time to
the hour and half hour on both a digital and analog clock
Write time to the hour and half-hour on both digital and analog clocks
Draw the hands on the analog clock for a given time to the hour or half-hour
Relate times to the half hour as ldquohalf-pastrdquo the hour
Compare and contrast
Meets Standard Students will have their own
demonstration clocks students will identify and find the hour and minute hands
Students create their own clocks using paper plates students will manipulate hands to identify varying times
Students will listen to Jack Hartman ldquoTick Tockrdquo song
Teachers and students will view clock on videos on brainpopjrcom students and teachers can complete quizzes available on website
Teachers will present time on an analog clock students will write the digital time on a white board
Students will play clock concentration Teacher will introduce measurement by
holding up objects and the students will examine the objects and explain the size
Large Judy Clock Individual student Judy
clocks Wipe off analogdigital clocks Clock stampers Timers Rulers Yardsticks Measuring tapes Sheet protectors Cardstock Paper plates Fasteners Index cards
Typical Assessment Question(s) or Task(s)
Students will be asked to identify and write time to the hour and half hour on both
32
Keansburg School DistrictCurriculum System
Mathematicsof graph should I use to answer questions
Why do I need to tell time
How many hands does a clock have
Are the hands on the clock the same size
How long is a minute
Why do I need to use a calendar
How do we use the clock and the calendar to determine what we will do in school
Why do we need to measure something
What can
objects by length Construct objects at
contrasting lengths
ordero Students will break into groups
and compare objects further and classify them depending on their size
Teacher will introduce the ruler Explain to students that the ruler is used to measure objects The students will then explore the classroom and select objects around the room that are smaller and larger than the ruler
Teacher will select specific body parts that the students will use as a personal unit of measurement The students will work in pairs to demonstrate how to measure objects around the room using their personal unit of measurement
The teacher will select a classroom object and the students will be asked to illustrate objects in the room that are bigger and smaller in size
The students will be able to organize represent and interpret data up to three categories through the use of a bar graph
The teacher will then divide students into heterogeneous groups and encourage the students to explain what they can learn from the graph The students will present findings following activity
Students will choose an object within classroom then find additional objects one being larger the other being shorter using a two-column chart Draw or write the objects in the chart
digital and analog clocks Students will be asked to
identify the parts of a clock students will be asked to draw the hands on an analog clock for a given time to the hour or half-hour
Students will be given various objects and will further be asked to compare and contrast the lengths of these objects
Students will be asked to provide or create objects contrasting lengths to demonstrate understanding of differences in length
33
Keansburg School DistrictCurriculum System
Mathematicswe use to draw and measure things
What do you think is about 1 inch long
How many steps long do you think it is from the front of the classroom to the back
If we measure in footsteps why are some of the measurements different
How is longer and shorter similar to greater and lesser
Exceeds Standard
The students will work in pairs to locate objects around the room and compare the lengths against each other The pairs will then work with another pair of students and compare the lengths of their objects with the objects the other pair located
Teacher will introduce the ruler in comparison to the yardstick The students will be encouraged to find objects that in the room that are larger than a ruler and measure using the yardstick
After the teacher introduces units of personal measurement the students will be encouraged to measure object in the room using their own unit of personal measurement and convert it into a standard measurement using a ruler or a yardstick
The teacher will select a classroom object and the students will be asked to illustrate objects in the room that are bigger and smaller by a specific size
The students will be able to organize represent and interpret data up to four or more categories through the use of a bar graph
The teacher will then divide students into heterogeneous groups and encourage the students to explain what they can learn from the graph and create a tally chart utilizing the data
Students will create clock flash cards by
34
Keansburg School DistrictCurriculum System
Mathematicsdrawing an analog clock on one side and writing the digital clock time on the other Students will include time in five minute intervals
Pose word problems where students have to find elapse time to the hour and half hour
Introduce second hand and conduct activities that are timed in seconds (Examples hopping on 1 foot blinking eyes counting to the highest number)
35
Keansburg School DistrictCurriculum System
MathematicsKeansburg School DistrictCurriculum Management System
SubjectGradeLevelMathematicsGrade 1
Timeline April-Quarter 4
Topic(s) Geometry
Significance of Learning Goal(s) To identify two and three dimensional shapes to understand fractional parts and create equal shares
Sugg
este
d D
ays
of
Inst
ruct
ion Content
Standards CPI Essential
Questions
Specific Learning Objective(s)
The Students Will Be Able To
Suggested ActivitiesInstructional Tools Materials
Technology Resources Assessments and Assessment
Models
Are there different shapes outside
How are geometric figures alike
How can we sort objects of different shapes
How can shapes and solids be described compared and used to make other shapes
Concept(s) Two and three dimensional shapes fractional parts equal shares
SWBAT
Combine two-dimensional or three-dimensional shapes or figures to create a new composite shape and identify the shapes within
Identify fractional parts of circles and rectangles into equal shares while developing vocabulary for halves fourths and quarters
Describe the whole as
Meets Standard
Determine which shape by touch without using their sight
o Materials attribute blocks shape sheet feely box wwwilluminationsnctmorglessondetail
Sorting 3-dimensional objects students will be given cards with 3-dimensional objects (trash can soup can globe ball tissue box box dice) they will sort them based on the 3-dimensional shape they represent
o 3-dimensional object cards sorting mats
Pizza and Cake Fractions students will utilize a pizza and a cake to work on the concept of fractions while developing the vocabulary halves quarters and fourths
o Materials teacher created pizza
Attribute blocks Geometric shapes 3-dimensional object
cards Sorting maps 3-dimensional shapes Solid and lane figures Geo-boards and rubber
bands Fraction circles Sheet protectors 2-dimensional shapes
Typical Assessment Question(s) or Task(s)
Students will be asked to describe and identify
36
Keansburg School DistrictCurriculum System
MathematicsWhat are equal parts
What foods do you divide into equal parts
What other items might be divided
How do you know if you have an equal share
two of or four of the shares Understand for these examples that decomposing into more equal shares creates smaller shares
and cake that are cut into fractions (construction paper)
Students will illustrate a picture of a boat using at least one three dimensional shape in their drawings Shapes include cubes cylinders spheres cones and rectangular prisms
Solid and Plane Figures Name the Face activity Provide three-dimensional objects Have students draw the face for each object as well as name the shape Examples ABC block juice can book party hat
Introduce fractions by having students identify shapes that show equal parts Display cut out shapes using document camera Include some shapes that are divided equally and some that are not divided equally As a whole group sort shapes into two categories Then have students go back to their desks and work with a partner to classify additional shapes
Provide students with shapes that are divided into four parts Include shapes that are divided into four equal parts and others that are unequal Students identify the shapes that are divided into four equal parts and explain their reasoning
Shape Town activity Students will design a shape town using the following shapes
shapes within combined two and three-dimensional shapes
Students will be given circles and rectangles students will be asked to divide these shapes into halves fourths and quarters
Students will be asked to sort shapes that are divided equally and not divided equally
37
Keansburg School DistrictCurriculum System
Mathematicstrapezoid hexagon square triangle and circle Afterwards students will calculate the total number of each shape they included After completing the activity students will present their final product to the class and explain how they decided which shapes to use
Given an array of dots students will draw shapes with specific number of sides and corners and connect the dots to create the shapes Example Draw a shape with 5 sides Draw a shape with 6 corners
Students will create two-dimensional shapes on geoboards Then using different colored rubber bands students will divide the shapes into equal parts Students will transfer their equally divided shapes onto geoboard paper by drawing lines to show their equal parts
Play the Fraction Path Game Materials Fraction circles a circle with frac12 shaded a circle with 13 shaded and a circle with frac14 shaded Gameboard Path consisting of assorted shapes divided into halves thirds and fourths Players Needed 3 Directions Place the fraction circles facedown Players close their eyes and pick one fraction circle Each player follows the path from start to finish Each player looks at each shape on the path and records how many shapes show their fractions Players record
38
Keansburg School DistrictCurriculum System
Mathematicstheir results on paper using tally marks At end of game students compare total number of shapes that show their fraction
Exceeds Standard
39
Keansburg School DistrictCurriculum System
MathematicsKeansburg School DistrictCurriculum Management System
SubjectGradeLevelMathematicsGrade 1
Timeline May-Quarter 4
Topic(s) Number and Operations in Base Ten
Significance of Learning Goal(s) To use place value to add and subtract
Sugg
este
d D
ays
of
Inst
ruct
ion Content
Standards CPI Essential
Questions
Specific Learning Objective(s)
The Students Will Be Able ToSuggested Activities
Instructional Tools Materials Technology Resources
Assessments and Assessment Models
40
Keansburg School DistrictCurriculum System
MathematicsCPI 1NBT4 1NBT5 1NBT6
EQ How do
numbers help us
How can sets of numbers be counted compared and ordered
How can I use numbers to solve problems
How would putting numbers on a chart make it easier to understand information
How can I make it easier to understand numbers when I sort them
What is place value
Why is place value important
How can I
Concept(s) Use place value and properties of operations to add and subtract
SWBAT Use mental math to find
10 more or ten less than a given two-digit number and explain reasoning used within any number to 120
Use place value to add within 100 add a two-digit number to a one-digit number and add a two-digit number to a multiple of ten
Understand when adding two-digit numbers that ones add to the ones and tens add to the tens and sometimes it is necessary to compose a ten by regrouping
For all above objects students will use concrete models and strategies based on place value and relate the strategy to a written method and explain the reasoning used
Subtract multiples of 10 in the range 10-90 from multiples of 10 in the range 10-90 using
Meets Standard
Comparing two digit numbers wwwk-5mathteachingresourcescom
Subtraction split wwwk-5mathteachingresourcescom
Ten more wwwk-5mathteachingresourcescom
Addition split wwwk-5mathteachingresourcescom
Exceeds Standard
Comparing 3-Digit numbers wwwk-5mathteachingresourcescom
What number is wwwk-5mathteachingresourcescom
Students develop addition and subtraction number stories and have partners solve
Create pictures using basendash10 blocks Students trace picture onto paper label the base ten blocks with their value and add total
Solve number grid puzzles by adding and subtraction 10 on the number grid
Number cards Base 10 blocks Counters Number grid puzzles Sleeve protectors wwwk-
5mathteachingresourcescom
Dice
Typical Assessment Question(s) or Task(s)
Recognize numbers 1-120 using flashcards
Write numbers 1-20 using block or graph paper
Build two-digit numbers using tens and ones blocks
Listen and note students skip counting orally by tens to 120
Students compare and label two numbers using relation symbols
41
Keansburg School DistrictCurriculum System
Mathematics
42
Keansburg School DistrictCurriculum System
MathematicsKeansburg School DistrictCurriculum Management System
SubjectGradeLevelMathematicsGrade 1
Timeline June-Quarter 4
Topic(s) Readiness skills for September of Grade 2
Significance of Learning Goal(s) To compare larger numbers add fluently and apply measurement skills
Sugg
este
d D
ays
of
Inst
ruct
ion Content
Standards CPI Essential Questions
Specific Learning Objective(s)
The Students Will Be Able ToSuggested Activities
Instructional Tools Materials Technology Resources
Assessments and Assessment Models
CPI
EQ How can I use
place value to compare and
order numbers in the 100s
How can mastering basic addition and subtraction facts help me compute larger numbers
How can I tie in
Concept(s)Use place value to compare larger numbers fluently add up to 20 apply measurement skills
SWBAT Extend place value into
the hundreds place and re-write and construct models beyond the hundreds
Fluently add and subtract within 20 using mental strategies
Apply measurement skills
Meets Standard Place Value barrier game httpwwwk-
5mathteachingresourcescommath-gameshtml (place value only)
High card
httpwwwlearningboxcomBase10 BaseTenhtml
Time barrier game httpwwwk-5mathteachingresourcescomsupport-filestimebarriergamepdf httpwwwk-5mathteachingresourcescomsupport-filestimebarriergamegridpdf
My favorite time of day writing activity
number cards base ten blocks rulers tape measurer string number relationship mat paper plates cotton balls judy clock digital clock
Typical Assessment Question(s) or Task(s)
Students will solve addition and subtraction problems within 20 in a given time
43
Keansburg School DistrictCurriculum System
Mathematicsmeasurement skills with real life experiences
httpwwwk-5mathteachingresourcescomsupport-filesmy-favorite-time-of-daypdf
Estimating length httpwwwk-5mathteachingresourcescomsupport-filesestimatinglengthpdf
Olympic golf plastic golf clubs cotton balls and tape measurer
Olympic smiles measuring smiles with string and rulers
Olympic Frisbee using paper plates and tape measurer
Olympic airplane students will make paper airplanes measure the distance that they can throw their airplane
Doubles plus 1 game httpwwwk-5mathteachingresourcescomsupport-filesdoubles-plus-onepdf
Eleven more httpwwwk-5mathteachingresourcescomsupport-fileselevenmorepdf
frame Students will be asked to
measure items using inches and centimeters
Identify and create numbers with place values extending into the hundreds place
44
Keansburg School DistrictCurriculum System
Mathematics
Building numbers with base ten blocks pick three cards and arrange them to show a 3-digit number build that number with base ten blocks repeat with the same three cards until no new numbers can be made
Length strength inches httpwwwharcourtschoolcomactivitylength_strength1_inches
Length strength centimeters httpwwwharcourtschoolcomactivitylength_strength1_centi
Exceeds Standard
Number relationship mat wwwk-5mathteachingresourcescom
Place value barrier game httpwwwk-5mathteachingresourcescommath-gameshtml (integrate other skills into place values for example the digit in my 10s place is four doubled)
Measuring the mousersquos path httpwwwk-5mathteachingresourcescomsupport-filespaths1pdf
45
Keansburg School DistrictCurriculum System
Mathematics
Double minus 1 game httpwwwk-5mathteachingresourcescomsupport-filesdoubles-minus-onepdf
Number relationship mat httpwwwk-5mathteachingresourcescomsupport-filesnumberrelationshipmatpdf
46
Keansburg School DistrictCurriculum System
Mathematicsignment Matrices of Common Core State Standards
Grade Strand Standard Standard
Sept
embe
r ndash
Oct
ober
Nov
embe
r ndash
Dec
embe
r
Janu
ary
ndash Fe
brua
ry
Mar
ch ndash
Apr
il
May
- Ju
ne
1 OA 1
CC1OA1 Represent and solve problems involving addition and subtraction Use addition and subtraction within 20 to solve word problems involving situations of adding to taking from putting together taking apart and comparing with unknowns in all positions eg by using objects drawings and equations with a symbol for the unknown number to represent the problem
1 OA 2
CC1OA2 Represent and solve problems involving addition and subtraction Solve word problems that call for addition of three whole numbers whose sum is less than or equal to 20 eg by using objects drawings and equations with a symbol for the unknown number to represent the problem
1 OA 3
CC1OA3 Understand and apply properties of operations and the relationship between addition and subtraction Apply properties of operations as strategies to add and subtract Examples If 8 + 3 = 11 is known then 3 + 8 = 11 is also known (Commutative property of addition) To add 2 + 6 + 4 the second two numbers can be added to make a ten so 2 + 6 + 4 = 2 + 10 = 12 (Associative property of addition) (Students need not use formal terms for these properties)
1 OA 4
CC1OA4 Understand and apply properties of operations and the relationship between addition and subtraction Understand subtraction as an unknown-addend problem For example subtract 10 ndash 8 by finding the number that makes 10 when added to 8
1 OA 5 CC1OA5 Add and subtract within 20 Relate counting to addition and subtraction (eg by counting on 2 to add 2)
1 OA 6 CC1OA6 Add and subtract within 20 Add and subtract within 20 demonstrating fluency for addition and subtraction within 10 Use strategies such as counting on making ten (eg 8 + 6 = 8 + 2 + 4 = 10 + 4 = 14) decomposing a number leading to a ten (eg 13 ndash 4 = 13 ndash 3 ndash 1 = 10 ndash 1 = 9) using the relationship between addition and subtraction (eg knowing that 8 + 4
47
Keansburg School DistrictCurriculum System
Mathematics= 12 one knows 12 ndash 8 = 4) and creating equivalent but easier or known sums (eg adding 6 + 7 by creating the known equivalent 6 + 6 + 1 = 12 + 1 = 13)
1 OA 7
CC1OA7 Work with addition and subtraction equations Understand the meaning of the equal sign and determine if equations involving addition and subtraction are true or false For example which of the following equations are true and which are false 6 = 6 7 = 8 ndash 1 5 + 2 = 2 + 5 4 + 1 = 5 + 2
1 OA 8
CC1OA8 Work with addition and subtraction equations Determine the unknown whole number in an addition or subtraction equation relating three whole numbers For example determine the unknown number that makes the equation true in each of the equations 8 + = 11 5 = _ ndash 3 6 + 6 = _
1 NBT 1
CC1NBT1 Extend the counting sequence Count to 120 starting at any number less than 120 In this range read and write numerals and represent a number of objects with a written numeral
1 NBT 2
CC1NBT2 Understand place value Understand that the two digits of a two-digit number represent amounts of tens and ones Understand the following as special cases -- a 10 can be thought of as a bundle of ten ones mdash called a ldquotenrdquo -- b The numbers from 11 to 19 are composed of a ten and one two three four five six seven eight or nine ones -- c The numbers 10 20 30 40 50 60 70 80 90 refer to one two three four five six seven eight or nine tens (and 0 ones)
1 NBT 3
CC1NBT3 Understand place value Compare two two-digit numbers based on meanings of the tens and ones digits recording the results of comparisons with the symbols gt = and lt
1 NBT 4
CC1NBT4 Use place value understanding and properties of operations to add and subtract Add within 100 including adding a two-digit number and a one-digit number and adding a two-digit number and a multiple of 10 using concrete models or drawings and strategies based on place value properties of operations andor the relationship between addition and subtraction relate the strategy to a written method and explain the reasoning used Understand that in adding two-digit numbers one adds tens and tens ones and ones and sometimes it is necessary to compose a ten
1 NBT 5
CC1NBT5 Use place value understanding and properties of operations to add and subtract Given a two-digit number mentally find 10 more or 10 less than the number without having to count explain the reasoning used
1 NBT 6 CC1NBT6 Use place value understanding and properties of operations to add and subtract Subtract multiples of 10 in the range 10-90 from multiples of 10 in the range 10-90 (positive or zero differences) using concrete models or drawings and strategies based on place value properties of operations andor
48
Keansburg School DistrictCurriculum System
Mathematicsthe relationship between addition and subtraction relate the strategy to a written method and explain the reasoning used
1 MD 1
CC1MD1 Measure lengths indirectly and by iterating length units Order three objects by length compare the lengths of two objects indirectly by using a third object
1 MD 2
CC1MD2 Measure lengths indirectly and by iterating length units Express the length of an object as a whole number of length units by laying multiple copies of a shorter object (the length unit) end to end understand that the length measurement of an object is the number of same-size length units that span it with no gaps or overlaps Limit to contexts where the object being measured is spanned by a whole number of length units with no gaps or overlaps
1 MD 3CC1MD3 Tell and write time Tell and write time in hours and half-hours using analog and digital clocks
1 MD 4
CC1MD4 Represent and interpret data Organize represent and interpret data with up to three categories ask and answer questions about the total number of data points how many in each category and how many more or less are in one category than in another
1 G 1
CC1G1 Reason with shapes and their attributes Distinguish between defining attributes (eg triangles are closed and three-sided) versus non-defining attributes (eg color orientation overall size) for a wide variety of shapes build and draw shapes to possess defining attributes
1 G 2
CC1G2 Reason with shapes and their attributes Compose two-dimensional shapes (rectangles squares trapezoids triangles half-circles and quarter-circles) or three-dimensional shapes (cubes right rectangular prisms right circular cones and right circular cylinders) to create a composite shape and compose new shapes from the composite shape (Students do not need to learn formal names such as ldquoright rectangular prismrdquo)
1 G 3
CC1G3 Reason with shapes and their attributes Partition circles and rectangles into two and four equal shares describe the shares using the words halves fourths and quarters and use the phrases half of fourth of and quarter of Describe the whole as two of or four of the shares Understand for these examples that decomposing into more equal shares creates smaller shares
49
Keansburg School DistrictCurriculum System
Mathematics
Common Core State Standards Vocabulary
Addition and subtraction within 5 10 20 100 or 1000 Addition or subtraction of two whole numbers with whole number answers and with sum or minuend in the range 0-5 0-10 0-20 or 0-100 respectively Example 8 + 2 = 10 is an addition within 10 14 ndash 5 = 9 is a subtraction within 20 and 55 ndash 18 = 37 is a subtraction within 100
Additive inverses Two numbers whose sum is 0 are additive inverses of one another Example 34 and ndash 34 are additive inverses of one another because 34 + (ndash 34) = (ndash 34) + 34 = 0
Associative property of addition See Table 3 in this Glossary
Associative property of multiplication See Table 3 in this Glossary
Bivariate data Pairs of linked numerical observations Example a list of heights and weights for each player on a football team
Box plot A method of visually displaying a distribution of data values by using the median quartiles and extremes of the data set A box shows the middle 50 of the data1
Commutative property See Table 3 in this Glossary
Complex fraction A fraction AB where A andor B are fractions (B nonzero)
Computation algorithm A set of predefined steps applicable to a class of problems that gives the correct result in every case when the steps are carried out correctly See also computation strategy
Computation strategy Purposeful manipulations that may be chosen for specific problems may not have a fixed order and may be aimed at converting one problem into another See also computation algorithm
Congruent Two plane or solid figures are congruent if one can be obtained from the other by rigid motion (a sequence of rotations reflections and translations)
Counting on A strategy for finding the number of objects in a group without having to count every member of the group For example if a stack of books is known to have 8 books and 3 more books are added to the top it is not necessary to count the stack
50
Keansburg School DistrictCurriculum System
Mathematicsall over again One can find the total by counting onmdashpointing to the top book and saying ldquoeightrdquo following this with ldquonine ten eleven There are eleven books nowrdquo
Dot plot See line plot
Dilation A transformation that moves each point along the ray through the point emanating from a fixed center and multiplies distances from the center by a common scale factor
Expanded form A multi-digit number is expressed in expanded form when it is written as a sum of single-digit multiples of powers of ten For example 643 = 600 + 40 + 3
Expected value For a random variable the weighted average of its possible values with weights given by their respective probabilities
First quartile For a data set with median M the first quartile is the median of the data values less than M Example For the data set 1 3 6 7 10 12 14 15 22 120 the first quartile is 62 See also median third quartile interquartile range
Fraction A number expressible in the form ab where a is a whole number and b is a positive whole number (The word fraction in these standards always refers to a non-negative number) See also rational number
Identity property of 0 See Table 3 in this Glossary
Independently combined probability models Two probability models are said to be combined independently if the probability of each ordered pair in the combined model equals the product of the original probabilities of the two individual outcomes in the ordered pair
Integer A number expressible in the form a or ndasha for some whole number a
Interquartile Range A measure of variation in a set of numerical data the interquartile range is the distance between the first and third quartiles of the data set Example For the data set 1 3 6 7 10 12 14 15 22 120 the interquartile range is 15 ndash 6 = 9 See also first quartile third quartile
Line plot A method of visually displaying a distribution of data values where each data value is shown as a dot or mark above a number line Also known as a dot plot3
51
Keansburg School DistrictCurriculum System
MathematicsMean A measure of center in a set of numerical data computed by adding the values in a list and then dividing by the number of values in the list4 Example For the data set 1 3 6 7 10 12 14 15 22 120 the mean is 21
Mean absolute deviation A measure of variation in a set of numerical data computed by adding the distances between each data value and the mean then dividing by the number of data values Example For the data set 2 3 6 7 10 12 14 15 22 120 the mean absolute deviation is 20
Median A measure of center in a set of numerical data The median of a list of values is the value appearing at the center of a sorted version of the listmdashor the mean of the two central values if the list contains an even number of values Example For the data set 2 3 6 7 10 12 14 15 22 90 the median is 11
Midline In the graph of a trigonometric function the horizontal line halfway between its maximum and minimum values
Multiplication and division within 100 Multiplication or division of two whole numbers with whole number answers and with product or dividend in the range 0-100 Example 72 divide 8 = 9
Multiplicative inverses Two numbers whose product is 1 are multiplicative inverses of one another Example 34 and 43 are multiplicative inverses of one another because 34 times 43 = 43 times 34 = 1
Number line diagram A diagram of the number line used to represent numbers and support reasoning about them In a number line diagram for measurement quantities the interval from 0 to 1 on the diagram represents the unit of measure for the quantity
Percent rate of change A rate of change expressed as a percent Example if a population grows from 50 to 55 in a year it grows by 550 = 10 per year
Probability distribution The set of possible values of a random variable with a probability assigned to each
Properties of operations See Table 3 in this Glossary
Properties of equality See Table 4 in this Glossary
Properties of inequality See Table 5 in this Glossary
Properties of operations See Table 3 in this Glossary
52
Keansburg School DistrictCurriculum System
MathematicsProbability A number between 0 and 1 used to quantify likelihood for processes that have uncertain outcomes (such as tossing a coin selecting a person at random from a group of people tossing a ball at a target or testing for a medical condition)
Probability model A probability model is used to assign probabilities to outcomes of a chance process by examining the nature of the process The set of all outcomes is called the sample space and their probabilities sum to 1 See also uniform probability model
Random variable An assignment of a numerical value to each outcome in a sample space
Rational expression A quotient of two polynomials with a non-zero denominator
Rational number A number expressible in the form ab or ndash ab for some fraction ab The rational numbers include the integers
Rectilinear figure A polygon all angles of which are right angles
Rigid motion A transformation of points in space consisting of a sequence of one or more translations reflections andor rotations Rigid motions are here assumed to preserve distances and angle measures
Repeating decimal The decimal form of a rational number See also terminating decimal
Sample space In a probability model for a random process a list of the individual outcomes that are to be considered
Scatter plot A graph in the coordinate plane representing a set of bivariate data For example the heights and weights of a group of people could be displayed on a scatter plot5
Similarity transformation A rigid motion followed by a dilation
Tape diagram A drawing that looks like a segment of tape used to illustrate number relationships Also known as a strip diagram bar model fraction strip or length model
Terminating decimal A decimal is called terminating if its repeating digit is 0
Third quartile For a data set with median M the third quartile is the median of the data values greater than M Example For the data set 2 3 6 7 10 12 14 15 22 120 the third quartile is 15 See also median first quartile interquartile range
Transitivity principle for indirect measurement If the length of object A is greater than the length of object B and the length of object B is greater than the length of object C then the length of object A is greater than the length of object C This principle applies
53
Keansburg School DistrictCurriculum System
Mathematicsto measurement of other quantities as well
Uniform probability model A probability model which assigns equal probability to all outcomes See also probability model
Vector A quantity with magnitude and direction in the plane or in space defined by an ordered pair or triple of real numbers
Visual fraction model A tape diagram number line diagram or area model
Whole numbers The numbers 0 1 2 3 hellip5
54
- MissionVision Statement
- Beliefs
- Measurement amp Data
- Measure lengths and by iterating length units
- Tell and write time
- Represent and interpret data
- Geometry
- Reason with shapes and their attributes
- Number and Base Ten
- Extend the counting sequence
- Understand place value
-
- Measurement amp Data (II)
-
- Measure lengths and by iterating length units
- Tell and write time
-
- Represent and interpret data
- Geometry (II)
- Reason with shapes their attributes
-
- Number and Base Ten
- Use place value understanding and properties of operations to add and subtract
- Teacher will cover up specific numbers on an enlarged number grid using cover up tape to have students identify numbers before and after Students will come up and write the missing numbers
- Students will play ldquoI have__ Who has __ Teacher will create cards using index cards and numbers in which students need further practice with Students will read their cards aloud Variations of game can include identifying specific numbers identifying numbers more or less etc)
- Students will use base ten blocks to represent numbers including three digit numbers Students will identify representation of numbers through these manipulatives They may match the representation to the written number
- Students will write the number they created using the base ten blocks using their white boards and markers
- Students will arrange given digits to create the greatest and lowest possible numbers They can show each number they create using base ten blocks
- Students will use the Base Ten Exchange Game to show an understanding of exchanging ones for tens and tens for hundreds Students can use place value mats base ten blocks (cubes tens and flats) Students can take number of cubes displayed with roll of single die Students will determine when exchanging can be made when reaching ten units
- Base ten concentration wwwk-5mathteachingresourcescom
- Ten frame compare wwwk-5mathteachingresourcescom
-
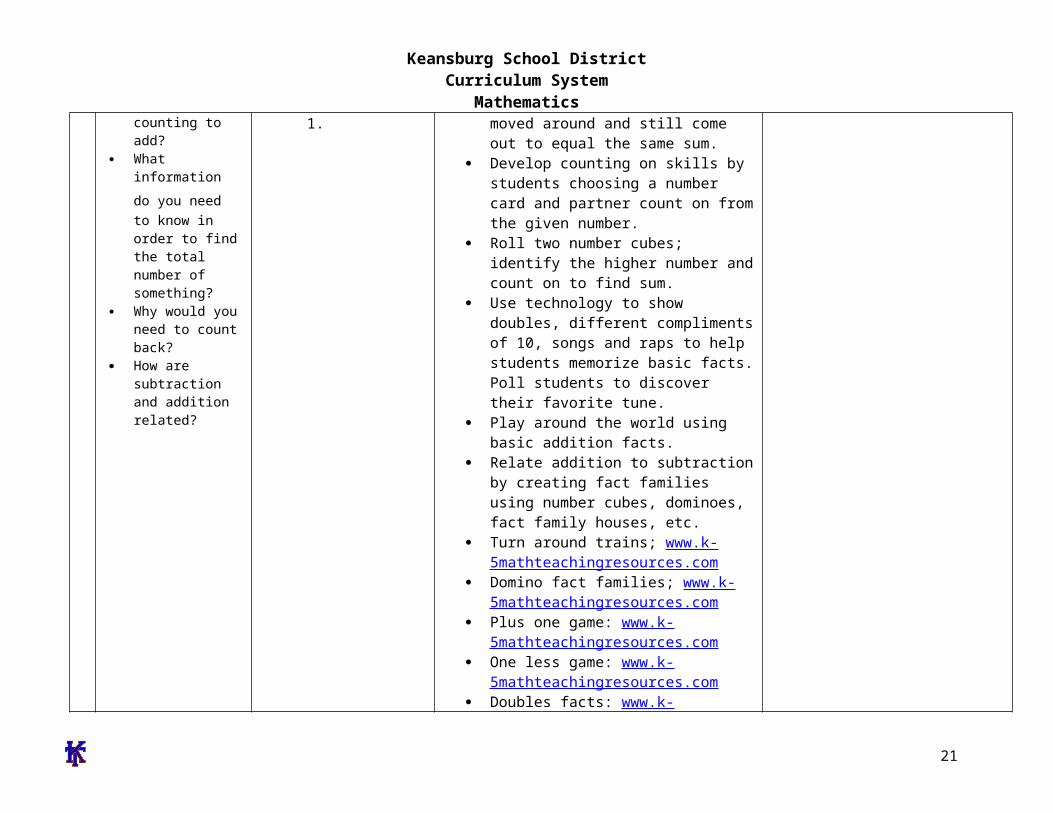
Keansburg School DistrictCurriculum System
MathematicsKeansburg School DistrictCurriculum Management System
SubjectGradeLevelMathematicsGrade 1
Timeline December-Quarter 2
Topic(s) Geometry
Significance of Learning Goal(s) To identify shapes and their attribures
Sugg
este
d D
ays
of
Inst
ruct
ion Content
Standards CPI Essential
Questions
Specific Learning Objective(s)
The Students Will Be Able To
Suggested Activities
Instructional Tools Materials
Technology Resources
Assessments and Assessment Models
CPI1G1 1G2
EQ Where do
you see shapes in our classroom
Are there different shapes outside
How are geometric figures alike
How can we sort
Concept(s) Identify shapes and their attributes
SWBAT Distinguish
between two and three-dimensional shapes by classifying their attributes For example color shape and size
Compare and contrast shapes based on their attributes
Construct and create shapes
Meets Standard Sorting shapes based on their attributes For example
number of sideso Materials attribute blocks shape card sheet sorting
mat Introduce vocabulary cylinder cube sphere rectangular
prism triangular prism pyramid Classroom shape hunt students go around the room finding shapes within the classroom For example trash can tissue box clock
o Materials shape sheet classroom objects httpilluminationsnctmorgLessonDetailaspxid=L237
Create 3-dimenstion shapes (rectangular prism pyramid cube)
o Straws twist ties shape cards Create 2-dimensional shapes (trapezoid triangle circle
rectangle rhombus)o Pattern block templates attribute blocks pattern
block template stencil geo-boards rubber bands httpilluminationsnctmorgLessonDetailaspx
Attribute blocks Shape card
sheet Sorting mat Twist ties Straws Shape cards Pattern block
templates Attribute blocks Pattern block
template stencil Geo-boards Rubber bands
22
Keansburg School DistrictCurriculum System
Mathematicsobjects of different shapes
How can shapes and solids be described compared and used to make other shapes What are equal parts
What foods do you divide into equal parts
What other items might be divided
How do you know if you have an equal share
possessing certain attributes
Identify and construct two-dimensional shapes
Identify and construct three-dimensional figures
id=L168 Create a drawing using shapes students will create a
picture using the pattern block template stencil (house sun flowers etc)
o Paper pattern block stencil template crayons
Apply understanding of attributes by playing Shape Detective and Attribute Train Game
Demonstrate understanding of 3 Dimensional shapes by playing Whatrsquos My Shape
Exceeds Standard
Introducing and exposing higher vocabulary polyhedronpolyhedra (many faces of a shape) Placing the word onto the word wall
Students read the poem Shapes by Shel Silverstein and create their own illustration of the poem to explore geometric figures and positional words
Materials httpilluminationsnctmorgLessonDetailaspxID=L202
Shapes by Shel Silverstein paper crayons pencils examples of rectangles triangles circles
Compose clues using inferencing to play Guess What Display variety of 3 dimensional shapes Silently choose
an object and give clues about it For example I amsmall I have 2 flat faces and if you trace my faces youwill get circles What am I (tomato can)
Students work together to use pattern blocks to coverother pattern blocks For example how many triangleblocks are needed to cover a hexagon block
Student rotate in groups to visit each geometric solidwhile completing a chart which shows faces sides and
Typical Assessment Question(s) or Task(s)
Ask students how many sides each shape has
Have students classify shapes based on number of sides
Have students identify shapes in the classroom
Have students create 2 and 3 dimensional shapes
Have students design pictures using pattern blockspattern block template
Have students identify and describe assigned shapersquos attributes
Ask students to name 3 dimensional shapes hidden i bag (Whatrsquos my Shape Game)
23
Keansburg School DistrictCurriculum System
Mathematics corners Students compose a shape town by using their pattern
block templates Then students will calculate the totalnumber of each pattern block used
Students will invent new shapes by using three-dimensional shapes
Students will create patterns using three dimensionalshapes
24
Keansburg School DistrictCurriculum System
MathematicsKeansburg School DistrictCurriculum Management System
SubjectGradeLevelMathematicsGrade 1
Timeline January-Quarter 2
Topic(s) Number and Operations in Base Ten
Significance of Learning Goal(s) To recognize compare and understand numbers to 120
Sugg
este
d D
ays
of
Inst
ruct
ion Content
Standards CPI Essential
Questions
Specific Learning Objective(s)
The Students Will Be Able To
Suggested ActivitiesInstructional Tools Materials
Technology Resources Assessments and Assessment
Models
25
Keansburg School DistrictCurriculum System
MathematicsCPI 1NBT1 1NBT2A 1NBT2B 1NBT2C 1NBT3
EQ How do
numbers help us
How can sets of numbers be counted compared and ordered
How can I use numbers to solve problems
How would putting numbers on a chart make it easier to understand information
How can I make it easier to understand numbers when I sort them
What is place value
Concept(s) Recognize compare and understand numbers up to 120
SWBAT Recognize read write
and count 0-120 Understand that a two-
digit number represents amounts of tens and ones
Relate groups of ten to skip counting
Compare two two-digit numbers based on meanings of tens and ones digits using symbols ltgt and =
Meets Standard Teacher will cover up specific numbers
on an enlarged number grid using cover up tape to have students identify numbers before and after Students will come up and write the missing numbers
Students will play ldquoI have__ Who has __ Teacher will create cards using index cards and numbers in which students need further practice with Students will read their cards aloud Variations of game can include identifying specific numbers identifying numbers more or less etc)
Students will use base ten blocks to represent numbers including three digit numbers Students will identify representation of numbers through these manipulatives They may match the representation to the written number
Students will write the number they created using the base ten blocks using their white boards and markers
Students will arrange given digits to create the greatest and lowest possible numbers They can show each number they create using base ten blocks
Students will use the Base Ten Exchange Game to show an
Number grids ldquoI have Who hasrdquo index
cards base ten blocks white boards markers number cards dice ten frame base ten concentration
boards (k-5 math teaching resources)
double ten frame boards (k-5 math teaching resources)
Typical Assessment Question(s) or Task(s)
Recognize numbers 1-120 using flashcards
Write numbers 1-20 using block or graph paper
Build two-digit numbers using tens and ones blocks
Listen and note students skip counting orally by tens to 120
Students compare and label two numbers using relation symbols
26
Keansburg School DistrictCurriculum System
Mathematics Why is place
value important
How can I use place value to compare and order numbers
How can I use the number grid to help me with counting numbers
How many times do you think you can hop in one minute
What does number relationships mean
Why do we need to know how to add
Why do we need to know how to subtract
How are addition and subtraction related
What are doubles
How can
understanding of exchanging ones for tens and tens for hundreds Students can use place value mats base ten blocks (cubes tens and flats) Students can take number of cubes displayed with roll of single die Students will determine when exchanging can be made when reaching ten units
Teens on the ten frame wwwk-5mathteachingresourcescom
Base ten concentration wwwk-5mathteachingresourcescom
Ten frame compare wwwk-5mathteachingresourcescom
Exceeds Standard
Students will create riddles Irsquom thinking of a number that has 4 tens and 13 ones Have students solve the riddle by regrouping the ones to find the answer
-Students use hundreds chart to jump up and down from a number to show 10 more or 10 less
-Students will play Whatrsquos my Number by giving clues based on place value odd or even and number sense For example Irsquom a two digit number The digit in my tens place is 2 more than 4
27
Keansburg School DistrictCurriculum System
Mathematicsdouble facts help us to add and subtract
Does it matter what order you use to add three numbers Why or why not
The digit in my ones place is 3 less than 8 Whatrsquos my number
My double ten frame riddle wwwk-5mathteachingresourcescom
28
Keansburg School DistrictCurriculum System
MathematicsKeansburg School DistrictCurriculum Management System
SubjectGradeLevelMathematicsGrade 1
Timeline February-Quarter 3
Topic(s) Operations amp Algebraic Expressions
Significance of Learning Goal(s) To solve addition and subtraction problems
Sugg
este
d D
ays
of
Inst
ruct
ion Content
Standards CPI
Essential Questions
Specific Learning Objective(s)
The Students Will Be Able To
Suggested ActivitiesInstructional Tools Materials
Technology Resources Assessments and Assessment
Models
CPI1OA31OA4 1OA5 1OA6 1OA7 1OA81OA2
EQ What
questions can be answered using addition
What strategies can be used to solve problems
How can we
Concept(s) Solve addition with and subtraction problems
SWBAT Solve addition problems
with sums up to 20 Use addition within 20 to
solve word problems involving real life situations
Solve word problems that call for addition of three whole numbers up to 20
Solve subtraction problems with difference up to 20
Use subtraction within 20 to solve word problems involving real
Meets Standard Model and have students create their
own individual number sentence using manipulatives and label operation symbols
Students will choose a strategy to solve number stories such as objects fingers and pictures count onback number line or number grid
Create real life situations in which students will use a strategy to solve a number story and create a number model
Review addition and subtraction number stories posters stating each key word for addition and subtraction operations
Combine and mix two sets of 0-20 number cards One partner draws two number cards from the top of the deck students will design and generate a number story using the two numbers
Materials Manipulatives (examples
counting bears connecting cubes pennies counters etc)
Slates dry erase markers erasers
Clear Sheet Protectors Sets of 0-20 number cards Number cards Cardstock Scrabble tiles letter cards
Typical Assessment Question(s) or Task(s)
Students will solve real life
29
Keansburg School DistrictCurriculum System
Mathematicstell how many
How does knowing math facts make math easier
How can numbers be helpful
Why do I need to subtract
How do we use addition and subtraction in our everyday life
Why are fact families important
What strategies can be used to solve problems How is counting on different from just counting to add
What information do you need to know in order to find
life situations Understand subtraction
as an unknown addend problem example subtract 9-5 by finding the number that makes 9 when added to 5
Both partners solve the problem in the number story and write the answer on their slate
Find three cards that have a sum of 12 how many different ways can the student make the sum of 12 using three cards students record work
-Teacher creates real life word problemsinvolving three addends up to 20
Ten frames subtraction wwwk-5mathteachingresourcescom
I have who has wwwk-5mathteachingresourcescom
True or false wwwk-5mathteachingresourcescom
Count to 20 wwwk-5mathteachingresourcescom
Exceeds Standard
Teacher creates multi step word problems for students to solve
Students work with partners or small groups to create real life word problems Compose class book of problems
Three letter addends use scrabble tiles or letter cards with corresponding numbers to make three letter words find
word problems Students will create their
own number sentences own number storiesword problems
Students will create and solve number stories in cooperative learning groups
Students will generate word problems using assigned numbers
30
Keansburg School DistrictCurriculum System
Mathematicsthe total number of something
Why would you need to count back
How are subtraction and addition related
the sum of each word by adding the numbers on the tiles Students will find which words have the greatest or smallest sum
31
Keansburg School DistrictCurriculum System
MathematicsKeansburg School DistrictCurriculum Management System
SubjectGradeLevelMathematicsGrade 1
Timeline March-Quarter 3
Topic(s) Measurement amp Data
Significance of Learning Goal(s) To tell time and compare measurements
Sugg
este
d D
ays
of
Inst
ruct
ion Content
Standards CPI
Essential Questions
Specific Learning Objective(s)
The Students Will Be Able ToSuggested Activities
Instructional Tools Materials Technology Resources
Assessments and Assessment Models
How would I know if a bar graph correctly shows what is on a tally chart
How could a bar graph answer a question
Do bar graphs make it easier to understand and compare facts Why
What kind
Concept(s) Telling time comparing measurements
SWBAT Identify and write time to
the hour and half hour on both a digital and analog clock
Write time to the hour and half-hour on both digital and analog clocks
Draw the hands on the analog clock for a given time to the hour or half-hour
Relate times to the half hour as ldquohalf-pastrdquo the hour
Compare and contrast
Meets Standard Students will have their own
demonstration clocks students will identify and find the hour and minute hands
Students create their own clocks using paper plates students will manipulate hands to identify varying times
Students will listen to Jack Hartman ldquoTick Tockrdquo song
Teachers and students will view clock on videos on brainpopjrcom students and teachers can complete quizzes available on website
Teachers will present time on an analog clock students will write the digital time on a white board
Students will play clock concentration Teacher will introduce measurement by
holding up objects and the students will examine the objects and explain the size
Large Judy Clock Individual student Judy
clocks Wipe off analogdigital clocks Clock stampers Timers Rulers Yardsticks Measuring tapes Sheet protectors Cardstock Paper plates Fasteners Index cards
Typical Assessment Question(s) or Task(s)
Students will be asked to identify and write time to the hour and half hour on both
32
Keansburg School DistrictCurriculum System
Mathematicsof graph should I use to answer questions
Why do I need to tell time
How many hands does a clock have
Are the hands on the clock the same size
How long is a minute
Why do I need to use a calendar
How do we use the clock and the calendar to determine what we will do in school
Why do we need to measure something
What can
objects by length Construct objects at
contrasting lengths
ordero Students will break into groups
and compare objects further and classify them depending on their size
Teacher will introduce the ruler Explain to students that the ruler is used to measure objects The students will then explore the classroom and select objects around the room that are smaller and larger than the ruler
Teacher will select specific body parts that the students will use as a personal unit of measurement The students will work in pairs to demonstrate how to measure objects around the room using their personal unit of measurement
The teacher will select a classroom object and the students will be asked to illustrate objects in the room that are bigger and smaller in size
The students will be able to organize represent and interpret data up to three categories through the use of a bar graph
The teacher will then divide students into heterogeneous groups and encourage the students to explain what they can learn from the graph The students will present findings following activity
Students will choose an object within classroom then find additional objects one being larger the other being shorter using a two-column chart Draw or write the objects in the chart
digital and analog clocks Students will be asked to
identify the parts of a clock students will be asked to draw the hands on an analog clock for a given time to the hour or half-hour
Students will be given various objects and will further be asked to compare and contrast the lengths of these objects
Students will be asked to provide or create objects contrasting lengths to demonstrate understanding of differences in length
33
Keansburg School DistrictCurriculum System
Mathematicswe use to draw and measure things
What do you think is about 1 inch long
How many steps long do you think it is from the front of the classroom to the back
If we measure in footsteps why are some of the measurements different
How is longer and shorter similar to greater and lesser
Exceeds Standard
The students will work in pairs to locate objects around the room and compare the lengths against each other The pairs will then work with another pair of students and compare the lengths of their objects with the objects the other pair located
Teacher will introduce the ruler in comparison to the yardstick The students will be encouraged to find objects that in the room that are larger than a ruler and measure using the yardstick
After the teacher introduces units of personal measurement the students will be encouraged to measure object in the room using their own unit of personal measurement and convert it into a standard measurement using a ruler or a yardstick
The teacher will select a classroom object and the students will be asked to illustrate objects in the room that are bigger and smaller by a specific size
The students will be able to organize represent and interpret data up to four or more categories through the use of a bar graph
The teacher will then divide students into heterogeneous groups and encourage the students to explain what they can learn from the graph and create a tally chart utilizing the data
Students will create clock flash cards by
34
Keansburg School DistrictCurriculum System
Mathematicsdrawing an analog clock on one side and writing the digital clock time on the other Students will include time in five minute intervals
Pose word problems where students have to find elapse time to the hour and half hour
Introduce second hand and conduct activities that are timed in seconds (Examples hopping on 1 foot blinking eyes counting to the highest number)
35
Keansburg School DistrictCurriculum System
MathematicsKeansburg School DistrictCurriculum Management System
SubjectGradeLevelMathematicsGrade 1
Timeline April-Quarter 4
Topic(s) Geometry
Significance of Learning Goal(s) To identify two and three dimensional shapes to understand fractional parts and create equal shares
Sugg
este
d D
ays
of
Inst
ruct
ion Content
Standards CPI Essential
Questions
Specific Learning Objective(s)
The Students Will Be Able To
Suggested ActivitiesInstructional Tools Materials
Technology Resources Assessments and Assessment
Models
Are there different shapes outside
How are geometric figures alike
How can we sort objects of different shapes
How can shapes and solids be described compared and used to make other shapes
Concept(s) Two and three dimensional shapes fractional parts equal shares
SWBAT
Combine two-dimensional or three-dimensional shapes or figures to create a new composite shape and identify the shapes within
Identify fractional parts of circles and rectangles into equal shares while developing vocabulary for halves fourths and quarters
Describe the whole as
Meets Standard
Determine which shape by touch without using their sight
o Materials attribute blocks shape sheet feely box wwwilluminationsnctmorglessondetail
Sorting 3-dimensional objects students will be given cards with 3-dimensional objects (trash can soup can globe ball tissue box box dice) they will sort them based on the 3-dimensional shape they represent
o 3-dimensional object cards sorting mats
Pizza and Cake Fractions students will utilize a pizza and a cake to work on the concept of fractions while developing the vocabulary halves quarters and fourths
o Materials teacher created pizza
Attribute blocks Geometric shapes 3-dimensional object
cards Sorting maps 3-dimensional shapes Solid and lane figures Geo-boards and rubber
bands Fraction circles Sheet protectors 2-dimensional shapes
Typical Assessment Question(s) or Task(s)
Students will be asked to describe and identify
36
Keansburg School DistrictCurriculum System
MathematicsWhat are equal parts
What foods do you divide into equal parts
What other items might be divided
How do you know if you have an equal share
two of or four of the shares Understand for these examples that decomposing into more equal shares creates smaller shares
and cake that are cut into fractions (construction paper)
Students will illustrate a picture of a boat using at least one three dimensional shape in their drawings Shapes include cubes cylinders spheres cones and rectangular prisms
Solid and Plane Figures Name the Face activity Provide three-dimensional objects Have students draw the face for each object as well as name the shape Examples ABC block juice can book party hat
Introduce fractions by having students identify shapes that show equal parts Display cut out shapes using document camera Include some shapes that are divided equally and some that are not divided equally As a whole group sort shapes into two categories Then have students go back to their desks and work with a partner to classify additional shapes
Provide students with shapes that are divided into four parts Include shapes that are divided into four equal parts and others that are unequal Students identify the shapes that are divided into four equal parts and explain their reasoning
Shape Town activity Students will design a shape town using the following shapes
shapes within combined two and three-dimensional shapes
Students will be given circles and rectangles students will be asked to divide these shapes into halves fourths and quarters
Students will be asked to sort shapes that are divided equally and not divided equally
37
Keansburg School DistrictCurriculum System
Mathematicstrapezoid hexagon square triangle and circle Afterwards students will calculate the total number of each shape they included After completing the activity students will present their final product to the class and explain how they decided which shapes to use
Given an array of dots students will draw shapes with specific number of sides and corners and connect the dots to create the shapes Example Draw a shape with 5 sides Draw a shape with 6 corners
Students will create two-dimensional shapes on geoboards Then using different colored rubber bands students will divide the shapes into equal parts Students will transfer their equally divided shapes onto geoboard paper by drawing lines to show their equal parts
Play the Fraction Path Game Materials Fraction circles a circle with frac12 shaded a circle with 13 shaded and a circle with frac14 shaded Gameboard Path consisting of assorted shapes divided into halves thirds and fourths Players Needed 3 Directions Place the fraction circles facedown Players close their eyes and pick one fraction circle Each player follows the path from start to finish Each player looks at each shape on the path and records how many shapes show their fractions Players record
38
Keansburg School DistrictCurriculum System
Mathematicstheir results on paper using tally marks At end of game students compare total number of shapes that show their fraction
Exceeds Standard
39
Keansburg School DistrictCurriculum System
MathematicsKeansburg School DistrictCurriculum Management System
SubjectGradeLevelMathematicsGrade 1
Timeline May-Quarter 4
Topic(s) Number and Operations in Base Ten
Significance of Learning Goal(s) To use place value to add and subtract
Sugg
este
d D
ays
of
Inst
ruct
ion Content
Standards CPI Essential
Questions
Specific Learning Objective(s)
The Students Will Be Able ToSuggested Activities
Instructional Tools Materials Technology Resources
Assessments and Assessment Models
40
Keansburg School DistrictCurriculum System
MathematicsCPI 1NBT4 1NBT5 1NBT6
EQ How do
numbers help us
How can sets of numbers be counted compared and ordered
How can I use numbers to solve problems
How would putting numbers on a chart make it easier to understand information
How can I make it easier to understand numbers when I sort them
What is place value
Why is place value important
How can I
Concept(s) Use place value and properties of operations to add and subtract
SWBAT Use mental math to find
10 more or ten less than a given two-digit number and explain reasoning used within any number to 120
Use place value to add within 100 add a two-digit number to a one-digit number and add a two-digit number to a multiple of ten
Understand when adding two-digit numbers that ones add to the ones and tens add to the tens and sometimes it is necessary to compose a ten by regrouping
For all above objects students will use concrete models and strategies based on place value and relate the strategy to a written method and explain the reasoning used
Subtract multiples of 10 in the range 10-90 from multiples of 10 in the range 10-90 using
Meets Standard
Comparing two digit numbers wwwk-5mathteachingresourcescom
Subtraction split wwwk-5mathteachingresourcescom
Ten more wwwk-5mathteachingresourcescom
Addition split wwwk-5mathteachingresourcescom
Exceeds Standard
Comparing 3-Digit numbers wwwk-5mathteachingresourcescom
What number is wwwk-5mathteachingresourcescom
Students develop addition and subtraction number stories and have partners solve
Create pictures using basendash10 blocks Students trace picture onto paper label the base ten blocks with their value and add total
Solve number grid puzzles by adding and subtraction 10 on the number grid
Number cards Base 10 blocks Counters Number grid puzzles Sleeve protectors wwwk-
5mathteachingresourcescom
Dice
Typical Assessment Question(s) or Task(s)
Recognize numbers 1-120 using flashcards
Write numbers 1-20 using block or graph paper
Build two-digit numbers using tens and ones blocks
Listen and note students skip counting orally by tens to 120
Students compare and label two numbers using relation symbols
41
Keansburg School DistrictCurriculum System
Mathematics
42
Keansburg School DistrictCurriculum System
MathematicsKeansburg School DistrictCurriculum Management System
SubjectGradeLevelMathematicsGrade 1
Timeline June-Quarter 4
Topic(s) Readiness skills for September of Grade 2
Significance of Learning Goal(s) To compare larger numbers add fluently and apply measurement skills
Sugg
este
d D
ays
of
Inst
ruct
ion Content
Standards CPI Essential Questions
Specific Learning Objective(s)
The Students Will Be Able ToSuggested Activities
Instructional Tools Materials Technology Resources
Assessments and Assessment Models
CPI
EQ How can I use
place value to compare and
order numbers in the 100s
How can mastering basic addition and subtraction facts help me compute larger numbers
How can I tie in
Concept(s)Use place value to compare larger numbers fluently add up to 20 apply measurement skills
SWBAT Extend place value into
the hundreds place and re-write and construct models beyond the hundreds
Fluently add and subtract within 20 using mental strategies
Apply measurement skills
Meets Standard Place Value barrier game httpwwwk-
5mathteachingresourcescommath-gameshtml (place value only)
High card
httpwwwlearningboxcomBase10 BaseTenhtml
Time barrier game httpwwwk-5mathteachingresourcescomsupport-filestimebarriergamepdf httpwwwk-5mathteachingresourcescomsupport-filestimebarriergamegridpdf
My favorite time of day writing activity
number cards base ten blocks rulers tape measurer string number relationship mat paper plates cotton balls judy clock digital clock
Typical Assessment Question(s) or Task(s)
Students will solve addition and subtraction problems within 20 in a given time
43
Keansburg School DistrictCurriculum System
Mathematicsmeasurement skills with real life experiences
httpwwwk-5mathteachingresourcescomsupport-filesmy-favorite-time-of-daypdf
Estimating length httpwwwk-5mathteachingresourcescomsupport-filesestimatinglengthpdf
Olympic golf plastic golf clubs cotton balls and tape measurer
Olympic smiles measuring smiles with string and rulers
Olympic Frisbee using paper plates and tape measurer
Olympic airplane students will make paper airplanes measure the distance that they can throw their airplane
Doubles plus 1 game httpwwwk-5mathteachingresourcescomsupport-filesdoubles-plus-onepdf
Eleven more httpwwwk-5mathteachingresourcescomsupport-fileselevenmorepdf
frame Students will be asked to
measure items using inches and centimeters
Identify and create numbers with place values extending into the hundreds place
44
Keansburg School DistrictCurriculum System
Mathematics
Building numbers with base ten blocks pick three cards and arrange them to show a 3-digit number build that number with base ten blocks repeat with the same three cards until no new numbers can be made
Length strength inches httpwwwharcourtschoolcomactivitylength_strength1_inches
Length strength centimeters httpwwwharcourtschoolcomactivitylength_strength1_centi
Exceeds Standard
Number relationship mat wwwk-5mathteachingresourcescom
Place value barrier game httpwwwk-5mathteachingresourcescommath-gameshtml (integrate other skills into place values for example the digit in my 10s place is four doubled)
Measuring the mousersquos path httpwwwk-5mathteachingresourcescomsupport-filespaths1pdf
45
Keansburg School DistrictCurriculum System
Mathematics
Double minus 1 game httpwwwk-5mathteachingresourcescomsupport-filesdoubles-minus-onepdf
Number relationship mat httpwwwk-5mathteachingresourcescomsupport-filesnumberrelationshipmatpdf
46
Keansburg School DistrictCurriculum System
Mathematicsignment Matrices of Common Core State Standards
Grade Strand Standard Standard
Sept
embe
r ndash
Oct
ober
Nov
embe
r ndash
Dec
embe
r
Janu
ary
ndash Fe
brua
ry
Mar
ch ndash
Apr
il
May
- Ju
ne
1 OA 1
CC1OA1 Represent and solve problems involving addition and subtraction Use addition and subtraction within 20 to solve word problems involving situations of adding to taking from putting together taking apart and comparing with unknowns in all positions eg by using objects drawings and equations with a symbol for the unknown number to represent the problem
1 OA 2
CC1OA2 Represent and solve problems involving addition and subtraction Solve word problems that call for addition of three whole numbers whose sum is less than or equal to 20 eg by using objects drawings and equations with a symbol for the unknown number to represent the problem
1 OA 3
CC1OA3 Understand and apply properties of operations and the relationship between addition and subtraction Apply properties of operations as strategies to add and subtract Examples If 8 + 3 = 11 is known then 3 + 8 = 11 is also known (Commutative property of addition) To add 2 + 6 + 4 the second two numbers can be added to make a ten so 2 + 6 + 4 = 2 + 10 = 12 (Associative property of addition) (Students need not use formal terms for these properties)
1 OA 4
CC1OA4 Understand and apply properties of operations and the relationship between addition and subtraction Understand subtraction as an unknown-addend problem For example subtract 10 ndash 8 by finding the number that makes 10 when added to 8
1 OA 5 CC1OA5 Add and subtract within 20 Relate counting to addition and subtraction (eg by counting on 2 to add 2)
1 OA 6 CC1OA6 Add and subtract within 20 Add and subtract within 20 demonstrating fluency for addition and subtraction within 10 Use strategies such as counting on making ten (eg 8 + 6 = 8 + 2 + 4 = 10 + 4 = 14) decomposing a number leading to a ten (eg 13 ndash 4 = 13 ndash 3 ndash 1 = 10 ndash 1 = 9) using the relationship between addition and subtraction (eg knowing that 8 + 4
47
Keansburg School DistrictCurriculum System
Mathematics= 12 one knows 12 ndash 8 = 4) and creating equivalent but easier or known sums (eg adding 6 + 7 by creating the known equivalent 6 + 6 + 1 = 12 + 1 = 13)
1 OA 7
CC1OA7 Work with addition and subtraction equations Understand the meaning of the equal sign and determine if equations involving addition and subtraction are true or false For example which of the following equations are true and which are false 6 = 6 7 = 8 ndash 1 5 + 2 = 2 + 5 4 + 1 = 5 + 2
1 OA 8
CC1OA8 Work with addition and subtraction equations Determine the unknown whole number in an addition or subtraction equation relating three whole numbers For example determine the unknown number that makes the equation true in each of the equations 8 + = 11 5 = _ ndash 3 6 + 6 = _
1 NBT 1
CC1NBT1 Extend the counting sequence Count to 120 starting at any number less than 120 In this range read and write numerals and represent a number of objects with a written numeral
1 NBT 2
CC1NBT2 Understand place value Understand that the two digits of a two-digit number represent amounts of tens and ones Understand the following as special cases -- a 10 can be thought of as a bundle of ten ones mdash called a ldquotenrdquo -- b The numbers from 11 to 19 are composed of a ten and one two three four five six seven eight or nine ones -- c The numbers 10 20 30 40 50 60 70 80 90 refer to one two three four five six seven eight or nine tens (and 0 ones)
1 NBT 3
CC1NBT3 Understand place value Compare two two-digit numbers based on meanings of the tens and ones digits recording the results of comparisons with the symbols gt = and lt
1 NBT 4
CC1NBT4 Use place value understanding and properties of operations to add and subtract Add within 100 including adding a two-digit number and a one-digit number and adding a two-digit number and a multiple of 10 using concrete models or drawings and strategies based on place value properties of operations andor the relationship between addition and subtraction relate the strategy to a written method and explain the reasoning used Understand that in adding two-digit numbers one adds tens and tens ones and ones and sometimes it is necessary to compose a ten
1 NBT 5
CC1NBT5 Use place value understanding and properties of operations to add and subtract Given a two-digit number mentally find 10 more or 10 less than the number without having to count explain the reasoning used
1 NBT 6 CC1NBT6 Use place value understanding and properties of operations to add and subtract Subtract multiples of 10 in the range 10-90 from multiples of 10 in the range 10-90 (positive or zero differences) using concrete models or drawings and strategies based on place value properties of operations andor
48
Keansburg School DistrictCurriculum System
Mathematicsthe relationship between addition and subtraction relate the strategy to a written method and explain the reasoning used
1 MD 1
CC1MD1 Measure lengths indirectly and by iterating length units Order three objects by length compare the lengths of two objects indirectly by using a third object
1 MD 2
CC1MD2 Measure lengths indirectly and by iterating length units Express the length of an object as a whole number of length units by laying multiple copies of a shorter object (the length unit) end to end understand that the length measurement of an object is the number of same-size length units that span it with no gaps or overlaps Limit to contexts where the object being measured is spanned by a whole number of length units with no gaps or overlaps
1 MD 3CC1MD3 Tell and write time Tell and write time in hours and half-hours using analog and digital clocks
1 MD 4
CC1MD4 Represent and interpret data Organize represent and interpret data with up to three categories ask and answer questions about the total number of data points how many in each category and how many more or less are in one category than in another
1 G 1
CC1G1 Reason with shapes and their attributes Distinguish between defining attributes (eg triangles are closed and three-sided) versus non-defining attributes (eg color orientation overall size) for a wide variety of shapes build and draw shapes to possess defining attributes
1 G 2
CC1G2 Reason with shapes and their attributes Compose two-dimensional shapes (rectangles squares trapezoids triangles half-circles and quarter-circles) or three-dimensional shapes (cubes right rectangular prisms right circular cones and right circular cylinders) to create a composite shape and compose new shapes from the composite shape (Students do not need to learn formal names such as ldquoright rectangular prismrdquo)
1 G 3
CC1G3 Reason with shapes and their attributes Partition circles and rectangles into two and four equal shares describe the shares using the words halves fourths and quarters and use the phrases half of fourth of and quarter of Describe the whole as two of or four of the shares Understand for these examples that decomposing into more equal shares creates smaller shares
49
Keansburg School DistrictCurriculum System
Mathematics
Common Core State Standards Vocabulary
Addition and subtraction within 5 10 20 100 or 1000 Addition or subtraction of two whole numbers with whole number answers and with sum or minuend in the range 0-5 0-10 0-20 or 0-100 respectively Example 8 + 2 = 10 is an addition within 10 14 ndash 5 = 9 is a subtraction within 20 and 55 ndash 18 = 37 is a subtraction within 100
Additive inverses Two numbers whose sum is 0 are additive inverses of one another Example 34 and ndash 34 are additive inverses of one another because 34 + (ndash 34) = (ndash 34) + 34 = 0
Associative property of addition See Table 3 in this Glossary
Associative property of multiplication See Table 3 in this Glossary
Bivariate data Pairs of linked numerical observations Example a list of heights and weights for each player on a football team
Box plot A method of visually displaying a distribution of data values by using the median quartiles and extremes of the data set A box shows the middle 50 of the data1
Commutative property See Table 3 in this Glossary
Complex fraction A fraction AB where A andor B are fractions (B nonzero)
Computation algorithm A set of predefined steps applicable to a class of problems that gives the correct result in every case when the steps are carried out correctly See also computation strategy
Computation strategy Purposeful manipulations that may be chosen for specific problems may not have a fixed order and may be aimed at converting one problem into another See also computation algorithm
Congruent Two plane or solid figures are congruent if one can be obtained from the other by rigid motion (a sequence of rotations reflections and translations)
Counting on A strategy for finding the number of objects in a group without having to count every member of the group For example if a stack of books is known to have 8 books and 3 more books are added to the top it is not necessary to count the stack
50
Keansburg School DistrictCurriculum System
Mathematicsall over again One can find the total by counting onmdashpointing to the top book and saying ldquoeightrdquo following this with ldquonine ten eleven There are eleven books nowrdquo
Dot plot See line plot
Dilation A transformation that moves each point along the ray through the point emanating from a fixed center and multiplies distances from the center by a common scale factor
Expanded form A multi-digit number is expressed in expanded form when it is written as a sum of single-digit multiples of powers of ten For example 643 = 600 + 40 + 3
Expected value For a random variable the weighted average of its possible values with weights given by their respective probabilities
First quartile For a data set with median M the first quartile is the median of the data values less than M Example For the data set 1 3 6 7 10 12 14 15 22 120 the first quartile is 62 See also median third quartile interquartile range
Fraction A number expressible in the form ab where a is a whole number and b is a positive whole number (The word fraction in these standards always refers to a non-negative number) See also rational number
Identity property of 0 See Table 3 in this Glossary
Independently combined probability models Two probability models are said to be combined independently if the probability of each ordered pair in the combined model equals the product of the original probabilities of the two individual outcomes in the ordered pair
Integer A number expressible in the form a or ndasha for some whole number a
Interquartile Range A measure of variation in a set of numerical data the interquartile range is the distance between the first and third quartiles of the data set Example For the data set 1 3 6 7 10 12 14 15 22 120 the interquartile range is 15 ndash 6 = 9 See also first quartile third quartile
Line plot A method of visually displaying a distribution of data values where each data value is shown as a dot or mark above a number line Also known as a dot plot3
51
Keansburg School DistrictCurriculum System
MathematicsMean A measure of center in a set of numerical data computed by adding the values in a list and then dividing by the number of values in the list4 Example For the data set 1 3 6 7 10 12 14 15 22 120 the mean is 21
Mean absolute deviation A measure of variation in a set of numerical data computed by adding the distances between each data value and the mean then dividing by the number of data values Example For the data set 2 3 6 7 10 12 14 15 22 120 the mean absolute deviation is 20
Median A measure of center in a set of numerical data The median of a list of values is the value appearing at the center of a sorted version of the listmdashor the mean of the two central values if the list contains an even number of values Example For the data set 2 3 6 7 10 12 14 15 22 90 the median is 11
Midline In the graph of a trigonometric function the horizontal line halfway between its maximum and minimum values
Multiplication and division within 100 Multiplication or division of two whole numbers with whole number answers and with product or dividend in the range 0-100 Example 72 divide 8 = 9
Multiplicative inverses Two numbers whose product is 1 are multiplicative inverses of one another Example 34 and 43 are multiplicative inverses of one another because 34 times 43 = 43 times 34 = 1
Number line diagram A diagram of the number line used to represent numbers and support reasoning about them In a number line diagram for measurement quantities the interval from 0 to 1 on the diagram represents the unit of measure for the quantity
Percent rate of change A rate of change expressed as a percent Example if a population grows from 50 to 55 in a year it grows by 550 = 10 per year
Probability distribution The set of possible values of a random variable with a probability assigned to each
Properties of operations See Table 3 in this Glossary
Properties of equality See Table 4 in this Glossary
Properties of inequality See Table 5 in this Glossary
Properties of operations See Table 3 in this Glossary
52
Keansburg School DistrictCurriculum System
MathematicsProbability A number between 0 and 1 used to quantify likelihood for processes that have uncertain outcomes (such as tossing a coin selecting a person at random from a group of people tossing a ball at a target or testing for a medical condition)
Probability model A probability model is used to assign probabilities to outcomes of a chance process by examining the nature of the process The set of all outcomes is called the sample space and their probabilities sum to 1 See also uniform probability model
Random variable An assignment of a numerical value to each outcome in a sample space
Rational expression A quotient of two polynomials with a non-zero denominator
Rational number A number expressible in the form ab or ndash ab for some fraction ab The rational numbers include the integers
Rectilinear figure A polygon all angles of which are right angles
Rigid motion A transformation of points in space consisting of a sequence of one or more translations reflections andor rotations Rigid motions are here assumed to preserve distances and angle measures
Repeating decimal The decimal form of a rational number See also terminating decimal
Sample space In a probability model for a random process a list of the individual outcomes that are to be considered
Scatter plot A graph in the coordinate plane representing a set of bivariate data For example the heights and weights of a group of people could be displayed on a scatter plot5
Similarity transformation A rigid motion followed by a dilation
Tape diagram A drawing that looks like a segment of tape used to illustrate number relationships Also known as a strip diagram bar model fraction strip or length model
Terminating decimal A decimal is called terminating if its repeating digit is 0
Third quartile For a data set with median M the third quartile is the median of the data values greater than M Example For the data set 2 3 6 7 10 12 14 15 22 120 the third quartile is 15 See also median first quartile interquartile range
Transitivity principle for indirect measurement If the length of object A is greater than the length of object B and the length of object B is greater than the length of object C then the length of object A is greater than the length of object C This principle applies
53
Keansburg School DistrictCurriculum System
Mathematicsto measurement of other quantities as well
Uniform probability model A probability model which assigns equal probability to all outcomes See also probability model
Vector A quantity with magnitude and direction in the plane or in space defined by an ordered pair or triple of real numbers
Visual fraction model A tape diagram number line diagram or area model
Whole numbers The numbers 0 1 2 3 hellip5
54
- MissionVision Statement
- Beliefs
- Measurement amp Data
- Measure lengths and by iterating length units
- Tell and write time
- Represent and interpret data
- Geometry
- Reason with shapes and their attributes
- Number and Base Ten
- Extend the counting sequence
- Understand place value
-
- Measurement amp Data (II)
-
- Measure lengths and by iterating length units
- Tell and write time
-
- Represent and interpret data
- Geometry (II)
- Reason with shapes their attributes
-
- Number and Base Ten
- Use place value understanding and properties of operations to add and subtract
- Teacher will cover up specific numbers on an enlarged number grid using cover up tape to have students identify numbers before and after Students will come up and write the missing numbers
- Students will play ldquoI have__ Who has __ Teacher will create cards using index cards and numbers in which students need further practice with Students will read their cards aloud Variations of game can include identifying specific numbers identifying numbers more or less etc)
- Students will use base ten blocks to represent numbers including three digit numbers Students will identify representation of numbers through these manipulatives They may match the representation to the written number
- Students will write the number they created using the base ten blocks using their white boards and markers
- Students will arrange given digits to create the greatest and lowest possible numbers They can show each number they create using base ten blocks
- Students will use the Base Ten Exchange Game to show an understanding of exchanging ones for tens and tens for hundreds Students can use place value mats base ten blocks (cubes tens and flats) Students can take number of cubes displayed with roll of single die Students will determine when exchanging can be made when reaching ten units
- Base ten concentration wwwk-5mathteachingresourcescom
- Ten frame compare wwwk-5mathteachingresourcescom
-
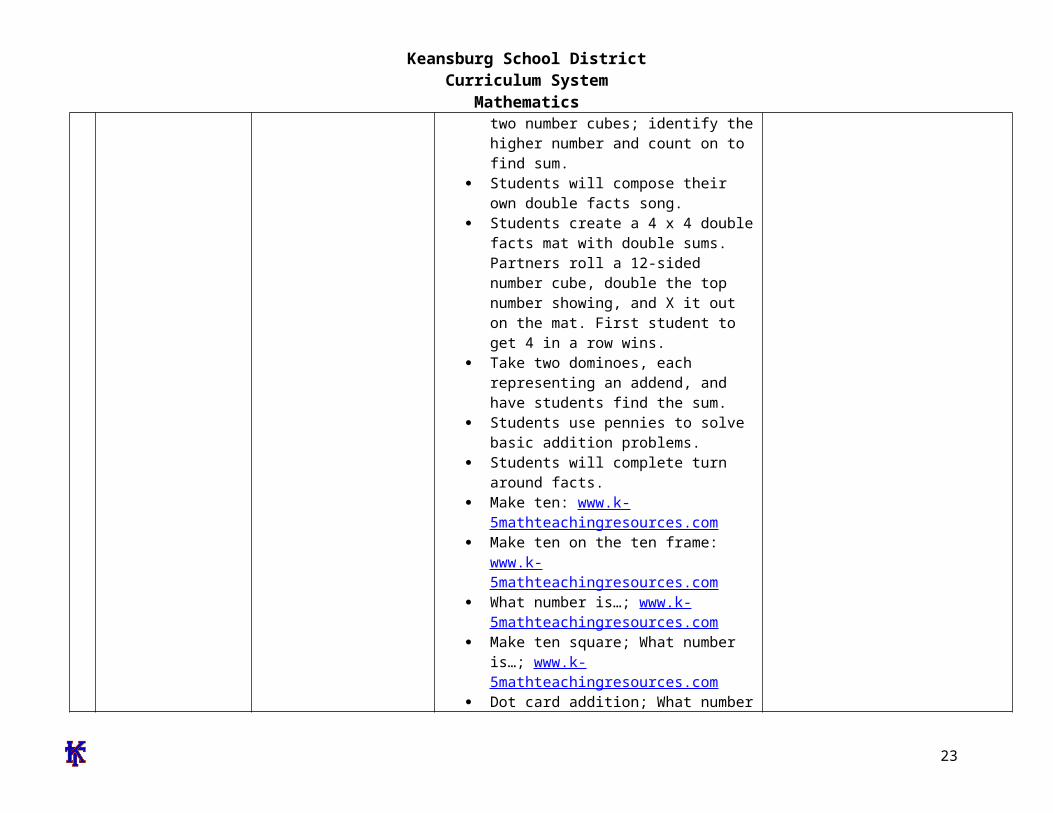
Keansburg School DistrictCurriculum System
Mathematicsobjects of different shapes
How can shapes and solids be described compared and used to make other shapes What are equal parts
What foods do you divide into equal parts
What other items might be divided
How do you know if you have an equal share
possessing certain attributes
Identify and construct two-dimensional shapes
Identify and construct three-dimensional figures
id=L168 Create a drawing using shapes students will create a
picture using the pattern block template stencil (house sun flowers etc)
o Paper pattern block stencil template crayons
Apply understanding of attributes by playing Shape Detective and Attribute Train Game
Demonstrate understanding of 3 Dimensional shapes by playing Whatrsquos My Shape
Exceeds Standard
Introducing and exposing higher vocabulary polyhedronpolyhedra (many faces of a shape) Placing the word onto the word wall
Students read the poem Shapes by Shel Silverstein and create their own illustration of the poem to explore geometric figures and positional words
Materials httpilluminationsnctmorgLessonDetailaspxID=L202
Shapes by Shel Silverstein paper crayons pencils examples of rectangles triangles circles
Compose clues using inferencing to play Guess What Display variety of 3 dimensional shapes Silently choose
an object and give clues about it For example I amsmall I have 2 flat faces and if you trace my faces youwill get circles What am I (tomato can)
Students work together to use pattern blocks to coverother pattern blocks For example how many triangleblocks are needed to cover a hexagon block
Student rotate in groups to visit each geometric solidwhile completing a chart which shows faces sides and
Typical Assessment Question(s) or Task(s)
Ask students how many sides each shape has
Have students classify shapes based on number of sides
Have students identify shapes in the classroom
Have students create 2 and 3 dimensional shapes
Have students design pictures using pattern blockspattern block template
Have students identify and describe assigned shapersquos attributes
Ask students to name 3 dimensional shapes hidden i bag (Whatrsquos my Shape Game)
23
Keansburg School DistrictCurriculum System
Mathematics corners Students compose a shape town by using their pattern
block templates Then students will calculate the totalnumber of each pattern block used
Students will invent new shapes by using three-dimensional shapes
Students will create patterns using three dimensionalshapes
24
Keansburg School DistrictCurriculum System
MathematicsKeansburg School DistrictCurriculum Management System
SubjectGradeLevelMathematicsGrade 1
Timeline January-Quarter 2
Topic(s) Number and Operations in Base Ten
Significance of Learning Goal(s) To recognize compare and understand numbers to 120
Sugg
este
d D
ays
of
Inst
ruct
ion Content
Standards CPI Essential
Questions
Specific Learning Objective(s)
The Students Will Be Able To
Suggested ActivitiesInstructional Tools Materials
Technology Resources Assessments and Assessment
Models
25
Keansburg School DistrictCurriculum System
MathematicsCPI 1NBT1 1NBT2A 1NBT2B 1NBT2C 1NBT3
EQ How do
numbers help us
How can sets of numbers be counted compared and ordered
How can I use numbers to solve problems
How would putting numbers on a chart make it easier to understand information
How can I make it easier to understand numbers when I sort them
What is place value
Concept(s) Recognize compare and understand numbers up to 120
SWBAT Recognize read write
and count 0-120 Understand that a two-
digit number represents amounts of tens and ones
Relate groups of ten to skip counting
Compare two two-digit numbers based on meanings of tens and ones digits using symbols ltgt and =
Meets Standard Teacher will cover up specific numbers
on an enlarged number grid using cover up tape to have students identify numbers before and after Students will come up and write the missing numbers
Students will play ldquoI have__ Who has __ Teacher will create cards using index cards and numbers in which students need further practice with Students will read their cards aloud Variations of game can include identifying specific numbers identifying numbers more or less etc)
Students will use base ten blocks to represent numbers including three digit numbers Students will identify representation of numbers through these manipulatives They may match the representation to the written number
Students will write the number they created using the base ten blocks using their white boards and markers
Students will arrange given digits to create the greatest and lowest possible numbers They can show each number they create using base ten blocks
Students will use the Base Ten Exchange Game to show an
Number grids ldquoI have Who hasrdquo index
cards base ten blocks white boards markers number cards dice ten frame base ten concentration
boards (k-5 math teaching resources)
double ten frame boards (k-5 math teaching resources)
Typical Assessment Question(s) or Task(s)
Recognize numbers 1-120 using flashcards
Write numbers 1-20 using block or graph paper
Build two-digit numbers using tens and ones blocks
Listen and note students skip counting orally by tens to 120
Students compare and label two numbers using relation symbols
26
Keansburg School DistrictCurriculum System
Mathematics Why is place
value important
How can I use place value to compare and order numbers
How can I use the number grid to help me with counting numbers
How many times do you think you can hop in one minute
What does number relationships mean
Why do we need to know how to add
Why do we need to know how to subtract
How are addition and subtraction related
What are doubles
How can
understanding of exchanging ones for tens and tens for hundreds Students can use place value mats base ten blocks (cubes tens and flats) Students can take number of cubes displayed with roll of single die Students will determine when exchanging can be made when reaching ten units
Teens on the ten frame wwwk-5mathteachingresourcescom
Base ten concentration wwwk-5mathteachingresourcescom
Ten frame compare wwwk-5mathteachingresourcescom
Exceeds Standard
Students will create riddles Irsquom thinking of a number that has 4 tens and 13 ones Have students solve the riddle by regrouping the ones to find the answer
-Students use hundreds chart to jump up and down from a number to show 10 more or 10 less
-Students will play Whatrsquos my Number by giving clues based on place value odd or even and number sense For example Irsquom a two digit number The digit in my tens place is 2 more than 4
27
Keansburg School DistrictCurriculum System
Mathematicsdouble facts help us to add and subtract
Does it matter what order you use to add three numbers Why or why not
The digit in my ones place is 3 less than 8 Whatrsquos my number
My double ten frame riddle wwwk-5mathteachingresourcescom
28
Keansburg School DistrictCurriculum System
MathematicsKeansburg School DistrictCurriculum Management System
SubjectGradeLevelMathematicsGrade 1
Timeline February-Quarter 3
Topic(s) Operations amp Algebraic Expressions
Significance of Learning Goal(s) To solve addition and subtraction problems
Sugg
este
d D
ays
of
Inst
ruct
ion Content
Standards CPI
Essential Questions
Specific Learning Objective(s)
The Students Will Be Able To
Suggested ActivitiesInstructional Tools Materials
Technology Resources Assessments and Assessment
Models
CPI1OA31OA4 1OA5 1OA6 1OA7 1OA81OA2
EQ What
questions can be answered using addition
What strategies can be used to solve problems
How can we
Concept(s) Solve addition with and subtraction problems
SWBAT Solve addition problems
with sums up to 20 Use addition within 20 to
solve word problems involving real life situations
Solve word problems that call for addition of three whole numbers up to 20
Solve subtraction problems with difference up to 20
Use subtraction within 20 to solve word problems involving real
Meets Standard Model and have students create their
own individual number sentence using manipulatives and label operation symbols
Students will choose a strategy to solve number stories such as objects fingers and pictures count onback number line or number grid
Create real life situations in which students will use a strategy to solve a number story and create a number model
Review addition and subtraction number stories posters stating each key word for addition and subtraction operations
Combine and mix two sets of 0-20 number cards One partner draws two number cards from the top of the deck students will design and generate a number story using the two numbers
Materials Manipulatives (examples
counting bears connecting cubes pennies counters etc)
Slates dry erase markers erasers
Clear Sheet Protectors Sets of 0-20 number cards Number cards Cardstock Scrabble tiles letter cards
Typical Assessment Question(s) or Task(s)
Students will solve real life
29
Keansburg School DistrictCurriculum System
Mathematicstell how many
How does knowing math facts make math easier
How can numbers be helpful
Why do I need to subtract
How do we use addition and subtraction in our everyday life
Why are fact families important
What strategies can be used to solve problems How is counting on different from just counting to add
What information do you need to know in order to find
life situations Understand subtraction
as an unknown addend problem example subtract 9-5 by finding the number that makes 9 when added to 5
Both partners solve the problem in the number story and write the answer on their slate
Find three cards that have a sum of 12 how many different ways can the student make the sum of 12 using three cards students record work
-Teacher creates real life word problemsinvolving three addends up to 20
Ten frames subtraction wwwk-5mathteachingresourcescom
I have who has wwwk-5mathteachingresourcescom
True or false wwwk-5mathteachingresourcescom
Count to 20 wwwk-5mathteachingresourcescom
Exceeds Standard
Teacher creates multi step word problems for students to solve
Students work with partners or small groups to create real life word problems Compose class book of problems
Three letter addends use scrabble tiles or letter cards with corresponding numbers to make three letter words find
word problems Students will create their
own number sentences own number storiesword problems
Students will create and solve number stories in cooperative learning groups
Students will generate word problems using assigned numbers
30
Keansburg School DistrictCurriculum System
Mathematicsthe total number of something
Why would you need to count back
How are subtraction and addition related
the sum of each word by adding the numbers on the tiles Students will find which words have the greatest or smallest sum
31
Keansburg School DistrictCurriculum System
MathematicsKeansburg School DistrictCurriculum Management System
SubjectGradeLevelMathematicsGrade 1
Timeline March-Quarter 3
Topic(s) Measurement amp Data
Significance of Learning Goal(s) To tell time and compare measurements
Sugg
este
d D
ays
of
Inst
ruct
ion Content
Standards CPI
Essential Questions
Specific Learning Objective(s)
The Students Will Be Able ToSuggested Activities
Instructional Tools Materials Technology Resources
Assessments and Assessment Models
How would I know if a bar graph correctly shows what is on a tally chart
How could a bar graph answer a question
Do bar graphs make it easier to understand and compare facts Why
What kind
Concept(s) Telling time comparing measurements
SWBAT Identify and write time to
the hour and half hour on both a digital and analog clock
Write time to the hour and half-hour on both digital and analog clocks
Draw the hands on the analog clock for a given time to the hour or half-hour
Relate times to the half hour as ldquohalf-pastrdquo the hour
Compare and contrast
Meets Standard Students will have their own
demonstration clocks students will identify and find the hour and minute hands
Students create their own clocks using paper plates students will manipulate hands to identify varying times
Students will listen to Jack Hartman ldquoTick Tockrdquo song
Teachers and students will view clock on videos on brainpopjrcom students and teachers can complete quizzes available on website
Teachers will present time on an analog clock students will write the digital time on a white board
Students will play clock concentration Teacher will introduce measurement by
holding up objects and the students will examine the objects and explain the size
Large Judy Clock Individual student Judy
clocks Wipe off analogdigital clocks Clock stampers Timers Rulers Yardsticks Measuring tapes Sheet protectors Cardstock Paper plates Fasteners Index cards
Typical Assessment Question(s) or Task(s)
Students will be asked to identify and write time to the hour and half hour on both
32
Keansburg School DistrictCurriculum System
Mathematicsof graph should I use to answer questions
Why do I need to tell time
How many hands does a clock have
Are the hands on the clock the same size
How long is a minute
Why do I need to use a calendar
How do we use the clock and the calendar to determine what we will do in school
Why do we need to measure something
What can
objects by length Construct objects at
contrasting lengths
ordero Students will break into groups
and compare objects further and classify them depending on their size
Teacher will introduce the ruler Explain to students that the ruler is used to measure objects The students will then explore the classroom and select objects around the room that are smaller and larger than the ruler
Teacher will select specific body parts that the students will use as a personal unit of measurement The students will work in pairs to demonstrate how to measure objects around the room using their personal unit of measurement
The teacher will select a classroom object and the students will be asked to illustrate objects in the room that are bigger and smaller in size
The students will be able to organize represent and interpret data up to three categories through the use of a bar graph
The teacher will then divide students into heterogeneous groups and encourage the students to explain what they can learn from the graph The students will present findings following activity
Students will choose an object within classroom then find additional objects one being larger the other being shorter using a two-column chart Draw or write the objects in the chart
digital and analog clocks Students will be asked to
identify the parts of a clock students will be asked to draw the hands on an analog clock for a given time to the hour or half-hour
Students will be given various objects and will further be asked to compare and contrast the lengths of these objects
Students will be asked to provide or create objects contrasting lengths to demonstrate understanding of differences in length
33
Keansburg School DistrictCurriculum System
Mathematicswe use to draw and measure things
What do you think is about 1 inch long
How many steps long do you think it is from the front of the classroom to the back
If we measure in footsteps why are some of the measurements different
How is longer and shorter similar to greater and lesser
Exceeds Standard
The students will work in pairs to locate objects around the room and compare the lengths against each other The pairs will then work with another pair of students and compare the lengths of their objects with the objects the other pair located
Teacher will introduce the ruler in comparison to the yardstick The students will be encouraged to find objects that in the room that are larger than a ruler and measure using the yardstick
After the teacher introduces units of personal measurement the students will be encouraged to measure object in the room using their own unit of personal measurement and convert it into a standard measurement using a ruler or a yardstick
The teacher will select a classroom object and the students will be asked to illustrate objects in the room that are bigger and smaller by a specific size
The students will be able to organize represent and interpret data up to four or more categories through the use of a bar graph
The teacher will then divide students into heterogeneous groups and encourage the students to explain what they can learn from the graph and create a tally chart utilizing the data
Students will create clock flash cards by
34
Keansburg School DistrictCurriculum System
Mathematicsdrawing an analog clock on one side and writing the digital clock time on the other Students will include time in five minute intervals
Pose word problems where students have to find elapse time to the hour and half hour
Introduce second hand and conduct activities that are timed in seconds (Examples hopping on 1 foot blinking eyes counting to the highest number)
35
Keansburg School DistrictCurriculum System
MathematicsKeansburg School DistrictCurriculum Management System
SubjectGradeLevelMathematicsGrade 1
Timeline April-Quarter 4
Topic(s) Geometry
Significance of Learning Goal(s) To identify two and three dimensional shapes to understand fractional parts and create equal shares
Sugg
este
d D
ays
of
Inst
ruct
ion Content
Standards CPI Essential
Questions
Specific Learning Objective(s)
The Students Will Be Able To
Suggested ActivitiesInstructional Tools Materials
Technology Resources Assessments and Assessment
Models
Are there different shapes outside
How are geometric figures alike
How can we sort objects of different shapes
How can shapes and solids be described compared and used to make other shapes
Concept(s) Two and three dimensional shapes fractional parts equal shares
SWBAT
Combine two-dimensional or three-dimensional shapes or figures to create a new composite shape and identify the shapes within
Identify fractional parts of circles and rectangles into equal shares while developing vocabulary for halves fourths and quarters
Describe the whole as
Meets Standard
Determine which shape by touch without using their sight
o Materials attribute blocks shape sheet feely box wwwilluminationsnctmorglessondetail
Sorting 3-dimensional objects students will be given cards with 3-dimensional objects (trash can soup can globe ball tissue box box dice) they will sort them based on the 3-dimensional shape they represent
o 3-dimensional object cards sorting mats
Pizza and Cake Fractions students will utilize a pizza and a cake to work on the concept of fractions while developing the vocabulary halves quarters and fourths
o Materials teacher created pizza
Attribute blocks Geometric shapes 3-dimensional object
cards Sorting maps 3-dimensional shapes Solid and lane figures Geo-boards and rubber
bands Fraction circles Sheet protectors 2-dimensional shapes
Typical Assessment Question(s) or Task(s)
Students will be asked to describe and identify
36
Keansburg School DistrictCurriculum System
MathematicsWhat are equal parts
What foods do you divide into equal parts
What other items might be divided
How do you know if you have an equal share
two of or four of the shares Understand for these examples that decomposing into more equal shares creates smaller shares
and cake that are cut into fractions (construction paper)
Students will illustrate a picture of a boat using at least one three dimensional shape in their drawings Shapes include cubes cylinders spheres cones and rectangular prisms
Solid and Plane Figures Name the Face activity Provide three-dimensional objects Have students draw the face for each object as well as name the shape Examples ABC block juice can book party hat
Introduce fractions by having students identify shapes that show equal parts Display cut out shapes using document camera Include some shapes that are divided equally and some that are not divided equally As a whole group sort shapes into two categories Then have students go back to their desks and work with a partner to classify additional shapes
Provide students with shapes that are divided into four parts Include shapes that are divided into four equal parts and others that are unequal Students identify the shapes that are divided into four equal parts and explain their reasoning
Shape Town activity Students will design a shape town using the following shapes
shapes within combined two and three-dimensional shapes
Students will be given circles and rectangles students will be asked to divide these shapes into halves fourths and quarters
Students will be asked to sort shapes that are divided equally and not divided equally
37
Keansburg School DistrictCurriculum System
Mathematicstrapezoid hexagon square triangle and circle Afterwards students will calculate the total number of each shape they included After completing the activity students will present their final product to the class and explain how they decided which shapes to use
Given an array of dots students will draw shapes with specific number of sides and corners and connect the dots to create the shapes Example Draw a shape with 5 sides Draw a shape with 6 corners
Students will create two-dimensional shapes on geoboards Then using different colored rubber bands students will divide the shapes into equal parts Students will transfer their equally divided shapes onto geoboard paper by drawing lines to show their equal parts
Play the Fraction Path Game Materials Fraction circles a circle with frac12 shaded a circle with 13 shaded and a circle with frac14 shaded Gameboard Path consisting of assorted shapes divided into halves thirds and fourths Players Needed 3 Directions Place the fraction circles facedown Players close their eyes and pick one fraction circle Each player follows the path from start to finish Each player looks at each shape on the path and records how many shapes show their fractions Players record
38
Keansburg School DistrictCurriculum System
Mathematicstheir results on paper using tally marks At end of game students compare total number of shapes that show their fraction
Exceeds Standard
39
Keansburg School DistrictCurriculum System
MathematicsKeansburg School DistrictCurriculum Management System
SubjectGradeLevelMathematicsGrade 1
Timeline May-Quarter 4
Topic(s) Number and Operations in Base Ten
Significance of Learning Goal(s) To use place value to add and subtract
Sugg
este
d D
ays
of
Inst
ruct
ion Content
Standards CPI Essential
Questions
Specific Learning Objective(s)
The Students Will Be Able ToSuggested Activities
Instructional Tools Materials Technology Resources
Assessments and Assessment Models
40
Keansburg School DistrictCurriculum System
MathematicsCPI 1NBT4 1NBT5 1NBT6
EQ How do
numbers help us
How can sets of numbers be counted compared and ordered
How can I use numbers to solve problems
How would putting numbers on a chart make it easier to understand information
How can I make it easier to understand numbers when I sort them
What is place value
Why is place value important
How can I
Concept(s) Use place value and properties of operations to add and subtract
SWBAT Use mental math to find
10 more or ten less than a given two-digit number and explain reasoning used within any number to 120
Use place value to add within 100 add a two-digit number to a one-digit number and add a two-digit number to a multiple of ten
Understand when adding two-digit numbers that ones add to the ones and tens add to the tens and sometimes it is necessary to compose a ten by regrouping
For all above objects students will use concrete models and strategies based on place value and relate the strategy to a written method and explain the reasoning used
Subtract multiples of 10 in the range 10-90 from multiples of 10 in the range 10-90 using
Meets Standard
Comparing two digit numbers wwwk-5mathteachingresourcescom
Subtraction split wwwk-5mathteachingresourcescom
Ten more wwwk-5mathteachingresourcescom
Addition split wwwk-5mathteachingresourcescom
Exceeds Standard
Comparing 3-Digit numbers wwwk-5mathteachingresourcescom
What number is wwwk-5mathteachingresourcescom
Students develop addition and subtraction number stories and have partners solve
Create pictures using basendash10 blocks Students trace picture onto paper label the base ten blocks with their value and add total
Solve number grid puzzles by adding and subtraction 10 on the number grid
Number cards Base 10 blocks Counters Number grid puzzles Sleeve protectors wwwk-
5mathteachingresourcescom
Dice
Typical Assessment Question(s) or Task(s)
Recognize numbers 1-120 using flashcards
Write numbers 1-20 using block or graph paper
Build two-digit numbers using tens and ones blocks
Listen and note students skip counting orally by tens to 120
Students compare and label two numbers using relation symbols
41
Keansburg School DistrictCurriculum System
Mathematics
42
Keansburg School DistrictCurriculum System
MathematicsKeansburg School DistrictCurriculum Management System
SubjectGradeLevelMathematicsGrade 1
Timeline June-Quarter 4
Topic(s) Readiness skills for September of Grade 2
Significance of Learning Goal(s) To compare larger numbers add fluently and apply measurement skills
Sugg
este
d D
ays
of
Inst
ruct
ion Content
Standards CPI Essential Questions
Specific Learning Objective(s)
The Students Will Be Able ToSuggested Activities
Instructional Tools Materials Technology Resources
Assessments and Assessment Models
CPI
EQ How can I use
place value to compare and
order numbers in the 100s
How can mastering basic addition and subtraction facts help me compute larger numbers
How can I tie in
Concept(s)Use place value to compare larger numbers fluently add up to 20 apply measurement skills
SWBAT Extend place value into
the hundreds place and re-write and construct models beyond the hundreds
Fluently add and subtract within 20 using mental strategies
Apply measurement skills
Meets Standard Place Value barrier game httpwwwk-
5mathteachingresourcescommath-gameshtml (place value only)
High card
httpwwwlearningboxcomBase10 BaseTenhtml
Time barrier game httpwwwk-5mathteachingresourcescomsupport-filestimebarriergamepdf httpwwwk-5mathteachingresourcescomsupport-filestimebarriergamegridpdf
My favorite time of day writing activity
number cards base ten blocks rulers tape measurer string number relationship mat paper plates cotton balls judy clock digital clock
Typical Assessment Question(s) or Task(s)
Students will solve addition and subtraction problems within 20 in a given time
43
Keansburg School DistrictCurriculum System
Mathematicsmeasurement skills with real life experiences
httpwwwk-5mathteachingresourcescomsupport-filesmy-favorite-time-of-daypdf
Estimating length httpwwwk-5mathteachingresourcescomsupport-filesestimatinglengthpdf
Olympic golf plastic golf clubs cotton balls and tape measurer
Olympic smiles measuring smiles with string and rulers
Olympic Frisbee using paper plates and tape measurer
Olympic airplane students will make paper airplanes measure the distance that they can throw their airplane
Doubles plus 1 game httpwwwk-5mathteachingresourcescomsupport-filesdoubles-plus-onepdf
Eleven more httpwwwk-5mathteachingresourcescomsupport-fileselevenmorepdf
frame Students will be asked to
measure items using inches and centimeters
Identify and create numbers with place values extending into the hundreds place
44
Keansburg School DistrictCurriculum System
Mathematics
Building numbers with base ten blocks pick three cards and arrange them to show a 3-digit number build that number with base ten blocks repeat with the same three cards until no new numbers can be made
Length strength inches httpwwwharcourtschoolcomactivitylength_strength1_inches
Length strength centimeters httpwwwharcourtschoolcomactivitylength_strength1_centi
Exceeds Standard
Number relationship mat wwwk-5mathteachingresourcescom
Place value barrier game httpwwwk-5mathteachingresourcescommath-gameshtml (integrate other skills into place values for example the digit in my 10s place is four doubled)
Measuring the mousersquos path httpwwwk-5mathteachingresourcescomsupport-filespaths1pdf
45
Keansburg School DistrictCurriculum System
Mathematics
Double minus 1 game httpwwwk-5mathteachingresourcescomsupport-filesdoubles-minus-onepdf
Number relationship mat httpwwwk-5mathteachingresourcescomsupport-filesnumberrelationshipmatpdf
46
Keansburg School DistrictCurriculum System
Mathematicsignment Matrices of Common Core State Standards
Grade Strand Standard Standard
Sept
embe
r ndash
Oct
ober
Nov
embe
r ndash
Dec
embe
r
Janu
ary
ndash Fe
brua
ry
Mar
ch ndash
Apr
il
May
- Ju
ne
1 OA 1
CC1OA1 Represent and solve problems involving addition and subtraction Use addition and subtraction within 20 to solve word problems involving situations of adding to taking from putting together taking apart and comparing with unknowns in all positions eg by using objects drawings and equations with a symbol for the unknown number to represent the problem
1 OA 2
CC1OA2 Represent and solve problems involving addition and subtraction Solve word problems that call for addition of three whole numbers whose sum is less than or equal to 20 eg by using objects drawings and equations with a symbol for the unknown number to represent the problem
1 OA 3
CC1OA3 Understand and apply properties of operations and the relationship between addition and subtraction Apply properties of operations as strategies to add and subtract Examples If 8 + 3 = 11 is known then 3 + 8 = 11 is also known (Commutative property of addition) To add 2 + 6 + 4 the second two numbers can be added to make a ten so 2 + 6 + 4 = 2 + 10 = 12 (Associative property of addition) (Students need not use formal terms for these properties)
1 OA 4
CC1OA4 Understand and apply properties of operations and the relationship between addition and subtraction Understand subtraction as an unknown-addend problem For example subtract 10 ndash 8 by finding the number that makes 10 when added to 8
1 OA 5 CC1OA5 Add and subtract within 20 Relate counting to addition and subtraction (eg by counting on 2 to add 2)
1 OA 6 CC1OA6 Add and subtract within 20 Add and subtract within 20 demonstrating fluency for addition and subtraction within 10 Use strategies such as counting on making ten (eg 8 + 6 = 8 + 2 + 4 = 10 + 4 = 14) decomposing a number leading to a ten (eg 13 ndash 4 = 13 ndash 3 ndash 1 = 10 ndash 1 = 9) using the relationship between addition and subtraction (eg knowing that 8 + 4
47
Keansburg School DistrictCurriculum System
Mathematics= 12 one knows 12 ndash 8 = 4) and creating equivalent but easier or known sums (eg adding 6 + 7 by creating the known equivalent 6 + 6 + 1 = 12 + 1 = 13)
1 OA 7
CC1OA7 Work with addition and subtraction equations Understand the meaning of the equal sign and determine if equations involving addition and subtraction are true or false For example which of the following equations are true and which are false 6 = 6 7 = 8 ndash 1 5 + 2 = 2 + 5 4 + 1 = 5 + 2
1 OA 8
CC1OA8 Work with addition and subtraction equations Determine the unknown whole number in an addition or subtraction equation relating three whole numbers For example determine the unknown number that makes the equation true in each of the equations 8 + = 11 5 = _ ndash 3 6 + 6 = _
1 NBT 1
CC1NBT1 Extend the counting sequence Count to 120 starting at any number less than 120 In this range read and write numerals and represent a number of objects with a written numeral
1 NBT 2
CC1NBT2 Understand place value Understand that the two digits of a two-digit number represent amounts of tens and ones Understand the following as special cases -- a 10 can be thought of as a bundle of ten ones mdash called a ldquotenrdquo -- b The numbers from 11 to 19 are composed of a ten and one two three four five six seven eight or nine ones -- c The numbers 10 20 30 40 50 60 70 80 90 refer to one two three four five six seven eight or nine tens (and 0 ones)
1 NBT 3
CC1NBT3 Understand place value Compare two two-digit numbers based on meanings of the tens and ones digits recording the results of comparisons with the symbols gt = and lt
1 NBT 4
CC1NBT4 Use place value understanding and properties of operations to add and subtract Add within 100 including adding a two-digit number and a one-digit number and adding a two-digit number and a multiple of 10 using concrete models or drawings and strategies based on place value properties of operations andor the relationship between addition and subtraction relate the strategy to a written method and explain the reasoning used Understand that in adding two-digit numbers one adds tens and tens ones and ones and sometimes it is necessary to compose a ten
1 NBT 5
CC1NBT5 Use place value understanding and properties of operations to add and subtract Given a two-digit number mentally find 10 more or 10 less than the number without having to count explain the reasoning used
1 NBT 6 CC1NBT6 Use place value understanding and properties of operations to add and subtract Subtract multiples of 10 in the range 10-90 from multiples of 10 in the range 10-90 (positive or zero differences) using concrete models or drawings and strategies based on place value properties of operations andor
48
Keansburg School DistrictCurriculum System
Mathematicsthe relationship between addition and subtraction relate the strategy to a written method and explain the reasoning used
1 MD 1
CC1MD1 Measure lengths indirectly and by iterating length units Order three objects by length compare the lengths of two objects indirectly by using a third object
1 MD 2
CC1MD2 Measure lengths indirectly and by iterating length units Express the length of an object as a whole number of length units by laying multiple copies of a shorter object (the length unit) end to end understand that the length measurement of an object is the number of same-size length units that span it with no gaps or overlaps Limit to contexts where the object being measured is spanned by a whole number of length units with no gaps or overlaps
1 MD 3CC1MD3 Tell and write time Tell and write time in hours and half-hours using analog and digital clocks
1 MD 4
CC1MD4 Represent and interpret data Organize represent and interpret data with up to three categories ask and answer questions about the total number of data points how many in each category and how many more or less are in one category than in another
1 G 1
CC1G1 Reason with shapes and their attributes Distinguish between defining attributes (eg triangles are closed and three-sided) versus non-defining attributes (eg color orientation overall size) for a wide variety of shapes build and draw shapes to possess defining attributes
1 G 2
CC1G2 Reason with shapes and their attributes Compose two-dimensional shapes (rectangles squares trapezoids triangles half-circles and quarter-circles) or three-dimensional shapes (cubes right rectangular prisms right circular cones and right circular cylinders) to create a composite shape and compose new shapes from the composite shape (Students do not need to learn formal names such as ldquoright rectangular prismrdquo)
1 G 3
CC1G3 Reason with shapes and their attributes Partition circles and rectangles into two and four equal shares describe the shares using the words halves fourths and quarters and use the phrases half of fourth of and quarter of Describe the whole as two of or four of the shares Understand for these examples that decomposing into more equal shares creates smaller shares
49
Keansburg School DistrictCurriculum System
Mathematics
Common Core State Standards Vocabulary
Addition and subtraction within 5 10 20 100 or 1000 Addition or subtraction of two whole numbers with whole number answers and with sum or minuend in the range 0-5 0-10 0-20 or 0-100 respectively Example 8 + 2 = 10 is an addition within 10 14 ndash 5 = 9 is a subtraction within 20 and 55 ndash 18 = 37 is a subtraction within 100
Additive inverses Two numbers whose sum is 0 are additive inverses of one another Example 34 and ndash 34 are additive inverses of one another because 34 + (ndash 34) = (ndash 34) + 34 = 0
Associative property of addition See Table 3 in this Glossary
Associative property of multiplication See Table 3 in this Glossary
Bivariate data Pairs of linked numerical observations Example a list of heights and weights for each player on a football team
Box plot A method of visually displaying a distribution of data values by using the median quartiles and extremes of the data set A box shows the middle 50 of the data1
Commutative property See Table 3 in this Glossary
Complex fraction A fraction AB where A andor B are fractions (B nonzero)
Computation algorithm A set of predefined steps applicable to a class of problems that gives the correct result in every case when the steps are carried out correctly See also computation strategy
Computation strategy Purposeful manipulations that may be chosen for specific problems may not have a fixed order and may be aimed at converting one problem into another See also computation algorithm
Congruent Two plane or solid figures are congruent if one can be obtained from the other by rigid motion (a sequence of rotations reflections and translations)
Counting on A strategy for finding the number of objects in a group without having to count every member of the group For example if a stack of books is known to have 8 books and 3 more books are added to the top it is not necessary to count the stack
50
Keansburg School DistrictCurriculum System
Mathematicsall over again One can find the total by counting onmdashpointing to the top book and saying ldquoeightrdquo following this with ldquonine ten eleven There are eleven books nowrdquo
Dot plot See line plot
Dilation A transformation that moves each point along the ray through the point emanating from a fixed center and multiplies distances from the center by a common scale factor
Expanded form A multi-digit number is expressed in expanded form when it is written as a sum of single-digit multiples of powers of ten For example 643 = 600 + 40 + 3
Expected value For a random variable the weighted average of its possible values with weights given by their respective probabilities
First quartile For a data set with median M the first quartile is the median of the data values less than M Example For the data set 1 3 6 7 10 12 14 15 22 120 the first quartile is 62 See also median third quartile interquartile range
Fraction A number expressible in the form ab where a is a whole number and b is a positive whole number (The word fraction in these standards always refers to a non-negative number) See also rational number
Identity property of 0 See Table 3 in this Glossary
Independently combined probability models Two probability models are said to be combined independently if the probability of each ordered pair in the combined model equals the product of the original probabilities of the two individual outcomes in the ordered pair
Integer A number expressible in the form a or ndasha for some whole number a
Interquartile Range A measure of variation in a set of numerical data the interquartile range is the distance between the first and third quartiles of the data set Example For the data set 1 3 6 7 10 12 14 15 22 120 the interquartile range is 15 ndash 6 = 9 See also first quartile third quartile
Line plot A method of visually displaying a distribution of data values where each data value is shown as a dot or mark above a number line Also known as a dot plot3
51
Keansburg School DistrictCurriculum System
MathematicsMean A measure of center in a set of numerical data computed by adding the values in a list and then dividing by the number of values in the list4 Example For the data set 1 3 6 7 10 12 14 15 22 120 the mean is 21
Mean absolute deviation A measure of variation in a set of numerical data computed by adding the distances between each data value and the mean then dividing by the number of data values Example For the data set 2 3 6 7 10 12 14 15 22 120 the mean absolute deviation is 20
Median A measure of center in a set of numerical data The median of a list of values is the value appearing at the center of a sorted version of the listmdashor the mean of the two central values if the list contains an even number of values Example For the data set 2 3 6 7 10 12 14 15 22 90 the median is 11
Midline In the graph of a trigonometric function the horizontal line halfway between its maximum and minimum values
Multiplication and division within 100 Multiplication or division of two whole numbers with whole number answers and with product or dividend in the range 0-100 Example 72 divide 8 = 9
Multiplicative inverses Two numbers whose product is 1 are multiplicative inverses of one another Example 34 and 43 are multiplicative inverses of one another because 34 times 43 = 43 times 34 = 1
Number line diagram A diagram of the number line used to represent numbers and support reasoning about them In a number line diagram for measurement quantities the interval from 0 to 1 on the diagram represents the unit of measure for the quantity
Percent rate of change A rate of change expressed as a percent Example if a population grows from 50 to 55 in a year it grows by 550 = 10 per year
Probability distribution The set of possible values of a random variable with a probability assigned to each
Properties of operations See Table 3 in this Glossary
Properties of equality See Table 4 in this Glossary
Properties of inequality See Table 5 in this Glossary
Properties of operations See Table 3 in this Glossary
52
Keansburg School DistrictCurriculum System
MathematicsProbability A number between 0 and 1 used to quantify likelihood for processes that have uncertain outcomes (such as tossing a coin selecting a person at random from a group of people tossing a ball at a target or testing for a medical condition)
Probability model A probability model is used to assign probabilities to outcomes of a chance process by examining the nature of the process The set of all outcomes is called the sample space and their probabilities sum to 1 See also uniform probability model
Random variable An assignment of a numerical value to each outcome in a sample space
Rational expression A quotient of two polynomials with a non-zero denominator
Rational number A number expressible in the form ab or ndash ab for some fraction ab The rational numbers include the integers
Rectilinear figure A polygon all angles of which are right angles
Rigid motion A transformation of points in space consisting of a sequence of one or more translations reflections andor rotations Rigid motions are here assumed to preserve distances and angle measures
Repeating decimal The decimal form of a rational number See also terminating decimal
Sample space In a probability model for a random process a list of the individual outcomes that are to be considered
Scatter plot A graph in the coordinate plane representing a set of bivariate data For example the heights and weights of a group of people could be displayed on a scatter plot5
Similarity transformation A rigid motion followed by a dilation
Tape diagram A drawing that looks like a segment of tape used to illustrate number relationships Also known as a strip diagram bar model fraction strip or length model
Terminating decimal A decimal is called terminating if its repeating digit is 0
Third quartile For a data set with median M the third quartile is the median of the data values greater than M Example For the data set 2 3 6 7 10 12 14 15 22 120 the third quartile is 15 See also median first quartile interquartile range
Transitivity principle for indirect measurement If the length of object A is greater than the length of object B and the length of object B is greater than the length of object C then the length of object A is greater than the length of object C This principle applies
53
Keansburg School DistrictCurriculum System
Mathematicsto measurement of other quantities as well
Uniform probability model A probability model which assigns equal probability to all outcomes See also probability model
Vector A quantity with magnitude and direction in the plane or in space defined by an ordered pair or triple of real numbers
Visual fraction model A tape diagram number line diagram or area model
Whole numbers The numbers 0 1 2 3 hellip5
54
- MissionVision Statement
- Beliefs
- Measurement amp Data
- Measure lengths and by iterating length units
- Tell and write time
- Represent and interpret data
- Geometry
- Reason with shapes and their attributes
- Number and Base Ten
- Extend the counting sequence
- Understand place value
-
- Measurement amp Data (II)
-
- Measure lengths and by iterating length units
- Tell and write time
-
- Represent and interpret data
- Geometry (II)
- Reason with shapes their attributes
-
- Number and Base Ten
- Use place value understanding and properties of operations to add and subtract
- Teacher will cover up specific numbers on an enlarged number grid using cover up tape to have students identify numbers before and after Students will come up and write the missing numbers
- Students will play ldquoI have__ Who has __ Teacher will create cards using index cards and numbers in which students need further practice with Students will read their cards aloud Variations of game can include identifying specific numbers identifying numbers more or less etc)
- Students will use base ten blocks to represent numbers including three digit numbers Students will identify representation of numbers through these manipulatives They may match the representation to the written number
- Students will write the number they created using the base ten blocks using their white boards and markers
- Students will arrange given digits to create the greatest and lowest possible numbers They can show each number they create using base ten blocks
- Students will use the Base Ten Exchange Game to show an understanding of exchanging ones for tens and tens for hundreds Students can use place value mats base ten blocks (cubes tens and flats) Students can take number of cubes displayed with roll of single die Students will determine when exchanging can be made when reaching ten units
- Base ten concentration wwwk-5mathteachingresourcescom
- Ten frame compare wwwk-5mathteachingresourcescom
-
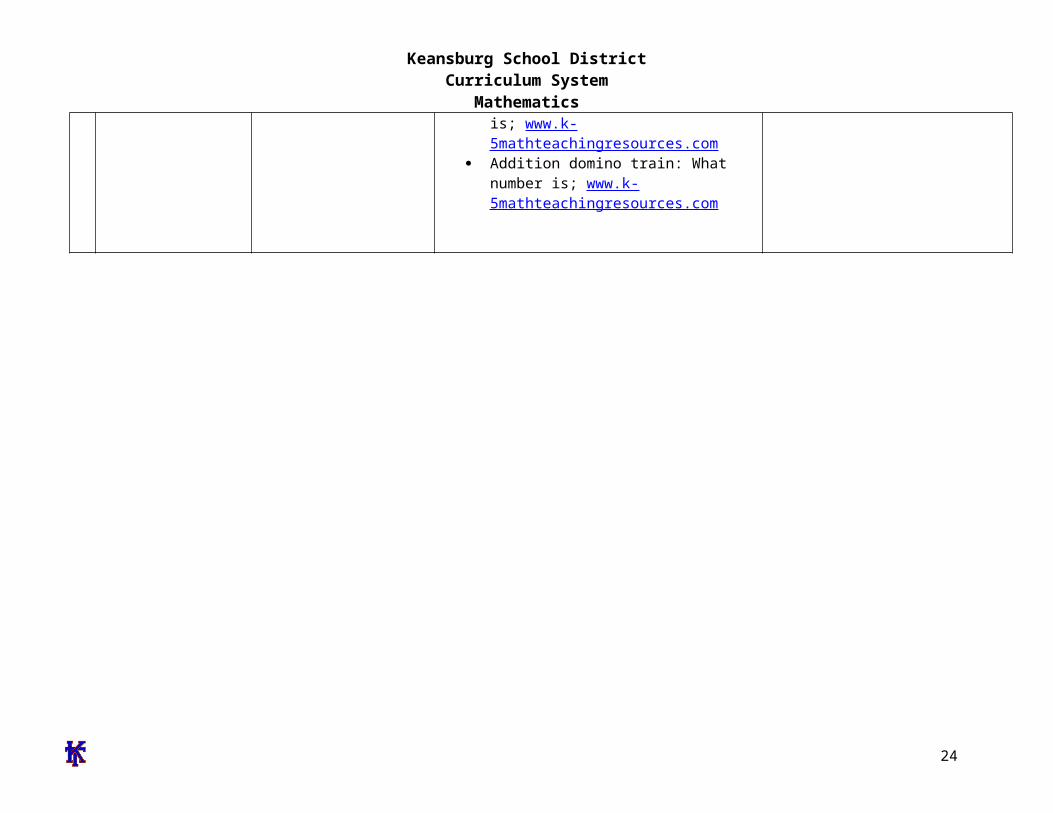
Keansburg School DistrictCurriculum System
Mathematics corners Students compose a shape town by using their pattern
block templates Then students will calculate the totalnumber of each pattern block used
Students will invent new shapes by using three-dimensional shapes
Students will create patterns using three dimensionalshapes
24
Keansburg School DistrictCurriculum System
MathematicsKeansburg School DistrictCurriculum Management System
SubjectGradeLevelMathematicsGrade 1
Timeline January-Quarter 2
Topic(s) Number and Operations in Base Ten
Significance of Learning Goal(s) To recognize compare and understand numbers to 120
Sugg
este
d D
ays
of
Inst
ruct
ion Content
Standards CPI Essential
Questions
Specific Learning Objective(s)
The Students Will Be Able To
Suggested ActivitiesInstructional Tools Materials
Technology Resources Assessments and Assessment
Models
25
Keansburg School DistrictCurriculum System
MathematicsCPI 1NBT1 1NBT2A 1NBT2B 1NBT2C 1NBT3
EQ How do
numbers help us
How can sets of numbers be counted compared and ordered
How can I use numbers to solve problems
How would putting numbers on a chart make it easier to understand information
How can I make it easier to understand numbers when I sort them
What is place value
Concept(s) Recognize compare and understand numbers up to 120
SWBAT Recognize read write
and count 0-120 Understand that a two-
digit number represents amounts of tens and ones
Relate groups of ten to skip counting
Compare two two-digit numbers based on meanings of tens and ones digits using symbols ltgt and =
Meets Standard Teacher will cover up specific numbers
on an enlarged number grid using cover up tape to have students identify numbers before and after Students will come up and write the missing numbers
Students will play ldquoI have__ Who has __ Teacher will create cards using index cards and numbers in which students need further practice with Students will read their cards aloud Variations of game can include identifying specific numbers identifying numbers more or less etc)
Students will use base ten blocks to represent numbers including three digit numbers Students will identify representation of numbers through these manipulatives They may match the representation to the written number
Students will write the number they created using the base ten blocks using their white boards and markers
Students will arrange given digits to create the greatest and lowest possible numbers They can show each number they create using base ten blocks
Students will use the Base Ten Exchange Game to show an
Number grids ldquoI have Who hasrdquo index
cards base ten blocks white boards markers number cards dice ten frame base ten concentration
boards (k-5 math teaching resources)
double ten frame boards (k-5 math teaching resources)
Typical Assessment Question(s) or Task(s)
Recognize numbers 1-120 using flashcards
Write numbers 1-20 using block or graph paper
Build two-digit numbers using tens and ones blocks
Listen and note students skip counting orally by tens to 120
Students compare and label two numbers using relation symbols
26
Keansburg School DistrictCurriculum System
Mathematics Why is place
value important
How can I use place value to compare and order numbers
How can I use the number grid to help me with counting numbers
How many times do you think you can hop in one minute
What does number relationships mean
Why do we need to know how to add
Why do we need to know how to subtract
How are addition and subtraction related
What are doubles
How can
understanding of exchanging ones for tens and tens for hundreds Students can use place value mats base ten blocks (cubes tens and flats) Students can take number of cubes displayed with roll of single die Students will determine when exchanging can be made when reaching ten units
Teens on the ten frame wwwk-5mathteachingresourcescom
Base ten concentration wwwk-5mathteachingresourcescom
Ten frame compare wwwk-5mathteachingresourcescom
Exceeds Standard
Students will create riddles Irsquom thinking of a number that has 4 tens and 13 ones Have students solve the riddle by regrouping the ones to find the answer
-Students use hundreds chart to jump up and down from a number to show 10 more or 10 less
-Students will play Whatrsquos my Number by giving clues based on place value odd or even and number sense For example Irsquom a two digit number The digit in my tens place is 2 more than 4
27
Keansburg School DistrictCurriculum System
Mathematicsdouble facts help us to add and subtract
Does it matter what order you use to add three numbers Why or why not
The digit in my ones place is 3 less than 8 Whatrsquos my number
My double ten frame riddle wwwk-5mathteachingresourcescom
28
Keansburg School DistrictCurriculum System
MathematicsKeansburg School DistrictCurriculum Management System
SubjectGradeLevelMathematicsGrade 1
Timeline February-Quarter 3
Topic(s) Operations amp Algebraic Expressions
Significance of Learning Goal(s) To solve addition and subtraction problems
Sugg
este
d D
ays
of
Inst
ruct
ion Content
Standards CPI
Essential Questions
Specific Learning Objective(s)
The Students Will Be Able To
Suggested ActivitiesInstructional Tools Materials
Technology Resources Assessments and Assessment
Models
CPI1OA31OA4 1OA5 1OA6 1OA7 1OA81OA2
EQ What
questions can be answered using addition
What strategies can be used to solve problems
How can we
Concept(s) Solve addition with and subtraction problems
SWBAT Solve addition problems
with sums up to 20 Use addition within 20 to
solve word problems involving real life situations
Solve word problems that call for addition of three whole numbers up to 20
Solve subtraction problems with difference up to 20
Use subtraction within 20 to solve word problems involving real
Meets Standard Model and have students create their
own individual number sentence using manipulatives and label operation symbols
Students will choose a strategy to solve number stories such as objects fingers and pictures count onback number line or number grid
Create real life situations in which students will use a strategy to solve a number story and create a number model
Review addition and subtraction number stories posters stating each key word for addition and subtraction operations
Combine and mix two sets of 0-20 number cards One partner draws two number cards from the top of the deck students will design and generate a number story using the two numbers
Materials Manipulatives (examples
counting bears connecting cubes pennies counters etc)
Slates dry erase markers erasers
Clear Sheet Protectors Sets of 0-20 number cards Number cards Cardstock Scrabble tiles letter cards
Typical Assessment Question(s) or Task(s)
Students will solve real life
29
Keansburg School DistrictCurriculum System
Mathematicstell how many
How does knowing math facts make math easier
How can numbers be helpful
Why do I need to subtract
How do we use addition and subtraction in our everyday life
Why are fact families important
What strategies can be used to solve problems How is counting on different from just counting to add
What information do you need to know in order to find
life situations Understand subtraction
as an unknown addend problem example subtract 9-5 by finding the number that makes 9 when added to 5
Both partners solve the problem in the number story and write the answer on their slate
Find three cards that have a sum of 12 how many different ways can the student make the sum of 12 using three cards students record work
-Teacher creates real life word problemsinvolving three addends up to 20
Ten frames subtraction wwwk-5mathteachingresourcescom
I have who has wwwk-5mathteachingresourcescom
True or false wwwk-5mathteachingresourcescom
Count to 20 wwwk-5mathteachingresourcescom
Exceeds Standard
Teacher creates multi step word problems for students to solve
Students work with partners or small groups to create real life word problems Compose class book of problems
Three letter addends use scrabble tiles or letter cards with corresponding numbers to make three letter words find
word problems Students will create their
own number sentences own number storiesword problems
Students will create and solve number stories in cooperative learning groups
Students will generate word problems using assigned numbers
30
Keansburg School DistrictCurriculum System
Mathematicsthe total number of something
Why would you need to count back
How are subtraction and addition related
the sum of each word by adding the numbers on the tiles Students will find which words have the greatest or smallest sum
31
Keansburg School DistrictCurriculum System
MathematicsKeansburg School DistrictCurriculum Management System
SubjectGradeLevelMathematicsGrade 1
Timeline March-Quarter 3
Topic(s) Measurement amp Data
Significance of Learning Goal(s) To tell time and compare measurements
Sugg
este
d D
ays
of
Inst
ruct
ion Content
Standards CPI
Essential Questions
Specific Learning Objective(s)
The Students Will Be Able ToSuggested Activities
Instructional Tools Materials Technology Resources
Assessments and Assessment Models
How would I know if a bar graph correctly shows what is on a tally chart
How could a bar graph answer a question
Do bar graphs make it easier to understand and compare facts Why
What kind
Concept(s) Telling time comparing measurements
SWBAT Identify and write time to
the hour and half hour on both a digital and analog clock
Write time to the hour and half-hour on both digital and analog clocks
Draw the hands on the analog clock for a given time to the hour or half-hour
Relate times to the half hour as ldquohalf-pastrdquo the hour
Compare and contrast
Meets Standard Students will have their own
demonstration clocks students will identify and find the hour and minute hands
Students create their own clocks using paper plates students will manipulate hands to identify varying times
Students will listen to Jack Hartman ldquoTick Tockrdquo song
Teachers and students will view clock on videos on brainpopjrcom students and teachers can complete quizzes available on website
Teachers will present time on an analog clock students will write the digital time on a white board
Students will play clock concentration Teacher will introduce measurement by
holding up objects and the students will examine the objects and explain the size
Large Judy Clock Individual student Judy
clocks Wipe off analogdigital clocks Clock stampers Timers Rulers Yardsticks Measuring tapes Sheet protectors Cardstock Paper plates Fasteners Index cards
Typical Assessment Question(s) or Task(s)
Students will be asked to identify and write time to the hour and half hour on both
32
Keansburg School DistrictCurriculum System
Mathematicsof graph should I use to answer questions
Why do I need to tell time
How many hands does a clock have
Are the hands on the clock the same size
How long is a minute
Why do I need to use a calendar
How do we use the clock and the calendar to determine what we will do in school
Why do we need to measure something
What can
objects by length Construct objects at
contrasting lengths
ordero Students will break into groups
and compare objects further and classify them depending on their size
Teacher will introduce the ruler Explain to students that the ruler is used to measure objects The students will then explore the classroom and select objects around the room that are smaller and larger than the ruler
Teacher will select specific body parts that the students will use as a personal unit of measurement The students will work in pairs to demonstrate how to measure objects around the room using their personal unit of measurement
The teacher will select a classroom object and the students will be asked to illustrate objects in the room that are bigger and smaller in size
The students will be able to organize represent and interpret data up to three categories through the use of a bar graph
The teacher will then divide students into heterogeneous groups and encourage the students to explain what they can learn from the graph The students will present findings following activity
Students will choose an object within classroom then find additional objects one being larger the other being shorter using a two-column chart Draw or write the objects in the chart
digital and analog clocks Students will be asked to
identify the parts of a clock students will be asked to draw the hands on an analog clock for a given time to the hour or half-hour
Students will be given various objects and will further be asked to compare and contrast the lengths of these objects
Students will be asked to provide or create objects contrasting lengths to demonstrate understanding of differences in length
33
Keansburg School DistrictCurriculum System
Mathematicswe use to draw and measure things
What do you think is about 1 inch long
How many steps long do you think it is from the front of the classroom to the back
If we measure in footsteps why are some of the measurements different
How is longer and shorter similar to greater and lesser
Exceeds Standard
The students will work in pairs to locate objects around the room and compare the lengths against each other The pairs will then work with another pair of students and compare the lengths of their objects with the objects the other pair located
Teacher will introduce the ruler in comparison to the yardstick The students will be encouraged to find objects that in the room that are larger than a ruler and measure using the yardstick
After the teacher introduces units of personal measurement the students will be encouraged to measure object in the room using their own unit of personal measurement and convert it into a standard measurement using a ruler or a yardstick
The teacher will select a classroom object and the students will be asked to illustrate objects in the room that are bigger and smaller by a specific size
The students will be able to organize represent and interpret data up to four or more categories through the use of a bar graph
The teacher will then divide students into heterogeneous groups and encourage the students to explain what they can learn from the graph and create a tally chart utilizing the data
Students will create clock flash cards by
34
Keansburg School DistrictCurriculum System
Mathematicsdrawing an analog clock on one side and writing the digital clock time on the other Students will include time in five minute intervals
Pose word problems where students have to find elapse time to the hour and half hour
Introduce second hand and conduct activities that are timed in seconds (Examples hopping on 1 foot blinking eyes counting to the highest number)
35
Keansburg School DistrictCurriculum System
MathematicsKeansburg School DistrictCurriculum Management System
SubjectGradeLevelMathematicsGrade 1
Timeline April-Quarter 4
Topic(s) Geometry
Significance of Learning Goal(s) To identify two and three dimensional shapes to understand fractional parts and create equal shares
Sugg
este
d D
ays
of
Inst
ruct
ion Content
Standards CPI Essential
Questions
Specific Learning Objective(s)
The Students Will Be Able To
Suggested ActivitiesInstructional Tools Materials
Technology Resources Assessments and Assessment
Models
Are there different shapes outside
How are geometric figures alike
How can we sort objects of different shapes
How can shapes and solids be described compared and used to make other shapes
Concept(s) Two and three dimensional shapes fractional parts equal shares
SWBAT
Combine two-dimensional or three-dimensional shapes or figures to create a new composite shape and identify the shapes within
Identify fractional parts of circles and rectangles into equal shares while developing vocabulary for halves fourths and quarters
Describe the whole as
Meets Standard
Determine which shape by touch without using their sight
o Materials attribute blocks shape sheet feely box wwwilluminationsnctmorglessondetail
Sorting 3-dimensional objects students will be given cards with 3-dimensional objects (trash can soup can globe ball tissue box box dice) they will sort them based on the 3-dimensional shape they represent
o 3-dimensional object cards sorting mats
Pizza and Cake Fractions students will utilize a pizza and a cake to work on the concept of fractions while developing the vocabulary halves quarters and fourths
o Materials teacher created pizza
Attribute blocks Geometric shapes 3-dimensional object
cards Sorting maps 3-dimensional shapes Solid and lane figures Geo-boards and rubber
bands Fraction circles Sheet protectors 2-dimensional shapes
Typical Assessment Question(s) or Task(s)
Students will be asked to describe and identify
36
Keansburg School DistrictCurriculum System
MathematicsWhat are equal parts
What foods do you divide into equal parts
What other items might be divided
How do you know if you have an equal share
two of or four of the shares Understand for these examples that decomposing into more equal shares creates smaller shares
and cake that are cut into fractions (construction paper)
Students will illustrate a picture of a boat using at least one three dimensional shape in their drawings Shapes include cubes cylinders spheres cones and rectangular prisms
Solid and Plane Figures Name the Face activity Provide three-dimensional objects Have students draw the face for each object as well as name the shape Examples ABC block juice can book party hat
Introduce fractions by having students identify shapes that show equal parts Display cut out shapes using document camera Include some shapes that are divided equally and some that are not divided equally As a whole group sort shapes into two categories Then have students go back to their desks and work with a partner to classify additional shapes
Provide students with shapes that are divided into four parts Include shapes that are divided into four equal parts and others that are unequal Students identify the shapes that are divided into four equal parts and explain their reasoning
Shape Town activity Students will design a shape town using the following shapes
shapes within combined two and three-dimensional shapes
Students will be given circles and rectangles students will be asked to divide these shapes into halves fourths and quarters
Students will be asked to sort shapes that are divided equally and not divided equally
37
Keansburg School DistrictCurriculum System
Mathematicstrapezoid hexagon square triangle and circle Afterwards students will calculate the total number of each shape they included After completing the activity students will present their final product to the class and explain how they decided which shapes to use
Given an array of dots students will draw shapes with specific number of sides and corners and connect the dots to create the shapes Example Draw a shape with 5 sides Draw a shape with 6 corners
Students will create two-dimensional shapes on geoboards Then using different colored rubber bands students will divide the shapes into equal parts Students will transfer their equally divided shapes onto geoboard paper by drawing lines to show their equal parts
Play the Fraction Path Game Materials Fraction circles a circle with frac12 shaded a circle with 13 shaded and a circle with frac14 shaded Gameboard Path consisting of assorted shapes divided into halves thirds and fourths Players Needed 3 Directions Place the fraction circles facedown Players close their eyes and pick one fraction circle Each player follows the path from start to finish Each player looks at each shape on the path and records how many shapes show their fractions Players record
38
Keansburg School DistrictCurriculum System
Mathematicstheir results on paper using tally marks At end of game students compare total number of shapes that show their fraction
Exceeds Standard
39
Keansburg School DistrictCurriculum System
MathematicsKeansburg School DistrictCurriculum Management System
SubjectGradeLevelMathematicsGrade 1
Timeline May-Quarter 4
Topic(s) Number and Operations in Base Ten
Significance of Learning Goal(s) To use place value to add and subtract
Sugg
este
d D
ays
of
Inst
ruct
ion Content
Standards CPI Essential
Questions
Specific Learning Objective(s)
The Students Will Be Able ToSuggested Activities
Instructional Tools Materials Technology Resources
Assessments and Assessment Models
40
Keansburg School DistrictCurriculum System
MathematicsCPI 1NBT4 1NBT5 1NBT6
EQ How do
numbers help us
How can sets of numbers be counted compared and ordered
How can I use numbers to solve problems
How would putting numbers on a chart make it easier to understand information
How can I make it easier to understand numbers when I sort them
What is place value
Why is place value important
How can I
Concept(s) Use place value and properties of operations to add and subtract
SWBAT Use mental math to find
10 more or ten less than a given two-digit number and explain reasoning used within any number to 120
Use place value to add within 100 add a two-digit number to a one-digit number and add a two-digit number to a multiple of ten
Understand when adding two-digit numbers that ones add to the ones and tens add to the tens and sometimes it is necessary to compose a ten by regrouping
For all above objects students will use concrete models and strategies based on place value and relate the strategy to a written method and explain the reasoning used
Subtract multiples of 10 in the range 10-90 from multiples of 10 in the range 10-90 using
Meets Standard
Comparing two digit numbers wwwk-5mathteachingresourcescom
Subtraction split wwwk-5mathteachingresourcescom
Ten more wwwk-5mathteachingresourcescom
Addition split wwwk-5mathteachingresourcescom
Exceeds Standard
Comparing 3-Digit numbers wwwk-5mathteachingresourcescom
What number is wwwk-5mathteachingresourcescom
Students develop addition and subtraction number stories and have partners solve
Create pictures using basendash10 blocks Students trace picture onto paper label the base ten blocks with their value and add total
Solve number grid puzzles by adding and subtraction 10 on the number grid
Number cards Base 10 blocks Counters Number grid puzzles Sleeve protectors wwwk-
5mathteachingresourcescom
Dice
Typical Assessment Question(s) or Task(s)
Recognize numbers 1-120 using flashcards
Write numbers 1-20 using block or graph paper
Build two-digit numbers using tens and ones blocks
Listen and note students skip counting orally by tens to 120
Students compare and label two numbers using relation symbols
41
Keansburg School DistrictCurriculum System
Mathematics
42
Keansburg School DistrictCurriculum System
MathematicsKeansburg School DistrictCurriculum Management System
SubjectGradeLevelMathematicsGrade 1
Timeline June-Quarter 4
Topic(s) Readiness skills for September of Grade 2
Significance of Learning Goal(s) To compare larger numbers add fluently and apply measurement skills
Sugg
este
d D
ays
of
Inst
ruct
ion Content
Standards CPI Essential Questions
Specific Learning Objective(s)
The Students Will Be Able ToSuggested Activities
Instructional Tools Materials Technology Resources
Assessments and Assessment Models
CPI
EQ How can I use
place value to compare and
order numbers in the 100s
How can mastering basic addition and subtraction facts help me compute larger numbers
How can I tie in
Concept(s)Use place value to compare larger numbers fluently add up to 20 apply measurement skills
SWBAT Extend place value into
the hundreds place and re-write and construct models beyond the hundreds
Fluently add and subtract within 20 using mental strategies
Apply measurement skills
Meets Standard Place Value barrier game httpwwwk-
5mathteachingresourcescommath-gameshtml (place value only)
High card
httpwwwlearningboxcomBase10 BaseTenhtml
Time barrier game httpwwwk-5mathteachingresourcescomsupport-filestimebarriergamepdf httpwwwk-5mathteachingresourcescomsupport-filestimebarriergamegridpdf
My favorite time of day writing activity
number cards base ten blocks rulers tape measurer string number relationship mat paper plates cotton balls judy clock digital clock
Typical Assessment Question(s) or Task(s)
Students will solve addition and subtraction problems within 20 in a given time
43
Keansburg School DistrictCurriculum System
Mathematicsmeasurement skills with real life experiences
httpwwwk-5mathteachingresourcescomsupport-filesmy-favorite-time-of-daypdf
Estimating length httpwwwk-5mathteachingresourcescomsupport-filesestimatinglengthpdf
Olympic golf plastic golf clubs cotton balls and tape measurer
Olympic smiles measuring smiles with string and rulers
Olympic Frisbee using paper plates and tape measurer
Olympic airplane students will make paper airplanes measure the distance that they can throw their airplane
Doubles plus 1 game httpwwwk-5mathteachingresourcescomsupport-filesdoubles-plus-onepdf
Eleven more httpwwwk-5mathteachingresourcescomsupport-fileselevenmorepdf
frame Students will be asked to
measure items using inches and centimeters
Identify and create numbers with place values extending into the hundreds place
44
Keansburg School DistrictCurriculum System
Mathematics
Building numbers with base ten blocks pick three cards and arrange them to show a 3-digit number build that number with base ten blocks repeat with the same three cards until no new numbers can be made
Length strength inches httpwwwharcourtschoolcomactivitylength_strength1_inches
Length strength centimeters httpwwwharcourtschoolcomactivitylength_strength1_centi
Exceeds Standard
Number relationship mat wwwk-5mathteachingresourcescom
Place value barrier game httpwwwk-5mathteachingresourcescommath-gameshtml (integrate other skills into place values for example the digit in my 10s place is four doubled)
Measuring the mousersquos path httpwwwk-5mathteachingresourcescomsupport-filespaths1pdf
45
Keansburg School DistrictCurriculum System
Mathematics
Double minus 1 game httpwwwk-5mathteachingresourcescomsupport-filesdoubles-minus-onepdf
Number relationship mat httpwwwk-5mathteachingresourcescomsupport-filesnumberrelationshipmatpdf
46
Keansburg School DistrictCurriculum System
Mathematicsignment Matrices of Common Core State Standards
Grade Strand Standard Standard
Sept
embe
r ndash
Oct
ober
Nov
embe
r ndash
Dec
embe
r
Janu
ary
ndash Fe
brua
ry
Mar
ch ndash
Apr
il
May
- Ju
ne
1 OA 1
CC1OA1 Represent and solve problems involving addition and subtraction Use addition and subtraction within 20 to solve word problems involving situations of adding to taking from putting together taking apart and comparing with unknowns in all positions eg by using objects drawings and equations with a symbol for the unknown number to represent the problem
1 OA 2
CC1OA2 Represent and solve problems involving addition and subtraction Solve word problems that call for addition of three whole numbers whose sum is less than or equal to 20 eg by using objects drawings and equations with a symbol for the unknown number to represent the problem
1 OA 3
CC1OA3 Understand and apply properties of operations and the relationship between addition and subtraction Apply properties of operations as strategies to add and subtract Examples If 8 + 3 = 11 is known then 3 + 8 = 11 is also known (Commutative property of addition) To add 2 + 6 + 4 the second two numbers can be added to make a ten so 2 + 6 + 4 = 2 + 10 = 12 (Associative property of addition) (Students need not use formal terms for these properties)
1 OA 4
CC1OA4 Understand and apply properties of operations and the relationship between addition and subtraction Understand subtraction as an unknown-addend problem For example subtract 10 ndash 8 by finding the number that makes 10 when added to 8
1 OA 5 CC1OA5 Add and subtract within 20 Relate counting to addition and subtraction (eg by counting on 2 to add 2)
1 OA 6 CC1OA6 Add and subtract within 20 Add and subtract within 20 demonstrating fluency for addition and subtraction within 10 Use strategies such as counting on making ten (eg 8 + 6 = 8 + 2 + 4 = 10 + 4 = 14) decomposing a number leading to a ten (eg 13 ndash 4 = 13 ndash 3 ndash 1 = 10 ndash 1 = 9) using the relationship between addition and subtraction (eg knowing that 8 + 4
47
Keansburg School DistrictCurriculum System
Mathematics= 12 one knows 12 ndash 8 = 4) and creating equivalent but easier or known sums (eg adding 6 + 7 by creating the known equivalent 6 + 6 + 1 = 12 + 1 = 13)
1 OA 7
CC1OA7 Work with addition and subtraction equations Understand the meaning of the equal sign and determine if equations involving addition and subtraction are true or false For example which of the following equations are true and which are false 6 = 6 7 = 8 ndash 1 5 + 2 = 2 + 5 4 + 1 = 5 + 2
1 OA 8
CC1OA8 Work with addition and subtraction equations Determine the unknown whole number in an addition or subtraction equation relating three whole numbers For example determine the unknown number that makes the equation true in each of the equations 8 + = 11 5 = _ ndash 3 6 + 6 = _
1 NBT 1
CC1NBT1 Extend the counting sequence Count to 120 starting at any number less than 120 In this range read and write numerals and represent a number of objects with a written numeral
1 NBT 2
CC1NBT2 Understand place value Understand that the two digits of a two-digit number represent amounts of tens and ones Understand the following as special cases -- a 10 can be thought of as a bundle of ten ones mdash called a ldquotenrdquo -- b The numbers from 11 to 19 are composed of a ten and one two three four five six seven eight or nine ones -- c The numbers 10 20 30 40 50 60 70 80 90 refer to one two three four five six seven eight or nine tens (and 0 ones)
1 NBT 3
CC1NBT3 Understand place value Compare two two-digit numbers based on meanings of the tens and ones digits recording the results of comparisons with the symbols gt = and lt
1 NBT 4
CC1NBT4 Use place value understanding and properties of operations to add and subtract Add within 100 including adding a two-digit number and a one-digit number and adding a two-digit number and a multiple of 10 using concrete models or drawings and strategies based on place value properties of operations andor the relationship between addition and subtraction relate the strategy to a written method and explain the reasoning used Understand that in adding two-digit numbers one adds tens and tens ones and ones and sometimes it is necessary to compose a ten
1 NBT 5
CC1NBT5 Use place value understanding and properties of operations to add and subtract Given a two-digit number mentally find 10 more or 10 less than the number without having to count explain the reasoning used
1 NBT 6 CC1NBT6 Use place value understanding and properties of operations to add and subtract Subtract multiples of 10 in the range 10-90 from multiples of 10 in the range 10-90 (positive or zero differences) using concrete models or drawings and strategies based on place value properties of operations andor
48
Keansburg School DistrictCurriculum System
Mathematicsthe relationship between addition and subtraction relate the strategy to a written method and explain the reasoning used
1 MD 1
CC1MD1 Measure lengths indirectly and by iterating length units Order three objects by length compare the lengths of two objects indirectly by using a third object
1 MD 2
CC1MD2 Measure lengths indirectly and by iterating length units Express the length of an object as a whole number of length units by laying multiple copies of a shorter object (the length unit) end to end understand that the length measurement of an object is the number of same-size length units that span it with no gaps or overlaps Limit to contexts where the object being measured is spanned by a whole number of length units with no gaps or overlaps
1 MD 3CC1MD3 Tell and write time Tell and write time in hours and half-hours using analog and digital clocks
1 MD 4
CC1MD4 Represent and interpret data Organize represent and interpret data with up to three categories ask and answer questions about the total number of data points how many in each category and how many more or less are in one category than in another
1 G 1
CC1G1 Reason with shapes and their attributes Distinguish between defining attributes (eg triangles are closed and three-sided) versus non-defining attributes (eg color orientation overall size) for a wide variety of shapes build and draw shapes to possess defining attributes
1 G 2
CC1G2 Reason with shapes and their attributes Compose two-dimensional shapes (rectangles squares trapezoids triangles half-circles and quarter-circles) or three-dimensional shapes (cubes right rectangular prisms right circular cones and right circular cylinders) to create a composite shape and compose new shapes from the composite shape (Students do not need to learn formal names such as ldquoright rectangular prismrdquo)
1 G 3
CC1G3 Reason with shapes and their attributes Partition circles and rectangles into two and four equal shares describe the shares using the words halves fourths and quarters and use the phrases half of fourth of and quarter of Describe the whole as two of or four of the shares Understand for these examples that decomposing into more equal shares creates smaller shares
49
Keansburg School DistrictCurriculum System
Mathematics
Common Core State Standards Vocabulary
Addition and subtraction within 5 10 20 100 or 1000 Addition or subtraction of two whole numbers with whole number answers and with sum or minuend in the range 0-5 0-10 0-20 or 0-100 respectively Example 8 + 2 = 10 is an addition within 10 14 ndash 5 = 9 is a subtraction within 20 and 55 ndash 18 = 37 is a subtraction within 100
Additive inverses Two numbers whose sum is 0 are additive inverses of one another Example 34 and ndash 34 are additive inverses of one another because 34 + (ndash 34) = (ndash 34) + 34 = 0
Associative property of addition See Table 3 in this Glossary
Associative property of multiplication See Table 3 in this Glossary
Bivariate data Pairs of linked numerical observations Example a list of heights and weights for each player on a football team
Box plot A method of visually displaying a distribution of data values by using the median quartiles and extremes of the data set A box shows the middle 50 of the data1
Commutative property See Table 3 in this Glossary
Complex fraction A fraction AB where A andor B are fractions (B nonzero)
Computation algorithm A set of predefined steps applicable to a class of problems that gives the correct result in every case when the steps are carried out correctly See also computation strategy
Computation strategy Purposeful manipulations that may be chosen for specific problems may not have a fixed order and may be aimed at converting one problem into another See also computation algorithm
Congruent Two plane or solid figures are congruent if one can be obtained from the other by rigid motion (a sequence of rotations reflections and translations)
Counting on A strategy for finding the number of objects in a group without having to count every member of the group For example if a stack of books is known to have 8 books and 3 more books are added to the top it is not necessary to count the stack
50
Keansburg School DistrictCurriculum System
Mathematicsall over again One can find the total by counting onmdashpointing to the top book and saying ldquoeightrdquo following this with ldquonine ten eleven There are eleven books nowrdquo
Dot plot See line plot
Dilation A transformation that moves each point along the ray through the point emanating from a fixed center and multiplies distances from the center by a common scale factor
Expanded form A multi-digit number is expressed in expanded form when it is written as a sum of single-digit multiples of powers of ten For example 643 = 600 + 40 + 3
Expected value For a random variable the weighted average of its possible values with weights given by their respective probabilities
First quartile For a data set with median M the first quartile is the median of the data values less than M Example For the data set 1 3 6 7 10 12 14 15 22 120 the first quartile is 62 See also median third quartile interquartile range
Fraction A number expressible in the form ab where a is a whole number and b is a positive whole number (The word fraction in these standards always refers to a non-negative number) See also rational number
Identity property of 0 See Table 3 in this Glossary
Independently combined probability models Two probability models are said to be combined independently if the probability of each ordered pair in the combined model equals the product of the original probabilities of the two individual outcomes in the ordered pair
Integer A number expressible in the form a or ndasha for some whole number a
Interquartile Range A measure of variation in a set of numerical data the interquartile range is the distance between the first and third quartiles of the data set Example For the data set 1 3 6 7 10 12 14 15 22 120 the interquartile range is 15 ndash 6 = 9 See also first quartile third quartile
Line plot A method of visually displaying a distribution of data values where each data value is shown as a dot or mark above a number line Also known as a dot plot3
51
Keansburg School DistrictCurriculum System
MathematicsMean A measure of center in a set of numerical data computed by adding the values in a list and then dividing by the number of values in the list4 Example For the data set 1 3 6 7 10 12 14 15 22 120 the mean is 21
Mean absolute deviation A measure of variation in a set of numerical data computed by adding the distances between each data value and the mean then dividing by the number of data values Example For the data set 2 3 6 7 10 12 14 15 22 120 the mean absolute deviation is 20
Median A measure of center in a set of numerical data The median of a list of values is the value appearing at the center of a sorted version of the listmdashor the mean of the two central values if the list contains an even number of values Example For the data set 2 3 6 7 10 12 14 15 22 90 the median is 11
Midline In the graph of a trigonometric function the horizontal line halfway between its maximum and minimum values
Multiplication and division within 100 Multiplication or division of two whole numbers with whole number answers and with product or dividend in the range 0-100 Example 72 divide 8 = 9
Multiplicative inverses Two numbers whose product is 1 are multiplicative inverses of one another Example 34 and 43 are multiplicative inverses of one another because 34 times 43 = 43 times 34 = 1
Number line diagram A diagram of the number line used to represent numbers and support reasoning about them In a number line diagram for measurement quantities the interval from 0 to 1 on the diagram represents the unit of measure for the quantity
Percent rate of change A rate of change expressed as a percent Example if a population grows from 50 to 55 in a year it grows by 550 = 10 per year
Probability distribution The set of possible values of a random variable with a probability assigned to each
Properties of operations See Table 3 in this Glossary
Properties of equality See Table 4 in this Glossary
Properties of inequality See Table 5 in this Glossary
Properties of operations See Table 3 in this Glossary
52
Keansburg School DistrictCurriculum System
MathematicsProbability A number between 0 and 1 used to quantify likelihood for processes that have uncertain outcomes (such as tossing a coin selecting a person at random from a group of people tossing a ball at a target or testing for a medical condition)
Probability model A probability model is used to assign probabilities to outcomes of a chance process by examining the nature of the process The set of all outcomes is called the sample space and their probabilities sum to 1 See also uniform probability model
Random variable An assignment of a numerical value to each outcome in a sample space
Rational expression A quotient of two polynomials with a non-zero denominator
Rational number A number expressible in the form ab or ndash ab for some fraction ab The rational numbers include the integers
Rectilinear figure A polygon all angles of which are right angles
Rigid motion A transformation of points in space consisting of a sequence of one or more translations reflections andor rotations Rigid motions are here assumed to preserve distances and angle measures
Repeating decimal The decimal form of a rational number See also terminating decimal
Sample space In a probability model for a random process a list of the individual outcomes that are to be considered
Scatter plot A graph in the coordinate plane representing a set of bivariate data For example the heights and weights of a group of people could be displayed on a scatter plot5
Similarity transformation A rigid motion followed by a dilation
Tape diagram A drawing that looks like a segment of tape used to illustrate number relationships Also known as a strip diagram bar model fraction strip or length model
Terminating decimal A decimal is called terminating if its repeating digit is 0
Third quartile For a data set with median M the third quartile is the median of the data values greater than M Example For the data set 2 3 6 7 10 12 14 15 22 120 the third quartile is 15 See also median first quartile interquartile range
Transitivity principle for indirect measurement If the length of object A is greater than the length of object B and the length of object B is greater than the length of object C then the length of object A is greater than the length of object C This principle applies
53
Keansburg School DistrictCurriculum System
Mathematicsto measurement of other quantities as well
Uniform probability model A probability model which assigns equal probability to all outcomes See also probability model
Vector A quantity with magnitude and direction in the plane or in space defined by an ordered pair or triple of real numbers
Visual fraction model A tape diagram number line diagram or area model
Whole numbers The numbers 0 1 2 3 hellip5
54
- MissionVision Statement
- Beliefs
- Measurement amp Data
- Measure lengths and by iterating length units
- Tell and write time
- Represent and interpret data
- Geometry
- Reason with shapes and their attributes
- Number and Base Ten
- Extend the counting sequence
- Understand place value
-
- Measurement amp Data (II)
-
- Measure lengths and by iterating length units
- Tell and write time
-
- Represent and interpret data
- Geometry (II)
- Reason with shapes their attributes
-
- Number and Base Ten
- Use place value understanding and properties of operations to add and subtract
- Teacher will cover up specific numbers on an enlarged number grid using cover up tape to have students identify numbers before and after Students will come up and write the missing numbers
- Students will play ldquoI have__ Who has __ Teacher will create cards using index cards and numbers in which students need further practice with Students will read their cards aloud Variations of game can include identifying specific numbers identifying numbers more or less etc)
- Students will use base ten blocks to represent numbers including three digit numbers Students will identify representation of numbers through these manipulatives They may match the representation to the written number
- Students will write the number they created using the base ten blocks using their white boards and markers
- Students will arrange given digits to create the greatest and lowest possible numbers They can show each number they create using base ten blocks
- Students will use the Base Ten Exchange Game to show an understanding of exchanging ones for tens and tens for hundreds Students can use place value mats base ten blocks (cubes tens and flats) Students can take number of cubes displayed with roll of single die Students will determine when exchanging can be made when reaching ten units
- Base ten concentration wwwk-5mathteachingresourcescom
- Ten frame compare wwwk-5mathteachingresourcescom
-
Keansburg School DistrictCurriculum System
MathematicsKeansburg School DistrictCurriculum Management System
SubjectGradeLevelMathematicsGrade 1
Timeline January-Quarter 2
Topic(s) Number and Operations in Base Ten
Significance of Learning Goal(s) To recognize compare and understand numbers to 120
Sugg
este
d D
ays
of
Inst
ruct
ion Content
Standards CPI Essential
Questions
Specific Learning Objective(s)
The Students Will Be Able To
Suggested ActivitiesInstructional Tools Materials
Technology Resources Assessments and Assessment
Models
25
Keansburg School DistrictCurriculum System
MathematicsCPI 1NBT1 1NBT2A 1NBT2B 1NBT2C 1NBT3
EQ How do
numbers help us
How can sets of numbers be counted compared and ordered
How can I use numbers to solve problems
How would putting numbers on a chart make it easier to understand information
How can I make it easier to understand numbers when I sort them
What is place value
Concept(s) Recognize compare and understand numbers up to 120
SWBAT Recognize read write
and count 0-120 Understand that a two-
digit number represents amounts of tens and ones
Relate groups of ten to skip counting
Compare two two-digit numbers based on meanings of tens and ones digits using symbols ltgt and =
Meets Standard Teacher will cover up specific numbers
on an enlarged number grid using cover up tape to have students identify numbers before and after Students will come up and write the missing numbers
Students will play ldquoI have__ Who has __ Teacher will create cards using index cards and numbers in which students need further practice with Students will read their cards aloud Variations of game can include identifying specific numbers identifying numbers more or less etc)
Students will use base ten blocks to represent numbers including three digit numbers Students will identify representation of numbers through these manipulatives They may match the representation to the written number
Students will write the number they created using the base ten blocks using their white boards and markers
Students will arrange given digits to create the greatest and lowest possible numbers They can show each number they create using base ten blocks
Students will use the Base Ten Exchange Game to show an
Number grids ldquoI have Who hasrdquo index
cards base ten blocks white boards markers number cards dice ten frame base ten concentration
boards (k-5 math teaching resources)
double ten frame boards (k-5 math teaching resources)
Typical Assessment Question(s) or Task(s)
Recognize numbers 1-120 using flashcards
Write numbers 1-20 using block or graph paper
Build two-digit numbers using tens and ones blocks
Listen and note students skip counting orally by tens to 120
Students compare and label two numbers using relation symbols
26
Keansburg School DistrictCurriculum System
Mathematics Why is place
value important
How can I use place value to compare and order numbers
How can I use the number grid to help me with counting numbers
How many times do you think you can hop in one minute
What does number relationships mean
Why do we need to know how to add
Why do we need to know how to subtract
How are addition and subtraction related
What are doubles
How can
understanding of exchanging ones for tens and tens for hundreds Students can use place value mats base ten blocks (cubes tens and flats) Students can take number of cubes displayed with roll of single die Students will determine when exchanging can be made when reaching ten units
Teens on the ten frame wwwk-5mathteachingresourcescom
Base ten concentration wwwk-5mathteachingresourcescom
Ten frame compare wwwk-5mathteachingresourcescom
Exceeds Standard
Students will create riddles Irsquom thinking of a number that has 4 tens and 13 ones Have students solve the riddle by regrouping the ones to find the answer
-Students use hundreds chart to jump up and down from a number to show 10 more or 10 less
-Students will play Whatrsquos my Number by giving clues based on place value odd or even and number sense For example Irsquom a two digit number The digit in my tens place is 2 more than 4
27
Keansburg School DistrictCurriculum System
Mathematicsdouble facts help us to add and subtract
Does it matter what order you use to add three numbers Why or why not
The digit in my ones place is 3 less than 8 Whatrsquos my number
My double ten frame riddle wwwk-5mathteachingresourcescom
28
Keansburg School DistrictCurriculum System
MathematicsKeansburg School DistrictCurriculum Management System
SubjectGradeLevelMathematicsGrade 1
Timeline February-Quarter 3
Topic(s) Operations amp Algebraic Expressions
Significance of Learning Goal(s) To solve addition and subtraction problems
Sugg
este
d D
ays
of
Inst
ruct
ion Content
Standards CPI
Essential Questions
Specific Learning Objective(s)
The Students Will Be Able To
Suggested ActivitiesInstructional Tools Materials
Technology Resources Assessments and Assessment
Models
CPI1OA31OA4 1OA5 1OA6 1OA7 1OA81OA2
EQ What
questions can be answered using addition
What strategies can be used to solve problems
How can we
Concept(s) Solve addition with and subtraction problems
SWBAT Solve addition problems
with sums up to 20 Use addition within 20 to
solve word problems involving real life situations
Solve word problems that call for addition of three whole numbers up to 20
Solve subtraction problems with difference up to 20
Use subtraction within 20 to solve word problems involving real
Meets Standard Model and have students create their
own individual number sentence using manipulatives and label operation symbols
Students will choose a strategy to solve number stories such as objects fingers and pictures count onback number line or number grid
Create real life situations in which students will use a strategy to solve a number story and create a number model
Review addition and subtraction number stories posters stating each key word for addition and subtraction operations
Combine and mix two sets of 0-20 number cards One partner draws two number cards from the top of the deck students will design and generate a number story using the two numbers
Materials Manipulatives (examples
counting bears connecting cubes pennies counters etc)
Slates dry erase markers erasers
Clear Sheet Protectors Sets of 0-20 number cards Number cards Cardstock Scrabble tiles letter cards
Typical Assessment Question(s) or Task(s)
Students will solve real life
29
Keansburg School DistrictCurriculum System
Mathematicstell how many
How does knowing math facts make math easier
How can numbers be helpful
Why do I need to subtract
How do we use addition and subtraction in our everyday life
Why are fact families important
What strategies can be used to solve problems How is counting on different from just counting to add
What information do you need to know in order to find
life situations Understand subtraction
as an unknown addend problem example subtract 9-5 by finding the number that makes 9 when added to 5
Both partners solve the problem in the number story and write the answer on their slate
Find three cards that have a sum of 12 how many different ways can the student make the sum of 12 using three cards students record work
-Teacher creates real life word problemsinvolving three addends up to 20
Ten frames subtraction wwwk-5mathteachingresourcescom
I have who has wwwk-5mathteachingresourcescom
True or false wwwk-5mathteachingresourcescom
Count to 20 wwwk-5mathteachingresourcescom
Exceeds Standard
Teacher creates multi step word problems for students to solve
Students work with partners or small groups to create real life word problems Compose class book of problems
Three letter addends use scrabble tiles or letter cards with corresponding numbers to make three letter words find
word problems Students will create their
own number sentences own number storiesword problems
Students will create and solve number stories in cooperative learning groups
Students will generate word problems using assigned numbers
30
Keansburg School DistrictCurriculum System
Mathematicsthe total number of something
Why would you need to count back
How are subtraction and addition related
the sum of each word by adding the numbers on the tiles Students will find which words have the greatest or smallest sum
31
Keansburg School DistrictCurriculum System
MathematicsKeansburg School DistrictCurriculum Management System
SubjectGradeLevelMathematicsGrade 1
Timeline March-Quarter 3
Topic(s) Measurement amp Data
Significance of Learning Goal(s) To tell time and compare measurements
Sugg
este
d D
ays
of
Inst
ruct
ion Content
Standards CPI
Essential Questions
Specific Learning Objective(s)
The Students Will Be Able ToSuggested Activities
Instructional Tools Materials Technology Resources
Assessments and Assessment Models
How would I know if a bar graph correctly shows what is on a tally chart
How could a bar graph answer a question
Do bar graphs make it easier to understand and compare facts Why
What kind
Concept(s) Telling time comparing measurements
SWBAT Identify and write time to
the hour and half hour on both a digital and analog clock
Write time to the hour and half-hour on both digital and analog clocks
Draw the hands on the analog clock for a given time to the hour or half-hour
Relate times to the half hour as ldquohalf-pastrdquo the hour
Compare and contrast
Meets Standard Students will have their own
demonstration clocks students will identify and find the hour and minute hands
Students create their own clocks using paper plates students will manipulate hands to identify varying times
Students will listen to Jack Hartman ldquoTick Tockrdquo song
Teachers and students will view clock on videos on brainpopjrcom students and teachers can complete quizzes available on website
Teachers will present time on an analog clock students will write the digital time on a white board
Students will play clock concentration Teacher will introduce measurement by
holding up objects and the students will examine the objects and explain the size
Large Judy Clock Individual student Judy
clocks Wipe off analogdigital clocks Clock stampers Timers Rulers Yardsticks Measuring tapes Sheet protectors Cardstock Paper plates Fasteners Index cards
Typical Assessment Question(s) or Task(s)
Students will be asked to identify and write time to the hour and half hour on both
32
Keansburg School DistrictCurriculum System
Mathematicsof graph should I use to answer questions
Why do I need to tell time
How many hands does a clock have
Are the hands on the clock the same size
How long is a minute
Why do I need to use a calendar
How do we use the clock and the calendar to determine what we will do in school
Why do we need to measure something
What can
objects by length Construct objects at
contrasting lengths
ordero Students will break into groups
and compare objects further and classify them depending on their size
Teacher will introduce the ruler Explain to students that the ruler is used to measure objects The students will then explore the classroom and select objects around the room that are smaller and larger than the ruler
Teacher will select specific body parts that the students will use as a personal unit of measurement The students will work in pairs to demonstrate how to measure objects around the room using their personal unit of measurement
The teacher will select a classroom object and the students will be asked to illustrate objects in the room that are bigger and smaller in size
The students will be able to organize represent and interpret data up to three categories through the use of a bar graph
The teacher will then divide students into heterogeneous groups and encourage the students to explain what they can learn from the graph The students will present findings following activity
Students will choose an object within classroom then find additional objects one being larger the other being shorter using a two-column chart Draw or write the objects in the chart
digital and analog clocks Students will be asked to
identify the parts of a clock students will be asked to draw the hands on an analog clock for a given time to the hour or half-hour
Students will be given various objects and will further be asked to compare and contrast the lengths of these objects
Students will be asked to provide or create objects contrasting lengths to demonstrate understanding of differences in length
33
Keansburg School DistrictCurriculum System
Mathematicswe use to draw and measure things
What do you think is about 1 inch long
How many steps long do you think it is from the front of the classroom to the back
If we measure in footsteps why are some of the measurements different
How is longer and shorter similar to greater and lesser
Exceeds Standard
The students will work in pairs to locate objects around the room and compare the lengths against each other The pairs will then work with another pair of students and compare the lengths of their objects with the objects the other pair located
Teacher will introduce the ruler in comparison to the yardstick The students will be encouraged to find objects that in the room that are larger than a ruler and measure using the yardstick
After the teacher introduces units of personal measurement the students will be encouraged to measure object in the room using their own unit of personal measurement and convert it into a standard measurement using a ruler or a yardstick
The teacher will select a classroom object and the students will be asked to illustrate objects in the room that are bigger and smaller by a specific size
The students will be able to organize represent and interpret data up to four or more categories through the use of a bar graph
The teacher will then divide students into heterogeneous groups and encourage the students to explain what they can learn from the graph and create a tally chart utilizing the data
Students will create clock flash cards by
34
Keansburg School DistrictCurriculum System
Mathematicsdrawing an analog clock on one side and writing the digital clock time on the other Students will include time in five minute intervals
Pose word problems where students have to find elapse time to the hour and half hour
Introduce second hand and conduct activities that are timed in seconds (Examples hopping on 1 foot blinking eyes counting to the highest number)
35
Keansburg School DistrictCurriculum System
MathematicsKeansburg School DistrictCurriculum Management System
SubjectGradeLevelMathematicsGrade 1
Timeline April-Quarter 4
Topic(s) Geometry
Significance of Learning Goal(s) To identify two and three dimensional shapes to understand fractional parts and create equal shares
Sugg
este
d D
ays
of
Inst
ruct
ion Content
Standards CPI Essential
Questions
Specific Learning Objective(s)
The Students Will Be Able To
Suggested ActivitiesInstructional Tools Materials
Technology Resources Assessments and Assessment
Models
Are there different shapes outside
How are geometric figures alike
How can we sort objects of different shapes
How can shapes and solids be described compared and used to make other shapes
Concept(s) Two and three dimensional shapes fractional parts equal shares
SWBAT
Combine two-dimensional or three-dimensional shapes or figures to create a new composite shape and identify the shapes within
Identify fractional parts of circles and rectangles into equal shares while developing vocabulary for halves fourths and quarters
Describe the whole as
Meets Standard
Determine which shape by touch without using their sight
o Materials attribute blocks shape sheet feely box wwwilluminationsnctmorglessondetail
Sorting 3-dimensional objects students will be given cards with 3-dimensional objects (trash can soup can globe ball tissue box box dice) they will sort them based on the 3-dimensional shape they represent
o 3-dimensional object cards sorting mats
Pizza and Cake Fractions students will utilize a pizza and a cake to work on the concept of fractions while developing the vocabulary halves quarters and fourths
o Materials teacher created pizza
Attribute blocks Geometric shapes 3-dimensional object
cards Sorting maps 3-dimensional shapes Solid and lane figures Geo-boards and rubber
bands Fraction circles Sheet protectors 2-dimensional shapes
Typical Assessment Question(s) or Task(s)
Students will be asked to describe and identify
36
Keansburg School DistrictCurriculum System
MathematicsWhat are equal parts
What foods do you divide into equal parts
What other items might be divided
How do you know if you have an equal share
two of or four of the shares Understand for these examples that decomposing into more equal shares creates smaller shares
and cake that are cut into fractions (construction paper)
Students will illustrate a picture of a boat using at least one three dimensional shape in their drawings Shapes include cubes cylinders spheres cones and rectangular prisms
Solid and Plane Figures Name the Face activity Provide three-dimensional objects Have students draw the face for each object as well as name the shape Examples ABC block juice can book party hat
Introduce fractions by having students identify shapes that show equal parts Display cut out shapes using document camera Include some shapes that are divided equally and some that are not divided equally As a whole group sort shapes into two categories Then have students go back to their desks and work with a partner to classify additional shapes
Provide students with shapes that are divided into four parts Include shapes that are divided into four equal parts and others that are unequal Students identify the shapes that are divided into four equal parts and explain their reasoning
Shape Town activity Students will design a shape town using the following shapes
shapes within combined two and three-dimensional shapes
Students will be given circles and rectangles students will be asked to divide these shapes into halves fourths and quarters
Students will be asked to sort shapes that are divided equally and not divided equally
37
Keansburg School DistrictCurriculum System
Mathematicstrapezoid hexagon square triangle and circle Afterwards students will calculate the total number of each shape they included After completing the activity students will present their final product to the class and explain how they decided which shapes to use
Given an array of dots students will draw shapes with specific number of sides and corners and connect the dots to create the shapes Example Draw a shape with 5 sides Draw a shape with 6 corners
Students will create two-dimensional shapes on geoboards Then using different colored rubber bands students will divide the shapes into equal parts Students will transfer their equally divided shapes onto geoboard paper by drawing lines to show their equal parts
Play the Fraction Path Game Materials Fraction circles a circle with frac12 shaded a circle with 13 shaded and a circle with frac14 shaded Gameboard Path consisting of assorted shapes divided into halves thirds and fourths Players Needed 3 Directions Place the fraction circles facedown Players close their eyes and pick one fraction circle Each player follows the path from start to finish Each player looks at each shape on the path and records how many shapes show their fractions Players record
38
Keansburg School DistrictCurriculum System
Mathematicstheir results on paper using tally marks At end of game students compare total number of shapes that show their fraction
Exceeds Standard
39
Keansburg School DistrictCurriculum System
MathematicsKeansburg School DistrictCurriculum Management System
SubjectGradeLevelMathematicsGrade 1
Timeline May-Quarter 4
Topic(s) Number and Operations in Base Ten
Significance of Learning Goal(s) To use place value to add and subtract
Sugg
este
d D
ays
of
Inst
ruct
ion Content
Standards CPI Essential
Questions
Specific Learning Objective(s)
The Students Will Be Able ToSuggested Activities
Instructional Tools Materials Technology Resources
Assessments and Assessment Models
40
Keansburg School DistrictCurriculum System
MathematicsCPI 1NBT4 1NBT5 1NBT6
EQ How do
numbers help us
How can sets of numbers be counted compared and ordered
How can I use numbers to solve problems
How would putting numbers on a chart make it easier to understand information
How can I make it easier to understand numbers when I sort them
What is place value
Why is place value important
How can I
Concept(s) Use place value and properties of operations to add and subtract
SWBAT Use mental math to find
10 more or ten less than a given two-digit number and explain reasoning used within any number to 120
Use place value to add within 100 add a two-digit number to a one-digit number and add a two-digit number to a multiple of ten
Understand when adding two-digit numbers that ones add to the ones and tens add to the tens and sometimes it is necessary to compose a ten by regrouping
For all above objects students will use concrete models and strategies based on place value and relate the strategy to a written method and explain the reasoning used
Subtract multiples of 10 in the range 10-90 from multiples of 10 in the range 10-90 using
Meets Standard
Comparing two digit numbers wwwk-5mathteachingresourcescom
Subtraction split wwwk-5mathteachingresourcescom
Ten more wwwk-5mathteachingresourcescom
Addition split wwwk-5mathteachingresourcescom
Exceeds Standard
Comparing 3-Digit numbers wwwk-5mathteachingresourcescom
What number is wwwk-5mathteachingresourcescom
Students develop addition and subtraction number stories and have partners solve
Create pictures using basendash10 blocks Students trace picture onto paper label the base ten blocks with their value and add total
Solve number grid puzzles by adding and subtraction 10 on the number grid
Number cards Base 10 blocks Counters Number grid puzzles Sleeve protectors wwwk-
5mathteachingresourcescom
Dice
Typical Assessment Question(s) or Task(s)
Recognize numbers 1-120 using flashcards
Write numbers 1-20 using block or graph paper
Build two-digit numbers using tens and ones blocks
Listen and note students skip counting orally by tens to 120
Students compare and label two numbers using relation symbols
41
Keansburg School DistrictCurriculum System
Mathematics
42
Keansburg School DistrictCurriculum System
MathematicsKeansburg School DistrictCurriculum Management System
SubjectGradeLevelMathematicsGrade 1
Timeline June-Quarter 4
Topic(s) Readiness skills for September of Grade 2
Significance of Learning Goal(s) To compare larger numbers add fluently and apply measurement skills
Sugg
este
d D
ays
of
Inst
ruct
ion Content
Standards CPI Essential Questions
Specific Learning Objective(s)
The Students Will Be Able ToSuggested Activities
Instructional Tools Materials Technology Resources
Assessments and Assessment Models
CPI
EQ How can I use
place value to compare and
order numbers in the 100s
How can mastering basic addition and subtraction facts help me compute larger numbers
How can I tie in
Concept(s)Use place value to compare larger numbers fluently add up to 20 apply measurement skills
SWBAT Extend place value into
the hundreds place and re-write and construct models beyond the hundreds
Fluently add and subtract within 20 using mental strategies
Apply measurement skills
Meets Standard Place Value barrier game httpwwwk-
5mathteachingresourcescommath-gameshtml (place value only)
High card
httpwwwlearningboxcomBase10 BaseTenhtml
Time barrier game httpwwwk-5mathteachingresourcescomsupport-filestimebarriergamepdf httpwwwk-5mathteachingresourcescomsupport-filestimebarriergamegridpdf
My favorite time of day writing activity
number cards base ten blocks rulers tape measurer string number relationship mat paper plates cotton balls judy clock digital clock
Typical Assessment Question(s) or Task(s)
Students will solve addition and subtraction problems within 20 in a given time
43
Keansburg School DistrictCurriculum System
Mathematicsmeasurement skills with real life experiences
httpwwwk-5mathteachingresourcescomsupport-filesmy-favorite-time-of-daypdf
Estimating length httpwwwk-5mathteachingresourcescomsupport-filesestimatinglengthpdf
Olympic golf plastic golf clubs cotton balls and tape measurer
Olympic smiles measuring smiles with string and rulers
Olympic Frisbee using paper plates and tape measurer
Olympic airplane students will make paper airplanes measure the distance that they can throw their airplane
Doubles plus 1 game httpwwwk-5mathteachingresourcescomsupport-filesdoubles-plus-onepdf
Eleven more httpwwwk-5mathteachingresourcescomsupport-fileselevenmorepdf
frame Students will be asked to
measure items using inches and centimeters
Identify and create numbers with place values extending into the hundreds place
44
Keansburg School DistrictCurriculum System
Mathematics
Building numbers with base ten blocks pick three cards and arrange them to show a 3-digit number build that number with base ten blocks repeat with the same three cards until no new numbers can be made
Length strength inches httpwwwharcourtschoolcomactivitylength_strength1_inches
Length strength centimeters httpwwwharcourtschoolcomactivitylength_strength1_centi
Exceeds Standard
Number relationship mat wwwk-5mathteachingresourcescom
Place value barrier game httpwwwk-5mathteachingresourcescommath-gameshtml (integrate other skills into place values for example the digit in my 10s place is four doubled)
Measuring the mousersquos path httpwwwk-5mathteachingresourcescomsupport-filespaths1pdf
45
Keansburg School DistrictCurriculum System
Mathematics
Double minus 1 game httpwwwk-5mathteachingresourcescomsupport-filesdoubles-minus-onepdf
Number relationship mat httpwwwk-5mathteachingresourcescomsupport-filesnumberrelationshipmatpdf
46
Keansburg School DistrictCurriculum System
Mathematicsignment Matrices of Common Core State Standards
Grade Strand Standard Standard
Sept
embe
r ndash
Oct
ober
Nov
embe
r ndash
Dec
embe
r
Janu
ary
ndash Fe
brua
ry
Mar
ch ndash
Apr
il
May
- Ju
ne
1 OA 1
CC1OA1 Represent and solve problems involving addition and subtraction Use addition and subtraction within 20 to solve word problems involving situations of adding to taking from putting together taking apart and comparing with unknowns in all positions eg by using objects drawings and equations with a symbol for the unknown number to represent the problem
1 OA 2
CC1OA2 Represent and solve problems involving addition and subtraction Solve word problems that call for addition of three whole numbers whose sum is less than or equal to 20 eg by using objects drawings and equations with a symbol for the unknown number to represent the problem
1 OA 3
CC1OA3 Understand and apply properties of operations and the relationship between addition and subtraction Apply properties of operations as strategies to add and subtract Examples If 8 + 3 = 11 is known then 3 + 8 = 11 is also known (Commutative property of addition) To add 2 + 6 + 4 the second two numbers can be added to make a ten so 2 + 6 + 4 = 2 + 10 = 12 (Associative property of addition) (Students need not use formal terms for these properties)
1 OA 4
CC1OA4 Understand and apply properties of operations and the relationship between addition and subtraction Understand subtraction as an unknown-addend problem For example subtract 10 ndash 8 by finding the number that makes 10 when added to 8
1 OA 5 CC1OA5 Add and subtract within 20 Relate counting to addition and subtraction (eg by counting on 2 to add 2)
1 OA 6 CC1OA6 Add and subtract within 20 Add and subtract within 20 demonstrating fluency for addition and subtraction within 10 Use strategies such as counting on making ten (eg 8 + 6 = 8 + 2 + 4 = 10 + 4 = 14) decomposing a number leading to a ten (eg 13 ndash 4 = 13 ndash 3 ndash 1 = 10 ndash 1 = 9) using the relationship between addition and subtraction (eg knowing that 8 + 4
47
Keansburg School DistrictCurriculum System
Mathematics= 12 one knows 12 ndash 8 = 4) and creating equivalent but easier or known sums (eg adding 6 + 7 by creating the known equivalent 6 + 6 + 1 = 12 + 1 = 13)
1 OA 7
CC1OA7 Work with addition and subtraction equations Understand the meaning of the equal sign and determine if equations involving addition and subtraction are true or false For example which of the following equations are true and which are false 6 = 6 7 = 8 ndash 1 5 + 2 = 2 + 5 4 + 1 = 5 + 2
1 OA 8
CC1OA8 Work with addition and subtraction equations Determine the unknown whole number in an addition or subtraction equation relating three whole numbers For example determine the unknown number that makes the equation true in each of the equations 8 + = 11 5 = _ ndash 3 6 + 6 = _
1 NBT 1
CC1NBT1 Extend the counting sequence Count to 120 starting at any number less than 120 In this range read and write numerals and represent a number of objects with a written numeral
1 NBT 2
CC1NBT2 Understand place value Understand that the two digits of a two-digit number represent amounts of tens and ones Understand the following as special cases -- a 10 can be thought of as a bundle of ten ones mdash called a ldquotenrdquo -- b The numbers from 11 to 19 are composed of a ten and one two three four five six seven eight or nine ones -- c The numbers 10 20 30 40 50 60 70 80 90 refer to one two three four five six seven eight or nine tens (and 0 ones)
1 NBT 3
CC1NBT3 Understand place value Compare two two-digit numbers based on meanings of the tens and ones digits recording the results of comparisons with the symbols gt = and lt
1 NBT 4
CC1NBT4 Use place value understanding and properties of operations to add and subtract Add within 100 including adding a two-digit number and a one-digit number and adding a two-digit number and a multiple of 10 using concrete models or drawings and strategies based on place value properties of operations andor the relationship between addition and subtraction relate the strategy to a written method and explain the reasoning used Understand that in adding two-digit numbers one adds tens and tens ones and ones and sometimes it is necessary to compose a ten
1 NBT 5
CC1NBT5 Use place value understanding and properties of operations to add and subtract Given a two-digit number mentally find 10 more or 10 less than the number without having to count explain the reasoning used
1 NBT 6 CC1NBT6 Use place value understanding and properties of operations to add and subtract Subtract multiples of 10 in the range 10-90 from multiples of 10 in the range 10-90 (positive or zero differences) using concrete models or drawings and strategies based on place value properties of operations andor
48
Keansburg School DistrictCurriculum System
Mathematicsthe relationship between addition and subtraction relate the strategy to a written method and explain the reasoning used
1 MD 1
CC1MD1 Measure lengths indirectly and by iterating length units Order three objects by length compare the lengths of two objects indirectly by using a third object
1 MD 2
CC1MD2 Measure lengths indirectly and by iterating length units Express the length of an object as a whole number of length units by laying multiple copies of a shorter object (the length unit) end to end understand that the length measurement of an object is the number of same-size length units that span it with no gaps or overlaps Limit to contexts where the object being measured is spanned by a whole number of length units with no gaps or overlaps
1 MD 3CC1MD3 Tell and write time Tell and write time in hours and half-hours using analog and digital clocks
1 MD 4
CC1MD4 Represent and interpret data Organize represent and interpret data with up to three categories ask and answer questions about the total number of data points how many in each category and how many more or less are in one category than in another
1 G 1
CC1G1 Reason with shapes and their attributes Distinguish between defining attributes (eg triangles are closed and three-sided) versus non-defining attributes (eg color orientation overall size) for a wide variety of shapes build and draw shapes to possess defining attributes
1 G 2
CC1G2 Reason with shapes and their attributes Compose two-dimensional shapes (rectangles squares trapezoids triangles half-circles and quarter-circles) or three-dimensional shapes (cubes right rectangular prisms right circular cones and right circular cylinders) to create a composite shape and compose new shapes from the composite shape (Students do not need to learn formal names such as ldquoright rectangular prismrdquo)
1 G 3
CC1G3 Reason with shapes and their attributes Partition circles and rectangles into two and four equal shares describe the shares using the words halves fourths and quarters and use the phrases half of fourth of and quarter of Describe the whole as two of or four of the shares Understand for these examples that decomposing into more equal shares creates smaller shares
49
Keansburg School DistrictCurriculum System
Mathematics
Common Core State Standards Vocabulary
Addition and subtraction within 5 10 20 100 or 1000 Addition or subtraction of two whole numbers with whole number answers and with sum or minuend in the range 0-5 0-10 0-20 or 0-100 respectively Example 8 + 2 = 10 is an addition within 10 14 ndash 5 = 9 is a subtraction within 20 and 55 ndash 18 = 37 is a subtraction within 100
Additive inverses Two numbers whose sum is 0 are additive inverses of one another Example 34 and ndash 34 are additive inverses of one another because 34 + (ndash 34) = (ndash 34) + 34 = 0
Associative property of addition See Table 3 in this Glossary
Associative property of multiplication See Table 3 in this Glossary
Bivariate data Pairs of linked numerical observations Example a list of heights and weights for each player on a football team
Box plot A method of visually displaying a distribution of data values by using the median quartiles and extremes of the data set A box shows the middle 50 of the data1
Commutative property See Table 3 in this Glossary
Complex fraction A fraction AB where A andor B are fractions (B nonzero)
Computation algorithm A set of predefined steps applicable to a class of problems that gives the correct result in every case when the steps are carried out correctly See also computation strategy
Computation strategy Purposeful manipulations that may be chosen for specific problems may not have a fixed order and may be aimed at converting one problem into another See also computation algorithm
Congruent Two plane or solid figures are congruent if one can be obtained from the other by rigid motion (a sequence of rotations reflections and translations)
Counting on A strategy for finding the number of objects in a group without having to count every member of the group For example if a stack of books is known to have 8 books and 3 more books are added to the top it is not necessary to count the stack
50
Keansburg School DistrictCurriculum System
Mathematicsall over again One can find the total by counting onmdashpointing to the top book and saying ldquoeightrdquo following this with ldquonine ten eleven There are eleven books nowrdquo
Dot plot See line plot
Dilation A transformation that moves each point along the ray through the point emanating from a fixed center and multiplies distances from the center by a common scale factor
Expanded form A multi-digit number is expressed in expanded form when it is written as a sum of single-digit multiples of powers of ten For example 643 = 600 + 40 + 3
Expected value For a random variable the weighted average of its possible values with weights given by their respective probabilities
First quartile For a data set with median M the first quartile is the median of the data values less than M Example For the data set 1 3 6 7 10 12 14 15 22 120 the first quartile is 62 See also median third quartile interquartile range
Fraction A number expressible in the form ab where a is a whole number and b is a positive whole number (The word fraction in these standards always refers to a non-negative number) See also rational number
Identity property of 0 See Table 3 in this Glossary
Independently combined probability models Two probability models are said to be combined independently if the probability of each ordered pair in the combined model equals the product of the original probabilities of the two individual outcomes in the ordered pair
Integer A number expressible in the form a or ndasha for some whole number a
Interquartile Range A measure of variation in a set of numerical data the interquartile range is the distance between the first and third quartiles of the data set Example For the data set 1 3 6 7 10 12 14 15 22 120 the interquartile range is 15 ndash 6 = 9 See also first quartile third quartile
Line plot A method of visually displaying a distribution of data values where each data value is shown as a dot or mark above a number line Also known as a dot plot3
51
Keansburg School DistrictCurriculum System
MathematicsMean A measure of center in a set of numerical data computed by adding the values in a list and then dividing by the number of values in the list4 Example For the data set 1 3 6 7 10 12 14 15 22 120 the mean is 21
Mean absolute deviation A measure of variation in a set of numerical data computed by adding the distances between each data value and the mean then dividing by the number of data values Example For the data set 2 3 6 7 10 12 14 15 22 120 the mean absolute deviation is 20
Median A measure of center in a set of numerical data The median of a list of values is the value appearing at the center of a sorted version of the listmdashor the mean of the two central values if the list contains an even number of values Example For the data set 2 3 6 7 10 12 14 15 22 90 the median is 11
Midline In the graph of a trigonometric function the horizontal line halfway between its maximum and minimum values
Multiplication and division within 100 Multiplication or division of two whole numbers with whole number answers and with product or dividend in the range 0-100 Example 72 divide 8 = 9
Multiplicative inverses Two numbers whose product is 1 are multiplicative inverses of one another Example 34 and 43 are multiplicative inverses of one another because 34 times 43 = 43 times 34 = 1
Number line diagram A diagram of the number line used to represent numbers and support reasoning about them In a number line diagram for measurement quantities the interval from 0 to 1 on the diagram represents the unit of measure for the quantity
Percent rate of change A rate of change expressed as a percent Example if a population grows from 50 to 55 in a year it grows by 550 = 10 per year
Probability distribution The set of possible values of a random variable with a probability assigned to each
Properties of operations See Table 3 in this Glossary
Properties of equality See Table 4 in this Glossary
Properties of inequality See Table 5 in this Glossary
Properties of operations See Table 3 in this Glossary
52
Keansburg School DistrictCurriculum System
MathematicsProbability A number between 0 and 1 used to quantify likelihood for processes that have uncertain outcomes (such as tossing a coin selecting a person at random from a group of people tossing a ball at a target or testing for a medical condition)
Probability model A probability model is used to assign probabilities to outcomes of a chance process by examining the nature of the process The set of all outcomes is called the sample space and their probabilities sum to 1 See also uniform probability model
Random variable An assignment of a numerical value to each outcome in a sample space
Rational expression A quotient of two polynomials with a non-zero denominator
Rational number A number expressible in the form ab or ndash ab for some fraction ab The rational numbers include the integers
Rectilinear figure A polygon all angles of which are right angles
Rigid motion A transformation of points in space consisting of a sequence of one or more translations reflections andor rotations Rigid motions are here assumed to preserve distances and angle measures
Repeating decimal The decimal form of a rational number See also terminating decimal
Sample space In a probability model for a random process a list of the individual outcomes that are to be considered
Scatter plot A graph in the coordinate plane representing a set of bivariate data For example the heights and weights of a group of people could be displayed on a scatter plot5
Similarity transformation A rigid motion followed by a dilation
Tape diagram A drawing that looks like a segment of tape used to illustrate number relationships Also known as a strip diagram bar model fraction strip or length model
Terminating decimal A decimal is called terminating if its repeating digit is 0
Third quartile For a data set with median M the third quartile is the median of the data values greater than M Example For the data set 2 3 6 7 10 12 14 15 22 120 the third quartile is 15 See also median first quartile interquartile range
Transitivity principle for indirect measurement If the length of object A is greater than the length of object B and the length of object B is greater than the length of object C then the length of object A is greater than the length of object C This principle applies
53
Keansburg School DistrictCurriculum System
Mathematicsto measurement of other quantities as well
Uniform probability model A probability model which assigns equal probability to all outcomes See also probability model
Vector A quantity with magnitude and direction in the plane or in space defined by an ordered pair or triple of real numbers
Visual fraction model A tape diagram number line diagram or area model
Whole numbers The numbers 0 1 2 3 hellip5
54
- MissionVision Statement
- Beliefs
- Measurement amp Data
- Measure lengths and by iterating length units
- Tell and write time
- Represent and interpret data
- Geometry
- Reason with shapes and their attributes
- Number and Base Ten
- Extend the counting sequence
- Understand place value
-
- Measurement amp Data (II)
-
- Measure lengths and by iterating length units
- Tell and write time
-
- Represent and interpret data
- Geometry (II)
- Reason with shapes their attributes
-
- Number and Base Ten
- Use place value understanding and properties of operations to add and subtract
- Teacher will cover up specific numbers on an enlarged number grid using cover up tape to have students identify numbers before and after Students will come up and write the missing numbers
- Students will play ldquoI have__ Who has __ Teacher will create cards using index cards and numbers in which students need further practice with Students will read their cards aloud Variations of game can include identifying specific numbers identifying numbers more or less etc)
- Students will use base ten blocks to represent numbers including three digit numbers Students will identify representation of numbers through these manipulatives They may match the representation to the written number
- Students will write the number they created using the base ten blocks using their white boards and markers
- Students will arrange given digits to create the greatest and lowest possible numbers They can show each number they create using base ten blocks
- Students will use the Base Ten Exchange Game to show an understanding of exchanging ones for tens and tens for hundreds Students can use place value mats base ten blocks (cubes tens and flats) Students can take number of cubes displayed with roll of single die Students will determine when exchanging can be made when reaching ten units
- Base ten concentration wwwk-5mathteachingresourcescom
- Ten frame compare wwwk-5mathteachingresourcescom
-
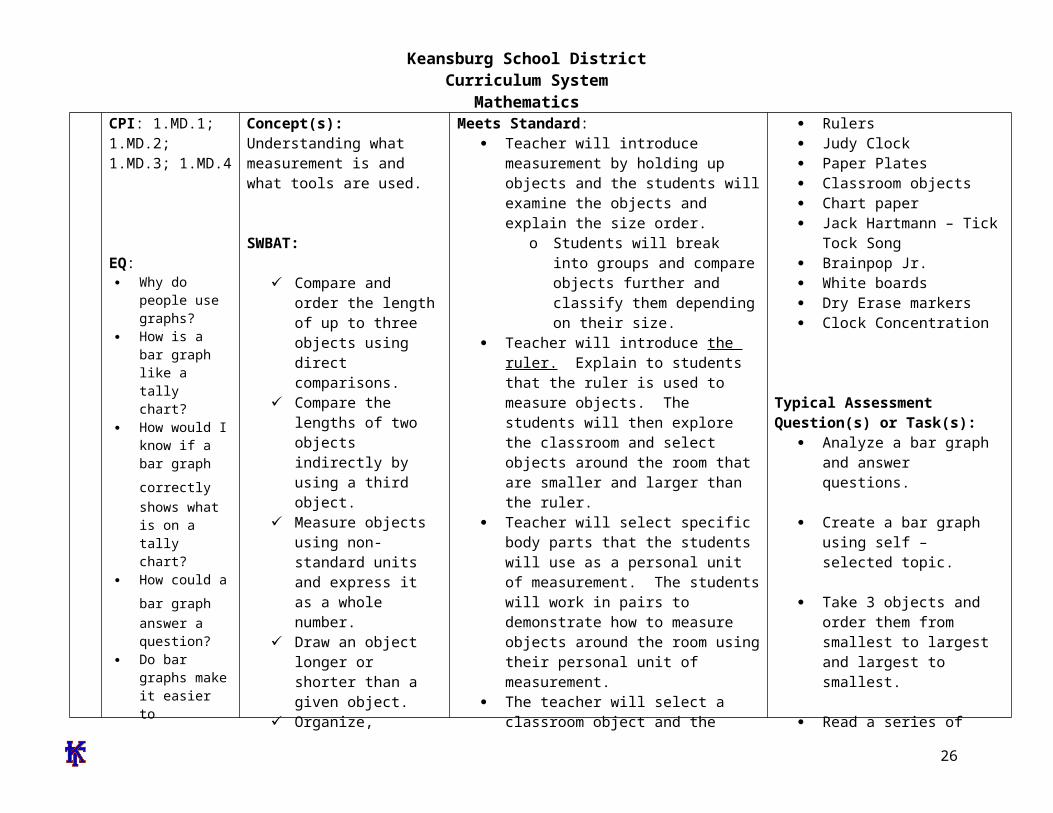
Keansburg School DistrictCurriculum System
Mathematics Why is place
value important
How can I use place value to compare and order numbers
How can I use the number grid to help me with counting numbers
How many times do you think you can hop in one minute
What does number relationships mean
Why do we need to know how to add
Why do we need to know how to subtract
How are addition and subtraction related
What are doubles
How can
understanding of exchanging ones for tens and tens for hundreds Students can use place value mats base ten blocks (cubes tens and flats) Students can take number of cubes displayed with roll of single die Students will determine when exchanging can be made when reaching ten units
Teens on the ten frame wwwk-5mathteachingresourcescom
Base ten concentration wwwk-5mathteachingresourcescom
Ten frame compare wwwk-5mathteachingresourcescom
Exceeds Standard
Students will create riddles Irsquom thinking of a number that has 4 tens and 13 ones Have students solve the riddle by regrouping the ones to find the answer
-Students use hundreds chart to jump up and down from a number to show 10 more or 10 less
-Students will play Whatrsquos my Number by giving clues based on place value odd or even and number sense For example Irsquom a two digit number The digit in my tens place is 2 more than 4
27
Keansburg School DistrictCurriculum System
Mathematicsdouble facts help us to add and subtract
Does it matter what order you use to add three numbers Why or why not
The digit in my ones place is 3 less than 8 Whatrsquos my number
My double ten frame riddle wwwk-5mathteachingresourcescom
28
Keansburg School DistrictCurriculum System
MathematicsKeansburg School DistrictCurriculum Management System
SubjectGradeLevelMathematicsGrade 1
Timeline February-Quarter 3
Topic(s) Operations amp Algebraic Expressions
Significance of Learning Goal(s) To solve addition and subtraction problems
Sugg
este
d D
ays
of
Inst
ruct
ion Content
Standards CPI
Essential Questions
Specific Learning Objective(s)
The Students Will Be Able To
Suggested ActivitiesInstructional Tools Materials
Technology Resources Assessments and Assessment
Models
CPI1OA31OA4 1OA5 1OA6 1OA7 1OA81OA2
EQ What
questions can be answered using addition
What strategies can be used to solve problems
How can we
Concept(s) Solve addition with and subtraction problems
SWBAT Solve addition problems
with sums up to 20 Use addition within 20 to
solve word problems involving real life situations
Solve word problems that call for addition of three whole numbers up to 20
Solve subtraction problems with difference up to 20
Use subtraction within 20 to solve word problems involving real
Meets Standard Model and have students create their
own individual number sentence using manipulatives and label operation symbols
Students will choose a strategy to solve number stories such as objects fingers and pictures count onback number line or number grid
Create real life situations in which students will use a strategy to solve a number story and create a number model
Review addition and subtraction number stories posters stating each key word for addition and subtraction operations
Combine and mix two sets of 0-20 number cards One partner draws two number cards from the top of the deck students will design and generate a number story using the two numbers
Materials Manipulatives (examples
counting bears connecting cubes pennies counters etc)
Slates dry erase markers erasers
Clear Sheet Protectors Sets of 0-20 number cards Number cards Cardstock Scrabble tiles letter cards
Typical Assessment Question(s) or Task(s)
Students will solve real life
29
Keansburg School DistrictCurriculum System
Mathematicstell how many
How does knowing math facts make math easier
How can numbers be helpful
Why do I need to subtract
How do we use addition and subtraction in our everyday life
Why are fact families important
What strategies can be used to solve problems How is counting on different from just counting to add
What information do you need to know in order to find
life situations Understand subtraction
as an unknown addend problem example subtract 9-5 by finding the number that makes 9 when added to 5
Both partners solve the problem in the number story and write the answer on their slate
Find three cards that have a sum of 12 how many different ways can the student make the sum of 12 using three cards students record work
-Teacher creates real life word problemsinvolving three addends up to 20
Ten frames subtraction wwwk-5mathteachingresourcescom
I have who has wwwk-5mathteachingresourcescom
True or false wwwk-5mathteachingresourcescom
Count to 20 wwwk-5mathteachingresourcescom
Exceeds Standard
Teacher creates multi step word problems for students to solve
Students work with partners or small groups to create real life word problems Compose class book of problems
Three letter addends use scrabble tiles or letter cards with corresponding numbers to make three letter words find
word problems Students will create their
own number sentences own number storiesword problems
Students will create and solve number stories in cooperative learning groups
Students will generate word problems using assigned numbers
30
Keansburg School DistrictCurriculum System
Mathematicsthe total number of something
Why would you need to count back
How are subtraction and addition related
the sum of each word by adding the numbers on the tiles Students will find which words have the greatest or smallest sum
31
Keansburg School DistrictCurriculum System
MathematicsKeansburg School DistrictCurriculum Management System
SubjectGradeLevelMathematicsGrade 1
Timeline March-Quarter 3
Topic(s) Measurement amp Data
Significance of Learning Goal(s) To tell time and compare measurements
Sugg
este
d D
ays
of
Inst
ruct
ion Content
Standards CPI
Essential Questions
Specific Learning Objective(s)
The Students Will Be Able ToSuggested Activities
Instructional Tools Materials Technology Resources
Assessments and Assessment Models
How would I know if a bar graph correctly shows what is on a tally chart
How could a bar graph answer a question
Do bar graphs make it easier to understand and compare facts Why
What kind
Concept(s) Telling time comparing measurements
SWBAT Identify and write time to
the hour and half hour on both a digital and analog clock
Write time to the hour and half-hour on both digital and analog clocks
Draw the hands on the analog clock for a given time to the hour or half-hour
Relate times to the half hour as ldquohalf-pastrdquo the hour
Compare and contrast
Meets Standard Students will have their own
demonstration clocks students will identify and find the hour and minute hands
Students create their own clocks using paper plates students will manipulate hands to identify varying times
Students will listen to Jack Hartman ldquoTick Tockrdquo song
Teachers and students will view clock on videos on brainpopjrcom students and teachers can complete quizzes available on website
Teachers will present time on an analog clock students will write the digital time on a white board
Students will play clock concentration Teacher will introduce measurement by
holding up objects and the students will examine the objects and explain the size
Large Judy Clock Individual student Judy
clocks Wipe off analogdigital clocks Clock stampers Timers Rulers Yardsticks Measuring tapes Sheet protectors Cardstock Paper plates Fasteners Index cards
Typical Assessment Question(s) or Task(s)
Students will be asked to identify and write time to the hour and half hour on both
32
Keansburg School DistrictCurriculum System
Mathematicsof graph should I use to answer questions
Why do I need to tell time
How many hands does a clock have
Are the hands on the clock the same size
How long is a minute
Why do I need to use a calendar
How do we use the clock and the calendar to determine what we will do in school
Why do we need to measure something
What can
objects by length Construct objects at
contrasting lengths
ordero Students will break into groups
and compare objects further and classify them depending on their size
Teacher will introduce the ruler Explain to students that the ruler is used to measure objects The students will then explore the classroom and select objects around the room that are smaller and larger than the ruler
Teacher will select specific body parts that the students will use as a personal unit of measurement The students will work in pairs to demonstrate how to measure objects around the room using their personal unit of measurement
The teacher will select a classroom object and the students will be asked to illustrate objects in the room that are bigger and smaller in size
The students will be able to organize represent and interpret data up to three categories through the use of a bar graph
The teacher will then divide students into heterogeneous groups and encourage the students to explain what they can learn from the graph The students will present findings following activity
Students will choose an object within classroom then find additional objects one being larger the other being shorter using a two-column chart Draw or write the objects in the chart
digital and analog clocks Students will be asked to
identify the parts of a clock students will be asked to draw the hands on an analog clock for a given time to the hour or half-hour
Students will be given various objects and will further be asked to compare and contrast the lengths of these objects
Students will be asked to provide or create objects contrasting lengths to demonstrate understanding of differences in length
33
Keansburg School DistrictCurriculum System
Mathematicswe use to draw and measure things
What do you think is about 1 inch long
How many steps long do you think it is from the front of the classroom to the back
If we measure in footsteps why are some of the measurements different
How is longer and shorter similar to greater and lesser
Exceeds Standard
The students will work in pairs to locate objects around the room and compare the lengths against each other The pairs will then work with another pair of students and compare the lengths of their objects with the objects the other pair located
Teacher will introduce the ruler in comparison to the yardstick The students will be encouraged to find objects that in the room that are larger than a ruler and measure using the yardstick
After the teacher introduces units of personal measurement the students will be encouraged to measure object in the room using their own unit of personal measurement and convert it into a standard measurement using a ruler or a yardstick
The teacher will select a classroom object and the students will be asked to illustrate objects in the room that are bigger and smaller by a specific size
The students will be able to organize represent and interpret data up to four or more categories through the use of a bar graph
The teacher will then divide students into heterogeneous groups and encourage the students to explain what they can learn from the graph and create a tally chart utilizing the data
Students will create clock flash cards by
34
Keansburg School DistrictCurriculum System
Mathematicsdrawing an analog clock on one side and writing the digital clock time on the other Students will include time in five minute intervals
Pose word problems where students have to find elapse time to the hour and half hour
Introduce second hand and conduct activities that are timed in seconds (Examples hopping on 1 foot blinking eyes counting to the highest number)
35
Keansburg School DistrictCurriculum System
MathematicsKeansburg School DistrictCurriculum Management System
SubjectGradeLevelMathematicsGrade 1
Timeline April-Quarter 4
Topic(s) Geometry
Significance of Learning Goal(s) To identify two and three dimensional shapes to understand fractional parts and create equal shares
Sugg
este
d D
ays
of
Inst
ruct
ion Content
Standards CPI Essential
Questions
Specific Learning Objective(s)
The Students Will Be Able To
Suggested ActivitiesInstructional Tools Materials
Technology Resources Assessments and Assessment
Models
Are there different shapes outside
How are geometric figures alike
How can we sort objects of different shapes
How can shapes and solids be described compared and used to make other shapes
Concept(s) Two and three dimensional shapes fractional parts equal shares
SWBAT
Combine two-dimensional or three-dimensional shapes or figures to create a new composite shape and identify the shapes within
Identify fractional parts of circles and rectangles into equal shares while developing vocabulary for halves fourths and quarters
Describe the whole as
Meets Standard
Determine which shape by touch without using their sight
o Materials attribute blocks shape sheet feely box wwwilluminationsnctmorglessondetail
Sorting 3-dimensional objects students will be given cards with 3-dimensional objects (trash can soup can globe ball tissue box box dice) they will sort them based on the 3-dimensional shape they represent
o 3-dimensional object cards sorting mats
Pizza and Cake Fractions students will utilize a pizza and a cake to work on the concept of fractions while developing the vocabulary halves quarters and fourths
o Materials teacher created pizza
Attribute blocks Geometric shapes 3-dimensional object
cards Sorting maps 3-dimensional shapes Solid and lane figures Geo-boards and rubber
bands Fraction circles Sheet protectors 2-dimensional shapes
Typical Assessment Question(s) or Task(s)
Students will be asked to describe and identify
36
Keansburg School DistrictCurriculum System
MathematicsWhat are equal parts
What foods do you divide into equal parts
What other items might be divided
How do you know if you have an equal share
two of or four of the shares Understand for these examples that decomposing into more equal shares creates smaller shares
and cake that are cut into fractions (construction paper)
Students will illustrate a picture of a boat using at least one three dimensional shape in their drawings Shapes include cubes cylinders spheres cones and rectangular prisms
Solid and Plane Figures Name the Face activity Provide three-dimensional objects Have students draw the face for each object as well as name the shape Examples ABC block juice can book party hat
Introduce fractions by having students identify shapes that show equal parts Display cut out shapes using document camera Include some shapes that are divided equally and some that are not divided equally As a whole group sort shapes into two categories Then have students go back to their desks and work with a partner to classify additional shapes
Provide students with shapes that are divided into four parts Include shapes that are divided into four equal parts and others that are unequal Students identify the shapes that are divided into four equal parts and explain their reasoning
Shape Town activity Students will design a shape town using the following shapes
shapes within combined two and three-dimensional shapes
Students will be given circles and rectangles students will be asked to divide these shapes into halves fourths and quarters
Students will be asked to sort shapes that are divided equally and not divided equally
37
Keansburg School DistrictCurriculum System
Mathematicstrapezoid hexagon square triangle and circle Afterwards students will calculate the total number of each shape they included After completing the activity students will present their final product to the class and explain how they decided which shapes to use
Given an array of dots students will draw shapes with specific number of sides and corners and connect the dots to create the shapes Example Draw a shape with 5 sides Draw a shape with 6 corners
Students will create two-dimensional shapes on geoboards Then using different colored rubber bands students will divide the shapes into equal parts Students will transfer their equally divided shapes onto geoboard paper by drawing lines to show their equal parts
Play the Fraction Path Game Materials Fraction circles a circle with frac12 shaded a circle with 13 shaded and a circle with frac14 shaded Gameboard Path consisting of assorted shapes divided into halves thirds and fourths Players Needed 3 Directions Place the fraction circles facedown Players close their eyes and pick one fraction circle Each player follows the path from start to finish Each player looks at each shape on the path and records how many shapes show their fractions Players record
38
Keansburg School DistrictCurriculum System
Mathematicstheir results on paper using tally marks At end of game students compare total number of shapes that show their fraction
Exceeds Standard
39
Keansburg School DistrictCurriculum System
MathematicsKeansburg School DistrictCurriculum Management System
SubjectGradeLevelMathematicsGrade 1
Timeline May-Quarter 4
Topic(s) Number and Operations in Base Ten
Significance of Learning Goal(s) To use place value to add and subtract
Sugg
este
d D
ays
of
Inst
ruct
ion Content
Standards CPI Essential
Questions
Specific Learning Objective(s)
The Students Will Be Able ToSuggested Activities
Instructional Tools Materials Technology Resources
Assessments and Assessment Models
40
Keansburg School DistrictCurriculum System
MathematicsCPI 1NBT4 1NBT5 1NBT6
EQ How do
numbers help us
How can sets of numbers be counted compared and ordered
How can I use numbers to solve problems
How would putting numbers on a chart make it easier to understand information
How can I make it easier to understand numbers when I sort them
What is place value
Why is place value important
How can I
Concept(s) Use place value and properties of operations to add and subtract
SWBAT Use mental math to find
10 more or ten less than a given two-digit number and explain reasoning used within any number to 120
Use place value to add within 100 add a two-digit number to a one-digit number and add a two-digit number to a multiple of ten
Understand when adding two-digit numbers that ones add to the ones and tens add to the tens and sometimes it is necessary to compose a ten by regrouping
For all above objects students will use concrete models and strategies based on place value and relate the strategy to a written method and explain the reasoning used
Subtract multiples of 10 in the range 10-90 from multiples of 10 in the range 10-90 using
Meets Standard
Comparing two digit numbers wwwk-5mathteachingresourcescom
Subtraction split wwwk-5mathteachingresourcescom
Ten more wwwk-5mathteachingresourcescom
Addition split wwwk-5mathteachingresourcescom
Exceeds Standard
Comparing 3-Digit numbers wwwk-5mathteachingresourcescom
What number is wwwk-5mathteachingresourcescom
Students develop addition and subtraction number stories and have partners solve
Create pictures using basendash10 blocks Students trace picture onto paper label the base ten blocks with their value and add total
Solve number grid puzzles by adding and subtraction 10 on the number grid
Number cards Base 10 blocks Counters Number grid puzzles Sleeve protectors wwwk-
5mathteachingresourcescom
Dice
Typical Assessment Question(s) or Task(s)
Recognize numbers 1-120 using flashcards
Write numbers 1-20 using block or graph paper
Build two-digit numbers using tens and ones blocks
Listen and note students skip counting orally by tens to 120
Students compare and label two numbers using relation symbols
41
Keansburg School DistrictCurriculum System
Mathematics
42
Keansburg School DistrictCurriculum System
MathematicsKeansburg School DistrictCurriculum Management System
SubjectGradeLevelMathematicsGrade 1
Timeline June-Quarter 4
Topic(s) Readiness skills for September of Grade 2
Significance of Learning Goal(s) To compare larger numbers add fluently and apply measurement skills
Sugg
este
d D
ays
of
Inst
ruct
ion Content
Standards CPI Essential Questions
Specific Learning Objective(s)
The Students Will Be Able ToSuggested Activities
Instructional Tools Materials Technology Resources
Assessments and Assessment Models
CPI
EQ How can I use
place value to compare and
order numbers in the 100s
How can mastering basic addition and subtraction facts help me compute larger numbers
How can I tie in
Concept(s)Use place value to compare larger numbers fluently add up to 20 apply measurement skills
SWBAT Extend place value into
the hundreds place and re-write and construct models beyond the hundreds
Fluently add and subtract within 20 using mental strategies
Apply measurement skills
Meets Standard Place Value barrier game httpwwwk-
5mathteachingresourcescommath-gameshtml (place value only)
High card
httpwwwlearningboxcomBase10 BaseTenhtml
Time barrier game httpwwwk-5mathteachingresourcescomsupport-filestimebarriergamepdf httpwwwk-5mathteachingresourcescomsupport-filestimebarriergamegridpdf
My favorite time of day writing activity
number cards base ten blocks rulers tape measurer string number relationship mat paper plates cotton balls judy clock digital clock
Typical Assessment Question(s) or Task(s)
Students will solve addition and subtraction problems within 20 in a given time
43
Keansburg School DistrictCurriculum System
Mathematicsmeasurement skills with real life experiences
httpwwwk-5mathteachingresourcescomsupport-filesmy-favorite-time-of-daypdf
Estimating length httpwwwk-5mathteachingresourcescomsupport-filesestimatinglengthpdf
Olympic golf plastic golf clubs cotton balls and tape measurer
Olympic smiles measuring smiles with string and rulers
Olympic Frisbee using paper plates and tape measurer
Olympic airplane students will make paper airplanes measure the distance that they can throw their airplane
Doubles plus 1 game httpwwwk-5mathteachingresourcescomsupport-filesdoubles-plus-onepdf
Eleven more httpwwwk-5mathteachingresourcescomsupport-fileselevenmorepdf
frame Students will be asked to
measure items using inches and centimeters
Identify and create numbers with place values extending into the hundreds place
44
Keansburg School DistrictCurriculum System
Mathematics
Building numbers with base ten blocks pick three cards and arrange them to show a 3-digit number build that number with base ten blocks repeat with the same three cards until no new numbers can be made
Length strength inches httpwwwharcourtschoolcomactivitylength_strength1_inches
Length strength centimeters httpwwwharcourtschoolcomactivitylength_strength1_centi
Exceeds Standard
Number relationship mat wwwk-5mathteachingresourcescom
Place value barrier game httpwwwk-5mathteachingresourcescommath-gameshtml (integrate other skills into place values for example the digit in my 10s place is four doubled)
Measuring the mousersquos path httpwwwk-5mathteachingresourcescomsupport-filespaths1pdf
45
Keansburg School DistrictCurriculum System
Mathematics
Double minus 1 game httpwwwk-5mathteachingresourcescomsupport-filesdoubles-minus-onepdf
Number relationship mat httpwwwk-5mathteachingresourcescomsupport-filesnumberrelationshipmatpdf
46
Keansburg School DistrictCurriculum System
Mathematicsignment Matrices of Common Core State Standards
Grade Strand Standard Standard
Sept
embe
r ndash
Oct
ober
Nov
embe
r ndash
Dec
embe
r
Janu
ary
ndash Fe
brua
ry
Mar
ch ndash
Apr
il
May
- Ju
ne
1 OA 1
CC1OA1 Represent and solve problems involving addition and subtraction Use addition and subtraction within 20 to solve word problems involving situations of adding to taking from putting together taking apart and comparing with unknowns in all positions eg by using objects drawings and equations with a symbol for the unknown number to represent the problem
1 OA 2
CC1OA2 Represent and solve problems involving addition and subtraction Solve word problems that call for addition of three whole numbers whose sum is less than or equal to 20 eg by using objects drawings and equations with a symbol for the unknown number to represent the problem
1 OA 3
CC1OA3 Understand and apply properties of operations and the relationship between addition and subtraction Apply properties of operations as strategies to add and subtract Examples If 8 + 3 = 11 is known then 3 + 8 = 11 is also known (Commutative property of addition) To add 2 + 6 + 4 the second two numbers can be added to make a ten so 2 + 6 + 4 = 2 + 10 = 12 (Associative property of addition) (Students need not use formal terms for these properties)
1 OA 4
CC1OA4 Understand and apply properties of operations and the relationship between addition and subtraction Understand subtraction as an unknown-addend problem For example subtract 10 ndash 8 by finding the number that makes 10 when added to 8
1 OA 5 CC1OA5 Add and subtract within 20 Relate counting to addition and subtraction (eg by counting on 2 to add 2)
1 OA 6 CC1OA6 Add and subtract within 20 Add and subtract within 20 demonstrating fluency for addition and subtraction within 10 Use strategies such as counting on making ten (eg 8 + 6 = 8 + 2 + 4 = 10 + 4 = 14) decomposing a number leading to a ten (eg 13 ndash 4 = 13 ndash 3 ndash 1 = 10 ndash 1 = 9) using the relationship between addition and subtraction (eg knowing that 8 + 4
47
Keansburg School DistrictCurriculum System
Mathematics= 12 one knows 12 ndash 8 = 4) and creating equivalent but easier or known sums (eg adding 6 + 7 by creating the known equivalent 6 + 6 + 1 = 12 + 1 = 13)
1 OA 7
CC1OA7 Work with addition and subtraction equations Understand the meaning of the equal sign and determine if equations involving addition and subtraction are true or false For example which of the following equations are true and which are false 6 = 6 7 = 8 ndash 1 5 + 2 = 2 + 5 4 + 1 = 5 + 2
1 OA 8
CC1OA8 Work with addition and subtraction equations Determine the unknown whole number in an addition or subtraction equation relating three whole numbers For example determine the unknown number that makes the equation true in each of the equations 8 + = 11 5 = _ ndash 3 6 + 6 = _
1 NBT 1
CC1NBT1 Extend the counting sequence Count to 120 starting at any number less than 120 In this range read and write numerals and represent a number of objects with a written numeral
1 NBT 2
CC1NBT2 Understand place value Understand that the two digits of a two-digit number represent amounts of tens and ones Understand the following as special cases -- a 10 can be thought of as a bundle of ten ones mdash called a ldquotenrdquo -- b The numbers from 11 to 19 are composed of a ten and one two three four five six seven eight or nine ones -- c The numbers 10 20 30 40 50 60 70 80 90 refer to one two three four five six seven eight or nine tens (and 0 ones)
1 NBT 3
CC1NBT3 Understand place value Compare two two-digit numbers based on meanings of the tens and ones digits recording the results of comparisons with the symbols gt = and lt
1 NBT 4
CC1NBT4 Use place value understanding and properties of operations to add and subtract Add within 100 including adding a two-digit number and a one-digit number and adding a two-digit number and a multiple of 10 using concrete models or drawings and strategies based on place value properties of operations andor the relationship between addition and subtraction relate the strategy to a written method and explain the reasoning used Understand that in adding two-digit numbers one adds tens and tens ones and ones and sometimes it is necessary to compose a ten
1 NBT 5
CC1NBT5 Use place value understanding and properties of operations to add and subtract Given a two-digit number mentally find 10 more or 10 less than the number without having to count explain the reasoning used
1 NBT 6 CC1NBT6 Use place value understanding and properties of operations to add and subtract Subtract multiples of 10 in the range 10-90 from multiples of 10 in the range 10-90 (positive or zero differences) using concrete models or drawings and strategies based on place value properties of operations andor
48
Keansburg School DistrictCurriculum System
Mathematicsthe relationship between addition and subtraction relate the strategy to a written method and explain the reasoning used
1 MD 1
CC1MD1 Measure lengths indirectly and by iterating length units Order three objects by length compare the lengths of two objects indirectly by using a third object
1 MD 2
CC1MD2 Measure lengths indirectly and by iterating length units Express the length of an object as a whole number of length units by laying multiple copies of a shorter object (the length unit) end to end understand that the length measurement of an object is the number of same-size length units that span it with no gaps or overlaps Limit to contexts where the object being measured is spanned by a whole number of length units with no gaps or overlaps
1 MD 3CC1MD3 Tell and write time Tell and write time in hours and half-hours using analog and digital clocks
1 MD 4
CC1MD4 Represent and interpret data Organize represent and interpret data with up to three categories ask and answer questions about the total number of data points how many in each category and how many more or less are in one category than in another
1 G 1
CC1G1 Reason with shapes and their attributes Distinguish between defining attributes (eg triangles are closed and three-sided) versus non-defining attributes (eg color orientation overall size) for a wide variety of shapes build and draw shapes to possess defining attributes
1 G 2
CC1G2 Reason with shapes and their attributes Compose two-dimensional shapes (rectangles squares trapezoids triangles half-circles and quarter-circles) or three-dimensional shapes (cubes right rectangular prisms right circular cones and right circular cylinders) to create a composite shape and compose new shapes from the composite shape (Students do not need to learn formal names such as ldquoright rectangular prismrdquo)
1 G 3
CC1G3 Reason with shapes and their attributes Partition circles and rectangles into two and four equal shares describe the shares using the words halves fourths and quarters and use the phrases half of fourth of and quarter of Describe the whole as two of or four of the shares Understand for these examples that decomposing into more equal shares creates smaller shares
49
Keansburg School DistrictCurriculum System
Mathematics
Common Core State Standards Vocabulary
Addition and subtraction within 5 10 20 100 or 1000 Addition or subtraction of two whole numbers with whole number answers and with sum or minuend in the range 0-5 0-10 0-20 or 0-100 respectively Example 8 + 2 = 10 is an addition within 10 14 ndash 5 = 9 is a subtraction within 20 and 55 ndash 18 = 37 is a subtraction within 100
Additive inverses Two numbers whose sum is 0 are additive inverses of one another Example 34 and ndash 34 are additive inverses of one another because 34 + (ndash 34) = (ndash 34) + 34 = 0
Associative property of addition See Table 3 in this Glossary
Associative property of multiplication See Table 3 in this Glossary
Bivariate data Pairs of linked numerical observations Example a list of heights and weights for each player on a football team
Box plot A method of visually displaying a distribution of data values by using the median quartiles and extremes of the data set A box shows the middle 50 of the data1
Commutative property See Table 3 in this Glossary
Complex fraction A fraction AB where A andor B are fractions (B nonzero)
Computation algorithm A set of predefined steps applicable to a class of problems that gives the correct result in every case when the steps are carried out correctly See also computation strategy
Computation strategy Purposeful manipulations that may be chosen for specific problems may not have a fixed order and may be aimed at converting one problem into another See also computation algorithm
Congruent Two plane or solid figures are congruent if one can be obtained from the other by rigid motion (a sequence of rotations reflections and translations)
Counting on A strategy for finding the number of objects in a group without having to count every member of the group For example if a stack of books is known to have 8 books and 3 more books are added to the top it is not necessary to count the stack
50
Keansburg School DistrictCurriculum System
Mathematicsall over again One can find the total by counting onmdashpointing to the top book and saying ldquoeightrdquo following this with ldquonine ten eleven There are eleven books nowrdquo
Dot plot See line plot
Dilation A transformation that moves each point along the ray through the point emanating from a fixed center and multiplies distances from the center by a common scale factor
Expanded form A multi-digit number is expressed in expanded form when it is written as a sum of single-digit multiples of powers of ten For example 643 = 600 + 40 + 3
Expected value For a random variable the weighted average of its possible values with weights given by their respective probabilities
First quartile For a data set with median M the first quartile is the median of the data values less than M Example For the data set 1 3 6 7 10 12 14 15 22 120 the first quartile is 62 See also median third quartile interquartile range
Fraction A number expressible in the form ab where a is a whole number and b is a positive whole number (The word fraction in these standards always refers to a non-negative number) See also rational number
Identity property of 0 See Table 3 in this Glossary
Independently combined probability models Two probability models are said to be combined independently if the probability of each ordered pair in the combined model equals the product of the original probabilities of the two individual outcomes in the ordered pair
Integer A number expressible in the form a or ndasha for some whole number a
Interquartile Range A measure of variation in a set of numerical data the interquartile range is the distance between the first and third quartiles of the data set Example For the data set 1 3 6 7 10 12 14 15 22 120 the interquartile range is 15 ndash 6 = 9 See also first quartile third quartile
Line plot A method of visually displaying a distribution of data values where each data value is shown as a dot or mark above a number line Also known as a dot plot3
51
Keansburg School DistrictCurriculum System
MathematicsMean A measure of center in a set of numerical data computed by adding the values in a list and then dividing by the number of values in the list4 Example For the data set 1 3 6 7 10 12 14 15 22 120 the mean is 21
Mean absolute deviation A measure of variation in a set of numerical data computed by adding the distances between each data value and the mean then dividing by the number of data values Example For the data set 2 3 6 7 10 12 14 15 22 120 the mean absolute deviation is 20
Median A measure of center in a set of numerical data The median of a list of values is the value appearing at the center of a sorted version of the listmdashor the mean of the two central values if the list contains an even number of values Example For the data set 2 3 6 7 10 12 14 15 22 90 the median is 11
Midline In the graph of a trigonometric function the horizontal line halfway between its maximum and minimum values
Multiplication and division within 100 Multiplication or division of two whole numbers with whole number answers and with product or dividend in the range 0-100 Example 72 divide 8 = 9
Multiplicative inverses Two numbers whose product is 1 are multiplicative inverses of one another Example 34 and 43 are multiplicative inverses of one another because 34 times 43 = 43 times 34 = 1
Number line diagram A diagram of the number line used to represent numbers and support reasoning about them In a number line diagram for measurement quantities the interval from 0 to 1 on the diagram represents the unit of measure for the quantity
Percent rate of change A rate of change expressed as a percent Example if a population grows from 50 to 55 in a year it grows by 550 = 10 per year
Probability distribution The set of possible values of a random variable with a probability assigned to each
Properties of operations See Table 3 in this Glossary
Properties of equality See Table 4 in this Glossary
Properties of inequality See Table 5 in this Glossary
Properties of operations See Table 3 in this Glossary
52
Keansburg School DistrictCurriculum System
MathematicsProbability A number between 0 and 1 used to quantify likelihood for processes that have uncertain outcomes (such as tossing a coin selecting a person at random from a group of people tossing a ball at a target or testing for a medical condition)
Probability model A probability model is used to assign probabilities to outcomes of a chance process by examining the nature of the process The set of all outcomes is called the sample space and their probabilities sum to 1 See also uniform probability model
Random variable An assignment of a numerical value to each outcome in a sample space
Rational expression A quotient of two polynomials with a non-zero denominator
Rational number A number expressible in the form ab or ndash ab for some fraction ab The rational numbers include the integers
Rectilinear figure A polygon all angles of which are right angles
Rigid motion A transformation of points in space consisting of a sequence of one or more translations reflections andor rotations Rigid motions are here assumed to preserve distances and angle measures
Repeating decimal The decimal form of a rational number See also terminating decimal
Sample space In a probability model for a random process a list of the individual outcomes that are to be considered
Scatter plot A graph in the coordinate plane representing a set of bivariate data For example the heights and weights of a group of people could be displayed on a scatter plot5
Similarity transformation A rigid motion followed by a dilation
Tape diagram A drawing that looks like a segment of tape used to illustrate number relationships Also known as a strip diagram bar model fraction strip or length model
Terminating decimal A decimal is called terminating if its repeating digit is 0
Third quartile For a data set with median M the third quartile is the median of the data values greater than M Example For the data set 2 3 6 7 10 12 14 15 22 120 the third quartile is 15 See also median first quartile interquartile range
Transitivity principle for indirect measurement If the length of object A is greater than the length of object B and the length of object B is greater than the length of object C then the length of object A is greater than the length of object C This principle applies
53
Keansburg School DistrictCurriculum System
Mathematicsto measurement of other quantities as well
Uniform probability model A probability model which assigns equal probability to all outcomes See also probability model
Vector A quantity with magnitude and direction in the plane or in space defined by an ordered pair or triple of real numbers
Visual fraction model A tape diagram number line diagram or area model
Whole numbers The numbers 0 1 2 3 hellip5
54
- MissionVision Statement
- Beliefs
- Measurement amp Data
- Measure lengths and by iterating length units
- Tell and write time
- Represent and interpret data
- Geometry
- Reason with shapes and their attributes
- Number and Base Ten
- Extend the counting sequence
- Understand place value
-
- Measurement amp Data (II)
-
- Measure lengths and by iterating length units
- Tell and write time
-
- Represent and interpret data
- Geometry (II)
- Reason with shapes their attributes
-
- Number and Base Ten
- Use place value understanding and properties of operations to add and subtract
- Teacher will cover up specific numbers on an enlarged number grid using cover up tape to have students identify numbers before and after Students will come up and write the missing numbers
- Students will play ldquoI have__ Who has __ Teacher will create cards using index cards and numbers in which students need further practice with Students will read their cards aloud Variations of game can include identifying specific numbers identifying numbers more or less etc)
- Students will use base ten blocks to represent numbers including three digit numbers Students will identify representation of numbers through these manipulatives They may match the representation to the written number
- Students will write the number they created using the base ten blocks using their white boards and markers
- Students will arrange given digits to create the greatest and lowest possible numbers They can show each number they create using base ten blocks
- Students will use the Base Ten Exchange Game to show an understanding of exchanging ones for tens and tens for hundreds Students can use place value mats base ten blocks (cubes tens and flats) Students can take number of cubes displayed with roll of single die Students will determine when exchanging can be made when reaching ten units
- Base ten concentration wwwk-5mathteachingresourcescom
- Ten frame compare wwwk-5mathteachingresourcescom
-
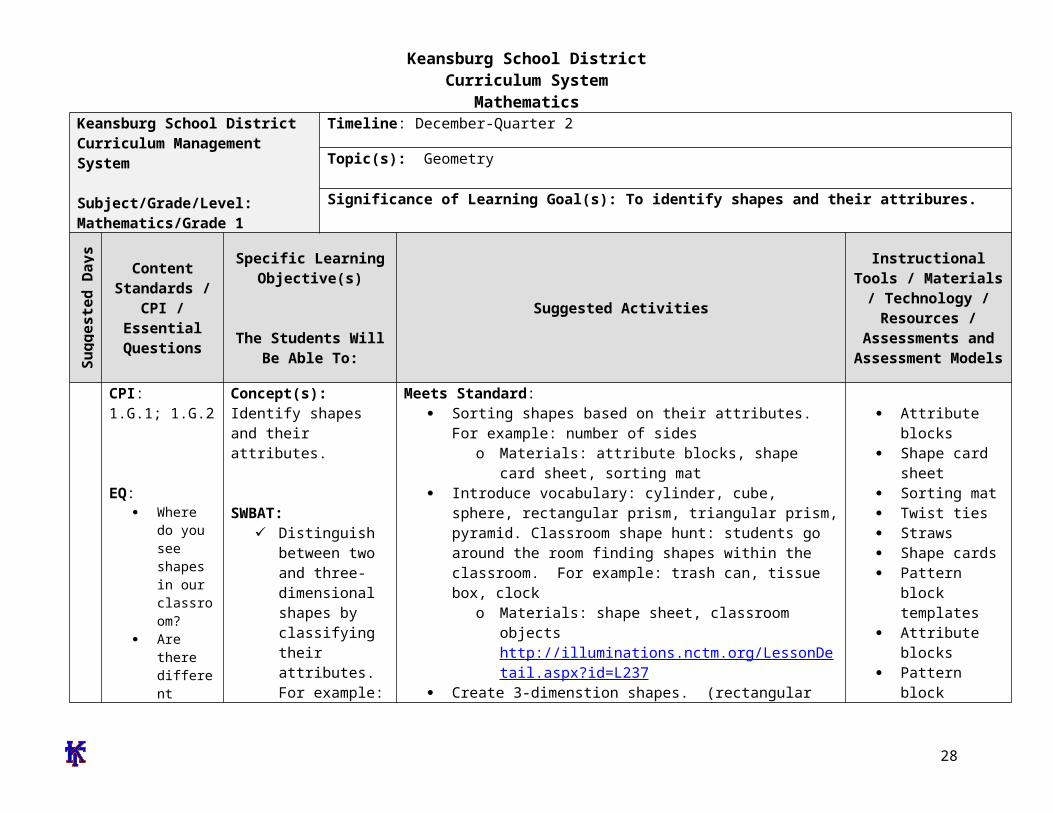
Keansburg School DistrictCurriculum System
Mathematicsdouble facts help us to add and subtract
Does it matter what order you use to add three numbers Why or why not
The digit in my ones place is 3 less than 8 Whatrsquos my number
My double ten frame riddle wwwk-5mathteachingresourcescom
28
Keansburg School DistrictCurriculum System
MathematicsKeansburg School DistrictCurriculum Management System
SubjectGradeLevelMathematicsGrade 1
Timeline February-Quarter 3
Topic(s) Operations amp Algebraic Expressions
Significance of Learning Goal(s) To solve addition and subtraction problems
Sugg
este
d D
ays
of
Inst
ruct
ion Content
Standards CPI
Essential Questions
Specific Learning Objective(s)
The Students Will Be Able To
Suggested ActivitiesInstructional Tools Materials
Technology Resources Assessments and Assessment
Models
CPI1OA31OA4 1OA5 1OA6 1OA7 1OA81OA2
EQ What
questions can be answered using addition
What strategies can be used to solve problems
How can we
Concept(s) Solve addition with and subtraction problems
SWBAT Solve addition problems
with sums up to 20 Use addition within 20 to
solve word problems involving real life situations
Solve word problems that call for addition of three whole numbers up to 20
Solve subtraction problems with difference up to 20
Use subtraction within 20 to solve word problems involving real
Meets Standard Model and have students create their
own individual number sentence using manipulatives and label operation symbols
Students will choose a strategy to solve number stories such as objects fingers and pictures count onback number line or number grid
Create real life situations in which students will use a strategy to solve a number story and create a number model
Review addition and subtraction number stories posters stating each key word for addition and subtraction operations
Combine and mix two sets of 0-20 number cards One partner draws two number cards from the top of the deck students will design and generate a number story using the two numbers
Materials Manipulatives (examples
counting bears connecting cubes pennies counters etc)
Slates dry erase markers erasers
Clear Sheet Protectors Sets of 0-20 number cards Number cards Cardstock Scrabble tiles letter cards
Typical Assessment Question(s) or Task(s)
Students will solve real life
29
Keansburg School DistrictCurriculum System
Mathematicstell how many
How does knowing math facts make math easier
How can numbers be helpful
Why do I need to subtract
How do we use addition and subtraction in our everyday life
Why are fact families important
What strategies can be used to solve problems How is counting on different from just counting to add
What information do you need to know in order to find
life situations Understand subtraction
as an unknown addend problem example subtract 9-5 by finding the number that makes 9 when added to 5
Both partners solve the problem in the number story and write the answer on their slate
Find three cards that have a sum of 12 how many different ways can the student make the sum of 12 using three cards students record work
-Teacher creates real life word problemsinvolving three addends up to 20
Ten frames subtraction wwwk-5mathteachingresourcescom
I have who has wwwk-5mathteachingresourcescom
True or false wwwk-5mathteachingresourcescom
Count to 20 wwwk-5mathteachingresourcescom
Exceeds Standard
Teacher creates multi step word problems for students to solve
Students work with partners or small groups to create real life word problems Compose class book of problems
Three letter addends use scrabble tiles or letter cards with corresponding numbers to make three letter words find
word problems Students will create their
own number sentences own number storiesword problems
Students will create and solve number stories in cooperative learning groups
Students will generate word problems using assigned numbers
30
Keansburg School DistrictCurriculum System
Mathematicsthe total number of something
Why would you need to count back
How are subtraction and addition related
the sum of each word by adding the numbers on the tiles Students will find which words have the greatest or smallest sum
31
Keansburg School DistrictCurriculum System
MathematicsKeansburg School DistrictCurriculum Management System
SubjectGradeLevelMathematicsGrade 1
Timeline March-Quarter 3
Topic(s) Measurement amp Data
Significance of Learning Goal(s) To tell time and compare measurements
Sugg
este
d D
ays
of
Inst
ruct
ion Content
Standards CPI
Essential Questions
Specific Learning Objective(s)
The Students Will Be Able ToSuggested Activities
Instructional Tools Materials Technology Resources
Assessments and Assessment Models
How would I know if a bar graph correctly shows what is on a tally chart
How could a bar graph answer a question
Do bar graphs make it easier to understand and compare facts Why
What kind
Concept(s) Telling time comparing measurements
SWBAT Identify and write time to
the hour and half hour on both a digital and analog clock
Write time to the hour and half-hour on both digital and analog clocks
Draw the hands on the analog clock for a given time to the hour or half-hour
Relate times to the half hour as ldquohalf-pastrdquo the hour
Compare and contrast
Meets Standard Students will have their own
demonstration clocks students will identify and find the hour and minute hands
Students create their own clocks using paper plates students will manipulate hands to identify varying times
Students will listen to Jack Hartman ldquoTick Tockrdquo song
Teachers and students will view clock on videos on brainpopjrcom students and teachers can complete quizzes available on website
Teachers will present time on an analog clock students will write the digital time on a white board
Students will play clock concentration Teacher will introduce measurement by
holding up objects and the students will examine the objects and explain the size
Large Judy Clock Individual student Judy
clocks Wipe off analogdigital clocks Clock stampers Timers Rulers Yardsticks Measuring tapes Sheet protectors Cardstock Paper plates Fasteners Index cards
Typical Assessment Question(s) or Task(s)
Students will be asked to identify and write time to the hour and half hour on both
32
Keansburg School DistrictCurriculum System
Mathematicsof graph should I use to answer questions
Why do I need to tell time
How many hands does a clock have
Are the hands on the clock the same size
How long is a minute
Why do I need to use a calendar
How do we use the clock and the calendar to determine what we will do in school
Why do we need to measure something
What can
objects by length Construct objects at
contrasting lengths
ordero Students will break into groups
and compare objects further and classify them depending on their size
Teacher will introduce the ruler Explain to students that the ruler is used to measure objects The students will then explore the classroom and select objects around the room that are smaller and larger than the ruler
Teacher will select specific body parts that the students will use as a personal unit of measurement The students will work in pairs to demonstrate how to measure objects around the room using their personal unit of measurement
The teacher will select a classroom object and the students will be asked to illustrate objects in the room that are bigger and smaller in size
The students will be able to organize represent and interpret data up to three categories through the use of a bar graph
The teacher will then divide students into heterogeneous groups and encourage the students to explain what they can learn from the graph The students will present findings following activity
Students will choose an object within classroom then find additional objects one being larger the other being shorter using a two-column chart Draw or write the objects in the chart
digital and analog clocks Students will be asked to
identify the parts of a clock students will be asked to draw the hands on an analog clock for a given time to the hour or half-hour
Students will be given various objects and will further be asked to compare and contrast the lengths of these objects
Students will be asked to provide or create objects contrasting lengths to demonstrate understanding of differences in length
33
Keansburg School DistrictCurriculum System
Mathematicswe use to draw and measure things
What do you think is about 1 inch long
How many steps long do you think it is from the front of the classroom to the back
If we measure in footsteps why are some of the measurements different
How is longer and shorter similar to greater and lesser
Exceeds Standard
The students will work in pairs to locate objects around the room and compare the lengths against each other The pairs will then work with another pair of students and compare the lengths of their objects with the objects the other pair located
Teacher will introduce the ruler in comparison to the yardstick The students will be encouraged to find objects that in the room that are larger than a ruler and measure using the yardstick
After the teacher introduces units of personal measurement the students will be encouraged to measure object in the room using their own unit of personal measurement and convert it into a standard measurement using a ruler or a yardstick
The teacher will select a classroom object and the students will be asked to illustrate objects in the room that are bigger and smaller by a specific size
The students will be able to organize represent and interpret data up to four or more categories through the use of a bar graph
The teacher will then divide students into heterogeneous groups and encourage the students to explain what they can learn from the graph and create a tally chart utilizing the data
Students will create clock flash cards by
34
Keansburg School DistrictCurriculum System
Mathematicsdrawing an analog clock on one side and writing the digital clock time on the other Students will include time in five minute intervals
Pose word problems where students have to find elapse time to the hour and half hour
Introduce second hand and conduct activities that are timed in seconds (Examples hopping on 1 foot blinking eyes counting to the highest number)
35
Keansburg School DistrictCurriculum System
MathematicsKeansburg School DistrictCurriculum Management System
SubjectGradeLevelMathematicsGrade 1
Timeline April-Quarter 4
Topic(s) Geometry
Significance of Learning Goal(s) To identify two and three dimensional shapes to understand fractional parts and create equal shares
Sugg
este
d D
ays
of
Inst
ruct
ion Content
Standards CPI Essential
Questions
Specific Learning Objective(s)
The Students Will Be Able To
Suggested ActivitiesInstructional Tools Materials
Technology Resources Assessments and Assessment
Models
Are there different shapes outside
How are geometric figures alike
How can we sort objects of different shapes
How can shapes and solids be described compared and used to make other shapes
Concept(s) Two and three dimensional shapes fractional parts equal shares
SWBAT
Combine two-dimensional or three-dimensional shapes or figures to create a new composite shape and identify the shapes within
Identify fractional parts of circles and rectangles into equal shares while developing vocabulary for halves fourths and quarters
Describe the whole as
Meets Standard
Determine which shape by touch without using their sight
o Materials attribute blocks shape sheet feely box wwwilluminationsnctmorglessondetail
Sorting 3-dimensional objects students will be given cards with 3-dimensional objects (trash can soup can globe ball tissue box box dice) they will sort them based on the 3-dimensional shape they represent
o 3-dimensional object cards sorting mats
Pizza and Cake Fractions students will utilize a pizza and a cake to work on the concept of fractions while developing the vocabulary halves quarters and fourths
o Materials teacher created pizza
Attribute blocks Geometric shapes 3-dimensional object
cards Sorting maps 3-dimensional shapes Solid and lane figures Geo-boards and rubber
bands Fraction circles Sheet protectors 2-dimensional shapes
Typical Assessment Question(s) or Task(s)
Students will be asked to describe and identify
36
Keansburg School DistrictCurriculum System
MathematicsWhat are equal parts
What foods do you divide into equal parts
What other items might be divided
How do you know if you have an equal share
two of or four of the shares Understand for these examples that decomposing into more equal shares creates smaller shares
and cake that are cut into fractions (construction paper)
Students will illustrate a picture of a boat using at least one three dimensional shape in their drawings Shapes include cubes cylinders spheres cones and rectangular prisms
Solid and Plane Figures Name the Face activity Provide three-dimensional objects Have students draw the face for each object as well as name the shape Examples ABC block juice can book party hat
Introduce fractions by having students identify shapes that show equal parts Display cut out shapes using document camera Include some shapes that are divided equally and some that are not divided equally As a whole group sort shapes into two categories Then have students go back to their desks and work with a partner to classify additional shapes
Provide students with shapes that are divided into four parts Include shapes that are divided into four equal parts and others that are unequal Students identify the shapes that are divided into four equal parts and explain their reasoning
Shape Town activity Students will design a shape town using the following shapes
shapes within combined two and three-dimensional shapes
Students will be given circles and rectangles students will be asked to divide these shapes into halves fourths and quarters
Students will be asked to sort shapes that are divided equally and not divided equally
37
Keansburg School DistrictCurriculum System
Mathematicstrapezoid hexagon square triangle and circle Afterwards students will calculate the total number of each shape they included After completing the activity students will present their final product to the class and explain how they decided which shapes to use
Given an array of dots students will draw shapes with specific number of sides and corners and connect the dots to create the shapes Example Draw a shape with 5 sides Draw a shape with 6 corners
Students will create two-dimensional shapes on geoboards Then using different colored rubber bands students will divide the shapes into equal parts Students will transfer their equally divided shapes onto geoboard paper by drawing lines to show their equal parts
Play the Fraction Path Game Materials Fraction circles a circle with frac12 shaded a circle with 13 shaded and a circle with frac14 shaded Gameboard Path consisting of assorted shapes divided into halves thirds and fourths Players Needed 3 Directions Place the fraction circles facedown Players close their eyes and pick one fraction circle Each player follows the path from start to finish Each player looks at each shape on the path and records how many shapes show their fractions Players record
38
Keansburg School DistrictCurriculum System
Mathematicstheir results on paper using tally marks At end of game students compare total number of shapes that show their fraction
Exceeds Standard
39
Keansburg School DistrictCurriculum System
MathematicsKeansburg School DistrictCurriculum Management System
SubjectGradeLevelMathematicsGrade 1
Timeline May-Quarter 4
Topic(s) Number and Operations in Base Ten
Significance of Learning Goal(s) To use place value to add and subtract
Sugg
este
d D
ays
of
Inst
ruct
ion Content
Standards CPI Essential
Questions
Specific Learning Objective(s)
The Students Will Be Able ToSuggested Activities
Instructional Tools Materials Technology Resources
Assessments and Assessment Models
40
Keansburg School DistrictCurriculum System
MathematicsCPI 1NBT4 1NBT5 1NBT6
EQ How do
numbers help us
How can sets of numbers be counted compared and ordered
How can I use numbers to solve problems
How would putting numbers on a chart make it easier to understand information
How can I make it easier to understand numbers when I sort them
What is place value
Why is place value important
How can I
Concept(s) Use place value and properties of operations to add and subtract
SWBAT Use mental math to find
10 more or ten less than a given two-digit number and explain reasoning used within any number to 120
Use place value to add within 100 add a two-digit number to a one-digit number and add a two-digit number to a multiple of ten
Understand when adding two-digit numbers that ones add to the ones and tens add to the tens and sometimes it is necessary to compose a ten by regrouping
For all above objects students will use concrete models and strategies based on place value and relate the strategy to a written method and explain the reasoning used
Subtract multiples of 10 in the range 10-90 from multiples of 10 in the range 10-90 using
Meets Standard
Comparing two digit numbers wwwk-5mathteachingresourcescom
Subtraction split wwwk-5mathteachingresourcescom
Ten more wwwk-5mathteachingresourcescom
Addition split wwwk-5mathteachingresourcescom
Exceeds Standard
Comparing 3-Digit numbers wwwk-5mathteachingresourcescom
What number is wwwk-5mathteachingresourcescom
Students develop addition and subtraction number stories and have partners solve
Create pictures using basendash10 blocks Students trace picture onto paper label the base ten blocks with their value and add total
Solve number grid puzzles by adding and subtraction 10 on the number grid
Number cards Base 10 blocks Counters Number grid puzzles Sleeve protectors wwwk-
5mathteachingresourcescom
Dice
Typical Assessment Question(s) or Task(s)
Recognize numbers 1-120 using flashcards
Write numbers 1-20 using block or graph paper
Build two-digit numbers using tens and ones blocks
Listen and note students skip counting orally by tens to 120
Students compare and label two numbers using relation symbols
41
Keansburg School DistrictCurriculum System
Mathematics
42
Keansburg School DistrictCurriculum System
MathematicsKeansburg School DistrictCurriculum Management System
SubjectGradeLevelMathematicsGrade 1
Timeline June-Quarter 4
Topic(s) Readiness skills for September of Grade 2
Significance of Learning Goal(s) To compare larger numbers add fluently and apply measurement skills
Sugg
este
d D
ays
of
Inst
ruct
ion Content
Standards CPI Essential Questions
Specific Learning Objective(s)
The Students Will Be Able ToSuggested Activities
Instructional Tools Materials Technology Resources
Assessments and Assessment Models
CPI
EQ How can I use
place value to compare and
order numbers in the 100s
How can mastering basic addition and subtraction facts help me compute larger numbers
How can I tie in
Concept(s)Use place value to compare larger numbers fluently add up to 20 apply measurement skills
SWBAT Extend place value into
the hundreds place and re-write and construct models beyond the hundreds
Fluently add and subtract within 20 using mental strategies
Apply measurement skills
Meets Standard Place Value barrier game httpwwwk-
5mathteachingresourcescommath-gameshtml (place value only)
High card
httpwwwlearningboxcomBase10 BaseTenhtml
Time barrier game httpwwwk-5mathteachingresourcescomsupport-filestimebarriergamepdf httpwwwk-5mathteachingresourcescomsupport-filestimebarriergamegridpdf
My favorite time of day writing activity
number cards base ten blocks rulers tape measurer string number relationship mat paper plates cotton balls judy clock digital clock
Typical Assessment Question(s) or Task(s)
Students will solve addition and subtraction problems within 20 in a given time
43
Keansburg School DistrictCurriculum System
Mathematicsmeasurement skills with real life experiences
httpwwwk-5mathteachingresourcescomsupport-filesmy-favorite-time-of-daypdf
Estimating length httpwwwk-5mathteachingresourcescomsupport-filesestimatinglengthpdf
Olympic golf plastic golf clubs cotton balls and tape measurer
Olympic smiles measuring smiles with string and rulers
Olympic Frisbee using paper plates and tape measurer
Olympic airplane students will make paper airplanes measure the distance that they can throw their airplane
Doubles plus 1 game httpwwwk-5mathteachingresourcescomsupport-filesdoubles-plus-onepdf
Eleven more httpwwwk-5mathteachingresourcescomsupport-fileselevenmorepdf
frame Students will be asked to
measure items using inches and centimeters
Identify and create numbers with place values extending into the hundreds place
44
Keansburg School DistrictCurriculum System
Mathematics
Building numbers with base ten blocks pick three cards and arrange them to show a 3-digit number build that number with base ten blocks repeat with the same three cards until no new numbers can be made
Length strength inches httpwwwharcourtschoolcomactivitylength_strength1_inches
Length strength centimeters httpwwwharcourtschoolcomactivitylength_strength1_centi
Exceeds Standard
Number relationship mat wwwk-5mathteachingresourcescom
Place value barrier game httpwwwk-5mathteachingresourcescommath-gameshtml (integrate other skills into place values for example the digit in my 10s place is four doubled)
Measuring the mousersquos path httpwwwk-5mathteachingresourcescomsupport-filespaths1pdf
45
Keansburg School DistrictCurriculum System
Mathematics
Double minus 1 game httpwwwk-5mathteachingresourcescomsupport-filesdoubles-minus-onepdf
Number relationship mat httpwwwk-5mathteachingresourcescomsupport-filesnumberrelationshipmatpdf
46
Keansburg School DistrictCurriculum System
Mathematicsignment Matrices of Common Core State Standards
Grade Strand Standard Standard
Sept
embe
r ndash
Oct
ober
Nov
embe
r ndash
Dec
embe
r
Janu
ary
ndash Fe
brua
ry
Mar
ch ndash
Apr
il
May
- Ju
ne
1 OA 1
CC1OA1 Represent and solve problems involving addition and subtraction Use addition and subtraction within 20 to solve word problems involving situations of adding to taking from putting together taking apart and comparing with unknowns in all positions eg by using objects drawings and equations with a symbol for the unknown number to represent the problem
1 OA 2
CC1OA2 Represent and solve problems involving addition and subtraction Solve word problems that call for addition of three whole numbers whose sum is less than or equal to 20 eg by using objects drawings and equations with a symbol for the unknown number to represent the problem
1 OA 3
CC1OA3 Understand and apply properties of operations and the relationship between addition and subtraction Apply properties of operations as strategies to add and subtract Examples If 8 + 3 = 11 is known then 3 + 8 = 11 is also known (Commutative property of addition) To add 2 + 6 + 4 the second two numbers can be added to make a ten so 2 + 6 + 4 = 2 + 10 = 12 (Associative property of addition) (Students need not use formal terms for these properties)
1 OA 4
CC1OA4 Understand and apply properties of operations and the relationship between addition and subtraction Understand subtraction as an unknown-addend problem For example subtract 10 ndash 8 by finding the number that makes 10 when added to 8
1 OA 5 CC1OA5 Add and subtract within 20 Relate counting to addition and subtraction (eg by counting on 2 to add 2)
1 OA 6 CC1OA6 Add and subtract within 20 Add and subtract within 20 demonstrating fluency for addition and subtraction within 10 Use strategies such as counting on making ten (eg 8 + 6 = 8 + 2 + 4 = 10 + 4 = 14) decomposing a number leading to a ten (eg 13 ndash 4 = 13 ndash 3 ndash 1 = 10 ndash 1 = 9) using the relationship between addition and subtraction (eg knowing that 8 + 4
47
Keansburg School DistrictCurriculum System
Mathematics= 12 one knows 12 ndash 8 = 4) and creating equivalent but easier or known sums (eg adding 6 + 7 by creating the known equivalent 6 + 6 + 1 = 12 + 1 = 13)
1 OA 7
CC1OA7 Work with addition and subtraction equations Understand the meaning of the equal sign and determine if equations involving addition and subtraction are true or false For example which of the following equations are true and which are false 6 = 6 7 = 8 ndash 1 5 + 2 = 2 + 5 4 + 1 = 5 + 2
1 OA 8
CC1OA8 Work with addition and subtraction equations Determine the unknown whole number in an addition or subtraction equation relating three whole numbers For example determine the unknown number that makes the equation true in each of the equations 8 + = 11 5 = _ ndash 3 6 + 6 = _
1 NBT 1
CC1NBT1 Extend the counting sequence Count to 120 starting at any number less than 120 In this range read and write numerals and represent a number of objects with a written numeral
1 NBT 2
CC1NBT2 Understand place value Understand that the two digits of a two-digit number represent amounts of tens and ones Understand the following as special cases -- a 10 can be thought of as a bundle of ten ones mdash called a ldquotenrdquo -- b The numbers from 11 to 19 are composed of a ten and one two three four five six seven eight or nine ones -- c The numbers 10 20 30 40 50 60 70 80 90 refer to one two three four five six seven eight or nine tens (and 0 ones)
1 NBT 3
CC1NBT3 Understand place value Compare two two-digit numbers based on meanings of the tens and ones digits recording the results of comparisons with the symbols gt = and lt
1 NBT 4
CC1NBT4 Use place value understanding and properties of operations to add and subtract Add within 100 including adding a two-digit number and a one-digit number and adding a two-digit number and a multiple of 10 using concrete models or drawings and strategies based on place value properties of operations andor the relationship between addition and subtraction relate the strategy to a written method and explain the reasoning used Understand that in adding two-digit numbers one adds tens and tens ones and ones and sometimes it is necessary to compose a ten
1 NBT 5
CC1NBT5 Use place value understanding and properties of operations to add and subtract Given a two-digit number mentally find 10 more or 10 less than the number without having to count explain the reasoning used
1 NBT 6 CC1NBT6 Use place value understanding and properties of operations to add and subtract Subtract multiples of 10 in the range 10-90 from multiples of 10 in the range 10-90 (positive or zero differences) using concrete models or drawings and strategies based on place value properties of operations andor
48
Keansburg School DistrictCurriculum System
Mathematicsthe relationship between addition and subtraction relate the strategy to a written method and explain the reasoning used
1 MD 1
CC1MD1 Measure lengths indirectly and by iterating length units Order three objects by length compare the lengths of two objects indirectly by using a third object
1 MD 2
CC1MD2 Measure lengths indirectly and by iterating length units Express the length of an object as a whole number of length units by laying multiple copies of a shorter object (the length unit) end to end understand that the length measurement of an object is the number of same-size length units that span it with no gaps or overlaps Limit to contexts where the object being measured is spanned by a whole number of length units with no gaps or overlaps
1 MD 3CC1MD3 Tell and write time Tell and write time in hours and half-hours using analog and digital clocks
1 MD 4
CC1MD4 Represent and interpret data Organize represent and interpret data with up to three categories ask and answer questions about the total number of data points how many in each category and how many more or less are in one category than in another
1 G 1
CC1G1 Reason with shapes and their attributes Distinguish between defining attributes (eg triangles are closed and three-sided) versus non-defining attributes (eg color orientation overall size) for a wide variety of shapes build and draw shapes to possess defining attributes
1 G 2
CC1G2 Reason with shapes and their attributes Compose two-dimensional shapes (rectangles squares trapezoids triangles half-circles and quarter-circles) or three-dimensional shapes (cubes right rectangular prisms right circular cones and right circular cylinders) to create a composite shape and compose new shapes from the composite shape (Students do not need to learn formal names such as ldquoright rectangular prismrdquo)
1 G 3
CC1G3 Reason with shapes and their attributes Partition circles and rectangles into two and four equal shares describe the shares using the words halves fourths and quarters and use the phrases half of fourth of and quarter of Describe the whole as two of or four of the shares Understand for these examples that decomposing into more equal shares creates smaller shares
49
Keansburg School DistrictCurriculum System
Mathematics
Common Core State Standards Vocabulary
Addition and subtraction within 5 10 20 100 or 1000 Addition or subtraction of two whole numbers with whole number answers and with sum or minuend in the range 0-5 0-10 0-20 or 0-100 respectively Example 8 + 2 = 10 is an addition within 10 14 ndash 5 = 9 is a subtraction within 20 and 55 ndash 18 = 37 is a subtraction within 100
Additive inverses Two numbers whose sum is 0 are additive inverses of one another Example 34 and ndash 34 are additive inverses of one another because 34 + (ndash 34) = (ndash 34) + 34 = 0
Associative property of addition See Table 3 in this Glossary
Associative property of multiplication See Table 3 in this Glossary
Bivariate data Pairs of linked numerical observations Example a list of heights and weights for each player on a football team
Box plot A method of visually displaying a distribution of data values by using the median quartiles and extremes of the data set A box shows the middle 50 of the data1
Commutative property See Table 3 in this Glossary
Complex fraction A fraction AB where A andor B are fractions (B nonzero)
Computation algorithm A set of predefined steps applicable to a class of problems that gives the correct result in every case when the steps are carried out correctly See also computation strategy
Computation strategy Purposeful manipulations that may be chosen for specific problems may not have a fixed order and may be aimed at converting one problem into another See also computation algorithm
Congruent Two plane or solid figures are congruent if one can be obtained from the other by rigid motion (a sequence of rotations reflections and translations)
Counting on A strategy for finding the number of objects in a group without having to count every member of the group For example if a stack of books is known to have 8 books and 3 more books are added to the top it is not necessary to count the stack
50
Keansburg School DistrictCurriculum System
Mathematicsall over again One can find the total by counting onmdashpointing to the top book and saying ldquoeightrdquo following this with ldquonine ten eleven There are eleven books nowrdquo
Dot plot See line plot
Dilation A transformation that moves each point along the ray through the point emanating from a fixed center and multiplies distances from the center by a common scale factor
Expanded form A multi-digit number is expressed in expanded form when it is written as a sum of single-digit multiples of powers of ten For example 643 = 600 + 40 + 3
Expected value For a random variable the weighted average of its possible values with weights given by their respective probabilities
First quartile For a data set with median M the first quartile is the median of the data values less than M Example For the data set 1 3 6 7 10 12 14 15 22 120 the first quartile is 62 See also median third quartile interquartile range
Fraction A number expressible in the form ab where a is a whole number and b is a positive whole number (The word fraction in these standards always refers to a non-negative number) See also rational number
Identity property of 0 See Table 3 in this Glossary
Independently combined probability models Two probability models are said to be combined independently if the probability of each ordered pair in the combined model equals the product of the original probabilities of the two individual outcomes in the ordered pair
Integer A number expressible in the form a or ndasha for some whole number a
Interquartile Range A measure of variation in a set of numerical data the interquartile range is the distance between the first and third quartiles of the data set Example For the data set 1 3 6 7 10 12 14 15 22 120 the interquartile range is 15 ndash 6 = 9 See also first quartile third quartile
Line plot A method of visually displaying a distribution of data values where each data value is shown as a dot or mark above a number line Also known as a dot plot3
51
Keansburg School DistrictCurriculum System
MathematicsMean A measure of center in a set of numerical data computed by adding the values in a list and then dividing by the number of values in the list4 Example For the data set 1 3 6 7 10 12 14 15 22 120 the mean is 21
Mean absolute deviation A measure of variation in a set of numerical data computed by adding the distances between each data value and the mean then dividing by the number of data values Example For the data set 2 3 6 7 10 12 14 15 22 120 the mean absolute deviation is 20
Median A measure of center in a set of numerical data The median of a list of values is the value appearing at the center of a sorted version of the listmdashor the mean of the two central values if the list contains an even number of values Example For the data set 2 3 6 7 10 12 14 15 22 90 the median is 11
Midline In the graph of a trigonometric function the horizontal line halfway between its maximum and minimum values
Multiplication and division within 100 Multiplication or division of two whole numbers with whole number answers and with product or dividend in the range 0-100 Example 72 divide 8 = 9
Multiplicative inverses Two numbers whose product is 1 are multiplicative inverses of one another Example 34 and 43 are multiplicative inverses of one another because 34 times 43 = 43 times 34 = 1
Number line diagram A diagram of the number line used to represent numbers and support reasoning about them In a number line diagram for measurement quantities the interval from 0 to 1 on the diagram represents the unit of measure for the quantity
Percent rate of change A rate of change expressed as a percent Example if a population grows from 50 to 55 in a year it grows by 550 = 10 per year
Probability distribution The set of possible values of a random variable with a probability assigned to each
Properties of operations See Table 3 in this Glossary
Properties of equality See Table 4 in this Glossary
Properties of inequality See Table 5 in this Glossary
Properties of operations See Table 3 in this Glossary
52
Keansburg School DistrictCurriculum System
MathematicsProbability A number between 0 and 1 used to quantify likelihood for processes that have uncertain outcomes (such as tossing a coin selecting a person at random from a group of people tossing a ball at a target or testing for a medical condition)
Probability model A probability model is used to assign probabilities to outcomes of a chance process by examining the nature of the process The set of all outcomes is called the sample space and their probabilities sum to 1 See also uniform probability model
Random variable An assignment of a numerical value to each outcome in a sample space
Rational expression A quotient of two polynomials with a non-zero denominator
Rational number A number expressible in the form ab or ndash ab for some fraction ab The rational numbers include the integers
Rectilinear figure A polygon all angles of which are right angles
Rigid motion A transformation of points in space consisting of a sequence of one or more translations reflections andor rotations Rigid motions are here assumed to preserve distances and angle measures
Repeating decimal The decimal form of a rational number See also terminating decimal
Sample space In a probability model for a random process a list of the individual outcomes that are to be considered
Scatter plot A graph in the coordinate plane representing a set of bivariate data For example the heights and weights of a group of people could be displayed on a scatter plot5
Similarity transformation A rigid motion followed by a dilation
Tape diagram A drawing that looks like a segment of tape used to illustrate number relationships Also known as a strip diagram bar model fraction strip or length model
Terminating decimal A decimal is called terminating if its repeating digit is 0
Third quartile For a data set with median M the third quartile is the median of the data values greater than M Example For the data set 2 3 6 7 10 12 14 15 22 120 the third quartile is 15 See also median first quartile interquartile range
Transitivity principle for indirect measurement If the length of object A is greater than the length of object B and the length of object B is greater than the length of object C then the length of object A is greater than the length of object C This principle applies
53
Keansburg School DistrictCurriculum System
Mathematicsto measurement of other quantities as well
Uniform probability model A probability model which assigns equal probability to all outcomes See also probability model
Vector A quantity with magnitude and direction in the plane or in space defined by an ordered pair or triple of real numbers
Visual fraction model A tape diagram number line diagram or area model
Whole numbers The numbers 0 1 2 3 hellip5
54
- MissionVision Statement
- Beliefs
- Measurement amp Data
- Measure lengths and by iterating length units
- Tell and write time
- Represent and interpret data
- Geometry
- Reason with shapes and their attributes
- Number and Base Ten
- Extend the counting sequence
- Understand place value
-
- Measurement amp Data (II)
-
- Measure lengths and by iterating length units
- Tell and write time
-
- Represent and interpret data
- Geometry (II)
- Reason with shapes their attributes
-
- Number and Base Ten
- Use place value understanding and properties of operations to add and subtract
- Teacher will cover up specific numbers on an enlarged number grid using cover up tape to have students identify numbers before and after Students will come up and write the missing numbers
- Students will play ldquoI have__ Who has __ Teacher will create cards using index cards and numbers in which students need further practice with Students will read their cards aloud Variations of game can include identifying specific numbers identifying numbers more or less etc)
- Students will use base ten blocks to represent numbers including three digit numbers Students will identify representation of numbers through these manipulatives They may match the representation to the written number
- Students will write the number they created using the base ten blocks using their white boards and markers
- Students will arrange given digits to create the greatest and lowest possible numbers They can show each number they create using base ten blocks
- Students will use the Base Ten Exchange Game to show an understanding of exchanging ones for tens and tens for hundreds Students can use place value mats base ten blocks (cubes tens and flats) Students can take number of cubes displayed with roll of single die Students will determine when exchanging can be made when reaching ten units
- Base ten concentration wwwk-5mathteachingresourcescom
- Ten frame compare wwwk-5mathteachingresourcescom
-
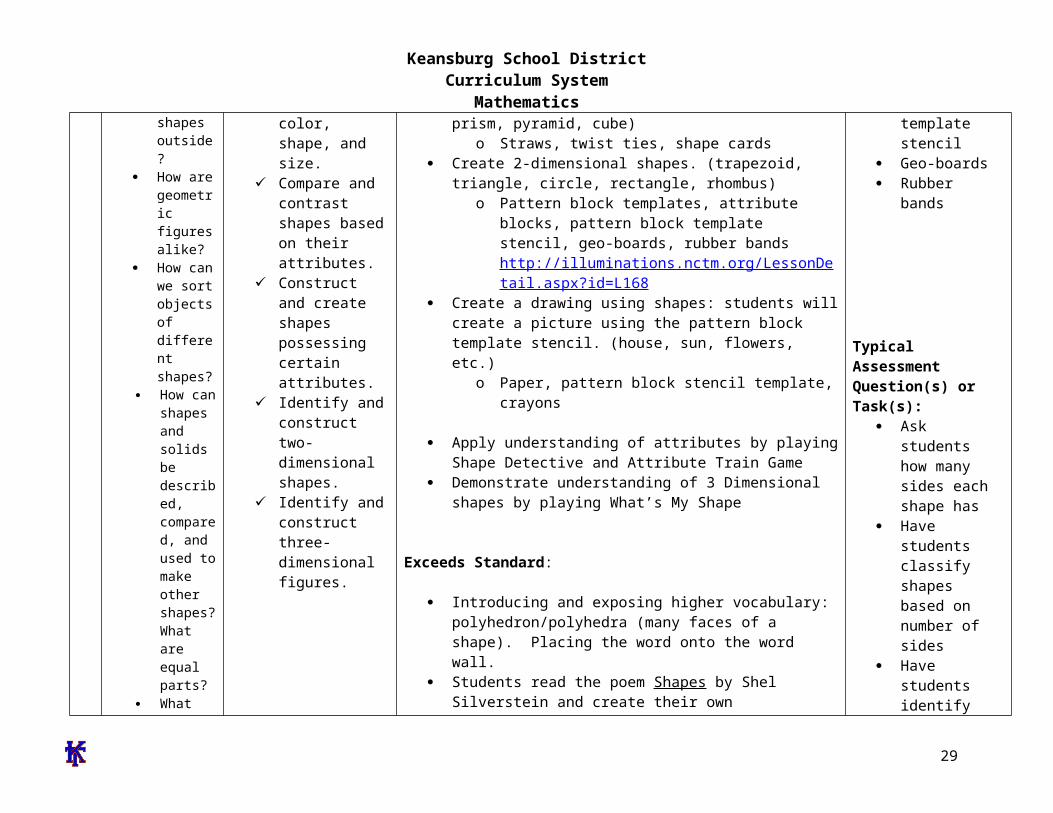
Keansburg School DistrictCurriculum System
MathematicsKeansburg School DistrictCurriculum Management System
SubjectGradeLevelMathematicsGrade 1
Timeline February-Quarter 3
Topic(s) Operations amp Algebraic Expressions
Significance of Learning Goal(s) To solve addition and subtraction problems
Sugg
este
d D
ays
of
Inst
ruct
ion Content
Standards CPI
Essential Questions
Specific Learning Objective(s)
The Students Will Be Able To
Suggested ActivitiesInstructional Tools Materials
Technology Resources Assessments and Assessment
Models
CPI1OA31OA4 1OA5 1OA6 1OA7 1OA81OA2
EQ What
questions can be answered using addition
What strategies can be used to solve problems
How can we
Concept(s) Solve addition with and subtraction problems
SWBAT Solve addition problems
with sums up to 20 Use addition within 20 to
solve word problems involving real life situations
Solve word problems that call for addition of three whole numbers up to 20
Solve subtraction problems with difference up to 20
Use subtraction within 20 to solve word problems involving real
Meets Standard Model and have students create their
own individual number sentence using manipulatives and label operation symbols
Students will choose a strategy to solve number stories such as objects fingers and pictures count onback number line or number grid
Create real life situations in which students will use a strategy to solve a number story and create a number model
Review addition and subtraction number stories posters stating each key word for addition and subtraction operations
Combine and mix two sets of 0-20 number cards One partner draws two number cards from the top of the deck students will design and generate a number story using the two numbers
Materials Manipulatives (examples
counting bears connecting cubes pennies counters etc)
Slates dry erase markers erasers
Clear Sheet Protectors Sets of 0-20 number cards Number cards Cardstock Scrabble tiles letter cards
Typical Assessment Question(s) or Task(s)
Students will solve real life
29
Keansburg School DistrictCurriculum System
Mathematicstell how many
How does knowing math facts make math easier
How can numbers be helpful
Why do I need to subtract
How do we use addition and subtraction in our everyday life
Why are fact families important
What strategies can be used to solve problems How is counting on different from just counting to add
What information do you need to know in order to find
life situations Understand subtraction
as an unknown addend problem example subtract 9-5 by finding the number that makes 9 when added to 5
Both partners solve the problem in the number story and write the answer on their slate
Find three cards that have a sum of 12 how many different ways can the student make the sum of 12 using three cards students record work
-Teacher creates real life word problemsinvolving three addends up to 20
Ten frames subtraction wwwk-5mathteachingresourcescom
I have who has wwwk-5mathteachingresourcescom
True or false wwwk-5mathteachingresourcescom
Count to 20 wwwk-5mathteachingresourcescom
Exceeds Standard
Teacher creates multi step word problems for students to solve
Students work with partners or small groups to create real life word problems Compose class book of problems
Three letter addends use scrabble tiles or letter cards with corresponding numbers to make three letter words find
word problems Students will create their
own number sentences own number storiesword problems
Students will create and solve number stories in cooperative learning groups
Students will generate word problems using assigned numbers
30
Keansburg School DistrictCurriculum System
Mathematicsthe total number of something
Why would you need to count back
How are subtraction and addition related
the sum of each word by adding the numbers on the tiles Students will find which words have the greatest or smallest sum
31
Keansburg School DistrictCurriculum System
MathematicsKeansburg School DistrictCurriculum Management System
SubjectGradeLevelMathematicsGrade 1
Timeline March-Quarter 3
Topic(s) Measurement amp Data
Significance of Learning Goal(s) To tell time and compare measurements
Sugg
este
d D
ays
of
Inst
ruct
ion Content
Standards CPI
Essential Questions
Specific Learning Objective(s)
The Students Will Be Able ToSuggested Activities
Instructional Tools Materials Technology Resources
Assessments and Assessment Models
How would I know if a bar graph correctly shows what is on a tally chart
How could a bar graph answer a question
Do bar graphs make it easier to understand and compare facts Why
What kind
Concept(s) Telling time comparing measurements
SWBAT Identify and write time to
the hour and half hour on both a digital and analog clock
Write time to the hour and half-hour on both digital and analog clocks
Draw the hands on the analog clock for a given time to the hour or half-hour
Relate times to the half hour as ldquohalf-pastrdquo the hour
Compare and contrast
Meets Standard Students will have their own
demonstration clocks students will identify and find the hour and minute hands
Students create their own clocks using paper plates students will manipulate hands to identify varying times
Students will listen to Jack Hartman ldquoTick Tockrdquo song
Teachers and students will view clock on videos on brainpopjrcom students and teachers can complete quizzes available on website
Teachers will present time on an analog clock students will write the digital time on a white board
Students will play clock concentration Teacher will introduce measurement by
holding up objects and the students will examine the objects and explain the size
Large Judy Clock Individual student Judy
clocks Wipe off analogdigital clocks Clock stampers Timers Rulers Yardsticks Measuring tapes Sheet protectors Cardstock Paper plates Fasteners Index cards
Typical Assessment Question(s) or Task(s)
Students will be asked to identify and write time to the hour and half hour on both
32
Keansburg School DistrictCurriculum System
Mathematicsof graph should I use to answer questions
Why do I need to tell time
How many hands does a clock have
Are the hands on the clock the same size
How long is a minute
Why do I need to use a calendar
How do we use the clock and the calendar to determine what we will do in school
Why do we need to measure something
What can
objects by length Construct objects at
contrasting lengths
ordero Students will break into groups
and compare objects further and classify them depending on their size
Teacher will introduce the ruler Explain to students that the ruler is used to measure objects The students will then explore the classroom and select objects around the room that are smaller and larger than the ruler
Teacher will select specific body parts that the students will use as a personal unit of measurement The students will work in pairs to demonstrate how to measure objects around the room using their personal unit of measurement
The teacher will select a classroom object and the students will be asked to illustrate objects in the room that are bigger and smaller in size
The students will be able to organize represent and interpret data up to three categories through the use of a bar graph
The teacher will then divide students into heterogeneous groups and encourage the students to explain what they can learn from the graph The students will present findings following activity
Students will choose an object within classroom then find additional objects one being larger the other being shorter using a two-column chart Draw or write the objects in the chart
digital and analog clocks Students will be asked to
identify the parts of a clock students will be asked to draw the hands on an analog clock for a given time to the hour or half-hour
Students will be given various objects and will further be asked to compare and contrast the lengths of these objects
Students will be asked to provide or create objects contrasting lengths to demonstrate understanding of differences in length
33
Keansburg School DistrictCurriculum System
Mathematicswe use to draw and measure things
What do you think is about 1 inch long
How many steps long do you think it is from the front of the classroom to the back
If we measure in footsteps why are some of the measurements different
How is longer and shorter similar to greater and lesser
Exceeds Standard
The students will work in pairs to locate objects around the room and compare the lengths against each other The pairs will then work with another pair of students and compare the lengths of their objects with the objects the other pair located
Teacher will introduce the ruler in comparison to the yardstick The students will be encouraged to find objects that in the room that are larger than a ruler and measure using the yardstick
After the teacher introduces units of personal measurement the students will be encouraged to measure object in the room using their own unit of personal measurement and convert it into a standard measurement using a ruler or a yardstick
The teacher will select a classroom object and the students will be asked to illustrate objects in the room that are bigger and smaller by a specific size
The students will be able to organize represent and interpret data up to four or more categories through the use of a bar graph
The teacher will then divide students into heterogeneous groups and encourage the students to explain what they can learn from the graph and create a tally chart utilizing the data
Students will create clock flash cards by
34
Keansburg School DistrictCurriculum System
Mathematicsdrawing an analog clock on one side and writing the digital clock time on the other Students will include time in five minute intervals
Pose word problems where students have to find elapse time to the hour and half hour
Introduce second hand and conduct activities that are timed in seconds (Examples hopping on 1 foot blinking eyes counting to the highest number)
35
Keansburg School DistrictCurriculum System
MathematicsKeansburg School DistrictCurriculum Management System
SubjectGradeLevelMathematicsGrade 1
Timeline April-Quarter 4
Topic(s) Geometry
Significance of Learning Goal(s) To identify two and three dimensional shapes to understand fractional parts and create equal shares
Sugg
este
d D
ays
of
Inst
ruct
ion Content
Standards CPI Essential
Questions
Specific Learning Objective(s)
The Students Will Be Able To
Suggested ActivitiesInstructional Tools Materials
Technology Resources Assessments and Assessment
Models
Are there different shapes outside
How are geometric figures alike
How can we sort objects of different shapes
How can shapes and solids be described compared and used to make other shapes
Concept(s) Two and three dimensional shapes fractional parts equal shares
SWBAT
Combine two-dimensional or three-dimensional shapes or figures to create a new composite shape and identify the shapes within
Identify fractional parts of circles and rectangles into equal shares while developing vocabulary for halves fourths and quarters
Describe the whole as
Meets Standard
Determine which shape by touch without using their sight
o Materials attribute blocks shape sheet feely box wwwilluminationsnctmorglessondetail
Sorting 3-dimensional objects students will be given cards with 3-dimensional objects (trash can soup can globe ball tissue box box dice) they will sort them based on the 3-dimensional shape they represent
o 3-dimensional object cards sorting mats
Pizza and Cake Fractions students will utilize a pizza and a cake to work on the concept of fractions while developing the vocabulary halves quarters and fourths
o Materials teacher created pizza
Attribute blocks Geometric shapes 3-dimensional object
cards Sorting maps 3-dimensional shapes Solid and lane figures Geo-boards and rubber
bands Fraction circles Sheet protectors 2-dimensional shapes
Typical Assessment Question(s) or Task(s)
Students will be asked to describe and identify
36
Keansburg School DistrictCurriculum System
MathematicsWhat are equal parts
What foods do you divide into equal parts
What other items might be divided
How do you know if you have an equal share
two of or four of the shares Understand for these examples that decomposing into more equal shares creates smaller shares
and cake that are cut into fractions (construction paper)
Students will illustrate a picture of a boat using at least one three dimensional shape in their drawings Shapes include cubes cylinders spheres cones and rectangular prisms
Solid and Plane Figures Name the Face activity Provide three-dimensional objects Have students draw the face for each object as well as name the shape Examples ABC block juice can book party hat
Introduce fractions by having students identify shapes that show equal parts Display cut out shapes using document camera Include some shapes that are divided equally and some that are not divided equally As a whole group sort shapes into two categories Then have students go back to their desks and work with a partner to classify additional shapes
Provide students with shapes that are divided into four parts Include shapes that are divided into four equal parts and others that are unequal Students identify the shapes that are divided into four equal parts and explain their reasoning
Shape Town activity Students will design a shape town using the following shapes
shapes within combined two and three-dimensional shapes
Students will be given circles and rectangles students will be asked to divide these shapes into halves fourths and quarters
Students will be asked to sort shapes that are divided equally and not divided equally
37
Keansburg School DistrictCurriculum System
Mathematicstrapezoid hexagon square triangle and circle Afterwards students will calculate the total number of each shape they included After completing the activity students will present their final product to the class and explain how they decided which shapes to use
Given an array of dots students will draw shapes with specific number of sides and corners and connect the dots to create the shapes Example Draw a shape with 5 sides Draw a shape with 6 corners
Students will create two-dimensional shapes on geoboards Then using different colored rubber bands students will divide the shapes into equal parts Students will transfer their equally divided shapes onto geoboard paper by drawing lines to show their equal parts
Play the Fraction Path Game Materials Fraction circles a circle with frac12 shaded a circle with 13 shaded and a circle with frac14 shaded Gameboard Path consisting of assorted shapes divided into halves thirds and fourths Players Needed 3 Directions Place the fraction circles facedown Players close their eyes and pick one fraction circle Each player follows the path from start to finish Each player looks at each shape on the path and records how many shapes show their fractions Players record
38
Keansburg School DistrictCurriculum System
Mathematicstheir results on paper using tally marks At end of game students compare total number of shapes that show their fraction
Exceeds Standard
39
Keansburg School DistrictCurriculum System
MathematicsKeansburg School DistrictCurriculum Management System
SubjectGradeLevelMathematicsGrade 1
Timeline May-Quarter 4
Topic(s) Number and Operations in Base Ten
Significance of Learning Goal(s) To use place value to add and subtract
Sugg
este
d D
ays
of
Inst
ruct
ion Content
Standards CPI Essential
Questions
Specific Learning Objective(s)
The Students Will Be Able ToSuggested Activities
Instructional Tools Materials Technology Resources
Assessments and Assessment Models
40
Keansburg School DistrictCurriculum System
MathematicsCPI 1NBT4 1NBT5 1NBT6
EQ How do
numbers help us
How can sets of numbers be counted compared and ordered
How can I use numbers to solve problems
How would putting numbers on a chart make it easier to understand information
How can I make it easier to understand numbers when I sort them
What is place value
Why is place value important
How can I
Concept(s) Use place value and properties of operations to add and subtract
SWBAT Use mental math to find
10 more or ten less than a given two-digit number and explain reasoning used within any number to 120
Use place value to add within 100 add a two-digit number to a one-digit number and add a two-digit number to a multiple of ten
Understand when adding two-digit numbers that ones add to the ones and tens add to the tens and sometimes it is necessary to compose a ten by regrouping
For all above objects students will use concrete models and strategies based on place value and relate the strategy to a written method and explain the reasoning used
Subtract multiples of 10 in the range 10-90 from multiples of 10 in the range 10-90 using
Meets Standard
Comparing two digit numbers wwwk-5mathteachingresourcescom
Subtraction split wwwk-5mathteachingresourcescom
Ten more wwwk-5mathteachingresourcescom
Addition split wwwk-5mathteachingresourcescom
Exceeds Standard
Comparing 3-Digit numbers wwwk-5mathteachingresourcescom
What number is wwwk-5mathteachingresourcescom
Students develop addition and subtraction number stories and have partners solve
Create pictures using basendash10 blocks Students trace picture onto paper label the base ten blocks with their value and add total
Solve number grid puzzles by adding and subtraction 10 on the number grid
Number cards Base 10 blocks Counters Number grid puzzles Sleeve protectors wwwk-
5mathteachingresourcescom
Dice
Typical Assessment Question(s) or Task(s)
Recognize numbers 1-120 using flashcards
Write numbers 1-20 using block or graph paper
Build two-digit numbers using tens and ones blocks
Listen and note students skip counting orally by tens to 120
Students compare and label two numbers using relation symbols
41
Keansburg School DistrictCurriculum System
Mathematics
42
Keansburg School DistrictCurriculum System
MathematicsKeansburg School DistrictCurriculum Management System
SubjectGradeLevelMathematicsGrade 1
Timeline June-Quarter 4
Topic(s) Readiness skills for September of Grade 2
Significance of Learning Goal(s) To compare larger numbers add fluently and apply measurement skills
Sugg
este
d D
ays
of
Inst
ruct
ion Content
Standards CPI Essential Questions
Specific Learning Objective(s)
The Students Will Be Able ToSuggested Activities
Instructional Tools Materials Technology Resources
Assessments and Assessment Models
CPI
EQ How can I use
place value to compare and
order numbers in the 100s
How can mastering basic addition and subtraction facts help me compute larger numbers
How can I tie in
Concept(s)Use place value to compare larger numbers fluently add up to 20 apply measurement skills
SWBAT Extend place value into
the hundreds place and re-write and construct models beyond the hundreds
Fluently add and subtract within 20 using mental strategies
Apply measurement skills
Meets Standard Place Value barrier game httpwwwk-
5mathteachingresourcescommath-gameshtml (place value only)
High card
httpwwwlearningboxcomBase10 BaseTenhtml
Time barrier game httpwwwk-5mathteachingresourcescomsupport-filestimebarriergamepdf httpwwwk-5mathteachingresourcescomsupport-filestimebarriergamegridpdf
My favorite time of day writing activity
number cards base ten blocks rulers tape measurer string number relationship mat paper plates cotton balls judy clock digital clock
Typical Assessment Question(s) or Task(s)
Students will solve addition and subtraction problems within 20 in a given time
43
Keansburg School DistrictCurriculum System
Mathematicsmeasurement skills with real life experiences
httpwwwk-5mathteachingresourcescomsupport-filesmy-favorite-time-of-daypdf
Estimating length httpwwwk-5mathteachingresourcescomsupport-filesestimatinglengthpdf
Olympic golf plastic golf clubs cotton balls and tape measurer
Olympic smiles measuring smiles with string and rulers
Olympic Frisbee using paper plates and tape measurer
Olympic airplane students will make paper airplanes measure the distance that they can throw their airplane
Doubles plus 1 game httpwwwk-5mathteachingresourcescomsupport-filesdoubles-plus-onepdf
Eleven more httpwwwk-5mathteachingresourcescomsupport-fileselevenmorepdf
frame Students will be asked to
measure items using inches and centimeters
Identify and create numbers with place values extending into the hundreds place
44
Keansburg School DistrictCurriculum System
Mathematics
Building numbers with base ten blocks pick three cards and arrange them to show a 3-digit number build that number with base ten blocks repeat with the same three cards until no new numbers can be made
Length strength inches httpwwwharcourtschoolcomactivitylength_strength1_inches
Length strength centimeters httpwwwharcourtschoolcomactivitylength_strength1_centi
Exceeds Standard
Number relationship mat wwwk-5mathteachingresourcescom
Place value barrier game httpwwwk-5mathteachingresourcescommath-gameshtml (integrate other skills into place values for example the digit in my 10s place is four doubled)
Measuring the mousersquos path httpwwwk-5mathteachingresourcescomsupport-filespaths1pdf
45
Keansburg School DistrictCurriculum System
Mathematics
Double minus 1 game httpwwwk-5mathteachingresourcescomsupport-filesdoubles-minus-onepdf
Number relationship mat httpwwwk-5mathteachingresourcescomsupport-filesnumberrelationshipmatpdf
46
Keansburg School DistrictCurriculum System
Mathematicsignment Matrices of Common Core State Standards
Grade Strand Standard Standard
Sept
embe
r ndash
Oct
ober
Nov
embe
r ndash
Dec
embe
r
Janu
ary
ndash Fe
brua
ry
Mar
ch ndash
Apr
il
May
- Ju
ne
1 OA 1
CC1OA1 Represent and solve problems involving addition and subtraction Use addition and subtraction within 20 to solve word problems involving situations of adding to taking from putting together taking apart and comparing with unknowns in all positions eg by using objects drawings and equations with a symbol for the unknown number to represent the problem
1 OA 2
CC1OA2 Represent and solve problems involving addition and subtraction Solve word problems that call for addition of three whole numbers whose sum is less than or equal to 20 eg by using objects drawings and equations with a symbol for the unknown number to represent the problem
1 OA 3
CC1OA3 Understand and apply properties of operations and the relationship between addition and subtraction Apply properties of operations as strategies to add and subtract Examples If 8 + 3 = 11 is known then 3 + 8 = 11 is also known (Commutative property of addition) To add 2 + 6 + 4 the second two numbers can be added to make a ten so 2 + 6 + 4 = 2 + 10 = 12 (Associative property of addition) (Students need not use formal terms for these properties)
1 OA 4
CC1OA4 Understand and apply properties of operations and the relationship between addition and subtraction Understand subtraction as an unknown-addend problem For example subtract 10 ndash 8 by finding the number that makes 10 when added to 8
1 OA 5 CC1OA5 Add and subtract within 20 Relate counting to addition and subtraction (eg by counting on 2 to add 2)
1 OA 6 CC1OA6 Add and subtract within 20 Add and subtract within 20 demonstrating fluency for addition and subtraction within 10 Use strategies such as counting on making ten (eg 8 + 6 = 8 + 2 + 4 = 10 + 4 = 14) decomposing a number leading to a ten (eg 13 ndash 4 = 13 ndash 3 ndash 1 = 10 ndash 1 = 9) using the relationship between addition and subtraction (eg knowing that 8 + 4
47
Keansburg School DistrictCurriculum System
Mathematics= 12 one knows 12 ndash 8 = 4) and creating equivalent but easier or known sums (eg adding 6 + 7 by creating the known equivalent 6 + 6 + 1 = 12 + 1 = 13)
1 OA 7
CC1OA7 Work with addition and subtraction equations Understand the meaning of the equal sign and determine if equations involving addition and subtraction are true or false For example which of the following equations are true and which are false 6 = 6 7 = 8 ndash 1 5 + 2 = 2 + 5 4 + 1 = 5 + 2
1 OA 8
CC1OA8 Work with addition and subtraction equations Determine the unknown whole number in an addition or subtraction equation relating three whole numbers For example determine the unknown number that makes the equation true in each of the equations 8 + = 11 5 = _ ndash 3 6 + 6 = _
1 NBT 1
CC1NBT1 Extend the counting sequence Count to 120 starting at any number less than 120 In this range read and write numerals and represent a number of objects with a written numeral
1 NBT 2
CC1NBT2 Understand place value Understand that the two digits of a two-digit number represent amounts of tens and ones Understand the following as special cases -- a 10 can be thought of as a bundle of ten ones mdash called a ldquotenrdquo -- b The numbers from 11 to 19 are composed of a ten and one two three four five six seven eight or nine ones -- c The numbers 10 20 30 40 50 60 70 80 90 refer to one two three four five six seven eight or nine tens (and 0 ones)
1 NBT 3
CC1NBT3 Understand place value Compare two two-digit numbers based on meanings of the tens and ones digits recording the results of comparisons with the symbols gt = and lt
1 NBT 4
CC1NBT4 Use place value understanding and properties of operations to add and subtract Add within 100 including adding a two-digit number and a one-digit number and adding a two-digit number and a multiple of 10 using concrete models or drawings and strategies based on place value properties of operations andor the relationship between addition and subtraction relate the strategy to a written method and explain the reasoning used Understand that in adding two-digit numbers one adds tens and tens ones and ones and sometimes it is necessary to compose a ten
1 NBT 5
CC1NBT5 Use place value understanding and properties of operations to add and subtract Given a two-digit number mentally find 10 more or 10 less than the number without having to count explain the reasoning used
1 NBT 6 CC1NBT6 Use place value understanding and properties of operations to add and subtract Subtract multiples of 10 in the range 10-90 from multiples of 10 in the range 10-90 (positive or zero differences) using concrete models or drawings and strategies based on place value properties of operations andor
48
Keansburg School DistrictCurriculum System
Mathematicsthe relationship between addition and subtraction relate the strategy to a written method and explain the reasoning used
1 MD 1
CC1MD1 Measure lengths indirectly and by iterating length units Order three objects by length compare the lengths of two objects indirectly by using a third object
1 MD 2
CC1MD2 Measure lengths indirectly and by iterating length units Express the length of an object as a whole number of length units by laying multiple copies of a shorter object (the length unit) end to end understand that the length measurement of an object is the number of same-size length units that span it with no gaps or overlaps Limit to contexts where the object being measured is spanned by a whole number of length units with no gaps or overlaps
1 MD 3CC1MD3 Tell and write time Tell and write time in hours and half-hours using analog and digital clocks
1 MD 4
CC1MD4 Represent and interpret data Organize represent and interpret data with up to three categories ask and answer questions about the total number of data points how many in each category and how many more or less are in one category than in another
1 G 1
CC1G1 Reason with shapes and their attributes Distinguish between defining attributes (eg triangles are closed and three-sided) versus non-defining attributes (eg color orientation overall size) for a wide variety of shapes build and draw shapes to possess defining attributes
1 G 2
CC1G2 Reason with shapes and their attributes Compose two-dimensional shapes (rectangles squares trapezoids triangles half-circles and quarter-circles) or three-dimensional shapes (cubes right rectangular prisms right circular cones and right circular cylinders) to create a composite shape and compose new shapes from the composite shape (Students do not need to learn formal names such as ldquoright rectangular prismrdquo)
1 G 3
CC1G3 Reason with shapes and their attributes Partition circles and rectangles into two and four equal shares describe the shares using the words halves fourths and quarters and use the phrases half of fourth of and quarter of Describe the whole as two of or four of the shares Understand for these examples that decomposing into more equal shares creates smaller shares
49
Keansburg School DistrictCurriculum System
Mathematics
Common Core State Standards Vocabulary
Addition and subtraction within 5 10 20 100 or 1000 Addition or subtraction of two whole numbers with whole number answers and with sum or minuend in the range 0-5 0-10 0-20 or 0-100 respectively Example 8 + 2 = 10 is an addition within 10 14 ndash 5 = 9 is a subtraction within 20 and 55 ndash 18 = 37 is a subtraction within 100
Additive inverses Two numbers whose sum is 0 are additive inverses of one another Example 34 and ndash 34 are additive inverses of one another because 34 + (ndash 34) = (ndash 34) + 34 = 0
Associative property of addition See Table 3 in this Glossary
Associative property of multiplication See Table 3 in this Glossary
Bivariate data Pairs of linked numerical observations Example a list of heights and weights for each player on a football team
Box plot A method of visually displaying a distribution of data values by using the median quartiles and extremes of the data set A box shows the middle 50 of the data1
Commutative property See Table 3 in this Glossary
Complex fraction A fraction AB where A andor B are fractions (B nonzero)
Computation algorithm A set of predefined steps applicable to a class of problems that gives the correct result in every case when the steps are carried out correctly See also computation strategy
Computation strategy Purposeful manipulations that may be chosen for specific problems may not have a fixed order and may be aimed at converting one problem into another See also computation algorithm
Congruent Two plane or solid figures are congruent if one can be obtained from the other by rigid motion (a sequence of rotations reflections and translations)
Counting on A strategy for finding the number of objects in a group without having to count every member of the group For example if a stack of books is known to have 8 books and 3 more books are added to the top it is not necessary to count the stack
50
Keansburg School DistrictCurriculum System
Mathematicsall over again One can find the total by counting onmdashpointing to the top book and saying ldquoeightrdquo following this with ldquonine ten eleven There are eleven books nowrdquo
Dot plot See line plot
Dilation A transformation that moves each point along the ray through the point emanating from a fixed center and multiplies distances from the center by a common scale factor
Expanded form A multi-digit number is expressed in expanded form when it is written as a sum of single-digit multiples of powers of ten For example 643 = 600 + 40 + 3
Expected value For a random variable the weighted average of its possible values with weights given by their respective probabilities
First quartile For a data set with median M the first quartile is the median of the data values less than M Example For the data set 1 3 6 7 10 12 14 15 22 120 the first quartile is 62 See also median third quartile interquartile range
Fraction A number expressible in the form ab where a is a whole number and b is a positive whole number (The word fraction in these standards always refers to a non-negative number) See also rational number
Identity property of 0 See Table 3 in this Glossary
Independently combined probability models Two probability models are said to be combined independently if the probability of each ordered pair in the combined model equals the product of the original probabilities of the two individual outcomes in the ordered pair
Integer A number expressible in the form a or ndasha for some whole number a
Interquartile Range A measure of variation in a set of numerical data the interquartile range is the distance between the first and third quartiles of the data set Example For the data set 1 3 6 7 10 12 14 15 22 120 the interquartile range is 15 ndash 6 = 9 See also first quartile third quartile
Line plot A method of visually displaying a distribution of data values where each data value is shown as a dot or mark above a number line Also known as a dot plot3
51
Keansburg School DistrictCurriculum System
MathematicsMean A measure of center in a set of numerical data computed by adding the values in a list and then dividing by the number of values in the list4 Example For the data set 1 3 6 7 10 12 14 15 22 120 the mean is 21
Mean absolute deviation A measure of variation in a set of numerical data computed by adding the distances between each data value and the mean then dividing by the number of data values Example For the data set 2 3 6 7 10 12 14 15 22 120 the mean absolute deviation is 20
Median A measure of center in a set of numerical data The median of a list of values is the value appearing at the center of a sorted version of the listmdashor the mean of the two central values if the list contains an even number of values Example For the data set 2 3 6 7 10 12 14 15 22 90 the median is 11
Midline In the graph of a trigonometric function the horizontal line halfway between its maximum and minimum values
Multiplication and division within 100 Multiplication or division of two whole numbers with whole number answers and with product or dividend in the range 0-100 Example 72 divide 8 = 9
Multiplicative inverses Two numbers whose product is 1 are multiplicative inverses of one another Example 34 and 43 are multiplicative inverses of one another because 34 times 43 = 43 times 34 = 1
Number line diagram A diagram of the number line used to represent numbers and support reasoning about them In a number line diagram for measurement quantities the interval from 0 to 1 on the diagram represents the unit of measure for the quantity
Percent rate of change A rate of change expressed as a percent Example if a population grows from 50 to 55 in a year it grows by 550 = 10 per year
Probability distribution The set of possible values of a random variable with a probability assigned to each
Properties of operations See Table 3 in this Glossary
Properties of equality See Table 4 in this Glossary
Properties of inequality See Table 5 in this Glossary
Properties of operations See Table 3 in this Glossary
52
Keansburg School DistrictCurriculum System
MathematicsProbability A number between 0 and 1 used to quantify likelihood for processes that have uncertain outcomes (such as tossing a coin selecting a person at random from a group of people tossing a ball at a target or testing for a medical condition)
Probability model A probability model is used to assign probabilities to outcomes of a chance process by examining the nature of the process The set of all outcomes is called the sample space and their probabilities sum to 1 See also uniform probability model
Random variable An assignment of a numerical value to each outcome in a sample space
Rational expression A quotient of two polynomials with a non-zero denominator
Rational number A number expressible in the form ab or ndash ab for some fraction ab The rational numbers include the integers
Rectilinear figure A polygon all angles of which are right angles
Rigid motion A transformation of points in space consisting of a sequence of one or more translations reflections andor rotations Rigid motions are here assumed to preserve distances and angle measures
Repeating decimal The decimal form of a rational number See also terminating decimal
Sample space In a probability model for a random process a list of the individual outcomes that are to be considered
Scatter plot A graph in the coordinate plane representing a set of bivariate data For example the heights and weights of a group of people could be displayed on a scatter plot5
Similarity transformation A rigid motion followed by a dilation
Tape diagram A drawing that looks like a segment of tape used to illustrate number relationships Also known as a strip diagram bar model fraction strip or length model
Terminating decimal A decimal is called terminating if its repeating digit is 0
Third quartile For a data set with median M the third quartile is the median of the data values greater than M Example For the data set 2 3 6 7 10 12 14 15 22 120 the third quartile is 15 See also median first quartile interquartile range
Transitivity principle for indirect measurement If the length of object A is greater than the length of object B and the length of object B is greater than the length of object C then the length of object A is greater than the length of object C This principle applies
53
Keansburg School DistrictCurriculum System
Mathematicsto measurement of other quantities as well
Uniform probability model A probability model which assigns equal probability to all outcomes See also probability model
Vector A quantity with magnitude and direction in the plane or in space defined by an ordered pair or triple of real numbers
Visual fraction model A tape diagram number line diagram or area model
Whole numbers The numbers 0 1 2 3 hellip5
54
- MissionVision Statement
- Beliefs
- Measurement amp Data
- Measure lengths and by iterating length units
- Tell and write time
- Represent and interpret data
- Geometry
- Reason with shapes and their attributes
- Number and Base Ten
- Extend the counting sequence
- Understand place value
-
- Measurement amp Data (II)
-
- Measure lengths and by iterating length units
- Tell and write time
-
- Represent and interpret data
- Geometry (II)
- Reason with shapes their attributes
-
- Number and Base Ten
- Use place value understanding and properties of operations to add and subtract
- Teacher will cover up specific numbers on an enlarged number grid using cover up tape to have students identify numbers before and after Students will come up and write the missing numbers
- Students will play ldquoI have__ Who has __ Teacher will create cards using index cards and numbers in which students need further practice with Students will read their cards aloud Variations of game can include identifying specific numbers identifying numbers more or less etc)
- Students will use base ten blocks to represent numbers including three digit numbers Students will identify representation of numbers through these manipulatives They may match the representation to the written number
- Students will write the number they created using the base ten blocks using their white boards and markers
- Students will arrange given digits to create the greatest and lowest possible numbers They can show each number they create using base ten blocks
- Students will use the Base Ten Exchange Game to show an understanding of exchanging ones for tens and tens for hundreds Students can use place value mats base ten blocks (cubes tens and flats) Students can take number of cubes displayed with roll of single die Students will determine when exchanging can be made when reaching ten units
- Base ten concentration wwwk-5mathteachingresourcescom
- Ten frame compare wwwk-5mathteachingresourcescom
-
Keansburg School DistrictCurriculum System
Mathematicsthe total number of something
Why would you need to count back
How are subtraction and addition related
the sum of each word by adding the numbers on the tiles Students will find which words have the greatest or smallest sum
31
Keansburg School DistrictCurriculum System
MathematicsKeansburg School DistrictCurriculum Management System
SubjectGradeLevelMathematicsGrade 1
Timeline March-Quarter 3
Topic(s) Measurement amp Data
Significance of Learning Goal(s) To tell time and compare measurements
Sugg
este
d D
ays
of
Inst
ruct
ion Content
Standards CPI
Essential Questions
Specific Learning Objective(s)
The Students Will Be Able ToSuggested Activities
Instructional Tools Materials Technology Resources
Assessments and Assessment Models
How would I know if a bar graph correctly shows what is on a tally chart
How could a bar graph answer a question
Do bar graphs make it easier to understand and compare facts Why
What kind
Concept(s) Telling time comparing measurements
SWBAT Identify and write time to
the hour and half hour on both a digital and analog clock
Write time to the hour and half-hour on both digital and analog clocks
Draw the hands on the analog clock for a given time to the hour or half-hour
Relate times to the half hour as ldquohalf-pastrdquo the hour
Compare and contrast
Meets Standard Students will have their own
demonstration clocks students will identify and find the hour and minute hands
Students create their own clocks using paper plates students will manipulate hands to identify varying times
Students will listen to Jack Hartman ldquoTick Tockrdquo song
Teachers and students will view clock on videos on brainpopjrcom students and teachers can complete quizzes available on website
Teachers will present time on an analog clock students will write the digital time on a white board
Students will play clock concentration Teacher will introduce measurement by
holding up objects and the students will examine the objects and explain the size
Large Judy Clock Individual student Judy
clocks Wipe off analogdigital clocks Clock stampers Timers Rulers Yardsticks Measuring tapes Sheet protectors Cardstock Paper plates Fasteners Index cards
Typical Assessment Question(s) or Task(s)
Students will be asked to identify and write time to the hour and half hour on both
32
Keansburg School DistrictCurriculum System
Mathematicsof graph should I use to answer questions
Why do I need to tell time
How many hands does a clock have
Are the hands on the clock the same size
How long is a minute
Why do I need to use a calendar
How do we use the clock and the calendar to determine what we will do in school
Why do we need to measure something
What can
objects by length Construct objects at
contrasting lengths
ordero Students will break into groups
and compare objects further and classify them depending on their size
Teacher will introduce the ruler Explain to students that the ruler is used to measure objects The students will then explore the classroom and select objects around the room that are smaller and larger than the ruler
Teacher will select specific body parts that the students will use as a personal unit of measurement The students will work in pairs to demonstrate how to measure objects around the room using their personal unit of measurement
The teacher will select a classroom object and the students will be asked to illustrate objects in the room that are bigger and smaller in size
The students will be able to organize represent and interpret data up to three categories through the use of a bar graph
The teacher will then divide students into heterogeneous groups and encourage the students to explain what they can learn from the graph The students will present findings following activity
Students will choose an object within classroom then find additional objects one being larger the other being shorter using a two-column chart Draw or write the objects in the chart
digital and analog clocks Students will be asked to
identify the parts of a clock students will be asked to draw the hands on an analog clock for a given time to the hour or half-hour
Students will be given various objects and will further be asked to compare and contrast the lengths of these objects
Students will be asked to provide or create objects contrasting lengths to demonstrate understanding of differences in length
33
Keansburg School DistrictCurriculum System
Mathematicswe use to draw and measure things
What do you think is about 1 inch long
How many steps long do you think it is from the front of the classroom to the back
If we measure in footsteps why are some of the measurements different
How is longer and shorter similar to greater and lesser
Exceeds Standard
The students will work in pairs to locate objects around the room and compare the lengths against each other The pairs will then work with another pair of students and compare the lengths of their objects with the objects the other pair located
Teacher will introduce the ruler in comparison to the yardstick The students will be encouraged to find objects that in the room that are larger than a ruler and measure using the yardstick
After the teacher introduces units of personal measurement the students will be encouraged to measure object in the room using their own unit of personal measurement and convert it into a standard measurement using a ruler or a yardstick
The teacher will select a classroom object and the students will be asked to illustrate objects in the room that are bigger and smaller by a specific size
The students will be able to organize represent and interpret data up to four or more categories through the use of a bar graph
The teacher will then divide students into heterogeneous groups and encourage the students to explain what they can learn from the graph and create a tally chart utilizing the data
Students will create clock flash cards by
34
Keansburg School DistrictCurriculum System
Mathematicsdrawing an analog clock on one side and writing the digital clock time on the other Students will include time in five minute intervals
Pose word problems where students have to find elapse time to the hour and half hour
Introduce second hand and conduct activities that are timed in seconds (Examples hopping on 1 foot blinking eyes counting to the highest number)
35
Keansburg School DistrictCurriculum System
MathematicsKeansburg School DistrictCurriculum Management System
SubjectGradeLevelMathematicsGrade 1
Timeline April-Quarter 4
Topic(s) Geometry
Significance of Learning Goal(s) To identify two and three dimensional shapes to understand fractional parts and create equal shares
Sugg
este
d D
ays
of
Inst
ruct
ion Content
Standards CPI Essential
Questions
Specific Learning Objective(s)
The Students Will Be Able To
Suggested ActivitiesInstructional Tools Materials
Technology Resources Assessments and Assessment
Models
Are there different shapes outside
How are geometric figures alike
How can we sort objects of different shapes
How can shapes and solids be described compared and used to make other shapes
Concept(s) Two and three dimensional shapes fractional parts equal shares
SWBAT
Combine two-dimensional or three-dimensional shapes or figures to create a new composite shape and identify the shapes within
Identify fractional parts of circles and rectangles into equal shares while developing vocabulary for halves fourths and quarters
Describe the whole as
Meets Standard
Determine which shape by touch without using their sight
o Materials attribute blocks shape sheet feely box wwwilluminationsnctmorglessondetail
Sorting 3-dimensional objects students will be given cards with 3-dimensional objects (trash can soup can globe ball tissue box box dice) they will sort them based on the 3-dimensional shape they represent
o 3-dimensional object cards sorting mats
Pizza and Cake Fractions students will utilize a pizza and a cake to work on the concept of fractions while developing the vocabulary halves quarters and fourths
o Materials teacher created pizza
Attribute blocks Geometric shapes 3-dimensional object
cards Sorting maps 3-dimensional shapes Solid and lane figures Geo-boards and rubber
bands Fraction circles Sheet protectors 2-dimensional shapes
Typical Assessment Question(s) or Task(s)
Students will be asked to describe and identify
36
Keansburg School DistrictCurriculum System
MathematicsWhat are equal parts
What foods do you divide into equal parts
What other items might be divided
How do you know if you have an equal share
two of or four of the shares Understand for these examples that decomposing into more equal shares creates smaller shares
and cake that are cut into fractions (construction paper)
Students will illustrate a picture of a boat using at least one three dimensional shape in their drawings Shapes include cubes cylinders spheres cones and rectangular prisms
Solid and Plane Figures Name the Face activity Provide three-dimensional objects Have students draw the face for each object as well as name the shape Examples ABC block juice can book party hat
Introduce fractions by having students identify shapes that show equal parts Display cut out shapes using document camera Include some shapes that are divided equally and some that are not divided equally As a whole group sort shapes into two categories Then have students go back to their desks and work with a partner to classify additional shapes
Provide students with shapes that are divided into four parts Include shapes that are divided into four equal parts and others that are unequal Students identify the shapes that are divided into four equal parts and explain their reasoning
Shape Town activity Students will design a shape town using the following shapes
shapes within combined two and three-dimensional shapes
Students will be given circles and rectangles students will be asked to divide these shapes into halves fourths and quarters
Students will be asked to sort shapes that are divided equally and not divided equally
37
Keansburg School DistrictCurriculum System
Mathematicstrapezoid hexagon square triangle and circle Afterwards students will calculate the total number of each shape they included After completing the activity students will present their final product to the class and explain how they decided which shapes to use
Given an array of dots students will draw shapes with specific number of sides and corners and connect the dots to create the shapes Example Draw a shape with 5 sides Draw a shape with 6 corners
Students will create two-dimensional shapes on geoboards Then using different colored rubber bands students will divide the shapes into equal parts Students will transfer their equally divided shapes onto geoboard paper by drawing lines to show their equal parts
Play the Fraction Path Game Materials Fraction circles a circle with frac12 shaded a circle with 13 shaded and a circle with frac14 shaded Gameboard Path consisting of assorted shapes divided into halves thirds and fourths Players Needed 3 Directions Place the fraction circles facedown Players close their eyes and pick one fraction circle Each player follows the path from start to finish Each player looks at each shape on the path and records how many shapes show their fractions Players record
38
Keansburg School DistrictCurriculum System
Mathematicstheir results on paper using tally marks At end of game students compare total number of shapes that show their fraction
Exceeds Standard
39
Keansburg School DistrictCurriculum System
MathematicsKeansburg School DistrictCurriculum Management System
SubjectGradeLevelMathematicsGrade 1
Timeline May-Quarter 4
Topic(s) Number and Operations in Base Ten
Significance of Learning Goal(s) To use place value to add and subtract
Sugg
este
d D
ays
of
Inst
ruct
ion Content
Standards CPI Essential
Questions
Specific Learning Objective(s)
The Students Will Be Able ToSuggested Activities
Instructional Tools Materials Technology Resources
Assessments and Assessment Models
40
Keansburg School DistrictCurriculum System
MathematicsCPI 1NBT4 1NBT5 1NBT6
EQ How do
numbers help us
How can sets of numbers be counted compared and ordered
How can I use numbers to solve problems
How would putting numbers on a chart make it easier to understand information
How can I make it easier to understand numbers when I sort them
What is place value
Why is place value important
How can I
Concept(s) Use place value and properties of operations to add and subtract
SWBAT Use mental math to find
10 more or ten less than a given two-digit number and explain reasoning used within any number to 120
Use place value to add within 100 add a two-digit number to a one-digit number and add a two-digit number to a multiple of ten
Understand when adding two-digit numbers that ones add to the ones and tens add to the tens and sometimes it is necessary to compose a ten by regrouping
For all above objects students will use concrete models and strategies based on place value and relate the strategy to a written method and explain the reasoning used
Subtract multiples of 10 in the range 10-90 from multiples of 10 in the range 10-90 using
Meets Standard
Comparing two digit numbers wwwk-5mathteachingresourcescom
Subtraction split wwwk-5mathteachingresourcescom
Ten more wwwk-5mathteachingresourcescom
Addition split wwwk-5mathteachingresourcescom
Exceeds Standard
Comparing 3-Digit numbers wwwk-5mathteachingresourcescom
What number is wwwk-5mathteachingresourcescom
Students develop addition and subtraction number stories and have partners solve
Create pictures using basendash10 blocks Students trace picture onto paper label the base ten blocks with their value and add total
Solve number grid puzzles by adding and subtraction 10 on the number grid
Number cards Base 10 blocks Counters Number grid puzzles Sleeve protectors wwwk-
5mathteachingresourcescom
Dice
Typical Assessment Question(s) or Task(s)
Recognize numbers 1-120 using flashcards
Write numbers 1-20 using block or graph paper
Build two-digit numbers using tens and ones blocks
Listen and note students skip counting orally by tens to 120
Students compare and label two numbers using relation symbols
41
Keansburg School DistrictCurriculum System
Mathematics
42
Keansburg School DistrictCurriculum System
MathematicsKeansburg School DistrictCurriculum Management System
SubjectGradeLevelMathematicsGrade 1
Timeline June-Quarter 4
Topic(s) Readiness skills for September of Grade 2
Significance of Learning Goal(s) To compare larger numbers add fluently and apply measurement skills
Sugg
este
d D
ays
of
Inst
ruct
ion Content
Standards CPI Essential Questions
Specific Learning Objective(s)
The Students Will Be Able ToSuggested Activities
Instructional Tools Materials Technology Resources
Assessments and Assessment Models
CPI
EQ How can I use
place value to compare and
order numbers in the 100s
How can mastering basic addition and subtraction facts help me compute larger numbers
How can I tie in
Concept(s)Use place value to compare larger numbers fluently add up to 20 apply measurement skills
SWBAT Extend place value into
the hundreds place and re-write and construct models beyond the hundreds
Fluently add and subtract within 20 using mental strategies
Apply measurement skills
Meets Standard Place Value barrier game httpwwwk-
5mathteachingresourcescommath-gameshtml (place value only)
High card
httpwwwlearningboxcomBase10 BaseTenhtml
Time barrier game httpwwwk-5mathteachingresourcescomsupport-filestimebarriergamepdf httpwwwk-5mathteachingresourcescomsupport-filestimebarriergamegridpdf
My favorite time of day writing activity
number cards base ten blocks rulers tape measurer string number relationship mat paper plates cotton balls judy clock digital clock
Typical Assessment Question(s) or Task(s)
Students will solve addition and subtraction problems within 20 in a given time
43
Keansburg School DistrictCurriculum System
Mathematicsmeasurement skills with real life experiences
httpwwwk-5mathteachingresourcescomsupport-filesmy-favorite-time-of-daypdf
Estimating length httpwwwk-5mathteachingresourcescomsupport-filesestimatinglengthpdf
Olympic golf plastic golf clubs cotton balls and tape measurer
Olympic smiles measuring smiles with string and rulers
Olympic Frisbee using paper plates and tape measurer
Olympic airplane students will make paper airplanes measure the distance that they can throw their airplane
Doubles plus 1 game httpwwwk-5mathteachingresourcescomsupport-filesdoubles-plus-onepdf
Eleven more httpwwwk-5mathteachingresourcescomsupport-fileselevenmorepdf
frame Students will be asked to
measure items using inches and centimeters
Identify and create numbers with place values extending into the hundreds place
44
Keansburg School DistrictCurriculum System
Mathematics
Building numbers with base ten blocks pick three cards and arrange them to show a 3-digit number build that number with base ten blocks repeat with the same three cards until no new numbers can be made
Length strength inches httpwwwharcourtschoolcomactivitylength_strength1_inches
Length strength centimeters httpwwwharcourtschoolcomactivitylength_strength1_centi
Exceeds Standard
Number relationship mat wwwk-5mathteachingresourcescom
Place value barrier game httpwwwk-5mathteachingresourcescommath-gameshtml (integrate other skills into place values for example the digit in my 10s place is four doubled)
Measuring the mousersquos path httpwwwk-5mathteachingresourcescomsupport-filespaths1pdf
45
Keansburg School DistrictCurriculum System
Mathematics
Double minus 1 game httpwwwk-5mathteachingresourcescomsupport-filesdoubles-minus-onepdf
Number relationship mat httpwwwk-5mathteachingresourcescomsupport-filesnumberrelationshipmatpdf
46
Keansburg School DistrictCurriculum System
Mathematicsignment Matrices of Common Core State Standards
Grade Strand Standard Standard
Sept
embe
r ndash
Oct
ober
Nov
embe
r ndash
Dec
embe
r
Janu
ary
ndash Fe
brua
ry
Mar
ch ndash
Apr
il
May
- Ju
ne
1 OA 1
CC1OA1 Represent and solve problems involving addition and subtraction Use addition and subtraction within 20 to solve word problems involving situations of adding to taking from putting together taking apart and comparing with unknowns in all positions eg by using objects drawings and equations with a symbol for the unknown number to represent the problem
1 OA 2
CC1OA2 Represent and solve problems involving addition and subtraction Solve word problems that call for addition of three whole numbers whose sum is less than or equal to 20 eg by using objects drawings and equations with a symbol for the unknown number to represent the problem
1 OA 3
CC1OA3 Understand and apply properties of operations and the relationship between addition and subtraction Apply properties of operations as strategies to add and subtract Examples If 8 + 3 = 11 is known then 3 + 8 = 11 is also known (Commutative property of addition) To add 2 + 6 + 4 the second two numbers can be added to make a ten so 2 + 6 + 4 = 2 + 10 = 12 (Associative property of addition) (Students need not use formal terms for these properties)
1 OA 4
CC1OA4 Understand and apply properties of operations and the relationship between addition and subtraction Understand subtraction as an unknown-addend problem For example subtract 10 ndash 8 by finding the number that makes 10 when added to 8
1 OA 5 CC1OA5 Add and subtract within 20 Relate counting to addition and subtraction (eg by counting on 2 to add 2)
1 OA 6 CC1OA6 Add and subtract within 20 Add and subtract within 20 demonstrating fluency for addition and subtraction within 10 Use strategies such as counting on making ten (eg 8 + 6 = 8 + 2 + 4 = 10 + 4 = 14) decomposing a number leading to a ten (eg 13 ndash 4 = 13 ndash 3 ndash 1 = 10 ndash 1 = 9) using the relationship between addition and subtraction (eg knowing that 8 + 4
47
Keansburg School DistrictCurriculum System
Mathematics= 12 one knows 12 ndash 8 = 4) and creating equivalent but easier or known sums (eg adding 6 + 7 by creating the known equivalent 6 + 6 + 1 = 12 + 1 = 13)
1 OA 7
CC1OA7 Work with addition and subtraction equations Understand the meaning of the equal sign and determine if equations involving addition and subtraction are true or false For example which of the following equations are true and which are false 6 = 6 7 = 8 ndash 1 5 + 2 = 2 + 5 4 + 1 = 5 + 2
1 OA 8
CC1OA8 Work with addition and subtraction equations Determine the unknown whole number in an addition or subtraction equation relating three whole numbers For example determine the unknown number that makes the equation true in each of the equations 8 + = 11 5 = _ ndash 3 6 + 6 = _
1 NBT 1
CC1NBT1 Extend the counting sequence Count to 120 starting at any number less than 120 In this range read and write numerals and represent a number of objects with a written numeral
1 NBT 2
CC1NBT2 Understand place value Understand that the two digits of a two-digit number represent amounts of tens and ones Understand the following as special cases -- a 10 can be thought of as a bundle of ten ones mdash called a ldquotenrdquo -- b The numbers from 11 to 19 are composed of a ten and one two three four five six seven eight or nine ones -- c The numbers 10 20 30 40 50 60 70 80 90 refer to one two three four five six seven eight or nine tens (and 0 ones)
1 NBT 3
CC1NBT3 Understand place value Compare two two-digit numbers based on meanings of the tens and ones digits recording the results of comparisons with the symbols gt = and lt
1 NBT 4
CC1NBT4 Use place value understanding and properties of operations to add and subtract Add within 100 including adding a two-digit number and a one-digit number and adding a two-digit number and a multiple of 10 using concrete models or drawings and strategies based on place value properties of operations andor the relationship between addition and subtraction relate the strategy to a written method and explain the reasoning used Understand that in adding two-digit numbers one adds tens and tens ones and ones and sometimes it is necessary to compose a ten
1 NBT 5
CC1NBT5 Use place value understanding and properties of operations to add and subtract Given a two-digit number mentally find 10 more or 10 less than the number without having to count explain the reasoning used
1 NBT 6 CC1NBT6 Use place value understanding and properties of operations to add and subtract Subtract multiples of 10 in the range 10-90 from multiples of 10 in the range 10-90 (positive or zero differences) using concrete models or drawings and strategies based on place value properties of operations andor
48
Keansburg School DistrictCurriculum System
Mathematicsthe relationship between addition and subtraction relate the strategy to a written method and explain the reasoning used
1 MD 1
CC1MD1 Measure lengths indirectly and by iterating length units Order three objects by length compare the lengths of two objects indirectly by using a third object
1 MD 2
CC1MD2 Measure lengths indirectly and by iterating length units Express the length of an object as a whole number of length units by laying multiple copies of a shorter object (the length unit) end to end understand that the length measurement of an object is the number of same-size length units that span it with no gaps or overlaps Limit to contexts where the object being measured is spanned by a whole number of length units with no gaps or overlaps
1 MD 3CC1MD3 Tell and write time Tell and write time in hours and half-hours using analog and digital clocks
1 MD 4
CC1MD4 Represent and interpret data Organize represent and interpret data with up to three categories ask and answer questions about the total number of data points how many in each category and how many more or less are in one category than in another
1 G 1
CC1G1 Reason with shapes and their attributes Distinguish between defining attributes (eg triangles are closed and three-sided) versus non-defining attributes (eg color orientation overall size) for a wide variety of shapes build and draw shapes to possess defining attributes
1 G 2
CC1G2 Reason with shapes and their attributes Compose two-dimensional shapes (rectangles squares trapezoids triangles half-circles and quarter-circles) or three-dimensional shapes (cubes right rectangular prisms right circular cones and right circular cylinders) to create a composite shape and compose new shapes from the composite shape (Students do not need to learn formal names such as ldquoright rectangular prismrdquo)
1 G 3
CC1G3 Reason with shapes and their attributes Partition circles and rectangles into two and four equal shares describe the shares using the words halves fourths and quarters and use the phrases half of fourth of and quarter of Describe the whole as two of or four of the shares Understand for these examples that decomposing into more equal shares creates smaller shares
49
Keansburg School DistrictCurriculum System
Mathematics
Common Core State Standards Vocabulary
Addition and subtraction within 5 10 20 100 or 1000 Addition or subtraction of two whole numbers with whole number answers and with sum or minuend in the range 0-5 0-10 0-20 or 0-100 respectively Example 8 + 2 = 10 is an addition within 10 14 ndash 5 = 9 is a subtraction within 20 and 55 ndash 18 = 37 is a subtraction within 100
Additive inverses Two numbers whose sum is 0 are additive inverses of one another Example 34 and ndash 34 are additive inverses of one another because 34 + (ndash 34) = (ndash 34) + 34 = 0
Associative property of addition See Table 3 in this Glossary
Associative property of multiplication See Table 3 in this Glossary
Bivariate data Pairs of linked numerical observations Example a list of heights and weights for each player on a football team
Box plot A method of visually displaying a distribution of data values by using the median quartiles and extremes of the data set A box shows the middle 50 of the data1
Commutative property See Table 3 in this Glossary
Complex fraction A fraction AB where A andor B are fractions (B nonzero)
Computation algorithm A set of predefined steps applicable to a class of problems that gives the correct result in every case when the steps are carried out correctly See also computation strategy
Computation strategy Purposeful manipulations that may be chosen for specific problems may not have a fixed order and may be aimed at converting one problem into another See also computation algorithm
Congruent Two plane or solid figures are congruent if one can be obtained from the other by rigid motion (a sequence of rotations reflections and translations)
Counting on A strategy for finding the number of objects in a group without having to count every member of the group For example if a stack of books is known to have 8 books and 3 more books are added to the top it is not necessary to count the stack
50
Keansburg School DistrictCurriculum System
Mathematicsall over again One can find the total by counting onmdashpointing to the top book and saying ldquoeightrdquo following this with ldquonine ten eleven There are eleven books nowrdquo
Dot plot See line plot
Dilation A transformation that moves each point along the ray through the point emanating from a fixed center and multiplies distances from the center by a common scale factor
Expanded form A multi-digit number is expressed in expanded form when it is written as a sum of single-digit multiples of powers of ten For example 643 = 600 + 40 + 3
Expected value For a random variable the weighted average of its possible values with weights given by their respective probabilities
First quartile For a data set with median M the first quartile is the median of the data values less than M Example For the data set 1 3 6 7 10 12 14 15 22 120 the first quartile is 62 See also median third quartile interquartile range
Fraction A number expressible in the form ab where a is a whole number and b is a positive whole number (The word fraction in these standards always refers to a non-negative number) See also rational number
Identity property of 0 See Table 3 in this Glossary
Independently combined probability models Two probability models are said to be combined independently if the probability of each ordered pair in the combined model equals the product of the original probabilities of the two individual outcomes in the ordered pair
Integer A number expressible in the form a or ndasha for some whole number a
Interquartile Range A measure of variation in a set of numerical data the interquartile range is the distance between the first and third quartiles of the data set Example For the data set 1 3 6 7 10 12 14 15 22 120 the interquartile range is 15 ndash 6 = 9 See also first quartile third quartile
Line plot A method of visually displaying a distribution of data values where each data value is shown as a dot or mark above a number line Also known as a dot plot3
51
Keansburg School DistrictCurriculum System
MathematicsMean A measure of center in a set of numerical data computed by adding the values in a list and then dividing by the number of values in the list4 Example For the data set 1 3 6 7 10 12 14 15 22 120 the mean is 21
Mean absolute deviation A measure of variation in a set of numerical data computed by adding the distances between each data value and the mean then dividing by the number of data values Example For the data set 2 3 6 7 10 12 14 15 22 120 the mean absolute deviation is 20
Median A measure of center in a set of numerical data The median of a list of values is the value appearing at the center of a sorted version of the listmdashor the mean of the two central values if the list contains an even number of values Example For the data set 2 3 6 7 10 12 14 15 22 90 the median is 11
Midline In the graph of a trigonometric function the horizontal line halfway between its maximum and minimum values
Multiplication and division within 100 Multiplication or division of two whole numbers with whole number answers and with product or dividend in the range 0-100 Example 72 divide 8 = 9
Multiplicative inverses Two numbers whose product is 1 are multiplicative inverses of one another Example 34 and 43 are multiplicative inverses of one another because 34 times 43 = 43 times 34 = 1
Number line diagram A diagram of the number line used to represent numbers and support reasoning about them In a number line diagram for measurement quantities the interval from 0 to 1 on the diagram represents the unit of measure for the quantity
Percent rate of change A rate of change expressed as a percent Example if a population grows from 50 to 55 in a year it grows by 550 = 10 per year
Probability distribution The set of possible values of a random variable with a probability assigned to each
Properties of operations See Table 3 in this Glossary
Properties of equality See Table 4 in this Glossary
Properties of inequality See Table 5 in this Glossary
Properties of operations See Table 3 in this Glossary
52
Keansburg School DistrictCurriculum System
MathematicsProbability A number between 0 and 1 used to quantify likelihood for processes that have uncertain outcomes (such as tossing a coin selecting a person at random from a group of people tossing a ball at a target or testing for a medical condition)
Probability model A probability model is used to assign probabilities to outcomes of a chance process by examining the nature of the process The set of all outcomes is called the sample space and their probabilities sum to 1 See also uniform probability model
Random variable An assignment of a numerical value to each outcome in a sample space
Rational expression A quotient of two polynomials with a non-zero denominator
Rational number A number expressible in the form ab or ndash ab for some fraction ab The rational numbers include the integers
Rectilinear figure A polygon all angles of which are right angles
Rigid motion A transformation of points in space consisting of a sequence of one or more translations reflections andor rotations Rigid motions are here assumed to preserve distances and angle measures
Repeating decimal The decimal form of a rational number See also terminating decimal
Sample space In a probability model for a random process a list of the individual outcomes that are to be considered
Scatter plot A graph in the coordinate plane representing a set of bivariate data For example the heights and weights of a group of people could be displayed on a scatter plot5
Similarity transformation A rigid motion followed by a dilation
Tape diagram A drawing that looks like a segment of tape used to illustrate number relationships Also known as a strip diagram bar model fraction strip or length model
Terminating decimal A decimal is called terminating if its repeating digit is 0
Third quartile For a data set with median M the third quartile is the median of the data values greater than M Example For the data set 2 3 6 7 10 12 14 15 22 120 the third quartile is 15 See also median first quartile interquartile range
Transitivity principle for indirect measurement If the length of object A is greater than the length of object B and the length of object B is greater than the length of object C then the length of object A is greater than the length of object C This principle applies
53
Keansburg School DistrictCurriculum System
Mathematicsto measurement of other quantities as well
Uniform probability model A probability model which assigns equal probability to all outcomes See also probability model
Vector A quantity with magnitude and direction in the plane or in space defined by an ordered pair or triple of real numbers
Visual fraction model A tape diagram number line diagram or area model
Whole numbers The numbers 0 1 2 3 hellip5
54
- MissionVision Statement
- Beliefs
- Measurement amp Data
- Measure lengths and by iterating length units
- Tell and write time
- Represent and interpret data
- Geometry
- Reason with shapes and their attributes
- Number and Base Ten
- Extend the counting sequence
- Understand place value
-
- Measurement amp Data (II)
-
- Measure lengths and by iterating length units
- Tell and write time
-
- Represent and interpret data
- Geometry (II)
- Reason with shapes their attributes
-
- Number and Base Ten
- Use place value understanding and properties of operations to add and subtract
- Teacher will cover up specific numbers on an enlarged number grid using cover up tape to have students identify numbers before and after Students will come up and write the missing numbers
- Students will play ldquoI have__ Who has __ Teacher will create cards using index cards and numbers in which students need further practice with Students will read their cards aloud Variations of game can include identifying specific numbers identifying numbers more or less etc)
- Students will use base ten blocks to represent numbers including three digit numbers Students will identify representation of numbers through these manipulatives They may match the representation to the written number
- Students will write the number they created using the base ten blocks using their white boards and markers
- Students will arrange given digits to create the greatest and lowest possible numbers They can show each number they create using base ten blocks
- Students will use the Base Ten Exchange Game to show an understanding of exchanging ones for tens and tens for hundreds Students can use place value mats base ten blocks (cubes tens and flats) Students can take number of cubes displayed with roll of single die Students will determine when exchanging can be made when reaching ten units
- Base ten concentration wwwk-5mathteachingresourcescom
- Ten frame compare wwwk-5mathteachingresourcescom
-
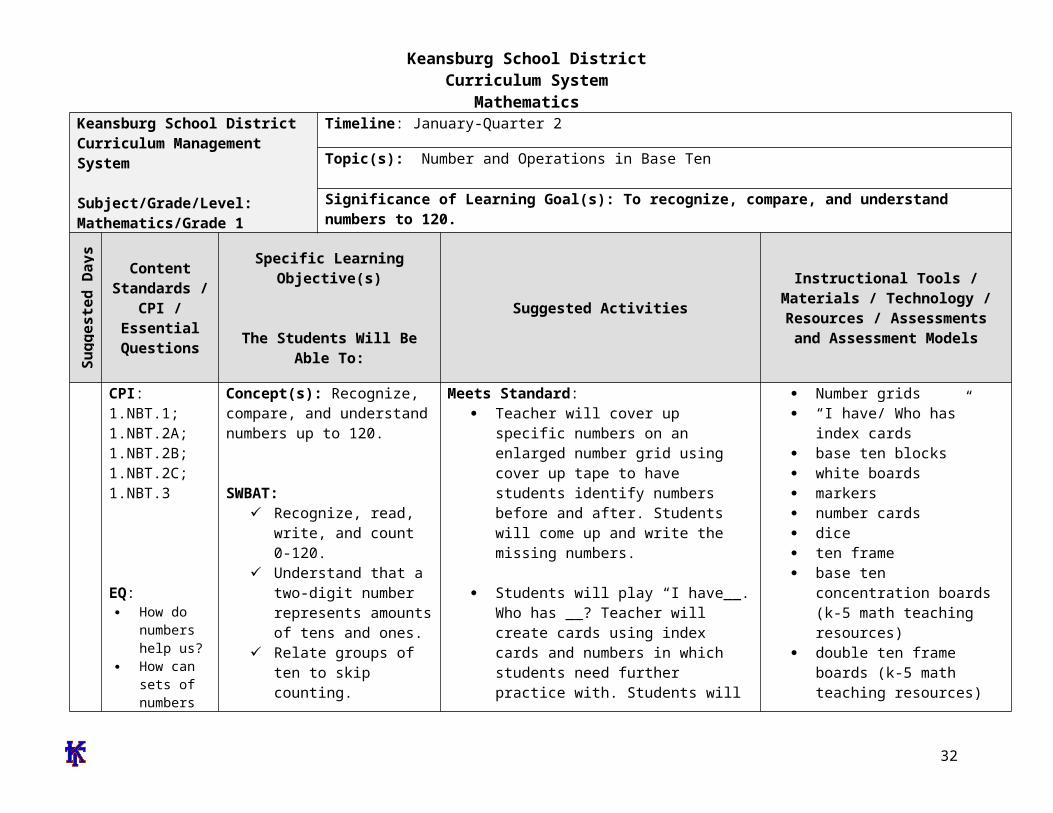
Keansburg School DistrictCurriculum System
MathematicsKeansburg School DistrictCurriculum Management System
SubjectGradeLevelMathematicsGrade 1
Timeline March-Quarter 3
Topic(s) Measurement amp Data
Significance of Learning Goal(s) To tell time and compare measurements
Sugg
este
d D
ays
of
Inst
ruct
ion Content
Standards CPI
Essential Questions
Specific Learning Objective(s)
The Students Will Be Able ToSuggested Activities
Instructional Tools Materials Technology Resources
Assessments and Assessment Models
How would I know if a bar graph correctly shows what is on a tally chart
How could a bar graph answer a question
Do bar graphs make it easier to understand and compare facts Why
What kind
Concept(s) Telling time comparing measurements
SWBAT Identify and write time to
the hour and half hour on both a digital and analog clock
Write time to the hour and half-hour on both digital and analog clocks
Draw the hands on the analog clock for a given time to the hour or half-hour
Relate times to the half hour as ldquohalf-pastrdquo the hour
Compare and contrast
Meets Standard Students will have their own
demonstration clocks students will identify and find the hour and minute hands
Students create their own clocks using paper plates students will manipulate hands to identify varying times
Students will listen to Jack Hartman ldquoTick Tockrdquo song
Teachers and students will view clock on videos on brainpopjrcom students and teachers can complete quizzes available on website
Teachers will present time on an analog clock students will write the digital time on a white board
Students will play clock concentration Teacher will introduce measurement by
holding up objects and the students will examine the objects and explain the size
Large Judy Clock Individual student Judy
clocks Wipe off analogdigital clocks Clock stampers Timers Rulers Yardsticks Measuring tapes Sheet protectors Cardstock Paper plates Fasteners Index cards
Typical Assessment Question(s) or Task(s)
Students will be asked to identify and write time to the hour and half hour on both
32
Keansburg School DistrictCurriculum System
Mathematicsof graph should I use to answer questions
Why do I need to tell time
How many hands does a clock have
Are the hands on the clock the same size
How long is a minute
Why do I need to use a calendar
How do we use the clock and the calendar to determine what we will do in school
Why do we need to measure something
What can
objects by length Construct objects at
contrasting lengths
ordero Students will break into groups
and compare objects further and classify them depending on their size
Teacher will introduce the ruler Explain to students that the ruler is used to measure objects The students will then explore the classroom and select objects around the room that are smaller and larger than the ruler
Teacher will select specific body parts that the students will use as a personal unit of measurement The students will work in pairs to demonstrate how to measure objects around the room using their personal unit of measurement
The teacher will select a classroom object and the students will be asked to illustrate objects in the room that are bigger and smaller in size
The students will be able to organize represent and interpret data up to three categories through the use of a bar graph
The teacher will then divide students into heterogeneous groups and encourage the students to explain what they can learn from the graph The students will present findings following activity
Students will choose an object within classroom then find additional objects one being larger the other being shorter using a two-column chart Draw or write the objects in the chart
digital and analog clocks Students will be asked to
identify the parts of a clock students will be asked to draw the hands on an analog clock for a given time to the hour or half-hour
Students will be given various objects and will further be asked to compare and contrast the lengths of these objects
Students will be asked to provide or create objects contrasting lengths to demonstrate understanding of differences in length
33
Keansburg School DistrictCurriculum System
Mathematicswe use to draw and measure things
What do you think is about 1 inch long
How many steps long do you think it is from the front of the classroom to the back
If we measure in footsteps why are some of the measurements different
How is longer and shorter similar to greater and lesser
Exceeds Standard
The students will work in pairs to locate objects around the room and compare the lengths against each other The pairs will then work with another pair of students and compare the lengths of their objects with the objects the other pair located
Teacher will introduce the ruler in comparison to the yardstick The students will be encouraged to find objects that in the room that are larger than a ruler and measure using the yardstick
After the teacher introduces units of personal measurement the students will be encouraged to measure object in the room using their own unit of personal measurement and convert it into a standard measurement using a ruler or a yardstick
The teacher will select a classroom object and the students will be asked to illustrate objects in the room that are bigger and smaller by a specific size
The students will be able to organize represent and interpret data up to four or more categories through the use of a bar graph
The teacher will then divide students into heterogeneous groups and encourage the students to explain what they can learn from the graph and create a tally chart utilizing the data
Students will create clock flash cards by
34
Keansburg School DistrictCurriculum System
Mathematicsdrawing an analog clock on one side and writing the digital clock time on the other Students will include time in five minute intervals
Pose word problems where students have to find elapse time to the hour and half hour
Introduce second hand and conduct activities that are timed in seconds (Examples hopping on 1 foot blinking eyes counting to the highest number)
35
Keansburg School DistrictCurriculum System
MathematicsKeansburg School DistrictCurriculum Management System
SubjectGradeLevelMathematicsGrade 1
Timeline April-Quarter 4
Topic(s) Geometry
Significance of Learning Goal(s) To identify two and three dimensional shapes to understand fractional parts and create equal shares
Sugg
este
d D
ays
of
Inst
ruct
ion Content
Standards CPI Essential
Questions
Specific Learning Objective(s)
The Students Will Be Able To
Suggested ActivitiesInstructional Tools Materials
Technology Resources Assessments and Assessment
Models
Are there different shapes outside
How are geometric figures alike
How can we sort objects of different shapes
How can shapes and solids be described compared and used to make other shapes
Concept(s) Two and three dimensional shapes fractional parts equal shares
SWBAT
Combine two-dimensional or three-dimensional shapes or figures to create a new composite shape and identify the shapes within
Identify fractional parts of circles and rectangles into equal shares while developing vocabulary for halves fourths and quarters
Describe the whole as
Meets Standard
Determine which shape by touch without using their sight
o Materials attribute blocks shape sheet feely box wwwilluminationsnctmorglessondetail
Sorting 3-dimensional objects students will be given cards with 3-dimensional objects (trash can soup can globe ball tissue box box dice) they will sort them based on the 3-dimensional shape they represent
o 3-dimensional object cards sorting mats
Pizza and Cake Fractions students will utilize a pizza and a cake to work on the concept of fractions while developing the vocabulary halves quarters and fourths
o Materials teacher created pizza
Attribute blocks Geometric shapes 3-dimensional object
cards Sorting maps 3-dimensional shapes Solid and lane figures Geo-boards and rubber
bands Fraction circles Sheet protectors 2-dimensional shapes
Typical Assessment Question(s) or Task(s)
Students will be asked to describe and identify
36
Keansburg School DistrictCurriculum System
MathematicsWhat are equal parts
What foods do you divide into equal parts
What other items might be divided
How do you know if you have an equal share
two of or four of the shares Understand for these examples that decomposing into more equal shares creates smaller shares
and cake that are cut into fractions (construction paper)
Students will illustrate a picture of a boat using at least one three dimensional shape in their drawings Shapes include cubes cylinders spheres cones and rectangular prisms
Solid and Plane Figures Name the Face activity Provide three-dimensional objects Have students draw the face for each object as well as name the shape Examples ABC block juice can book party hat
Introduce fractions by having students identify shapes that show equal parts Display cut out shapes using document camera Include some shapes that are divided equally and some that are not divided equally As a whole group sort shapes into two categories Then have students go back to their desks and work with a partner to classify additional shapes
Provide students with shapes that are divided into four parts Include shapes that are divided into four equal parts and others that are unequal Students identify the shapes that are divided into four equal parts and explain their reasoning
Shape Town activity Students will design a shape town using the following shapes
shapes within combined two and three-dimensional shapes
Students will be given circles and rectangles students will be asked to divide these shapes into halves fourths and quarters
Students will be asked to sort shapes that are divided equally and not divided equally
37
Keansburg School DistrictCurriculum System
Mathematicstrapezoid hexagon square triangle and circle Afterwards students will calculate the total number of each shape they included After completing the activity students will present their final product to the class and explain how they decided which shapes to use
Given an array of dots students will draw shapes with specific number of sides and corners and connect the dots to create the shapes Example Draw a shape with 5 sides Draw a shape with 6 corners
Students will create two-dimensional shapes on geoboards Then using different colored rubber bands students will divide the shapes into equal parts Students will transfer their equally divided shapes onto geoboard paper by drawing lines to show their equal parts
Play the Fraction Path Game Materials Fraction circles a circle with frac12 shaded a circle with 13 shaded and a circle with frac14 shaded Gameboard Path consisting of assorted shapes divided into halves thirds and fourths Players Needed 3 Directions Place the fraction circles facedown Players close their eyes and pick one fraction circle Each player follows the path from start to finish Each player looks at each shape on the path and records how many shapes show their fractions Players record
38
Keansburg School DistrictCurriculum System
Mathematicstheir results on paper using tally marks At end of game students compare total number of shapes that show their fraction
Exceeds Standard
39
Keansburg School DistrictCurriculum System
MathematicsKeansburg School DistrictCurriculum Management System
SubjectGradeLevelMathematicsGrade 1
Timeline May-Quarter 4
Topic(s) Number and Operations in Base Ten
Significance of Learning Goal(s) To use place value to add and subtract
Sugg
este
d D
ays
of
Inst
ruct
ion Content
Standards CPI Essential
Questions
Specific Learning Objective(s)
The Students Will Be Able ToSuggested Activities
Instructional Tools Materials Technology Resources
Assessments and Assessment Models
40
Keansburg School DistrictCurriculum System
MathematicsCPI 1NBT4 1NBT5 1NBT6
EQ How do
numbers help us
How can sets of numbers be counted compared and ordered
How can I use numbers to solve problems
How would putting numbers on a chart make it easier to understand information
How can I make it easier to understand numbers when I sort them
What is place value
Why is place value important
How can I
Concept(s) Use place value and properties of operations to add and subtract
SWBAT Use mental math to find
10 more or ten less than a given two-digit number and explain reasoning used within any number to 120
Use place value to add within 100 add a two-digit number to a one-digit number and add a two-digit number to a multiple of ten
Understand when adding two-digit numbers that ones add to the ones and tens add to the tens and sometimes it is necessary to compose a ten by regrouping
For all above objects students will use concrete models and strategies based on place value and relate the strategy to a written method and explain the reasoning used
Subtract multiples of 10 in the range 10-90 from multiples of 10 in the range 10-90 using
Meets Standard
Comparing two digit numbers wwwk-5mathteachingresourcescom
Subtraction split wwwk-5mathteachingresourcescom
Ten more wwwk-5mathteachingresourcescom
Addition split wwwk-5mathteachingresourcescom
Exceeds Standard
Comparing 3-Digit numbers wwwk-5mathteachingresourcescom
What number is wwwk-5mathteachingresourcescom
Students develop addition and subtraction number stories and have partners solve
Create pictures using basendash10 blocks Students trace picture onto paper label the base ten blocks with their value and add total
Solve number grid puzzles by adding and subtraction 10 on the number grid
Number cards Base 10 blocks Counters Number grid puzzles Sleeve protectors wwwk-
5mathteachingresourcescom
Dice
Typical Assessment Question(s) or Task(s)
Recognize numbers 1-120 using flashcards
Write numbers 1-20 using block or graph paper
Build two-digit numbers using tens and ones blocks
Listen and note students skip counting orally by tens to 120
Students compare and label two numbers using relation symbols
41
Keansburg School DistrictCurriculum System
Mathematics
42
Keansburg School DistrictCurriculum System
MathematicsKeansburg School DistrictCurriculum Management System
SubjectGradeLevelMathematicsGrade 1
Timeline June-Quarter 4
Topic(s) Readiness skills for September of Grade 2
Significance of Learning Goal(s) To compare larger numbers add fluently and apply measurement skills
Sugg
este
d D
ays
of
Inst
ruct
ion Content
Standards CPI Essential Questions
Specific Learning Objective(s)
The Students Will Be Able ToSuggested Activities
Instructional Tools Materials Technology Resources
Assessments and Assessment Models
CPI
EQ How can I use
place value to compare and
order numbers in the 100s
How can mastering basic addition and subtraction facts help me compute larger numbers
How can I tie in
Concept(s)Use place value to compare larger numbers fluently add up to 20 apply measurement skills
SWBAT Extend place value into
the hundreds place and re-write and construct models beyond the hundreds
Fluently add and subtract within 20 using mental strategies
Apply measurement skills
Meets Standard Place Value barrier game httpwwwk-
5mathteachingresourcescommath-gameshtml (place value only)
High card
httpwwwlearningboxcomBase10 BaseTenhtml
Time barrier game httpwwwk-5mathteachingresourcescomsupport-filestimebarriergamepdf httpwwwk-5mathteachingresourcescomsupport-filestimebarriergamegridpdf
My favorite time of day writing activity
number cards base ten blocks rulers tape measurer string number relationship mat paper plates cotton balls judy clock digital clock
Typical Assessment Question(s) or Task(s)
Students will solve addition and subtraction problems within 20 in a given time
43
Keansburg School DistrictCurriculum System
Mathematicsmeasurement skills with real life experiences
httpwwwk-5mathteachingresourcescomsupport-filesmy-favorite-time-of-daypdf
Estimating length httpwwwk-5mathteachingresourcescomsupport-filesestimatinglengthpdf
Olympic golf plastic golf clubs cotton balls and tape measurer
Olympic smiles measuring smiles with string and rulers
Olympic Frisbee using paper plates and tape measurer
Olympic airplane students will make paper airplanes measure the distance that they can throw their airplane
Doubles plus 1 game httpwwwk-5mathteachingresourcescomsupport-filesdoubles-plus-onepdf
Eleven more httpwwwk-5mathteachingresourcescomsupport-fileselevenmorepdf
frame Students will be asked to
measure items using inches and centimeters
Identify and create numbers with place values extending into the hundreds place
44
Keansburg School DistrictCurriculum System
Mathematics
Building numbers with base ten blocks pick three cards and arrange them to show a 3-digit number build that number with base ten blocks repeat with the same three cards until no new numbers can be made
Length strength inches httpwwwharcourtschoolcomactivitylength_strength1_inches
Length strength centimeters httpwwwharcourtschoolcomactivitylength_strength1_centi
Exceeds Standard
Number relationship mat wwwk-5mathteachingresourcescom
Place value barrier game httpwwwk-5mathteachingresourcescommath-gameshtml (integrate other skills into place values for example the digit in my 10s place is four doubled)
Measuring the mousersquos path httpwwwk-5mathteachingresourcescomsupport-filespaths1pdf
45
Keansburg School DistrictCurriculum System
Mathematics
Double minus 1 game httpwwwk-5mathteachingresourcescomsupport-filesdoubles-minus-onepdf
Number relationship mat httpwwwk-5mathteachingresourcescomsupport-filesnumberrelationshipmatpdf
46
Keansburg School DistrictCurriculum System
Mathematicsignment Matrices of Common Core State Standards
Grade Strand Standard Standard
Sept
embe
r ndash
Oct
ober
Nov
embe
r ndash
Dec
embe
r
Janu
ary
ndash Fe
brua
ry
Mar
ch ndash
Apr
il
May
- Ju
ne
1 OA 1
CC1OA1 Represent and solve problems involving addition and subtraction Use addition and subtraction within 20 to solve word problems involving situations of adding to taking from putting together taking apart and comparing with unknowns in all positions eg by using objects drawings and equations with a symbol for the unknown number to represent the problem
1 OA 2
CC1OA2 Represent and solve problems involving addition and subtraction Solve word problems that call for addition of three whole numbers whose sum is less than or equal to 20 eg by using objects drawings and equations with a symbol for the unknown number to represent the problem
1 OA 3
CC1OA3 Understand and apply properties of operations and the relationship between addition and subtraction Apply properties of operations as strategies to add and subtract Examples If 8 + 3 = 11 is known then 3 + 8 = 11 is also known (Commutative property of addition) To add 2 + 6 + 4 the second two numbers can be added to make a ten so 2 + 6 + 4 = 2 + 10 = 12 (Associative property of addition) (Students need not use formal terms for these properties)
1 OA 4
CC1OA4 Understand and apply properties of operations and the relationship between addition and subtraction Understand subtraction as an unknown-addend problem For example subtract 10 ndash 8 by finding the number that makes 10 when added to 8
1 OA 5 CC1OA5 Add and subtract within 20 Relate counting to addition and subtraction (eg by counting on 2 to add 2)
1 OA 6 CC1OA6 Add and subtract within 20 Add and subtract within 20 demonstrating fluency for addition and subtraction within 10 Use strategies such as counting on making ten (eg 8 + 6 = 8 + 2 + 4 = 10 + 4 = 14) decomposing a number leading to a ten (eg 13 ndash 4 = 13 ndash 3 ndash 1 = 10 ndash 1 = 9) using the relationship between addition and subtraction (eg knowing that 8 + 4
47
Keansburg School DistrictCurriculum System
Mathematics= 12 one knows 12 ndash 8 = 4) and creating equivalent but easier or known sums (eg adding 6 + 7 by creating the known equivalent 6 + 6 + 1 = 12 + 1 = 13)
1 OA 7
CC1OA7 Work with addition and subtraction equations Understand the meaning of the equal sign and determine if equations involving addition and subtraction are true or false For example which of the following equations are true and which are false 6 = 6 7 = 8 ndash 1 5 + 2 = 2 + 5 4 + 1 = 5 + 2
1 OA 8
CC1OA8 Work with addition and subtraction equations Determine the unknown whole number in an addition or subtraction equation relating three whole numbers For example determine the unknown number that makes the equation true in each of the equations 8 + = 11 5 = _ ndash 3 6 + 6 = _
1 NBT 1
CC1NBT1 Extend the counting sequence Count to 120 starting at any number less than 120 In this range read and write numerals and represent a number of objects with a written numeral
1 NBT 2
CC1NBT2 Understand place value Understand that the two digits of a two-digit number represent amounts of tens and ones Understand the following as special cases -- a 10 can be thought of as a bundle of ten ones mdash called a ldquotenrdquo -- b The numbers from 11 to 19 are composed of a ten and one two three four five six seven eight or nine ones -- c The numbers 10 20 30 40 50 60 70 80 90 refer to one two three four five six seven eight or nine tens (and 0 ones)
1 NBT 3
CC1NBT3 Understand place value Compare two two-digit numbers based on meanings of the tens and ones digits recording the results of comparisons with the symbols gt = and lt
1 NBT 4
CC1NBT4 Use place value understanding and properties of operations to add and subtract Add within 100 including adding a two-digit number and a one-digit number and adding a two-digit number and a multiple of 10 using concrete models or drawings and strategies based on place value properties of operations andor the relationship between addition and subtraction relate the strategy to a written method and explain the reasoning used Understand that in adding two-digit numbers one adds tens and tens ones and ones and sometimes it is necessary to compose a ten
1 NBT 5
CC1NBT5 Use place value understanding and properties of operations to add and subtract Given a two-digit number mentally find 10 more or 10 less than the number without having to count explain the reasoning used
1 NBT 6 CC1NBT6 Use place value understanding and properties of operations to add and subtract Subtract multiples of 10 in the range 10-90 from multiples of 10 in the range 10-90 (positive or zero differences) using concrete models or drawings and strategies based on place value properties of operations andor
48
Keansburg School DistrictCurriculum System
Mathematicsthe relationship between addition and subtraction relate the strategy to a written method and explain the reasoning used
1 MD 1
CC1MD1 Measure lengths indirectly and by iterating length units Order three objects by length compare the lengths of two objects indirectly by using a third object
1 MD 2
CC1MD2 Measure lengths indirectly and by iterating length units Express the length of an object as a whole number of length units by laying multiple copies of a shorter object (the length unit) end to end understand that the length measurement of an object is the number of same-size length units that span it with no gaps or overlaps Limit to contexts where the object being measured is spanned by a whole number of length units with no gaps or overlaps
1 MD 3CC1MD3 Tell and write time Tell and write time in hours and half-hours using analog and digital clocks
1 MD 4
CC1MD4 Represent and interpret data Organize represent and interpret data with up to three categories ask and answer questions about the total number of data points how many in each category and how many more or less are in one category than in another
1 G 1
CC1G1 Reason with shapes and their attributes Distinguish between defining attributes (eg triangles are closed and three-sided) versus non-defining attributes (eg color orientation overall size) for a wide variety of shapes build and draw shapes to possess defining attributes
1 G 2
CC1G2 Reason with shapes and their attributes Compose two-dimensional shapes (rectangles squares trapezoids triangles half-circles and quarter-circles) or three-dimensional shapes (cubes right rectangular prisms right circular cones and right circular cylinders) to create a composite shape and compose new shapes from the composite shape (Students do not need to learn formal names such as ldquoright rectangular prismrdquo)
1 G 3
CC1G3 Reason with shapes and their attributes Partition circles and rectangles into two and four equal shares describe the shares using the words halves fourths and quarters and use the phrases half of fourth of and quarter of Describe the whole as two of or four of the shares Understand for these examples that decomposing into more equal shares creates smaller shares
49
Keansburg School DistrictCurriculum System
Mathematics
Common Core State Standards Vocabulary
Addition and subtraction within 5 10 20 100 or 1000 Addition or subtraction of two whole numbers with whole number answers and with sum or minuend in the range 0-5 0-10 0-20 or 0-100 respectively Example 8 + 2 = 10 is an addition within 10 14 ndash 5 = 9 is a subtraction within 20 and 55 ndash 18 = 37 is a subtraction within 100
Additive inverses Two numbers whose sum is 0 are additive inverses of one another Example 34 and ndash 34 are additive inverses of one another because 34 + (ndash 34) = (ndash 34) + 34 = 0
Associative property of addition See Table 3 in this Glossary
Associative property of multiplication See Table 3 in this Glossary
Bivariate data Pairs of linked numerical observations Example a list of heights and weights for each player on a football team
Box plot A method of visually displaying a distribution of data values by using the median quartiles and extremes of the data set A box shows the middle 50 of the data1
Commutative property See Table 3 in this Glossary
Complex fraction A fraction AB where A andor B are fractions (B nonzero)
Computation algorithm A set of predefined steps applicable to a class of problems that gives the correct result in every case when the steps are carried out correctly See also computation strategy
Computation strategy Purposeful manipulations that may be chosen for specific problems may not have a fixed order and may be aimed at converting one problem into another See also computation algorithm
Congruent Two plane or solid figures are congruent if one can be obtained from the other by rigid motion (a sequence of rotations reflections and translations)
Counting on A strategy for finding the number of objects in a group without having to count every member of the group For example if a stack of books is known to have 8 books and 3 more books are added to the top it is not necessary to count the stack
50
Keansburg School DistrictCurriculum System
Mathematicsall over again One can find the total by counting onmdashpointing to the top book and saying ldquoeightrdquo following this with ldquonine ten eleven There are eleven books nowrdquo
Dot plot See line plot
Dilation A transformation that moves each point along the ray through the point emanating from a fixed center and multiplies distances from the center by a common scale factor
Expanded form A multi-digit number is expressed in expanded form when it is written as a sum of single-digit multiples of powers of ten For example 643 = 600 + 40 + 3
Expected value For a random variable the weighted average of its possible values with weights given by their respective probabilities
First quartile For a data set with median M the first quartile is the median of the data values less than M Example For the data set 1 3 6 7 10 12 14 15 22 120 the first quartile is 62 See also median third quartile interquartile range
Fraction A number expressible in the form ab where a is a whole number and b is a positive whole number (The word fraction in these standards always refers to a non-negative number) See also rational number
Identity property of 0 See Table 3 in this Glossary
Independently combined probability models Two probability models are said to be combined independently if the probability of each ordered pair in the combined model equals the product of the original probabilities of the two individual outcomes in the ordered pair
Integer A number expressible in the form a or ndasha for some whole number a
Interquartile Range A measure of variation in a set of numerical data the interquartile range is the distance between the first and third quartiles of the data set Example For the data set 1 3 6 7 10 12 14 15 22 120 the interquartile range is 15 ndash 6 = 9 See also first quartile third quartile
Line plot A method of visually displaying a distribution of data values where each data value is shown as a dot or mark above a number line Also known as a dot plot3
51
Keansburg School DistrictCurriculum System
MathematicsMean A measure of center in a set of numerical data computed by adding the values in a list and then dividing by the number of values in the list4 Example For the data set 1 3 6 7 10 12 14 15 22 120 the mean is 21
Mean absolute deviation A measure of variation in a set of numerical data computed by adding the distances between each data value and the mean then dividing by the number of data values Example For the data set 2 3 6 7 10 12 14 15 22 120 the mean absolute deviation is 20
Median A measure of center in a set of numerical data The median of a list of values is the value appearing at the center of a sorted version of the listmdashor the mean of the two central values if the list contains an even number of values Example For the data set 2 3 6 7 10 12 14 15 22 90 the median is 11
Midline In the graph of a trigonometric function the horizontal line halfway between its maximum and minimum values
Multiplication and division within 100 Multiplication or division of two whole numbers with whole number answers and with product or dividend in the range 0-100 Example 72 divide 8 = 9
Multiplicative inverses Two numbers whose product is 1 are multiplicative inverses of one another Example 34 and 43 are multiplicative inverses of one another because 34 times 43 = 43 times 34 = 1
Number line diagram A diagram of the number line used to represent numbers and support reasoning about them In a number line diagram for measurement quantities the interval from 0 to 1 on the diagram represents the unit of measure for the quantity
Percent rate of change A rate of change expressed as a percent Example if a population grows from 50 to 55 in a year it grows by 550 = 10 per year
Probability distribution The set of possible values of a random variable with a probability assigned to each
Properties of operations See Table 3 in this Glossary
Properties of equality See Table 4 in this Glossary
Properties of inequality See Table 5 in this Glossary
Properties of operations See Table 3 in this Glossary
52
Keansburg School DistrictCurriculum System
MathematicsProbability A number between 0 and 1 used to quantify likelihood for processes that have uncertain outcomes (such as tossing a coin selecting a person at random from a group of people tossing a ball at a target or testing for a medical condition)
Probability model A probability model is used to assign probabilities to outcomes of a chance process by examining the nature of the process The set of all outcomes is called the sample space and their probabilities sum to 1 See also uniform probability model
Random variable An assignment of a numerical value to each outcome in a sample space
Rational expression A quotient of two polynomials with a non-zero denominator
Rational number A number expressible in the form ab or ndash ab for some fraction ab The rational numbers include the integers
Rectilinear figure A polygon all angles of which are right angles
Rigid motion A transformation of points in space consisting of a sequence of one or more translations reflections andor rotations Rigid motions are here assumed to preserve distances and angle measures
Repeating decimal The decimal form of a rational number See also terminating decimal
Sample space In a probability model for a random process a list of the individual outcomes that are to be considered
Scatter plot A graph in the coordinate plane representing a set of bivariate data For example the heights and weights of a group of people could be displayed on a scatter plot5
Similarity transformation A rigid motion followed by a dilation
Tape diagram A drawing that looks like a segment of tape used to illustrate number relationships Also known as a strip diagram bar model fraction strip or length model
Terminating decimal A decimal is called terminating if its repeating digit is 0
Third quartile For a data set with median M the third quartile is the median of the data values greater than M Example For the data set 2 3 6 7 10 12 14 15 22 120 the third quartile is 15 See also median first quartile interquartile range
Transitivity principle for indirect measurement If the length of object A is greater than the length of object B and the length of object B is greater than the length of object C then the length of object A is greater than the length of object C This principle applies
53
Keansburg School DistrictCurriculum System
Mathematicsto measurement of other quantities as well
Uniform probability model A probability model which assigns equal probability to all outcomes See also probability model
Vector A quantity with magnitude and direction in the plane or in space defined by an ordered pair or triple of real numbers
Visual fraction model A tape diagram number line diagram or area model
Whole numbers The numbers 0 1 2 3 hellip5
54
- MissionVision Statement
- Beliefs
- Measurement amp Data
- Measure lengths and by iterating length units
- Tell and write time
- Represent and interpret data
- Geometry
- Reason with shapes and their attributes
- Number and Base Ten
- Extend the counting sequence
- Understand place value
-
- Measurement amp Data (II)
-
- Measure lengths and by iterating length units
- Tell and write time
-
- Represent and interpret data
- Geometry (II)
- Reason with shapes their attributes
-
- Number and Base Ten
- Use place value understanding and properties of operations to add and subtract
- Teacher will cover up specific numbers on an enlarged number grid using cover up tape to have students identify numbers before and after Students will come up and write the missing numbers
- Students will play ldquoI have__ Who has __ Teacher will create cards using index cards and numbers in which students need further practice with Students will read their cards aloud Variations of game can include identifying specific numbers identifying numbers more or less etc)
- Students will use base ten blocks to represent numbers including three digit numbers Students will identify representation of numbers through these manipulatives They may match the representation to the written number
- Students will write the number they created using the base ten blocks using their white boards and markers
- Students will arrange given digits to create the greatest and lowest possible numbers They can show each number they create using base ten blocks
- Students will use the Base Ten Exchange Game to show an understanding of exchanging ones for tens and tens for hundreds Students can use place value mats base ten blocks (cubes tens and flats) Students can take number of cubes displayed with roll of single die Students will determine when exchanging can be made when reaching ten units
- Base ten concentration wwwk-5mathteachingresourcescom
- Ten frame compare wwwk-5mathteachingresourcescom
-
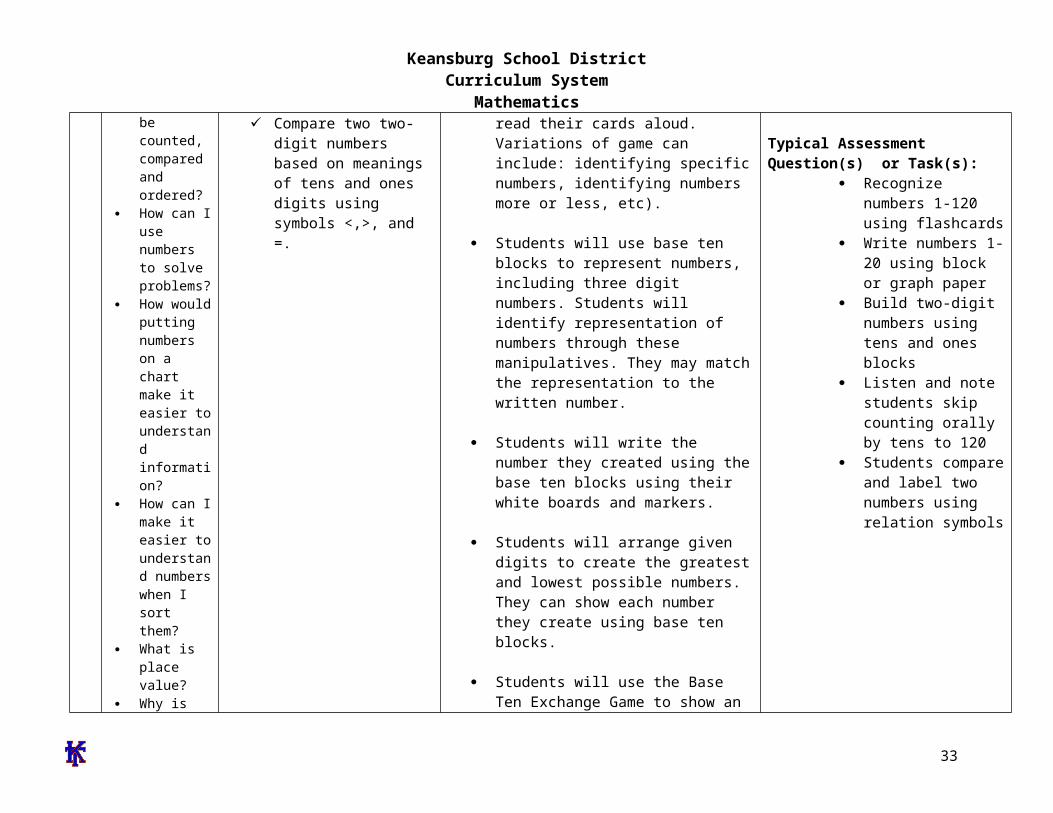
Keansburg School DistrictCurriculum System
Mathematicsof graph should I use to answer questions
Why do I need to tell time
How many hands does a clock have
Are the hands on the clock the same size
How long is a minute
Why do I need to use a calendar
How do we use the clock and the calendar to determine what we will do in school
Why do we need to measure something
What can
objects by length Construct objects at
contrasting lengths
ordero Students will break into groups
and compare objects further and classify them depending on their size
Teacher will introduce the ruler Explain to students that the ruler is used to measure objects The students will then explore the classroom and select objects around the room that are smaller and larger than the ruler
Teacher will select specific body parts that the students will use as a personal unit of measurement The students will work in pairs to demonstrate how to measure objects around the room using their personal unit of measurement
The teacher will select a classroom object and the students will be asked to illustrate objects in the room that are bigger and smaller in size
The students will be able to organize represent and interpret data up to three categories through the use of a bar graph
The teacher will then divide students into heterogeneous groups and encourage the students to explain what they can learn from the graph The students will present findings following activity
Students will choose an object within classroom then find additional objects one being larger the other being shorter using a two-column chart Draw or write the objects in the chart
digital and analog clocks Students will be asked to
identify the parts of a clock students will be asked to draw the hands on an analog clock for a given time to the hour or half-hour
Students will be given various objects and will further be asked to compare and contrast the lengths of these objects
Students will be asked to provide or create objects contrasting lengths to demonstrate understanding of differences in length
33
Keansburg School DistrictCurriculum System
Mathematicswe use to draw and measure things
What do you think is about 1 inch long
How many steps long do you think it is from the front of the classroom to the back
If we measure in footsteps why are some of the measurements different
How is longer and shorter similar to greater and lesser
Exceeds Standard
The students will work in pairs to locate objects around the room and compare the lengths against each other The pairs will then work with another pair of students and compare the lengths of their objects with the objects the other pair located
Teacher will introduce the ruler in comparison to the yardstick The students will be encouraged to find objects that in the room that are larger than a ruler and measure using the yardstick
After the teacher introduces units of personal measurement the students will be encouraged to measure object in the room using their own unit of personal measurement and convert it into a standard measurement using a ruler or a yardstick
The teacher will select a classroom object and the students will be asked to illustrate objects in the room that are bigger and smaller by a specific size
The students will be able to organize represent and interpret data up to four or more categories through the use of a bar graph
The teacher will then divide students into heterogeneous groups and encourage the students to explain what they can learn from the graph and create a tally chart utilizing the data
Students will create clock flash cards by
34
Keansburg School DistrictCurriculum System
Mathematicsdrawing an analog clock on one side and writing the digital clock time on the other Students will include time in five minute intervals
Pose word problems where students have to find elapse time to the hour and half hour
Introduce second hand and conduct activities that are timed in seconds (Examples hopping on 1 foot blinking eyes counting to the highest number)
35
Keansburg School DistrictCurriculum System
MathematicsKeansburg School DistrictCurriculum Management System
SubjectGradeLevelMathematicsGrade 1
Timeline April-Quarter 4
Topic(s) Geometry
Significance of Learning Goal(s) To identify two and three dimensional shapes to understand fractional parts and create equal shares
Sugg
este
d D
ays
of
Inst
ruct
ion Content
Standards CPI Essential
Questions
Specific Learning Objective(s)
The Students Will Be Able To
Suggested ActivitiesInstructional Tools Materials
Technology Resources Assessments and Assessment
Models
Are there different shapes outside
How are geometric figures alike
How can we sort objects of different shapes
How can shapes and solids be described compared and used to make other shapes
Concept(s) Two and three dimensional shapes fractional parts equal shares
SWBAT
Combine two-dimensional or three-dimensional shapes or figures to create a new composite shape and identify the shapes within
Identify fractional parts of circles and rectangles into equal shares while developing vocabulary for halves fourths and quarters
Describe the whole as
Meets Standard
Determine which shape by touch without using their sight
o Materials attribute blocks shape sheet feely box wwwilluminationsnctmorglessondetail
Sorting 3-dimensional objects students will be given cards with 3-dimensional objects (trash can soup can globe ball tissue box box dice) they will sort them based on the 3-dimensional shape they represent
o 3-dimensional object cards sorting mats
Pizza and Cake Fractions students will utilize a pizza and a cake to work on the concept of fractions while developing the vocabulary halves quarters and fourths
o Materials teacher created pizza
Attribute blocks Geometric shapes 3-dimensional object
cards Sorting maps 3-dimensional shapes Solid and lane figures Geo-boards and rubber
bands Fraction circles Sheet protectors 2-dimensional shapes
Typical Assessment Question(s) or Task(s)
Students will be asked to describe and identify
36
Keansburg School DistrictCurriculum System
MathematicsWhat are equal parts
What foods do you divide into equal parts
What other items might be divided
How do you know if you have an equal share
two of or four of the shares Understand for these examples that decomposing into more equal shares creates smaller shares
and cake that are cut into fractions (construction paper)
Students will illustrate a picture of a boat using at least one three dimensional shape in their drawings Shapes include cubes cylinders spheres cones and rectangular prisms
Solid and Plane Figures Name the Face activity Provide three-dimensional objects Have students draw the face for each object as well as name the shape Examples ABC block juice can book party hat
Introduce fractions by having students identify shapes that show equal parts Display cut out shapes using document camera Include some shapes that are divided equally and some that are not divided equally As a whole group sort shapes into two categories Then have students go back to their desks and work with a partner to classify additional shapes
Provide students with shapes that are divided into four parts Include shapes that are divided into four equal parts and others that are unequal Students identify the shapes that are divided into four equal parts and explain their reasoning
Shape Town activity Students will design a shape town using the following shapes
shapes within combined two and three-dimensional shapes
Students will be given circles and rectangles students will be asked to divide these shapes into halves fourths and quarters
Students will be asked to sort shapes that are divided equally and not divided equally
37
Keansburg School DistrictCurriculum System
Mathematicstrapezoid hexagon square triangle and circle Afterwards students will calculate the total number of each shape they included After completing the activity students will present their final product to the class and explain how they decided which shapes to use
Given an array of dots students will draw shapes with specific number of sides and corners and connect the dots to create the shapes Example Draw a shape with 5 sides Draw a shape with 6 corners
Students will create two-dimensional shapes on geoboards Then using different colored rubber bands students will divide the shapes into equal parts Students will transfer their equally divided shapes onto geoboard paper by drawing lines to show their equal parts
Play the Fraction Path Game Materials Fraction circles a circle with frac12 shaded a circle with 13 shaded and a circle with frac14 shaded Gameboard Path consisting of assorted shapes divided into halves thirds and fourths Players Needed 3 Directions Place the fraction circles facedown Players close their eyes and pick one fraction circle Each player follows the path from start to finish Each player looks at each shape on the path and records how many shapes show their fractions Players record
38
Keansburg School DistrictCurriculum System
Mathematicstheir results on paper using tally marks At end of game students compare total number of shapes that show their fraction
Exceeds Standard
39
Keansburg School DistrictCurriculum System
MathematicsKeansburg School DistrictCurriculum Management System
SubjectGradeLevelMathematicsGrade 1
Timeline May-Quarter 4
Topic(s) Number and Operations in Base Ten
Significance of Learning Goal(s) To use place value to add and subtract
Sugg
este
d D
ays
of
Inst
ruct
ion Content
Standards CPI Essential
Questions
Specific Learning Objective(s)
The Students Will Be Able ToSuggested Activities
Instructional Tools Materials Technology Resources
Assessments and Assessment Models
40
Keansburg School DistrictCurriculum System
MathematicsCPI 1NBT4 1NBT5 1NBT6
EQ How do
numbers help us
How can sets of numbers be counted compared and ordered
How can I use numbers to solve problems
How would putting numbers on a chart make it easier to understand information
How can I make it easier to understand numbers when I sort them
What is place value
Why is place value important
How can I
Concept(s) Use place value and properties of operations to add and subtract
SWBAT Use mental math to find
10 more or ten less than a given two-digit number and explain reasoning used within any number to 120
Use place value to add within 100 add a two-digit number to a one-digit number and add a two-digit number to a multiple of ten
Understand when adding two-digit numbers that ones add to the ones and tens add to the tens and sometimes it is necessary to compose a ten by regrouping
For all above objects students will use concrete models and strategies based on place value and relate the strategy to a written method and explain the reasoning used
Subtract multiples of 10 in the range 10-90 from multiples of 10 in the range 10-90 using
Meets Standard
Comparing two digit numbers wwwk-5mathteachingresourcescom
Subtraction split wwwk-5mathteachingresourcescom
Ten more wwwk-5mathteachingresourcescom
Addition split wwwk-5mathteachingresourcescom
Exceeds Standard
Comparing 3-Digit numbers wwwk-5mathteachingresourcescom
What number is wwwk-5mathteachingresourcescom
Students develop addition and subtraction number stories and have partners solve
Create pictures using basendash10 blocks Students trace picture onto paper label the base ten blocks with their value and add total
Solve number grid puzzles by adding and subtraction 10 on the number grid
Number cards Base 10 blocks Counters Number grid puzzles Sleeve protectors wwwk-
5mathteachingresourcescom
Dice
Typical Assessment Question(s) or Task(s)
Recognize numbers 1-120 using flashcards
Write numbers 1-20 using block or graph paper
Build two-digit numbers using tens and ones blocks
Listen and note students skip counting orally by tens to 120
Students compare and label two numbers using relation symbols
41
Keansburg School DistrictCurriculum System
Mathematics
42
Keansburg School DistrictCurriculum System
MathematicsKeansburg School DistrictCurriculum Management System
SubjectGradeLevelMathematicsGrade 1
Timeline June-Quarter 4
Topic(s) Readiness skills for September of Grade 2
Significance of Learning Goal(s) To compare larger numbers add fluently and apply measurement skills
Sugg
este
d D
ays
of
Inst
ruct
ion Content
Standards CPI Essential Questions
Specific Learning Objective(s)
The Students Will Be Able ToSuggested Activities
Instructional Tools Materials Technology Resources
Assessments and Assessment Models
CPI
EQ How can I use
place value to compare and
order numbers in the 100s
How can mastering basic addition and subtraction facts help me compute larger numbers
How can I tie in
Concept(s)Use place value to compare larger numbers fluently add up to 20 apply measurement skills
SWBAT Extend place value into
the hundreds place and re-write and construct models beyond the hundreds
Fluently add and subtract within 20 using mental strategies
Apply measurement skills
Meets Standard Place Value barrier game httpwwwk-
5mathteachingresourcescommath-gameshtml (place value only)
High card
httpwwwlearningboxcomBase10 BaseTenhtml
Time barrier game httpwwwk-5mathteachingresourcescomsupport-filestimebarriergamepdf httpwwwk-5mathteachingresourcescomsupport-filestimebarriergamegridpdf
My favorite time of day writing activity
number cards base ten blocks rulers tape measurer string number relationship mat paper plates cotton balls judy clock digital clock
Typical Assessment Question(s) or Task(s)
Students will solve addition and subtraction problems within 20 in a given time
43
Keansburg School DistrictCurriculum System
Mathematicsmeasurement skills with real life experiences
httpwwwk-5mathteachingresourcescomsupport-filesmy-favorite-time-of-daypdf
Estimating length httpwwwk-5mathteachingresourcescomsupport-filesestimatinglengthpdf
Olympic golf plastic golf clubs cotton balls and tape measurer
Olympic smiles measuring smiles with string and rulers
Olympic Frisbee using paper plates and tape measurer
Olympic airplane students will make paper airplanes measure the distance that they can throw their airplane
Doubles plus 1 game httpwwwk-5mathteachingresourcescomsupport-filesdoubles-plus-onepdf
Eleven more httpwwwk-5mathteachingresourcescomsupport-fileselevenmorepdf
frame Students will be asked to
measure items using inches and centimeters
Identify and create numbers with place values extending into the hundreds place
44
Keansburg School DistrictCurriculum System
Mathematics
Building numbers with base ten blocks pick three cards and arrange them to show a 3-digit number build that number with base ten blocks repeat with the same three cards until no new numbers can be made
Length strength inches httpwwwharcourtschoolcomactivitylength_strength1_inches
Length strength centimeters httpwwwharcourtschoolcomactivitylength_strength1_centi
Exceeds Standard
Number relationship mat wwwk-5mathteachingresourcescom
Place value barrier game httpwwwk-5mathteachingresourcescommath-gameshtml (integrate other skills into place values for example the digit in my 10s place is four doubled)
Measuring the mousersquos path httpwwwk-5mathteachingresourcescomsupport-filespaths1pdf
45
Keansburg School DistrictCurriculum System
Mathematics
Double minus 1 game httpwwwk-5mathteachingresourcescomsupport-filesdoubles-minus-onepdf
Number relationship mat httpwwwk-5mathteachingresourcescomsupport-filesnumberrelationshipmatpdf
46
Keansburg School DistrictCurriculum System
Mathematicsignment Matrices of Common Core State Standards
Grade Strand Standard Standard
Sept
embe
r ndash
Oct
ober
Nov
embe
r ndash
Dec
embe
r
Janu
ary
ndash Fe
brua
ry
Mar
ch ndash
Apr
il
May
- Ju
ne
1 OA 1
CC1OA1 Represent and solve problems involving addition and subtraction Use addition and subtraction within 20 to solve word problems involving situations of adding to taking from putting together taking apart and comparing with unknowns in all positions eg by using objects drawings and equations with a symbol for the unknown number to represent the problem
1 OA 2
CC1OA2 Represent and solve problems involving addition and subtraction Solve word problems that call for addition of three whole numbers whose sum is less than or equal to 20 eg by using objects drawings and equations with a symbol for the unknown number to represent the problem
1 OA 3
CC1OA3 Understand and apply properties of operations and the relationship between addition and subtraction Apply properties of operations as strategies to add and subtract Examples If 8 + 3 = 11 is known then 3 + 8 = 11 is also known (Commutative property of addition) To add 2 + 6 + 4 the second two numbers can be added to make a ten so 2 + 6 + 4 = 2 + 10 = 12 (Associative property of addition) (Students need not use formal terms for these properties)
1 OA 4
CC1OA4 Understand and apply properties of operations and the relationship between addition and subtraction Understand subtraction as an unknown-addend problem For example subtract 10 ndash 8 by finding the number that makes 10 when added to 8
1 OA 5 CC1OA5 Add and subtract within 20 Relate counting to addition and subtraction (eg by counting on 2 to add 2)
1 OA 6 CC1OA6 Add and subtract within 20 Add and subtract within 20 demonstrating fluency for addition and subtraction within 10 Use strategies such as counting on making ten (eg 8 + 6 = 8 + 2 + 4 = 10 + 4 = 14) decomposing a number leading to a ten (eg 13 ndash 4 = 13 ndash 3 ndash 1 = 10 ndash 1 = 9) using the relationship between addition and subtraction (eg knowing that 8 + 4
47
Keansburg School DistrictCurriculum System
Mathematics= 12 one knows 12 ndash 8 = 4) and creating equivalent but easier or known sums (eg adding 6 + 7 by creating the known equivalent 6 + 6 + 1 = 12 + 1 = 13)
1 OA 7
CC1OA7 Work with addition and subtraction equations Understand the meaning of the equal sign and determine if equations involving addition and subtraction are true or false For example which of the following equations are true and which are false 6 = 6 7 = 8 ndash 1 5 + 2 = 2 + 5 4 + 1 = 5 + 2
1 OA 8
CC1OA8 Work with addition and subtraction equations Determine the unknown whole number in an addition or subtraction equation relating three whole numbers For example determine the unknown number that makes the equation true in each of the equations 8 + = 11 5 = _ ndash 3 6 + 6 = _
1 NBT 1
CC1NBT1 Extend the counting sequence Count to 120 starting at any number less than 120 In this range read and write numerals and represent a number of objects with a written numeral
1 NBT 2
CC1NBT2 Understand place value Understand that the two digits of a two-digit number represent amounts of tens and ones Understand the following as special cases -- a 10 can be thought of as a bundle of ten ones mdash called a ldquotenrdquo -- b The numbers from 11 to 19 are composed of a ten and one two three four five six seven eight or nine ones -- c The numbers 10 20 30 40 50 60 70 80 90 refer to one two three four five six seven eight or nine tens (and 0 ones)
1 NBT 3
CC1NBT3 Understand place value Compare two two-digit numbers based on meanings of the tens and ones digits recording the results of comparisons with the symbols gt = and lt
1 NBT 4
CC1NBT4 Use place value understanding and properties of operations to add and subtract Add within 100 including adding a two-digit number and a one-digit number and adding a two-digit number and a multiple of 10 using concrete models or drawings and strategies based on place value properties of operations andor the relationship between addition and subtraction relate the strategy to a written method and explain the reasoning used Understand that in adding two-digit numbers one adds tens and tens ones and ones and sometimes it is necessary to compose a ten
1 NBT 5
CC1NBT5 Use place value understanding and properties of operations to add and subtract Given a two-digit number mentally find 10 more or 10 less than the number without having to count explain the reasoning used
1 NBT 6 CC1NBT6 Use place value understanding and properties of operations to add and subtract Subtract multiples of 10 in the range 10-90 from multiples of 10 in the range 10-90 (positive or zero differences) using concrete models or drawings and strategies based on place value properties of operations andor
48
Keansburg School DistrictCurriculum System
Mathematicsthe relationship between addition and subtraction relate the strategy to a written method and explain the reasoning used
1 MD 1
CC1MD1 Measure lengths indirectly and by iterating length units Order three objects by length compare the lengths of two objects indirectly by using a third object
1 MD 2
CC1MD2 Measure lengths indirectly and by iterating length units Express the length of an object as a whole number of length units by laying multiple copies of a shorter object (the length unit) end to end understand that the length measurement of an object is the number of same-size length units that span it with no gaps or overlaps Limit to contexts where the object being measured is spanned by a whole number of length units with no gaps or overlaps
1 MD 3CC1MD3 Tell and write time Tell and write time in hours and half-hours using analog and digital clocks
1 MD 4
CC1MD4 Represent and interpret data Organize represent and interpret data with up to three categories ask and answer questions about the total number of data points how many in each category and how many more or less are in one category than in another
1 G 1
CC1G1 Reason with shapes and their attributes Distinguish between defining attributes (eg triangles are closed and three-sided) versus non-defining attributes (eg color orientation overall size) for a wide variety of shapes build and draw shapes to possess defining attributes
1 G 2
CC1G2 Reason with shapes and their attributes Compose two-dimensional shapes (rectangles squares trapezoids triangles half-circles and quarter-circles) or three-dimensional shapes (cubes right rectangular prisms right circular cones and right circular cylinders) to create a composite shape and compose new shapes from the composite shape (Students do not need to learn formal names such as ldquoright rectangular prismrdquo)
1 G 3
CC1G3 Reason with shapes and their attributes Partition circles and rectangles into two and four equal shares describe the shares using the words halves fourths and quarters and use the phrases half of fourth of and quarter of Describe the whole as two of or four of the shares Understand for these examples that decomposing into more equal shares creates smaller shares
49
Keansburg School DistrictCurriculum System
Mathematics
Common Core State Standards Vocabulary
Addition and subtraction within 5 10 20 100 or 1000 Addition or subtraction of two whole numbers with whole number answers and with sum or minuend in the range 0-5 0-10 0-20 or 0-100 respectively Example 8 + 2 = 10 is an addition within 10 14 ndash 5 = 9 is a subtraction within 20 and 55 ndash 18 = 37 is a subtraction within 100
Additive inverses Two numbers whose sum is 0 are additive inverses of one another Example 34 and ndash 34 are additive inverses of one another because 34 + (ndash 34) = (ndash 34) + 34 = 0
Associative property of addition See Table 3 in this Glossary
Associative property of multiplication See Table 3 in this Glossary
Bivariate data Pairs of linked numerical observations Example a list of heights and weights for each player on a football team
Box plot A method of visually displaying a distribution of data values by using the median quartiles and extremes of the data set A box shows the middle 50 of the data1
Commutative property See Table 3 in this Glossary
Complex fraction A fraction AB where A andor B are fractions (B nonzero)
Computation algorithm A set of predefined steps applicable to a class of problems that gives the correct result in every case when the steps are carried out correctly See also computation strategy
Computation strategy Purposeful manipulations that may be chosen for specific problems may not have a fixed order and may be aimed at converting one problem into another See also computation algorithm
Congruent Two plane or solid figures are congruent if one can be obtained from the other by rigid motion (a sequence of rotations reflections and translations)
Counting on A strategy for finding the number of objects in a group without having to count every member of the group For example if a stack of books is known to have 8 books and 3 more books are added to the top it is not necessary to count the stack
50
Keansburg School DistrictCurriculum System
Mathematicsall over again One can find the total by counting onmdashpointing to the top book and saying ldquoeightrdquo following this with ldquonine ten eleven There are eleven books nowrdquo
Dot plot See line plot
Dilation A transformation that moves each point along the ray through the point emanating from a fixed center and multiplies distances from the center by a common scale factor
Expanded form A multi-digit number is expressed in expanded form when it is written as a sum of single-digit multiples of powers of ten For example 643 = 600 + 40 + 3
Expected value For a random variable the weighted average of its possible values with weights given by their respective probabilities
First quartile For a data set with median M the first quartile is the median of the data values less than M Example For the data set 1 3 6 7 10 12 14 15 22 120 the first quartile is 62 See also median third quartile interquartile range
Fraction A number expressible in the form ab where a is a whole number and b is a positive whole number (The word fraction in these standards always refers to a non-negative number) See also rational number
Identity property of 0 See Table 3 in this Glossary
Independently combined probability models Two probability models are said to be combined independently if the probability of each ordered pair in the combined model equals the product of the original probabilities of the two individual outcomes in the ordered pair
Integer A number expressible in the form a or ndasha for some whole number a
Interquartile Range A measure of variation in a set of numerical data the interquartile range is the distance between the first and third quartiles of the data set Example For the data set 1 3 6 7 10 12 14 15 22 120 the interquartile range is 15 ndash 6 = 9 See also first quartile third quartile
Line plot A method of visually displaying a distribution of data values where each data value is shown as a dot or mark above a number line Also known as a dot plot3
51
Keansburg School DistrictCurriculum System
MathematicsMean A measure of center in a set of numerical data computed by adding the values in a list and then dividing by the number of values in the list4 Example For the data set 1 3 6 7 10 12 14 15 22 120 the mean is 21
Mean absolute deviation A measure of variation in a set of numerical data computed by adding the distances between each data value and the mean then dividing by the number of data values Example For the data set 2 3 6 7 10 12 14 15 22 120 the mean absolute deviation is 20
Median A measure of center in a set of numerical data The median of a list of values is the value appearing at the center of a sorted version of the listmdashor the mean of the two central values if the list contains an even number of values Example For the data set 2 3 6 7 10 12 14 15 22 90 the median is 11
Midline In the graph of a trigonometric function the horizontal line halfway between its maximum and minimum values
Multiplication and division within 100 Multiplication or division of two whole numbers with whole number answers and with product or dividend in the range 0-100 Example 72 divide 8 = 9
Multiplicative inverses Two numbers whose product is 1 are multiplicative inverses of one another Example 34 and 43 are multiplicative inverses of one another because 34 times 43 = 43 times 34 = 1
Number line diagram A diagram of the number line used to represent numbers and support reasoning about them In a number line diagram for measurement quantities the interval from 0 to 1 on the diagram represents the unit of measure for the quantity
Percent rate of change A rate of change expressed as a percent Example if a population grows from 50 to 55 in a year it grows by 550 = 10 per year
Probability distribution The set of possible values of a random variable with a probability assigned to each
Properties of operations See Table 3 in this Glossary
Properties of equality See Table 4 in this Glossary
Properties of inequality See Table 5 in this Glossary
Properties of operations See Table 3 in this Glossary
52
Keansburg School DistrictCurriculum System
MathematicsProbability A number between 0 and 1 used to quantify likelihood for processes that have uncertain outcomes (such as tossing a coin selecting a person at random from a group of people tossing a ball at a target or testing for a medical condition)
Probability model A probability model is used to assign probabilities to outcomes of a chance process by examining the nature of the process The set of all outcomes is called the sample space and their probabilities sum to 1 See also uniform probability model
Random variable An assignment of a numerical value to each outcome in a sample space
Rational expression A quotient of two polynomials with a non-zero denominator
Rational number A number expressible in the form ab or ndash ab for some fraction ab The rational numbers include the integers
Rectilinear figure A polygon all angles of which are right angles
Rigid motion A transformation of points in space consisting of a sequence of one or more translations reflections andor rotations Rigid motions are here assumed to preserve distances and angle measures
Repeating decimal The decimal form of a rational number See also terminating decimal
Sample space In a probability model for a random process a list of the individual outcomes that are to be considered
Scatter plot A graph in the coordinate plane representing a set of bivariate data For example the heights and weights of a group of people could be displayed on a scatter plot5
Similarity transformation A rigid motion followed by a dilation
Tape diagram A drawing that looks like a segment of tape used to illustrate number relationships Also known as a strip diagram bar model fraction strip or length model
Terminating decimal A decimal is called terminating if its repeating digit is 0
Third quartile For a data set with median M the third quartile is the median of the data values greater than M Example For the data set 2 3 6 7 10 12 14 15 22 120 the third quartile is 15 See also median first quartile interquartile range
Transitivity principle for indirect measurement If the length of object A is greater than the length of object B and the length of object B is greater than the length of object C then the length of object A is greater than the length of object C This principle applies
53
Keansburg School DistrictCurriculum System
Mathematicsto measurement of other quantities as well
Uniform probability model A probability model which assigns equal probability to all outcomes See also probability model
Vector A quantity with magnitude and direction in the plane or in space defined by an ordered pair or triple of real numbers
Visual fraction model A tape diagram number line diagram or area model
Whole numbers The numbers 0 1 2 3 hellip5
54
- MissionVision Statement
- Beliefs
- Measurement amp Data
- Measure lengths and by iterating length units
- Tell and write time
- Represent and interpret data
- Geometry
- Reason with shapes and their attributes
- Number and Base Ten
- Extend the counting sequence
- Understand place value
-
- Measurement amp Data (II)
-
- Measure lengths and by iterating length units
- Tell and write time
-
- Represent and interpret data
- Geometry (II)
- Reason with shapes their attributes
-
- Number and Base Ten
- Use place value understanding and properties of operations to add and subtract
- Teacher will cover up specific numbers on an enlarged number grid using cover up tape to have students identify numbers before and after Students will come up and write the missing numbers
- Students will play ldquoI have__ Who has __ Teacher will create cards using index cards and numbers in which students need further practice with Students will read their cards aloud Variations of game can include identifying specific numbers identifying numbers more or less etc)
- Students will use base ten blocks to represent numbers including three digit numbers Students will identify representation of numbers through these manipulatives They may match the representation to the written number
- Students will write the number they created using the base ten blocks using their white boards and markers
- Students will arrange given digits to create the greatest and lowest possible numbers They can show each number they create using base ten blocks
- Students will use the Base Ten Exchange Game to show an understanding of exchanging ones for tens and tens for hundreds Students can use place value mats base ten blocks (cubes tens and flats) Students can take number of cubes displayed with roll of single die Students will determine when exchanging can be made when reaching ten units
- Base ten concentration wwwk-5mathteachingresourcescom
- Ten frame compare wwwk-5mathteachingresourcescom
-
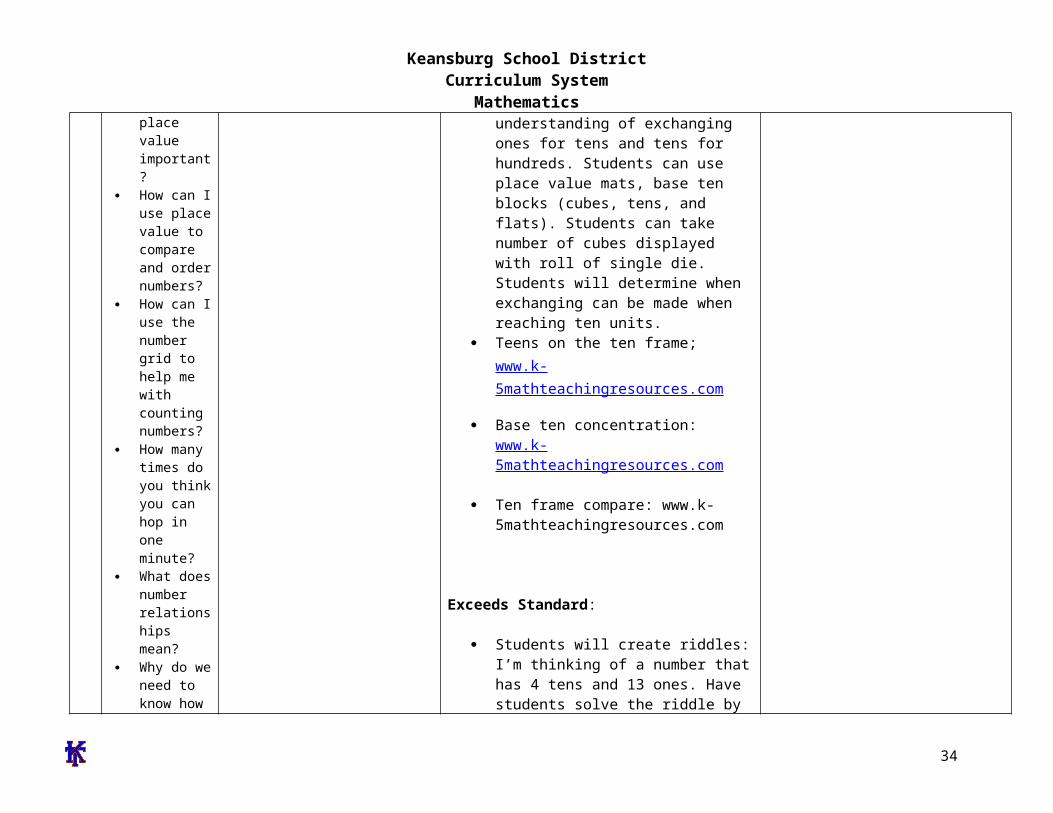
Keansburg School DistrictCurriculum System
Mathematicswe use to draw and measure things
What do you think is about 1 inch long
How many steps long do you think it is from the front of the classroom to the back
If we measure in footsteps why are some of the measurements different
How is longer and shorter similar to greater and lesser
Exceeds Standard
The students will work in pairs to locate objects around the room and compare the lengths against each other The pairs will then work with another pair of students and compare the lengths of their objects with the objects the other pair located
Teacher will introduce the ruler in comparison to the yardstick The students will be encouraged to find objects that in the room that are larger than a ruler and measure using the yardstick
After the teacher introduces units of personal measurement the students will be encouraged to measure object in the room using their own unit of personal measurement and convert it into a standard measurement using a ruler or a yardstick
The teacher will select a classroom object and the students will be asked to illustrate objects in the room that are bigger and smaller by a specific size
The students will be able to organize represent and interpret data up to four or more categories through the use of a bar graph
The teacher will then divide students into heterogeneous groups and encourage the students to explain what they can learn from the graph and create a tally chart utilizing the data
Students will create clock flash cards by
34
Keansburg School DistrictCurriculum System
Mathematicsdrawing an analog clock on one side and writing the digital clock time on the other Students will include time in five minute intervals
Pose word problems where students have to find elapse time to the hour and half hour
Introduce second hand and conduct activities that are timed in seconds (Examples hopping on 1 foot blinking eyes counting to the highest number)
35
Keansburg School DistrictCurriculum System
MathematicsKeansburg School DistrictCurriculum Management System
SubjectGradeLevelMathematicsGrade 1
Timeline April-Quarter 4
Topic(s) Geometry
Significance of Learning Goal(s) To identify two and three dimensional shapes to understand fractional parts and create equal shares
Sugg
este
d D
ays
of
Inst
ruct
ion Content
Standards CPI Essential
Questions
Specific Learning Objective(s)
The Students Will Be Able To
Suggested ActivitiesInstructional Tools Materials
Technology Resources Assessments and Assessment
Models
Are there different shapes outside
How are geometric figures alike
How can we sort objects of different shapes
How can shapes and solids be described compared and used to make other shapes
Concept(s) Two and three dimensional shapes fractional parts equal shares
SWBAT
Combine two-dimensional or three-dimensional shapes or figures to create a new composite shape and identify the shapes within
Identify fractional parts of circles and rectangles into equal shares while developing vocabulary for halves fourths and quarters
Describe the whole as
Meets Standard
Determine which shape by touch without using their sight
o Materials attribute blocks shape sheet feely box wwwilluminationsnctmorglessondetail
Sorting 3-dimensional objects students will be given cards with 3-dimensional objects (trash can soup can globe ball tissue box box dice) they will sort them based on the 3-dimensional shape they represent
o 3-dimensional object cards sorting mats
Pizza and Cake Fractions students will utilize a pizza and a cake to work on the concept of fractions while developing the vocabulary halves quarters and fourths
o Materials teacher created pizza
Attribute blocks Geometric shapes 3-dimensional object
cards Sorting maps 3-dimensional shapes Solid and lane figures Geo-boards and rubber
bands Fraction circles Sheet protectors 2-dimensional shapes
Typical Assessment Question(s) or Task(s)
Students will be asked to describe and identify
36
Keansburg School DistrictCurriculum System
MathematicsWhat are equal parts
What foods do you divide into equal parts
What other items might be divided
How do you know if you have an equal share
two of or four of the shares Understand for these examples that decomposing into more equal shares creates smaller shares
and cake that are cut into fractions (construction paper)
Students will illustrate a picture of a boat using at least one three dimensional shape in their drawings Shapes include cubes cylinders spheres cones and rectangular prisms
Solid and Plane Figures Name the Face activity Provide three-dimensional objects Have students draw the face for each object as well as name the shape Examples ABC block juice can book party hat
Introduce fractions by having students identify shapes that show equal parts Display cut out shapes using document camera Include some shapes that are divided equally and some that are not divided equally As a whole group sort shapes into two categories Then have students go back to their desks and work with a partner to classify additional shapes
Provide students with shapes that are divided into four parts Include shapes that are divided into four equal parts and others that are unequal Students identify the shapes that are divided into four equal parts and explain their reasoning
Shape Town activity Students will design a shape town using the following shapes
shapes within combined two and three-dimensional shapes
Students will be given circles and rectangles students will be asked to divide these shapes into halves fourths and quarters
Students will be asked to sort shapes that are divided equally and not divided equally
37
Keansburg School DistrictCurriculum System
Mathematicstrapezoid hexagon square triangle and circle Afterwards students will calculate the total number of each shape they included After completing the activity students will present their final product to the class and explain how they decided which shapes to use
Given an array of dots students will draw shapes with specific number of sides and corners and connect the dots to create the shapes Example Draw a shape with 5 sides Draw a shape with 6 corners
Students will create two-dimensional shapes on geoboards Then using different colored rubber bands students will divide the shapes into equal parts Students will transfer their equally divided shapes onto geoboard paper by drawing lines to show their equal parts
Play the Fraction Path Game Materials Fraction circles a circle with frac12 shaded a circle with 13 shaded and a circle with frac14 shaded Gameboard Path consisting of assorted shapes divided into halves thirds and fourths Players Needed 3 Directions Place the fraction circles facedown Players close their eyes and pick one fraction circle Each player follows the path from start to finish Each player looks at each shape on the path and records how many shapes show their fractions Players record
38
Keansburg School DistrictCurriculum System
Mathematicstheir results on paper using tally marks At end of game students compare total number of shapes that show their fraction
Exceeds Standard
39
Keansburg School DistrictCurriculum System
MathematicsKeansburg School DistrictCurriculum Management System
SubjectGradeLevelMathematicsGrade 1
Timeline May-Quarter 4
Topic(s) Number and Operations in Base Ten
Significance of Learning Goal(s) To use place value to add and subtract
Sugg
este
d D
ays
of
Inst
ruct
ion Content
Standards CPI Essential
Questions
Specific Learning Objective(s)
The Students Will Be Able ToSuggested Activities
Instructional Tools Materials Technology Resources
Assessments and Assessment Models
40
Keansburg School DistrictCurriculum System
MathematicsCPI 1NBT4 1NBT5 1NBT6
EQ How do
numbers help us
How can sets of numbers be counted compared and ordered
How can I use numbers to solve problems
How would putting numbers on a chart make it easier to understand information
How can I make it easier to understand numbers when I sort them
What is place value
Why is place value important
How can I
Concept(s) Use place value and properties of operations to add and subtract
SWBAT Use mental math to find
10 more or ten less than a given two-digit number and explain reasoning used within any number to 120
Use place value to add within 100 add a two-digit number to a one-digit number and add a two-digit number to a multiple of ten
Understand when adding two-digit numbers that ones add to the ones and tens add to the tens and sometimes it is necessary to compose a ten by regrouping
For all above objects students will use concrete models and strategies based on place value and relate the strategy to a written method and explain the reasoning used
Subtract multiples of 10 in the range 10-90 from multiples of 10 in the range 10-90 using
Meets Standard
Comparing two digit numbers wwwk-5mathteachingresourcescom
Subtraction split wwwk-5mathteachingresourcescom
Ten more wwwk-5mathteachingresourcescom
Addition split wwwk-5mathteachingresourcescom
Exceeds Standard
Comparing 3-Digit numbers wwwk-5mathteachingresourcescom
What number is wwwk-5mathteachingresourcescom
Students develop addition and subtraction number stories and have partners solve
Create pictures using basendash10 blocks Students trace picture onto paper label the base ten blocks with their value and add total
Solve number grid puzzles by adding and subtraction 10 on the number grid
Number cards Base 10 blocks Counters Number grid puzzles Sleeve protectors wwwk-
5mathteachingresourcescom
Dice
Typical Assessment Question(s) or Task(s)
Recognize numbers 1-120 using flashcards
Write numbers 1-20 using block or graph paper
Build two-digit numbers using tens and ones blocks
Listen and note students skip counting orally by tens to 120
Students compare and label two numbers using relation symbols
41
Keansburg School DistrictCurriculum System
Mathematics
42
Keansburg School DistrictCurriculum System
MathematicsKeansburg School DistrictCurriculum Management System
SubjectGradeLevelMathematicsGrade 1
Timeline June-Quarter 4
Topic(s) Readiness skills for September of Grade 2
Significance of Learning Goal(s) To compare larger numbers add fluently and apply measurement skills
Sugg
este
d D
ays
of
Inst
ruct
ion Content
Standards CPI Essential Questions
Specific Learning Objective(s)
The Students Will Be Able ToSuggested Activities
Instructional Tools Materials Technology Resources
Assessments and Assessment Models
CPI
EQ How can I use
place value to compare and
order numbers in the 100s
How can mastering basic addition and subtraction facts help me compute larger numbers
How can I tie in
Concept(s)Use place value to compare larger numbers fluently add up to 20 apply measurement skills
SWBAT Extend place value into
the hundreds place and re-write and construct models beyond the hundreds
Fluently add and subtract within 20 using mental strategies
Apply measurement skills
Meets Standard Place Value barrier game httpwwwk-
5mathteachingresourcescommath-gameshtml (place value only)
High card
httpwwwlearningboxcomBase10 BaseTenhtml
Time barrier game httpwwwk-5mathteachingresourcescomsupport-filestimebarriergamepdf httpwwwk-5mathteachingresourcescomsupport-filestimebarriergamegridpdf
My favorite time of day writing activity
number cards base ten blocks rulers tape measurer string number relationship mat paper plates cotton balls judy clock digital clock
Typical Assessment Question(s) or Task(s)
Students will solve addition and subtraction problems within 20 in a given time
43
Keansburg School DistrictCurriculum System
Mathematicsmeasurement skills with real life experiences
httpwwwk-5mathteachingresourcescomsupport-filesmy-favorite-time-of-daypdf
Estimating length httpwwwk-5mathteachingresourcescomsupport-filesestimatinglengthpdf
Olympic golf plastic golf clubs cotton balls and tape measurer
Olympic smiles measuring smiles with string and rulers
Olympic Frisbee using paper plates and tape measurer
Olympic airplane students will make paper airplanes measure the distance that they can throw their airplane
Doubles plus 1 game httpwwwk-5mathteachingresourcescomsupport-filesdoubles-plus-onepdf
Eleven more httpwwwk-5mathteachingresourcescomsupport-fileselevenmorepdf
frame Students will be asked to
measure items using inches and centimeters
Identify and create numbers with place values extending into the hundreds place
44
Keansburg School DistrictCurriculum System
Mathematics
Building numbers with base ten blocks pick three cards and arrange them to show a 3-digit number build that number with base ten blocks repeat with the same three cards until no new numbers can be made
Length strength inches httpwwwharcourtschoolcomactivitylength_strength1_inches
Length strength centimeters httpwwwharcourtschoolcomactivitylength_strength1_centi
Exceeds Standard
Number relationship mat wwwk-5mathteachingresourcescom
Place value barrier game httpwwwk-5mathteachingresourcescommath-gameshtml (integrate other skills into place values for example the digit in my 10s place is four doubled)
Measuring the mousersquos path httpwwwk-5mathteachingresourcescomsupport-filespaths1pdf
45
Keansburg School DistrictCurriculum System
Mathematics
Double minus 1 game httpwwwk-5mathteachingresourcescomsupport-filesdoubles-minus-onepdf
Number relationship mat httpwwwk-5mathteachingresourcescomsupport-filesnumberrelationshipmatpdf
46
Keansburg School DistrictCurriculum System
Mathematicsignment Matrices of Common Core State Standards
Grade Strand Standard Standard
Sept
embe
r ndash
Oct
ober
Nov
embe
r ndash
Dec
embe
r
Janu
ary
ndash Fe
brua
ry
Mar
ch ndash
Apr
il
May
- Ju
ne
1 OA 1
CC1OA1 Represent and solve problems involving addition and subtraction Use addition and subtraction within 20 to solve word problems involving situations of adding to taking from putting together taking apart and comparing with unknowns in all positions eg by using objects drawings and equations with a symbol for the unknown number to represent the problem
1 OA 2
CC1OA2 Represent and solve problems involving addition and subtraction Solve word problems that call for addition of three whole numbers whose sum is less than or equal to 20 eg by using objects drawings and equations with a symbol for the unknown number to represent the problem
1 OA 3
CC1OA3 Understand and apply properties of operations and the relationship between addition and subtraction Apply properties of operations as strategies to add and subtract Examples If 8 + 3 = 11 is known then 3 + 8 = 11 is also known (Commutative property of addition) To add 2 + 6 + 4 the second two numbers can be added to make a ten so 2 + 6 + 4 = 2 + 10 = 12 (Associative property of addition) (Students need not use formal terms for these properties)
1 OA 4
CC1OA4 Understand and apply properties of operations and the relationship between addition and subtraction Understand subtraction as an unknown-addend problem For example subtract 10 ndash 8 by finding the number that makes 10 when added to 8
1 OA 5 CC1OA5 Add and subtract within 20 Relate counting to addition and subtraction (eg by counting on 2 to add 2)
1 OA 6 CC1OA6 Add and subtract within 20 Add and subtract within 20 demonstrating fluency for addition and subtraction within 10 Use strategies such as counting on making ten (eg 8 + 6 = 8 + 2 + 4 = 10 + 4 = 14) decomposing a number leading to a ten (eg 13 ndash 4 = 13 ndash 3 ndash 1 = 10 ndash 1 = 9) using the relationship between addition and subtraction (eg knowing that 8 + 4
47
Keansburg School DistrictCurriculum System
Mathematics= 12 one knows 12 ndash 8 = 4) and creating equivalent but easier or known sums (eg adding 6 + 7 by creating the known equivalent 6 + 6 + 1 = 12 + 1 = 13)
1 OA 7
CC1OA7 Work with addition and subtraction equations Understand the meaning of the equal sign and determine if equations involving addition and subtraction are true or false For example which of the following equations are true and which are false 6 = 6 7 = 8 ndash 1 5 + 2 = 2 + 5 4 + 1 = 5 + 2
1 OA 8
CC1OA8 Work with addition and subtraction equations Determine the unknown whole number in an addition or subtraction equation relating three whole numbers For example determine the unknown number that makes the equation true in each of the equations 8 + = 11 5 = _ ndash 3 6 + 6 = _
1 NBT 1
CC1NBT1 Extend the counting sequence Count to 120 starting at any number less than 120 In this range read and write numerals and represent a number of objects with a written numeral
1 NBT 2
CC1NBT2 Understand place value Understand that the two digits of a two-digit number represent amounts of tens and ones Understand the following as special cases -- a 10 can be thought of as a bundle of ten ones mdash called a ldquotenrdquo -- b The numbers from 11 to 19 are composed of a ten and one two three four five six seven eight or nine ones -- c The numbers 10 20 30 40 50 60 70 80 90 refer to one two three four five six seven eight or nine tens (and 0 ones)
1 NBT 3
CC1NBT3 Understand place value Compare two two-digit numbers based on meanings of the tens and ones digits recording the results of comparisons with the symbols gt = and lt
1 NBT 4
CC1NBT4 Use place value understanding and properties of operations to add and subtract Add within 100 including adding a two-digit number and a one-digit number and adding a two-digit number and a multiple of 10 using concrete models or drawings and strategies based on place value properties of operations andor the relationship between addition and subtraction relate the strategy to a written method and explain the reasoning used Understand that in adding two-digit numbers one adds tens and tens ones and ones and sometimes it is necessary to compose a ten
1 NBT 5
CC1NBT5 Use place value understanding and properties of operations to add and subtract Given a two-digit number mentally find 10 more or 10 less than the number without having to count explain the reasoning used
1 NBT 6 CC1NBT6 Use place value understanding and properties of operations to add and subtract Subtract multiples of 10 in the range 10-90 from multiples of 10 in the range 10-90 (positive or zero differences) using concrete models or drawings and strategies based on place value properties of operations andor
48
Keansburg School DistrictCurriculum System
Mathematicsthe relationship between addition and subtraction relate the strategy to a written method and explain the reasoning used
1 MD 1
CC1MD1 Measure lengths indirectly and by iterating length units Order three objects by length compare the lengths of two objects indirectly by using a third object
1 MD 2
CC1MD2 Measure lengths indirectly and by iterating length units Express the length of an object as a whole number of length units by laying multiple copies of a shorter object (the length unit) end to end understand that the length measurement of an object is the number of same-size length units that span it with no gaps or overlaps Limit to contexts where the object being measured is spanned by a whole number of length units with no gaps or overlaps
1 MD 3CC1MD3 Tell and write time Tell and write time in hours and half-hours using analog and digital clocks
1 MD 4
CC1MD4 Represent and interpret data Organize represent and interpret data with up to three categories ask and answer questions about the total number of data points how many in each category and how many more or less are in one category than in another
1 G 1
CC1G1 Reason with shapes and their attributes Distinguish between defining attributes (eg triangles are closed and three-sided) versus non-defining attributes (eg color orientation overall size) for a wide variety of shapes build and draw shapes to possess defining attributes
1 G 2
CC1G2 Reason with shapes and their attributes Compose two-dimensional shapes (rectangles squares trapezoids triangles half-circles and quarter-circles) or three-dimensional shapes (cubes right rectangular prisms right circular cones and right circular cylinders) to create a composite shape and compose new shapes from the composite shape (Students do not need to learn formal names such as ldquoright rectangular prismrdquo)
1 G 3
CC1G3 Reason with shapes and their attributes Partition circles and rectangles into two and four equal shares describe the shares using the words halves fourths and quarters and use the phrases half of fourth of and quarter of Describe the whole as two of or four of the shares Understand for these examples that decomposing into more equal shares creates smaller shares
49
Keansburg School DistrictCurriculum System
Mathematics
Common Core State Standards Vocabulary
Addition and subtraction within 5 10 20 100 or 1000 Addition or subtraction of two whole numbers with whole number answers and with sum or minuend in the range 0-5 0-10 0-20 or 0-100 respectively Example 8 + 2 = 10 is an addition within 10 14 ndash 5 = 9 is a subtraction within 20 and 55 ndash 18 = 37 is a subtraction within 100
Additive inverses Two numbers whose sum is 0 are additive inverses of one another Example 34 and ndash 34 are additive inverses of one another because 34 + (ndash 34) = (ndash 34) + 34 = 0
Associative property of addition See Table 3 in this Glossary
Associative property of multiplication See Table 3 in this Glossary
Bivariate data Pairs of linked numerical observations Example a list of heights and weights for each player on a football team
Box plot A method of visually displaying a distribution of data values by using the median quartiles and extremes of the data set A box shows the middle 50 of the data1
Commutative property See Table 3 in this Glossary
Complex fraction A fraction AB where A andor B are fractions (B nonzero)
Computation algorithm A set of predefined steps applicable to a class of problems that gives the correct result in every case when the steps are carried out correctly See also computation strategy
Computation strategy Purposeful manipulations that may be chosen for specific problems may not have a fixed order and may be aimed at converting one problem into another See also computation algorithm
Congruent Two plane or solid figures are congruent if one can be obtained from the other by rigid motion (a sequence of rotations reflections and translations)
Counting on A strategy for finding the number of objects in a group without having to count every member of the group For example if a stack of books is known to have 8 books and 3 more books are added to the top it is not necessary to count the stack
50
Keansburg School DistrictCurriculum System
Mathematicsall over again One can find the total by counting onmdashpointing to the top book and saying ldquoeightrdquo following this with ldquonine ten eleven There are eleven books nowrdquo
Dot plot See line plot
Dilation A transformation that moves each point along the ray through the point emanating from a fixed center and multiplies distances from the center by a common scale factor
Expanded form A multi-digit number is expressed in expanded form when it is written as a sum of single-digit multiples of powers of ten For example 643 = 600 + 40 + 3
Expected value For a random variable the weighted average of its possible values with weights given by their respective probabilities
First quartile For a data set with median M the first quartile is the median of the data values less than M Example For the data set 1 3 6 7 10 12 14 15 22 120 the first quartile is 62 See also median third quartile interquartile range
Fraction A number expressible in the form ab where a is a whole number and b is a positive whole number (The word fraction in these standards always refers to a non-negative number) See also rational number
Identity property of 0 See Table 3 in this Glossary
Independently combined probability models Two probability models are said to be combined independently if the probability of each ordered pair in the combined model equals the product of the original probabilities of the two individual outcomes in the ordered pair
Integer A number expressible in the form a or ndasha for some whole number a
Interquartile Range A measure of variation in a set of numerical data the interquartile range is the distance between the first and third quartiles of the data set Example For the data set 1 3 6 7 10 12 14 15 22 120 the interquartile range is 15 ndash 6 = 9 See also first quartile third quartile
Line plot A method of visually displaying a distribution of data values where each data value is shown as a dot or mark above a number line Also known as a dot plot3
51
Keansburg School DistrictCurriculum System
MathematicsMean A measure of center in a set of numerical data computed by adding the values in a list and then dividing by the number of values in the list4 Example For the data set 1 3 6 7 10 12 14 15 22 120 the mean is 21
Mean absolute deviation A measure of variation in a set of numerical data computed by adding the distances between each data value and the mean then dividing by the number of data values Example For the data set 2 3 6 7 10 12 14 15 22 120 the mean absolute deviation is 20
Median A measure of center in a set of numerical data The median of a list of values is the value appearing at the center of a sorted version of the listmdashor the mean of the two central values if the list contains an even number of values Example For the data set 2 3 6 7 10 12 14 15 22 90 the median is 11
Midline In the graph of a trigonometric function the horizontal line halfway between its maximum and minimum values
Multiplication and division within 100 Multiplication or division of two whole numbers with whole number answers and with product or dividend in the range 0-100 Example 72 divide 8 = 9
Multiplicative inverses Two numbers whose product is 1 are multiplicative inverses of one another Example 34 and 43 are multiplicative inverses of one another because 34 times 43 = 43 times 34 = 1
Number line diagram A diagram of the number line used to represent numbers and support reasoning about them In a number line diagram for measurement quantities the interval from 0 to 1 on the diagram represents the unit of measure for the quantity
Percent rate of change A rate of change expressed as a percent Example if a population grows from 50 to 55 in a year it grows by 550 = 10 per year
Probability distribution The set of possible values of a random variable with a probability assigned to each
Properties of operations See Table 3 in this Glossary
Properties of equality See Table 4 in this Glossary
Properties of inequality See Table 5 in this Glossary
Properties of operations See Table 3 in this Glossary
52
Keansburg School DistrictCurriculum System
MathematicsProbability A number between 0 and 1 used to quantify likelihood for processes that have uncertain outcomes (such as tossing a coin selecting a person at random from a group of people tossing a ball at a target or testing for a medical condition)
Probability model A probability model is used to assign probabilities to outcomes of a chance process by examining the nature of the process The set of all outcomes is called the sample space and their probabilities sum to 1 See also uniform probability model
Random variable An assignment of a numerical value to each outcome in a sample space
Rational expression A quotient of two polynomials with a non-zero denominator
Rational number A number expressible in the form ab or ndash ab for some fraction ab The rational numbers include the integers
Rectilinear figure A polygon all angles of which are right angles
Rigid motion A transformation of points in space consisting of a sequence of one or more translations reflections andor rotations Rigid motions are here assumed to preserve distances and angle measures
Repeating decimal The decimal form of a rational number See also terminating decimal
Sample space In a probability model for a random process a list of the individual outcomes that are to be considered
Scatter plot A graph in the coordinate plane representing a set of bivariate data For example the heights and weights of a group of people could be displayed on a scatter plot5
Similarity transformation A rigid motion followed by a dilation
Tape diagram A drawing that looks like a segment of tape used to illustrate number relationships Also known as a strip diagram bar model fraction strip or length model
Terminating decimal A decimal is called terminating if its repeating digit is 0
Third quartile For a data set with median M the third quartile is the median of the data values greater than M Example For the data set 2 3 6 7 10 12 14 15 22 120 the third quartile is 15 See also median first quartile interquartile range
Transitivity principle for indirect measurement If the length of object A is greater than the length of object B and the length of object B is greater than the length of object C then the length of object A is greater than the length of object C This principle applies
53
Keansburg School DistrictCurriculum System
Mathematicsto measurement of other quantities as well
Uniform probability model A probability model which assigns equal probability to all outcomes See also probability model
Vector A quantity with magnitude and direction in the plane or in space defined by an ordered pair or triple of real numbers
Visual fraction model A tape diagram number line diagram or area model
Whole numbers The numbers 0 1 2 3 hellip5
54
- MissionVision Statement
- Beliefs
- Measurement amp Data
- Measure lengths and by iterating length units
- Tell and write time
- Represent and interpret data
- Geometry
- Reason with shapes and their attributes
- Number and Base Ten
- Extend the counting sequence
- Understand place value
-
- Measurement amp Data (II)
-
- Measure lengths and by iterating length units
- Tell and write time
-
- Represent and interpret data
- Geometry (II)
- Reason with shapes their attributes
-
- Number and Base Ten
- Use place value understanding and properties of operations to add and subtract
- Teacher will cover up specific numbers on an enlarged number grid using cover up tape to have students identify numbers before and after Students will come up and write the missing numbers
- Students will play ldquoI have__ Who has __ Teacher will create cards using index cards and numbers in which students need further practice with Students will read their cards aloud Variations of game can include identifying specific numbers identifying numbers more or less etc)
- Students will use base ten blocks to represent numbers including three digit numbers Students will identify representation of numbers through these manipulatives They may match the representation to the written number
- Students will write the number they created using the base ten blocks using their white boards and markers
- Students will arrange given digits to create the greatest and lowest possible numbers They can show each number they create using base ten blocks
- Students will use the Base Ten Exchange Game to show an understanding of exchanging ones for tens and tens for hundreds Students can use place value mats base ten blocks (cubes tens and flats) Students can take number of cubes displayed with roll of single die Students will determine when exchanging can be made when reaching ten units
- Base ten concentration wwwk-5mathteachingresourcescom
- Ten frame compare wwwk-5mathteachingresourcescom
-
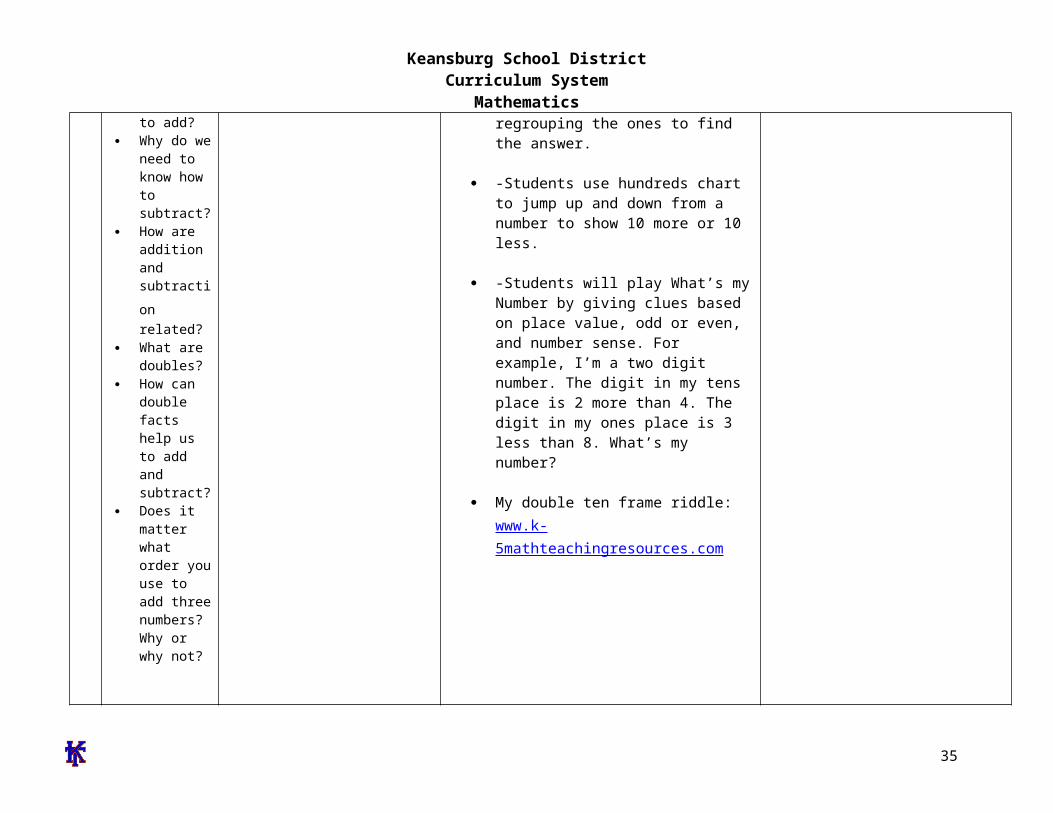
Keansburg School DistrictCurriculum System
MathematicsKeansburg School DistrictCurriculum Management System
SubjectGradeLevelMathematicsGrade 1
Timeline April-Quarter 4
Topic(s) Geometry
Significance of Learning Goal(s) To identify two and three dimensional shapes to understand fractional parts and create equal shares
Sugg
este
d D
ays
of
Inst
ruct
ion Content
Standards CPI Essential
Questions
Specific Learning Objective(s)
The Students Will Be Able To
Suggested ActivitiesInstructional Tools Materials
Technology Resources Assessments and Assessment
Models
Are there different shapes outside
How are geometric figures alike
How can we sort objects of different shapes
How can shapes and solids be described compared and used to make other shapes
Concept(s) Two and three dimensional shapes fractional parts equal shares
SWBAT
Combine two-dimensional or three-dimensional shapes or figures to create a new composite shape and identify the shapes within
Identify fractional parts of circles and rectangles into equal shares while developing vocabulary for halves fourths and quarters
Describe the whole as
Meets Standard
Determine which shape by touch without using their sight
o Materials attribute blocks shape sheet feely box wwwilluminationsnctmorglessondetail
Sorting 3-dimensional objects students will be given cards with 3-dimensional objects (trash can soup can globe ball tissue box box dice) they will sort them based on the 3-dimensional shape they represent
o 3-dimensional object cards sorting mats
Pizza and Cake Fractions students will utilize a pizza and a cake to work on the concept of fractions while developing the vocabulary halves quarters and fourths
o Materials teacher created pizza
Attribute blocks Geometric shapes 3-dimensional object
cards Sorting maps 3-dimensional shapes Solid and lane figures Geo-boards and rubber
bands Fraction circles Sheet protectors 2-dimensional shapes
Typical Assessment Question(s) or Task(s)
Students will be asked to describe and identify
36
Keansburg School DistrictCurriculum System
MathematicsWhat are equal parts
What foods do you divide into equal parts
What other items might be divided
How do you know if you have an equal share
two of or four of the shares Understand for these examples that decomposing into more equal shares creates smaller shares
and cake that are cut into fractions (construction paper)
Students will illustrate a picture of a boat using at least one three dimensional shape in their drawings Shapes include cubes cylinders spheres cones and rectangular prisms
Solid and Plane Figures Name the Face activity Provide three-dimensional objects Have students draw the face for each object as well as name the shape Examples ABC block juice can book party hat
Introduce fractions by having students identify shapes that show equal parts Display cut out shapes using document camera Include some shapes that are divided equally and some that are not divided equally As a whole group sort shapes into two categories Then have students go back to their desks and work with a partner to classify additional shapes
Provide students with shapes that are divided into four parts Include shapes that are divided into four equal parts and others that are unequal Students identify the shapes that are divided into four equal parts and explain their reasoning
Shape Town activity Students will design a shape town using the following shapes
shapes within combined two and three-dimensional shapes
Students will be given circles and rectangles students will be asked to divide these shapes into halves fourths and quarters
Students will be asked to sort shapes that are divided equally and not divided equally
37
Keansburg School DistrictCurriculum System
Mathematicstrapezoid hexagon square triangle and circle Afterwards students will calculate the total number of each shape they included After completing the activity students will present their final product to the class and explain how they decided which shapes to use
Given an array of dots students will draw shapes with specific number of sides and corners and connect the dots to create the shapes Example Draw a shape with 5 sides Draw a shape with 6 corners
Students will create two-dimensional shapes on geoboards Then using different colored rubber bands students will divide the shapes into equal parts Students will transfer their equally divided shapes onto geoboard paper by drawing lines to show their equal parts
Play the Fraction Path Game Materials Fraction circles a circle with frac12 shaded a circle with 13 shaded and a circle with frac14 shaded Gameboard Path consisting of assorted shapes divided into halves thirds and fourths Players Needed 3 Directions Place the fraction circles facedown Players close their eyes and pick one fraction circle Each player follows the path from start to finish Each player looks at each shape on the path and records how many shapes show their fractions Players record
38
Keansburg School DistrictCurriculum System
Mathematicstheir results on paper using tally marks At end of game students compare total number of shapes that show their fraction
Exceeds Standard
39
Keansburg School DistrictCurriculum System
MathematicsKeansburg School DistrictCurriculum Management System
SubjectGradeLevelMathematicsGrade 1
Timeline May-Quarter 4
Topic(s) Number and Operations in Base Ten
Significance of Learning Goal(s) To use place value to add and subtract
Sugg
este
d D
ays
of
Inst
ruct
ion Content
Standards CPI Essential
Questions
Specific Learning Objective(s)
The Students Will Be Able ToSuggested Activities
Instructional Tools Materials Technology Resources
Assessments and Assessment Models
40
Keansburg School DistrictCurriculum System
MathematicsCPI 1NBT4 1NBT5 1NBT6
EQ How do
numbers help us
How can sets of numbers be counted compared and ordered
How can I use numbers to solve problems
How would putting numbers on a chart make it easier to understand information
How can I make it easier to understand numbers when I sort them
What is place value
Why is place value important
How can I
Concept(s) Use place value and properties of operations to add and subtract
SWBAT Use mental math to find
10 more or ten less than a given two-digit number and explain reasoning used within any number to 120
Use place value to add within 100 add a two-digit number to a one-digit number and add a two-digit number to a multiple of ten
Understand when adding two-digit numbers that ones add to the ones and tens add to the tens and sometimes it is necessary to compose a ten by regrouping
For all above objects students will use concrete models and strategies based on place value and relate the strategy to a written method and explain the reasoning used
Subtract multiples of 10 in the range 10-90 from multiples of 10 in the range 10-90 using
Meets Standard
Comparing two digit numbers wwwk-5mathteachingresourcescom
Subtraction split wwwk-5mathteachingresourcescom
Ten more wwwk-5mathteachingresourcescom
Addition split wwwk-5mathteachingresourcescom
Exceeds Standard
Comparing 3-Digit numbers wwwk-5mathteachingresourcescom
What number is wwwk-5mathteachingresourcescom
Students develop addition and subtraction number stories and have partners solve
Create pictures using basendash10 blocks Students trace picture onto paper label the base ten blocks with their value and add total
Solve number grid puzzles by adding and subtraction 10 on the number grid
Number cards Base 10 blocks Counters Number grid puzzles Sleeve protectors wwwk-
5mathteachingresourcescom
Dice
Typical Assessment Question(s) or Task(s)
Recognize numbers 1-120 using flashcards
Write numbers 1-20 using block or graph paper
Build two-digit numbers using tens and ones blocks
Listen and note students skip counting orally by tens to 120
Students compare and label two numbers using relation symbols
41
Keansburg School DistrictCurriculum System
Mathematics
42
Keansburg School DistrictCurriculum System
MathematicsKeansburg School DistrictCurriculum Management System
SubjectGradeLevelMathematicsGrade 1
Timeline June-Quarter 4
Topic(s) Readiness skills for September of Grade 2
Significance of Learning Goal(s) To compare larger numbers add fluently and apply measurement skills
Sugg
este
d D
ays
of
Inst
ruct
ion Content
Standards CPI Essential Questions
Specific Learning Objective(s)
The Students Will Be Able ToSuggested Activities
Instructional Tools Materials Technology Resources
Assessments and Assessment Models
CPI
EQ How can I use
place value to compare and
order numbers in the 100s
How can mastering basic addition and subtraction facts help me compute larger numbers
How can I tie in
Concept(s)Use place value to compare larger numbers fluently add up to 20 apply measurement skills
SWBAT Extend place value into
the hundreds place and re-write and construct models beyond the hundreds
Fluently add and subtract within 20 using mental strategies
Apply measurement skills
Meets Standard Place Value barrier game httpwwwk-
5mathteachingresourcescommath-gameshtml (place value only)
High card
httpwwwlearningboxcomBase10 BaseTenhtml
Time barrier game httpwwwk-5mathteachingresourcescomsupport-filestimebarriergamepdf httpwwwk-5mathteachingresourcescomsupport-filestimebarriergamegridpdf
My favorite time of day writing activity
number cards base ten blocks rulers tape measurer string number relationship mat paper plates cotton balls judy clock digital clock
Typical Assessment Question(s) or Task(s)
Students will solve addition and subtraction problems within 20 in a given time
43
Keansburg School DistrictCurriculum System
Mathematicsmeasurement skills with real life experiences
httpwwwk-5mathteachingresourcescomsupport-filesmy-favorite-time-of-daypdf
Estimating length httpwwwk-5mathteachingresourcescomsupport-filesestimatinglengthpdf
Olympic golf plastic golf clubs cotton balls and tape measurer
Olympic smiles measuring smiles with string and rulers
Olympic Frisbee using paper plates and tape measurer
Olympic airplane students will make paper airplanes measure the distance that they can throw their airplane
Doubles plus 1 game httpwwwk-5mathteachingresourcescomsupport-filesdoubles-plus-onepdf
Eleven more httpwwwk-5mathteachingresourcescomsupport-fileselevenmorepdf
frame Students will be asked to
measure items using inches and centimeters
Identify and create numbers with place values extending into the hundreds place
44
Keansburg School DistrictCurriculum System
Mathematics
Building numbers with base ten blocks pick three cards and arrange them to show a 3-digit number build that number with base ten blocks repeat with the same three cards until no new numbers can be made
Length strength inches httpwwwharcourtschoolcomactivitylength_strength1_inches
Length strength centimeters httpwwwharcourtschoolcomactivitylength_strength1_centi
Exceeds Standard
Number relationship mat wwwk-5mathteachingresourcescom
Place value barrier game httpwwwk-5mathteachingresourcescommath-gameshtml (integrate other skills into place values for example the digit in my 10s place is four doubled)
Measuring the mousersquos path httpwwwk-5mathteachingresourcescomsupport-filespaths1pdf
45
Keansburg School DistrictCurriculum System
Mathematics
Double minus 1 game httpwwwk-5mathteachingresourcescomsupport-filesdoubles-minus-onepdf
Number relationship mat httpwwwk-5mathteachingresourcescomsupport-filesnumberrelationshipmatpdf
46
Keansburg School DistrictCurriculum System
Mathematicsignment Matrices of Common Core State Standards
Grade Strand Standard Standard
Sept
embe
r ndash
Oct
ober
Nov
embe
r ndash
Dec
embe
r
Janu
ary
ndash Fe
brua
ry
Mar
ch ndash
Apr
il
May
- Ju
ne
1 OA 1
CC1OA1 Represent and solve problems involving addition and subtraction Use addition and subtraction within 20 to solve word problems involving situations of adding to taking from putting together taking apart and comparing with unknowns in all positions eg by using objects drawings and equations with a symbol for the unknown number to represent the problem
1 OA 2
CC1OA2 Represent and solve problems involving addition and subtraction Solve word problems that call for addition of three whole numbers whose sum is less than or equal to 20 eg by using objects drawings and equations with a symbol for the unknown number to represent the problem
1 OA 3
CC1OA3 Understand and apply properties of operations and the relationship between addition and subtraction Apply properties of operations as strategies to add and subtract Examples If 8 + 3 = 11 is known then 3 + 8 = 11 is also known (Commutative property of addition) To add 2 + 6 + 4 the second two numbers can be added to make a ten so 2 + 6 + 4 = 2 + 10 = 12 (Associative property of addition) (Students need not use formal terms for these properties)
1 OA 4
CC1OA4 Understand and apply properties of operations and the relationship between addition and subtraction Understand subtraction as an unknown-addend problem For example subtract 10 ndash 8 by finding the number that makes 10 when added to 8
1 OA 5 CC1OA5 Add and subtract within 20 Relate counting to addition and subtraction (eg by counting on 2 to add 2)
1 OA 6 CC1OA6 Add and subtract within 20 Add and subtract within 20 demonstrating fluency for addition and subtraction within 10 Use strategies such as counting on making ten (eg 8 + 6 = 8 + 2 + 4 = 10 + 4 = 14) decomposing a number leading to a ten (eg 13 ndash 4 = 13 ndash 3 ndash 1 = 10 ndash 1 = 9) using the relationship between addition and subtraction (eg knowing that 8 + 4
47
Keansburg School DistrictCurriculum System
Mathematics= 12 one knows 12 ndash 8 = 4) and creating equivalent but easier or known sums (eg adding 6 + 7 by creating the known equivalent 6 + 6 + 1 = 12 + 1 = 13)
1 OA 7
CC1OA7 Work with addition and subtraction equations Understand the meaning of the equal sign and determine if equations involving addition and subtraction are true or false For example which of the following equations are true and which are false 6 = 6 7 = 8 ndash 1 5 + 2 = 2 + 5 4 + 1 = 5 + 2
1 OA 8
CC1OA8 Work with addition and subtraction equations Determine the unknown whole number in an addition or subtraction equation relating three whole numbers For example determine the unknown number that makes the equation true in each of the equations 8 + = 11 5 = _ ndash 3 6 + 6 = _
1 NBT 1
CC1NBT1 Extend the counting sequence Count to 120 starting at any number less than 120 In this range read and write numerals and represent a number of objects with a written numeral
1 NBT 2
CC1NBT2 Understand place value Understand that the two digits of a two-digit number represent amounts of tens and ones Understand the following as special cases -- a 10 can be thought of as a bundle of ten ones mdash called a ldquotenrdquo -- b The numbers from 11 to 19 are composed of a ten and one two three four five six seven eight or nine ones -- c The numbers 10 20 30 40 50 60 70 80 90 refer to one two three four five six seven eight or nine tens (and 0 ones)
1 NBT 3
CC1NBT3 Understand place value Compare two two-digit numbers based on meanings of the tens and ones digits recording the results of comparisons with the symbols gt = and lt
1 NBT 4
CC1NBT4 Use place value understanding and properties of operations to add and subtract Add within 100 including adding a two-digit number and a one-digit number and adding a two-digit number and a multiple of 10 using concrete models or drawings and strategies based on place value properties of operations andor the relationship between addition and subtraction relate the strategy to a written method and explain the reasoning used Understand that in adding two-digit numbers one adds tens and tens ones and ones and sometimes it is necessary to compose a ten
1 NBT 5
CC1NBT5 Use place value understanding and properties of operations to add and subtract Given a two-digit number mentally find 10 more or 10 less than the number without having to count explain the reasoning used
1 NBT 6 CC1NBT6 Use place value understanding and properties of operations to add and subtract Subtract multiples of 10 in the range 10-90 from multiples of 10 in the range 10-90 (positive or zero differences) using concrete models or drawings and strategies based on place value properties of operations andor
48
Keansburg School DistrictCurriculum System
Mathematicsthe relationship between addition and subtraction relate the strategy to a written method and explain the reasoning used
1 MD 1
CC1MD1 Measure lengths indirectly and by iterating length units Order three objects by length compare the lengths of two objects indirectly by using a third object
1 MD 2
CC1MD2 Measure lengths indirectly and by iterating length units Express the length of an object as a whole number of length units by laying multiple copies of a shorter object (the length unit) end to end understand that the length measurement of an object is the number of same-size length units that span it with no gaps or overlaps Limit to contexts where the object being measured is spanned by a whole number of length units with no gaps or overlaps
1 MD 3CC1MD3 Tell and write time Tell and write time in hours and half-hours using analog and digital clocks
1 MD 4
CC1MD4 Represent and interpret data Organize represent and interpret data with up to three categories ask and answer questions about the total number of data points how many in each category and how many more or less are in one category than in another
1 G 1
CC1G1 Reason with shapes and their attributes Distinguish between defining attributes (eg triangles are closed and three-sided) versus non-defining attributes (eg color orientation overall size) for a wide variety of shapes build and draw shapes to possess defining attributes
1 G 2
CC1G2 Reason with shapes and their attributes Compose two-dimensional shapes (rectangles squares trapezoids triangles half-circles and quarter-circles) or three-dimensional shapes (cubes right rectangular prisms right circular cones and right circular cylinders) to create a composite shape and compose new shapes from the composite shape (Students do not need to learn formal names such as ldquoright rectangular prismrdquo)
1 G 3
CC1G3 Reason with shapes and their attributes Partition circles and rectangles into two and four equal shares describe the shares using the words halves fourths and quarters and use the phrases half of fourth of and quarter of Describe the whole as two of or four of the shares Understand for these examples that decomposing into more equal shares creates smaller shares
49
Keansburg School DistrictCurriculum System
Mathematics
Common Core State Standards Vocabulary
Addition and subtraction within 5 10 20 100 or 1000 Addition or subtraction of two whole numbers with whole number answers and with sum or minuend in the range 0-5 0-10 0-20 or 0-100 respectively Example 8 + 2 = 10 is an addition within 10 14 ndash 5 = 9 is a subtraction within 20 and 55 ndash 18 = 37 is a subtraction within 100
Additive inverses Two numbers whose sum is 0 are additive inverses of one another Example 34 and ndash 34 are additive inverses of one another because 34 + (ndash 34) = (ndash 34) + 34 = 0
Associative property of addition See Table 3 in this Glossary
Associative property of multiplication See Table 3 in this Glossary
Bivariate data Pairs of linked numerical observations Example a list of heights and weights for each player on a football team
Box plot A method of visually displaying a distribution of data values by using the median quartiles and extremes of the data set A box shows the middle 50 of the data1
Commutative property See Table 3 in this Glossary
Complex fraction A fraction AB where A andor B are fractions (B nonzero)
Computation algorithm A set of predefined steps applicable to a class of problems that gives the correct result in every case when the steps are carried out correctly See also computation strategy
Computation strategy Purposeful manipulations that may be chosen for specific problems may not have a fixed order and may be aimed at converting one problem into another See also computation algorithm
Congruent Two plane or solid figures are congruent if one can be obtained from the other by rigid motion (a sequence of rotations reflections and translations)
Counting on A strategy for finding the number of objects in a group without having to count every member of the group For example if a stack of books is known to have 8 books and 3 more books are added to the top it is not necessary to count the stack
50
Keansburg School DistrictCurriculum System
Mathematicsall over again One can find the total by counting onmdashpointing to the top book and saying ldquoeightrdquo following this with ldquonine ten eleven There are eleven books nowrdquo
Dot plot See line plot
Dilation A transformation that moves each point along the ray through the point emanating from a fixed center and multiplies distances from the center by a common scale factor
Expanded form A multi-digit number is expressed in expanded form when it is written as a sum of single-digit multiples of powers of ten For example 643 = 600 + 40 + 3
Expected value For a random variable the weighted average of its possible values with weights given by their respective probabilities
First quartile For a data set with median M the first quartile is the median of the data values less than M Example For the data set 1 3 6 7 10 12 14 15 22 120 the first quartile is 62 See also median third quartile interquartile range
Fraction A number expressible in the form ab where a is a whole number and b is a positive whole number (The word fraction in these standards always refers to a non-negative number) See also rational number
Identity property of 0 See Table 3 in this Glossary
Independently combined probability models Two probability models are said to be combined independently if the probability of each ordered pair in the combined model equals the product of the original probabilities of the two individual outcomes in the ordered pair
Integer A number expressible in the form a or ndasha for some whole number a
Interquartile Range A measure of variation in a set of numerical data the interquartile range is the distance between the first and third quartiles of the data set Example For the data set 1 3 6 7 10 12 14 15 22 120 the interquartile range is 15 ndash 6 = 9 See also first quartile third quartile
Line plot A method of visually displaying a distribution of data values where each data value is shown as a dot or mark above a number line Also known as a dot plot3
51
Keansburg School DistrictCurriculum System
MathematicsMean A measure of center in a set of numerical data computed by adding the values in a list and then dividing by the number of values in the list4 Example For the data set 1 3 6 7 10 12 14 15 22 120 the mean is 21
Mean absolute deviation A measure of variation in a set of numerical data computed by adding the distances between each data value and the mean then dividing by the number of data values Example For the data set 2 3 6 7 10 12 14 15 22 120 the mean absolute deviation is 20
Median A measure of center in a set of numerical data The median of a list of values is the value appearing at the center of a sorted version of the listmdashor the mean of the two central values if the list contains an even number of values Example For the data set 2 3 6 7 10 12 14 15 22 90 the median is 11
Midline In the graph of a trigonometric function the horizontal line halfway between its maximum and minimum values
Multiplication and division within 100 Multiplication or division of two whole numbers with whole number answers and with product or dividend in the range 0-100 Example 72 divide 8 = 9
Multiplicative inverses Two numbers whose product is 1 are multiplicative inverses of one another Example 34 and 43 are multiplicative inverses of one another because 34 times 43 = 43 times 34 = 1
Number line diagram A diagram of the number line used to represent numbers and support reasoning about them In a number line diagram for measurement quantities the interval from 0 to 1 on the diagram represents the unit of measure for the quantity
Percent rate of change A rate of change expressed as a percent Example if a population grows from 50 to 55 in a year it grows by 550 = 10 per year
Probability distribution The set of possible values of a random variable with a probability assigned to each
Properties of operations See Table 3 in this Glossary
Properties of equality See Table 4 in this Glossary
Properties of inequality See Table 5 in this Glossary
Properties of operations See Table 3 in this Glossary
52
Keansburg School DistrictCurriculum System
MathematicsProbability A number between 0 and 1 used to quantify likelihood for processes that have uncertain outcomes (such as tossing a coin selecting a person at random from a group of people tossing a ball at a target or testing for a medical condition)
Probability model A probability model is used to assign probabilities to outcomes of a chance process by examining the nature of the process The set of all outcomes is called the sample space and their probabilities sum to 1 See also uniform probability model
Random variable An assignment of a numerical value to each outcome in a sample space
Rational expression A quotient of two polynomials with a non-zero denominator
Rational number A number expressible in the form ab or ndash ab for some fraction ab The rational numbers include the integers
Rectilinear figure A polygon all angles of which are right angles
Rigid motion A transformation of points in space consisting of a sequence of one or more translations reflections andor rotations Rigid motions are here assumed to preserve distances and angle measures
Repeating decimal The decimal form of a rational number See also terminating decimal
Sample space In a probability model for a random process a list of the individual outcomes that are to be considered
Scatter plot A graph in the coordinate plane representing a set of bivariate data For example the heights and weights of a group of people could be displayed on a scatter plot5
Similarity transformation A rigid motion followed by a dilation
Tape diagram A drawing that looks like a segment of tape used to illustrate number relationships Also known as a strip diagram bar model fraction strip or length model
Terminating decimal A decimal is called terminating if its repeating digit is 0
Third quartile For a data set with median M the third quartile is the median of the data values greater than M Example For the data set 2 3 6 7 10 12 14 15 22 120 the third quartile is 15 See also median first quartile interquartile range
Transitivity principle for indirect measurement If the length of object A is greater than the length of object B and the length of object B is greater than the length of object C then the length of object A is greater than the length of object C This principle applies
53
Keansburg School DistrictCurriculum System
Mathematicsto measurement of other quantities as well
Uniform probability model A probability model which assigns equal probability to all outcomes See also probability model
Vector A quantity with magnitude and direction in the plane or in space defined by an ordered pair or triple of real numbers
Visual fraction model A tape diagram number line diagram or area model
Whole numbers The numbers 0 1 2 3 hellip5
54
- MissionVision Statement
- Beliefs
- Measurement amp Data
- Measure lengths and by iterating length units
- Tell and write time
- Represent and interpret data
- Geometry
- Reason with shapes and their attributes
- Number and Base Ten
- Extend the counting sequence
- Understand place value
-
- Measurement amp Data (II)
-
- Measure lengths and by iterating length units
- Tell and write time
-
- Represent and interpret data
- Geometry (II)
- Reason with shapes their attributes
-
- Number and Base Ten
- Use place value understanding and properties of operations to add and subtract
- Teacher will cover up specific numbers on an enlarged number grid using cover up tape to have students identify numbers before and after Students will come up and write the missing numbers
- Students will play ldquoI have__ Who has __ Teacher will create cards using index cards and numbers in which students need further practice with Students will read their cards aloud Variations of game can include identifying specific numbers identifying numbers more or less etc)
- Students will use base ten blocks to represent numbers including three digit numbers Students will identify representation of numbers through these manipulatives They may match the representation to the written number
- Students will write the number they created using the base ten blocks using their white boards and markers
- Students will arrange given digits to create the greatest and lowest possible numbers They can show each number they create using base ten blocks
- Students will use the Base Ten Exchange Game to show an understanding of exchanging ones for tens and tens for hundreds Students can use place value mats base ten blocks (cubes tens and flats) Students can take number of cubes displayed with roll of single die Students will determine when exchanging can be made when reaching ten units
- Base ten concentration wwwk-5mathteachingresourcescom
- Ten frame compare wwwk-5mathteachingresourcescom
-
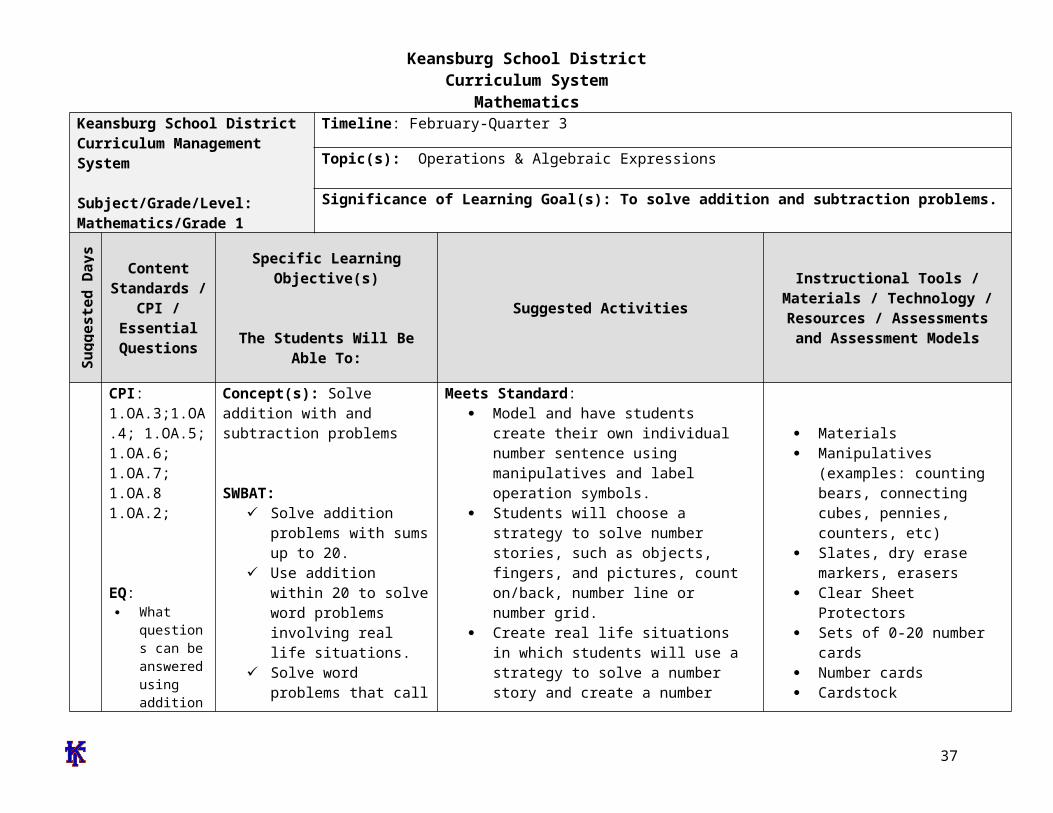
Keansburg School DistrictCurriculum System
MathematicsWhat are equal parts
What foods do you divide into equal parts
What other items might be divided
How do you know if you have an equal share
two of or four of the shares Understand for these examples that decomposing into more equal shares creates smaller shares
and cake that are cut into fractions (construction paper)
Students will illustrate a picture of a boat using at least one three dimensional shape in their drawings Shapes include cubes cylinders spheres cones and rectangular prisms
Solid and Plane Figures Name the Face activity Provide three-dimensional objects Have students draw the face for each object as well as name the shape Examples ABC block juice can book party hat
Introduce fractions by having students identify shapes that show equal parts Display cut out shapes using document camera Include some shapes that are divided equally and some that are not divided equally As a whole group sort shapes into two categories Then have students go back to their desks and work with a partner to classify additional shapes
Provide students with shapes that are divided into four parts Include shapes that are divided into four equal parts and others that are unequal Students identify the shapes that are divided into four equal parts and explain their reasoning
Shape Town activity Students will design a shape town using the following shapes
shapes within combined two and three-dimensional shapes
Students will be given circles and rectangles students will be asked to divide these shapes into halves fourths and quarters
Students will be asked to sort shapes that are divided equally and not divided equally
37
Keansburg School DistrictCurriculum System
Mathematicstrapezoid hexagon square triangle and circle Afterwards students will calculate the total number of each shape they included After completing the activity students will present their final product to the class and explain how they decided which shapes to use
Given an array of dots students will draw shapes with specific number of sides and corners and connect the dots to create the shapes Example Draw a shape with 5 sides Draw a shape with 6 corners
Students will create two-dimensional shapes on geoboards Then using different colored rubber bands students will divide the shapes into equal parts Students will transfer their equally divided shapes onto geoboard paper by drawing lines to show their equal parts
Play the Fraction Path Game Materials Fraction circles a circle with frac12 shaded a circle with 13 shaded and a circle with frac14 shaded Gameboard Path consisting of assorted shapes divided into halves thirds and fourths Players Needed 3 Directions Place the fraction circles facedown Players close their eyes and pick one fraction circle Each player follows the path from start to finish Each player looks at each shape on the path and records how many shapes show their fractions Players record
38
Keansburg School DistrictCurriculum System
Mathematicstheir results on paper using tally marks At end of game students compare total number of shapes that show their fraction
Exceeds Standard
39
Keansburg School DistrictCurriculum System
MathematicsKeansburg School DistrictCurriculum Management System
SubjectGradeLevelMathematicsGrade 1
Timeline May-Quarter 4
Topic(s) Number and Operations in Base Ten
Significance of Learning Goal(s) To use place value to add and subtract
Sugg
este
d D
ays
of
Inst
ruct
ion Content
Standards CPI Essential
Questions
Specific Learning Objective(s)
The Students Will Be Able ToSuggested Activities
Instructional Tools Materials Technology Resources
Assessments and Assessment Models
40
Keansburg School DistrictCurriculum System
MathematicsCPI 1NBT4 1NBT5 1NBT6
EQ How do
numbers help us
How can sets of numbers be counted compared and ordered
How can I use numbers to solve problems
How would putting numbers on a chart make it easier to understand information
How can I make it easier to understand numbers when I sort them
What is place value
Why is place value important
How can I
Concept(s) Use place value and properties of operations to add and subtract
SWBAT Use mental math to find
10 more or ten less than a given two-digit number and explain reasoning used within any number to 120
Use place value to add within 100 add a two-digit number to a one-digit number and add a two-digit number to a multiple of ten
Understand when adding two-digit numbers that ones add to the ones and tens add to the tens and sometimes it is necessary to compose a ten by regrouping
For all above objects students will use concrete models and strategies based on place value and relate the strategy to a written method and explain the reasoning used
Subtract multiples of 10 in the range 10-90 from multiples of 10 in the range 10-90 using
Meets Standard
Comparing two digit numbers wwwk-5mathteachingresourcescom
Subtraction split wwwk-5mathteachingresourcescom
Ten more wwwk-5mathteachingresourcescom
Addition split wwwk-5mathteachingresourcescom
Exceeds Standard
Comparing 3-Digit numbers wwwk-5mathteachingresourcescom
What number is wwwk-5mathteachingresourcescom
Students develop addition and subtraction number stories and have partners solve
Create pictures using basendash10 blocks Students trace picture onto paper label the base ten blocks with their value and add total
Solve number grid puzzles by adding and subtraction 10 on the number grid
Number cards Base 10 blocks Counters Number grid puzzles Sleeve protectors wwwk-
5mathteachingresourcescom
Dice
Typical Assessment Question(s) or Task(s)
Recognize numbers 1-120 using flashcards
Write numbers 1-20 using block or graph paper
Build two-digit numbers using tens and ones blocks
Listen and note students skip counting orally by tens to 120
Students compare and label two numbers using relation symbols
41
Keansburg School DistrictCurriculum System
Mathematics
42
Keansburg School DistrictCurriculum System
MathematicsKeansburg School DistrictCurriculum Management System
SubjectGradeLevelMathematicsGrade 1
Timeline June-Quarter 4
Topic(s) Readiness skills for September of Grade 2
Significance of Learning Goal(s) To compare larger numbers add fluently and apply measurement skills
Sugg
este
d D
ays
of
Inst
ruct
ion Content
Standards CPI Essential Questions
Specific Learning Objective(s)
The Students Will Be Able ToSuggested Activities
Instructional Tools Materials Technology Resources
Assessments and Assessment Models
CPI
EQ How can I use
place value to compare and
order numbers in the 100s
How can mastering basic addition and subtraction facts help me compute larger numbers
How can I tie in
Concept(s)Use place value to compare larger numbers fluently add up to 20 apply measurement skills
SWBAT Extend place value into
the hundreds place and re-write and construct models beyond the hundreds
Fluently add and subtract within 20 using mental strategies
Apply measurement skills
Meets Standard Place Value barrier game httpwwwk-
5mathteachingresourcescommath-gameshtml (place value only)
High card
httpwwwlearningboxcomBase10 BaseTenhtml
Time barrier game httpwwwk-5mathteachingresourcescomsupport-filestimebarriergamepdf httpwwwk-5mathteachingresourcescomsupport-filestimebarriergamegridpdf
My favorite time of day writing activity
number cards base ten blocks rulers tape measurer string number relationship mat paper plates cotton balls judy clock digital clock
Typical Assessment Question(s) or Task(s)
Students will solve addition and subtraction problems within 20 in a given time
43
Keansburg School DistrictCurriculum System
Mathematicsmeasurement skills with real life experiences
httpwwwk-5mathteachingresourcescomsupport-filesmy-favorite-time-of-daypdf
Estimating length httpwwwk-5mathteachingresourcescomsupport-filesestimatinglengthpdf
Olympic golf plastic golf clubs cotton balls and tape measurer
Olympic smiles measuring smiles with string and rulers
Olympic Frisbee using paper plates and tape measurer
Olympic airplane students will make paper airplanes measure the distance that they can throw their airplane
Doubles plus 1 game httpwwwk-5mathteachingresourcescomsupport-filesdoubles-plus-onepdf
Eleven more httpwwwk-5mathteachingresourcescomsupport-fileselevenmorepdf
frame Students will be asked to
measure items using inches and centimeters
Identify and create numbers with place values extending into the hundreds place
44
Keansburg School DistrictCurriculum System
Mathematics
Building numbers with base ten blocks pick three cards and arrange them to show a 3-digit number build that number with base ten blocks repeat with the same three cards until no new numbers can be made
Length strength inches httpwwwharcourtschoolcomactivitylength_strength1_inches
Length strength centimeters httpwwwharcourtschoolcomactivitylength_strength1_centi
Exceeds Standard
Number relationship mat wwwk-5mathteachingresourcescom
Place value barrier game httpwwwk-5mathteachingresourcescommath-gameshtml (integrate other skills into place values for example the digit in my 10s place is four doubled)
Measuring the mousersquos path httpwwwk-5mathteachingresourcescomsupport-filespaths1pdf
45
Keansburg School DistrictCurriculum System
Mathematics
Double minus 1 game httpwwwk-5mathteachingresourcescomsupport-filesdoubles-minus-onepdf
Number relationship mat httpwwwk-5mathteachingresourcescomsupport-filesnumberrelationshipmatpdf
46
Keansburg School DistrictCurriculum System
Mathematicsignment Matrices of Common Core State Standards
Grade Strand Standard Standard
Sept
embe
r ndash
Oct
ober
Nov
embe
r ndash
Dec
embe
r
Janu
ary
ndash Fe
brua
ry
Mar
ch ndash
Apr
il
May
- Ju
ne
1 OA 1
CC1OA1 Represent and solve problems involving addition and subtraction Use addition and subtraction within 20 to solve word problems involving situations of adding to taking from putting together taking apart and comparing with unknowns in all positions eg by using objects drawings and equations with a symbol for the unknown number to represent the problem
1 OA 2
CC1OA2 Represent and solve problems involving addition and subtraction Solve word problems that call for addition of three whole numbers whose sum is less than or equal to 20 eg by using objects drawings and equations with a symbol for the unknown number to represent the problem
1 OA 3
CC1OA3 Understand and apply properties of operations and the relationship between addition and subtraction Apply properties of operations as strategies to add and subtract Examples If 8 + 3 = 11 is known then 3 + 8 = 11 is also known (Commutative property of addition) To add 2 + 6 + 4 the second two numbers can be added to make a ten so 2 + 6 + 4 = 2 + 10 = 12 (Associative property of addition) (Students need not use formal terms for these properties)
1 OA 4
CC1OA4 Understand and apply properties of operations and the relationship between addition and subtraction Understand subtraction as an unknown-addend problem For example subtract 10 ndash 8 by finding the number that makes 10 when added to 8
1 OA 5 CC1OA5 Add and subtract within 20 Relate counting to addition and subtraction (eg by counting on 2 to add 2)
1 OA 6 CC1OA6 Add and subtract within 20 Add and subtract within 20 demonstrating fluency for addition and subtraction within 10 Use strategies such as counting on making ten (eg 8 + 6 = 8 + 2 + 4 = 10 + 4 = 14) decomposing a number leading to a ten (eg 13 ndash 4 = 13 ndash 3 ndash 1 = 10 ndash 1 = 9) using the relationship between addition and subtraction (eg knowing that 8 + 4
47
Keansburg School DistrictCurriculum System
Mathematics= 12 one knows 12 ndash 8 = 4) and creating equivalent but easier or known sums (eg adding 6 + 7 by creating the known equivalent 6 + 6 + 1 = 12 + 1 = 13)
1 OA 7
CC1OA7 Work with addition and subtraction equations Understand the meaning of the equal sign and determine if equations involving addition and subtraction are true or false For example which of the following equations are true and which are false 6 = 6 7 = 8 ndash 1 5 + 2 = 2 + 5 4 + 1 = 5 + 2
1 OA 8
CC1OA8 Work with addition and subtraction equations Determine the unknown whole number in an addition or subtraction equation relating three whole numbers For example determine the unknown number that makes the equation true in each of the equations 8 + = 11 5 = _ ndash 3 6 + 6 = _
1 NBT 1
CC1NBT1 Extend the counting sequence Count to 120 starting at any number less than 120 In this range read and write numerals and represent a number of objects with a written numeral
1 NBT 2
CC1NBT2 Understand place value Understand that the two digits of a two-digit number represent amounts of tens and ones Understand the following as special cases -- a 10 can be thought of as a bundle of ten ones mdash called a ldquotenrdquo -- b The numbers from 11 to 19 are composed of a ten and one two three four five six seven eight or nine ones -- c The numbers 10 20 30 40 50 60 70 80 90 refer to one two three four five six seven eight or nine tens (and 0 ones)
1 NBT 3
CC1NBT3 Understand place value Compare two two-digit numbers based on meanings of the tens and ones digits recording the results of comparisons with the symbols gt = and lt
1 NBT 4
CC1NBT4 Use place value understanding and properties of operations to add and subtract Add within 100 including adding a two-digit number and a one-digit number and adding a two-digit number and a multiple of 10 using concrete models or drawings and strategies based on place value properties of operations andor the relationship between addition and subtraction relate the strategy to a written method and explain the reasoning used Understand that in adding two-digit numbers one adds tens and tens ones and ones and sometimes it is necessary to compose a ten
1 NBT 5
CC1NBT5 Use place value understanding and properties of operations to add and subtract Given a two-digit number mentally find 10 more or 10 less than the number without having to count explain the reasoning used
1 NBT 6 CC1NBT6 Use place value understanding and properties of operations to add and subtract Subtract multiples of 10 in the range 10-90 from multiples of 10 in the range 10-90 (positive or zero differences) using concrete models or drawings and strategies based on place value properties of operations andor
48
Keansburg School DistrictCurriculum System
Mathematicsthe relationship between addition and subtraction relate the strategy to a written method and explain the reasoning used
1 MD 1
CC1MD1 Measure lengths indirectly and by iterating length units Order three objects by length compare the lengths of two objects indirectly by using a third object
1 MD 2
CC1MD2 Measure lengths indirectly and by iterating length units Express the length of an object as a whole number of length units by laying multiple copies of a shorter object (the length unit) end to end understand that the length measurement of an object is the number of same-size length units that span it with no gaps or overlaps Limit to contexts where the object being measured is spanned by a whole number of length units with no gaps or overlaps
1 MD 3CC1MD3 Tell and write time Tell and write time in hours and half-hours using analog and digital clocks
1 MD 4
CC1MD4 Represent and interpret data Organize represent and interpret data with up to three categories ask and answer questions about the total number of data points how many in each category and how many more or less are in one category than in another
1 G 1
CC1G1 Reason with shapes and their attributes Distinguish between defining attributes (eg triangles are closed and three-sided) versus non-defining attributes (eg color orientation overall size) for a wide variety of shapes build and draw shapes to possess defining attributes
1 G 2
CC1G2 Reason with shapes and their attributes Compose two-dimensional shapes (rectangles squares trapezoids triangles half-circles and quarter-circles) or three-dimensional shapes (cubes right rectangular prisms right circular cones and right circular cylinders) to create a composite shape and compose new shapes from the composite shape (Students do not need to learn formal names such as ldquoright rectangular prismrdquo)
1 G 3
CC1G3 Reason with shapes and their attributes Partition circles and rectangles into two and four equal shares describe the shares using the words halves fourths and quarters and use the phrases half of fourth of and quarter of Describe the whole as two of or four of the shares Understand for these examples that decomposing into more equal shares creates smaller shares
49
Keansburg School DistrictCurriculum System
Mathematics
Common Core State Standards Vocabulary
Addition and subtraction within 5 10 20 100 or 1000 Addition or subtraction of two whole numbers with whole number answers and with sum or minuend in the range 0-5 0-10 0-20 or 0-100 respectively Example 8 + 2 = 10 is an addition within 10 14 ndash 5 = 9 is a subtraction within 20 and 55 ndash 18 = 37 is a subtraction within 100
Additive inverses Two numbers whose sum is 0 are additive inverses of one another Example 34 and ndash 34 are additive inverses of one another because 34 + (ndash 34) = (ndash 34) + 34 = 0
Associative property of addition See Table 3 in this Glossary
Associative property of multiplication See Table 3 in this Glossary
Bivariate data Pairs of linked numerical observations Example a list of heights and weights for each player on a football team
Box plot A method of visually displaying a distribution of data values by using the median quartiles and extremes of the data set A box shows the middle 50 of the data1
Commutative property See Table 3 in this Glossary
Complex fraction A fraction AB where A andor B are fractions (B nonzero)
Computation algorithm A set of predefined steps applicable to a class of problems that gives the correct result in every case when the steps are carried out correctly See also computation strategy
Computation strategy Purposeful manipulations that may be chosen for specific problems may not have a fixed order and may be aimed at converting one problem into another See also computation algorithm
Congruent Two plane or solid figures are congruent if one can be obtained from the other by rigid motion (a sequence of rotations reflections and translations)
Counting on A strategy for finding the number of objects in a group without having to count every member of the group For example if a stack of books is known to have 8 books and 3 more books are added to the top it is not necessary to count the stack
50
Keansburg School DistrictCurriculum System
Mathematicsall over again One can find the total by counting onmdashpointing to the top book and saying ldquoeightrdquo following this with ldquonine ten eleven There are eleven books nowrdquo
Dot plot See line plot
Dilation A transformation that moves each point along the ray through the point emanating from a fixed center and multiplies distances from the center by a common scale factor
Expanded form A multi-digit number is expressed in expanded form when it is written as a sum of single-digit multiples of powers of ten For example 643 = 600 + 40 + 3
Expected value For a random variable the weighted average of its possible values with weights given by their respective probabilities
First quartile For a data set with median M the first quartile is the median of the data values less than M Example For the data set 1 3 6 7 10 12 14 15 22 120 the first quartile is 62 See also median third quartile interquartile range
Fraction A number expressible in the form ab where a is a whole number and b is a positive whole number (The word fraction in these standards always refers to a non-negative number) See also rational number
Identity property of 0 See Table 3 in this Glossary
Independently combined probability models Two probability models are said to be combined independently if the probability of each ordered pair in the combined model equals the product of the original probabilities of the two individual outcomes in the ordered pair
Integer A number expressible in the form a or ndasha for some whole number a
Interquartile Range A measure of variation in a set of numerical data the interquartile range is the distance between the first and third quartiles of the data set Example For the data set 1 3 6 7 10 12 14 15 22 120 the interquartile range is 15 ndash 6 = 9 See also first quartile third quartile
Line plot A method of visually displaying a distribution of data values where each data value is shown as a dot or mark above a number line Also known as a dot plot3
51
Keansburg School DistrictCurriculum System
MathematicsMean A measure of center in a set of numerical data computed by adding the values in a list and then dividing by the number of values in the list4 Example For the data set 1 3 6 7 10 12 14 15 22 120 the mean is 21
Mean absolute deviation A measure of variation in a set of numerical data computed by adding the distances between each data value and the mean then dividing by the number of data values Example For the data set 2 3 6 7 10 12 14 15 22 120 the mean absolute deviation is 20
Median A measure of center in a set of numerical data The median of a list of values is the value appearing at the center of a sorted version of the listmdashor the mean of the two central values if the list contains an even number of values Example For the data set 2 3 6 7 10 12 14 15 22 90 the median is 11
Midline In the graph of a trigonometric function the horizontal line halfway between its maximum and minimum values
Multiplication and division within 100 Multiplication or division of two whole numbers with whole number answers and with product or dividend in the range 0-100 Example 72 divide 8 = 9
Multiplicative inverses Two numbers whose product is 1 are multiplicative inverses of one another Example 34 and 43 are multiplicative inverses of one another because 34 times 43 = 43 times 34 = 1
Number line diagram A diagram of the number line used to represent numbers and support reasoning about them In a number line diagram for measurement quantities the interval from 0 to 1 on the diagram represents the unit of measure for the quantity
Percent rate of change A rate of change expressed as a percent Example if a population grows from 50 to 55 in a year it grows by 550 = 10 per year
Probability distribution The set of possible values of a random variable with a probability assigned to each
Properties of operations See Table 3 in this Glossary
Properties of equality See Table 4 in this Glossary
Properties of inequality See Table 5 in this Glossary
Properties of operations See Table 3 in this Glossary
52
Keansburg School DistrictCurriculum System
MathematicsProbability A number between 0 and 1 used to quantify likelihood for processes that have uncertain outcomes (such as tossing a coin selecting a person at random from a group of people tossing a ball at a target or testing for a medical condition)
Probability model A probability model is used to assign probabilities to outcomes of a chance process by examining the nature of the process The set of all outcomes is called the sample space and their probabilities sum to 1 See also uniform probability model
Random variable An assignment of a numerical value to each outcome in a sample space
Rational expression A quotient of two polynomials with a non-zero denominator
Rational number A number expressible in the form ab or ndash ab for some fraction ab The rational numbers include the integers
Rectilinear figure A polygon all angles of which are right angles
Rigid motion A transformation of points in space consisting of a sequence of one or more translations reflections andor rotations Rigid motions are here assumed to preserve distances and angle measures
Repeating decimal The decimal form of a rational number See also terminating decimal
Sample space In a probability model for a random process a list of the individual outcomes that are to be considered
Scatter plot A graph in the coordinate plane representing a set of bivariate data For example the heights and weights of a group of people could be displayed on a scatter plot5
Similarity transformation A rigid motion followed by a dilation
Tape diagram A drawing that looks like a segment of tape used to illustrate number relationships Also known as a strip diagram bar model fraction strip or length model
Terminating decimal A decimal is called terminating if its repeating digit is 0
Third quartile For a data set with median M the third quartile is the median of the data values greater than M Example For the data set 2 3 6 7 10 12 14 15 22 120 the third quartile is 15 See also median first quartile interquartile range
Transitivity principle for indirect measurement If the length of object A is greater than the length of object B and the length of object B is greater than the length of object C then the length of object A is greater than the length of object C This principle applies
53
Keansburg School DistrictCurriculum System
Mathematicsto measurement of other quantities as well
Uniform probability model A probability model which assigns equal probability to all outcomes See also probability model
Vector A quantity with magnitude and direction in the plane or in space defined by an ordered pair or triple of real numbers
Visual fraction model A tape diagram number line diagram or area model
Whole numbers The numbers 0 1 2 3 hellip5
54
- MissionVision Statement
- Beliefs
- Measurement amp Data
- Measure lengths and by iterating length units
- Tell and write time
- Represent and interpret data
- Geometry
- Reason with shapes and their attributes
- Number and Base Ten
- Extend the counting sequence
- Understand place value
-
- Measurement amp Data (II)
-
- Measure lengths and by iterating length units
- Tell and write time
-
- Represent and interpret data
- Geometry (II)
- Reason with shapes their attributes
-
- Number and Base Ten
- Use place value understanding and properties of operations to add and subtract
- Teacher will cover up specific numbers on an enlarged number grid using cover up tape to have students identify numbers before and after Students will come up and write the missing numbers
- Students will play ldquoI have__ Who has __ Teacher will create cards using index cards and numbers in which students need further practice with Students will read their cards aloud Variations of game can include identifying specific numbers identifying numbers more or less etc)
- Students will use base ten blocks to represent numbers including three digit numbers Students will identify representation of numbers through these manipulatives They may match the representation to the written number
- Students will write the number they created using the base ten blocks using their white boards and markers
- Students will arrange given digits to create the greatest and lowest possible numbers They can show each number they create using base ten blocks
- Students will use the Base Ten Exchange Game to show an understanding of exchanging ones for tens and tens for hundreds Students can use place value mats base ten blocks (cubes tens and flats) Students can take number of cubes displayed with roll of single die Students will determine when exchanging can be made when reaching ten units
- Base ten concentration wwwk-5mathteachingresourcescom
- Ten frame compare wwwk-5mathteachingresourcescom
-
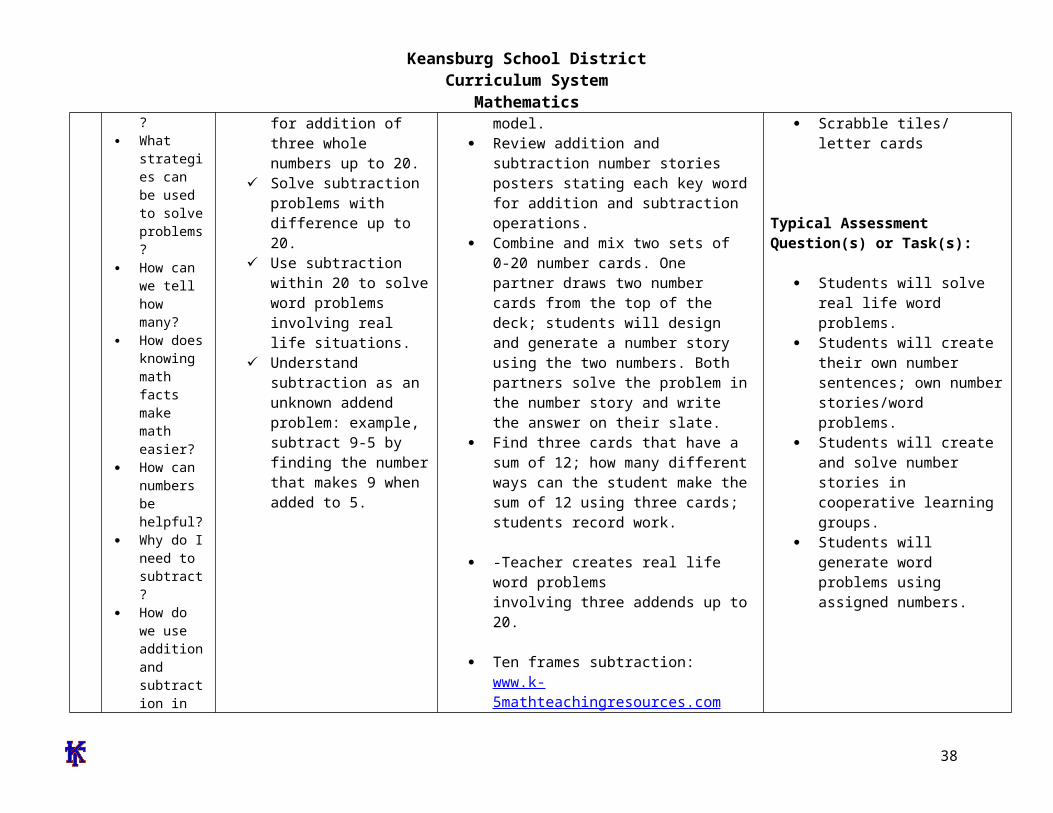
Keansburg School DistrictCurriculum System
Mathematicstrapezoid hexagon square triangle and circle Afterwards students will calculate the total number of each shape they included After completing the activity students will present their final product to the class and explain how they decided which shapes to use
Given an array of dots students will draw shapes with specific number of sides and corners and connect the dots to create the shapes Example Draw a shape with 5 sides Draw a shape with 6 corners
Students will create two-dimensional shapes on geoboards Then using different colored rubber bands students will divide the shapes into equal parts Students will transfer their equally divided shapes onto geoboard paper by drawing lines to show their equal parts
Play the Fraction Path Game Materials Fraction circles a circle with frac12 shaded a circle with 13 shaded and a circle with frac14 shaded Gameboard Path consisting of assorted shapes divided into halves thirds and fourths Players Needed 3 Directions Place the fraction circles facedown Players close their eyes and pick one fraction circle Each player follows the path from start to finish Each player looks at each shape on the path and records how many shapes show their fractions Players record
38
Keansburg School DistrictCurriculum System
Mathematicstheir results on paper using tally marks At end of game students compare total number of shapes that show their fraction
Exceeds Standard
39
Keansburg School DistrictCurriculum System
MathematicsKeansburg School DistrictCurriculum Management System
SubjectGradeLevelMathematicsGrade 1
Timeline May-Quarter 4
Topic(s) Number and Operations in Base Ten
Significance of Learning Goal(s) To use place value to add and subtract
Sugg
este
d D
ays
of
Inst
ruct
ion Content
Standards CPI Essential
Questions
Specific Learning Objective(s)
The Students Will Be Able ToSuggested Activities
Instructional Tools Materials Technology Resources
Assessments and Assessment Models
40
Keansburg School DistrictCurriculum System
MathematicsCPI 1NBT4 1NBT5 1NBT6
EQ How do
numbers help us
How can sets of numbers be counted compared and ordered
How can I use numbers to solve problems
How would putting numbers on a chart make it easier to understand information
How can I make it easier to understand numbers when I sort them
What is place value
Why is place value important
How can I
Concept(s) Use place value and properties of operations to add and subtract
SWBAT Use mental math to find
10 more or ten less than a given two-digit number and explain reasoning used within any number to 120
Use place value to add within 100 add a two-digit number to a one-digit number and add a two-digit number to a multiple of ten
Understand when adding two-digit numbers that ones add to the ones and tens add to the tens and sometimes it is necessary to compose a ten by regrouping
For all above objects students will use concrete models and strategies based on place value and relate the strategy to a written method and explain the reasoning used
Subtract multiples of 10 in the range 10-90 from multiples of 10 in the range 10-90 using
Meets Standard
Comparing two digit numbers wwwk-5mathteachingresourcescom
Subtraction split wwwk-5mathteachingresourcescom
Ten more wwwk-5mathteachingresourcescom
Addition split wwwk-5mathteachingresourcescom
Exceeds Standard
Comparing 3-Digit numbers wwwk-5mathteachingresourcescom
What number is wwwk-5mathteachingresourcescom
Students develop addition and subtraction number stories and have partners solve
Create pictures using basendash10 blocks Students trace picture onto paper label the base ten blocks with their value and add total
Solve number grid puzzles by adding and subtraction 10 on the number grid
Number cards Base 10 blocks Counters Number grid puzzles Sleeve protectors wwwk-
5mathteachingresourcescom
Dice
Typical Assessment Question(s) or Task(s)
Recognize numbers 1-120 using flashcards
Write numbers 1-20 using block or graph paper
Build two-digit numbers using tens and ones blocks
Listen and note students skip counting orally by tens to 120
Students compare and label two numbers using relation symbols
41
Keansburg School DistrictCurriculum System
Mathematics
42
Keansburg School DistrictCurriculum System
MathematicsKeansburg School DistrictCurriculum Management System
SubjectGradeLevelMathematicsGrade 1
Timeline June-Quarter 4
Topic(s) Readiness skills for September of Grade 2
Significance of Learning Goal(s) To compare larger numbers add fluently and apply measurement skills
Sugg
este
d D
ays
of
Inst
ruct
ion Content
Standards CPI Essential Questions
Specific Learning Objective(s)
The Students Will Be Able ToSuggested Activities
Instructional Tools Materials Technology Resources
Assessments and Assessment Models
CPI
EQ How can I use
place value to compare and
order numbers in the 100s
How can mastering basic addition and subtraction facts help me compute larger numbers
How can I tie in
Concept(s)Use place value to compare larger numbers fluently add up to 20 apply measurement skills
SWBAT Extend place value into
the hundreds place and re-write and construct models beyond the hundreds
Fluently add and subtract within 20 using mental strategies
Apply measurement skills
Meets Standard Place Value barrier game httpwwwk-
5mathteachingresourcescommath-gameshtml (place value only)
High card
httpwwwlearningboxcomBase10 BaseTenhtml
Time barrier game httpwwwk-5mathteachingresourcescomsupport-filestimebarriergamepdf httpwwwk-5mathteachingresourcescomsupport-filestimebarriergamegridpdf
My favorite time of day writing activity
number cards base ten blocks rulers tape measurer string number relationship mat paper plates cotton balls judy clock digital clock
Typical Assessment Question(s) or Task(s)
Students will solve addition and subtraction problems within 20 in a given time
43
Keansburg School DistrictCurriculum System
Mathematicsmeasurement skills with real life experiences
httpwwwk-5mathteachingresourcescomsupport-filesmy-favorite-time-of-daypdf
Estimating length httpwwwk-5mathteachingresourcescomsupport-filesestimatinglengthpdf
Olympic golf plastic golf clubs cotton balls and tape measurer
Olympic smiles measuring smiles with string and rulers
Olympic Frisbee using paper plates and tape measurer
Olympic airplane students will make paper airplanes measure the distance that they can throw their airplane
Doubles plus 1 game httpwwwk-5mathteachingresourcescomsupport-filesdoubles-plus-onepdf
Eleven more httpwwwk-5mathteachingresourcescomsupport-fileselevenmorepdf
frame Students will be asked to
measure items using inches and centimeters
Identify and create numbers with place values extending into the hundreds place
44
Keansburg School DistrictCurriculum System
Mathematics
Building numbers with base ten blocks pick three cards and arrange them to show a 3-digit number build that number with base ten blocks repeat with the same three cards until no new numbers can be made
Length strength inches httpwwwharcourtschoolcomactivitylength_strength1_inches
Length strength centimeters httpwwwharcourtschoolcomactivitylength_strength1_centi
Exceeds Standard
Number relationship mat wwwk-5mathteachingresourcescom
Place value barrier game httpwwwk-5mathteachingresourcescommath-gameshtml (integrate other skills into place values for example the digit in my 10s place is four doubled)
Measuring the mousersquos path httpwwwk-5mathteachingresourcescomsupport-filespaths1pdf
45
Keansburg School DistrictCurriculum System
Mathematics
Double minus 1 game httpwwwk-5mathteachingresourcescomsupport-filesdoubles-minus-onepdf
Number relationship mat httpwwwk-5mathteachingresourcescomsupport-filesnumberrelationshipmatpdf
46
Keansburg School DistrictCurriculum System
Mathematicsignment Matrices of Common Core State Standards
Grade Strand Standard Standard
Sept
embe
r ndash
Oct
ober
Nov
embe
r ndash
Dec
embe
r
Janu
ary
ndash Fe
brua
ry
Mar
ch ndash
Apr
il
May
- Ju
ne
1 OA 1
CC1OA1 Represent and solve problems involving addition and subtraction Use addition and subtraction within 20 to solve word problems involving situations of adding to taking from putting together taking apart and comparing with unknowns in all positions eg by using objects drawings and equations with a symbol for the unknown number to represent the problem
1 OA 2
CC1OA2 Represent and solve problems involving addition and subtraction Solve word problems that call for addition of three whole numbers whose sum is less than or equal to 20 eg by using objects drawings and equations with a symbol for the unknown number to represent the problem
1 OA 3
CC1OA3 Understand and apply properties of operations and the relationship between addition and subtraction Apply properties of operations as strategies to add and subtract Examples If 8 + 3 = 11 is known then 3 + 8 = 11 is also known (Commutative property of addition) To add 2 + 6 + 4 the second two numbers can be added to make a ten so 2 + 6 + 4 = 2 + 10 = 12 (Associative property of addition) (Students need not use formal terms for these properties)
1 OA 4
CC1OA4 Understand and apply properties of operations and the relationship between addition and subtraction Understand subtraction as an unknown-addend problem For example subtract 10 ndash 8 by finding the number that makes 10 when added to 8
1 OA 5 CC1OA5 Add and subtract within 20 Relate counting to addition and subtraction (eg by counting on 2 to add 2)
1 OA 6 CC1OA6 Add and subtract within 20 Add and subtract within 20 demonstrating fluency for addition and subtraction within 10 Use strategies such as counting on making ten (eg 8 + 6 = 8 + 2 + 4 = 10 + 4 = 14) decomposing a number leading to a ten (eg 13 ndash 4 = 13 ndash 3 ndash 1 = 10 ndash 1 = 9) using the relationship between addition and subtraction (eg knowing that 8 + 4
47
Keansburg School DistrictCurriculum System
Mathematics= 12 one knows 12 ndash 8 = 4) and creating equivalent but easier or known sums (eg adding 6 + 7 by creating the known equivalent 6 + 6 + 1 = 12 + 1 = 13)
1 OA 7
CC1OA7 Work with addition and subtraction equations Understand the meaning of the equal sign and determine if equations involving addition and subtraction are true or false For example which of the following equations are true and which are false 6 = 6 7 = 8 ndash 1 5 + 2 = 2 + 5 4 + 1 = 5 + 2
1 OA 8
CC1OA8 Work with addition and subtraction equations Determine the unknown whole number in an addition or subtraction equation relating three whole numbers For example determine the unknown number that makes the equation true in each of the equations 8 + = 11 5 = _ ndash 3 6 + 6 = _
1 NBT 1
CC1NBT1 Extend the counting sequence Count to 120 starting at any number less than 120 In this range read and write numerals and represent a number of objects with a written numeral
1 NBT 2
CC1NBT2 Understand place value Understand that the two digits of a two-digit number represent amounts of tens and ones Understand the following as special cases -- a 10 can be thought of as a bundle of ten ones mdash called a ldquotenrdquo -- b The numbers from 11 to 19 are composed of a ten and one two three four five six seven eight or nine ones -- c The numbers 10 20 30 40 50 60 70 80 90 refer to one two three four five six seven eight or nine tens (and 0 ones)
1 NBT 3
CC1NBT3 Understand place value Compare two two-digit numbers based on meanings of the tens and ones digits recording the results of comparisons with the symbols gt = and lt
1 NBT 4
CC1NBT4 Use place value understanding and properties of operations to add and subtract Add within 100 including adding a two-digit number and a one-digit number and adding a two-digit number and a multiple of 10 using concrete models or drawings and strategies based on place value properties of operations andor the relationship between addition and subtraction relate the strategy to a written method and explain the reasoning used Understand that in adding two-digit numbers one adds tens and tens ones and ones and sometimes it is necessary to compose a ten
1 NBT 5
CC1NBT5 Use place value understanding and properties of operations to add and subtract Given a two-digit number mentally find 10 more or 10 less than the number without having to count explain the reasoning used
1 NBT 6 CC1NBT6 Use place value understanding and properties of operations to add and subtract Subtract multiples of 10 in the range 10-90 from multiples of 10 in the range 10-90 (positive or zero differences) using concrete models or drawings and strategies based on place value properties of operations andor
48
Keansburg School DistrictCurriculum System
Mathematicsthe relationship between addition and subtraction relate the strategy to a written method and explain the reasoning used
1 MD 1
CC1MD1 Measure lengths indirectly and by iterating length units Order three objects by length compare the lengths of two objects indirectly by using a third object
1 MD 2
CC1MD2 Measure lengths indirectly and by iterating length units Express the length of an object as a whole number of length units by laying multiple copies of a shorter object (the length unit) end to end understand that the length measurement of an object is the number of same-size length units that span it with no gaps or overlaps Limit to contexts where the object being measured is spanned by a whole number of length units with no gaps or overlaps
1 MD 3CC1MD3 Tell and write time Tell and write time in hours and half-hours using analog and digital clocks
1 MD 4
CC1MD4 Represent and interpret data Organize represent and interpret data with up to three categories ask and answer questions about the total number of data points how many in each category and how many more or less are in one category than in another
1 G 1
CC1G1 Reason with shapes and their attributes Distinguish between defining attributes (eg triangles are closed and three-sided) versus non-defining attributes (eg color orientation overall size) for a wide variety of shapes build and draw shapes to possess defining attributes
1 G 2
CC1G2 Reason with shapes and their attributes Compose two-dimensional shapes (rectangles squares trapezoids triangles half-circles and quarter-circles) or three-dimensional shapes (cubes right rectangular prisms right circular cones and right circular cylinders) to create a composite shape and compose new shapes from the composite shape (Students do not need to learn formal names such as ldquoright rectangular prismrdquo)
1 G 3
CC1G3 Reason with shapes and their attributes Partition circles and rectangles into two and four equal shares describe the shares using the words halves fourths and quarters and use the phrases half of fourth of and quarter of Describe the whole as two of or four of the shares Understand for these examples that decomposing into more equal shares creates smaller shares
49
Keansburg School DistrictCurriculum System
Mathematics
Common Core State Standards Vocabulary
Addition and subtraction within 5 10 20 100 or 1000 Addition or subtraction of two whole numbers with whole number answers and with sum or minuend in the range 0-5 0-10 0-20 or 0-100 respectively Example 8 + 2 = 10 is an addition within 10 14 ndash 5 = 9 is a subtraction within 20 and 55 ndash 18 = 37 is a subtraction within 100
Additive inverses Two numbers whose sum is 0 are additive inverses of one another Example 34 and ndash 34 are additive inverses of one another because 34 + (ndash 34) = (ndash 34) + 34 = 0
Associative property of addition See Table 3 in this Glossary
Associative property of multiplication See Table 3 in this Glossary
Bivariate data Pairs of linked numerical observations Example a list of heights and weights for each player on a football team
Box plot A method of visually displaying a distribution of data values by using the median quartiles and extremes of the data set A box shows the middle 50 of the data1
Commutative property See Table 3 in this Glossary
Complex fraction A fraction AB where A andor B are fractions (B nonzero)
Computation algorithm A set of predefined steps applicable to a class of problems that gives the correct result in every case when the steps are carried out correctly See also computation strategy
Computation strategy Purposeful manipulations that may be chosen for specific problems may not have a fixed order and may be aimed at converting one problem into another See also computation algorithm
Congruent Two plane or solid figures are congruent if one can be obtained from the other by rigid motion (a sequence of rotations reflections and translations)
Counting on A strategy for finding the number of objects in a group without having to count every member of the group For example if a stack of books is known to have 8 books and 3 more books are added to the top it is not necessary to count the stack
50
Keansburg School DistrictCurriculum System
Mathematicsall over again One can find the total by counting onmdashpointing to the top book and saying ldquoeightrdquo following this with ldquonine ten eleven There are eleven books nowrdquo
Dot plot See line plot
Dilation A transformation that moves each point along the ray through the point emanating from a fixed center and multiplies distances from the center by a common scale factor
Expanded form A multi-digit number is expressed in expanded form when it is written as a sum of single-digit multiples of powers of ten For example 643 = 600 + 40 + 3
Expected value For a random variable the weighted average of its possible values with weights given by their respective probabilities
First quartile For a data set with median M the first quartile is the median of the data values less than M Example For the data set 1 3 6 7 10 12 14 15 22 120 the first quartile is 62 See also median third quartile interquartile range
Fraction A number expressible in the form ab where a is a whole number and b is a positive whole number (The word fraction in these standards always refers to a non-negative number) See also rational number
Identity property of 0 See Table 3 in this Glossary
Independently combined probability models Two probability models are said to be combined independently if the probability of each ordered pair in the combined model equals the product of the original probabilities of the two individual outcomes in the ordered pair
Integer A number expressible in the form a or ndasha for some whole number a
Interquartile Range A measure of variation in a set of numerical data the interquartile range is the distance between the first and third quartiles of the data set Example For the data set 1 3 6 7 10 12 14 15 22 120 the interquartile range is 15 ndash 6 = 9 See also first quartile third quartile
Line plot A method of visually displaying a distribution of data values where each data value is shown as a dot or mark above a number line Also known as a dot plot3
51
Keansburg School DistrictCurriculum System
MathematicsMean A measure of center in a set of numerical data computed by adding the values in a list and then dividing by the number of values in the list4 Example For the data set 1 3 6 7 10 12 14 15 22 120 the mean is 21
Mean absolute deviation A measure of variation in a set of numerical data computed by adding the distances between each data value and the mean then dividing by the number of data values Example For the data set 2 3 6 7 10 12 14 15 22 120 the mean absolute deviation is 20
Median A measure of center in a set of numerical data The median of a list of values is the value appearing at the center of a sorted version of the listmdashor the mean of the two central values if the list contains an even number of values Example For the data set 2 3 6 7 10 12 14 15 22 90 the median is 11
Midline In the graph of a trigonometric function the horizontal line halfway between its maximum and minimum values
Multiplication and division within 100 Multiplication or division of two whole numbers with whole number answers and with product or dividend in the range 0-100 Example 72 divide 8 = 9
Multiplicative inverses Two numbers whose product is 1 are multiplicative inverses of one another Example 34 and 43 are multiplicative inverses of one another because 34 times 43 = 43 times 34 = 1
Number line diagram A diagram of the number line used to represent numbers and support reasoning about them In a number line diagram for measurement quantities the interval from 0 to 1 on the diagram represents the unit of measure for the quantity
Percent rate of change A rate of change expressed as a percent Example if a population grows from 50 to 55 in a year it grows by 550 = 10 per year
Probability distribution The set of possible values of a random variable with a probability assigned to each
Properties of operations See Table 3 in this Glossary
Properties of equality See Table 4 in this Glossary
Properties of inequality See Table 5 in this Glossary
Properties of operations See Table 3 in this Glossary
52
Keansburg School DistrictCurriculum System
MathematicsProbability A number between 0 and 1 used to quantify likelihood for processes that have uncertain outcomes (such as tossing a coin selecting a person at random from a group of people tossing a ball at a target or testing for a medical condition)
Probability model A probability model is used to assign probabilities to outcomes of a chance process by examining the nature of the process The set of all outcomes is called the sample space and their probabilities sum to 1 See also uniform probability model
Random variable An assignment of a numerical value to each outcome in a sample space
Rational expression A quotient of two polynomials with a non-zero denominator
Rational number A number expressible in the form ab or ndash ab for some fraction ab The rational numbers include the integers
Rectilinear figure A polygon all angles of which are right angles
Rigid motion A transformation of points in space consisting of a sequence of one or more translations reflections andor rotations Rigid motions are here assumed to preserve distances and angle measures
Repeating decimal The decimal form of a rational number See also terminating decimal
Sample space In a probability model for a random process a list of the individual outcomes that are to be considered
Scatter plot A graph in the coordinate plane representing a set of bivariate data For example the heights and weights of a group of people could be displayed on a scatter plot5
Similarity transformation A rigid motion followed by a dilation
Tape diagram A drawing that looks like a segment of tape used to illustrate number relationships Also known as a strip diagram bar model fraction strip or length model
Terminating decimal A decimal is called terminating if its repeating digit is 0
Third quartile For a data set with median M the third quartile is the median of the data values greater than M Example For the data set 2 3 6 7 10 12 14 15 22 120 the third quartile is 15 See also median first quartile interquartile range
Transitivity principle for indirect measurement If the length of object A is greater than the length of object B and the length of object B is greater than the length of object C then the length of object A is greater than the length of object C This principle applies
53
Keansburg School DistrictCurriculum System
Mathematicsto measurement of other quantities as well
Uniform probability model A probability model which assigns equal probability to all outcomes See also probability model
Vector A quantity with magnitude and direction in the plane or in space defined by an ordered pair or triple of real numbers
Visual fraction model A tape diagram number line diagram or area model
Whole numbers The numbers 0 1 2 3 hellip5
54
- MissionVision Statement
- Beliefs
- Measurement amp Data
- Measure lengths and by iterating length units
- Tell and write time
- Represent and interpret data
- Geometry
- Reason with shapes and their attributes
- Number and Base Ten
- Extend the counting sequence
- Understand place value
-
- Measurement amp Data (II)
-
- Measure lengths and by iterating length units
- Tell and write time
-
- Represent and interpret data
- Geometry (II)
- Reason with shapes their attributes
-
- Number and Base Ten
- Use place value understanding and properties of operations to add and subtract
- Teacher will cover up specific numbers on an enlarged number grid using cover up tape to have students identify numbers before and after Students will come up and write the missing numbers
- Students will play ldquoI have__ Who has __ Teacher will create cards using index cards and numbers in which students need further practice with Students will read their cards aloud Variations of game can include identifying specific numbers identifying numbers more or less etc)
- Students will use base ten blocks to represent numbers including three digit numbers Students will identify representation of numbers through these manipulatives They may match the representation to the written number
- Students will write the number they created using the base ten blocks using their white boards and markers
- Students will arrange given digits to create the greatest and lowest possible numbers They can show each number they create using base ten blocks
- Students will use the Base Ten Exchange Game to show an understanding of exchanging ones for tens and tens for hundreds Students can use place value mats base ten blocks (cubes tens and flats) Students can take number of cubes displayed with roll of single die Students will determine when exchanging can be made when reaching ten units
- Base ten concentration wwwk-5mathteachingresourcescom
- Ten frame compare wwwk-5mathteachingresourcescom
-
Keansburg School DistrictCurriculum System
MathematicsKeansburg School DistrictCurriculum Management System
SubjectGradeLevelMathematicsGrade 1
Timeline May-Quarter 4
Topic(s) Number and Operations in Base Ten
Significance of Learning Goal(s) To use place value to add and subtract
Sugg
este
d D
ays
of
Inst
ruct
ion Content
Standards CPI Essential
Questions
Specific Learning Objective(s)
The Students Will Be Able ToSuggested Activities
Instructional Tools Materials Technology Resources
Assessments and Assessment Models
40
Keansburg School DistrictCurriculum System
MathematicsCPI 1NBT4 1NBT5 1NBT6
EQ How do
numbers help us
How can sets of numbers be counted compared and ordered
How can I use numbers to solve problems
How would putting numbers on a chart make it easier to understand information
How can I make it easier to understand numbers when I sort them
What is place value
Why is place value important
How can I
Concept(s) Use place value and properties of operations to add and subtract
SWBAT Use mental math to find
10 more or ten less than a given two-digit number and explain reasoning used within any number to 120
Use place value to add within 100 add a two-digit number to a one-digit number and add a two-digit number to a multiple of ten
Understand when adding two-digit numbers that ones add to the ones and tens add to the tens and sometimes it is necessary to compose a ten by regrouping
For all above objects students will use concrete models and strategies based on place value and relate the strategy to a written method and explain the reasoning used
Subtract multiples of 10 in the range 10-90 from multiples of 10 in the range 10-90 using
Meets Standard
Comparing two digit numbers wwwk-5mathteachingresourcescom
Subtraction split wwwk-5mathteachingresourcescom
Ten more wwwk-5mathteachingresourcescom
Addition split wwwk-5mathteachingresourcescom
Exceeds Standard
Comparing 3-Digit numbers wwwk-5mathteachingresourcescom
What number is wwwk-5mathteachingresourcescom
Students develop addition and subtraction number stories and have partners solve
Create pictures using basendash10 blocks Students trace picture onto paper label the base ten blocks with their value and add total
Solve number grid puzzles by adding and subtraction 10 on the number grid
Number cards Base 10 blocks Counters Number grid puzzles Sleeve protectors wwwk-
5mathteachingresourcescom
Dice
Typical Assessment Question(s) or Task(s)
Recognize numbers 1-120 using flashcards
Write numbers 1-20 using block or graph paper
Build two-digit numbers using tens and ones blocks
Listen and note students skip counting orally by tens to 120
Students compare and label two numbers using relation symbols
41
Keansburg School DistrictCurriculum System
Mathematics
42
Keansburg School DistrictCurriculum System
MathematicsKeansburg School DistrictCurriculum Management System
SubjectGradeLevelMathematicsGrade 1
Timeline June-Quarter 4
Topic(s) Readiness skills for September of Grade 2
Significance of Learning Goal(s) To compare larger numbers add fluently and apply measurement skills
Sugg
este
d D
ays
of
Inst
ruct
ion Content
Standards CPI Essential Questions
Specific Learning Objective(s)
The Students Will Be Able ToSuggested Activities
Instructional Tools Materials Technology Resources
Assessments and Assessment Models
CPI
EQ How can I use
place value to compare and
order numbers in the 100s
How can mastering basic addition and subtraction facts help me compute larger numbers
How can I tie in
Concept(s)Use place value to compare larger numbers fluently add up to 20 apply measurement skills
SWBAT Extend place value into
the hundreds place and re-write and construct models beyond the hundreds
Fluently add and subtract within 20 using mental strategies
Apply measurement skills
Meets Standard Place Value barrier game httpwwwk-
5mathteachingresourcescommath-gameshtml (place value only)
High card
httpwwwlearningboxcomBase10 BaseTenhtml
Time barrier game httpwwwk-5mathteachingresourcescomsupport-filestimebarriergamepdf httpwwwk-5mathteachingresourcescomsupport-filestimebarriergamegridpdf
My favorite time of day writing activity
number cards base ten blocks rulers tape measurer string number relationship mat paper plates cotton balls judy clock digital clock
Typical Assessment Question(s) or Task(s)
Students will solve addition and subtraction problems within 20 in a given time
43
Keansburg School DistrictCurriculum System
Mathematicsmeasurement skills with real life experiences
httpwwwk-5mathteachingresourcescomsupport-filesmy-favorite-time-of-daypdf
Estimating length httpwwwk-5mathteachingresourcescomsupport-filesestimatinglengthpdf
Olympic golf plastic golf clubs cotton balls and tape measurer
Olympic smiles measuring smiles with string and rulers
Olympic Frisbee using paper plates and tape measurer
Olympic airplane students will make paper airplanes measure the distance that they can throw their airplane
Doubles plus 1 game httpwwwk-5mathteachingresourcescomsupport-filesdoubles-plus-onepdf
Eleven more httpwwwk-5mathteachingresourcescomsupport-fileselevenmorepdf
frame Students will be asked to
measure items using inches and centimeters
Identify and create numbers with place values extending into the hundreds place
44
Keansburg School DistrictCurriculum System
Mathematics
Building numbers with base ten blocks pick three cards and arrange them to show a 3-digit number build that number with base ten blocks repeat with the same three cards until no new numbers can be made
Length strength inches httpwwwharcourtschoolcomactivitylength_strength1_inches
Length strength centimeters httpwwwharcourtschoolcomactivitylength_strength1_centi
Exceeds Standard
Number relationship mat wwwk-5mathteachingresourcescom
Place value barrier game httpwwwk-5mathteachingresourcescommath-gameshtml (integrate other skills into place values for example the digit in my 10s place is four doubled)
Measuring the mousersquos path httpwwwk-5mathteachingresourcescomsupport-filespaths1pdf
45
Keansburg School DistrictCurriculum System
Mathematics
Double minus 1 game httpwwwk-5mathteachingresourcescomsupport-filesdoubles-minus-onepdf
Number relationship mat httpwwwk-5mathteachingresourcescomsupport-filesnumberrelationshipmatpdf
46
Keansburg School DistrictCurriculum System
Mathematicsignment Matrices of Common Core State Standards
Grade Strand Standard Standard
Sept
embe
r ndash
Oct
ober
Nov
embe
r ndash
Dec
embe
r
Janu
ary
ndash Fe
brua
ry
Mar
ch ndash
Apr
il
May
- Ju
ne
1 OA 1
CC1OA1 Represent and solve problems involving addition and subtraction Use addition and subtraction within 20 to solve word problems involving situations of adding to taking from putting together taking apart and comparing with unknowns in all positions eg by using objects drawings and equations with a symbol for the unknown number to represent the problem
1 OA 2
CC1OA2 Represent and solve problems involving addition and subtraction Solve word problems that call for addition of three whole numbers whose sum is less than or equal to 20 eg by using objects drawings and equations with a symbol for the unknown number to represent the problem
1 OA 3
CC1OA3 Understand and apply properties of operations and the relationship between addition and subtraction Apply properties of operations as strategies to add and subtract Examples If 8 + 3 = 11 is known then 3 + 8 = 11 is also known (Commutative property of addition) To add 2 + 6 + 4 the second two numbers can be added to make a ten so 2 + 6 + 4 = 2 + 10 = 12 (Associative property of addition) (Students need not use formal terms for these properties)
1 OA 4
CC1OA4 Understand and apply properties of operations and the relationship between addition and subtraction Understand subtraction as an unknown-addend problem For example subtract 10 ndash 8 by finding the number that makes 10 when added to 8
1 OA 5 CC1OA5 Add and subtract within 20 Relate counting to addition and subtraction (eg by counting on 2 to add 2)
1 OA 6 CC1OA6 Add and subtract within 20 Add and subtract within 20 demonstrating fluency for addition and subtraction within 10 Use strategies such as counting on making ten (eg 8 + 6 = 8 + 2 + 4 = 10 + 4 = 14) decomposing a number leading to a ten (eg 13 ndash 4 = 13 ndash 3 ndash 1 = 10 ndash 1 = 9) using the relationship between addition and subtraction (eg knowing that 8 + 4
47
Keansburg School DistrictCurriculum System
Mathematics= 12 one knows 12 ndash 8 = 4) and creating equivalent but easier or known sums (eg adding 6 + 7 by creating the known equivalent 6 + 6 + 1 = 12 + 1 = 13)
1 OA 7
CC1OA7 Work with addition and subtraction equations Understand the meaning of the equal sign and determine if equations involving addition and subtraction are true or false For example which of the following equations are true and which are false 6 = 6 7 = 8 ndash 1 5 + 2 = 2 + 5 4 + 1 = 5 + 2
1 OA 8
CC1OA8 Work with addition and subtraction equations Determine the unknown whole number in an addition or subtraction equation relating three whole numbers For example determine the unknown number that makes the equation true in each of the equations 8 + = 11 5 = _ ndash 3 6 + 6 = _
1 NBT 1
CC1NBT1 Extend the counting sequence Count to 120 starting at any number less than 120 In this range read and write numerals and represent a number of objects with a written numeral
1 NBT 2
CC1NBT2 Understand place value Understand that the two digits of a two-digit number represent amounts of tens and ones Understand the following as special cases -- a 10 can be thought of as a bundle of ten ones mdash called a ldquotenrdquo -- b The numbers from 11 to 19 are composed of a ten and one two three four five six seven eight or nine ones -- c The numbers 10 20 30 40 50 60 70 80 90 refer to one two three four five six seven eight or nine tens (and 0 ones)
1 NBT 3
CC1NBT3 Understand place value Compare two two-digit numbers based on meanings of the tens and ones digits recording the results of comparisons with the symbols gt = and lt
1 NBT 4
CC1NBT4 Use place value understanding and properties of operations to add and subtract Add within 100 including adding a two-digit number and a one-digit number and adding a two-digit number and a multiple of 10 using concrete models or drawings and strategies based on place value properties of operations andor the relationship between addition and subtraction relate the strategy to a written method and explain the reasoning used Understand that in adding two-digit numbers one adds tens and tens ones and ones and sometimes it is necessary to compose a ten
1 NBT 5
CC1NBT5 Use place value understanding and properties of operations to add and subtract Given a two-digit number mentally find 10 more or 10 less than the number without having to count explain the reasoning used
1 NBT 6 CC1NBT6 Use place value understanding and properties of operations to add and subtract Subtract multiples of 10 in the range 10-90 from multiples of 10 in the range 10-90 (positive or zero differences) using concrete models or drawings and strategies based on place value properties of operations andor
48
Keansburg School DistrictCurriculum System
Mathematicsthe relationship between addition and subtraction relate the strategy to a written method and explain the reasoning used
1 MD 1
CC1MD1 Measure lengths indirectly and by iterating length units Order three objects by length compare the lengths of two objects indirectly by using a third object
1 MD 2
CC1MD2 Measure lengths indirectly and by iterating length units Express the length of an object as a whole number of length units by laying multiple copies of a shorter object (the length unit) end to end understand that the length measurement of an object is the number of same-size length units that span it with no gaps or overlaps Limit to contexts where the object being measured is spanned by a whole number of length units with no gaps or overlaps
1 MD 3CC1MD3 Tell and write time Tell and write time in hours and half-hours using analog and digital clocks
1 MD 4
CC1MD4 Represent and interpret data Organize represent and interpret data with up to three categories ask and answer questions about the total number of data points how many in each category and how many more or less are in one category than in another
1 G 1
CC1G1 Reason with shapes and their attributes Distinguish between defining attributes (eg triangles are closed and three-sided) versus non-defining attributes (eg color orientation overall size) for a wide variety of shapes build and draw shapes to possess defining attributes
1 G 2
CC1G2 Reason with shapes and their attributes Compose two-dimensional shapes (rectangles squares trapezoids triangles half-circles and quarter-circles) or three-dimensional shapes (cubes right rectangular prisms right circular cones and right circular cylinders) to create a composite shape and compose new shapes from the composite shape (Students do not need to learn formal names such as ldquoright rectangular prismrdquo)
1 G 3
CC1G3 Reason with shapes and their attributes Partition circles and rectangles into two and four equal shares describe the shares using the words halves fourths and quarters and use the phrases half of fourth of and quarter of Describe the whole as two of or four of the shares Understand for these examples that decomposing into more equal shares creates smaller shares
49
Keansburg School DistrictCurriculum System
Mathematics
Common Core State Standards Vocabulary
Addition and subtraction within 5 10 20 100 or 1000 Addition or subtraction of two whole numbers with whole number answers and with sum or minuend in the range 0-5 0-10 0-20 or 0-100 respectively Example 8 + 2 = 10 is an addition within 10 14 ndash 5 = 9 is a subtraction within 20 and 55 ndash 18 = 37 is a subtraction within 100
Additive inverses Two numbers whose sum is 0 are additive inverses of one another Example 34 and ndash 34 are additive inverses of one another because 34 + (ndash 34) = (ndash 34) + 34 = 0
Associative property of addition See Table 3 in this Glossary
Associative property of multiplication See Table 3 in this Glossary
Bivariate data Pairs of linked numerical observations Example a list of heights and weights for each player on a football team
Box plot A method of visually displaying a distribution of data values by using the median quartiles and extremes of the data set A box shows the middle 50 of the data1
Commutative property See Table 3 in this Glossary
Complex fraction A fraction AB where A andor B are fractions (B nonzero)
Computation algorithm A set of predefined steps applicable to a class of problems that gives the correct result in every case when the steps are carried out correctly See also computation strategy
Computation strategy Purposeful manipulations that may be chosen for specific problems may not have a fixed order and may be aimed at converting one problem into another See also computation algorithm
Congruent Two plane or solid figures are congruent if one can be obtained from the other by rigid motion (a sequence of rotations reflections and translations)
Counting on A strategy for finding the number of objects in a group without having to count every member of the group For example if a stack of books is known to have 8 books and 3 more books are added to the top it is not necessary to count the stack
50
Keansburg School DistrictCurriculum System
Mathematicsall over again One can find the total by counting onmdashpointing to the top book and saying ldquoeightrdquo following this with ldquonine ten eleven There are eleven books nowrdquo
Dot plot See line plot
Dilation A transformation that moves each point along the ray through the point emanating from a fixed center and multiplies distances from the center by a common scale factor
Expanded form A multi-digit number is expressed in expanded form when it is written as a sum of single-digit multiples of powers of ten For example 643 = 600 + 40 + 3
Expected value For a random variable the weighted average of its possible values with weights given by their respective probabilities
First quartile For a data set with median M the first quartile is the median of the data values less than M Example For the data set 1 3 6 7 10 12 14 15 22 120 the first quartile is 62 See also median third quartile interquartile range
Fraction A number expressible in the form ab where a is a whole number and b is a positive whole number (The word fraction in these standards always refers to a non-negative number) See also rational number
Identity property of 0 See Table 3 in this Glossary
Independently combined probability models Two probability models are said to be combined independently if the probability of each ordered pair in the combined model equals the product of the original probabilities of the two individual outcomes in the ordered pair
Integer A number expressible in the form a or ndasha for some whole number a
Interquartile Range A measure of variation in a set of numerical data the interquartile range is the distance between the first and third quartiles of the data set Example For the data set 1 3 6 7 10 12 14 15 22 120 the interquartile range is 15 ndash 6 = 9 See also first quartile third quartile
Line plot A method of visually displaying a distribution of data values where each data value is shown as a dot or mark above a number line Also known as a dot plot3
51
Keansburg School DistrictCurriculum System
MathematicsMean A measure of center in a set of numerical data computed by adding the values in a list and then dividing by the number of values in the list4 Example For the data set 1 3 6 7 10 12 14 15 22 120 the mean is 21
Mean absolute deviation A measure of variation in a set of numerical data computed by adding the distances between each data value and the mean then dividing by the number of data values Example For the data set 2 3 6 7 10 12 14 15 22 120 the mean absolute deviation is 20
Median A measure of center in a set of numerical data The median of a list of values is the value appearing at the center of a sorted version of the listmdashor the mean of the two central values if the list contains an even number of values Example For the data set 2 3 6 7 10 12 14 15 22 90 the median is 11
Midline In the graph of a trigonometric function the horizontal line halfway between its maximum and minimum values
Multiplication and division within 100 Multiplication or division of two whole numbers with whole number answers and with product or dividend in the range 0-100 Example 72 divide 8 = 9
Multiplicative inverses Two numbers whose product is 1 are multiplicative inverses of one another Example 34 and 43 are multiplicative inverses of one another because 34 times 43 = 43 times 34 = 1
Number line diagram A diagram of the number line used to represent numbers and support reasoning about them In a number line diagram for measurement quantities the interval from 0 to 1 on the diagram represents the unit of measure for the quantity
Percent rate of change A rate of change expressed as a percent Example if a population grows from 50 to 55 in a year it grows by 550 = 10 per year
Probability distribution The set of possible values of a random variable with a probability assigned to each
Properties of operations See Table 3 in this Glossary
Properties of equality See Table 4 in this Glossary
Properties of inequality See Table 5 in this Glossary
Properties of operations See Table 3 in this Glossary
52
Keansburg School DistrictCurriculum System
MathematicsProbability A number between 0 and 1 used to quantify likelihood for processes that have uncertain outcomes (such as tossing a coin selecting a person at random from a group of people tossing a ball at a target or testing for a medical condition)
Probability model A probability model is used to assign probabilities to outcomes of a chance process by examining the nature of the process The set of all outcomes is called the sample space and their probabilities sum to 1 See also uniform probability model
Random variable An assignment of a numerical value to each outcome in a sample space
Rational expression A quotient of two polynomials with a non-zero denominator
Rational number A number expressible in the form ab or ndash ab for some fraction ab The rational numbers include the integers
Rectilinear figure A polygon all angles of which are right angles
Rigid motion A transformation of points in space consisting of a sequence of one or more translations reflections andor rotations Rigid motions are here assumed to preserve distances and angle measures
Repeating decimal The decimal form of a rational number See also terminating decimal
Sample space In a probability model for a random process a list of the individual outcomes that are to be considered
Scatter plot A graph in the coordinate plane representing a set of bivariate data For example the heights and weights of a group of people could be displayed on a scatter plot5
Similarity transformation A rigid motion followed by a dilation
Tape diagram A drawing that looks like a segment of tape used to illustrate number relationships Also known as a strip diagram bar model fraction strip or length model
Terminating decimal A decimal is called terminating if its repeating digit is 0
Third quartile For a data set with median M the third quartile is the median of the data values greater than M Example For the data set 2 3 6 7 10 12 14 15 22 120 the third quartile is 15 See also median first quartile interquartile range
Transitivity principle for indirect measurement If the length of object A is greater than the length of object B and the length of object B is greater than the length of object C then the length of object A is greater than the length of object C This principle applies
53
Keansburg School DistrictCurriculum System
Mathematicsto measurement of other quantities as well
Uniform probability model A probability model which assigns equal probability to all outcomes See also probability model
Vector A quantity with magnitude and direction in the plane or in space defined by an ordered pair or triple of real numbers
Visual fraction model A tape diagram number line diagram or area model
Whole numbers The numbers 0 1 2 3 hellip5
54
- MissionVision Statement
- Beliefs
- Measurement amp Data
- Measure lengths and by iterating length units
- Tell and write time
- Represent and interpret data
- Geometry
- Reason with shapes and their attributes
- Number and Base Ten
- Extend the counting sequence
- Understand place value
-
- Measurement amp Data (II)
-
- Measure lengths and by iterating length units
- Tell and write time
-
- Represent and interpret data
- Geometry (II)
- Reason with shapes their attributes
-
- Number and Base Ten
- Use place value understanding and properties of operations to add and subtract
- Teacher will cover up specific numbers on an enlarged number grid using cover up tape to have students identify numbers before and after Students will come up and write the missing numbers
- Students will play ldquoI have__ Who has __ Teacher will create cards using index cards and numbers in which students need further practice with Students will read their cards aloud Variations of game can include identifying specific numbers identifying numbers more or less etc)
- Students will use base ten blocks to represent numbers including three digit numbers Students will identify representation of numbers through these manipulatives They may match the representation to the written number
- Students will write the number they created using the base ten blocks using their white boards and markers
- Students will arrange given digits to create the greatest and lowest possible numbers They can show each number they create using base ten blocks
- Students will use the Base Ten Exchange Game to show an understanding of exchanging ones for tens and tens for hundreds Students can use place value mats base ten blocks (cubes tens and flats) Students can take number of cubes displayed with roll of single die Students will determine when exchanging can be made when reaching ten units
- Base ten concentration wwwk-5mathteachingresourcescom
- Ten frame compare wwwk-5mathteachingresourcescom
-
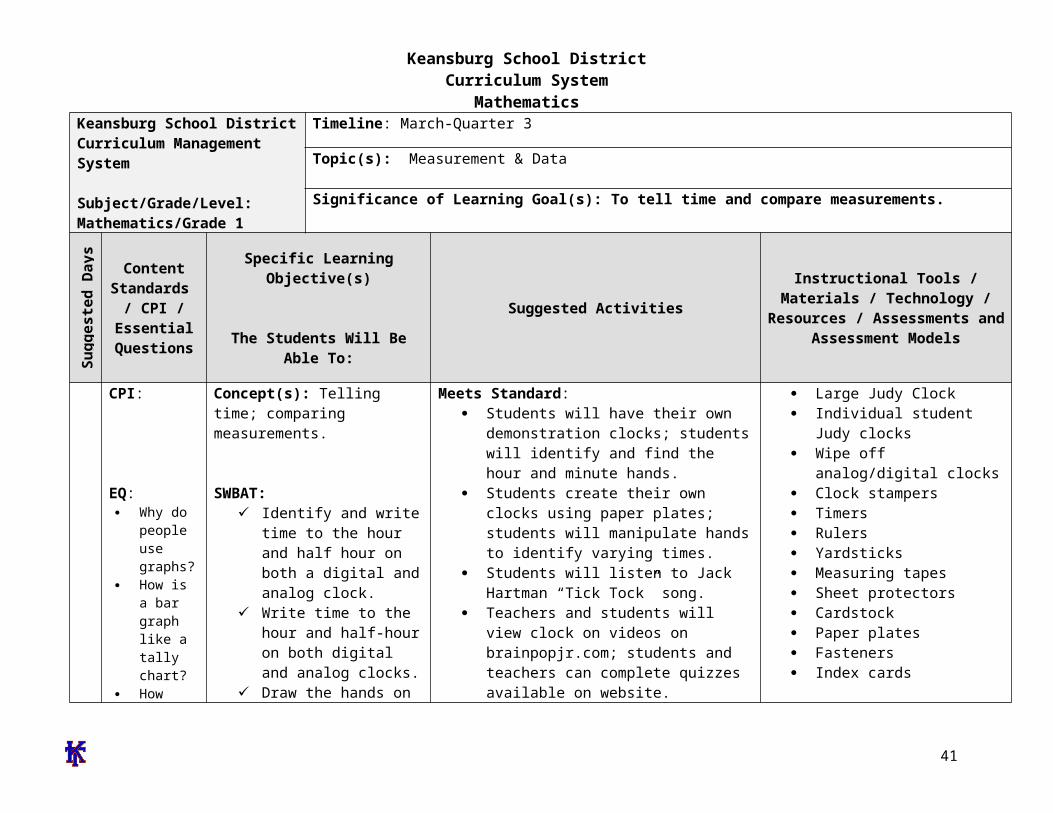
Keansburg School DistrictCurriculum System
MathematicsCPI 1NBT4 1NBT5 1NBT6
EQ How do
numbers help us
How can sets of numbers be counted compared and ordered
How can I use numbers to solve problems
How would putting numbers on a chart make it easier to understand information
How can I make it easier to understand numbers when I sort them
What is place value
Why is place value important
How can I
Concept(s) Use place value and properties of operations to add and subtract
SWBAT Use mental math to find
10 more or ten less than a given two-digit number and explain reasoning used within any number to 120
Use place value to add within 100 add a two-digit number to a one-digit number and add a two-digit number to a multiple of ten
Understand when adding two-digit numbers that ones add to the ones and tens add to the tens and sometimes it is necessary to compose a ten by regrouping
For all above objects students will use concrete models and strategies based on place value and relate the strategy to a written method and explain the reasoning used
Subtract multiples of 10 in the range 10-90 from multiples of 10 in the range 10-90 using
Meets Standard
Comparing two digit numbers wwwk-5mathteachingresourcescom
Subtraction split wwwk-5mathteachingresourcescom
Ten more wwwk-5mathteachingresourcescom
Addition split wwwk-5mathteachingresourcescom
Exceeds Standard
Comparing 3-Digit numbers wwwk-5mathteachingresourcescom
What number is wwwk-5mathteachingresourcescom
Students develop addition and subtraction number stories and have partners solve
Create pictures using basendash10 blocks Students trace picture onto paper label the base ten blocks with their value and add total
Solve number grid puzzles by adding and subtraction 10 on the number grid
Number cards Base 10 blocks Counters Number grid puzzles Sleeve protectors wwwk-
5mathteachingresourcescom
Dice
Typical Assessment Question(s) or Task(s)
Recognize numbers 1-120 using flashcards
Write numbers 1-20 using block or graph paper
Build two-digit numbers using tens and ones blocks
Listen and note students skip counting orally by tens to 120
Students compare and label two numbers using relation symbols
41
Keansburg School DistrictCurriculum System
Mathematics
42
Keansburg School DistrictCurriculum System
MathematicsKeansburg School DistrictCurriculum Management System
SubjectGradeLevelMathematicsGrade 1
Timeline June-Quarter 4
Topic(s) Readiness skills for September of Grade 2
Significance of Learning Goal(s) To compare larger numbers add fluently and apply measurement skills
Sugg
este
d D
ays
of
Inst
ruct
ion Content
Standards CPI Essential Questions
Specific Learning Objective(s)
The Students Will Be Able ToSuggested Activities
Instructional Tools Materials Technology Resources
Assessments and Assessment Models
CPI
EQ How can I use
place value to compare and
order numbers in the 100s
How can mastering basic addition and subtraction facts help me compute larger numbers
How can I tie in
Concept(s)Use place value to compare larger numbers fluently add up to 20 apply measurement skills
SWBAT Extend place value into
the hundreds place and re-write and construct models beyond the hundreds
Fluently add and subtract within 20 using mental strategies
Apply measurement skills
Meets Standard Place Value barrier game httpwwwk-
5mathteachingresourcescommath-gameshtml (place value only)
High card
httpwwwlearningboxcomBase10 BaseTenhtml
Time barrier game httpwwwk-5mathteachingresourcescomsupport-filestimebarriergamepdf httpwwwk-5mathteachingresourcescomsupport-filestimebarriergamegridpdf
My favorite time of day writing activity
number cards base ten blocks rulers tape measurer string number relationship mat paper plates cotton balls judy clock digital clock
Typical Assessment Question(s) or Task(s)
Students will solve addition and subtraction problems within 20 in a given time
43
Keansburg School DistrictCurriculum System
Mathematicsmeasurement skills with real life experiences
httpwwwk-5mathteachingresourcescomsupport-filesmy-favorite-time-of-daypdf
Estimating length httpwwwk-5mathteachingresourcescomsupport-filesestimatinglengthpdf
Olympic golf plastic golf clubs cotton balls and tape measurer
Olympic smiles measuring smiles with string and rulers
Olympic Frisbee using paper plates and tape measurer
Olympic airplane students will make paper airplanes measure the distance that they can throw their airplane
Doubles plus 1 game httpwwwk-5mathteachingresourcescomsupport-filesdoubles-plus-onepdf
Eleven more httpwwwk-5mathteachingresourcescomsupport-fileselevenmorepdf
frame Students will be asked to
measure items using inches and centimeters
Identify and create numbers with place values extending into the hundreds place
44
Keansburg School DistrictCurriculum System
Mathematics
Building numbers with base ten blocks pick three cards and arrange them to show a 3-digit number build that number with base ten blocks repeat with the same three cards until no new numbers can be made
Length strength inches httpwwwharcourtschoolcomactivitylength_strength1_inches
Length strength centimeters httpwwwharcourtschoolcomactivitylength_strength1_centi
Exceeds Standard
Number relationship mat wwwk-5mathteachingresourcescom
Place value barrier game httpwwwk-5mathteachingresourcescommath-gameshtml (integrate other skills into place values for example the digit in my 10s place is four doubled)
Measuring the mousersquos path httpwwwk-5mathteachingresourcescomsupport-filespaths1pdf
45
Keansburg School DistrictCurriculum System
Mathematics
Double minus 1 game httpwwwk-5mathteachingresourcescomsupport-filesdoubles-minus-onepdf
Number relationship mat httpwwwk-5mathteachingresourcescomsupport-filesnumberrelationshipmatpdf
46
Keansburg School DistrictCurriculum System
Mathematicsignment Matrices of Common Core State Standards
Grade Strand Standard Standard
Sept
embe
r ndash
Oct
ober
Nov
embe
r ndash
Dec
embe
r
Janu
ary
ndash Fe
brua
ry
Mar
ch ndash
Apr
il
May
- Ju
ne
1 OA 1
CC1OA1 Represent and solve problems involving addition and subtraction Use addition and subtraction within 20 to solve word problems involving situations of adding to taking from putting together taking apart and comparing with unknowns in all positions eg by using objects drawings and equations with a symbol for the unknown number to represent the problem
1 OA 2
CC1OA2 Represent and solve problems involving addition and subtraction Solve word problems that call for addition of three whole numbers whose sum is less than or equal to 20 eg by using objects drawings and equations with a symbol for the unknown number to represent the problem
1 OA 3
CC1OA3 Understand and apply properties of operations and the relationship between addition and subtraction Apply properties of operations as strategies to add and subtract Examples If 8 + 3 = 11 is known then 3 + 8 = 11 is also known (Commutative property of addition) To add 2 + 6 + 4 the second two numbers can be added to make a ten so 2 + 6 + 4 = 2 + 10 = 12 (Associative property of addition) (Students need not use formal terms for these properties)
1 OA 4
CC1OA4 Understand and apply properties of operations and the relationship between addition and subtraction Understand subtraction as an unknown-addend problem For example subtract 10 ndash 8 by finding the number that makes 10 when added to 8
1 OA 5 CC1OA5 Add and subtract within 20 Relate counting to addition and subtraction (eg by counting on 2 to add 2)
1 OA 6 CC1OA6 Add and subtract within 20 Add and subtract within 20 demonstrating fluency for addition and subtraction within 10 Use strategies such as counting on making ten (eg 8 + 6 = 8 + 2 + 4 = 10 + 4 = 14) decomposing a number leading to a ten (eg 13 ndash 4 = 13 ndash 3 ndash 1 = 10 ndash 1 = 9) using the relationship between addition and subtraction (eg knowing that 8 + 4
47
Keansburg School DistrictCurriculum System
Mathematics= 12 one knows 12 ndash 8 = 4) and creating equivalent but easier or known sums (eg adding 6 + 7 by creating the known equivalent 6 + 6 + 1 = 12 + 1 = 13)
1 OA 7
CC1OA7 Work with addition and subtraction equations Understand the meaning of the equal sign and determine if equations involving addition and subtraction are true or false For example which of the following equations are true and which are false 6 = 6 7 = 8 ndash 1 5 + 2 = 2 + 5 4 + 1 = 5 + 2
1 OA 8
CC1OA8 Work with addition and subtraction equations Determine the unknown whole number in an addition or subtraction equation relating three whole numbers For example determine the unknown number that makes the equation true in each of the equations 8 + = 11 5 = _ ndash 3 6 + 6 = _
1 NBT 1
CC1NBT1 Extend the counting sequence Count to 120 starting at any number less than 120 In this range read and write numerals and represent a number of objects with a written numeral
1 NBT 2
CC1NBT2 Understand place value Understand that the two digits of a two-digit number represent amounts of tens and ones Understand the following as special cases -- a 10 can be thought of as a bundle of ten ones mdash called a ldquotenrdquo -- b The numbers from 11 to 19 are composed of a ten and one two three four five six seven eight or nine ones -- c The numbers 10 20 30 40 50 60 70 80 90 refer to one two three four five six seven eight or nine tens (and 0 ones)
1 NBT 3
CC1NBT3 Understand place value Compare two two-digit numbers based on meanings of the tens and ones digits recording the results of comparisons with the symbols gt = and lt
1 NBT 4
CC1NBT4 Use place value understanding and properties of operations to add and subtract Add within 100 including adding a two-digit number and a one-digit number and adding a two-digit number and a multiple of 10 using concrete models or drawings and strategies based on place value properties of operations andor the relationship between addition and subtraction relate the strategy to a written method and explain the reasoning used Understand that in adding two-digit numbers one adds tens and tens ones and ones and sometimes it is necessary to compose a ten
1 NBT 5
CC1NBT5 Use place value understanding and properties of operations to add and subtract Given a two-digit number mentally find 10 more or 10 less than the number without having to count explain the reasoning used
1 NBT 6 CC1NBT6 Use place value understanding and properties of operations to add and subtract Subtract multiples of 10 in the range 10-90 from multiples of 10 in the range 10-90 (positive or zero differences) using concrete models or drawings and strategies based on place value properties of operations andor
48
Keansburg School DistrictCurriculum System
Mathematicsthe relationship between addition and subtraction relate the strategy to a written method and explain the reasoning used
1 MD 1
CC1MD1 Measure lengths indirectly and by iterating length units Order three objects by length compare the lengths of two objects indirectly by using a third object
1 MD 2
CC1MD2 Measure lengths indirectly and by iterating length units Express the length of an object as a whole number of length units by laying multiple copies of a shorter object (the length unit) end to end understand that the length measurement of an object is the number of same-size length units that span it with no gaps or overlaps Limit to contexts where the object being measured is spanned by a whole number of length units with no gaps or overlaps
1 MD 3CC1MD3 Tell and write time Tell and write time in hours and half-hours using analog and digital clocks
1 MD 4
CC1MD4 Represent and interpret data Organize represent and interpret data with up to three categories ask and answer questions about the total number of data points how many in each category and how many more or less are in one category than in another
1 G 1
CC1G1 Reason with shapes and their attributes Distinguish between defining attributes (eg triangles are closed and three-sided) versus non-defining attributes (eg color orientation overall size) for a wide variety of shapes build and draw shapes to possess defining attributes
1 G 2
CC1G2 Reason with shapes and their attributes Compose two-dimensional shapes (rectangles squares trapezoids triangles half-circles and quarter-circles) or three-dimensional shapes (cubes right rectangular prisms right circular cones and right circular cylinders) to create a composite shape and compose new shapes from the composite shape (Students do not need to learn formal names such as ldquoright rectangular prismrdquo)
1 G 3
CC1G3 Reason with shapes and their attributes Partition circles and rectangles into two and four equal shares describe the shares using the words halves fourths and quarters and use the phrases half of fourth of and quarter of Describe the whole as two of or four of the shares Understand for these examples that decomposing into more equal shares creates smaller shares
49
Keansburg School DistrictCurriculum System
Mathematics
Common Core State Standards Vocabulary
Addition and subtraction within 5 10 20 100 or 1000 Addition or subtraction of two whole numbers with whole number answers and with sum or minuend in the range 0-5 0-10 0-20 or 0-100 respectively Example 8 + 2 = 10 is an addition within 10 14 ndash 5 = 9 is a subtraction within 20 and 55 ndash 18 = 37 is a subtraction within 100
Additive inverses Two numbers whose sum is 0 are additive inverses of one another Example 34 and ndash 34 are additive inverses of one another because 34 + (ndash 34) = (ndash 34) + 34 = 0
Associative property of addition See Table 3 in this Glossary
Associative property of multiplication See Table 3 in this Glossary
Bivariate data Pairs of linked numerical observations Example a list of heights and weights for each player on a football team
Box plot A method of visually displaying a distribution of data values by using the median quartiles and extremes of the data set A box shows the middle 50 of the data1
Commutative property See Table 3 in this Glossary
Complex fraction A fraction AB where A andor B are fractions (B nonzero)
Computation algorithm A set of predefined steps applicable to a class of problems that gives the correct result in every case when the steps are carried out correctly See also computation strategy
Computation strategy Purposeful manipulations that may be chosen for specific problems may not have a fixed order and may be aimed at converting one problem into another See also computation algorithm
Congruent Two plane or solid figures are congruent if one can be obtained from the other by rigid motion (a sequence of rotations reflections and translations)
Counting on A strategy for finding the number of objects in a group without having to count every member of the group For example if a stack of books is known to have 8 books and 3 more books are added to the top it is not necessary to count the stack
50
Keansburg School DistrictCurriculum System
Mathematicsall over again One can find the total by counting onmdashpointing to the top book and saying ldquoeightrdquo following this with ldquonine ten eleven There are eleven books nowrdquo
Dot plot See line plot
Dilation A transformation that moves each point along the ray through the point emanating from a fixed center and multiplies distances from the center by a common scale factor
Expanded form A multi-digit number is expressed in expanded form when it is written as a sum of single-digit multiples of powers of ten For example 643 = 600 + 40 + 3
Expected value For a random variable the weighted average of its possible values with weights given by their respective probabilities
First quartile For a data set with median M the first quartile is the median of the data values less than M Example For the data set 1 3 6 7 10 12 14 15 22 120 the first quartile is 62 See also median third quartile interquartile range
Fraction A number expressible in the form ab where a is a whole number and b is a positive whole number (The word fraction in these standards always refers to a non-negative number) See also rational number
Identity property of 0 See Table 3 in this Glossary
Independently combined probability models Two probability models are said to be combined independently if the probability of each ordered pair in the combined model equals the product of the original probabilities of the two individual outcomes in the ordered pair
Integer A number expressible in the form a or ndasha for some whole number a
Interquartile Range A measure of variation in a set of numerical data the interquartile range is the distance between the first and third quartiles of the data set Example For the data set 1 3 6 7 10 12 14 15 22 120 the interquartile range is 15 ndash 6 = 9 See also first quartile third quartile
Line plot A method of visually displaying a distribution of data values where each data value is shown as a dot or mark above a number line Also known as a dot plot3
51
Keansburg School DistrictCurriculum System
MathematicsMean A measure of center in a set of numerical data computed by adding the values in a list and then dividing by the number of values in the list4 Example For the data set 1 3 6 7 10 12 14 15 22 120 the mean is 21
Mean absolute deviation A measure of variation in a set of numerical data computed by adding the distances between each data value and the mean then dividing by the number of data values Example For the data set 2 3 6 7 10 12 14 15 22 120 the mean absolute deviation is 20
Median A measure of center in a set of numerical data The median of a list of values is the value appearing at the center of a sorted version of the listmdashor the mean of the two central values if the list contains an even number of values Example For the data set 2 3 6 7 10 12 14 15 22 90 the median is 11
Midline In the graph of a trigonometric function the horizontal line halfway between its maximum and minimum values
Multiplication and division within 100 Multiplication or division of two whole numbers with whole number answers and with product or dividend in the range 0-100 Example 72 divide 8 = 9
Multiplicative inverses Two numbers whose product is 1 are multiplicative inverses of one another Example 34 and 43 are multiplicative inverses of one another because 34 times 43 = 43 times 34 = 1
Number line diagram A diagram of the number line used to represent numbers and support reasoning about them In a number line diagram for measurement quantities the interval from 0 to 1 on the diagram represents the unit of measure for the quantity
Percent rate of change A rate of change expressed as a percent Example if a population grows from 50 to 55 in a year it grows by 550 = 10 per year
Probability distribution The set of possible values of a random variable with a probability assigned to each
Properties of operations See Table 3 in this Glossary
Properties of equality See Table 4 in this Glossary
Properties of inequality See Table 5 in this Glossary
Properties of operations See Table 3 in this Glossary
52
Keansburg School DistrictCurriculum System
MathematicsProbability A number between 0 and 1 used to quantify likelihood for processes that have uncertain outcomes (such as tossing a coin selecting a person at random from a group of people tossing a ball at a target or testing for a medical condition)
Probability model A probability model is used to assign probabilities to outcomes of a chance process by examining the nature of the process The set of all outcomes is called the sample space and their probabilities sum to 1 See also uniform probability model
Random variable An assignment of a numerical value to each outcome in a sample space
Rational expression A quotient of two polynomials with a non-zero denominator
Rational number A number expressible in the form ab or ndash ab for some fraction ab The rational numbers include the integers
Rectilinear figure A polygon all angles of which are right angles
Rigid motion A transformation of points in space consisting of a sequence of one or more translations reflections andor rotations Rigid motions are here assumed to preserve distances and angle measures
Repeating decimal The decimal form of a rational number See also terminating decimal
Sample space In a probability model for a random process a list of the individual outcomes that are to be considered
Scatter plot A graph in the coordinate plane representing a set of bivariate data For example the heights and weights of a group of people could be displayed on a scatter plot5
Similarity transformation A rigid motion followed by a dilation
Tape diagram A drawing that looks like a segment of tape used to illustrate number relationships Also known as a strip diagram bar model fraction strip or length model
Terminating decimal A decimal is called terminating if its repeating digit is 0
Third quartile For a data set with median M the third quartile is the median of the data values greater than M Example For the data set 2 3 6 7 10 12 14 15 22 120 the third quartile is 15 See also median first quartile interquartile range
Transitivity principle for indirect measurement If the length of object A is greater than the length of object B and the length of object B is greater than the length of object C then the length of object A is greater than the length of object C This principle applies
53
Keansburg School DistrictCurriculum System
Mathematicsto measurement of other quantities as well
Uniform probability model A probability model which assigns equal probability to all outcomes See also probability model
Vector A quantity with magnitude and direction in the plane or in space defined by an ordered pair or triple of real numbers
Visual fraction model A tape diagram number line diagram or area model
Whole numbers The numbers 0 1 2 3 hellip5
54
- MissionVision Statement
- Beliefs
- Measurement amp Data
- Measure lengths and by iterating length units
- Tell and write time
- Represent and interpret data
- Geometry
- Reason with shapes and their attributes
- Number and Base Ten
- Extend the counting sequence
- Understand place value
-
- Measurement amp Data (II)
-
- Measure lengths and by iterating length units
- Tell and write time
-
- Represent and interpret data
- Geometry (II)
- Reason with shapes their attributes
-
- Number and Base Ten
- Use place value understanding and properties of operations to add and subtract
- Teacher will cover up specific numbers on an enlarged number grid using cover up tape to have students identify numbers before and after Students will come up and write the missing numbers
- Students will play ldquoI have__ Who has __ Teacher will create cards using index cards and numbers in which students need further practice with Students will read their cards aloud Variations of game can include identifying specific numbers identifying numbers more or less etc)
- Students will use base ten blocks to represent numbers including three digit numbers Students will identify representation of numbers through these manipulatives They may match the representation to the written number
- Students will write the number they created using the base ten blocks using their white boards and markers
- Students will arrange given digits to create the greatest and lowest possible numbers They can show each number they create using base ten blocks
- Students will use the Base Ten Exchange Game to show an understanding of exchanging ones for tens and tens for hundreds Students can use place value mats base ten blocks (cubes tens and flats) Students can take number of cubes displayed with roll of single die Students will determine when exchanging can be made when reaching ten units
- Base ten concentration wwwk-5mathteachingresourcescom
- Ten frame compare wwwk-5mathteachingresourcescom
-
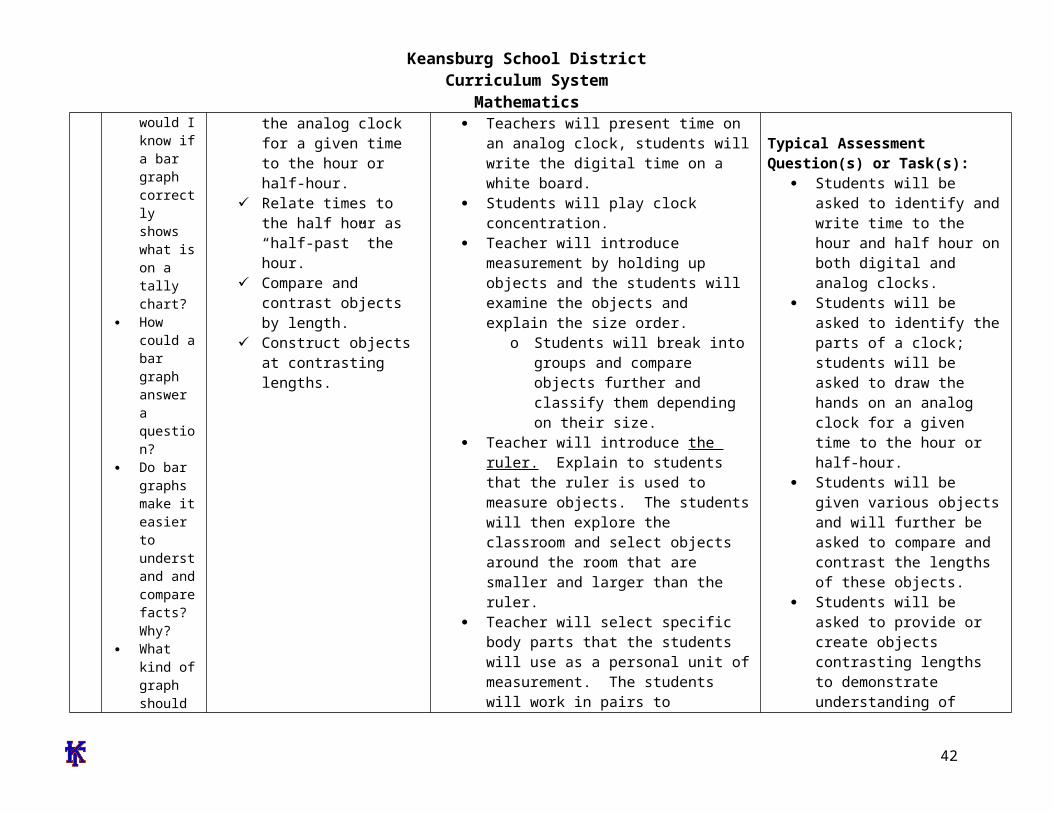
Keansburg School DistrictCurriculum System
Mathematics
42
Keansburg School DistrictCurriculum System
MathematicsKeansburg School DistrictCurriculum Management System
SubjectGradeLevelMathematicsGrade 1
Timeline June-Quarter 4
Topic(s) Readiness skills for September of Grade 2
Significance of Learning Goal(s) To compare larger numbers add fluently and apply measurement skills
Sugg
este
d D
ays
of
Inst
ruct
ion Content
Standards CPI Essential Questions
Specific Learning Objective(s)
The Students Will Be Able ToSuggested Activities
Instructional Tools Materials Technology Resources
Assessments and Assessment Models
CPI
EQ How can I use
place value to compare and
order numbers in the 100s
How can mastering basic addition and subtraction facts help me compute larger numbers
How can I tie in
Concept(s)Use place value to compare larger numbers fluently add up to 20 apply measurement skills
SWBAT Extend place value into
the hundreds place and re-write and construct models beyond the hundreds
Fluently add and subtract within 20 using mental strategies
Apply measurement skills
Meets Standard Place Value barrier game httpwwwk-
5mathteachingresourcescommath-gameshtml (place value only)
High card
httpwwwlearningboxcomBase10 BaseTenhtml
Time barrier game httpwwwk-5mathteachingresourcescomsupport-filestimebarriergamepdf httpwwwk-5mathteachingresourcescomsupport-filestimebarriergamegridpdf
My favorite time of day writing activity
number cards base ten blocks rulers tape measurer string number relationship mat paper plates cotton balls judy clock digital clock
Typical Assessment Question(s) or Task(s)
Students will solve addition and subtraction problems within 20 in a given time
43
Keansburg School DistrictCurriculum System
Mathematicsmeasurement skills with real life experiences
httpwwwk-5mathteachingresourcescomsupport-filesmy-favorite-time-of-daypdf
Estimating length httpwwwk-5mathteachingresourcescomsupport-filesestimatinglengthpdf
Olympic golf plastic golf clubs cotton balls and tape measurer
Olympic smiles measuring smiles with string and rulers
Olympic Frisbee using paper plates and tape measurer
Olympic airplane students will make paper airplanes measure the distance that they can throw their airplane
Doubles plus 1 game httpwwwk-5mathteachingresourcescomsupport-filesdoubles-plus-onepdf
Eleven more httpwwwk-5mathteachingresourcescomsupport-fileselevenmorepdf
frame Students will be asked to
measure items using inches and centimeters
Identify and create numbers with place values extending into the hundreds place
44
Keansburg School DistrictCurriculum System
Mathematics
Building numbers with base ten blocks pick three cards and arrange them to show a 3-digit number build that number with base ten blocks repeat with the same three cards until no new numbers can be made
Length strength inches httpwwwharcourtschoolcomactivitylength_strength1_inches
Length strength centimeters httpwwwharcourtschoolcomactivitylength_strength1_centi
Exceeds Standard
Number relationship mat wwwk-5mathteachingresourcescom
Place value barrier game httpwwwk-5mathteachingresourcescommath-gameshtml (integrate other skills into place values for example the digit in my 10s place is four doubled)
Measuring the mousersquos path httpwwwk-5mathteachingresourcescomsupport-filespaths1pdf
45
Keansburg School DistrictCurriculum System
Mathematics
Double minus 1 game httpwwwk-5mathteachingresourcescomsupport-filesdoubles-minus-onepdf
Number relationship mat httpwwwk-5mathteachingresourcescomsupport-filesnumberrelationshipmatpdf
46
Keansburg School DistrictCurriculum System
Mathematicsignment Matrices of Common Core State Standards
Grade Strand Standard Standard
Sept
embe
r ndash
Oct
ober
Nov
embe
r ndash
Dec
embe
r
Janu
ary
ndash Fe
brua
ry
Mar
ch ndash
Apr
il
May
- Ju
ne
1 OA 1
CC1OA1 Represent and solve problems involving addition and subtraction Use addition and subtraction within 20 to solve word problems involving situations of adding to taking from putting together taking apart and comparing with unknowns in all positions eg by using objects drawings and equations with a symbol for the unknown number to represent the problem
1 OA 2
CC1OA2 Represent and solve problems involving addition and subtraction Solve word problems that call for addition of three whole numbers whose sum is less than or equal to 20 eg by using objects drawings and equations with a symbol for the unknown number to represent the problem
1 OA 3
CC1OA3 Understand and apply properties of operations and the relationship between addition and subtraction Apply properties of operations as strategies to add and subtract Examples If 8 + 3 = 11 is known then 3 + 8 = 11 is also known (Commutative property of addition) To add 2 + 6 + 4 the second two numbers can be added to make a ten so 2 + 6 + 4 = 2 + 10 = 12 (Associative property of addition) (Students need not use formal terms for these properties)
1 OA 4
CC1OA4 Understand and apply properties of operations and the relationship between addition and subtraction Understand subtraction as an unknown-addend problem For example subtract 10 ndash 8 by finding the number that makes 10 when added to 8
1 OA 5 CC1OA5 Add and subtract within 20 Relate counting to addition and subtraction (eg by counting on 2 to add 2)
1 OA 6 CC1OA6 Add and subtract within 20 Add and subtract within 20 demonstrating fluency for addition and subtraction within 10 Use strategies such as counting on making ten (eg 8 + 6 = 8 + 2 + 4 = 10 + 4 = 14) decomposing a number leading to a ten (eg 13 ndash 4 = 13 ndash 3 ndash 1 = 10 ndash 1 = 9) using the relationship between addition and subtraction (eg knowing that 8 + 4
47
Keansburg School DistrictCurriculum System
Mathematics= 12 one knows 12 ndash 8 = 4) and creating equivalent but easier or known sums (eg adding 6 + 7 by creating the known equivalent 6 + 6 + 1 = 12 + 1 = 13)
1 OA 7
CC1OA7 Work with addition and subtraction equations Understand the meaning of the equal sign and determine if equations involving addition and subtraction are true or false For example which of the following equations are true and which are false 6 = 6 7 = 8 ndash 1 5 + 2 = 2 + 5 4 + 1 = 5 + 2
1 OA 8
CC1OA8 Work with addition and subtraction equations Determine the unknown whole number in an addition or subtraction equation relating three whole numbers For example determine the unknown number that makes the equation true in each of the equations 8 + = 11 5 = _ ndash 3 6 + 6 = _
1 NBT 1
CC1NBT1 Extend the counting sequence Count to 120 starting at any number less than 120 In this range read and write numerals and represent a number of objects with a written numeral
1 NBT 2
CC1NBT2 Understand place value Understand that the two digits of a two-digit number represent amounts of tens and ones Understand the following as special cases -- a 10 can be thought of as a bundle of ten ones mdash called a ldquotenrdquo -- b The numbers from 11 to 19 are composed of a ten and one two three four five six seven eight or nine ones -- c The numbers 10 20 30 40 50 60 70 80 90 refer to one two three four five six seven eight or nine tens (and 0 ones)
1 NBT 3
CC1NBT3 Understand place value Compare two two-digit numbers based on meanings of the tens and ones digits recording the results of comparisons with the symbols gt = and lt
1 NBT 4
CC1NBT4 Use place value understanding and properties of operations to add and subtract Add within 100 including adding a two-digit number and a one-digit number and adding a two-digit number and a multiple of 10 using concrete models or drawings and strategies based on place value properties of operations andor the relationship between addition and subtraction relate the strategy to a written method and explain the reasoning used Understand that in adding two-digit numbers one adds tens and tens ones and ones and sometimes it is necessary to compose a ten
1 NBT 5
CC1NBT5 Use place value understanding and properties of operations to add and subtract Given a two-digit number mentally find 10 more or 10 less than the number without having to count explain the reasoning used
1 NBT 6 CC1NBT6 Use place value understanding and properties of operations to add and subtract Subtract multiples of 10 in the range 10-90 from multiples of 10 in the range 10-90 (positive or zero differences) using concrete models or drawings and strategies based on place value properties of operations andor
48
Keansburg School DistrictCurriculum System
Mathematicsthe relationship between addition and subtraction relate the strategy to a written method and explain the reasoning used
1 MD 1
CC1MD1 Measure lengths indirectly and by iterating length units Order three objects by length compare the lengths of two objects indirectly by using a third object
1 MD 2
CC1MD2 Measure lengths indirectly and by iterating length units Express the length of an object as a whole number of length units by laying multiple copies of a shorter object (the length unit) end to end understand that the length measurement of an object is the number of same-size length units that span it with no gaps or overlaps Limit to contexts where the object being measured is spanned by a whole number of length units with no gaps or overlaps
1 MD 3CC1MD3 Tell and write time Tell and write time in hours and half-hours using analog and digital clocks
1 MD 4
CC1MD4 Represent and interpret data Organize represent and interpret data with up to three categories ask and answer questions about the total number of data points how many in each category and how many more or less are in one category than in another
1 G 1
CC1G1 Reason with shapes and their attributes Distinguish between defining attributes (eg triangles are closed and three-sided) versus non-defining attributes (eg color orientation overall size) for a wide variety of shapes build and draw shapes to possess defining attributes
1 G 2
CC1G2 Reason with shapes and their attributes Compose two-dimensional shapes (rectangles squares trapezoids triangles half-circles and quarter-circles) or three-dimensional shapes (cubes right rectangular prisms right circular cones and right circular cylinders) to create a composite shape and compose new shapes from the composite shape (Students do not need to learn formal names such as ldquoright rectangular prismrdquo)
1 G 3
CC1G3 Reason with shapes and their attributes Partition circles and rectangles into two and four equal shares describe the shares using the words halves fourths and quarters and use the phrases half of fourth of and quarter of Describe the whole as two of or four of the shares Understand for these examples that decomposing into more equal shares creates smaller shares
49
Keansburg School DistrictCurriculum System
Mathematics
Common Core State Standards Vocabulary
Addition and subtraction within 5 10 20 100 or 1000 Addition or subtraction of two whole numbers with whole number answers and with sum or minuend in the range 0-5 0-10 0-20 or 0-100 respectively Example 8 + 2 = 10 is an addition within 10 14 ndash 5 = 9 is a subtraction within 20 and 55 ndash 18 = 37 is a subtraction within 100
Additive inverses Two numbers whose sum is 0 are additive inverses of one another Example 34 and ndash 34 are additive inverses of one another because 34 + (ndash 34) = (ndash 34) + 34 = 0
Associative property of addition See Table 3 in this Glossary
Associative property of multiplication See Table 3 in this Glossary
Bivariate data Pairs of linked numerical observations Example a list of heights and weights for each player on a football team
Box plot A method of visually displaying a distribution of data values by using the median quartiles and extremes of the data set A box shows the middle 50 of the data1
Commutative property See Table 3 in this Glossary
Complex fraction A fraction AB where A andor B are fractions (B nonzero)
Computation algorithm A set of predefined steps applicable to a class of problems that gives the correct result in every case when the steps are carried out correctly See also computation strategy
Computation strategy Purposeful manipulations that may be chosen for specific problems may not have a fixed order and may be aimed at converting one problem into another See also computation algorithm
Congruent Two plane or solid figures are congruent if one can be obtained from the other by rigid motion (a sequence of rotations reflections and translations)
Counting on A strategy for finding the number of objects in a group without having to count every member of the group For example if a stack of books is known to have 8 books and 3 more books are added to the top it is not necessary to count the stack
50
Keansburg School DistrictCurriculum System
Mathematicsall over again One can find the total by counting onmdashpointing to the top book and saying ldquoeightrdquo following this with ldquonine ten eleven There are eleven books nowrdquo
Dot plot See line plot
Dilation A transformation that moves each point along the ray through the point emanating from a fixed center and multiplies distances from the center by a common scale factor
Expanded form A multi-digit number is expressed in expanded form when it is written as a sum of single-digit multiples of powers of ten For example 643 = 600 + 40 + 3
Expected value For a random variable the weighted average of its possible values with weights given by their respective probabilities
First quartile For a data set with median M the first quartile is the median of the data values less than M Example For the data set 1 3 6 7 10 12 14 15 22 120 the first quartile is 62 See also median third quartile interquartile range
Fraction A number expressible in the form ab where a is a whole number and b is a positive whole number (The word fraction in these standards always refers to a non-negative number) See also rational number
Identity property of 0 See Table 3 in this Glossary
Independently combined probability models Two probability models are said to be combined independently if the probability of each ordered pair in the combined model equals the product of the original probabilities of the two individual outcomes in the ordered pair
Integer A number expressible in the form a or ndasha for some whole number a
Interquartile Range A measure of variation in a set of numerical data the interquartile range is the distance between the first and third quartiles of the data set Example For the data set 1 3 6 7 10 12 14 15 22 120 the interquartile range is 15 ndash 6 = 9 See also first quartile third quartile
Line plot A method of visually displaying a distribution of data values where each data value is shown as a dot or mark above a number line Also known as a dot plot3
51
Keansburg School DistrictCurriculum System
MathematicsMean A measure of center in a set of numerical data computed by adding the values in a list and then dividing by the number of values in the list4 Example For the data set 1 3 6 7 10 12 14 15 22 120 the mean is 21
Mean absolute deviation A measure of variation in a set of numerical data computed by adding the distances between each data value and the mean then dividing by the number of data values Example For the data set 2 3 6 7 10 12 14 15 22 120 the mean absolute deviation is 20
Median A measure of center in a set of numerical data The median of a list of values is the value appearing at the center of a sorted version of the listmdashor the mean of the two central values if the list contains an even number of values Example For the data set 2 3 6 7 10 12 14 15 22 90 the median is 11
Midline In the graph of a trigonometric function the horizontal line halfway between its maximum and minimum values
Multiplication and division within 100 Multiplication or division of two whole numbers with whole number answers and with product or dividend in the range 0-100 Example 72 divide 8 = 9
Multiplicative inverses Two numbers whose product is 1 are multiplicative inverses of one another Example 34 and 43 are multiplicative inverses of one another because 34 times 43 = 43 times 34 = 1
Number line diagram A diagram of the number line used to represent numbers and support reasoning about them In a number line diagram for measurement quantities the interval from 0 to 1 on the diagram represents the unit of measure for the quantity
Percent rate of change A rate of change expressed as a percent Example if a population grows from 50 to 55 in a year it grows by 550 = 10 per year
Probability distribution The set of possible values of a random variable with a probability assigned to each
Properties of operations See Table 3 in this Glossary
Properties of equality See Table 4 in this Glossary
Properties of inequality See Table 5 in this Glossary
Properties of operations See Table 3 in this Glossary
52
Keansburg School DistrictCurriculum System
MathematicsProbability A number between 0 and 1 used to quantify likelihood for processes that have uncertain outcomes (such as tossing a coin selecting a person at random from a group of people tossing a ball at a target or testing for a medical condition)
Probability model A probability model is used to assign probabilities to outcomes of a chance process by examining the nature of the process The set of all outcomes is called the sample space and their probabilities sum to 1 See also uniform probability model
Random variable An assignment of a numerical value to each outcome in a sample space
Rational expression A quotient of two polynomials with a non-zero denominator
Rational number A number expressible in the form ab or ndash ab for some fraction ab The rational numbers include the integers
Rectilinear figure A polygon all angles of which are right angles
Rigid motion A transformation of points in space consisting of a sequence of one or more translations reflections andor rotations Rigid motions are here assumed to preserve distances and angle measures
Repeating decimal The decimal form of a rational number See also terminating decimal
Sample space In a probability model for a random process a list of the individual outcomes that are to be considered
Scatter plot A graph in the coordinate plane representing a set of bivariate data For example the heights and weights of a group of people could be displayed on a scatter plot5
Similarity transformation A rigid motion followed by a dilation
Tape diagram A drawing that looks like a segment of tape used to illustrate number relationships Also known as a strip diagram bar model fraction strip or length model
Terminating decimal A decimal is called terminating if its repeating digit is 0
Third quartile For a data set with median M the third quartile is the median of the data values greater than M Example For the data set 2 3 6 7 10 12 14 15 22 120 the third quartile is 15 See also median first quartile interquartile range
Transitivity principle for indirect measurement If the length of object A is greater than the length of object B and the length of object B is greater than the length of object C then the length of object A is greater than the length of object C This principle applies
53
Keansburg School DistrictCurriculum System
Mathematicsto measurement of other quantities as well
Uniform probability model A probability model which assigns equal probability to all outcomes See also probability model
Vector A quantity with magnitude and direction in the plane or in space defined by an ordered pair or triple of real numbers
Visual fraction model A tape diagram number line diagram or area model
Whole numbers The numbers 0 1 2 3 hellip5
54
- MissionVision Statement
- Beliefs
- Measurement amp Data
- Measure lengths and by iterating length units
- Tell and write time
- Represent and interpret data
- Geometry
- Reason with shapes and their attributes
- Number and Base Ten
- Extend the counting sequence
- Understand place value
-
- Measurement amp Data (II)
-
- Measure lengths and by iterating length units
- Tell and write time
-
- Represent and interpret data
- Geometry (II)
- Reason with shapes their attributes
-
- Number and Base Ten
- Use place value understanding and properties of operations to add and subtract
- Teacher will cover up specific numbers on an enlarged number grid using cover up tape to have students identify numbers before and after Students will come up and write the missing numbers
- Students will play ldquoI have__ Who has __ Teacher will create cards using index cards and numbers in which students need further practice with Students will read their cards aloud Variations of game can include identifying specific numbers identifying numbers more or less etc)
- Students will use base ten blocks to represent numbers including three digit numbers Students will identify representation of numbers through these manipulatives They may match the representation to the written number
- Students will write the number they created using the base ten blocks using their white boards and markers
- Students will arrange given digits to create the greatest and lowest possible numbers They can show each number they create using base ten blocks
- Students will use the Base Ten Exchange Game to show an understanding of exchanging ones for tens and tens for hundreds Students can use place value mats base ten blocks (cubes tens and flats) Students can take number of cubes displayed with roll of single die Students will determine when exchanging can be made when reaching ten units
- Base ten concentration wwwk-5mathteachingresourcescom
- Ten frame compare wwwk-5mathteachingresourcescom
-
Keansburg School DistrictCurriculum System
Mathematics
Double minus 1 game httpwwwk-5mathteachingresourcescomsupport-filesdoubles-minus-onepdf
Number relationship mat httpwwwk-5mathteachingresourcescomsupport-filesnumberrelationshipmatpdf
46
Keansburg School DistrictCurriculum System
Mathematicsignment Matrices of Common Core State Standards
Grade Strand Standard Standard
Sept
embe
r ndash
Oct
ober
Nov
embe
r ndash
Dec
embe
r
Janu
ary
ndash Fe
brua
ry
Mar
ch ndash
Apr
il
May
- Ju
ne
1 OA 1
CC1OA1 Represent and solve problems involving addition and subtraction Use addition and subtraction within 20 to solve word problems involving situations of adding to taking from putting together taking apart and comparing with unknowns in all positions eg by using objects drawings and equations with a symbol for the unknown number to represent the problem
1 OA 2
CC1OA2 Represent and solve problems involving addition and subtraction Solve word problems that call for addition of three whole numbers whose sum is less than or equal to 20 eg by using objects drawings and equations with a symbol for the unknown number to represent the problem
1 OA 3
CC1OA3 Understand and apply properties of operations and the relationship between addition and subtraction Apply properties of operations as strategies to add and subtract Examples If 8 + 3 = 11 is known then 3 + 8 = 11 is also known (Commutative property of addition) To add 2 + 6 + 4 the second two numbers can be added to make a ten so 2 + 6 + 4 = 2 + 10 = 12 (Associative property of addition) (Students need not use formal terms for these properties)
1 OA 4
CC1OA4 Understand and apply properties of operations and the relationship between addition and subtraction Understand subtraction as an unknown-addend problem For example subtract 10 ndash 8 by finding the number that makes 10 when added to 8
1 OA 5 CC1OA5 Add and subtract within 20 Relate counting to addition and subtraction (eg by counting on 2 to add 2)
1 OA 6 CC1OA6 Add and subtract within 20 Add and subtract within 20 demonstrating fluency for addition and subtraction within 10 Use strategies such as counting on making ten (eg 8 + 6 = 8 + 2 + 4 = 10 + 4 = 14) decomposing a number leading to a ten (eg 13 ndash 4 = 13 ndash 3 ndash 1 = 10 ndash 1 = 9) using the relationship between addition and subtraction (eg knowing that 8 + 4
47
Keansburg School DistrictCurriculum System
Mathematics= 12 one knows 12 ndash 8 = 4) and creating equivalent but easier or known sums (eg adding 6 + 7 by creating the known equivalent 6 + 6 + 1 = 12 + 1 = 13)
1 OA 7
CC1OA7 Work with addition and subtraction equations Understand the meaning of the equal sign and determine if equations involving addition and subtraction are true or false For example which of the following equations are true and which are false 6 = 6 7 = 8 ndash 1 5 + 2 = 2 + 5 4 + 1 = 5 + 2
1 OA 8
CC1OA8 Work with addition and subtraction equations Determine the unknown whole number in an addition or subtraction equation relating three whole numbers For example determine the unknown number that makes the equation true in each of the equations 8 + = 11 5 = _ ndash 3 6 + 6 = _
1 NBT 1
CC1NBT1 Extend the counting sequence Count to 120 starting at any number less than 120 In this range read and write numerals and represent a number of objects with a written numeral
1 NBT 2
CC1NBT2 Understand place value Understand that the two digits of a two-digit number represent amounts of tens and ones Understand the following as special cases -- a 10 can be thought of as a bundle of ten ones mdash called a ldquotenrdquo -- b The numbers from 11 to 19 are composed of a ten and one two three four five six seven eight or nine ones -- c The numbers 10 20 30 40 50 60 70 80 90 refer to one two three four five six seven eight or nine tens (and 0 ones)
1 NBT 3
CC1NBT3 Understand place value Compare two two-digit numbers based on meanings of the tens and ones digits recording the results of comparisons with the symbols gt = and lt
1 NBT 4
CC1NBT4 Use place value understanding and properties of operations to add and subtract Add within 100 including adding a two-digit number and a one-digit number and adding a two-digit number and a multiple of 10 using concrete models or drawings and strategies based on place value properties of operations andor the relationship between addition and subtraction relate the strategy to a written method and explain the reasoning used Understand that in adding two-digit numbers one adds tens and tens ones and ones and sometimes it is necessary to compose a ten
1 NBT 5
CC1NBT5 Use place value understanding and properties of operations to add and subtract Given a two-digit number mentally find 10 more or 10 less than the number without having to count explain the reasoning used
1 NBT 6 CC1NBT6 Use place value understanding and properties of operations to add and subtract Subtract multiples of 10 in the range 10-90 from multiples of 10 in the range 10-90 (positive or zero differences) using concrete models or drawings and strategies based on place value properties of operations andor
48
Keansburg School DistrictCurriculum System
Mathematicsthe relationship between addition and subtraction relate the strategy to a written method and explain the reasoning used
1 MD 1
CC1MD1 Measure lengths indirectly and by iterating length units Order three objects by length compare the lengths of two objects indirectly by using a third object
1 MD 2
CC1MD2 Measure lengths indirectly and by iterating length units Express the length of an object as a whole number of length units by laying multiple copies of a shorter object (the length unit) end to end understand that the length measurement of an object is the number of same-size length units that span it with no gaps or overlaps Limit to contexts where the object being measured is spanned by a whole number of length units with no gaps or overlaps
1 MD 3CC1MD3 Tell and write time Tell and write time in hours and half-hours using analog and digital clocks
1 MD 4
CC1MD4 Represent and interpret data Organize represent and interpret data with up to three categories ask and answer questions about the total number of data points how many in each category and how many more or less are in one category than in another
1 G 1
CC1G1 Reason with shapes and their attributes Distinguish between defining attributes (eg triangles are closed and three-sided) versus non-defining attributes (eg color orientation overall size) for a wide variety of shapes build and draw shapes to possess defining attributes
1 G 2
CC1G2 Reason with shapes and their attributes Compose two-dimensional shapes (rectangles squares trapezoids triangles half-circles and quarter-circles) or three-dimensional shapes (cubes right rectangular prisms right circular cones and right circular cylinders) to create a composite shape and compose new shapes from the composite shape (Students do not need to learn formal names such as ldquoright rectangular prismrdquo)
1 G 3
CC1G3 Reason with shapes and their attributes Partition circles and rectangles into two and four equal shares describe the shares using the words halves fourths and quarters and use the phrases half of fourth of and quarter of Describe the whole as two of or four of the shares Understand for these examples that decomposing into more equal shares creates smaller shares
49
Keansburg School DistrictCurriculum System
Mathematics
Common Core State Standards Vocabulary
Addition and subtraction within 5 10 20 100 or 1000 Addition or subtraction of two whole numbers with whole number answers and with sum or minuend in the range 0-5 0-10 0-20 or 0-100 respectively Example 8 + 2 = 10 is an addition within 10 14 ndash 5 = 9 is a subtraction within 20 and 55 ndash 18 = 37 is a subtraction within 100
Additive inverses Two numbers whose sum is 0 are additive inverses of one another Example 34 and ndash 34 are additive inverses of one another because 34 + (ndash 34) = (ndash 34) + 34 = 0
Associative property of addition See Table 3 in this Glossary
Associative property of multiplication See Table 3 in this Glossary
Bivariate data Pairs of linked numerical observations Example a list of heights and weights for each player on a football team
Box plot A method of visually displaying a distribution of data values by using the median quartiles and extremes of the data set A box shows the middle 50 of the data1
Commutative property See Table 3 in this Glossary
Complex fraction A fraction AB where A andor B are fractions (B nonzero)
Computation algorithm A set of predefined steps applicable to a class of problems that gives the correct result in every case when the steps are carried out correctly See also computation strategy
Computation strategy Purposeful manipulations that may be chosen for specific problems may not have a fixed order and may be aimed at converting one problem into another See also computation algorithm
Congruent Two plane or solid figures are congruent if one can be obtained from the other by rigid motion (a sequence of rotations reflections and translations)
Counting on A strategy for finding the number of objects in a group without having to count every member of the group For example if a stack of books is known to have 8 books and 3 more books are added to the top it is not necessary to count the stack
50
Keansburg School DistrictCurriculum System
Mathematicsall over again One can find the total by counting onmdashpointing to the top book and saying ldquoeightrdquo following this with ldquonine ten eleven There are eleven books nowrdquo
Dot plot See line plot
Dilation A transformation that moves each point along the ray through the point emanating from a fixed center and multiplies distances from the center by a common scale factor
Expanded form A multi-digit number is expressed in expanded form when it is written as a sum of single-digit multiples of powers of ten For example 643 = 600 + 40 + 3
Expected value For a random variable the weighted average of its possible values with weights given by their respective probabilities
First quartile For a data set with median M the first quartile is the median of the data values less than M Example For the data set 1 3 6 7 10 12 14 15 22 120 the first quartile is 62 See also median third quartile interquartile range
Fraction A number expressible in the form ab where a is a whole number and b is a positive whole number (The word fraction in these standards always refers to a non-negative number) See also rational number
Identity property of 0 See Table 3 in this Glossary
Independently combined probability models Two probability models are said to be combined independently if the probability of each ordered pair in the combined model equals the product of the original probabilities of the two individual outcomes in the ordered pair
Integer A number expressible in the form a or ndasha for some whole number a
Interquartile Range A measure of variation in a set of numerical data the interquartile range is the distance between the first and third quartiles of the data set Example For the data set 1 3 6 7 10 12 14 15 22 120 the interquartile range is 15 ndash 6 = 9 See also first quartile third quartile
Line plot A method of visually displaying a distribution of data values where each data value is shown as a dot or mark above a number line Also known as a dot plot3
51
Keansburg School DistrictCurriculum System
MathematicsMean A measure of center in a set of numerical data computed by adding the values in a list and then dividing by the number of values in the list4 Example For the data set 1 3 6 7 10 12 14 15 22 120 the mean is 21
Mean absolute deviation A measure of variation in a set of numerical data computed by adding the distances between each data value and the mean then dividing by the number of data values Example For the data set 2 3 6 7 10 12 14 15 22 120 the mean absolute deviation is 20
Median A measure of center in a set of numerical data The median of a list of values is the value appearing at the center of a sorted version of the listmdashor the mean of the two central values if the list contains an even number of values Example For the data set 2 3 6 7 10 12 14 15 22 90 the median is 11
Midline In the graph of a trigonometric function the horizontal line halfway between its maximum and minimum values
Multiplication and division within 100 Multiplication or division of two whole numbers with whole number answers and with product or dividend in the range 0-100 Example 72 divide 8 = 9
Multiplicative inverses Two numbers whose product is 1 are multiplicative inverses of one another Example 34 and 43 are multiplicative inverses of one another because 34 times 43 = 43 times 34 = 1
Number line diagram A diagram of the number line used to represent numbers and support reasoning about them In a number line diagram for measurement quantities the interval from 0 to 1 on the diagram represents the unit of measure for the quantity
Percent rate of change A rate of change expressed as a percent Example if a population grows from 50 to 55 in a year it grows by 550 = 10 per year
Probability distribution The set of possible values of a random variable with a probability assigned to each
Properties of operations See Table 3 in this Glossary
Properties of equality See Table 4 in this Glossary
Properties of inequality See Table 5 in this Glossary
Properties of operations See Table 3 in this Glossary
52
Keansburg School DistrictCurriculum System
MathematicsProbability A number between 0 and 1 used to quantify likelihood for processes that have uncertain outcomes (such as tossing a coin selecting a person at random from a group of people tossing a ball at a target or testing for a medical condition)
Probability model A probability model is used to assign probabilities to outcomes of a chance process by examining the nature of the process The set of all outcomes is called the sample space and their probabilities sum to 1 See also uniform probability model
Random variable An assignment of a numerical value to each outcome in a sample space
Rational expression A quotient of two polynomials with a non-zero denominator
Rational number A number expressible in the form ab or ndash ab for some fraction ab The rational numbers include the integers
Rectilinear figure A polygon all angles of which are right angles
Rigid motion A transformation of points in space consisting of a sequence of one or more translations reflections andor rotations Rigid motions are here assumed to preserve distances and angle measures
Repeating decimal The decimal form of a rational number See also terminating decimal
Sample space In a probability model for a random process a list of the individual outcomes that are to be considered
Scatter plot A graph in the coordinate plane representing a set of bivariate data For example the heights and weights of a group of people could be displayed on a scatter plot5
Similarity transformation A rigid motion followed by a dilation
Tape diagram A drawing that looks like a segment of tape used to illustrate number relationships Also known as a strip diagram bar model fraction strip or length model
Terminating decimal A decimal is called terminating if its repeating digit is 0
Third quartile For a data set with median M the third quartile is the median of the data values greater than M Example For the data set 2 3 6 7 10 12 14 15 22 120 the third quartile is 15 See also median first quartile interquartile range
Transitivity principle for indirect measurement If the length of object A is greater than the length of object B and the length of object B is greater than the length of object C then the length of object A is greater than the length of object C This principle applies
53
Keansburg School DistrictCurriculum System
Mathematicsto measurement of other quantities as well
Uniform probability model A probability model which assigns equal probability to all outcomes See also probability model
Vector A quantity with magnitude and direction in the plane or in space defined by an ordered pair or triple of real numbers
Visual fraction model A tape diagram number line diagram or area model
Whole numbers The numbers 0 1 2 3 hellip5
54
- MissionVision Statement
- Beliefs
- Measurement amp Data
- Measure lengths and by iterating length units
- Tell and write time
- Represent and interpret data
- Geometry
- Reason with shapes and their attributes
- Number and Base Ten
- Extend the counting sequence
- Understand place value
-
- Measurement amp Data (II)
-
- Measure lengths and by iterating length units
- Tell and write time
-
- Represent and interpret data
- Geometry (II)
- Reason with shapes their attributes
-
- Number and Base Ten
- Use place value understanding and properties of operations to add and subtract
- Teacher will cover up specific numbers on an enlarged number grid using cover up tape to have students identify numbers before and after Students will come up and write the missing numbers
- Students will play ldquoI have__ Who has __ Teacher will create cards using index cards and numbers in which students need further practice with Students will read their cards aloud Variations of game can include identifying specific numbers identifying numbers more or less etc)
- Students will use base ten blocks to represent numbers including three digit numbers Students will identify representation of numbers through these manipulatives They may match the representation to the written number
- Students will write the number they created using the base ten blocks using their white boards and markers
- Students will arrange given digits to create the greatest and lowest possible numbers They can show each number they create using base ten blocks
- Students will use the Base Ten Exchange Game to show an understanding of exchanging ones for tens and tens for hundreds Students can use place value mats base ten blocks (cubes tens and flats) Students can take number of cubes displayed with roll of single die Students will determine when exchanging can be made when reaching ten units
- Base ten concentration wwwk-5mathteachingresourcescom
- Ten frame compare wwwk-5mathteachingresourcescom
-
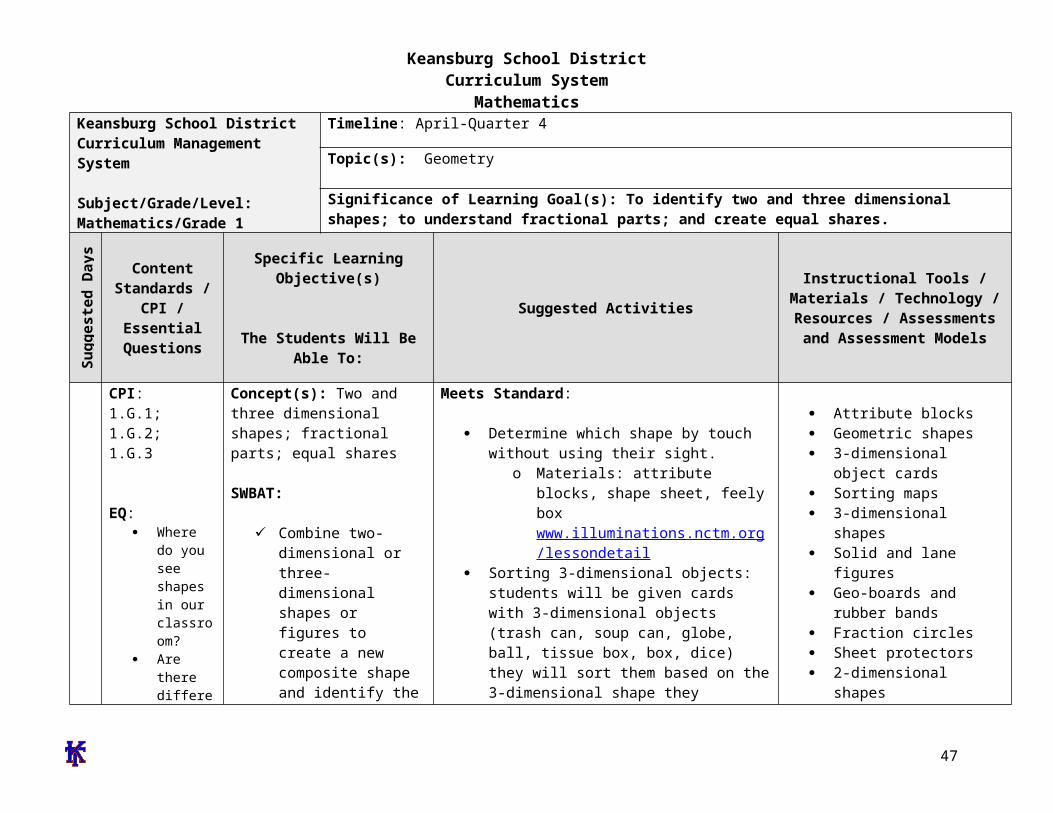
Keansburg School DistrictCurriculum System
Mathematicsignment Matrices of Common Core State Standards
Grade Strand Standard Standard
Sept
embe
r ndash
Oct
ober
Nov
embe
r ndash
Dec
embe
r
Janu
ary
ndash Fe
brua
ry
Mar
ch ndash
Apr
il
May
- Ju
ne
1 OA 1
CC1OA1 Represent and solve problems involving addition and subtraction Use addition and subtraction within 20 to solve word problems involving situations of adding to taking from putting together taking apart and comparing with unknowns in all positions eg by using objects drawings and equations with a symbol for the unknown number to represent the problem
1 OA 2
CC1OA2 Represent and solve problems involving addition and subtraction Solve word problems that call for addition of three whole numbers whose sum is less than or equal to 20 eg by using objects drawings and equations with a symbol for the unknown number to represent the problem
1 OA 3
CC1OA3 Understand and apply properties of operations and the relationship between addition and subtraction Apply properties of operations as strategies to add and subtract Examples If 8 + 3 = 11 is known then 3 + 8 = 11 is also known (Commutative property of addition) To add 2 + 6 + 4 the second two numbers can be added to make a ten so 2 + 6 + 4 = 2 + 10 = 12 (Associative property of addition) (Students need not use formal terms for these properties)
1 OA 4
CC1OA4 Understand and apply properties of operations and the relationship between addition and subtraction Understand subtraction as an unknown-addend problem For example subtract 10 ndash 8 by finding the number that makes 10 when added to 8
1 OA 5 CC1OA5 Add and subtract within 20 Relate counting to addition and subtraction (eg by counting on 2 to add 2)
1 OA 6 CC1OA6 Add and subtract within 20 Add and subtract within 20 demonstrating fluency for addition and subtraction within 10 Use strategies such as counting on making ten (eg 8 + 6 = 8 + 2 + 4 = 10 + 4 = 14) decomposing a number leading to a ten (eg 13 ndash 4 = 13 ndash 3 ndash 1 = 10 ndash 1 = 9) using the relationship between addition and subtraction (eg knowing that 8 + 4
47
Keansburg School DistrictCurriculum System
Mathematics= 12 one knows 12 ndash 8 = 4) and creating equivalent but easier or known sums (eg adding 6 + 7 by creating the known equivalent 6 + 6 + 1 = 12 + 1 = 13)
1 OA 7
CC1OA7 Work with addition and subtraction equations Understand the meaning of the equal sign and determine if equations involving addition and subtraction are true or false For example which of the following equations are true and which are false 6 = 6 7 = 8 ndash 1 5 + 2 = 2 + 5 4 + 1 = 5 + 2
1 OA 8
CC1OA8 Work with addition and subtraction equations Determine the unknown whole number in an addition or subtraction equation relating three whole numbers For example determine the unknown number that makes the equation true in each of the equations 8 + = 11 5 = _ ndash 3 6 + 6 = _
1 NBT 1
CC1NBT1 Extend the counting sequence Count to 120 starting at any number less than 120 In this range read and write numerals and represent a number of objects with a written numeral
1 NBT 2
CC1NBT2 Understand place value Understand that the two digits of a two-digit number represent amounts of tens and ones Understand the following as special cases -- a 10 can be thought of as a bundle of ten ones mdash called a ldquotenrdquo -- b The numbers from 11 to 19 are composed of a ten and one two three four five six seven eight or nine ones -- c The numbers 10 20 30 40 50 60 70 80 90 refer to one two three four five six seven eight or nine tens (and 0 ones)
1 NBT 3
CC1NBT3 Understand place value Compare two two-digit numbers based on meanings of the tens and ones digits recording the results of comparisons with the symbols gt = and lt
1 NBT 4
CC1NBT4 Use place value understanding and properties of operations to add and subtract Add within 100 including adding a two-digit number and a one-digit number and adding a two-digit number and a multiple of 10 using concrete models or drawings and strategies based on place value properties of operations andor the relationship between addition and subtraction relate the strategy to a written method and explain the reasoning used Understand that in adding two-digit numbers one adds tens and tens ones and ones and sometimes it is necessary to compose a ten
1 NBT 5
CC1NBT5 Use place value understanding and properties of operations to add and subtract Given a two-digit number mentally find 10 more or 10 less than the number without having to count explain the reasoning used
1 NBT 6 CC1NBT6 Use place value understanding and properties of operations to add and subtract Subtract multiples of 10 in the range 10-90 from multiples of 10 in the range 10-90 (positive or zero differences) using concrete models or drawings and strategies based on place value properties of operations andor
48
Keansburg School DistrictCurriculum System
Mathematicsthe relationship between addition and subtraction relate the strategy to a written method and explain the reasoning used
1 MD 1
CC1MD1 Measure lengths indirectly and by iterating length units Order three objects by length compare the lengths of two objects indirectly by using a third object
1 MD 2
CC1MD2 Measure lengths indirectly and by iterating length units Express the length of an object as a whole number of length units by laying multiple copies of a shorter object (the length unit) end to end understand that the length measurement of an object is the number of same-size length units that span it with no gaps or overlaps Limit to contexts where the object being measured is spanned by a whole number of length units with no gaps or overlaps
1 MD 3CC1MD3 Tell and write time Tell and write time in hours and half-hours using analog and digital clocks
1 MD 4
CC1MD4 Represent and interpret data Organize represent and interpret data with up to three categories ask and answer questions about the total number of data points how many in each category and how many more or less are in one category than in another
1 G 1
CC1G1 Reason with shapes and their attributes Distinguish between defining attributes (eg triangles are closed and three-sided) versus non-defining attributes (eg color orientation overall size) for a wide variety of shapes build and draw shapes to possess defining attributes
1 G 2
CC1G2 Reason with shapes and their attributes Compose two-dimensional shapes (rectangles squares trapezoids triangles half-circles and quarter-circles) or three-dimensional shapes (cubes right rectangular prisms right circular cones and right circular cylinders) to create a composite shape and compose new shapes from the composite shape (Students do not need to learn formal names such as ldquoright rectangular prismrdquo)
1 G 3
CC1G3 Reason with shapes and their attributes Partition circles and rectangles into two and four equal shares describe the shares using the words halves fourths and quarters and use the phrases half of fourth of and quarter of Describe the whole as two of or four of the shares Understand for these examples that decomposing into more equal shares creates smaller shares
49
Keansburg School DistrictCurriculum System
Mathematics
Common Core State Standards Vocabulary
Addition and subtraction within 5 10 20 100 or 1000 Addition or subtraction of two whole numbers with whole number answers and with sum or minuend in the range 0-5 0-10 0-20 or 0-100 respectively Example 8 + 2 = 10 is an addition within 10 14 ndash 5 = 9 is a subtraction within 20 and 55 ndash 18 = 37 is a subtraction within 100
Additive inverses Two numbers whose sum is 0 are additive inverses of one another Example 34 and ndash 34 are additive inverses of one another because 34 + (ndash 34) = (ndash 34) + 34 = 0
Associative property of addition See Table 3 in this Glossary
Associative property of multiplication See Table 3 in this Glossary
Bivariate data Pairs of linked numerical observations Example a list of heights and weights for each player on a football team
Box plot A method of visually displaying a distribution of data values by using the median quartiles and extremes of the data set A box shows the middle 50 of the data1
Commutative property See Table 3 in this Glossary
Complex fraction A fraction AB where A andor B are fractions (B nonzero)
Computation algorithm A set of predefined steps applicable to a class of problems that gives the correct result in every case when the steps are carried out correctly See also computation strategy
Computation strategy Purposeful manipulations that may be chosen for specific problems may not have a fixed order and may be aimed at converting one problem into another See also computation algorithm
Congruent Two plane or solid figures are congruent if one can be obtained from the other by rigid motion (a sequence of rotations reflections and translations)
Counting on A strategy for finding the number of objects in a group without having to count every member of the group For example if a stack of books is known to have 8 books and 3 more books are added to the top it is not necessary to count the stack
50
Keansburg School DistrictCurriculum System
Mathematicsall over again One can find the total by counting onmdashpointing to the top book and saying ldquoeightrdquo following this with ldquonine ten eleven There are eleven books nowrdquo
Dot plot See line plot
Dilation A transformation that moves each point along the ray through the point emanating from a fixed center and multiplies distances from the center by a common scale factor
Expanded form A multi-digit number is expressed in expanded form when it is written as a sum of single-digit multiples of powers of ten For example 643 = 600 + 40 + 3
Expected value For a random variable the weighted average of its possible values with weights given by their respective probabilities
First quartile For a data set with median M the first quartile is the median of the data values less than M Example For the data set 1 3 6 7 10 12 14 15 22 120 the first quartile is 62 See also median third quartile interquartile range
Fraction A number expressible in the form ab where a is a whole number and b is a positive whole number (The word fraction in these standards always refers to a non-negative number) See also rational number
Identity property of 0 See Table 3 in this Glossary
Independently combined probability models Two probability models are said to be combined independently if the probability of each ordered pair in the combined model equals the product of the original probabilities of the two individual outcomes in the ordered pair
Integer A number expressible in the form a or ndasha for some whole number a
Interquartile Range A measure of variation in a set of numerical data the interquartile range is the distance between the first and third quartiles of the data set Example For the data set 1 3 6 7 10 12 14 15 22 120 the interquartile range is 15 ndash 6 = 9 See also first quartile third quartile
Line plot A method of visually displaying a distribution of data values where each data value is shown as a dot or mark above a number line Also known as a dot plot3
51
Keansburg School DistrictCurriculum System
MathematicsMean A measure of center in a set of numerical data computed by adding the values in a list and then dividing by the number of values in the list4 Example For the data set 1 3 6 7 10 12 14 15 22 120 the mean is 21
Mean absolute deviation A measure of variation in a set of numerical data computed by adding the distances between each data value and the mean then dividing by the number of data values Example For the data set 2 3 6 7 10 12 14 15 22 120 the mean absolute deviation is 20
Median A measure of center in a set of numerical data The median of a list of values is the value appearing at the center of a sorted version of the listmdashor the mean of the two central values if the list contains an even number of values Example For the data set 2 3 6 7 10 12 14 15 22 90 the median is 11
Midline In the graph of a trigonometric function the horizontal line halfway between its maximum and minimum values
Multiplication and division within 100 Multiplication or division of two whole numbers with whole number answers and with product or dividend in the range 0-100 Example 72 divide 8 = 9
Multiplicative inverses Two numbers whose product is 1 are multiplicative inverses of one another Example 34 and 43 are multiplicative inverses of one another because 34 times 43 = 43 times 34 = 1
Number line diagram A diagram of the number line used to represent numbers and support reasoning about them In a number line diagram for measurement quantities the interval from 0 to 1 on the diagram represents the unit of measure for the quantity
Percent rate of change A rate of change expressed as a percent Example if a population grows from 50 to 55 in a year it grows by 550 = 10 per year
Probability distribution The set of possible values of a random variable with a probability assigned to each
Properties of operations See Table 3 in this Glossary
Properties of equality See Table 4 in this Glossary
Properties of inequality See Table 5 in this Glossary
Properties of operations See Table 3 in this Glossary
52
Keansburg School DistrictCurriculum System
MathematicsProbability A number between 0 and 1 used to quantify likelihood for processes that have uncertain outcomes (such as tossing a coin selecting a person at random from a group of people tossing a ball at a target or testing for a medical condition)
Probability model A probability model is used to assign probabilities to outcomes of a chance process by examining the nature of the process The set of all outcomes is called the sample space and their probabilities sum to 1 See also uniform probability model
Random variable An assignment of a numerical value to each outcome in a sample space
Rational expression A quotient of two polynomials with a non-zero denominator
Rational number A number expressible in the form ab or ndash ab for some fraction ab The rational numbers include the integers
Rectilinear figure A polygon all angles of which are right angles
Rigid motion A transformation of points in space consisting of a sequence of one or more translations reflections andor rotations Rigid motions are here assumed to preserve distances and angle measures
Repeating decimal The decimal form of a rational number See also terminating decimal
Sample space In a probability model for a random process a list of the individual outcomes that are to be considered
Scatter plot A graph in the coordinate plane representing a set of bivariate data For example the heights and weights of a group of people could be displayed on a scatter plot5
Similarity transformation A rigid motion followed by a dilation
Tape diagram A drawing that looks like a segment of tape used to illustrate number relationships Also known as a strip diagram bar model fraction strip or length model
Terminating decimal A decimal is called terminating if its repeating digit is 0
Third quartile For a data set with median M the third quartile is the median of the data values greater than M Example For the data set 2 3 6 7 10 12 14 15 22 120 the third quartile is 15 See also median first quartile interquartile range
Transitivity principle for indirect measurement If the length of object A is greater than the length of object B and the length of object B is greater than the length of object C then the length of object A is greater than the length of object C This principle applies
53
Keansburg School DistrictCurriculum System
Mathematicsto measurement of other quantities as well
Uniform probability model A probability model which assigns equal probability to all outcomes See also probability model
Vector A quantity with magnitude and direction in the plane or in space defined by an ordered pair or triple of real numbers
Visual fraction model A tape diagram number line diagram or area model
Whole numbers The numbers 0 1 2 3 hellip5
54
- MissionVision Statement
- Beliefs
- Measurement amp Data
- Measure lengths and by iterating length units
- Tell and write time
- Represent and interpret data
- Geometry
- Reason with shapes and their attributes
- Number and Base Ten
- Extend the counting sequence
- Understand place value
-
- Measurement amp Data (II)
-
- Measure lengths and by iterating length units
- Tell and write time
-
- Represent and interpret data
- Geometry (II)
- Reason with shapes their attributes
-
- Number and Base Ten
- Use place value understanding and properties of operations to add and subtract
- Teacher will cover up specific numbers on an enlarged number grid using cover up tape to have students identify numbers before and after Students will come up and write the missing numbers
- Students will play ldquoI have__ Who has __ Teacher will create cards using index cards and numbers in which students need further practice with Students will read their cards aloud Variations of game can include identifying specific numbers identifying numbers more or less etc)
- Students will use base ten blocks to represent numbers including three digit numbers Students will identify representation of numbers through these manipulatives They may match the representation to the written number
- Students will write the number they created using the base ten blocks using their white boards and markers
- Students will arrange given digits to create the greatest and lowest possible numbers They can show each number they create using base ten blocks
- Students will use the Base Ten Exchange Game to show an understanding of exchanging ones for tens and tens for hundreds Students can use place value mats base ten blocks (cubes tens and flats) Students can take number of cubes displayed with roll of single die Students will determine when exchanging can be made when reaching ten units
- Base ten concentration wwwk-5mathteachingresourcescom
- Ten frame compare wwwk-5mathteachingresourcescom
-
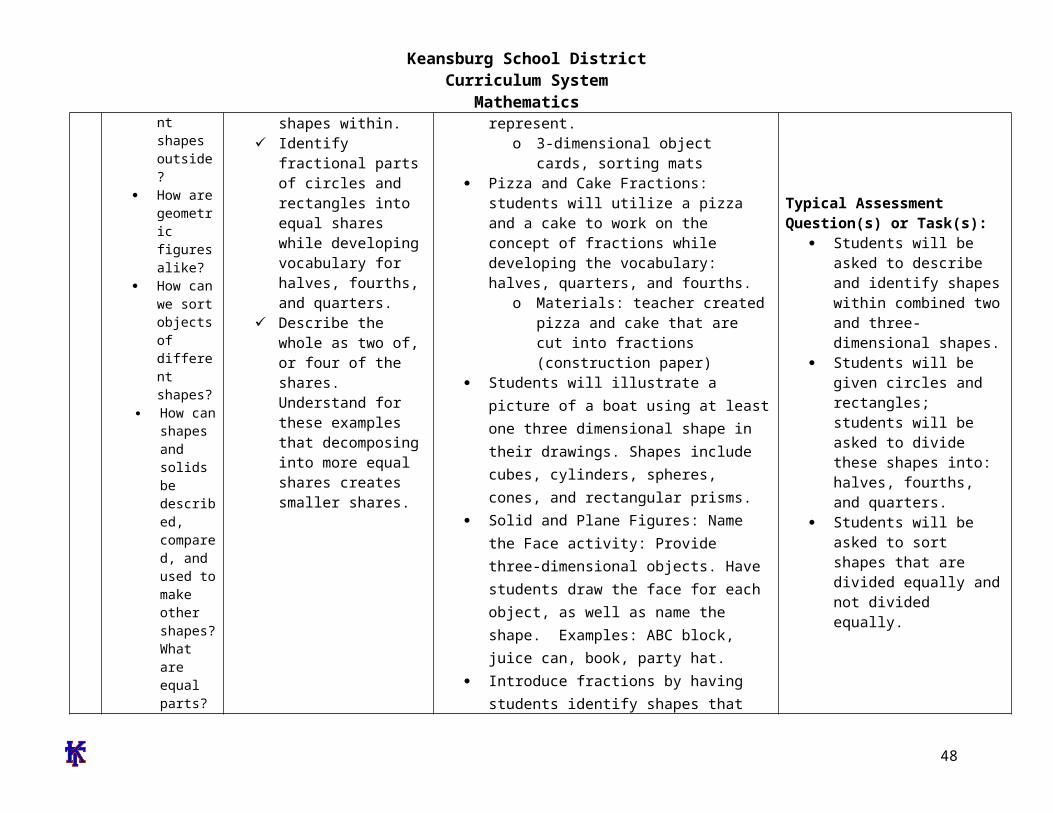
Keansburg School DistrictCurriculum System
Mathematics= 12 one knows 12 ndash 8 = 4) and creating equivalent but easier or known sums (eg adding 6 + 7 by creating the known equivalent 6 + 6 + 1 = 12 + 1 = 13)
1 OA 7
CC1OA7 Work with addition and subtraction equations Understand the meaning of the equal sign and determine if equations involving addition and subtraction are true or false For example which of the following equations are true and which are false 6 = 6 7 = 8 ndash 1 5 + 2 = 2 + 5 4 + 1 = 5 + 2
1 OA 8
CC1OA8 Work with addition and subtraction equations Determine the unknown whole number in an addition or subtraction equation relating three whole numbers For example determine the unknown number that makes the equation true in each of the equations 8 + = 11 5 = _ ndash 3 6 + 6 = _
1 NBT 1
CC1NBT1 Extend the counting sequence Count to 120 starting at any number less than 120 In this range read and write numerals and represent a number of objects with a written numeral
1 NBT 2
CC1NBT2 Understand place value Understand that the two digits of a two-digit number represent amounts of tens and ones Understand the following as special cases -- a 10 can be thought of as a bundle of ten ones mdash called a ldquotenrdquo -- b The numbers from 11 to 19 are composed of a ten and one two three four five six seven eight or nine ones -- c The numbers 10 20 30 40 50 60 70 80 90 refer to one two three four five six seven eight or nine tens (and 0 ones)
1 NBT 3
CC1NBT3 Understand place value Compare two two-digit numbers based on meanings of the tens and ones digits recording the results of comparisons with the symbols gt = and lt
1 NBT 4
CC1NBT4 Use place value understanding and properties of operations to add and subtract Add within 100 including adding a two-digit number and a one-digit number and adding a two-digit number and a multiple of 10 using concrete models or drawings and strategies based on place value properties of operations andor the relationship between addition and subtraction relate the strategy to a written method and explain the reasoning used Understand that in adding two-digit numbers one adds tens and tens ones and ones and sometimes it is necessary to compose a ten
1 NBT 5
CC1NBT5 Use place value understanding and properties of operations to add and subtract Given a two-digit number mentally find 10 more or 10 less than the number without having to count explain the reasoning used
1 NBT 6 CC1NBT6 Use place value understanding and properties of operations to add and subtract Subtract multiples of 10 in the range 10-90 from multiples of 10 in the range 10-90 (positive or zero differences) using concrete models or drawings and strategies based on place value properties of operations andor
48
Keansburg School DistrictCurriculum System
Mathematicsthe relationship between addition and subtraction relate the strategy to a written method and explain the reasoning used
1 MD 1
CC1MD1 Measure lengths indirectly and by iterating length units Order three objects by length compare the lengths of two objects indirectly by using a third object
1 MD 2
CC1MD2 Measure lengths indirectly and by iterating length units Express the length of an object as a whole number of length units by laying multiple copies of a shorter object (the length unit) end to end understand that the length measurement of an object is the number of same-size length units that span it with no gaps or overlaps Limit to contexts where the object being measured is spanned by a whole number of length units with no gaps or overlaps
1 MD 3CC1MD3 Tell and write time Tell and write time in hours and half-hours using analog and digital clocks
1 MD 4
CC1MD4 Represent and interpret data Organize represent and interpret data with up to three categories ask and answer questions about the total number of data points how many in each category and how many more or less are in one category than in another
1 G 1
CC1G1 Reason with shapes and their attributes Distinguish between defining attributes (eg triangles are closed and three-sided) versus non-defining attributes (eg color orientation overall size) for a wide variety of shapes build and draw shapes to possess defining attributes
1 G 2
CC1G2 Reason with shapes and their attributes Compose two-dimensional shapes (rectangles squares trapezoids triangles half-circles and quarter-circles) or three-dimensional shapes (cubes right rectangular prisms right circular cones and right circular cylinders) to create a composite shape and compose new shapes from the composite shape (Students do not need to learn formal names such as ldquoright rectangular prismrdquo)
1 G 3
CC1G3 Reason with shapes and their attributes Partition circles and rectangles into two and four equal shares describe the shares using the words halves fourths and quarters and use the phrases half of fourth of and quarter of Describe the whole as two of or four of the shares Understand for these examples that decomposing into more equal shares creates smaller shares
49
Keansburg School DistrictCurriculum System
Mathematics
Common Core State Standards Vocabulary
Addition and subtraction within 5 10 20 100 or 1000 Addition or subtraction of two whole numbers with whole number answers and with sum or minuend in the range 0-5 0-10 0-20 or 0-100 respectively Example 8 + 2 = 10 is an addition within 10 14 ndash 5 = 9 is a subtraction within 20 and 55 ndash 18 = 37 is a subtraction within 100
Additive inverses Two numbers whose sum is 0 are additive inverses of one another Example 34 and ndash 34 are additive inverses of one another because 34 + (ndash 34) = (ndash 34) + 34 = 0
Associative property of addition See Table 3 in this Glossary
Associative property of multiplication See Table 3 in this Glossary
Bivariate data Pairs of linked numerical observations Example a list of heights and weights for each player on a football team
Box plot A method of visually displaying a distribution of data values by using the median quartiles and extremes of the data set A box shows the middle 50 of the data1
Commutative property See Table 3 in this Glossary
Complex fraction A fraction AB where A andor B are fractions (B nonzero)
Computation algorithm A set of predefined steps applicable to a class of problems that gives the correct result in every case when the steps are carried out correctly See also computation strategy
Computation strategy Purposeful manipulations that may be chosen for specific problems may not have a fixed order and may be aimed at converting one problem into another See also computation algorithm
Congruent Two plane or solid figures are congruent if one can be obtained from the other by rigid motion (a sequence of rotations reflections and translations)
Counting on A strategy for finding the number of objects in a group without having to count every member of the group For example if a stack of books is known to have 8 books and 3 more books are added to the top it is not necessary to count the stack
50
Keansburg School DistrictCurriculum System
Mathematicsall over again One can find the total by counting onmdashpointing to the top book and saying ldquoeightrdquo following this with ldquonine ten eleven There are eleven books nowrdquo
Dot plot See line plot
Dilation A transformation that moves each point along the ray through the point emanating from a fixed center and multiplies distances from the center by a common scale factor
Expanded form A multi-digit number is expressed in expanded form when it is written as a sum of single-digit multiples of powers of ten For example 643 = 600 + 40 + 3
Expected value For a random variable the weighted average of its possible values with weights given by their respective probabilities
First quartile For a data set with median M the first quartile is the median of the data values less than M Example For the data set 1 3 6 7 10 12 14 15 22 120 the first quartile is 62 See also median third quartile interquartile range
Fraction A number expressible in the form ab where a is a whole number and b is a positive whole number (The word fraction in these standards always refers to a non-negative number) See also rational number
Identity property of 0 See Table 3 in this Glossary
Independently combined probability models Two probability models are said to be combined independently if the probability of each ordered pair in the combined model equals the product of the original probabilities of the two individual outcomes in the ordered pair
Integer A number expressible in the form a or ndasha for some whole number a
Interquartile Range A measure of variation in a set of numerical data the interquartile range is the distance between the first and third quartiles of the data set Example For the data set 1 3 6 7 10 12 14 15 22 120 the interquartile range is 15 ndash 6 = 9 See also first quartile third quartile
Line plot A method of visually displaying a distribution of data values where each data value is shown as a dot or mark above a number line Also known as a dot plot3
51
Keansburg School DistrictCurriculum System
MathematicsMean A measure of center in a set of numerical data computed by adding the values in a list and then dividing by the number of values in the list4 Example For the data set 1 3 6 7 10 12 14 15 22 120 the mean is 21
Mean absolute deviation A measure of variation in a set of numerical data computed by adding the distances between each data value and the mean then dividing by the number of data values Example For the data set 2 3 6 7 10 12 14 15 22 120 the mean absolute deviation is 20
Median A measure of center in a set of numerical data The median of a list of values is the value appearing at the center of a sorted version of the listmdashor the mean of the two central values if the list contains an even number of values Example For the data set 2 3 6 7 10 12 14 15 22 90 the median is 11
Midline In the graph of a trigonometric function the horizontal line halfway between its maximum and minimum values
Multiplication and division within 100 Multiplication or division of two whole numbers with whole number answers and with product or dividend in the range 0-100 Example 72 divide 8 = 9
Multiplicative inverses Two numbers whose product is 1 are multiplicative inverses of one another Example 34 and 43 are multiplicative inverses of one another because 34 times 43 = 43 times 34 = 1
Number line diagram A diagram of the number line used to represent numbers and support reasoning about them In a number line diagram for measurement quantities the interval from 0 to 1 on the diagram represents the unit of measure for the quantity
Percent rate of change A rate of change expressed as a percent Example if a population grows from 50 to 55 in a year it grows by 550 = 10 per year
Probability distribution The set of possible values of a random variable with a probability assigned to each
Properties of operations See Table 3 in this Glossary
Properties of equality See Table 4 in this Glossary
Properties of inequality See Table 5 in this Glossary
Properties of operations See Table 3 in this Glossary
52
Keansburg School DistrictCurriculum System
MathematicsProbability A number between 0 and 1 used to quantify likelihood for processes that have uncertain outcomes (such as tossing a coin selecting a person at random from a group of people tossing a ball at a target or testing for a medical condition)
Probability model A probability model is used to assign probabilities to outcomes of a chance process by examining the nature of the process The set of all outcomes is called the sample space and their probabilities sum to 1 See also uniform probability model
Random variable An assignment of a numerical value to each outcome in a sample space
Rational expression A quotient of two polynomials with a non-zero denominator
Rational number A number expressible in the form ab or ndash ab for some fraction ab The rational numbers include the integers
Rectilinear figure A polygon all angles of which are right angles
Rigid motion A transformation of points in space consisting of a sequence of one or more translations reflections andor rotations Rigid motions are here assumed to preserve distances and angle measures
Repeating decimal The decimal form of a rational number See also terminating decimal
Sample space In a probability model for a random process a list of the individual outcomes that are to be considered
Scatter plot A graph in the coordinate plane representing a set of bivariate data For example the heights and weights of a group of people could be displayed on a scatter plot5
Similarity transformation A rigid motion followed by a dilation
Tape diagram A drawing that looks like a segment of tape used to illustrate number relationships Also known as a strip diagram bar model fraction strip or length model
Terminating decimal A decimal is called terminating if its repeating digit is 0
Third quartile For a data set with median M the third quartile is the median of the data values greater than M Example For the data set 2 3 6 7 10 12 14 15 22 120 the third quartile is 15 See also median first quartile interquartile range
Transitivity principle for indirect measurement If the length of object A is greater than the length of object B and the length of object B is greater than the length of object C then the length of object A is greater than the length of object C This principle applies
53
Keansburg School DistrictCurriculum System
Mathematicsto measurement of other quantities as well
Uniform probability model A probability model which assigns equal probability to all outcomes See also probability model
Vector A quantity with magnitude and direction in the plane or in space defined by an ordered pair or triple of real numbers
Visual fraction model A tape diagram number line diagram or area model
Whole numbers The numbers 0 1 2 3 hellip5
54
- MissionVision Statement
- Beliefs
- Measurement amp Data
- Measure lengths and by iterating length units
- Tell and write time
- Represent and interpret data
- Geometry
- Reason with shapes and their attributes
- Number and Base Ten
- Extend the counting sequence
- Understand place value
-
- Measurement amp Data (II)
-
- Measure lengths and by iterating length units
- Tell and write time
-
- Represent and interpret data
- Geometry (II)
- Reason with shapes their attributes
-
- Number and Base Ten
- Use place value understanding and properties of operations to add and subtract
- Teacher will cover up specific numbers on an enlarged number grid using cover up tape to have students identify numbers before and after Students will come up and write the missing numbers
- Students will play ldquoI have__ Who has __ Teacher will create cards using index cards and numbers in which students need further practice with Students will read their cards aloud Variations of game can include identifying specific numbers identifying numbers more or less etc)
- Students will use base ten blocks to represent numbers including three digit numbers Students will identify representation of numbers through these manipulatives They may match the representation to the written number
- Students will write the number they created using the base ten blocks using their white boards and markers
- Students will arrange given digits to create the greatest and lowest possible numbers They can show each number they create using base ten blocks
- Students will use the Base Ten Exchange Game to show an understanding of exchanging ones for tens and tens for hundreds Students can use place value mats base ten blocks (cubes tens and flats) Students can take number of cubes displayed with roll of single die Students will determine when exchanging can be made when reaching ten units
- Base ten concentration wwwk-5mathteachingresourcescom
- Ten frame compare wwwk-5mathteachingresourcescom
-
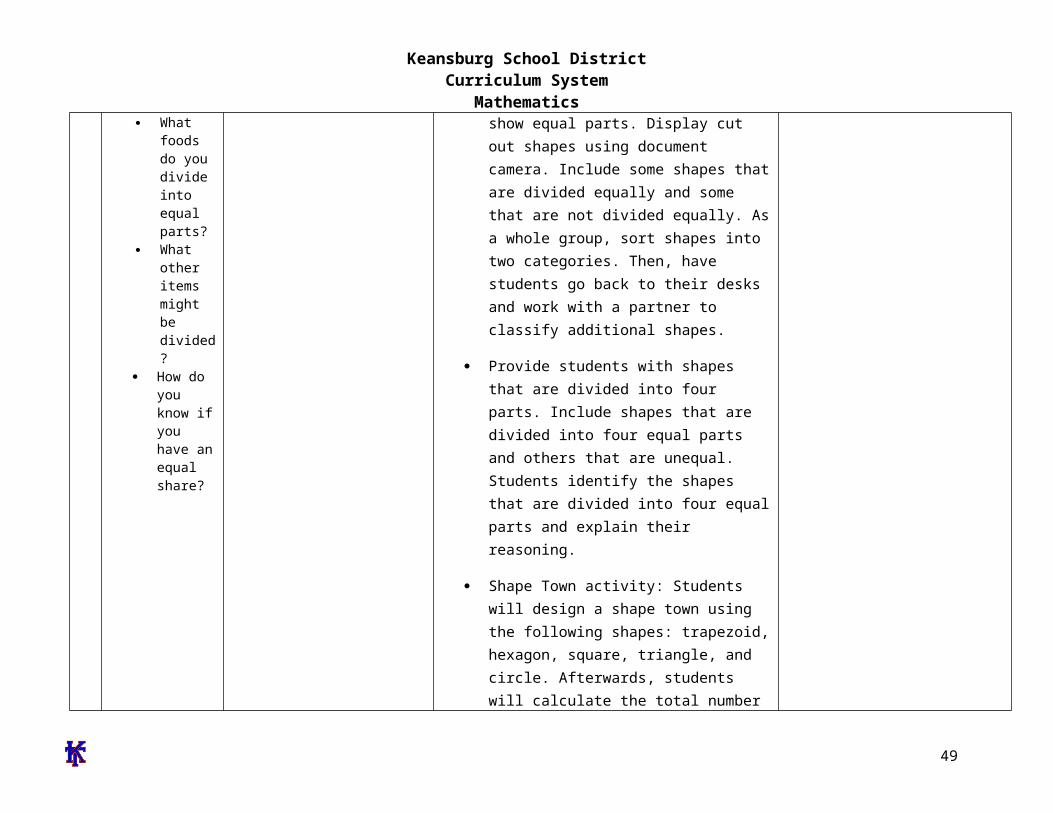
Keansburg School DistrictCurriculum System
Mathematics
Common Core State Standards Vocabulary
Addition and subtraction within 5 10 20 100 or 1000 Addition or subtraction of two whole numbers with whole number answers and with sum or minuend in the range 0-5 0-10 0-20 or 0-100 respectively Example 8 + 2 = 10 is an addition within 10 14 ndash 5 = 9 is a subtraction within 20 and 55 ndash 18 = 37 is a subtraction within 100
Additive inverses Two numbers whose sum is 0 are additive inverses of one another Example 34 and ndash 34 are additive inverses of one another because 34 + (ndash 34) = (ndash 34) + 34 = 0
Associative property of addition See Table 3 in this Glossary
Associative property of multiplication See Table 3 in this Glossary
Bivariate data Pairs of linked numerical observations Example a list of heights and weights for each player on a football team
Box plot A method of visually displaying a distribution of data values by using the median quartiles and extremes of the data set A box shows the middle 50 of the data1
Commutative property See Table 3 in this Glossary
Complex fraction A fraction AB where A andor B are fractions (B nonzero)
Computation algorithm A set of predefined steps applicable to a class of problems that gives the correct result in every case when the steps are carried out correctly See also computation strategy
Computation strategy Purposeful manipulations that may be chosen for specific problems may not have a fixed order and may be aimed at converting one problem into another See also computation algorithm
Congruent Two plane or solid figures are congruent if one can be obtained from the other by rigid motion (a sequence of rotations reflections and translations)
Counting on A strategy for finding the number of objects in a group without having to count every member of the group For example if a stack of books is known to have 8 books and 3 more books are added to the top it is not necessary to count the stack
50
Keansburg School DistrictCurriculum System
Mathematicsall over again One can find the total by counting onmdashpointing to the top book and saying ldquoeightrdquo following this with ldquonine ten eleven There are eleven books nowrdquo
Dot plot See line plot
Dilation A transformation that moves each point along the ray through the point emanating from a fixed center and multiplies distances from the center by a common scale factor
Expanded form A multi-digit number is expressed in expanded form when it is written as a sum of single-digit multiples of powers of ten For example 643 = 600 + 40 + 3
Expected value For a random variable the weighted average of its possible values with weights given by their respective probabilities
First quartile For a data set with median M the first quartile is the median of the data values less than M Example For the data set 1 3 6 7 10 12 14 15 22 120 the first quartile is 62 See also median third quartile interquartile range
Fraction A number expressible in the form ab where a is a whole number and b is a positive whole number (The word fraction in these standards always refers to a non-negative number) See also rational number
Identity property of 0 See Table 3 in this Glossary
Independently combined probability models Two probability models are said to be combined independently if the probability of each ordered pair in the combined model equals the product of the original probabilities of the two individual outcomes in the ordered pair
Integer A number expressible in the form a or ndasha for some whole number a
Interquartile Range A measure of variation in a set of numerical data the interquartile range is the distance between the first and third quartiles of the data set Example For the data set 1 3 6 7 10 12 14 15 22 120 the interquartile range is 15 ndash 6 = 9 See also first quartile third quartile
Line plot A method of visually displaying a distribution of data values where each data value is shown as a dot or mark above a number line Also known as a dot plot3
51
Keansburg School DistrictCurriculum System
MathematicsMean A measure of center in a set of numerical data computed by adding the values in a list and then dividing by the number of values in the list4 Example For the data set 1 3 6 7 10 12 14 15 22 120 the mean is 21
Mean absolute deviation A measure of variation in a set of numerical data computed by adding the distances between each data value and the mean then dividing by the number of data values Example For the data set 2 3 6 7 10 12 14 15 22 120 the mean absolute deviation is 20
Median A measure of center in a set of numerical data The median of a list of values is the value appearing at the center of a sorted version of the listmdashor the mean of the two central values if the list contains an even number of values Example For the data set 2 3 6 7 10 12 14 15 22 90 the median is 11
Midline In the graph of a trigonometric function the horizontal line halfway between its maximum and minimum values
Multiplication and division within 100 Multiplication or division of two whole numbers with whole number answers and with product or dividend in the range 0-100 Example 72 divide 8 = 9
Multiplicative inverses Two numbers whose product is 1 are multiplicative inverses of one another Example 34 and 43 are multiplicative inverses of one another because 34 times 43 = 43 times 34 = 1
Number line diagram A diagram of the number line used to represent numbers and support reasoning about them In a number line diagram for measurement quantities the interval from 0 to 1 on the diagram represents the unit of measure for the quantity
Percent rate of change A rate of change expressed as a percent Example if a population grows from 50 to 55 in a year it grows by 550 = 10 per year
Probability distribution The set of possible values of a random variable with a probability assigned to each
Properties of operations See Table 3 in this Glossary
Properties of equality See Table 4 in this Glossary
Properties of inequality See Table 5 in this Glossary
Properties of operations See Table 3 in this Glossary
52
Keansburg School DistrictCurriculum System
MathematicsProbability A number between 0 and 1 used to quantify likelihood for processes that have uncertain outcomes (such as tossing a coin selecting a person at random from a group of people tossing a ball at a target or testing for a medical condition)
Probability model A probability model is used to assign probabilities to outcomes of a chance process by examining the nature of the process The set of all outcomes is called the sample space and their probabilities sum to 1 See also uniform probability model
Random variable An assignment of a numerical value to each outcome in a sample space
Rational expression A quotient of two polynomials with a non-zero denominator
Rational number A number expressible in the form ab or ndash ab for some fraction ab The rational numbers include the integers
Rectilinear figure A polygon all angles of which are right angles
Rigid motion A transformation of points in space consisting of a sequence of one or more translations reflections andor rotations Rigid motions are here assumed to preserve distances and angle measures
Repeating decimal The decimal form of a rational number See also terminating decimal
Sample space In a probability model for a random process a list of the individual outcomes that are to be considered
Scatter plot A graph in the coordinate plane representing a set of bivariate data For example the heights and weights of a group of people could be displayed on a scatter plot5
Similarity transformation A rigid motion followed by a dilation
Tape diagram A drawing that looks like a segment of tape used to illustrate number relationships Also known as a strip diagram bar model fraction strip or length model
Terminating decimal A decimal is called terminating if its repeating digit is 0
Third quartile For a data set with median M the third quartile is the median of the data values greater than M Example For the data set 2 3 6 7 10 12 14 15 22 120 the third quartile is 15 See also median first quartile interquartile range
Transitivity principle for indirect measurement If the length of object A is greater than the length of object B and the length of object B is greater than the length of object C then the length of object A is greater than the length of object C This principle applies
53
Keansburg School DistrictCurriculum System
Mathematicsto measurement of other quantities as well
Uniform probability model A probability model which assigns equal probability to all outcomes See also probability model
Vector A quantity with magnitude and direction in the plane or in space defined by an ordered pair or triple of real numbers
Visual fraction model A tape diagram number line diagram or area model
Whole numbers The numbers 0 1 2 3 hellip5
54
- MissionVision Statement
- Beliefs
- Measurement amp Data
- Measure lengths and by iterating length units
- Tell and write time
- Represent and interpret data
- Geometry
- Reason with shapes and their attributes
- Number and Base Ten
- Extend the counting sequence
- Understand place value
-
- Measurement amp Data (II)
-
- Measure lengths and by iterating length units
- Tell and write time
-
- Represent and interpret data
- Geometry (II)
- Reason with shapes their attributes
-
- Number and Base Ten
- Use place value understanding and properties of operations to add and subtract
- Teacher will cover up specific numbers on an enlarged number grid using cover up tape to have students identify numbers before and after Students will come up and write the missing numbers
- Students will play ldquoI have__ Who has __ Teacher will create cards using index cards and numbers in which students need further practice with Students will read their cards aloud Variations of game can include identifying specific numbers identifying numbers more or less etc)
- Students will use base ten blocks to represent numbers including three digit numbers Students will identify representation of numbers through these manipulatives They may match the representation to the written number
- Students will write the number they created using the base ten blocks using their white boards and markers
- Students will arrange given digits to create the greatest and lowest possible numbers They can show each number they create using base ten blocks
- Students will use the Base Ten Exchange Game to show an understanding of exchanging ones for tens and tens for hundreds Students can use place value mats base ten blocks (cubes tens and flats) Students can take number of cubes displayed with roll of single die Students will determine when exchanging can be made when reaching ten units
- Base ten concentration wwwk-5mathteachingresourcescom
- Ten frame compare wwwk-5mathteachingresourcescom
-
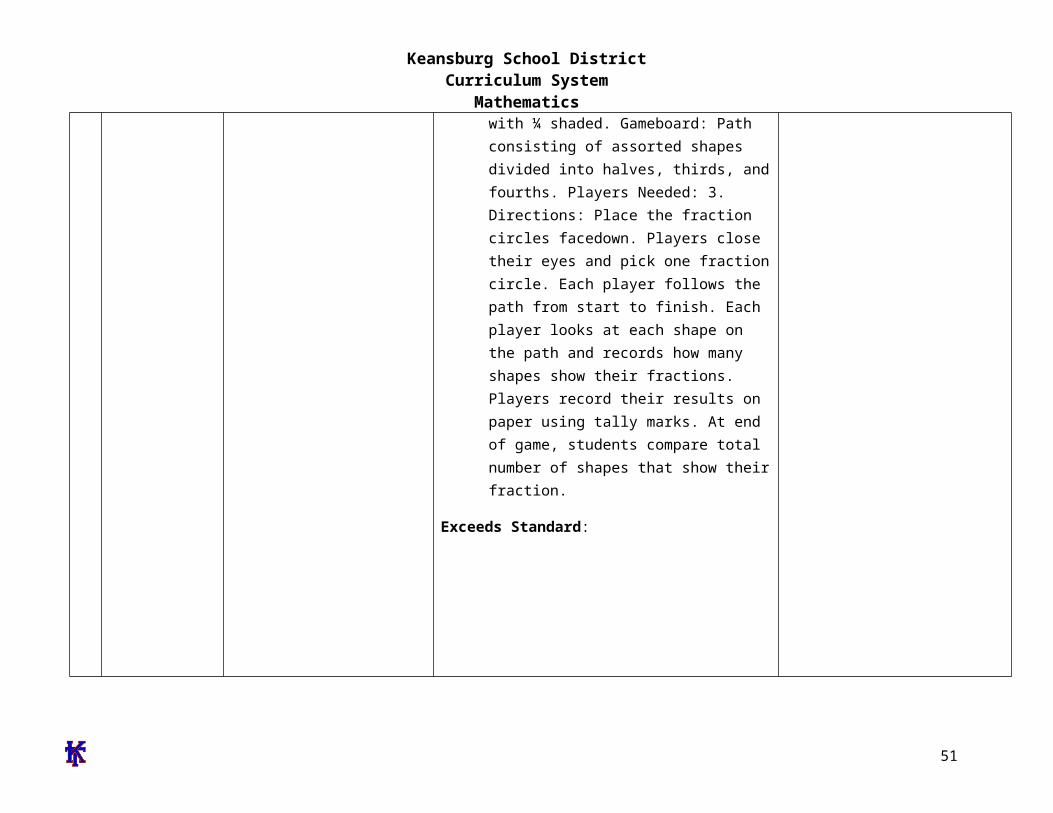
Keansburg School DistrictCurriculum System
Mathematicsall over again One can find the total by counting onmdashpointing to the top book and saying ldquoeightrdquo following this with ldquonine ten eleven There are eleven books nowrdquo
Dot plot See line plot
Dilation A transformation that moves each point along the ray through the point emanating from a fixed center and multiplies distances from the center by a common scale factor
Expanded form A multi-digit number is expressed in expanded form when it is written as a sum of single-digit multiples of powers of ten For example 643 = 600 + 40 + 3
Expected value For a random variable the weighted average of its possible values with weights given by their respective probabilities
First quartile For a data set with median M the first quartile is the median of the data values less than M Example For the data set 1 3 6 7 10 12 14 15 22 120 the first quartile is 62 See also median third quartile interquartile range
Fraction A number expressible in the form ab where a is a whole number and b is a positive whole number (The word fraction in these standards always refers to a non-negative number) See also rational number
Identity property of 0 See Table 3 in this Glossary
Independently combined probability models Two probability models are said to be combined independently if the probability of each ordered pair in the combined model equals the product of the original probabilities of the two individual outcomes in the ordered pair
Integer A number expressible in the form a or ndasha for some whole number a
Interquartile Range A measure of variation in a set of numerical data the interquartile range is the distance between the first and third quartiles of the data set Example For the data set 1 3 6 7 10 12 14 15 22 120 the interquartile range is 15 ndash 6 = 9 See also first quartile third quartile
Line plot A method of visually displaying a distribution of data values where each data value is shown as a dot or mark above a number line Also known as a dot plot3
51
Keansburg School DistrictCurriculum System
MathematicsMean A measure of center in a set of numerical data computed by adding the values in a list and then dividing by the number of values in the list4 Example For the data set 1 3 6 7 10 12 14 15 22 120 the mean is 21
Mean absolute deviation A measure of variation in a set of numerical data computed by adding the distances between each data value and the mean then dividing by the number of data values Example For the data set 2 3 6 7 10 12 14 15 22 120 the mean absolute deviation is 20
Median A measure of center in a set of numerical data The median of a list of values is the value appearing at the center of a sorted version of the listmdashor the mean of the two central values if the list contains an even number of values Example For the data set 2 3 6 7 10 12 14 15 22 90 the median is 11
Midline In the graph of a trigonometric function the horizontal line halfway between its maximum and minimum values
Multiplication and division within 100 Multiplication or division of two whole numbers with whole number answers and with product or dividend in the range 0-100 Example 72 divide 8 = 9
Multiplicative inverses Two numbers whose product is 1 are multiplicative inverses of one another Example 34 and 43 are multiplicative inverses of one another because 34 times 43 = 43 times 34 = 1
Number line diagram A diagram of the number line used to represent numbers and support reasoning about them In a number line diagram for measurement quantities the interval from 0 to 1 on the diagram represents the unit of measure for the quantity
Percent rate of change A rate of change expressed as a percent Example if a population grows from 50 to 55 in a year it grows by 550 = 10 per year
Probability distribution The set of possible values of a random variable with a probability assigned to each
Properties of operations See Table 3 in this Glossary
Properties of equality See Table 4 in this Glossary
Properties of inequality See Table 5 in this Glossary
Properties of operations See Table 3 in this Glossary
52
Keansburg School DistrictCurriculum System
MathematicsProbability A number between 0 and 1 used to quantify likelihood for processes that have uncertain outcomes (such as tossing a coin selecting a person at random from a group of people tossing a ball at a target or testing for a medical condition)
Probability model A probability model is used to assign probabilities to outcomes of a chance process by examining the nature of the process The set of all outcomes is called the sample space and their probabilities sum to 1 See also uniform probability model
Random variable An assignment of a numerical value to each outcome in a sample space
Rational expression A quotient of two polynomials with a non-zero denominator
Rational number A number expressible in the form ab or ndash ab for some fraction ab The rational numbers include the integers
Rectilinear figure A polygon all angles of which are right angles
Rigid motion A transformation of points in space consisting of a sequence of one or more translations reflections andor rotations Rigid motions are here assumed to preserve distances and angle measures
Repeating decimal The decimal form of a rational number See also terminating decimal
Sample space In a probability model for a random process a list of the individual outcomes that are to be considered
Scatter plot A graph in the coordinate plane representing a set of bivariate data For example the heights and weights of a group of people could be displayed on a scatter plot5
Similarity transformation A rigid motion followed by a dilation
Tape diagram A drawing that looks like a segment of tape used to illustrate number relationships Also known as a strip diagram bar model fraction strip or length model
Terminating decimal A decimal is called terminating if its repeating digit is 0
Third quartile For a data set with median M the third quartile is the median of the data values greater than M Example For the data set 2 3 6 7 10 12 14 15 22 120 the third quartile is 15 See also median first quartile interquartile range
Transitivity principle for indirect measurement If the length of object A is greater than the length of object B and the length of object B is greater than the length of object C then the length of object A is greater than the length of object C This principle applies
53
Keansburg School DistrictCurriculum System
Mathematicsto measurement of other quantities as well
Uniform probability model A probability model which assigns equal probability to all outcomes See also probability model
Vector A quantity with magnitude and direction in the plane or in space defined by an ordered pair or triple of real numbers
Visual fraction model A tape diagram number line diagram or area model
Whole numbers The numbers 0 1 2 3 hellip5
54
- MissionVision Statement
- Beliefs
- Measurement amp Data
- Measure lengths and by iterating length units
- Tell and write time
- Represent and interpret data
- Geometry
- Reason with shapes and their attributes
- Number and Base Ten
- Extend the counting sequence
- Understand place value
-
- Measurement amp Data (II)
-
- Measure lengths and by iterating length units
- Tell and write time
-
- Represent and interpret data
- Geometry (II)
- Reason with shapes their attributes
-
- Number and Base Ten
- Use place value understanding and properties of operations to add and subtract
- Teacher will cover up specific numbers on an enlarged number grid using cover up tape to have students identify numbers before and after Students will come up and write the missing numbers
- Students will play ldquoI have__ Who has __ Teacher will create cards using index cards and numbers in which students need further practice with Students will read their cards aloud Variations of game can include identifying specific numbers identifying numbers more or less etc)
- Students will use base ten blocks to represent numbers including three digit numbers Students will identify representation of numbers through these manipulatives They may match the representation to the written number
- Students will write the number they created using the base ten blocks using their white boards and markers
- Students will arrange given digits to create the greatest and lowest possible numbers They can show each number they create using base ten blocks
- Students will use the Base Ten Exchange Game to show an understanding of exchanging ones for tens and tens for hundreds Students can use place value mats base ten blocks (cubes tens and flats) Students can take number of cubes displayed with roll of single die Students will determine when exchanging can be made when reaching ten units
- Base ten concentration wwwk-5mathteachingresourcescom
- Ten frame compare wwwk-5mathteachingresourcescom
-
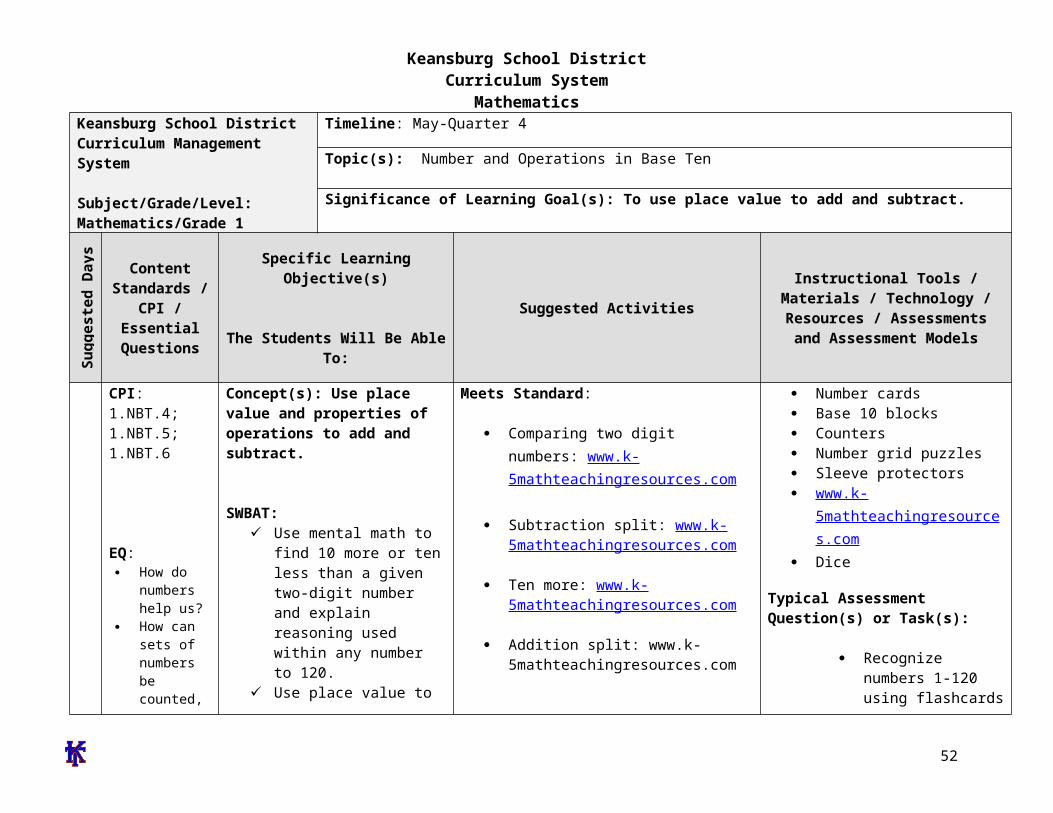
Keansburg School DistrictCurriculum System
MathematicsMean A measure of center in a set of numerical data computed by adding the values in a list and then dividing by the number of values in the list4 Example For the data set 1 3 6 7 10 12 14 15 22 120 the mean is 21
Mean absolute deviation A measure of variation in a set of numerical data computed by adding the distances between each data value and the mean then dividing by the number of data values Example For the data set 2 3 6 7 10 12 14 15 22 120 the mean absolute deviation is 20
Median A measure of center in a set of numerical data The median of a list of values is the value appearing at the center of a sorted version of the listmdashor the mean of the two central values if the list contains an even number of values Example For the data set 2 3 6 7 10 12 14 15 22 90 the median is 11
Midline In the graph of a trigonometric function the horizontal line halfway between its maximum and minimum values
Multiplication and division within 100 Multiplication or division of two whole numbers with whole number answers and with product or dividend in the range 0-100 Example 72 divide 8 = 9
Multiplicative inverses Two numbers whose product is 1 are multiplicative inverses of one another Example 34 and 43 are multiplicative inverses of one another because 34 times 43 = 43 times 34 = 1
Number line diagram A diagram of the number line used to represent numbers and support reasoning about them In a number line diagram for measurement quantities the interval from 0 to 1 on the diagram represents the unit of measure for the quantity
Percent rate of change A rate of change expressed as a percent Example if a population grows from 50 to 55 in a year it grows by 550 = 10 per year
Probability distribution The set of possible values of a random variable with a probability assigned to each
Properties of operations See Table 3 in this Glossary
Properties of equality See Table 4 in this Glossary
Properties of inequality See Table 5 in this Glossary
Properties of operations See Table 3 in this Glossary
52
Keansburg School DistrictCurriculum System
MathematicsProbability A number between 0 and 1 used to quantify likelihood for processes that have uncertain outcomes (such as tossing a coin selecting a person at random from a group of people tossing a ball at a target or testing for a medical condition)
Probability model A probability model is used to assign probabilities to outcomes of a chance process by examining the nature of the process The set of all outcomes is called the sample space and their probabilities sum to 1 See also uniform probability model
Random variable An assignment of a numerical value to each outcome in a sample space
Rational expression A quotient of two polynomials with a non-zero denominator
Rational number A number expressible in the form ab or ndash ab for some fraction ab The rational numbers include the integers
Rectilinear figure A polygon all angles of which are right angles
Rigid motion A transformation of points in space consisting of a sequence of one or more translations reflections andor rotations Rigid motions are here assumed to preserve distances and angle measures
Repeating decimal The decimal form of a rational number See also terminating decimal
Sample space In a probability model for a random process a list of the individual outcomes that are to be considered
Scatter plot A graph in the coordinate plane representing a set of bivariate data For example the heights and weights of a group of people could be displayed on a scatter plot5
Similarity transformation A rigid motion followed by a dilation
Tape diagram A drawing that looks like a segment of tape used to illustrate number relationships Also known as a strip diagram bar model fraction strip or length model
Terminating decimal A decimal is called terminating if its repeating digit is 0
Third quartile For a data set with median M the third quartile is the median of the data values greater than M Example For the data set 2 3 6 7 10 12 14 15 22 120 the third quartile is 15 See also median first quartile interquartile range
Transitivity principle for indirect measurement If the length of object A is greater than the length of object B and the length of object B is greater than the length of object C then the length of object A is greater than the length of object C This principle applies
53
Keansburg School DistrictCurriculum System
Mathematicsto measurement of other quantities as well
Uniform probability model A probability model which assigns equal probability to all outcomes See also probability model
Vector A quantity with magnitude and direction in the plane or in space defined by an ordered pair or triple of real numbers
Visual fraction model A tape diagram number line diagram or area model
Whole numbers The numbers 0 1 2 3 hellip5
54
- MissionVision Statement
- Beliefs
- Measurement amp Data
- Measure lengths and by iterating length units
- Tell and write time
- Represent and interpret data
- Geometry
- Reason with shapes and their attributes
- Number and Base Ten
- Extend the counting sequence
- Understand place value
-
- Measurement amp Data (II)
-
- Measure lengths and by iterating length units
- Tell and write time
-
- Represent and interpret data
- Geometry (II)
- Reason with shapes their attributes
-
- Number and Base Ten
- Use place value understanding and properties of operations to add and subtract
- Teacher will cover up specific numbers on an enlarged number grid using cover up tape to have students identify numbers before and after Students will come up and write the missing numbers
- Students will play ldquoI have__ Who has __ Teacher will create cards using index cards and numbers in which students need further practice with Students will read their cards aloud Variations of game can include identifying specific numbers identifying numbers more or less etc)
- Students will use base ten blocks to represent numbers including three digit numbers Students will identify representation of numbers through these manipulatives They may match the representation to the written number
- Students will write the number they created using the base ten blocks using their white boards and markers
- Students will arrange given digits to create the greatest and lowest possible numbers They can show each number they create using base ten blocks
- Students will use the Base Ten Exchange Game to show an understanding of exchanging ones for tens and tens for hundreds Students can use place value mats base ten blocks (cubes tens and flats) Students can take number of cubes displayed with roll of single die Students will determine when exchanging can be made when reaching ten units
- Base ten concentration wwwk-5mathteachingresourcescom
- Ten frame compare wwwk-5mathteachingresourcescom
-
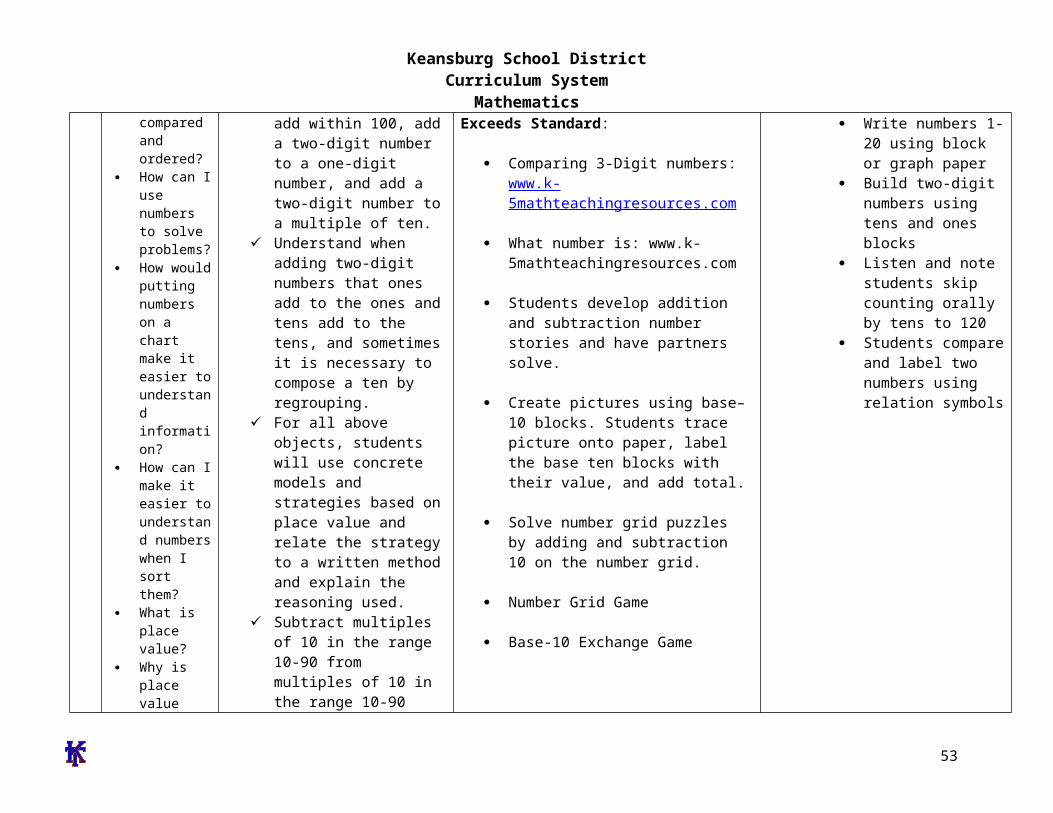
Keansburg School DistrictCurriculum System
Mathematicsto measurement of other quantities as well
Uniform probability model A probability model which assigns equal probability to all outcomes See also probability model
Vector A quantity with magnitude and direction in the plane or in space defined by an ordered pair or triple of real numbers
Visual fraction model A tape diagram number line diagram or area model
Whole numbers The numbers 0 1 2 3 hellip5
54
- MissionVision Statement
- Beliefs
- Measurement amp Data
- Measure lengths and by iterating length units
- Tell and write time
- Represent and interpret data
- Geometry
- Reason with shapes and their attributes
- Number and Base Ten
- Extend the counting sequence
- Understand place value
-
- Measurement amp Data (II)
-
- Measure lengths and by iterating length units
- Tell and write time
-
- Represent and interpret data
- Geometry (II)
- Reason with shapes their attributes
-
- Number and Base Ten
- Use place value understanding and properties of operations to add and subtract
- Teacher will cover up specific numbers on an enlarged number grid using cover up tape to have students identify numbers before and after Students will come up and write the missing numbers
- Students will play ldquoI have__ Who has __ Teacher will create cards using index cards and numbers in which students need further practice with Students will read their cards aloud Variations of game can include identifying specific numbers identifying numbers more or less etc)
- Students will use base ten blocks to represent numbers including three digit numbers Students will identify representation of numbers through these manipulatives They may match the representation to the written number
- Students will write the number they created using the base ten blocks using their white boards and markers
- Students will arrange given digits to create the greatest and lowest possible numbers They can show each number they create using base ten blocks
- Students will use the Base Ten Exchange Game to show an understanding of exchanging ones for tens and tens for hundreds Students can use place value mats base ten blocks (cubes tens and flats) Students can take number of cubes displayed with roll of single die Students will determine when exchanging can be made when reaching ten units
- Base ten concentration wwwk-5mathteachingresourcescom
- Ten frame compare wwwk-5mathteachingresourcescom
-