SimplyMap 2.0 November 8, 2011 Janina Mueller. Mapping Census Data.

© 2008 The AuthorsJournal Compilation © 2008 Blackwell Publishing Ltd
Geography Compass 2/6 (2008): 2011–2039, 10.1111/j.1749-8198.2008.00167.x
Web Mapping 2.0: The Neogeography of the GeoWeb
Muki Haklay1*, Alex Singleton1 and Chris Parker2
1University College London2Ordnance Survey
AbstractThe landscape of Internet mapping technologies has changed dramatically since2005. New techniques are being used and new terms have been invented and enteredthe lexicon such as: mash-ups, crowdsourcing, neogeography and geostack. Awhole range of websites and communities from the commercial Google Maps tothe grassroots OpenStreetMap, and applications such as Platial, also have emerged.In their totality, these new applications represent a step change in the evolutionof the area of Internet geographic applications (which some have termed theGeoWeb). The nature of this change warrants an explanation and an overview, asit has implications both for geographers and the public notion of Geography. Thisarticle provides a critical review of this newly emerging landscape, starting withan introduction to the concepts, technologies and structures that have emergedover the short period of intense innovation. It introduces the non-technicalreader to them, suggests reasons for the neologism, explains the terminology, andprovides a perspective on the current trends. Case studies are used to demonstratethis Web Mapping 2.0 era, and differentiate it from the previous generation ofInternet mapping. Finally, the implications of these new techniques and thechallenges they pose to geographic information science, geography and society atlarge are considered.
1 Introduction
From an early start over 15 years ago, the use of the Internet to delivergeographic information and maps is burgeoning. However, within thisperiod, there has been a step change in the number of users and moreimportantly in the nature of applications that, in their totality, are nowtermed ‘The Geographic World Wide Web’ or ‘the GeoWeb’. The numberof visitors to public Web mapping sites provides an indication of thischange. In mid-2005, the market leader in the UK (Multimap) attracted7.3 million visitors and, in the USA, Mapquest was used by 47 millionvisitors. By the end of 2007, Google Maps was used by 71.5 million andGoogle Earth by 22.7 million (Wall Street Journal 2007). Moreover, bymid-2007, there were over 50,000 new websites that are based on Google

2012 Web Mapping 2.0 and neogeography
© 2008 The Authors Geography Compass 2/6 (2008): 2011–2039, 10.1111/j.1749-8198.2008.00167.xJournal Compilation © 2008 Blackwell Publishing Ltd
Maps (Tran 2007) whereas in the previous era of Internet mapping, thenumber of mapping websites was significantly smaller due to technical andfinancial barriers.
This dramatic landscape change is accompanied by neologism of itsown.1 New terms are being coined to describe new techniques that arebeing used such as: map mash-ups, crowdsourcing, mapping applicationprogramming interfaces (API), neogeography, geostack, tags, geotechnologiesand folksonomies. These rapid developments in Web mapping andgeographic information use are enabled and facilitated by global trends inthe way individuals and communities are using the Internet and newtechnologies to create, develop, share and use information (including geo-graphic information), through innovative, often collaborative, applications.The term ‘Web 2.0’ is frequently used to describe these trends and wasfirst coined by Tim O’Reilly on 30 September 2005 at the first Web 2.0Conference. He later clarified his definition as:
Web 2.0 is the business revolution in the computer industry caused by themove to the Internet as platform, and an attempt to understand the rules forsuccess on that new platform. (O’Reilly 2006)
The term ‘Geospatial Web’ implies the merging of geographic (location-based) information with the abstract information that currently dominatesthe Internet. Notice that while the term ‘Geospatial’ has a long history(see Kohn 1970 for one of the first uses of the term), it has gainedincreasing popularity within the recent past to describe computer handlingof geographic information. There has been an increased awareness bynumerous Web 2.0 technologists of the importance of geography andlocation as a means to index and access information over the Internet. Asa result, over the last few years, geographic information could be arguedto have firmly entered the mainstream information economy. We will usethe term ‘Web Mapping 2.0’ to describe this new phase in the evolutionof the geospatial Web. As Goodchild (2007a, 27) noted,
[T]he early Web was primarily one-directional, allowing a large number ofusers to view the contents of a comparatively small number of sites, the newWeb 2.0 is a bi-directional collaboration in which users are able to interactwith and provide information to central sites, and to see that informationcollated and made available to others.
The purpose of this article is to provide the non-technical reader with areview of this short period of intense innovation, which is rapidly changingthe Web mapping landscape. This will review the historical growth ofWeb mapping and an introduction to the latest concepts, technologies andstructures; explain the characteristics and trends of Web Mapping 2.0supported by case studies; and discuss the implications and opportunitiesof these developments on geographic information science, geography,geographic information providers and society.

© 2008 The Authors Geography Compass 2/6 (2008): 2011–2039, 10.1111/j.1749-8198.2008.00167.xJournal Compilation © 2008 Blackwell Publishing Ltd
Web Mapping 2.0 and neogeography 2013
Noteworthy is the fact that the examples we are using are all UK-based.Development of Web 2.0 is happening across the globe, but severalimportant activities have occurred in the UK over the past few years. Forexample, the open geographic information project OpenStreetMap startedin London, and the Ordnance Survey is the first national mapping agencyto release a Web-based open application programming interface for theuse of its products.
Before turning to the body of the article, it is worth outlining the coreof our argument. As the discussion below will show, the recent changeshave not created new functionality in geographic information delivery.Internet-based information delivery has a 15-year history and, for example,the functionality that allows the integration of information from multiplewebsites (mash-up) was possible by utilising the Open Geospatial Consor-tium (OGC) standards since 2000. The concept of the geostack – themultiple technological components that allow collecting, storing and sharinggeographic information – has been appearing in the literature for almost40 years as geographic information system (GIS) (see Kohn 1970) or in itsInternet incarnation in the OGC documentation. Thus, the change is notof increased functionality, rather how emerging technologies have creatednew approaches to geographic information distribution and, most impor-tantly, in the usability and ease of application development. Previousreviews (Plewe 2007; Tsou 2005; Turner 2006) have provided a goodintroduction to the technical developments; however, they have notexplained the consequences of these changes. The aim of this article is tocombine the technical and societal analysis to explain the emergence ofWeb Mapping 2.0 and, more importantly, why the concept of neogeo-graphy emerged.
2 The GeoWeb – the First Decade
Internet mapping started early after the emergence of the World WideWeb (WWW or Web) with the introduction of the Xerox PARC MapViewer in 1993 (Putz 1994). This application provided very rudimentarycapabilities – the ability to present a map of the world, zooming atpredefined scales and controlling the visibility of rivers and border features.
Technically, the ability of the WWW at this time was to create a Webpage (a Hypertext Markup Language or HTML file) in which an imagefile is embedded. The interaction between the user and the map wasimplemented by a computer code (a Common Gateway Interface or CGIscript), which ran on the Web server. Each time the user clicked on oneof the links on the page, the user’s Web browser sent a request to theserver. The request encoded in it the coordinates of the area that the userwas interested in and other options such as the layers that were to bedisplayed. Once the server received the request, it would execute the CGIscript, which would produce the HTML page and the associated image

2014 Web Mapping 2.0 and neogeography
© 2008 The Authors Geography Compass 2/6 (2008): 2011–2039, 10.1111/j.1749-8198.2008.00167.xJournal Compilation © 2008 Blackwell Publishing Ltd
file that presented the new map, and then transfer these files over theInternet to the user’s computer. Once the files were received, the user’sbrowser would render them and show them on the computer’s screen.
This interaction mode led to a delay of a few seconds between theuser’s action (the click on the map) and the rendering of the map on thescreen, with a visible refresh of the whole browser window when the newpage was downloaded. This interaction model was the core of most of theWeb mapping applications for the next decade. Figure 1 provides anexample of a process of digitising an area object on an Internet mappingsite, using this interaction mode.
The early 1990s saw a very rapid increase in the development of deliverymechanisms for geographic information and mapping over the Internetand the WWW. While Doyle et al. (1998), Plewe (1997), and Peng andTsou (2003) provide a comprehensive review of these developments,Plewe (2007) is especially valuable in identifying four technical eras in the
Fig. 1. Digitising of area over the Internet – transactions between client and server.

© 2008 The Authors Geography Compass 2/6 (2008): 2011–2039, 10.1111/j.1749-8198.2008.00167.xJournal Compilation © 2008 Blackwell Publishing Ltd
Web Mapping 2.0 and neogeography 2015
development of Internet mapping. In order of increasing complexity, usersaccessed Web mapping by three main methods: public mapping sites, Web(or Internet) Mapping Servers, and more sophisticated Geographic WebServices.
The most popular mode of Web mapping provision was through publicmapping sites. In the UK, Multimap.com was developed in 1995 todeliver maps to mobile phones, but ended with a highly successful publicmapping site, which was launched in 1996 (Parker 2005). In the sameyear, MapQuest was launched in the USA (Peterson 1997). Other similarwebsites included Streetmap, Yahoo! Maps, Microsoft’s MapPoint, andMap24. The main characteristics of all these services are that they provideaccess to simple queries about locations and directions. The user couldexplore the map image through options to scroll the map by clicking onareas at the edge of the map. A similar procedure enabled the user tozoom in and out. Figure 2 shows the Multimap website circa 2005.
By and large, the services were limited to information preloaded by theprovider and allowed little customisation by end users. Furthermore, asFigure 2 illustrates, most of the maps were restricted in size due to limi-tations in the end user’s computer monitor resolution and other demandson the design of a page such as advertisements. In addition, the image filecontaining the map tended to be bigger in size than the Web page that
Fig. 2. Multimap website, early 2005.

2016 Web Mapping 2.0 and neogeography
© 2008 The Authors Geography Compass 2/6 (2008): 2011–2039, 10.1111/j.1749-8198.2008.00167.xJournal Compilation © 2008 Blackwell Publishing Ltd
contained it. Therefore, network latency coupled with the limited datatransfer capacity (bandwidth) of the end users’ dial-up modems encourageddevelopers to minimise the size of the map.
Noteworthy is the impact of all these factors on the use of Web map-ping sites – from the user’s perspective, the process was slow and thereforethe experience not especially pleasurable, so the websites were used in alimited way without detailed exploration of the map.
The ability to deliver maps over the Internet was also important fororganisations who wanted to use their own datasets and create applicationswith sophisticated analytical capabilities. Here, most GIS vendors offeredWeb Mapping Server (WMS) software that could be installed on a localWeb server. The way in which the mapping information was delivered tothe user varied from relying on the capabilities of the browser similar topublic mapping websites, to downloaded software that needed installationbefore the user could view the data and extended the capabilities of thebrowser (Peng and Tsou 2003). These applications borrowed their inter-action metaphors from desktop GIS and, therefore, required the user tofamiliarise themselves with the application before they could use it. AsTraynor and Williams (1995) noted, the terminology in GIS borrows frommultiple disciplines, and this creates a major obstacle for new users. Anexample for this type of application is provided in Figure 3 which shows
Fig. 3. UK Environment Agency website 2002.

© 2008 The Authors Geography Compass 2/6 (2008): 2011–2039, 10.1111/j.1749-8198.2008.00167.xJournal Compilation © 2008 Blackwell Publishing Ltd
Web Mapping 2.0 and neogeography 2017
such an application from 2002, created by the UK Environment Agencyto provide environmental information to the public. Notice the especiallysmall area of the map and the use of GIS terminology in the interface(data layers, query layer, zoom in, zoom out, etc.). In order to query themap, the user needs to select the layer to be queried, and also the option‘What’s that on the map?’ – a rather complex operation.
While the Web Mapping Servers were designed to allow browsing,searching, downloading and rudimentary editing capabilities, the need forhighly sophisticated services over the Internet was covered by GeographicWeb Services software (such as ESRI’s ArcServer). This class of softwareallowed the use of high-end analytical capabilities (for an example of suchan application, see Simao et al. forthcoming). However, Geographic WebServices are beyond the scope of this article, and for a complete discussion,see Tang and Selwood (2003). What is important to note is that, similarto WMS, the end-user interface was complex and sophisticated.
The OGC standards are the final elements of the GeoWeb that it isimportant to understand before turning to Web Mapping 2.0.
With its origins in the mid-1990s, the OGC (www.opengeospatial.org) becamea significant force in the GIS arena by setting standards for interoperability(Peng and Tsou 2003), thus allowing users of GIS to share data andprocessing, and use software and data from a wide range of providers. Thisis significant because of those high costs associated with data in terms ofacquisition and manipulation for a specific task. Therefore, it is veryimportant that an organisation can use software and data from differentsources without costly and complex data conversion procedures. Commonstandards for integration of data and software provide the needed bridgethat enables such interoperability.
Since 2000, the OGC has developed a set of standards for Web map-ping. The first was the Web Mapping Service specifications (OGC 2000).These allowed WMS software to publish geographic information storedon multiple servers, often in disparate locations, and in a format that wassuitable for further processing by multiple software that adopted the OGCstandards. This ability was significant, as it realised the possibility of rapidlyproducing a map through the aggregation of readily available informationto provide a new service. An example exercise used in the developmentof the standard focused on how information from meteorological remotesensing satellites could be integrated with information about populationto provide an early warning of hurricanes (Gawne-Cain and Holcroft2000). In the years that have passed since the introduction of the OGCWeb Mapping Service specifications, many software products that arecompatible with the standard have appeared in the marketplace. However,the utilisation of real-world complex WMS applications remains thedomain of GIS experts in specialised areas. This lack of adoption can bepartially associated with the technical complexity of the standards. Froman end user’s perspective, the standards are confusing and do not necessarily
2018 Web Mapping 2.0 and neogeography
© 2008 The Authors Geography Compass 2/6 (2008): 2011–2039, 10.1111/j.1749-8198.2008.00167.xJournal Compilation © 2008 Blackwell Publishing Ltd
meet user needs. Finally, many of the implementations were slow and didnot provide an effective experience.
In summary, until about 2005, delivery of geographic information andGIS capabilities over the Internet was possible and increasingly moresophisticated but a combination of factors limited their use. Developingan Internet-based mapping application remained complex, and this limitedthe number of developers and kept the cost of Web mapping high. Impor-tantly, as most of these Internet mapping applications rely on somebackground cartography, this required purchasing expensive backgroundmaps outside the USA, or, even where public domain geographic informationare available (USA), a significant knowledge in manipulating these datasetsand preparing them for delivery is required.
Finally, from an end user perspective, the delivery of geographic infor-mation in a graphical form was limited due to network bandwidth,especially as when these standards were first introduced many users werestill using dial-up links to the Internet.
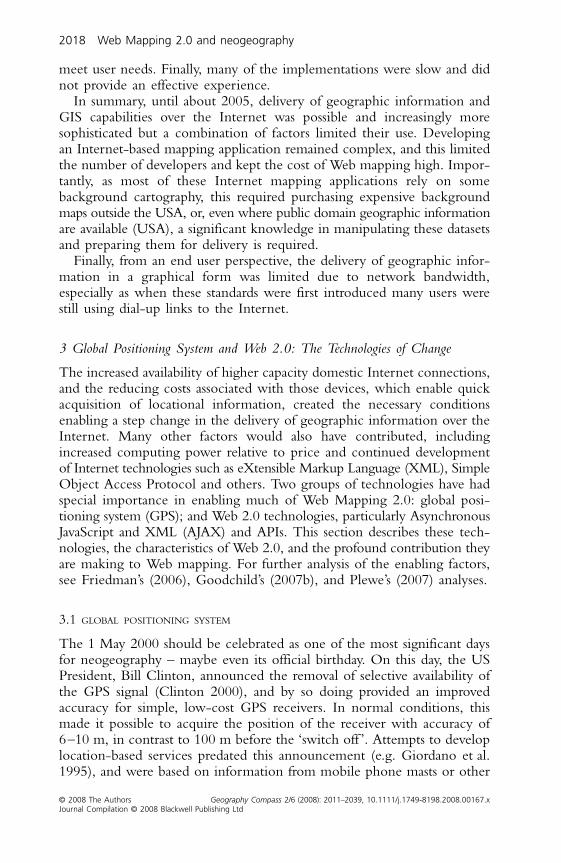
3 Global Positioning System and Web 2.0: The Technologies of Change
The increased availability of higher capacity domestic Internet connections,and the reducing costs associated with those devices, which enable quickacquisition of locational information, created the necessary conditionsenabling a step change in the delivery of geographic information over theInternet. Many other factors would also have contributed, includingincreased computing power relative to price and continued developmentof Internet technologies such as eXtensible Markup Language (XML), SimpleObject Access Protocol and others. Two groups of technologies have hadspecial importance in enabling much of Web Mapping 2.0: global posi-tioning system (GPS); and Web 2.0 technologies, particularly AsynchronousJavaScript and XML (AJAX) and APIs. This section describes these tech-nologies, the characteristics of Web 2.0, and the profound contribution theyare making to Web mapping. For further analysis of the enabling factors,see Friedman’s (2006), Goodchild’s (2007b), and Plewe’s (2007) analyses.
3.1 GLOBAL POSITIONING SYSTEM
The 1 May 2000 should be celebrated as one of the most significant daysfor neogeography – maybe even its official birthday. On this day, the USPresident, Bill Clinton, announced the removal of selective availability ofthe GPS signal (Clinton 2000), and by so doing provided an improvedaccuracy for simple, low-cost GPS receivers. In normal conditions, thismade it possible to acquire the position of the receiver with accuracy of6–10 m, in contrast to 100 m before the ‘switch off ’. Attempts to developlocation-based services predated this announcement (e.g. Giordano et al.1995), and were based on information from mobile phone masts or other

© 2008 The Authors Geography Compass 2/6 (2008): 2011–2039, 10.1111/j.1749-8198.2008.00167.xJournal Compilation © 2008 Blackwell Publishing Ltd
Web Mapping 2.0 and neogeography 2019
beacons. However, these methods had not gained much market share dueto technical complexity or lack of coverage. By mid-2001, it was possibleto purchase a receiver unit for about US$100 (Hightower and Borriello2001). These receivers enabled more people than ever before to collectinformation about different locations and upload this information to theircomputers. However, until 2002, when an interchange standard (GPX)was published, the sharing of this information was a complicated task thatrequired computing and data manipulation knowledge. The GPX standardhas been rapidly adopted by most developers of GPS systems and by 2004it had become commonplace (Foster 2004).
3.2 WEB 2.0 TECHNOLOGIES AND AJAX
The GPX belongs to a class of standards and technologies that providesthe infrastructure for what came to be known as Web 2.0. The impactsof Web 2.0 can be considered in terms of the underpinning technologiesand the characteristics of application development and use they enable.While initial popular use of the Web was characterised by websites thatenabled the distribution of information in new ways but with a limitedinteraction, the technologies of Web 2.0 provide a far richer user inter-action and experience. Several factors have provided a platform for thesenew applications. First, as a result of the Dot Com bubble of the late1990s, a massive data transfer capacity became available at very low costs,enabling the proliferation of broadband services to home users. Second,technology companies developed standards that allowed the transfer ofinformation between distributed systems in different locations. This familyof standards (including OGC standards and GPX) were based on XML.Another innovation, which integrates XML-based standards and allowsthe development of sophisticated applications, is the AJAX (for an accessibleexplanation of these developments and their lineage, see Friedman 2006,pp. 51–93). As Zucker (2007) notes, the most important innovation inAJAX is in the ability to fetch information from a remote server inanticipation of the user’s action and provide interaction without the needto refresh the whole Web page. This changes the user experience dramaticallyand makes the Web application more similar to a desktop applicationwhere the interaction mode is smooth. A decade earlier, this was possiblethrough the use of additional software but, as the embedded applicationwas not an integral part of the Web page, the experience of using themapping application was not very satisfying because it forced the user tolearn another set of interaction rules in addition to the main modes thatare common on the Web (see also Tsou 2005). AJAX-based geographicalapplications look and feel very different. First, the area of the screen thatis served by the map has increased dramatically, thus improving the usabilityof Web mapping significantly (Haklay and Zafiri 2007; Skarlatidou andHaklay 2006). Second, the ability to interact within the browser’s window

2020 Web Mapping 2.0 and neogeography
© 2008 The Authors Geography Compass 2/6 (2008): 2011–2039, 10.1111/j.1749-8198.2008.00167.xJournal Compilation © 2008 Blackwell Publishing Ltd
changed the mode from the ‘click-and-wait-for-a-page-refresh’ to directmanipulation of the map – a mode of interaction familiar in other desktopapplications, and more akin to desktop GIS.
3.3 APPLICATION PROGRAMMING INTERFACE
A third technological difference that has direct relevance to the discussionhere is the appearance of APIs. In the first decade of Web mapping, thedevelopment of a well-functioning WMS application (such as MapServeror ArcIMS) required significant knowledge in programming and servermanagement. Even packages like Manifold GIS or Microsoft’s MapPoint,which used a generic Web programming framework, required significantinvestment in developer time to learn how to use their functionality.In addition, through the API, users have access to centralised pools of veryhigh-resolution background geographic data including maps, satellite data,street photography and building outlines. APIs are relatively easy to use andhave made application development more accessible, thus enabling a far largercommunity of people who could create, share and mash up (geographic)information as illustrated in the examples we give in the next section.
We argue that the technologies outlined in this section have encourageda far wider adoption of the use of geographic applications because finally,after a decade of development, Web mapping has been given simpler toolsthat, when deployed, enable a more pleasurable and effective user experience.Unlike the previous generation of Web mapping sites, the mode of inter-action, the speed of the response and the ability to experiment with newways of integrating geographic information with other types of informationhas encouraged many programmers and users to utilise geographic infor-mation in their applications. These technologies have provided theingredients for a new type of Web mapping.
4 The Emergence of Neogeography
Central to Web Mapping 2.0 is the concept of neogeography. The termis attributed to Di-Ann Eisnor (2006) of Platial.com – ‘a socially networkedmapping platform which makes it easy to find, create, share, and publishmaps and places’ and the essence of neogeography according to Turner:
Neogeography means ‘new geography’ and consists of a set of techniques andtools that fall outside the realm of traditional GIS, Geographic InformationSystems. Where historically a professional cartographer might use ArcGIS, talkof Mercator versus Mollweide projections, and resolve land area disputes, aneogeographer uses a mapping API like Google Maps, talks about GPX versusKML, and geotags his photos to make a map of his summer vacation.
Essentially, Neogeography is about people using and creating their ownmaps, on their own terms and by combining elements of an existing toolset.

© 2008 The Authors Geography Compass 2/6 (2008): 2011–2039, 10.1111/j.1749-8198.2008.00167.xJournal Compilation © 2008 Blackwell Publishing Ltd
Web Mapping 2.0 and neogeography 2021
Neogeography is about sharing location information with friends and visitors,helping shape context, and conveying understanding through knowledge ofplace.
Lastly, Neogeography is fun . . . (Turner 2006, 2–3)
The contrast offered in this definition is between perceived tedious, slow,boring and expensive practices of cartographers and geographers, andenjoyable, rule breaking and relevant uses of geographic information bylaypersons. As will be discussed later, this disregard to past practices is partof the zeitgeist that is central to Web Mapping 2.0.
The advent of the above technologies and standards discussed in theprevious section have led to the emergence of numerous neogeographyapplications which utilise the Google, Yahoo and Microsoft (GYM) mappingAPIs to create rich geographic websites.
An early example appeared a few weeks after Google released theirmapping service in 2005. Paul Radamacher developed a new site thatmerged information from the San Francisco-based free small-ads websiteCraigslist with Google information in a site called HousingMaps (Tran 2007).This process of combining information from several websites and sourcesto produce a new Web service became known as a mash-up. Importantly,the speed of broadband connections allowed his server to connect toCraigslist and Google Maps servers and deliver the combined informationso quickly that from the end-user perspective the interaction was seamlessand pleasing. The simplicity of the Google Maps implementation enabledhim to reprogram it for his needs. Shortly afterwards, Google released anofficial API which made it even easier to develop and implement mappingapplications. As of June 2007, there were over 50,000 Google Maps mash-ups(Tran 2007). Importantly, most of the mash-ups are the equivalent of pushpins that have been located on a map, with some multimedia information– mostly text but sometime images or video clip – attached to the pin.
The APIs are a very significant enabling factor of Web Mapping 2.0applications, both in terms of providing mapping functionality and high-resolution background data. This was exemplified immediately followingHurricane Katrina in the USA in 2005. While OGC WMS specificationsprovided at least the same technical functionality as map mash-ups, it wasthe latter that were rapidly developed and used (Miller 2006). In the eventof this real disaster, the OGC specification languished: ‘. . . many, many[Geospatial] applications were built, only a handful support OGC stand-ards’ (OGC 2005). This admission was of particular irony considering, asnoted early, that the OGC specifications testbed scenario was a responseto a hurricane in southeastern USA (Gawne-Cain and Holcroft 2000).This failure can be attributed to the ease of use of Web Mapping 2.0 APIscompared to the relative complexity and obscurity of OGC standards.
Several different categories of neogeography mash-ups have emerged,which are differentiated by their methods of data collection: whether they

2022 Web Mapping 2.0 and neogeography
© 2008 The Authors Geography Compass 2/6 (2008): 2011–2039, 10.1111/j.1749-8198.2008.00167.xJournal Compilation © 2008 Blackwell Publishing Ltd
integrate data or services from other sources through an API, or whetherthey supply data back to the community through their own API.
Neogeography websites do not necessarily rely on user-generatedcontent to supply innovative services and instead some supply data whichthey collect from disparate or difficult to access sources. The core innova-tions in these websites are the methods by which they collect and packageinformation to enable other uses. An example of this type of website isNestoria (www.nestoria.com), which gathers information from numerousestate agents about the spatial location of properties for sale or rent in theUK and Spain. Visitors to the Nestoria website can enter their propertysearch requirements and the Nestoria application returns a list of propertiesfor sale matching these criteria and displays them as push pins on top ofa Google map. Nestoria also provides an API to allow other websites touse their property database or integrate it with a Geobrowser like GoogleEarth.
Neogeography examples also include innovative uses of non-mappingwebsites to display spatial information. Flickr (www.flickr.com) is a photo-sharing website where users can upload pictures and add metadata to apicture such as a description and ‘tags’. Tags are much like keywords fora journal article, describing the main topics covered within a paper. InFlickr, these can refer to the content of a picture, for example, a photo-graph of a bowl of fruit may have a tag of ‘fruit’, or can be created bydrawing boxes around elements within a picture. These tags appear whena viewer of an image hovers their cursor over a tagged area. A novel useof tags has appeared in the development of the ‘Memory Maps’ groupwithin Flickr. In this, users upload screen shots taken from Google Mapsand then annotate them with tags detailing memories people have aboutthese areas (Figure 4).
Another way to use tags is by georeferencing an image with geographiccoordinates, in a process called geotagging. On Flickr, this can be doneby dragging the image to a location on a map, or through the use ofGPX files. As with other neogeography jargon, geotagging is not addinganything new, apart from being Web specific, as the term geocoding hasbeen widely used for over 40 years to describe the association of a pieceof information with a location.
Tags form an important characteristic in Web 2.0 and allow users tocreate their own semantic categorisation of online content. These ‘Folk-sonomies’ (Vander Wal 2007) decentralise the formal classification of objectsinto fixed partitions, and instead use virtual classification schema based onmeta-information defined by users. Although this decentralisation ofinformation organisation may appear progressive, Weinberger (2007, 165)warns that these classifications can, however, mislead because ‘tags haveno context’. These folksonomies contrast to top-down taxonomies of spatialinformation (ontologies), which are created by experts (Fonseca et al. 2000).Tags have been utilised in neogeography applications in a number of

© 2008 The Authors Geography Compass 2/6 (2008): 2011–2039, 10.1111/j.1749-8198.2008.00167.xJournal Compilation © 2008 Blackwell Publishing Ltd
Web Mapping 2.0 and neogeography 2023
innovative ways: for example, the concept of Tag Clouds, which demon-strate the popularity of tags as a graphic visualisation where words scaledby their popularity have been extended through the development of ‘TagMaps’ (Slingsby et al. 2007) that represent the ‘importance’ and locationof geographically referenced text. The applications developed by Slingsbyet al. (2007) display a range of spatiotemporally referenced search engine searchterms (Figure 5) on top of Google Earth. The purpose of this visualisationtechnique is to present a summary of those activities being conducted byusers of the Internet across space and time by geographic areas.
5 Technologies of Cooperation and Web Mapping 2.0
Before turning to case studies that demonstrate specific applications thatdraw on Web Mapping 2.0-related technologies and characteristics, it isimportant to understand the social context of these developments.
Since the early 1990s, developments in computer-mediated communi-cation (CMC) have enabled groups of people to use networked computersto accomplish collaborative activities. Rheingold (1994, 110) discussed inrelation to early developments on the Internet that CMC enables peopleto ‘rediscover the power of cooperation, turning cooperation into a game,
Fig. 4. The First Flickr Memory Map (URL: http://www.flickr.com/photos/mathowie/8496262/).

2024 Web Mapping 2.0 and neogeography
© 2008 The Authors Geography Compass 2/6 (2008): 2011–2039, 10.1111/j.1749-8198.2008.00167.xJournal Compilation © 2008 Blackwell Publishing Ltd
a way of life – a merger of knowledge capital, social capital and communion’.Rheingold was not alone – books like The Cluetrain Manifesto (Levineet al. 2000), articles such as ‘Computer Networks as Social Network’(Wellman et al. 1996) and many others called for, and emphasised, the roleof the Internet and the Web in creating and sustaining social networks andsocial activities. Significantly, the interest in the use of networked computersfor accomplishing collaborative geographic tasks has been an integral partof GIScience over the same period, and there is now a substantive bodyof literature on collaborative GIS and geographic applications (see Balarmand Dragicevic 2006; Jankowski and Nyerges 2001) and discussion aboutthe geographic aspects of these virtual communities appear in numerousgeographic literatures since the 1990s (Batty 1997; Graham 1998; andmany others). Yet, until fairly recently, large-scale collaborative systems inwhich millions of users could share information were slow to emerge.
One infamous and early example is the Geocities website created in1994, which allowed users a free account to create a personal website. Atits height, it was one of the most popular websites on the Internet, with
Fig. 5. Interactive timelines for exploration. Tags are constrained to Friday night (top) andSaturday morning and early afternoon (bottom) (Source: Slingsby et al. 2007).

© 2008 The Authors Geography Compass 2/6 (2008): 2011–2039, 10.1111/j.1749-8198.2008.00167.xJournal Compilation © 2008 Blackwell Publishing Ltd
Web Mapping 2.0 and neogeography 2025
over 3.3 million users (Bassett and Wilbert 1999; Brown 2001). Due to arange of technical and organisational reasons combined with blunderssuch as overwhelming the sites with pop-up advertisements, the sitequickly deteriorated towards the end of the 1999 (see detailed analysis inBrown 2001). Geocities promoted claims of establishing a communityonline, and encouraged users to interact through online chat rooms andbulletin boards, but, at the end, the community had withered.
Increased bandwidth and connectivity options have increased thenumber of people with access to the Internet and ushered a new era indigital collaboration over the last 4 years. As Saveri et al. (2005) note, itis possible to identify a series of ‘technologies of collaboration’. Thesetechnologies are categorised as:
• Self-organising mesh networks: software and hardware objects that createnetworks through self-organisation and link between themselves auton-omously. Examples for these are peer-to-peer networks, in whichdifferent nodes in the network are using the resources of other nodesin order to accomplish a task. For example, file-sharing networks thatare used to exchange multimedia files such as music or video.
• Community computing grids: situations where people share computingresources among a group by voluntarily running applications on theircomputers, and exploiting unused computing capacity. The BarkleyOpen Infrastructure for Network Computing is one of the mostcommon software systems that allow such activities, and it has beenused to integrate thousands of home computers for modelling climatechange in an experiment which was run by the BBC and OxfordUniversity or in the search for extraterrestrial life in the SETI@homeproject. In both cases, by breaking up the tasks and spreading them overmany computers, it becomes possible to complete a computationallyintensive task within a reasonable time.
• Peer production networks: enabling people to work together on a specifictask, often without monetary remuneration. For example, these are oftenused in the development of open source software projects, which involvegroups of programmers and software designers working cooperatively,such as the creation of an operating system (Linux) or a GIS (GRASS).The term ‘volunteers’ has been used to describe the participants in suchactivities (see Goodchild 2007a).
• Social mobile computing: technologies allowing coherent activities amonga group of people, some of whom are complete strangers. An exampleis ‘smart mobs’ (Rheingold 2002) – groups of people gathering in agiven place at a given time through coordination via Short MessagingService on their mobile phones. The medium is used to coordinate anactivity by passing a message among groups of acquaintances, and thefinal gathering creates a specific social activity such as a public pillowfight or a more purposeful activity such as a political demonstration.

2026 Web Mapping 2.0 and neogeography
© 2008 The Authors Geography Compass 2/6 (2008): 2011–2039, 10.1111/j.1749-8198.2008.00167.xJournal Compilation © 2008 Blackwell Publishing Ltd
• Group-forming networks: technologies that allow subgroups to be formedand interact. Examples include groups of collectors on eBay, or usersof local bulletin board systems. Both social and personal interests aresupported through this technology.
• Social software: probably the most common sites classified as Web 2.0.Social networking sites such as Facebook (www.facebook.com) haveenabled users to build profiles that can be shared through ‘friend requests’,linking people from often disparate geographical locations into virtualplaces. These networks of individuals are dichotomous between real andvirtual acquaintances. Real acquaintances are those networks of peoplebuilt from real-life associations such as friends, family or work colleagues.Virtual acquaintances are made through a shared interest (e.g. the Face-book group ‘GIS rules and so do we’) or a common motivating goal.
• Social accounting tools: offering methods of establishing trust betweenusers. For example, the way in which sellers and buyers are rated oneBay to create confidence between strangers.
• Knowledge collectives: technologies that allow people to share informationand set the structures and rules of managing common resources. Examplesinclude wikis such as Wikipedia – shared areas where people can writeand keep information or Web logs (blogs) where people are sharingopinions about various issues.
In the description of these collaborative technologies, it is important tonote that the emphasis is moving away from isolated technology into theembodiment of technology within social activities. The following sectionsprovide three cases that demonstrate both the social and technological aspectsof Web Mapping 2.0. In each case, we provide a description of the application,followed by a concise analysis that places them within this framework.
6 OpenStreetMap (http://www.openstreetmap.org/)
Virtual associations that can exist in social software have led to ‘crowd-sourcing’ (Howe 2006), which has proven to be one of the most significantand potentially controversial developments in Web 2.0 and neogeography.This term developed from the concept of outsourcing where businessoperations are transferred to remote cheaper locations (Friedman 2006).Similarly, crowdsourcing is how large groups of users can perform func-tions which are either difficult to automate or expensive to implement.Tapscott and Williams (2006) discusses that ‘in many peer productioncommunities, productive activities are voluntary and non-monetary’;content is created for free, for the development of the community.
The neogeography example of crowdsourcing is the project Open-StreetMap (OSM). OSM is a project to create a set of map data that arefree to use, editable and licensed under new copyright schemes (Figure 6).A key motivation for this project is to enable free access to current

© 2008 The Authors Geography Compass 2/6 (2008): 2011–2039, 10.1111/j.1749-8198.2008.00167.xJournal Compilation © 2008 Blackwell Publishing Ltd
Web Mapping 2.0 and neogeography 2027
geographic information in European countries where geographic infor-mation is considered to be expensive. In the USA, where basic road dataare available through the US Census Bureau TIGER/Line programme, thedetails that are provided are limited (streets and roads only) and do not includegreen space, landmarks and the like. In addition, due to the cost of updates,the update cycle is slow and does not take into account rapid changes.
The OSM data can be edited online through a wiki-like interfacewhere, once a user has created an account, the underlying map data canbe viewed and edited. A number of sources have been used to create thesemaps including uploaded GPS tracks, out of copyright maps and, morerecently, aerial photographs through collaboration with Yahoo! UnlikeWikipedia, where the majority of content is created at disparate locations,the OSM community also organises a series of local workshops (called‘mapping parties’) which aim to create and annotate content for localisedgeographical areas (see Perkins and Dodge 2008). These events are designedto introduce new contributors to the community with hands-on experienceof collecting data, while positively contributing to the project overall bygenerating new data and street labelling as part of the exercise. The OSMdata are stored in servers at University College London (UCL) and Bytemarkwhich contributes the bandwidth for this project. While over 18,000 people
Fig. 6. High resolution map from OpenStreetMap of the area near University College London.

2028 Web Mapping 2.0 and neogeography
© 2008 The Authors Geography Compass 2/6 (2008): 2011–2039, 10.1111/j.1749-8198.2008.00167.xJournal Compilation © 2008 Blackwell Publishing Ltd
have contributed to the map as of December 2007, it is a core group of about40 volunteers who dedicate their time to create a viable data collectionservice. This includes the maintenance of the server, writing the coresoftware that handles the transactions with the server in adding and editinggeographic information, and creating cartographical outputs. The projectincludes two editing tools that participants have developed as part of itwith a lightweight editing software package that is working within thebrowser and another stand-alone version, more akin to a GIS editing package.
Involvement in the project requires the participants to be knowledgeableabout computers and GPS technology, in order to know how to collectGPS tracks, upload the GPX files to their computers and then edit themand upload them to the OSM server. The use of the data also requiresknowledge on how to extract the information from a database and convertit into a usable format.
The OSM project provides a good example for the social and technicalaspects that were highlighted in the previous section. First and foremost,OSM is a knowledge collective that is creating a meaningful geographic datacollection as its main objective. At the same time, it includes a peer productionnetwork, as different groups within the organisation are focusing on thedevelopment of different aspects of the project – digitising tools, renderingsoftware to display the maps, server software to host and coordinate theproduction and delivery, and running activities such as mapping parties. Itis utilising community computing grids in the process of rendering thevarious tiles through the programme Tiles@home, in which about 100volunteers use their computers to render OSM tiles. OSM uses SocialMobile Computing to an extent during the process of data collection,especially during mapping parties where participants coordinate the workusing mobile GPS receivers and mobile phones. The group-formingnetwork can be seen on the main wiki, which contains information aboutthe project, and also through an array of active mailing lists, Internet RelayChats and other modes of CMC. Finally, social accounting is occurringin OSM: for example, in highlighting the contribution of various membersof the OSM community through publication on a website of the amountof computing they have contributed or the number of edits they havecarried out over the last week, month and year.
OSM also demonstrates some of the aspects that are significant inneogeography. First, the API for downloading the data is very simple – allthat is required is latitude and longitude coordinates. This is in sharpcontrast to OGC APIs, which require multiple parameters. Second, theOSM map itself is using AJAX technology and it is easy to integrate itinto other applications, as Nestoria has done in parts of the UK. On theother hand, OSM data are not complete or consistent across the world, oreven across London, where the project has started. The accuracy of thedata is unknown, as there are no systemic and comprehensive qualityassurance processes integral to the data collection. Furthermore, there is

© 2008 The Authors Geography Compass 2/6 (2008): 2011–2039, 10.1111/j.1749-8198.2008.00167.xJournal Compilation © 2008 Blackwell Publishing Ltd
Web Mapping 2.0 and neogeography 2029
no intention of universal coverage or social equality as Steve Coast, thefounder of OSM, said in an interview: ‘Nobody wants to do council estates.But apart from those socio-economic barriers – for places people aren’tthat interested in visiting anyway – nowhere else gets missed’ (GISPro 2007).
7 London Profiler (http://www.londonprofiler.org/)
Another example of the power of the new generation of Web mappingto contribute to quick assembly of maps is the London Profiler (Gibinet al. 2008), which was created by the Centre for Advanced Spatial Analysis,UCL. Unlike the majority of GYM mash-up websites, the London Profilersite presents geographic information as series of choropleth maps on topof Google Maps rather than as simple points (push pins). Although theGoogle Maps API enables vector shapes to be overlaid on their map data,this is limited to a fairly small dataset, and as such not for extensivegeographical areas. To circumnavigate this problem, the vector data canbe transformed into an image format similar to the Google backgroundmap, thereby enabling this information to be integrated seamlessly withGoogle Maps information. The London Profiler website displays multiplepublic domain datasets from a variety of sources for the Government OfficeRegion of London. The purpose of the website is to engage with decision-and policy-makers from a variety of audiences and encourage them to makemore informed choices based on publicly available spatial information. Byoverlaying these data onto Google Maps data, this enables contextualinformation to be taken into account when making decisions (Figure 7).
Data layers include: the Multicultural Atlas of London (Mateos et al.2007); E-Society Classification (Longley et al. 2006); HEFCE POLARClassification and Associated HE data (Corver 2005); National StatisticsOutput Area Classification (Vickers and Rees 2007) and several others.
The website navigation uses the Google Maps interface. Users can addor hide different data layers by clicking on the relevant tabs. A final featurewhich enables users to incorporate their own data into London Profileris the ability to load publicly available files in Google Earth standard(known as KML) onto the map. For example, using KML feeds fromNestoria, discussed earlier, property information can be added to theLondon Profiler website, thus enabling contextual information to beconsidered when searching for a property (Figure 8).
The London Profiler is helpful in understanding some of the advantagesand problems in Web Mapping 2.0. The use of the application is verysmooth and rapid, so changing the map from one topic to another usuallytakes less than 5 sec; hence, the user feels that the application is trulyinteractive. The use of the map is based on the Google Maps interface,and, therefore, the amount of learning required from the user is minimal.The user is also able to select the topics that are of interest to them fromthe list on the map, and view the information instantly. Furthermore, the

2030 Web Mapping 2.0 and neogeography
© 2008 The Authors Geography Compass 2/6 (2008): 2011–2039, 10.1111/j.1749-8198.2008.00167.xJournal Compilation © 2008 Blackwell Publishing Ltd
use of external information providers (Google for the background map,Nestoria for property) means that a single person can effectively managethe site as the focus is solely on the added value layers. On the negativeside, the map is using static ranges of colours and classification, and, therefore,the user cannot explore the information in more detail. Furthermore, theapplication is inherently cartographical and void of any analytical capacity.However, it effectively demonstrates that Web Mapping 2.0 approachescan be used very effectively as a means of disseminating results of researchto a wider audience. For example, the site has featured on the BBC online(BBC 2008) website in a story about recent research conducted at UCLinto the ethnic composition of London neighbourhoods. Additionally,over 18,000 people have visited the site since it launched.
8 Ordnance Survey OpenSpace (http://openspace.ordnancesurvey.co.uk/)
Ordnance Survey (OS) OpenSpace provides an API to access a range ofOrdnance Survey data that enable anyone registered for the service to startbuilding new applications which integrate other third-party information(Figure 9). Additionally, the OS OpenSpace website provides a supporting
Fig. 7. The London Profiler interface displaying the income dimension of the lower superoutput area for an area of London.

© 2008 The Authors Geography Compass 2/6 (2008): 2011–2039, 10.1111/j.1749-8198.2008.00167.xJournal Compilation © 2008 Blackwell Publishing Ltd
Web Mapping 2.0 and neogeography 2031
Fig. 8. Nestoria-generated KML for ‘SE6’ in London displayed on the Index of MultipleDeprivation Hybrid Map with 75% visibility.
Fig. 9. Ordnance Survey OpenSpace.

2032 Web Mapping 2.0 and neogeography
© 2008 The Authors Geography Compass 2/6 (2008): 2011–2039, 10.1111/j.1749-8198.2008.00167.xJournal Compilation © 2008 Blackwell Publishing Ltd
community forum and developer information where users can shareresources and seek information. The site is the only mapping API tosupport the British National Grid and additionally includes support fordifferent data formats such as OGC WMS and Web Feature Service standards.The provision of Ordnance Survey data in an accessible API form aimsto stimulate community applications and involvement and was also recog-nised as an important objective in the Power of Information Review(Mayo and Steinberg 2007), which called for the opening up of publicinformation for the use of wider society. OS OpenSpace provides the richcartographic and contextual details of Ordnance Survey data that enablea raft of rural community and outdoor exploration activities not possibleusing the GYM offerings. Additionally, higher-resolution street details,which include building outlines, also provide potential for different typesof urban- and neighbourhood-based applications. Given that the drivingforces of neogeography include community involvement, a resurgent senseof place and collective ownership, the provision of such content may yieldinteresting new applications.
The OS OpenSpace has the potential to drive the use of OS geographicinformation across the Web by a wide community of independentdevelopers, small Web and media companies, social groups and organisa-tions as well as large corporate and government organisations. However,it is unclear how these latter groups engage with the accompanyingaspects of community building, crowdsourcing, etc. Furthermore, althoughsome community groups and non-governmental organisations have thecapacity to utilise Web technologies as part of their activities, many organ-isations and groups are not capable of taking advantage of this develop-ment due to lack of technical skills and resources. The introduction ofneogeography-type services by OS may prove significant in fosteringthese types of developments into the more mainstream geographicinformation market.
In terms of our overview of Web Mapping 2.0, OS OpenSpace israising some important aspects. First, it demonstrates how major providersof geographic information, who are part of the traditional ‘geography’ towhich neogeography is positing itself against, are adopting the innovationsof Web Mapping 2.0 within their current offering and infrastructure.Second, the use of a local grid reference, and not the ubiquitous latitude/longitude which is common in neogeography, provides an accessiblereference that answers the needs of the specific locality. This is significant,as the approach that the GYM is promoting is of an imaginary globalisedand ubiquitous data provision. Third, OpenSpace is demonstrating howgovernmental and commercial organisations can build on Peer ProductionNetwork – OpenSpace is based on OpenLayers, an Open Source librarydeveloped to provide a framework for accessing geographic informationover the Internet. The adoption of OpenLayers enabled the OS to developOpenSpace – for example, in terms of documentation and examples.

© 2008 The Authors Geography Compass 2/6 (2008): 2011–2039, 10.1111/j.1749-8198.2008.00167.xJournal Compilation © 2008 Blackwell Publishing Ltd
Web Mapping 2.0 and neogeography 2033
Finally, the need for OpenSpace itself came about from the growinginterest in location and geography sparked by Web Mapping 2.0.
9 Implications and critique
The three case studies demonstrated how Web Mapping 2.0 and neogeo-graphy concepts are influencing the development of geographic informationapplications in a voluntary environment, at a university and in a nationalmapping agency. In this part, we turn to the implications of these rapid,open, innovative, collaborative, and interactive developments.
9.1 GEOGRAPHIC INFORMATION PROVIDERS
As with other media content providers (e.g. music and news media), thegeneral information provision model has now changed. It has changedfrom a linear, publishing ‘push’ model where data and information iscollected and brought together centrally, turned into product and publishedto an inter-networked, participatory model where users also collaborativelycreate, share and mash-up data and where information can be accessedthrough many channels, almost anywhere, when the user wants it. Addi-tionally, the role of the traditional information provider may change(Parker 2007). The increased prevalence of user-generated content (includingproducts and services) is blurring the difference between producers andconsumers in what is sometimes termed prosumer. There is also a realisationof users as innovators, experimenting with new products and services onopen innovation platforms, such as OS OpenSpace.
However, these changes are challenging current conceptions and practicesin data provision. When all can potentially capture and distribute data throughaccess to GPS, the Internet and mobile devices, what information canusers trust? Another profound change is in the business models of dataproviders as, for many applications, data can be accessed freely either fromvoluntary sources or from commercial providers through their APIs. Thiscan also have an impact on software vendors, at least in some WMSapplications. An emerging role for the traditional information provider isto perform a data verification function, to facilitate ease of use of and easeof access to the required information, and to ensure a good user experience,and it might be these roles that will become central to the activities ofdata providers (Parker 2007).
9.2 GEOGRAPHY AND GISCIENCE – CULT OF THE AMATEUR OR MASS COLLABORATION?
In a commentary on the wider Web 2.0 debate, Keen (2007) questionswhat he calls the ‘Cult of the Amateur’ encouraged by Web 2.0. Hequestions the consequences of blindly supporting a culture that endorses

2034 Web Mapping 2.0 and neogeography
© 2008 The Authors Geography Compass 2/6 (2008): 2011–2039, 10.1111/j.1749-8198.2008.00167.xJournal Compilation © 2008 Blackwell Publishing Ltd
plagiarism, piracy and fundamentally weakens traditional media, creativeand scholarly institutions. Keen cautions that ‘we [need to] use technologyin a way that encourages innovation, open communication, and progress,while simultaneously preserving professional standards of truth, decency,and creativity’. Tapscott and Williams (2006) describe a growing economydriven by mass collaboration based on the principles of openness, peerproduction, sharing and acting globally. Through different examples theytease out the guidelines by which to succeed in this environment. Onesuspects the answer lies with the appropriate use of both approaches tovarying degrees according to the challenge being faced.
A similar debate has started in the geographic information communitywhere it is apparent that the notion of neogeography contains within itcertain disregard to existing geographical and cartographical traditions,and an even more overt disregard to the whole area of GIS and GIScience.The following example, from one of the core activists of OpenStreetMap:
There’s also a darker side to the complexity of traditional GIS. The fact thatsomeone needs a master’s degree in GIS to work as a GIS Technician shouldset alarm bells ringing. By maintaining the complexity of GIS, vendors likeESRI or Oracle are able to justify the costs of their products and consultantsare able to justify their high fees and trade organisations justify their [sic.]existence. (Black 2007)
A similar derogatory disregard to the efforts of researchers of GIS/2 canbe found in Miller (2006).
Importantly, naïve conceptualisations of geography as the location offactual objects in space, a lack of understanding of spatial analysis and adismissive attitude to geography, cartography and GIS were identified byUnwin (2005) among general GIS users (‘accidental geographers’ as Unwincalls them). However, within neogeography they are seen by some as partof the core ideology. Similar to Wikipedia’s core values, these are basedon strong techno-libertarian politics (Keen 2007), which are especiallycommon with high-tech and Internet culture (Borsook 2000; Hodgkinson2008). Thus, the concepts of collaboration, cooperation, sharing andopenness should be seen within a context of a capitalist mode of productionwhere the collaboration is done from personal motives and in advancementof personal wealth, and less as an altruistic activity.
Regardless of these ideological undertones, it is important to acknowl-edge how neogeographic techniques and collaborative ways of workinghave demonstrated reduced development time and improved usability.They have raised general awareness of geographic information, the earthand the relationships between people and processes to potentially millions.These new techniques do not negate the importance of spatial analysis orcartography or surveying used in traditional geography and GIScience. Itis not either one or the other, and there is clearly a space for both, so asynergistic approach is required.

© 2008 The Authors Geography Compass 2/6 (2008): 2011–2039, 10.1111/j.1749-8198.2008.00167.xJournal Compilation © 2008 Blackwell Publishing Ltd
Web Mapping 2.0 and neogeography 2035
Web Mapping 2.0 can influence GIScience by raising new questionsand can offer novel data sets. For example, this will include data inter-operability between neogeography data sets and traditional GIS ones, includingsemantic interoperability or maintaining the quality, integrity and currencyof (crowd) sourced content. It also provides large quantitative and qualitativedata sources that can be used to answer long-standing research questions.
These new developments are also providing a fruitful area for geo-graphic research. Some of the questions that are emerging include: whatkind of participatory practices are emerging with the support of thesetechnologies and how do they influence the relationship between peopleand places? What kind of cultural and conceptual understanding of space,scale and geography are being used and how are the human concepts ofgeographical space emerging through these systems? In what ways arecomputer systems constraining the geographical imagination of their users?
The current wave of technologies provides a rich source of empiricalevidence at a scale that was not available before. These are relevant for allcurrent research frameworks in geography from the positivist to the critical.
GIS has provided a number of powerful techniques to add to thegeographer’s toolbox. Web Mapping 2.0 and neogeography have addedmore and made the former easier to use and information easier to accessand convey to millions. The potential of these open, collaborative tech-niques to address challenges, be they local or global, is very significant.
Through neogeography, satellite navigation systems and similar tech-nologies, many people are exposed to geographic information and maybe fascinated with the concepts behind these technologies. There isclearly a large pool of enthusiastic amateurs with significant interestand willingness to invest their time and effort into the use of thesetechnologies. As Massey (2006) noted, it is time to put the geographyback into global thinking and this is an opportunity that should be seizedby geographers.
Short Biographies
Mordechai (Muki) Haklay is a Senior Lecturer in GIScience at UCL,where he is also the director of UCL Chorley Institute – an interdiscipli-nary research centre, with an aim to provide computer visualisation andmodelling for UCL strategic research activities. He has written on issuesof public access to environmental information, usability of GIS and otheraspects of geographical information science. He has published in Area, theInternational Journal of GIScience and in several edited books. As part of hisresearch, he is interested in Participatory GIS and been following OpenStreet Map over the last 3 years. He holds a BSc and MA from theHebrew University of Jerusalem and a PhD from UCL.
Alex Singleton is the Spatial Literacy Research Officer at UCL. He recentlycompleted a successful Knowledge Transfer Partnership at the Universities

2036 Web Mapping 2.0 and neogeography
© 2008 The Authors Geography Compass 2/6 (2008): 2011–2039, 10.1111/j.1749-8198.2008.00167.xJournal Compilation © 2008 Blackwell Publishing Ltd
and Colleges Admissions Service where he developed geodemographicprofiling tools and techniques to enable UK Higher Education institutionsto target and engage with under-represented groups. Alex’s recently com-pleted PhD explored the geodemographic analysis of access inequality inHigher Education, including the modelling of neighbourhood participa-tion rates, prior performance and progression. His research has involvedcollaboration with numerous data partners including the Universities andColleges Admissions Service, the Higher Education Statistics Agency, theLearning and Skills Council and the Department for Children, Schoolsand Families. He holds a BSc in Geography from the University of Man-chester and a PhD from UCL.
Chris Parker headed Research & Innovation at Ordnance Survey, GreatBritain’s national mapping agency, and is now engaged in the Organisation’sproduct and service strategy. He has written and presented on researchchallenges and future trends for geographic information providers, and theuse of geographic information in emergency management. He has pub-lished in the Cartographic Journal and several edited books. A practisinggeographer and land resources scientist experienced in the public, privateand third sectors, at home and overseas, he has a keen interest in designingfor ease of use and collaborative use of geographic information applied tosocietal challenges. He holds a BA from Nottingham University and aMSc and PhD from Cranfield Institute of Technology.
Notes
* Correspondence address: Muki Haklay, Department of Civil, Environmental and GeomaticEngineering, University College London, Gower Street, London WC1E 6BT, UK. E-mail:[email protected] Noteworthy is that the invention of words and the Internet is nothing new, and the first waveof applications developed in the 1990s had its own neologisms such as ‘new economy’, ‘cyberspace’,‘dot.com’, ‘ecommerce’, ‘information superhighway’ – many of which are now commonparlance, but others were short-lived.
References
Balarm, S., and Dragicevic, S. (eds) (2006). Collaborative geographic information systems: origins,boundaries and structures. Hershey, PA: Idea Group Inc.
Bassett, C., and Wilbert, C. (1999). Where you want to go today (like it or not): leisurepractices in cyberspace. In: Crouch, D. (ed.) Leisure/tourism geographies: practices and geographicalknowledge. London: Routledge, pp. 181–94.
Batty, M. (1997). Virtual geography. Futures 29, pp. 337–352.BBC. (2008). Mapping London’s immigration. [online]. Retrieved on 30 April 2008 from http://
news.bbc.co.uk/1/hi/uk/7315460.stmBlack, N. (2007). Neogeography and the AGI: have they got the wrong idea? Blog Entry.
[online]. Retrieved on 9 January 2008 from http://www.blacksworld.net/blog/2007/09/22/Neogeography-and-the-agi-have-they-got-the-wrong-idea/
Borsook, P. (2000). Cyberselfish – a critical romp through the terribly libertarian world of high tech.London: Little, Borwn and Company.

© 2008 The Authors Geography Compass 2/6 (2008): 2011–2039, 10.1111/j.1749-8198.2008.00167.xJournal Compilation © 2008 Blackwell Publishing Ltd
Web Mapping 2.0 and neogeography 2037
Brown, J. (2001). Three case studies. In: Werry, C. and Mowbray, M. (eds) Online communities:commerce, community action, and the virtual university. Upper Saddle River, NJ: Prentice Hall,pp. 33–46.
Clinton, W. (2000). Improving the civilian global positioning system (GPS). Office of Science andTechnology Policy, Executive Office of the President, 1 May 2000. [online]. Retrieved on 1November 2007 from http://www.ostp.gov/html/0053_4.html
Corver, M. (2005). Young participation in higher education. HEFCE 2005/03. Bristol, UK: HEFCE.Doyle, S., Dodge, M., and Smith, A. (1998). The potential of web-based mapping and virtual
reality technologies for modeling urban environments. Computers, Environment and UrbanSystems 22 (2), pp. 137–155.
Eisnor, D. (2006). What is neogeography anyway? [online]. Retrieved on 27 May 2006 from http://platial.typepad.com/news/2006/05/what_is_neogeog.html
Fonseca, F., et al. (2000). ‘Ontologies and knowledge sharing in urban GIS’ computer.Environment and Urban Systems 24 (3), pp. 232–251.
Foster, D. (2004). GPX: the GPS exchange format. [online]. Retrieved on 2 November 2007from http://www.topografix.com/gpx.asp
Friedman, T. L. (2006). The world is flat: A brief history of the twenty-first century, updated andexpanded edition. New York: Farrar, Straus and Giroux.
Gawne-Cain, A., and Holcroft, C. (2000). An introduction to OpenGIS. GI News September,pp. 54–57.
Gibin, M., et al. (2008). Exploratory cartographic visualisation of London using the GoogleMaps API. Applied Spatial Analysis and Policy 1 (2), pp. 85–97.
Giordano, A., Chan, M., and Habal, H. (1995). A novel location-based service and architecture. TheSixth IEEE International Symposium on Personal, Indoor and Mobile Radio Communications,Merging onto the Information Superhighway, Wireless, pp. 853–857.
GISPro. (2007). The GISPro interview with OSM founder Steve Coast. GIS professional 18October, pp. 20–23.
Goodchild, M. F. (2007a). Citizens as voluntary sensors: spatial data infrastructure in the worldof Web 2.0. International Journal of Spatial Data Infrastructures Research 2, pp. 24–32.
——. (2007b). Citizens as sensors: the world of volunteered geography. GeoJournal 69 (4),pp. 211–221.
Graham, S. (1998). The end of geography or the explosion of place? Conceptualising space,place and information technology. Progress in Human Geography 22 (2), pp. 165–185.
Haklay, M., and Zafiri, A. F. (2007). Usability engineering for GIS – Learning from a snapshot.Presented at the 23rd International Cartographic Congress, Moscow, Russia, 4–10 August 2007.
Hightower, J., and Borriello, G. (2001). A survey and taxonomy of location sensing systems forubiquitous computing. UW CSE 01-08-03, University of Washington, Department of ComputerScience and Engineering, Seattle, WA, August 2001.
Hodgkinson, T. (2008). With friends like this . . . Guardian 14 January. [online]. Retrieved on30 August 2008 from http://www.guardian.co.uk/technology/2008/jan/14/facebook
Howe, J. (2006). The rise of crowdsourcing. Wired Magazine 14 (6), pp. 176–183.Jankowski, P., and Nyerges, T. (2001). Geographical information systems for group decision making.
London: Taylor and Francis.Keen, A. (2007). The cult of the amateur. London: Nicholas Brealey Publishing.Kohn, C. M. (1970). The 1960s: a decade of progress in geographical research and instruction.
Annals of the Association of American Geographers 60, pp. 211–219.Levine, R., et al. (2000). The cluetrain manifesto: the end of business as usual. Cambridge, MA:
Pegasus Books.Longley, P. A., et al. (2006). Geodemographic classifications, the digital divide and understanding
customer take-up of new technologies. BT Technology Journal 24, pp. 67–74.Massey, D. (2006). Is the world really shrinking? Free Thinking 2006, Thursday 9 November 2006
21:30–22:30 (BBC Radio 3). [online]. Retrieved on 2 November 2007 from http://www.bbc.co.uk/radio3/freethinking2006/pip/hcb0r/
Mateos, P., Webber, R., and Longley, P. (2007). The cultural, ethnic and linguistic classification ofpopulations and neighbourhoods using personal names. CASA Working Paper 116. [online].Retrieved on 2 November 2007 from http://www.casa.ucl.ac.uk/working_papers/paper116.pdf

2038 Web Mapping 2.0 and neogeography
© 2008 The Authors Geography Compass 2/6 (2008): 2011–2039, 10.1111/j.1749-8198.2008.00167.xJournal Compilation © 2008 Blackwell Publishing Ltd
Mayo, E., and Steinberg, T. (2007). The power of information. An independent review.[online]. Retrieved on 30 August 2008 from http://www.cabinetoffice.gov.uk/reports/power_of_information.aspx
Miller, C. M. (2006). A beast in the field: the Google Maps mashup as GIS/2. Cartographica.41 (3), pp. 187–199.
Open Geospatial Consortium Inc. (OGC). (2000). OpenGIS® Web Map Server InterfaceImplementation Specification, Revision 1.0.0.
——. (2005). OGC Newsletter – October 2005. [online]. Retrieved on 2 November 2007 fromhttp://www.opengeospatial.org/pressroom/newsletters/200510
O’Reilly, T. (2005). What is Web 2.0: design patterns and business models for the next generation of software.Posted 30/09/2005. [online]. Retrieved on 24 June 2006 from http://www.oreillynet.com/lpt/a/6228
——. (2006). Web 2.0 compact definition: trying again. Posted 10/12/2006. [online]. Retrievedon 2 November 2007 from http://radar.oreilly.com/archives/2006/12/Web_20_compact.html
Parker, C. J. (2007). Addressing grand challenges and global problems, using location information informal and informal web-based communities. Presentation to Association of GeographicalInformation Annual Conference, Building a GeoCommunity, Stratford-Upon-Avon, UK,20 September.
Parker, N. (2005). Executive interview with Sean Phelan, Founder of Multimap. DirectionsMagazine. Posted 16/5/2005. [online]. Retrieved on 2 November 2007 from http://www.directionsmag.com/article.php?article_id=863&trv=1
Peng, Z. R., and Tsou, M. H. (2003). Internet GIS. Hoboken, NJ: John Wiley & Sons.Perkins, C., and Dodge, M. (2008). The potential of user-generated cartography: a case study
of the OpenStreetMap project and Mapchester mapping party. North West Geography, 8 (1),pp. 19–32.
Peterson, M. P. (1997). Trends in Internet map use. Proceedings 18th ICA/ACI InternationalCartographic Conference, Stockholm, Sweden, pp. 1635–1642.
Plewe, B. (1997). GIS online: information retrieval, mapping, and the Internet. Santa Fe, NM:OnWord Press.
——. (2007). Web cartography in the United States. Cartography and Geographic InformationScience 34 (2), pp. 133–136.
Putz, S. (1994). Interactive information services using World Wide Web hypertext. Proceedings of theFirst International Conference on World Wide Web, Geneva, 25–27 May.
Rheingold, H. (1994). The virtual community in a computerised world. London: Martin Secker &Warburg Ltd.
——. (2002). smart mobs: the next social revolution. Jackson, TN: Perseus Books.Saveri, A., Rheingold, H., and Vian, K. (2005). Technologies of cooperation. Palo Alto, CA:
Institute for the future.Simao, A., Densham, P., and Haklay, M. (forthcoming). Web-based GIS for Collaborative
Planning and Public Participation: an application to the strategic planning of wind farm sites.Journal of Environmental Management.
Skarlatidou, A., and Haklay, M. (2006). Public web mapping: preliminary usability evaluation.Presented at GIS Research UK 2005, Nottingham, UK, 5–7 April.
Slingsby, A., et al. (2007). Interactive tag maps and tag clouds for the multiscale exploration of largespatio-temporal datasets. The 11th International Conference on Information Visualisation.[online]. Retrieved on 2 November 2007 from http://doi.ieeecomputersociety.org/10.1109/IV.2007.71
Tang, W., and Selwood, J. (2003). Connecting our world: GIS web services. Redlands, CA: ESRI Press.Tapscott, D., and Williams, A. D. (2006). Wikinomics – How mass collaboration changes everything.
London, UK: Atlantic Books.Tran, T. (2007). Google Maps Mashups 2.0. Google Lat-Long Blog. Posted 11/7/2007. [online].
Retrieved on 2 November 2007 from http://google-latlong.blogspot.com/Traynor, C., and Williams, M. G. (1995). Why are geographic information systems hard to use?
In: Katz, I., Mack, R. and Marks, L. (eds) Conference companion on human factors in computingsystems – chi ’95. Denver, CO: ACM Press, pp. 288–289.
Tsou, M. H. (2005). Recent developments in Internet GIS, GIS development. [online]. Retrievedon 14 April 2008 from http://www.gisdevelopment.net/technology/gis/techgis_002pf.htm

© 2008 The Authors Geography Compass 2/6 (2008): 2011–2039, 10.1111/j.1749-8198.2008.00167.xJournal Compilation © 2008 Blackwell Publishing Ltd
Web Mapping 2.0 and neogeography 2039
Turner, A. J. (2006). Introduction to neogeography. Sebastopol, CA: O’Reilly Media Inc.Unwin, D. (2005). Fiddling on a different planet. Geoforum 36, pp. 681–684.Vander Wal, T. (2007). Folksonomy coinage and definition. [online]. Retrieved on 1 October 2007
from http://vanderwal.net/folksonomy.htmlVickers, D., and Rees, P. (2007). Creating the national statistics 2001 output area classification,
Journal of the Royal Statistical Society, Series A 170 (2), pp. 379–403.Wall Street Journal. (2007). Acquisition to Expand Microsoft’s Map Services, 13 December 2007.Weinberger, D. (2007). Everything is miscellaneous: the power of the new digital disorder. New York:
Times books.Wellman, B., et al. (1996). Computer networks as social networks: collaborative work, telework
and virtual community. Annual Review of Sociology 22, pp. 213–238.Zucker, D. F. (2007). What does AJAX mean for you? Interactions 14 (5), pp. 10–12.