Matthew Rose - Downer & Daniel Caldwell - WSP Parsons Brinkerhoff

FALL 2013
Annenberg Institute for School Reform • Voices in Urban Education
This book is printed on Environment® Paper. This 100 percent recycled paper reduces solid waste disposal and lessens landfill dependency. By utilizing this paper,
• 4.14 trees were preserved for the future.
• 2,979,128 BTUs of energy were conserved.
• 12.4 pounds of solid waste were not generated.
• 1,787 gallons of wastewater flow were saved.
• 389 pounds of greenhouse gases were prevented from forming.
Voices in U
rban Education C
olleg
e Read
iness In
dicato
r Systems: A
Framew
ork fo
r the Field
FA
LL
20
13
Building Capacity for College Readiness Indicator Systems
Jacob Mishook
Putting College and Career Readiness at the Forefront of District Priorities in Dallas
Shane Hall
Measuring Academic Tenacity: New Visions for Public Schools
Jared Carrano
Looking at the Right Data in the Right Way: Pittsburgh Public Schools
Peter Lavorini
San Jose Unified School District, 2010–2013: Building a Culture of Evidence-Based Practice around College Readiness
Lambrina Kless
College Readiness Indicator Systems Framework
Graciela N. Borsato, Jenny Nagaoka, and Ellen Foley
The Pittsburgh Promise: A Community’s Commitment to Its Young People
Saleem Ghubril
Readiness for College: The Role of Noncognitive Factors and Context
Jenny Nagaoka, Camille A. Farrington, Melissa Roderick, Elaine Allensworth, Tasha Seneca Keyes, David W. Johnson, and Nicole O. Beechum
Annenberg Institute for School Reform
Brown University, Box 1985
Providence, Rhode Island 02912
Web: www.annenberginstitute.org
Twitter: @AnnenbergInst
Facebook: www.facebook.com/AnnenbergInstituteForSchoolReform
Non Profit Org.
U.S. Postage
PAID
Providence, RI
Permit #202
College Readiness Indicator Systems:A Framework for the Field
II Annenberg Institute for School Reform
College Readiness Indicator Systems: A Framework for the Field Number 38, Fall 2013
Executive Editor Philip Gloudemans
Guest Editor Jacob Mishook
Managing Editor Margaret Balch-Gonzalez
Assistant Editor O’rya Hyde-Keller
Production and Distribution Mary Arkins Decasse
Design Brown University Graphic Services
Illustrator Robert Brinkerhoff
Voices in Urban Education (ISSN 1553-541x) is published quarterly at Brown University, Providence, Rhode Island. Ar-ticles may be reproduced with appropriate credit to the Annenberg Institute. Single copies are $12.50 each, including postage and handling. A discount is available on bulk orders. Call 401 863-2018 for further information.
The Annenberg Institute for School Reform was established in 1993 at Brown University. Its mission is to develop, share, and act on knowledge that improves the conditions and outcomes of schooling in America, especially in urban communities and in schools attended by traditionally underserved children. For program infor-mation, contact:
Annenberg Institute for School Reform Brown University, Box 1985 Providence, Rhode Island 02912 Tel: 401 863-7990 Fax: 401 863-1290 Web: www.annenberginstitute.org
Twitter: @AnnenbergInst
Facebook: www.facebook.com. AnnenbergInstituteForSchoolReform
© 2013 Brown University, Annenberg Institute for School Reform
About the College Readiness Indicator Systems Initiative
The College Readiness Indicator Systems (CRIS) initiative, funded by the Bill & Melinda Gates Foundation, brings together three research part-ners – the Annenberg Institute for School Reform at Brown University, the John W. Gardner Center for Youth and Their Communities at Stanford University, and the University of Chicago Consor-tium for Chicago School Research; three urban districts – Dallas Independent School District, Pittsburgh Public Schools, and San Jose Unified School District; and one school support organiza-tion – New Visions for Public Schools in New York City – to jointly develop, test, and dissemi-nate effective tools and resources that provide early diagnostic indications of what students need to become college ready. AISR has also done research on partnerships for college readi-ness with the School District of Philadelphia.
For more information, see www.annenberginstitute.org/cris.
College Readiness Indicator Systems: A Framework for the FieldBuilding Capacity for College Readiness Indicator Systems 2
Jacob Mishook
As schools and districts face new, higher national expectations for college readiness, they must develop better ways of identifying students who are struggling and connect them to supports.
Putting College and Career Readiness at the Forefront of District Priorities in Dallas 6
Shane Hall
With college readiness at the center of district priorities, Dallas has made strides in measuring and understanding the role that schools play in students’ knowledge of how to navigate the college experience.
Measuring Academic Tenacity: New Visions for Public Schools 12
Jared Carrano
A district-like school support network in New York City is expanding its academic preparedness indicator and support system to include indicators for academic tenacity.
Looking at the Right Data in the Right Way: Pittsburgh Public Schools 19
Peter Lavorini
Pittsburgh is using its college readiness indicator system to focus on the most useful information to monitor and the most effective way to analyze it to help students stay on track.
San Jose Unified School District, 2010–2013: Building a Culture of Evidence-Based Practice around 23 College Readiness
Lambrina Kless
San Jose has integrated a college readiness indicator system into its strategic plan with the goal of ensuring that all its graduates leave the district prepared to fully participate in a global society.
College Readiness Indicator Systems Framework 28
Graciela N. Borsato, Jenny Nagaoka, and Ellen Foley
A new framework from the CRIS initiative provides guidance on implementing a system of indica-tors and supports for students who are off track for post-secondary success.
The Pittsburgh Promise: A Community’s Commitment to Its Young People 36
Saleem Ghubril
A community organization has mobilized resources to make a promise to every public school student in Pittsburgh: if you do well in school, we’ll help with the financial burden of attending college.
Readiness for College: The Role of Noncognitive Factors and Context 45
Jenny Nagaoka, Camille A. Farrington, Melissa Roderick, Elaine Allensworth, Tasha Seneca Keyes, David W. Johnson, and Nicole O. Beechum
Research has shown that in addition to academic knowledge, a variety of noncognitive skills are essential to students’ post-secondary success.

2 Annenberg Institute for School Reform
Over the last decade, a growing consensus has developed that for our nation’s students to succeed in twenty-first-century economic and civic life, high school graduation is no longer sufficient. Labor-market analyses have
shown that high-wage positions increasingly require postsecondary education and training, and students must now graduate from high school prepared to succeed in college and career. In response to these changes in the economy and labor force, policies are being adopted across the country such as the Common Core State Standards and accompanying assessments. These standards, to be implemented in 2014 in most states, codify the new skills required for students to be proficient in mathematics and English language arts.
The codification of these broad college and career aspirations into policy opens up the possibility of a new era of equity, in which all students, including those who have historically been poorly served by the public education system, have the same access to and preparation for higher education that affluent families take for granted. At the same time, the new requirements present a colossal challenge to school systems. Not only must they get better at identifying which students are struggling, they must figure out how to use that information to support those students.
THE COLLEGE READINESS INDICATOR SYSTEMS INITIATIVE
Three years ago, the Annenberg Institute for School Reform at Brown University (AISR) joined two other university-based partners – the John W. Gardner Center for Youth and Their Communities at Stanford University (Gardner Center) and the University of Chicago Consortium for Chicago School Research (CCSR) – and five urban sites,1 with support from the Bill & Melinda Gates Foundation, to address these challenges. The goal of the College Readiness Indicator Systems (CRIS) initiative was to develop a model for systems that would not only generate data
Building Capacity for College Readiness Indicator Systems
Jacob Mishook
As schools and districts face new, higher national expectations for college readiness, they must
develop better ways of identifying students who are struggling and connect them to supports.
Jacob Mishook is a senior research associate in district redesign and leadership at the Annenberg Institute for School Reform at Brown University.
1 In addition to the work in four sites described in this issue of VUE, AISR conducted research on partnerships for college readiness in the School District of Philadelphia. See http://annenberginstitute.org/publication/partnerships-college-readiness.
for districts on whether each student was on track for college readiness, but would also tie those data to supports and interventions that would help keep students on track.
We reported on the early work of the CRIS project in the Fall 2012 issue of Voices in Urban Education (VUE 35) – College Readiness Indicator Systems (CRIS): Building Effective Supports for Students.2 At that time, the four school districts and one school support network involved in CRIS – Dallas Independent School District, New Visions for Public Schools in New York City, the School District of Philadelphia, Pittsburgh Public Schools, and San Jose Unified School District – were collecting and analyzing large amounts of information about their students and schools. Several of them, including Dallas and New Visions, had identified key indicators for students veering off-track to graduate high school, such as course failures in ninth grade and poor attendance. Others, such as San Jose, had created a culture of high expectations for students where the district had adopted a college-ready “A–G curriculum”3 and reduced barriers to students wanting to take Advanced Placement courses. Still others had been building community support for college readiness. In Pittsburgh, for instance, the nonprofit community organiza-tion Pittsburgh Promise guarantees college scholarships for all the district’s high school graduates who meet the academic criteria.
LESSONS LEARNED
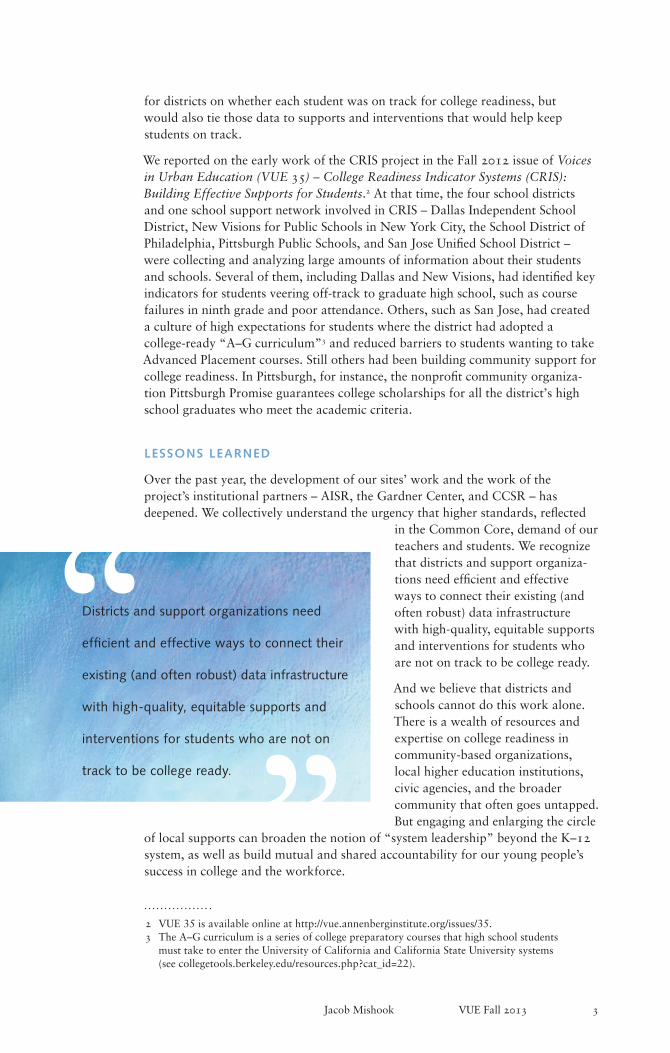
Over the past year, the development of our sites’ work and the work of the project’s institutional partners – AISR, the Gardner Center, and CCSR – has deepened. We collectively understand the urgency that higher standards, reflected
in the Common Core, demand of our teachers and students. We recognize that districts and support organiza-tions need efficient and effective ways to connect their existing (and often robust) data infrastructure with high-quality, equitable supports and interventions for students who are not on track to be college ready.
And we believe that districts and schools cannot do this work alone. There is a wealth of resources and expertise on college readiness in community-based organizations, local higher education institutions, civic agencies, and the broader community that often goes untapped. But engaging and enlarging the circle
of local supports can broaden the notion of “system leadership” beyond the K–12 system, as well as build mutual and shared accountability for our young people’s success in college and the workforce.
2 VUE 35 is available online at http://vue.annenberginstitute.org/issues/35. 3 The A–G curriculum is a series of college preparatory courses that high school students must take to enter the University of California and California State University systems (see collegetools.berkeley.edu/resources.php?cat_id=22).
“ “Districts and support organizations need
efficient and effective ways to connect their
existing (and often robust) data infrastructure
with high-quality, equitable supports and
interventions for students who are not on
track to be college ready.
Jacob Mishook VUE Fall 2013 3
4 Annenberg Institute for School Reform
The contributions to this issue of Voices in Urban Education reflect the lessons of three years of work on the CRIS project. Collectively, they frame our current understanding of college readiness and show how college readiness indicator systems are being infused into the day-to-day work and culture of our sites.
The issue begins with the view from the sites where CRIS is being implemented on the ground.
• Shane Hall, CRIS site liaison for Dallas Independent School District, discusses the district’s long history of developing college readiness indicators, the impact of new district leadership and community-driven organizations on preparing young people for college and career, and several district schools’ pilot testing of new interventions to raise students’ college knowledge. Jayda Batchelder and Courtnee Benford add an additional perspective from Education Opens Doors, a grassroots nonprofit in Dallas that aims to address the opportunity gap in students’ college knowledge and “soft skills.”
• Jared Carrano, CRIS site liaison for New Visions for Public Schools, notes his organization’s unique perspective as a school support organization that provides district-like support services to a network of schools in New York City, and he describes how New Visions is linking academic tenacity to the Common Core. Daniel Voloch of iMentor describes his community-based organization’s college readiness support for the city’s students through an ambitious mentoring program.
• Peter Lavorini, CRIS site liaison for Pittsburgh Public Schools, writes forthrightly about his district’s longstanding challenge of moving beyond easily collected data and the district’s work with other local community partners to leverage greater resources to move all students to being college ready.
• Lambrina Kless, former CRIS site liaison for San Jose Unified School District, describes how the district positioned CRIS within the framework of its new strategic plan and performance measures and how the district used “data intervention cycles” to build a districtwide culture of evidence-based practices in support of college readiness.
The next article, a collaboration of the three CRIS thought partners, addresses a major goal of the CRIS work: to develop a comprehensive framework, grounded in practical lessons from the sites, that would clarify the connections between district leadership, indicator selection, cycles of inquiry, evidence-based data use, effective supports and interventions, and community-based resources, showing how all adults in an educational system can work in alignment around a common goal of college readiness. Graciela Borsato of the Gardner Center, Jenny Nagaoka of CCSR, and Ellen Foley of AISR outline major features of the framework. Among the points they highlight are:
• College and career success requires academic preparedness, but also requires support for students in two other crucial dimensions: academic tenacity and college knowledge.
• Students and schools do not exist in a vacuum. Measures of college readiness must go beyond individual students to address supports for college readiness at the school and system levels.
The issue goes on to present a powerful example of the possibilities that communities can provide to their young people in accessing and succeeding in institutes of higher education. Saleem Ghubril, executive director of the Pittsburgh
Jacob Mishook VUE Fall 2013 5
Promise, spoke with VUE guest editor Jacob Mishook about the work of the Promise, how it measures success, and the evolution from a primarily scholarship-based program to one that coordinates and brokers supports for students in high school and at the post-secondary level. Angela Romans and Rebecca Boxx of AISR offer a perspective on the Providence Children and Youth Cabinet, a cross-sector coalition that includes the district and the mayor’s office tasked with actualizing a community-wide vision for children’s success, from cradle to career.
We close with an article by Jenny Nagaoka and her colleagues from CCSR on “noncognitive skills” – the beliefs and strategies, such as academic tenacity, that are crucial to students’ academic performance and persistence in post-secondary education. Educators increasingly recognize the impact of these “soft” skills, but they are often hard to measure. The article provides a lucid summary of the literature on noncognitive skills that spans multiple disciplines and points the way toward effective supports and interventions to address students’ skills in these areas. The authors observe that noncognitive factors for college readiness are not only an individual attribute of students, but also depend on the college context.
Schools and districts are being asked to take on more and more functions and responsibilities, often with ever-tighter resources. To help support school systems in this challenging environment, CRIS can provide a common language, under-standing, and set of measures around college readiness; offer continuity in the face of leadership transition; help align and leverage cross-sector collaboration; and keep equity at the center of college readiness efforts by linking all students to the supports they need to be successful. We hope that lessons shared in this issue of VUE suggest how college readiness indicator systems might help other school communities navigate the challenges and realize the promise of the new national aspiration: college and career readiness for all students.
6 Annenberg Institute for School Reform
Shane Hall is a data strategist for evaluation and assessment at the Dallas Independent School District and site liaison for the College Readiness Indicator Systems project.
Dallas Independent School District’s (ISD) efforts to develop a system of college
readiness indicators began in 2008, when we received a Bill & Melinda Gates Foundation grant under the foundation’s College-Ready Education initiative. With this grant, Dallas ISD’s Performance Management and Analytics department developed a college readiness measurement model, as well as a dashboard and other data-driven measurement tools that would enable principals, teachers, and counselors to gauge the college readiness of their students.
The college readiness measurement model, based on the work of the
University of Chicago Consortium for Chicago School Research and David Conley’s Education Policy Improve-ment Center, emphasized students’ content knowledge, cognitive strategies, academic behaviors, and college context skills. The model also consid-ered the college-going culture of schools and students’ progress in college, as measured by data from the National Student Clearinghouse (NSC).1 Dallas ISD has received NSC data and reports since 2006. Although we had extensive data on student
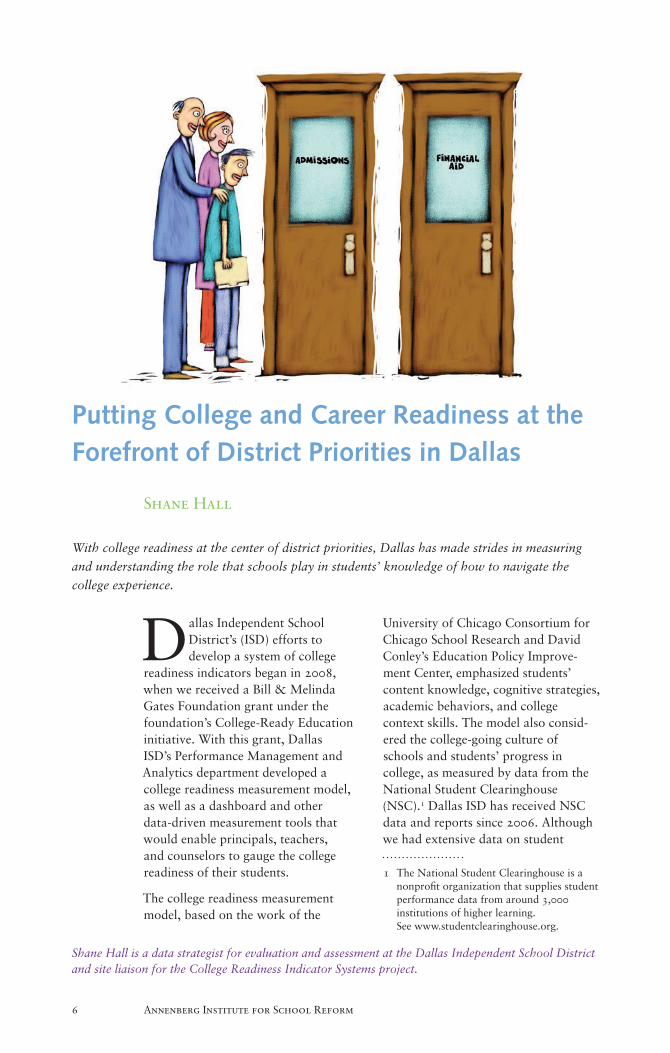
Putting College and Career Readiness at the Forefront of District Priorities in Dallas
Shane Hall
With college readiness at the center of district priorities, Dallas has made strides in measuring
and understanding the role that schools play in students’ knowledge of how to navigate the
college experience.
1 The National Student Clearinghouse is a nonprofit organization that supplies student performance data from around 3,000 institutions of higher learning. See www.studentclearinghouse.org.
content knowledge, as measured by grades and various assessments, the model identified a need for data on cognitive strategies, academic behaviors, and context skills and awareness.
In 2010, we began work on a longitudi-nal diagnostic study of college readiness and success. The study, completed in 2011, analyzed data on more than 75,000 high school graduates spanning the years 1998 through 2009. We found that although more than 50 percent of our district’s graduates enroll in college some time after high school, only 15 percent completed some kind of degree or certificate. We knew this was unac-ceptably low and that we had a lot of work to do to prepare our students for the demands of the twenty-first-century economy.
In 2011, Dallas ISD’s college readiness work continued when the district became one of the sites for the work of the College Readiness Indicator Systems (CRIS) project.2
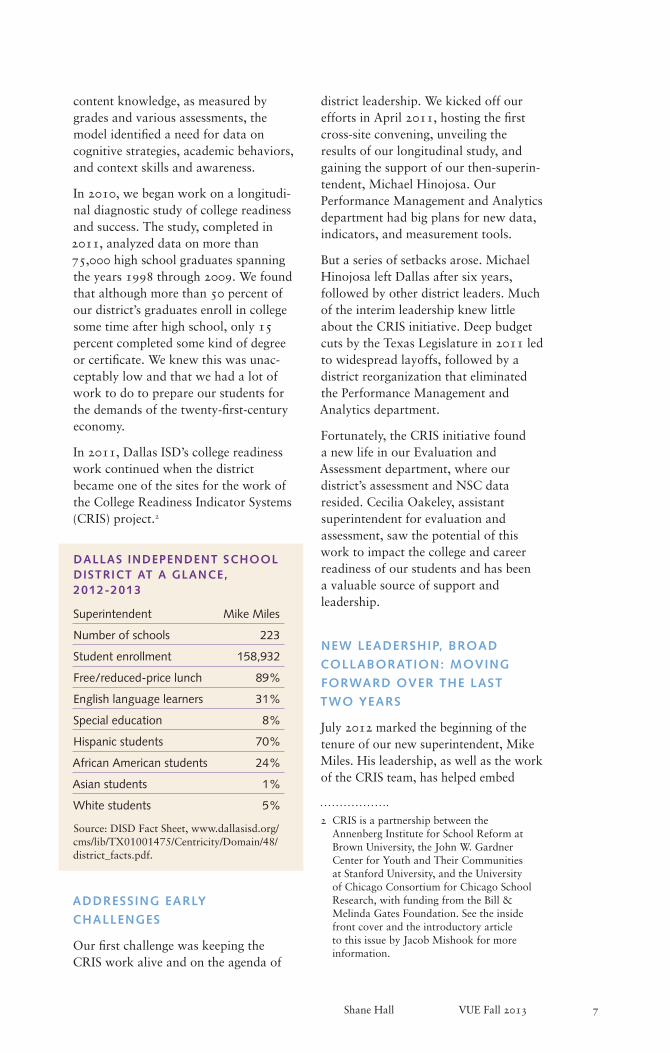
DALLAS INDEPENDENT SCHOOL DISTRICT AT A GLANCE, 2012-2013
Superintendent Mike Miles
Number of schools 223
Student enrollment 158,932
Free/reduced-price lunch 89%
English language learners 31%
Special education 8%
Hispanic students 70%
African American students 24%
Asian students 1%
White students 5%
Source: DISD Fact Sheet, www.dallasisd.org/cms/lib/TX01001475/Centricity/Domain/48/district_facts.pdf.
ADDRESSING EARLY
CHALLENGES
Our first challenge was keeping the CRIS work alive and on the agenda of
district leadership. We kicked off our efforts in April 2011, hosting the first cross-site convening, unveiling the results of our longitudinal study, and gaining the support of our then-superin-tendent, Michael Hinojosa. Our Performance Management and Analytics department had big plans for new data, indicators, and measurement tools.
But a series of setbacks arose. Michael Hinojosa left Dallas after six years, followed by other district leaders. Much of the interim leadership knew little about the CRIS initiative. Deep budget cuts by the Texas Legislature in 2011 led to widespread layoffs, followed by a district reorganization that eliminated the Performance Management and Analytics department.
Fortunately, the CRIS initiative found a new life in our Evaluation and Assessment department, where our district’s assessment and NSC data resided. Cecilia Oakeley, assistant superintendent for evaluation and assessment, saw the potential of this work to impact the college and career readiness of our students and has been a valuable source of support and leadership.
NEW LEADERSHIP, BROAD
COLLABORATION: MOVING
FORWARD OVER THE LAST
TWO YEARS
July 2012 marked the beginning of the tenure of our new superintendent, Mike Miles. His leadership, as well as the work of the CRIS team, has helped embed
Shane Hall VUE Fall 2013 7
2 CRIS is a partnership between the Annenberg Institute for School Reform at Brown University, the John W. Gardner Center for Youth and Their Communities at Stanford University, and the University of Chicago Consortium for Chicago School Research, with funding from the Bill & Melinda Gates Foundation. See the inside front cover and the introductory article to this issue by Jacob Mishook for more information.

8 Annenberg Institute for School Reform
college and career readiness throughout the work of the district. Superintendent Miles’s emphasis on quality of instruction, effective teachers, and strong leadership by principals is designed to create a foundation for student academic success that translates to success in college and the work force. The district’s improve-ment plan, known as Destination 2020, contains measurable goals for student success, including goals related to college and career readiness, such as college readiness standards for the SAT and ACT, as well as career-ready certifications.3
We have also made enormous gains in measuring and understanding college knowledge and the crucial role that schools have in this area. The CRIS team has worked closely with our Counseling Services department, which evaluates high school counselors in part on a series of college knowledge measures. These indicators include percentage of high school seniors completing the state’s common application for college admission, known as ApplyTexas; the percentage of seniors completing the Free Applica-tion for Federal Student Aid (FAFSA); and the percentage of seniors taking the SAT or ACT.
Sylvia Lopez, our director of counsel-ing services, has been a valuable member of the CRIS team. She cites the teamwork among various district departments as an important accom-plishment arising from the CRIS work:
The collaboration has been great. The teamwork between so many departments such as College Career Readiness, Evaluation and Assess-ment, the Management Information Systems Department, and of course outside work by Commit! and Educate Texas.
Dallas ISD continues to forge strong alliances with area institutions of higher education, local foundations, and other external partners around college readiness. Organizations such as
Commit! and Educate Texas have helped foster a culture around college readiness and college access across all of Dallas County. We have also completed a data-sharing agreement with the Dallas County Community College District, the post-secondary destination for the majority of our high school graduates, that will enable us to better understand the post-secondary outcomes of our students and, in turn, inform supports and interventions in our district designed to better prepare students for college. Based on the knowledge Dallas ISD has gained about students’ college readiness needs, especially around college knowledge, we have begun piloting in several district schools a set of classroom-based supports with Education Opens Doors, a local community-based organization (see “Perspectives” sidebar on pages 10–11 for more details).
In a complex environment in which schools face constant demands at the local, state, and federal levels, keeping the CRIS work on the district’s “radar” is always a challenge. But our team continues its work, aligning CRIS with other district efforts to demonstrate that this is not merely one initiative or program among many, but one that is consistent with – and supportive of – other Dallas ISD goals.
COLLEGE AND CAREER
READINESS INDICATORS,
GOALS, AND INTERVENTIONS:
FRONT AND CENTER IN
THE DISTRICT
The importance of college readiness has always been recognized, but now it is a key part of the conversation whenever the district undertakes a new program or initiative. This fall, Dallas ISD will implement Imagine 2020, a pilot of Superintendent Miles’s plan to
3 See www.dallasisd.org/Page/14380 for more information on Destination 2020.
Shane Hall VUE Fall 2013 9
transform the entire district. This initiative will be concentrated in three high-needs high schools and their feeder middle and elementary cam-puses. College and career readiness indicators, goals, and interventions have been woven throughout all aspects of this program. In years past, college readiness might have been simply one goal among many; now, it is at the forefront of everything we do.
From my own experience in Evaluation and Assessment, I can say that my department, Counseling Services, and the College and Career Readiness departments collaborate more closely than at any time I can recall in the nearly fifteen years I’ve been with Dallas ISD. I receive far more requests from schools and departments for SAT, ACT, and other college-readiness-related data than in the past. Silvia Lopez says:
There is definitely more collaboration across central office and outside resources. The school counselors are more confident when speaking about data and data elements to measure. Principals are also asking counselors to increase the college and career readi-ness work that they do with students. It all seems to be coming together.
LESSONS LEARNED
I would advise other districts trying to develop college readiness indicators: Remember that behind every line of data is a student, and you have to think about students when thinking about college and career readiness. As Dallas ISD CRIS consultant Michael Dryden often reminds us, “Data do not define children, children define data.” When developing indicators, ask yourself what outcomes you want to achieve, take stock of the data you have, and consider how they can measure your progress. Think outside the square and leverage the data you already have in ways you might not have thought of before. Engage thought partners in foundations
and universities to help with this. Making the most of your existing data can mean less additional data to collect.
Further, get support and input from the campuses; after all, principals, teachers, and counselors interact with the students every day and are the best people to implement the appropriate interventions. Finally, Silvia Lopez advises: “Be patient and persevere. Never give up and continue to keep the conversation alive when talking about data and college and career readiness.”
LOOKING AHEAD
Data from the Texas Higher Education Coordinating Board indicate that more than a third of our graduates have freshman-year GPAs in college below 2.0. Many of our students need remedial courses in college, which cost them time and money but do not bear credit. Dallas ISD’s College and Career Readi-ness department, under the leadership of Linda K. Johnson (a former CRIS consultant for our district), has worked with the Dallas County Community College District on an initiative that would allow high school students to take the state’s new placement test, the Texas Success Initiative, which replaces the Accuplacer and determines whether a student will need remediation in college. Armed with this information, we can do more to prepare students for college while they are still with us – and before they enter a college campus. In addition, Dallas ISD will pay for all eleventh-grade students in the district to take the SAT in February 2014.
We also recognize that while college readiness is important, the true end goal is not college graduation, but work force success. To that end, we hope to collaborate with the Texas Education Agency and Texas Work Force Commis-sion on a data-sharing agreement that would provide data on the work force outcomes of our students – regardless of whether they went to college!
10 Annenberg Institute for School Reform
EMPOWERING DALLAS STUDENTS TO NAVIGATE THROUGH HIGH SCHOOL TO COLLEGE: EDUCATION OPENS DOORS
Jayda Batchelder and Courtnee Benford
Jayda Batchelder is the founding executive director and Courtnee Benford is the pilot program manager of Education Opens Doors, Inc., in Dallas, Texas.
“I always heard I should go to college, but don’t know people who have gone. Now I know what college is, and the actual steps to get there.” This inner-city eighth grader’s words echo a common sentiment among students participating in the Roadmap to Success program, our first pilot program, at Education Opens Doors (EOD).
EOD is a grassroots nonprofit formed in response to a glaring opportunity gap for students resulting from a lack of college knowledge and soft skills. As a Teach for America middle school teacher in Dallas-Fort Worth, Jayda Batchelder saw firsthand how content mastery alone was not adequately preparing her students for high school success. In 2010, she spearheaded the creation of Roadmap to Success, a new classroom manual featuring interactive and self-guided learning opportunities, created in collaboration with her colleagues and designed to empower students to purposefully navigate through high school to college. Since then, we have continued to develop Roadmap to Success into the cornerstone of EOD’s programming, which consists of an accompanying curriculum, implementation support, and data collec-tion tools. Our Dallas-area spring pilot, launched in spring 2013, provided weekly lessons for 1,500 students in grades 6 through 9 and their thirty-three teachers across nine sites.
Among low-income students nationally, 95 percent aspire to attend college, 70 percent graduate high school, 41 percent enroll in college, and a mere 8 percent complete their bachelor’s degree. Two driving factors contributing to the low percentage of college completion are inadequate academic infrastructure and reduced college expectations (Intentional Futures 2012). We know that:
If educators are to use college and career readiness as a strategy for accomplishing the goal of postsecondary education access and success, they must couple academic preparedness with the knowledge and skills students need to navigate the college-going process (Roderick, Nagaoka & Coca 2009)
Though Dallas County has an 81 percent graduation rate, only 13 percent of graduates are deemed “college-ready.”* In addition to the Roadmap to Success manual, EOD aims to close this gap by targeting the underlying mechanisms of student identity development. We raise students’ college expectations, confidence, and skills to navigate the college-going process.
Roadmap to Success provides a way for students to plan and track their college-going efforts, starting in middle school. The manual helps students understand the impact of their GPA, choice of classes, and SAT scores on their college applications and career success. It offers templates and explanations of college and career topics such as interviews, resumes and cover letters, evaluating college, choosing a major, the value of service and extracurricular activities, and paying for college.
We recognize that the battle to empower students with college knowledge cannot most effectively be fought alone. As a start-up nonprofit, our collaboration with local education leaders, universities, nonprofit
* Note: From Texas Education Agency AEIS Report 2010-2011. College Ready defined as SAT of 1110 on Reading/Math components or an ACT composite score of 24. Numbers exclude students from numerator and denominator who can be identified as moving elsewhere. Data: http://ritter.tea.state.tx.us/perfreport/aeis/2011 Presentation: www.dallascityhall.com/council_briefings/briefings0412/CommitEd_040412.pdf

VUE Fall 2013 11
networks, and stakeholders in the community are crucial to assuring that we are thoughtful, impactful, and successful in closing the opportunity gap.
An instrumental factor in gaining community support has been our continued commitment to measuring and improving outcomes. Just as Roadmap to Success helps our students track their progress, EOD also collects and analyzes data to provide a roadmap for our own success. This ongoing evaluation aims to ensure and document the difference we are making for our students, their schools, their families, and our community. We do so through comprehensive content knowledge assessments, research-aligned surveys, and on-site observations. The results are helping us continuously make real-time improvements to our practice and develop additional curriculum for our future programming.
To quantify the need for our program, we compared initial college knowledge by grade level and found no statistically significant difference. Those findings suggest that, regardless of age or grade, as students progress in their academic careers, they are not receiving this crucial information during the school day or at home around the dinner table. Yet, when we tested Roadmap to Success students at the end of the pilot semester, we saw 12 percent growth on average in college knowledge across the board. Even more exciting were the results among our sixth-graders, who averaged 36 percent growth, indicating they were not too young to begin college preparation.
While we did not find significant differences in growth by race/ethnicity, socioeconomic status, implementation setting, grade level, or other hypothesized factors, we did find that classroom presence and program mindset of teachers were big differentiating factors for outcome scores. This creates many new questions about how we can improve moving forward: How can we better support teachers? How can we create lessons that are equitably delivered? How can we change teachers’ underlying mindset around their students’ ability to graduate from high school and attend college? How do we scale our program while ensuring fidelity of model to empower more students?
These results are guiding our next steps and show that we have only scratched the surface. We are maintaining a hands-on, supportive role on-site, improving teacher professional development, providing more thorough curriculum, and developing an online teacher platform to improve communication and resource delivery. We will continue our emphasis on data by tracking our students longitudinally to measure program effectiveness – how many take the SAT/ACT, graduate high school, enroll in and graduate from college, etc. Our future plans include a video portal and mobile app aligned to Roadmap to Success for both students and their parents to use for ongoing college and career preparation.
Our students deserve and desperately need data-driven organizations backed by quantitative and qualitative results. The enthusiasm and eagerness to acquire college knowledge that students have shown in our pilot program challenges schools, nonprofits, and other community partners to make sure their young people have a pathway to acquire this necessary knowledge. In the words of one Roadmap to Success teacher, “Education does indeed open doors, and our kids are ready to sprint – not walk – through them.”
For more information on Education Opens Doors, see http://educationopensdoors.org.
REFERENCES
Intentional Futures. 2012. From Aspiration to Graduation: Dynamics Affecting Student Success.
A study for the Bill & Melinda Gates Foundation (September 14), http://intentionalfutures.com/work/
college-knowledge.
Roderick, M., J. Nagaoka, and V. Coca. 2009. “College Readiness for All: The Challenge for Urban High
Schools,” America’s High Schools 19, no. 1 (Spring), http://futureofchildren.org/publications/journals/
article/index.xml?journalid=30&articleid=53§ionid=215.
12 Annenberg Institute for School Reform
Over the past three years, the College Readiness Indicator Systems (CRIS) project has
afforded New Visions for Public Schools an opportunity to reflect upon our college readiness systems and practices.1 Through our involvement in the project, we have been able to explore various strategies for ensuring that our students graduate from high school ready for college and careers. Before taking readers through our CRIS experience, however, it is
important to note two key ways in which New Visions is unique among the CRIS team members.
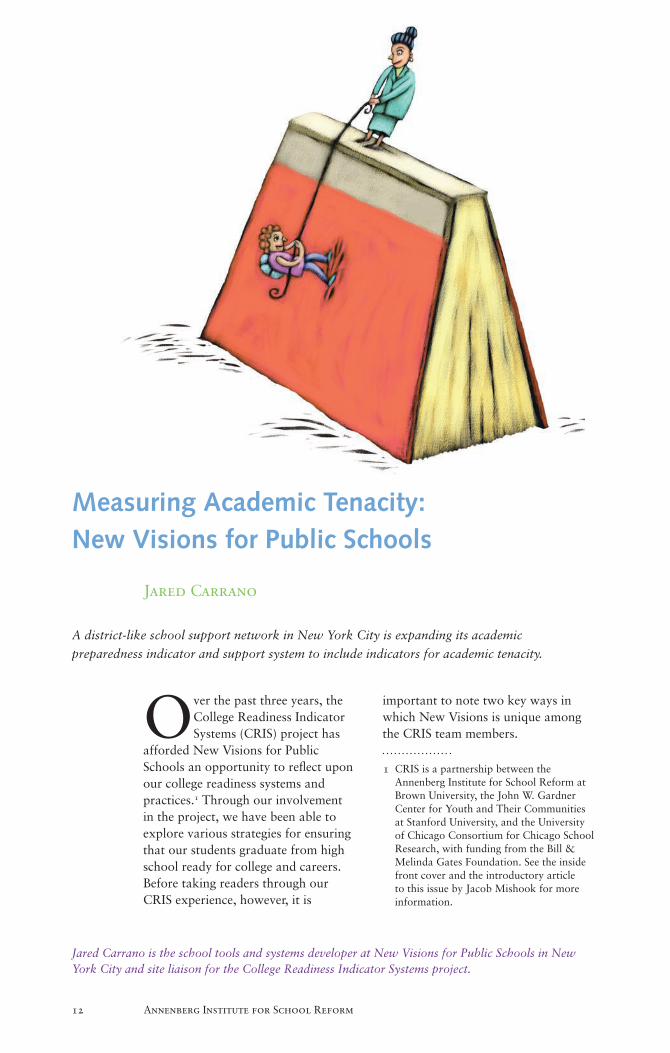
Measuring Academic Tenacity: New Visions for Public Schools
Jared Carrano
A district-like school support network in New York City is expanding its academic
preparedness indicator and support system to include indicators for academic tenacity.
Jared Carrano is the school tools and systems developer at New Visions for Public Schools in New York City and site liaison for the College Readiness Indicator Systems project.
1 CRIS is a partnership between the Annenberg Institute for School Reform at Brown University, the John W. Gardner Center for Youth and Their Communities at Stanford University, and the University of Chicago Consortium for Chicago School Research, with funding from the Bill & Melinda Gates Foundation. See the inside front cover and the introductory article to this issue by Jacob Mishook for more information.
Jared Carrano VUE Fall 2013 13
The first is that we are the only CRIS site that is not a formal school district. As a nonprofit Partnership Support Organization, New Visions is respon-sible for providing a number of district-like supports and services to the roughly seventy-five New York City public high schools in our network, although we do not have authority over school-level decision making or practices.
The second difference lies in New Visions’ early development and adoption of a college readiness indicator, preceding similar activities by our CRIS district colleagues. In 2005, New Visions created an “On-Track to College Readiness” metric to support our schools with student- and school-level planning and assessment. The metric divides students into four performance groups – on track for college; on track for graduation; almost on track; and off track – based
on their credit accumulation, atten-dance, and New York State Regents test pass rates after each semester.
Our on-track metric has been extreme-ly useful in helping our schools identify which of their students are at risk of not graduating ready for college. But because it is based solely on academic indicators, it only paints a partial picture. Given the growing recognition in both the academic literature and policy circles of the importance of students’ noncognitive skills develop-ment (known as academic tenacity by the CRIS project) for college and career readiness, New Visions has been interested in finding ways to measure – and to incorporate such measures – into our college-readiness metric. The CRIS project enabled us to focus on this increasingly important work.2
2 See Nagaoka et al. in this issue of VUE for more on noncognitive skills.
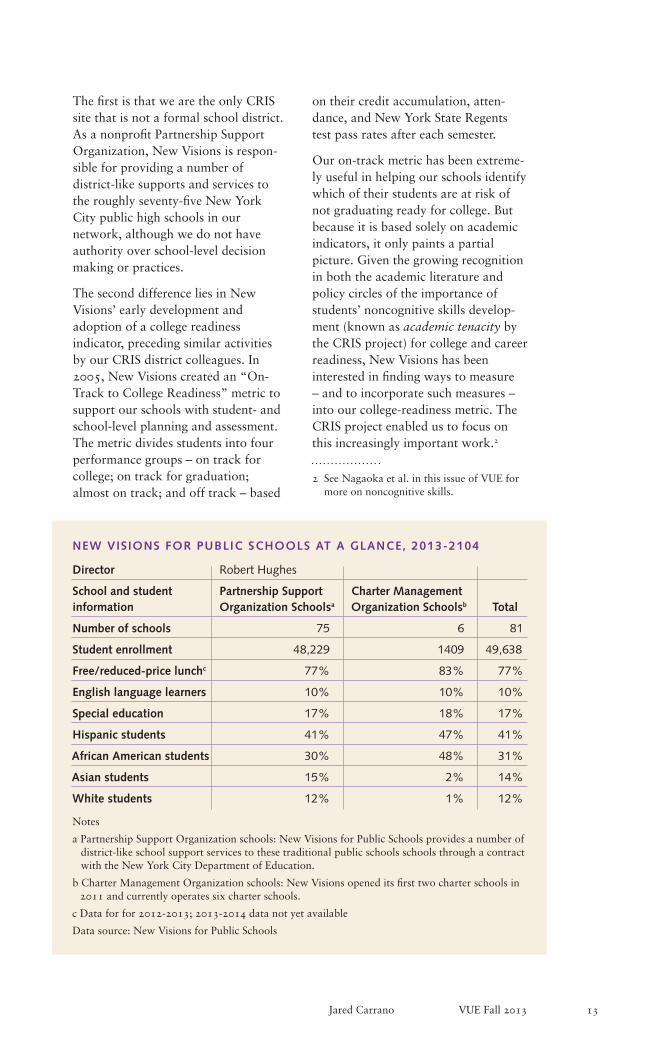
NEW VISIONS FOR PUBLIC SCHOOLS AT A GLANCE, 2013-2104
Director Robert Hughes
School and student Partnership Support Charter Management information Organization Schoolsa Organization Schoolsb Total
Number of schools 75 6 81
Student enrollment 48,229 1409 49,638
Free/reduced-price lunchc 77% 83% 77%
English language learners 10% 10% 10%
Special education 17% 18% 17%
Hispanic students 41% 47% 41%
African American students 30% 48% 31%
Asian students 15% 2% 14%
White students 12% 1% 12%
Notes
a Partnership Support Organization schools: New Visions for Public Schools provides a number of district-like school support services to these traditional public schools schools through a contract with the New York City Department of Education.
b Charter Management Organization schools: New Visions opened its first two charter schools in 2011 and currently operates six charter schools.
c Data for for 2012-2013; 2013-2014 data not yet available
Data source: New Visions for Public Schools
14 Annenberg Institute for School Reform
LINKING ACADEMIC TENACITY
TO THE COMMON CORE
Early on in the project, we concluded that beyond utilizing subjective student self-assessment tools like surveys or other very rough proxies such as student attendance, no one had yet found any convincing measures of academic tenacity. Around the same time, New Visions had just begun work on developing Common Core–aligned curriculum modules in math and English, thanks to funding from both the federal government and the Bill & Melinda Gates Foundation. As we engaged in these two strands of work, we began to see a convergence between the two efforts.
We proposed that true mastery of the Common Core will require students to demonstrate academic tenacity, as the standards help students to understand the skills and knowledge that they need and support them in self-regulating their progress to mastery. For example, Common Core writing standard #5 for English language arts for ninth- to tenth-graders requires students to “develop and strengthen writing as needed by planning, revising, editing, rewriting, or trying a new approach.”3 Research also suggests that students are more effective at self-regulating their progress when they deeply understand the knowledge and skills that they are required to master (Sadler 1989; Nicol & Milligan 2006; Rust, Price & O’Donovan 2003). So we hypothesized that engaging students with a Common Core–aligned rubric would help them to understand at a very granular level their performance on various skills and how they can improve.
To test this, we conducted focus groups of both higher- and lower-performing students in four New Visions schools that were part of the same initiative to design and implement Common Core–aligned curriculum. Our initial findings suggested that students were
able to articulate the Common Core skills they were required to master, and they were able to pinpoint their strengths and weaknesses and describe how they could improve on their deficits.
Although these student focus groups provided us with promising initial evidence to support our hypothesis, we are limited in our ability to put it to further testing until the Common Core is widely adopted across our schools, and it is premature to operationalize this work. New Visions will continue exploring the relationship between tenacity and the Common Core as the standards are rolled out across our network schools.
SUPPORTING COMPREHENSIVE
PROGRAMMING TO BOOST
ACADEMIC TENACITY
While we await the rollout of the Com-mon Core standards, New Visions has shifted our focus towards supporting comprehensive programming to boost academic tenacity, specifically through a program called iMentor, a school-based mentoring program that matches public high school students with college-educated mentors in one-to-one relationships. Each student receives a mentor who augments existing guidance and college counseling programs at their school. Mentor-men-tee pairs at New Visions schools are matched for all four years of high school, over which time they exchange weekly emails and meet in person on a monthly basis.4
3 See www.corestandards.org/ELA-Literacy CCRA/W. 4 For more on iMentor, see the Perspectives
sidebar at the end of this article, “Supporting College Readiness through Mentoring in New York City: iMentor,” by Daniel Voloch.
Jared Carrano VUE Fall 2013 15
The iMentor program seeks to develop seven core noncognitive skills: social capital development, utilizing a growth mindset, perseverance, critical think-ing, help-seeking and self-advocacy, optimism and excitement about the future, and curiosity and love of learning. Mentors also help their mentees develop college knowledge, such as how to identify the best college match, apply for financial aid, meet application deadlines, write effective essays, and integrate into college life – all of which allows students to reach important milestones on their path to college graduation.
Over the next several years, each entering student at eight New Visions high schools will be paired with a mentor for four years, as part of a six-year study of these schools by the Research Alliance for New York City Schools, which will be completed in 2018; the first annual report will be released in fall 2014. Approximately 2,500 students will be mentored over the life of the project.
THE FUTURE DIRECTION OF
COLLEGE READINESS AT NEW
VISIONS
The CRIS project has enabled New Visions to explore new ways of improving upon our existing college readiness indicators and supports, focusing on the promotion and devel-opment of academic tenacity in particular, and has created the space for us to think deeply upon the challenges and opportunities we face. Three years later, as the CRIS project comes to an end, we have identified some promising paths forward and are excited to continue with this highly important work.
Going forward, New Visions will continue to explore the convergence of the Common Core with the develop-ment of academic tenacity and ways to support comprehensive school
programming aimed at developing students’ noncognitive skills. We are also developing a data warehouse that will allow us to connect many formerly isolated data sets and produce sophisti-cated and nuanced data analysis to help our schools make informed decisions about programming and resource allocation. We have also begun to examine longitudinal college readiness data, tracking the four-year high school trajectory of individual students at each school in our network.
The data warehouse concept was facilitated by the CRIS project in that it awarded New Visions’ Deputy Director of Research, Brad Gunton, a data fellowship, which enabled him to participate in a number of data conven-ings. Brad’s learnings through these convenings helped him to understand the critical role that a data warehouse could play in New Visions’ ability to more quickly identify and address school- and student-level challenges to success. The data warehouse will enable New Visions to make compara-tive data accessible to our schools, unite traditionally separated data strands, and conduct sophisticated analysis over time. Beyond our current capabilities, the warehouse will facilitate the integration of data from multiple sources to encompass academ-ic information, behavioral history, teacher assignments, scheduling and program practices, grades and curri-cula, and budget and resource allocations. We also will be able to create meaningful tools and user interfaces that coherently aggregate this data to meet the diverse and complex day-to-day needs of New Visions’ organizational staff, school staff, and the external providers that deliver services to our students.
Another promising strand of work around college readiness is the tracking of individual student progress over time, what we refer to as Stock and Flow mapping, developed by New

16 Annenberg Institute for School Reform
Visions’ director of research and organizational learning, Susan Fair-child.5 These maps show how a cohort of students move between the various on-track performance groups over their eight semesters in high school. Large movement, or “flows,” of students from a lower to higher category at a particular point in time can provide evidence that a particular intervention is working. Conversely, large flows of students from higher to lower categories might suggest current programming or structures are not ade-quately serving students. We have only begun to scratch the surface of what these maps can tell us, and we believe that they have the potential to become powerful tools for sustainably getting more students college ready.
REFERENCES
Nicol, D., and C. Milligan. 2006. “Rethink-
ing Technology-Supported Assessment
Practices in Relation to the Seven Principles
of Good Feedback Practice.” In Innovative
Assessment in Higher Education, edited by
C. Bryan and K. Clegg. London, UK: Taylor
and Francis Group Ltd.
Rust, C., M. Price, and B. O’Donovan.
2003. “Improving Students’ Learning by
Developing Their Understanding of
Assessment Criteria and Processes,”
Assessment & Evaluation in Higher
Education 28, no. 2.
Sadler, D. R. 1989. “Formative Assessment
and the Design of Instructional Systems,”
Instructional Science 18, no. 2:119–144.
5 See www.newvisions.org/blog/entry/stock-and-flow-a-school-level-vital-sign for more information.
VUE Fall 2013 17
SUPPORTING COLLEGE READINESS THROUGH MENTORING IN NEW YORK CITY: iMENTOR
Daniel Voloch
Daniel Voloch is managing director of program design at iMentor.
The mission of iMentor, founded in 1999, is to build mentoring relationships that empower students in low-income communities to graduate high school, succeed in college, and achieve their ambitions. Over the past fourteen years, iMentor has developed a new mentoring model that aims to make mentoring a more reliable and effective intervention in helping students create pathways to college completion. In the process, we learned how to engage thousands of adults as mentors; developed a whole-school model that matches every student in a school with a mentor; and ensured that mentors are effective at supporting specific student outcomes such as developing college knowledge and noncognitive skills. This year, iMentor is serving 3,400 mentor-mentee pairs in New York City and 2,000 more nationwide. Since 1999, 11,000 students have been paired with mentors.
Strong Mentor/Mentee Relationships to Support College Readiness
The heart of the iMentor program is the one-to-one mentoring relationships that develop over the length of three-year (eleventh grade through first year of college) or four-year (ninth through twelfth grade) matches. Throughout the match, students and their mentors engage with our research-based curriculum via weekly emails and monthly in-person meetings. This means that our mentors work with their mentees every week from high school through college, providing a level of individualized coaching that is rarely available through traditional student support models.* While our ultimate outcome is college completion, iMentor has four core outcomes that we work toward for all of our pairs:
• Developing strong personal relationships. Ensuring our pairs develop strong, candid, trusting relationships is the foundation for everything we do. iMentor’s curriculum facilitates the develop-ment of these relationships by creating opportunities for mentors and mentees to share similarities and differences in their backgrounds, experiences, interests, and aspirations. Mentors and mentees also work together to establish expectations for their relationships and mentors help mentees set goals and create action plans to achieve those goals.
• Growing and nurturing a college aspiration. Our mentees enter the program with a wide variety of college aspirations. Some want to go to college, whereas others are not sure what their college plans are. iMentor’s aim is to make college a tangible and attainable goal for all of our students. Mentors help mentees develop a college-going mindset and gain a realistic understanding of how attending and completing college may influence their future options. Since all of our mentors are college graduates, they share their attending and completing college experiences with mentees and provide first-hand perspectives of college life.
• Developing noncognitive skills. In order for students to be prepared for college, it is critical to provide them with a curriculum and experiences that develop the noncognitive skills that research cites as predictive of college success. iMentor’s curriculum focuses on developing seven noncogni-tive skills: social capital skills, utilizing a growth mindset, perseverance, critical thinking, seeking help/self-advocacy, excitement/optimism about the future, and curiosity/love of learning. Each of
* See www.imentor.org/video-gallery for video profiles of some of the mentor-mentee pairs.
18 Annenberg Institute for School Reform
these skills is introduced to students in the first year of their match and developed, reinforced, and assessed throughout each succeeding year of their relationship.
• Providing individualized support in the college process. iMentor’s curriculum focuses on five college support areas: ensuring college knowledge, continuous and early assessment of college readiness, utilizing college tools and resources, project managing the college application process, and support-ing the transition to college.
Evaluating the Program Model
Each year, iMentor conducts pre and post evaluations using research-validated scales that measure program impact, including noncognitive skill development. We have seen promising initial results, including:
• 85 percent of mentees say that their mentor is someone they can trust
• 86 percent of mentees report that their mentor has helped them feel they can do/say things to improve as a student or further their education
• 78 percent of mentors helped their mentees prepare for the SATs, Regents exams, or other standardized tests
• 78 percent of mentors report that they helped their mentee create a college plan and set goals to achieve it
In addition to annual program evaluations, in 2011, iMentor launched a six-year independent evaluation of its program model that is being conducted by the Research Alliance for New York City Schools. The evaluation will enroll approximately 2,500 students from eight high schools in New York City beginning in the ninth grade. At each school, the treatment group cohort will be enrolled one year after the control group cohort. The Research Alliance will use a mixed-method longitudinal approach to provide a side-by-side comparison of students in the control group and students in the treatment group. Data for each group will be aggregated annually from ninth to twelfth grade to determine iMentor’s overall impact on student outcomes, including growth in key noncognitive skills. This evaluation will be one of the largest and most comprehensive studies ever published on school-based mentoring.
Looking Ahead: A More Explicit Focus on Noncognitive Skills
Over the last fourteen years, iMentor has learned how to effectively leverage mentors in supporting first-generation college-bound students. In the last two years, iMentor launched a new curriculum and joined forces with the New York City Student Success Collaborative and other leading organizations to focus more explicitly on noncognitive skill development.
One of the critical challenges we have faced in the area of noncognitive skill development has been a lack of interim measures. While we can capture growth via pre and post evaluations, it is critical from a program implementation standpoint that we know throughout the year whether our students understand and can apply these noncognitive skills. To that end, we are piloting a series of formative assessments that will provide our staff with these interim measures facilitating additional scaffolding or support when needed.
We also plan to develop a scenario-based rubric that will allow our pairs to develop a richer understanding of what it means to demonstrate these noncognitive skills (e.g., having a growth mindset, being able to self-advocate, demonstrating resilience) so that they can subsequently identify which noncognitive skills they would like to focus on throughout their relationship. Ultimately, our program is rooted in the pair experience, and we want to be able to make noncognitive skill development as transparent as possible so that mentors and mentees have a common language and can intentionally discuss and practice these critical skills.
For more information on iMentor’s model or evaluation, please contact Daniel Voloch at [email protected].
VUE Fall 2013 19
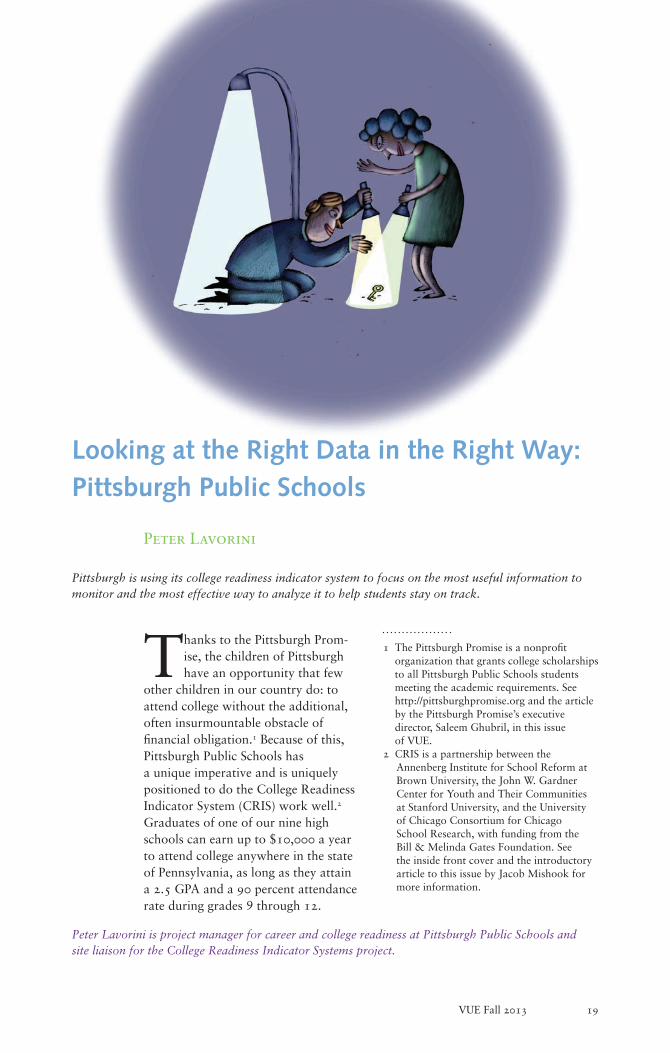
Thanks to the Pittsburgh Prom-ise, the children of Pittsburgh have an opportunity that few
other children in our country do: to attend college without the additional, often insurmountable obstacle of financial obligation.1 Because of this, Pittsburgh Public Schools has a unique imperative and is uniquely positioned to do the College Readiness Indicator System (CRIS) work well.2 Graduates of one of our nine high schools can earn up to $10,000 a year to attend college anywhere in the state of Pennsylvania, as long as they attain a 2.5 GPA and a 90 percent attendance rate during grades 9 through 12.
Peter Lavorini is project manager for career and college readiness at Pittsburgh Public Schools and site liaison for the College Readiness Indicator Systems project.
Looking at the Right Data in the Right Way: Pittsburgh Public Schools
Peter Lavorini
Pittsburgh is using its college readiness indicator system to focus on the most useful information to monitor and the most effective way to analyze it to help students stay on track.
1 The Pittsburgh Promise is a nonprofit organization that grants college scholarships to all Pittsburgh Public Schools students meeting the academic requirements. See http://pittsburghpromise.org and the article by the Pittsburgh Promise’s executive director, Saleem Ghubril, in this issue of VUE.
2 CRIS is a partnership between the Annenberg Institute for School Reform at Brown University, the John W. Gardner Center for Youth and Their Communities at Stanford University, and the University of Chicago Consortium for Chicago School Research, with funding from the Bill & Melinda Gates Foundation. See the inside front cover and the introductory article to this issue by Jacob Mishook for more information.
20 Annenberg Institute for School Reform
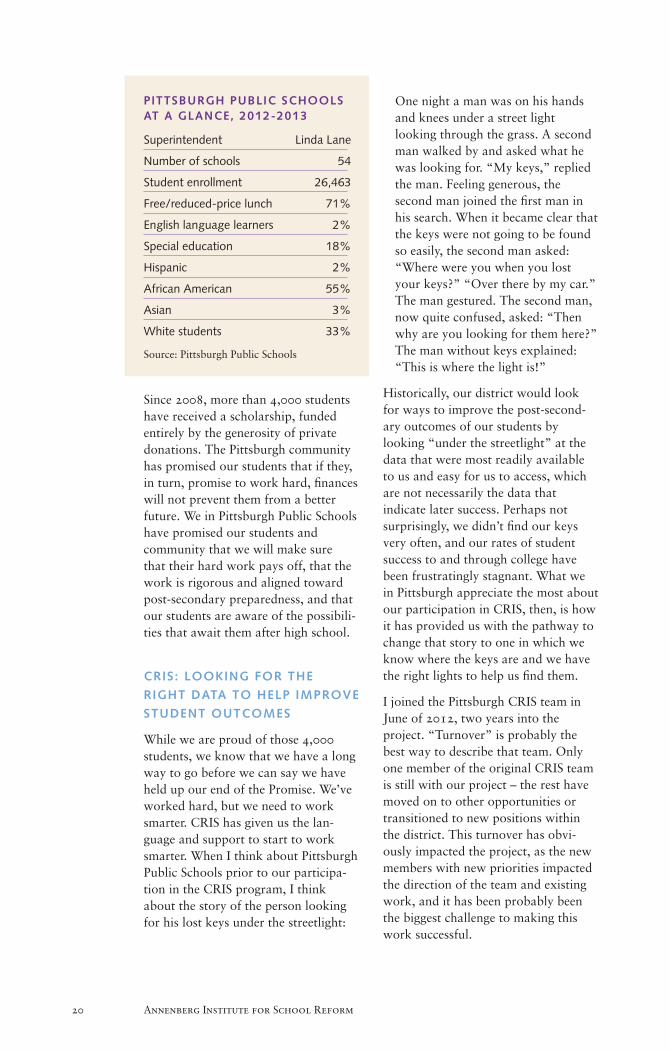
PITTSBURGH PUBLIC SCHOOLS AT A GLANCE, 2012-2013
Superintendent Linda Lane
Number of schools 54
Student enrollment 26,463
Free/reduced-price lunch 71%
English language learners 2%
Special education 18%
Hispanic 2%
African American 55%
Asian 3%
White students 33%
Source: Pittsburgh Public Schools
Since 2008, more than 4,000 students have received a scholarship, funded entirely by the generosity of private donations. The Pittsburgh community has promised our students that if they, in turn, promise to work hard, finances will not prevent them from a better future. We in Pittsburgh Public Schools have promised our students and community that we will make sure that their hard work pays off, that the work is rigorous and aligned toward post-secondary preparedness, and that our students are aware of the possibili-ties that await them after high school.
CRIS: LOOKING FOR THE
RIGHT DATA TO HELP IMPROVE
STUDENT OUTCOMES
While we are proud of those 4,000 students, we know that we have a long way to go before we can say we have held up our end of the Promise. We’ve worked hard, but we need to work smarter. CRIS has given us the lan-guage and support to start to work smarter. When I think about Pittsburgh Public Schools prior to our participa-tion in the CRIS program, I think about the story of the person looking for his lost keys under the streetlight:
One night a man was on his hands and knees under a street light looking through the grass. A second man walked by and asked what he was looking for. “My keys,” replied the man. Feeling generous, the second man joined the first man in his search. When it became clear that the keys were not going to be found so easily, the second man asked: “Where were you when you lost your keys?” “Over there by my car.” The man gestured. The second man, now quite confused, asked: “Then why are you looking for them here?” The man without keys explained: “This is where the light is!”
Historically, our district would look for ways to improve the post-second-ary outcomes of our students by looking “under the streetlight” at the data that were most readily available to us and easy for us to access, which are not necessarily the data that indicate later success. Perhaps not surprisingly, we didn’t find our keys very often, and our rates of student success to and through college have been frustratingly stagnant. What we in Pittsburgh appreciate the most about our participation in CRIS, then, is how it has provided us with the pathway to change that story to one in which we know where the keys are and we have the right lights to help us find them.
I joined the Pittsburgh CRIS team in June of 2012, two years into the project. “Turnover” is probably the best way to describe that team. Only one member of the original CRIS team is still with our project – the rest have moved on to other opportunities or transitioned to new positions within the district. This turnover has obvi-ously impacted the project, as the new members with new priorities impacted the direction of the team and existing work, and it has been probably been the biggest challenge to making this work successful.
Moreover, the scope of the project grew with each new member. At one point we had identified nine indicators that had a cycle of inquiry associated with each, and it was incredibly challenging to support. Couple a large scope with a diverse, often in-flux team, and you find a project with much promise and much stagnation.
FOCUSING ON THE MOST
USEFUL INDICATORS
The CRIS team went through its last reshuffling right around the time that I started. We quickly shifted our focus to three areas: narrowing the scope of the project toward the indicators that had the most leverage on ensuring later success, establishing a sense of owner-ship of the project, and laying the groundwork for sustaining the work past the life of the grant. Using our CRIS grant, we brought on a research analyst, Kyle Siler-Evans, to help us find “the right streetlight” – the indicators that would tell us the most about our students’ success after high school – by looking at National Student Clearinghouse data.3 What he found was so obvious that it was surprising – students who are success-ful in college do two things well: they show up to school and they get good grades. Since attendance and GPA are the two criteria for the Promise, we realized we were already looking at the right data, we just weren’t looking at it in the right way.
Fortunately for us, we found a commu-nity in Pittsburgh and an infrastructure within Pittsburgh Public Schools that was ready and willing to focus on these indicators. We have partnered with the Promise, United Way of Allegheny County, the Allegheny County Depart-
ment of Human Services, the local universities, and others to create a holistic approach to improving student attendance rates in grades K–12, including sharing data with afterschool partners and new programs to incentiv-ize good attendance.
For example, when we realized the importance of good attendance as an indicator of future success, our community partners rallied together and began a “Be There” initiative, aimed at eliminating our chronic absenteeism issue. Organizations such as United Way, the University of Pittsburgh’s Office of Child Develop-ment, and the county’s Department of
Human Services have worked to create materials aimed at promoting good attendance and training for after-school partners on how to make attendance a central part of their work. As this issue of VUE goes to press, the Be There campaign is scheduled to really take off on October 10, when close to 250 people will attend a “School Atten-dance Matters” conference designed to provide school communities with strategies and resources to address the barriers to good attendance that their students face.
3 The National Student Clearinghouse is a nonprofit organization that supplies student performance data from 3,000 institutions of higher learning. See www.studentclearinghouse.org.
“ “When we realized the importance of good
attendance as an indicator of future
success, our community partners rallied
together and began an initiative aimed at
eliminating our chronic absenteeism.
Peter Lavorini VUE Fall 2013 21
22 Annenberg Institute for School Reform
Focusing on attendance taught us two important lessons for this work: ask for help from your community part-ners, particularly in those instances when they’re in a prime situation to help, and be transparent with your stakeholders about the urgency and imperative of improving these indica-tors. Like the good Samaritan in the streetlight story, the community wants to help, they just want to help in the right place.
SUPPORTING DECISION-
MAKERS WITH DATA
Similarly, the CRIS work has arrived at a prime opportunity to leverage other initiatives within Pittsburgh Public Schools to scale up and sustain the CRIS work, particularly around supporting decision-makers with data. In Pittsburgh, we are focusing on teacher effectiveness as the major factor in improving student outcomes through our ambitious Empowering Effective Teachers (EET) plan, funded by a $40 million grant from the Bill & Melinda Gates Foundation and more than $40 million in state and federal grants. By measuring differences in teacher effectiveness and using this information to help teachers improve, we now have ways to understand and respond to differences in teacher effectiveness.
The EET plan, then, has created an appetite for more information about students, staff, and initiatives that can lead to better student outcomes, and with that appetite has come major investments in data infrastructure (including a data warehouse and reporting platform) and structures within schools to review and respond to that data. CRIS has graciously funded my participation in the Strate-gic Data Project at the Harvard School of Education’s Center for Education Policy Research, which has given me and the two other data fellows within
PPS opportunities for new ways of thinking about using our student and teacher effectiveness data. Further-more, our CRIS team has played a major role in developing new types of analysis and reports to improve the effectiveness of teachers and principals – and we’re just warming up.
After the first three years of the CRIS project, we’re confident that we’re looking under the right streetlight. District leadership is supporting our work and our school staff feel empow-ered by the cycles of inquiry and supporting data and resources to respond to those indicators. We are hard at work incorporating additional data into our framework for under-standing college readiness and are building off of the work we’ve done around attendance and GPA to focus on our students’ college knowledge.
We have a long way to go, however, before we see our students succeeding at the level we want. Our schools need more support with instituting cycles of inquiry and strong data cultures. Our students need more support with creating healthy habits early and they need to know how to access the promise of a college education. Our CRIS team needs to find ways to sustain the work after the life of the grant, including ensuring that person-nel can stay dedicated to the work in a time of budget constraints. We’re confident that our plans for addressing all of those concerns can be successful, and we’re thankful that we have the support of our partners at AISR and the John Gardner Center to help us carry out those plans.
There’s a lot of promise in Pittsburgh Public Schools. CRIS has helped us get that much closer to delivering on that promise.

The author would like to recognize the efforts of the San Jose Unified School District CRIS Team, whose three years of hard work on the CRIS project is reflected in this article.
In 2012-2013, leaders and staff of the San Jose Unified School District (SJUSD) focused on accomplishing
the district’s new mission: to aggressively pursue solutions to close the opportunity gap and ensure that all students leave SJUSD with twenty-first-century skills, prepared to participate in a global society. The district’s participation in the College Readiness Indicator Systems (CRIS) initiative1 presented an opportu-nity to place the CRIS work within the context of the district’s 2012–2017 strategic plan, Opportunity21. The
Lambrina Kless is the former administrator of data integration and reporting and CRIS site liaison at the San Jose Unified School District.
San Jose Unified School District, 2010–2013: Building a Culture of Evidence-Based Practice around College Readiness
Lambrina Kless
San Jose has integrated a college readiness indicator system into its strategic plan with the goal of ensuring that all its graduates leave the district prepared to fully participate in a global society.
1 CRIS is a partnership between the Annenberg Institute for School Reform at Brown University, the John W. Gardner Center for Youth and Their Communities at Stanford University, and the University of Chicago Consortium for Chicago School Research, with funding from the Bill & Melinda Gates Foundation. See the inside front cover and the introductory article to this issue by Jacob Mishook for more information. 2 See www.sjusd.org/opportunity21/key- performance-measures for more information.
district positioned the CRIS work as a way to establish, validate, and model a process for broad implementation of the district’s Key Performance Mea-sures (KPMs) – a set of connected data metrics that signal how well the district is accomplishing its goals (see the sidebar for a list of KPMs).2
VUE Fall 2013 23
24 Annenberg Institute for School Reform
This positioning of CRIS has ensured a coherent K–12 effort by our three CRIS schools – Lowell Elementary, Hoover Middle, and Lincoln High, which together create a college readiness pipeline throughout one feeder cluster of schools – and created a model for districtwide rollout of college and career readiness indica-tors.3 CRIS teams working on indicators at the school and district (setting and systems) levels4 success-fully implemented what we refer to as data intervention cycles, which use data to identify struggling students, match the students with supports, and then evaluate the effectiveness of the supports. The district has used these cycles to begin building a culture of evidence-based practices districtwide.
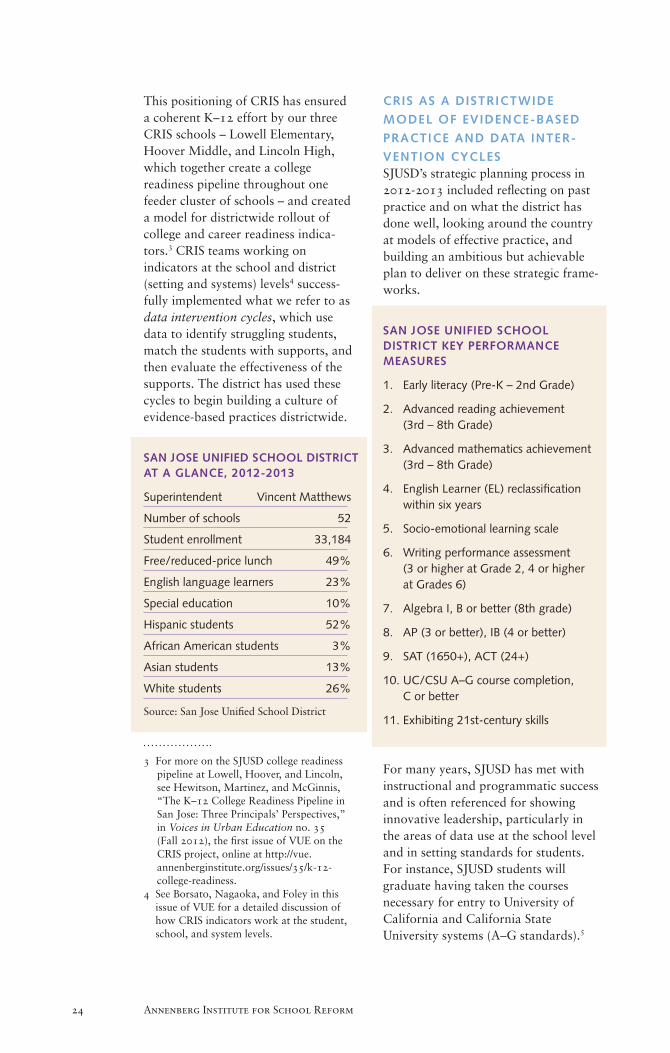
SAN JOSE UNIFIED SCHOOL DISTRICT AT A GLANCE, 2012-2013
Superintendent Vincent Matthews
Number of schools 52
Student enrollment 33,184
Free/reduced-price lunch 49%
English language learners 23%
Special education 10%
Hispanic students 52%
African American students 3%
Asian students 13%
White students 26%
Source: San Jose Unified School District
CRIS AS A DISTRICTWIDE
MODEL OF EVIDENCE-BASED
PRACTICE AND DATA INTER-
VENTION CYCLESSJUSD’s strategic planning process in 2012-2013 included reflecting on past practice and on what the district has done well, looking around the country at models of effective practice, and building an ambitious but achievable plan to deliver on these strategic frame-works.
SAN JOSE UNIFIED SCHOOL DISTRICT KEY PERFORMANCE MEASURES
1. Early literacy (Pre-K – 2nd Grade)
2. Advanced reading achievement (3rd – 8th Grade)
3. Advanced mathematics achievement (3rd – 8th Grade)
4. English Learner (EL) reclassification within six years
5. Socio-emotional learning scale
6. Writing performance assessment (3 or higher at Grade 2, 4 or higher at Grades 6)
7. Algebra I, B or better (8th grade)
8. AP (3 or better), IB (4 or better)
9. SAT (1650+), ACT (24+)
10. UC/CSU A–G course completion, C or better
11. Exhibiting 21st-century skills
For many years, SJUSD has met with instructional and programmatic success and is often referenced for showing innovative leadership, particularly in the areas of data use at the school level and in setting standards for students. For instance, SJUSD students will graduate having taken the courses necessary for entry to University of California and California State University systems (A–G standards).5
3 For more on the SJUSD college readiness pipeline at Lowell, Hoover, and Lincoln, see Hewitson, Martinez, and McGinnis, “The K–12 College Readiness Pipeline in San Jose: Three Principals’ Perspectives,” in Voices in Urban Education no. 35 (Fall 2012), the first issue of VUE on the CRIS project, online at http://vue. annenberginstitute.org/issues/35/k-12- college-readiness. 4 See Borsato, Nagaoka, and Foley in this
issue of VUE for a detailed discussion of how CRIS indicators work at the student, school, and system levels.
Lambrina Kless VUE Fall 2013 25
However, gaps in achievement continue to exist, particularly for San Jose’s Hispanic students. As the district worked toward closing the opportunity gaps among our students, there were several strategies that the organization leveraged to help propel work forward. While all of the elements of the strate-gic plan are important, there are a vital few that will help to jumpstart the efforts to accomplish our new mission. CRIS work, specifically, supported the district’s commitment to data-driven decision making. Our plan was to build on existing, good systems to reinforce behaviors that channel more resources and support to our students in most need. These include targeted academic programs, curricula, and interventions before, after, and during school for students who are struggling with core subjects and literacy; individualized adult support for students with behav-ioral and socio-emotional difficulties; and college advising in the areas of navigating the application and financial aid process for college-eligible students who might otherwise not receive support in overcoming these barriers to college entry and enrollment. This was driven primarily by the publication of our Key Performance Measures (KPMs), which both guided the organization and held it accountable for results. The CRIS program was critical to allowing us to validate our measures and to pilot systems of action based on these indicators.
During 2010 to 2012, the SJUSD CRIS team put in place these key evidence-based structures, practices, and processes:
• created a CRIS District Team, thereby ensuring system-level supports for college readiness focus and work;
• created school-level teams at the feeder pattern schools Lowell Elementary, Hoover Middle, and Lincoln High, to implement data intervention cycles that support student success at the setting level;
• conducted ongoing retreats to share out best practices;
• established biweekly meetings of the District CRIS team and each site team; and
• shared our work with other partner districts in the CRIS network.
BUILDING A CULTURE OF
EVIDENCE USE THROUGH CRIS
SITE TEAMS
The CRIS site teams used data intervention cycles, which involved using data to:
• identify a struggling group of students, using indicators in three dimensions of college readiness: academic preparedness, academic tenacity, and college knowledge (see the article by Borsato, Nagaoka, and Foley in this issue of VUE);
• design interventions to support these students and improve their success;
• evaluate the effectiveness of the interventions; and
• scale them out to the rest of the school.
These cycles and the CRIS school teams have become a model of evi-dence-based practice that the district subsequently planned to scale out in
5 The A–G curriculum is a series of college preparatory courses that high school students must take to be eligible to enter the University of California and California State University systems. See etools.berkeley. edu/resources.php?cat_id=22 for more information.
26 Annenberg
Institute for School Reform
2012-2013 and beyond through cross-functional groups called (OP-STAT) teams6 that represent different departments, roles (principals, teach-ers, counselors, district administrators), and levels (elementary, middle, and high), and engage in deep inquiry around one of the eleven KPMs. In the 2012-2013 school year, SJUSD launched three OPSTAT teams that focused on increased AP/IB participa-tion and performance, socio-emotional learning, and graduation rates and completion of A–G requirements. Three to four additional OPSTAT teams per year will tackle other KPMs in the coming school years, starting with early literacy in 2013-2014.
During year one of work (2012-2013 for the first wave of teams), OPSTAT teams engaged in intense and focused data analysis to identify the thresholds to be used in developing different tiers
of supports for students. The teams also examined and selected the most effective strategies to improve student success on the particular KPM. The teams published reports and/or shared
findings with the rationale behind the KPM and its significance, data exam-ined, evidence-based processed implemented, recommended interven-tions, and implementation and monitoring processes for school sites to put these supports to action.
In 2013-2014 and beyond, school-level teams that are CRIS-like will continue the work of each KPM’s OPSTAT team at their sites, to ensure roll-out and sustainability of the evidence-based practices and beliefs. SJUSD is building out a district accountability system based on reports that track schools’ KPM progress. Reports will be auto-mated and sent out on alerts through the new Data Warehouse and Business Intelligence Tool to which the district is transitioning in 2013-2014. KPM reports will be customized for different levels within the organization, includ-ing senior leadership, site leadership, and teachers. Site and district OPSTAT teams will use these reports, with support from the district office, to monitor the success of interventions at the setting and system levels.
School data teams, modeled on CRIS and OPSTAT teams, will conduct annual inquiry cycles in accordance with the following projected timeline:
• research and investigate thresholds for struggling students: first and second quarter of the school year;
• identify and plan for effective interventions and supports for struggling students: third quarter; and
• implement interventions and supports: fourth quarter and summer.
Throughout this process, the teams will consistently communicate their work to other site staff to elicit buy-in and build capacity for implementation of the selected strategies.
“ “The district will forge ahead with efforts to
map out supports and interventions and
track these consistently through emerging
data system capabilities.
6 “OPSTAT (‘OP’ for Opportunity 21 and ‘STAT’ for statistics and its data-driven nature) is a process whereby teams composed of both site and central office staff create replicable practices to improve student outcomes” (from www.sjusd.org/schools/documentation/downloads/Data_Research_Eval_Handbook.pdf).
Lambrina Kless VUE Fall 2013 27
ONGOING INDICATOR
DEVELOPMENT AND
IMPLEMENTATION
The district CRIS team and the three CRIS schools continued refining indicators of academic preparedness, academic tenacity, and college knowl-edge at the individual and setting levels. Teams continued to meet on a regular basis to assess progress, share challeng-es, and make mid-course corrections based on implementation feedback and evidence. Retreats took place at the beginning of each school year for the school and district CRIS teams to share indicator development and data collection results for each chosen indicator and to cement lessons learned for K–12 expansion of CRIS work.
SJUSD also made advances in the selection of indicators and the imple-mentation of a CRIS at the elementary and middle school levels, with the goal of informing and influencing a K–12 trajectory of college readiness begin-ning with the early grades. SJUSD partnered with the Everyone Graduates Center at Johns Hopkins University. This partnership, through direct collaboration around the socio-emo-tional learning OPSTAT team, helped us to identify when off-track indicators emerged in the academic tenacity trajectory of our students at the elementary and middle school levels and what interventions from grade to grade could be most effective to bring students back on track. Our Hoover Middle School CRIS team, in particu-lar, has been implementing a micro-process intervention strategy since August 2011.
LOOKING AHEAD
We are confident that SJUSD will continue making advances on the most persistent challenges to developing and scaling a CRIS. The district will take advantage of a new user-friendly data warehouse and reporting tools to position CRIS work and its offshoots (like OPSTAT) so as to increase data capture of online learning technologies related to college readiness in the years to come. SJUSD will continue to scale out CRIS work and processes across school sites and the central office through OPSTAT district and site teams.
Efforts are also in place to validate our high schools’ selection of indicators and how they map to indicators at the elementary and middle school levels, as well as to explore the development of predictive models around the CRIS work. We will also forge ahead with efforts to map out supports and interventions and track these consis-tently through emerging data system capabilities. The district is poised to leverage the success and lessons learned from CRIS efforts to date in order to create a scalable framework that will guide overall KPM efforts in data collection and reporting; data-based decision-making (use of data and goal-setting based on measures’ cut points); implementation strategies for interventions and supports based on the data analysis; and the extension of CRIS work to other sites in conjunc-tion with the roll-out of KPMs.
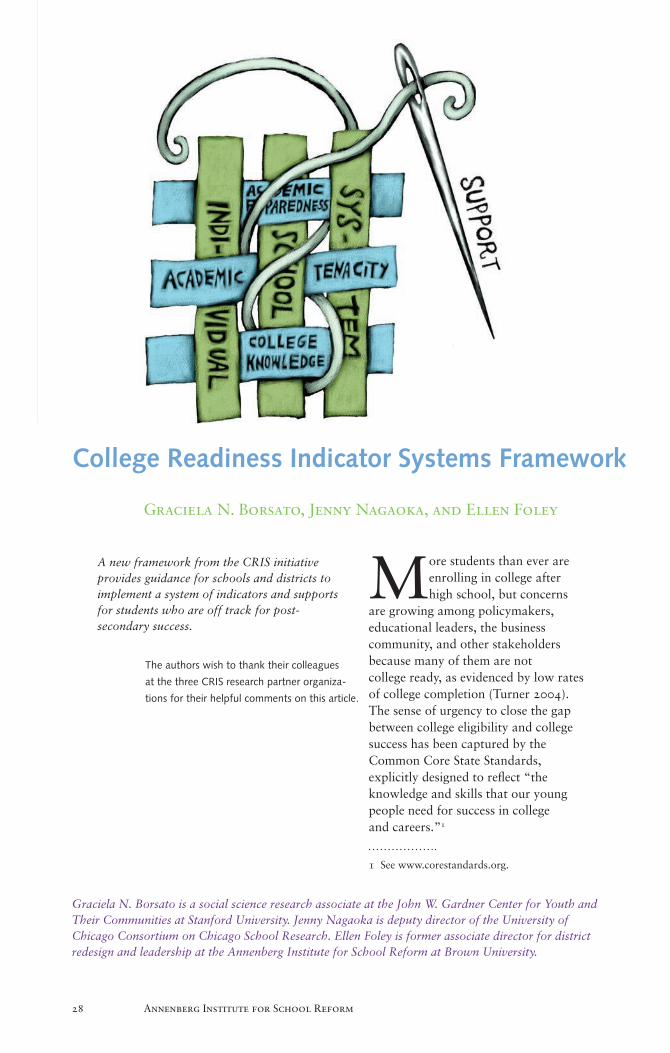
28 Annenberg Institute for School Reform
More students than ever are enrolling in college after high school, but concerns
are growing among policymakers, educational leaders, the business community, and other stakeholders because many of them are not college ready, as evidenced by low rates of college completion (Turner 2004). The sense of urgency to close the gap between college eligibility and college success has been captured by the Common Core State Standards, explicitly designed to reflect “the knowledge and skills that our young people need for success in college and careers.”1
Graciela N. Borsato is a social science research associate at the John W. Gardner Center for Youth and Their Communities at Stanford University. Jenny Nagaoka is deputy director of the University of Chicago Consortium on Chicago School Research. Ellen Foley is former associate director for district redesign and leadership at the Annenberg Institute for School Reform at Brown University.
College Readiness Indicator Systems Framework
Graciela N. Borsato, Jenny Nagaoka, and Ellen Foley
A new framework from the CRIS initiative provides guidance for schools and districts to implement a system of indicators and supports for students who are off track for post- secondary success.
The authors wish to thank their colleagues
at the three CRIS research partner organiza-
tions for their helpful comments on this article.
1 See www.corestandards.org.
Graciela N. Borsato, Jenny Nagaoka, and Ellen Foley VUE Fall 2013 29
In the face of the higher expectations embedded in the new standards, districts must look beyond the goal of high school graduation to ensure that their students graduate ready for college and career. To that end, an important task is to link information about the perfor-mance of high school students to their post-secondary enrollment and degree attainment, and districts increasingly have access to data that allows them to do just that. The wealth of information now available creates an unprecedented opportunity for district administrators, educators, and community partners to monitor and support students in attaining their educational aspirations.
However, the ready availability of data is just a starting point. Increasing college readiness and success rates among students, particularly histori-cally underrepresented students, will require ways to measure college readiness that go beyond test scores and grades. It will require indicator systems that identify students who fall off track and assess the effectiveness of the supports and interventions used in response. It will also require fostering a culture of data inquiry in schools and school systems and building the capacity of administrators, educators, and community partners to effectively use data in supporting students.
Furthermore, education stakeholders need a framework to link a vision for college readiness to specific and multidimensional constructs of readi-ness, measurable and valid indicators, data use, and supports and interven-tions. As partners in the College Readiness Indicator Systems (CRIS) initiative, the Annenberg Institute for School Reform at Brown University, the John W. Gardner Center for Youth and Their Communities at Stanford University, and the University of Chicago Consortium on Chicago School Research have worked with four urban districts and one school support network to develop and study the implementation of a system of indicators and supports designed to significantly increase students’ readiness to enter and succeed in college.2 This collaborative work has helped deepen our understanding of the interconnect-ed elements and strategies necessary for an effective college readiness indicator system, which we describe in this article as the CRIS framework.
The CRIS framework is meant to provide guidance to district administra-tors, community partners, and educators in building and implement-ing an indicator system that monitors students and guides the allocation of supports and resources to ensure that
2 The CRIS partners worked in three urban school districts – Dallas Independent School District, Pittsburgh Public Schools, and San Jose Unified School District – and one school support network, New Visions for Public Schools in New York City, to develop this framework. AISR also worked with the School District of Philadelphia to explore the partnerships that sustain college readiness indicator systems.
“ “Increasing college readiness and success
rates among students, particularly histori-
cally underrepresented students, will
require ways to measure college readiness
that go beyond test scores and grades.
30 Annenberg Institute for School Reform
more students finish high school ready to be successful in college and career. The work of building this system in response to new national college readiness expectations is still in an early stage, and in that spirit we will share promising strategies emerging from the experiences of the CRIS sites in several CRIS tools and resources, now in development, which will be available in 2014.
THE CRIS FRAMEWORK:
A SYSTEMATIC APPROACH TO
KEEPING STUDENTS ON TRACK
FOR COLLEGE READINESS
Many school systems already have in place “early warning systems” to keep their students on track to high school graduation.3 The CRIS framework builds upon and enhances existing early warning systems in several ways.
First, CRIS looks beyond high school graduation and college eligibility to target college readiness. Moreover, most monitoring systems currently in use focus on academic preparation, as defined by a limited number of academic measures such as course credit and grade point average. But educators are increasingly aware that academic content alone is not enough to ensure success. CRIS conceptualizes college readiness not just as academic preparation but also as the knowledge,
beliefs, and attitudes necessary to access college and be successful once in college.4
Second, the CRIS framework recog-nizes that indicators are needed at three levels: individual (student), setting (school), and system (district). Individ-ual-level indicators help identify students who need support. Setting- and system-level indicators serve to monitor whether the conditions are in place to promote college readiness and inform decision-making (e.g., allocation of resources; design of new policies) when those conditions are not met.
Finally, CRIS recognizes that the responsibility for making college readiness supports available goes beyond the district. The CRIS indica-tors and their respective cycles of inquiry can serve to mobilize efforts by the district and its community partners to establish a citywide network of college readiness supports directly aligned with the needs identified in the student population. Indicators and cycles of inquiry also serve to monitor the effectiveness of those supports. In this way, CRIS affords flexibility and attention to local variation in needs, capacity, and opportunities and guides use of resources available in the community to provide the supports and interventions that prove to be most effective for college readiness.
FRAMEWORK COMPONENTS
The CRIS framework, depicted in Figure 1, provides a conceptual foundation for the development and implementation of college readiness indicator systems.
3 In a previous issue of Voices in Urban Education presenting the CRIS work Oded Gurantz and Graciela Borsato (2012) of the Gardner Center outlined an early version of the CRIS framework (see http://vue.annenberginstitute.org/issues/35/building-and-implementing). This article incorporates and refines some of the material from that earlier version.
4 For a review of the research on noncognitive factors, see Nagaoka et al. in this issue of VUE. For a concrete example of the need to go beyond academic preparation, see Jayda Batchelder and Courtnee Benford’s piece in this issue of VUE on Education Opens Doors in Dallas.
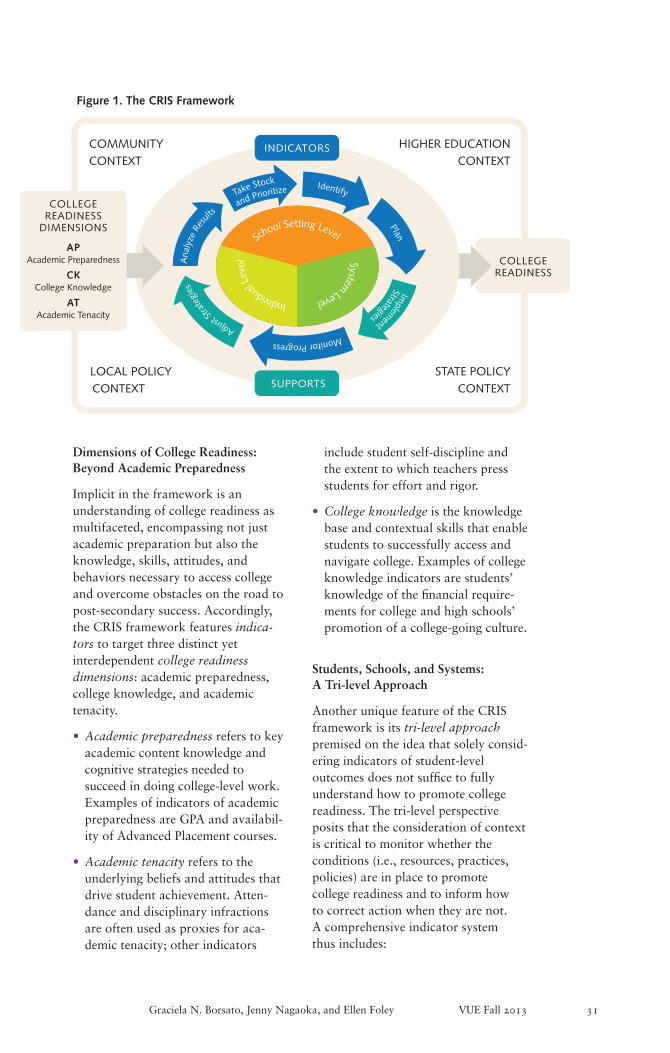
Graciela N. Borsato, Jenny Nagaoka, and Ellen Foley VUE Fall 2013 31
Dimensions of College Readiness: Beyond Academic Preparedness
Implicit in the framework is an understanding of college readiness as multifaceted, encompassing not just academic preparation but also the knowledge, skills, attitudes, and behaviors necessary to access college and overcome obstacles on the road to post-secondary success. Accordingly, the CRIS framework features indica-tors to target three distinct yet interdependent college readiness dimensions: academic preparedness, college knowledge, and academic tenacity.
• Academic preparedness refers to key academic content knowledge and cognitive strategies needed to succeed in doing college-level work. Examples of indicators of academic preparedness are GPA and availabil-ity of Advanced Placement courses.
• Academic tenacity refers to the underlying beliefs and attitudes that drive student achievement. Atten-dance and disciplinary infractions are often used as proxies for aca-demic tenacity; other indicators
include student self-discipline and the extent to which teachers press students for effort and rigor.
• College knowledge is the knowledge base and contextual skills that enable students to successfully access and navigate college. Examples of college knowledge indicators are students’ knowledge of the financial require-ments for college and high schools’ promotion of a college-going culture.
Students, Schools, and Systems: A Tri-level Approach
Another unique feature of the CRIS framework is its tri-level approach premised on the idea that solely consid-ering indicators of student-level outcomes does not suffice to fully understand how to promote college readiness. The tri-level perspective posits that the consideration of context is critical to monitor whether the conditions (i.e., resources, practices, policies) are in place to promote college readiness and to inform how to correct action when they are not. A comprehensive indicator system thus includes:
Figure 1. The CRIS Framework
COLLEGEREADINESS
COMMUNITY CONTEXT
LOCAL POLICY CONTEXT
HIGHER EDUCATION CONTEXT
STATE POLICYCONTEXT
INDICATORS
SUPPORTS
System
Level Individual L
evel
School Setting Level
COLLEGEREADINESS
DIMENSIONS
APAcademic Preparedness
CKCollege Knowledge
ATAcademic Tenacity
School And Classroom Context
SOCIO-CULTURAL CONTEXT
Academic Mindsets
Academic PerseveranceSocial Skills Learning Strategies
Academic Behaviors
Academic Performance
Stud
ent
Back
grou
nd C
hara
cter
istic
s
Ana
lyze
Res
ults
Take Stock
and Prioritize Identify
PlanIm
plem
ent
Strategies
Monitor ProgressAdjust
Strat
egie
s
Ana
lyze
Res
ults
32 Annenberg Institute for School Reform
• At the individual level, indicators measure students’ personal progress toward college readiness. In addition to courses and credits, individual-level indicators include knowledge about college requirements and students’ goals for learning.
• At the setting level, indicators track the resources and opportunities for students provided by their school. These include teachers’ efforts to push students to high levels of academic performance, a high school’s college-going culture, and availability of Advanced Placement courses.
• At the system level, the focus of the indicators is on district policy and funding infrastructure that impact the availability of college readiness supports, including guidance counselors, professional development for teachers, and resources to support effective data generation and use. System-level indicators are crucial in that they signal the extent to which district-level resources are in place to carry out an effective college readiness agenda.
The three dimensions of college readiness, when combined with the three levels, give rise to a 3 x 3 matrix that we call the “CRIS Menu.” The indicators in the CRIS menu reflect an extensive review of the research literature on high school factors that predict college readiness. By selecting indicators from the CRIS menu that are directly relevant to their own context, districts construct an indicator system that is evidence-based and attuned to their unique goals and priorities.5
Tying the Indicators to Supports
In addition to indicators, organized into three dimensions and three levels, the CRIS framework features college readiness supports. These refer to programs or activities that are enacted in order to effect some intended change in performance, behavior, or environ-ment. In some cases, supports target students (e.g., tutoring program; workshop on how to complete the Free Application for Federal Student Aid, or FAFSA) and in others they target adults (e.g., availability of a data coach who can facilitate staff conversations about data; professional development for teachers around college readiness).
The cycle of inquiry process, depicted as the consecutive circular arrows in Figure 1, is the mechanism that connects indicators with supports. The cycle of inquiry serves to:
• guide the process of identifying students (the individual level) who need help and connecting them with the appropriate supports (e.g., tutoring, counseling, etc.);
• enable stakeholders to examine whether resources are available (e.g., data infrastructure, professional development for teachers) and policies in place (e.g., consistent attendance policy) at the setting (school) and system (district) levels to promote college readiness;
• help leadership establish effective processes and structures for using indicators.
Ultimately, close monitoring of indicators and timely action as appro-priate will increase the chances that more students attain the combination of skills, knowledge, and attitudes needed by the time they finish high school in order to access college and succeed once they are in college.
5 See Gurantz and Borsato (2012) for an early version of the CRIS menu and examples of how districts might use it. A new version, in development, is scheduled for release in 2014.
Graciela N. Borsato, Jenny Nagaoka, and Ellen Foley VUE Fall 2013 33
The process of using indicators to monitor progress toward college readi-ness and to activate supports and interventions when needed is embedded in the community, policy, and higher education context, represented by the larger background rectangle. The context captures outer conditions that impact – positively or negatively – the ability of students to be college ready. These include the current state and local education policy around college readiness (e.g., high school graduation require-ments; availability, accessibility, and affordability of higher education) and the extent of collaboration across multiple sectors of the community (including those that interact with the district) to build college readiness partnerships, share data, and establish mutual priori-ties to support college readiness.
Some of these contextual conditions are within the locus of control of district leaders; some are not. Either way, they influence how college readiness is defined, developed, and deployed in a school district. Com-bined with system-level indicators, the context shapes how effectively CRIS can be implemented, who is involved in it, and what kinds of resources and supports are available to them.
BUILDING A COLLEGE
READINESS INDICATOR SYSTEM
The process of building a CRIS involves much more than a district selecting indicators from the CRIS Menu that are directly relevant to its strategic mission and current priorities. A successful CRIS district will carefully plan the timeline for data collection and analysis, assess and respond to data infrastructure needs, and assign staff roles and responsibilities associ-ated with indicators. In other words, the district maps the conditions for each indicator that will allow for its systematic and effective use. This process may sound simple in theory
but it is challenging in practice. Its importance, however, cannot be overstated.
This close examination of a given indicator also allows for the identifica-tion of potential challenges and bottlenecks when it comes to actually using the indicator to inform action, including human resistance to change and internal politics, and taking proactive steps to handle those effec-tively. Concerns may also be uncovered about the quality of the currently available data (e.g., the way in which student attendance is collected varies across schools) or about capacity issues around collecting and understanding data (e.g., training is needed to bring teachers up to speed with a new student information system). Similarly, system strengths may be identified that support the transition from data to action, such as a districtwide culture of data use that is already in place.
Ultimately, the challenge of developing an effective CRIS involves more than the presence or absence of valid, reliable, relevant indicators. It requires attention to issues of data use – how to support action – which, if not ad-dressed up front, are bound to jeopardize CRIS efforts. It also requires examination of the supports that adults in the system need in order to collect, use, and act on data. Administrators and teachers need time to reflect on the meaning of data and to know what questions their data can and cannot answer or how to interpret complex relationships in the data. The users – administrators, board members, teachers, parents, students – of the CRIS must be involved in its develop-ment and implementation. This involvement will likely facilitate the emergence of a common language and common set of goals around college readiness, ensure buy-in, and also increase the chances that the end product meets users’ needs and will be sustained and deepened.
34 Annenberg Institute for School Reform
USING A COLLEGE READINESS
INDICATOR SYSTEM: THE
CYCLE OF INQUIRY
Building a culture within organizations around data use depends on having a process for data inquiry that guides how data are used and the adoption of supports and policies around college readiness. The cycle of inquiry illus-trates what data use looks like in action and helps guide what components are needed for an effective data system.
We have identified six stages in the cycle of inquiry (Figure 1) for any given indicator selected by a district from the CRIS Menu:
1. Take stock and prioritize
2. Identify
3. Plan
4. Implement strategies, policies, and interventions
5. Monitor progress and adjust as needed
6. Analyze results
The first two steps of the cycle occur at the beginning of each school year, For a given indicator, the district takes stock of student population patterns relative to that indicator across schools and prioritizes actions to take. A parallel process occurs at the school level, where each school takes stock of where it is with regard to that indicator – data collected, supports available, proce-dures in place, etc., and prioritizes actions. The school then identifies and examines its own students relative to the target indicator in order to organize information for planning, since the population of students can change each year. Schools can also create lists of students who may require additional monitoring and support.
At the district level, the third step, plan, involves determining what resources are available to each school to serve students, particularly subgroups with specific needs (e.g., AP courses for students with a GPA above 3.0), and what barriers may exist to developing and carrying out a plan for providing additional resources or guidance. The district can also set college readiness goals for each school based on their student characteristics identified in the previous step. At the school level, student data should be organized to set long-term and intermediary goals and benchmarks, and the supports, inter-ventions, and policies needed to meet those goals should be planned.
Throughout the school year, as districts and schools implement the strategies, interventions, and policies, data should be collected so that the district and schools can monitor progress and make adjustments as needed. It is critical that the data systems are organized to provide timely and easily accessible data to schools so they can monitor progress toward goals and adjust policies, supports, and interven-tions. Educators should closely watch the progress of students and identify and diagnose which students need additional supports.
Finally, at the end of the school year, the district and schools analyze results and assess schools’ performance on indicators and their progress toward goals, paying close attention to the performance of subgroups. The analysis of results also lays the groundwork for plans for following year. Data inquiry is an ongoing process that allows districts and schools to use information to refine and improve their college readiness efforts across school years.
Graciela N. Borsato, Jenny Nagaoka, and Ellen Foley VUE Fall 2013 35
SUMMARY
The CRIS framework is intended as a tool to help districts and schools implement the conditions, processes, and supports needed to increase the number of students who finish high school ready to be successful in college. This means intervening early and matching identified students with the supports they need – but also address-ing the skills, capacities, and attitudes of adults working in all parts of the school system.
Changing cultures and the policies and practices they reinforce often requires engaging stakeholders about the imperative for setting new goals and for using data aligned with the district’s current needs, rather than historical ones. It requires a system with the willingness and resources to develop ongoing cycles of inquiry that use data about college readiness to inform policy and practice. And it requires data about individual, school, and system levels, as well as across the dimensions of college readiness: academic preparation, academic tenacity, and college knowledge.
Increasing the college readiness and success rates for currently underrepre-sented populations such as low-income students, students of color, immigrants, and first-generation students also challenges decades of historical inequities and systemic disadvantages. Districts must then use CRIS in tandem with efforts to foster cultures, attitudes, and beliefs that reinforce the need to provide for all what was once reserved for some. It is important to recognize that shifting cultures and long-estab-lished processes and behaviors takes time and an improvement in outcomes will not be immediate. The investment is worthwhile, though, given that college readiness indicator systems not only provide the means to measure college readiness, but also develop the long-term capacity to spur, evaluate,
and adjust college readiness supports and help more and more students leave high school ready to succeed.
REFERENCES
Gurantz, O., and G. N. Borsato. 2012.
“Building and Implementing a College
Readiness Indicator System: Lessons from
the First Two Years of the CRIS Initiative,”
Voices in Urban Education 35 (Fall):5–15.
Turner, S. 2004. “Going to College and
Finishing College: Explaining Different
Educational Outcomes.” In College
Choices: The Economics of Where to Go,
When to Go, and How to Pay for It, edited
by C. M. Hoxby. Chicago, IL: University
of Chicago Press.
36 Annenberg Institute for School Reform
Saleem Ghubril is executive director of the Pittsburgh Promise.
The nonprofit community-based organization Pittsburgh Promise aims to help revitalize Pitts-
burgh and its public school system by offering college scholarships to any Pittsburgh Public School graduate who meets the academic requirements. Executive director Saleem Ghubril spoke with VUE guest editor Jacob Mishook about his organization’s successes and challenges.
What was the impetus for the creation of the Pittsburgh Promise?
Like many other promise programs from different cities,
we launched the Pittsburgh Promise because in addition to wanting to transform the quality of public educa-
tion in the city and make higher education accessible to our urban kids, we wanted to have something which might help us reverse decades-long population and enrollment declines. In the fifty years prior to the Promise, the city of Pittsburgh lost about 60 percent of its population and similarly, Pitts-burgh Public Schools lost about 60 percent of its enrollment. So our hope with the Promise was to add fuel to the school reform work that was then taking place and is still taking place today, to make higher education accessible but also give an incentive to families who already were in our city and had their kids enrolled in our schools to stay, as well as for those who weren’t in our city and in our schools to consider relocating and enrolling.
QA
The Pittsburgh Promise: A Community’s
Commitment to Its Young People
Saleem Ghubril
A community organization has mobilized resources to make a promise to every
public school student in Pittsburgh: if you do well in school, we’ll help with
the financial burden of attending college.
Saleem Ghubril VUE Fall 2013 37
Has the Promise helped stem the exodus of families from Pittsburgh?
That’s really hard to answer for a number of reasons. Not
enough time has passed for there to be a dramatic change at the macro level – population, enrollment, economy, work force. Those are among the long-term goals of the Promise. Also, it’s really hard to draw a cause-and-effect conclusion that because of the Promise people are now staying in the city, enrolling their kids, and coming to the city.
What I can say, however, without an ounce of hesitation, is that in the last two years, for the first time in fifty years, the population of Pittsburgh grew again. So the five-decades-long population decline seems to have come to a stop and the population is grow-ing, though the numbers are small. The rapid decline in the enrollment of the district has also slowed down, and in the last two years we’ve seen enroll-ment in kindergarten grow by 7 and 11 percent respectively. Those are encouraging things.
The RAND Corporation did an evalua-tion of the impact of the Promise, and they interviewed or surveyed nearly 500 families who have enrolled their kids in Pittsburgh public schools since the inception of the Promise and enrolled them in middle school.1 In other words, they had school-aged chil-dren before the Promise and their kids weren’t in Pittsburgh Public Schools, and RAND attempted to find out why they have since enrolled their kids. The families cited three reasons. The most often-cited reason was the Promise. The second and third reasons, which were really close second and third, were the reform work that took place in the district and the diversity of both culture and programs that Pittsburgh
Public Schools offer that other regional systems don’t.
What drew you to the work of the Pittsburgh Promise?
My wife and I moved to Pittsburgh in 1984 to start a
youth organization. We were hired by a local church to start a youth out-reach. We thought we would be here for three to five years and then go somewhere else, but we didn’t end up going anywhere else. I led that agency, called the Pittsburgh Project, from 1985 till 2008. The work of the Pittsburgh Project focuses on the community, fixing houses and provid-ing affordable housing for seniors and poor people and also youth develop-ment. It focuses on the micro level – on the individual child, the individual family, the individual senior citizen, and individual housing.
In December 2007 at our annual holiday party for our donors for the Pittsburgh Project, in my closing speech I said that I’m no longer content fixing houses for seniors on streets that remain unsafe for them. I’m no longer content helping kids with their home-work and sending them to schools that are failing them. And then I closed by saying if we really care about these populations, then we have to not shift focus but add to our focus some emphasis on the systems that impact our kids and our seniors the most and in particular, public schools and neighborhoods. And I closed by saying I don’t know how we’re going to go about doing that, but expect me in twelve months at the next holiday party to report back to you on our plan going forward. In April 2008, four months later, I was approached about leading the Pittsburgh Promise. That, for me, was one of those mo-ments where I thought, maybe it’s not the Pittsburgh Project that needs to make a shift from the micro to the macro, from the individuals to the
QQAA
1 See www.rand.org/pubs/monographs/MG1139.html.
38 Annenberg Institute for School Reform
system, maybe it’s a personal shift that I would make.
A COMMITMENT TO THE
YOUNG PEOPLE
OF PITTSBURGH
Who does the Pittsburgh Promise serve, and through what kind of activities?
The Pittsburgh Promise is its own freestanding nonprofit
organization. While we work very closely with Pittsburgh Public Schools as their key partner, and they are our key partner, we are not organization-ally and structurally a part of Pittsburgh Public Schools. The Promise is really a kind of partnership between the city of Pittsburgh and Pittsburgh Public Schools, the University of Pittsburgh Medical Center, and the Pittsburgh Foundation. We exist to serve kids who live in any one of our ninety urban neighborhoods in the city and attend any one of our fifty-seven traditional public schools or eight or nine public charter schools.
How many students has the Promise served?
In the last five years we have provided scholarships to about
4,100 students, and those scholarships added up to just over $36 million in the last five years. Our students have gone to 107 different higher education institutions in the Commonwealth of Pennsylvania. Some are public, some are private, some are four-year, some are two-year, some are trade or techni-cal, some are faith-based, some are secular, but basically every accredited post-secondary institution in Pennsylva-nia is eligible to receive Promise scholars and Promise scholarships.
What is the Promise’s financial commitment to students?
We have committed to up to $10,000 per year. We reward
longevity. Those who’ve been with us in the district and in our city from kindergarten, they get the maximum, which is $10,000. As kids started with us or moved into the city in elementary school, they get 95 percent, middle school they get 85 percent, and if they started with us on day one of ninth grade, they get 75 percent. So the range of the annual scholarship is between $7,500 and $10,000. It’s substantial, and it’s enough to give pause if you’re thinking about pulling your kid out of the city schools or moving out of the city. If you have more than one child, say you have three children, suddenly it’s a $120,000 college trust fund that you have for your kids. It’s a game-changer for many.
Have you had to turn any students away because of the financial crisis?
The Pittsburgh community’s support of the Promise has been
absolutely breathtaking, considering the economic realities of the last five years. In each of the last five years, we raised more each year than we spent. But that was the original funding model of the Promise, which was and continues to be that we raise more each year than we actually spend, and then we invest the balance in an endowment for future scholarships. We have established a small and growing endowment that has about $50 million in it right now.
We haven’t turned anybody away and hopefully, with hard work and God’s grace we will continue that trend and not turn anyone away. At the Promise basically our message is if you meet the criteria, you get it – it’s not a competi-tive thing where a thousand kids apply
QA
QA
QA
QA
Saleem Ghubril VUE Fall 2013 39
for 300 scholarships – and so far we’ve been able to honor that. And, of course, our board and I are deeply concerned about the sustainability of the model, so hardly a week goes by where I don’t have a meeting where we look very closely at the long-term projections. The question that haunts us all is, right now we’re talking about the Promise right now to every kid in Pittsburgh public schools – what has to happen for us to ensure that the current pre-kindergart-ners are guaranteed a scholarship when they graduate? That’s priority one. We have a clear path forward to honor that commitment but our hope is to be able to honor it for longer than today’s pre-K class.
THE CHALLENGES OF
PREPARING STUDENTS FOR
COLLEGE IN AN URBAN
SETTING
What kind of challenges do the Promise Scholars have in higher education?
Many of our kids are not adequately prepared. They are
graduating from urban schools – some of our fifty-seven schools are preparing their kids remarkably well, and some are very poorly preparing their kids. So the quality of our schools varies, and therefore the quality of the experience that our kids are having in terms of success in post-secondary institutions varies significantly.
Our students’ college knowledge is also a challenge, in terms of their persis-tence, our students’ study skills, their expectations about what kind of time they should spend each day on study-ing, seeking help, managing their time, managing their money, managing their stress. The fact that they have to buy books – for many that’s proven to be a surprise. So we need to do a better job equipping our kids with the right kind of college knowledge before they leave
our secondary schools. Lots of our kids are first-generation college students – that’s not unusual in urban districts – and families have underestimated what it takes for the student to be successful. Sometimes there are too many demands from home on the kid’s time that pull the kid away from focusing on their education.
Many of our kids have to keep part-time jobs, and some full-time. I know one student who carried three part-time jobs throughout her four years of college and still finished – remarkably, in four years. Part of it is an economic issue, when a full half of our kids have a zero expected family contribution on their FAFSA applica-tion. Another 25 percent have such a low EFC [expected family contribu-tion] that they’re eligible for a Pell grant or a need-based grant.
Some lack the drive. They got the scholarship, and they met the mini-mum requirements to get the scholarship with no problem – it’s that they didn’t necessarily have the drive to pursue higher education. So we learned about one kid who went to buy books then deregistered because the line at the bookstore was too long.
How many of the students end up with substantial student debt?
That’s a reality in every commu-nity, and certainly a reality for us. The total cost of attendance
to any one of the state universities in Pennsylvania is about $15,000 a year. Half of our kids have a zero expected family contribution, and 82 percent are eligible for Pell [federal] or state grants. So many of them are getting $8,000 or $8,500, the maximum, combined Pell or state grants. So if they choose to go to any one of our state schools, they get $8,000 from the federal govern-ment and the state government by way of free money. Our $10,000 can take them the distance, and they can
Q
Q
A
A
40 Annenberg Institute for School Reform
graduate without any debt. The only money they have to have is to buy a bus ticket or get a ride to get to the school and back.
Those who have the ability to get accepted to more selective schools and more expensive schools usually also get some institutional aid. The state universities don’t have institutional aid. Right now we have about fifteen or eighteen kids at the University of Pennsylvania. We have forty-five kids at Carnegie Mellon University. The full cost of attendance there is around $50,000 to $55,000. If they get the $8,000 from federal or state govern-ments and our $10,000, they still have a huge gap to fill. But those institutions give pretty substantial institutional aid to help students to cover the gap. And those kids are more likely to borrow money than not. But they’re going to great schools that prepare them for future success.
The group that I get much more concerned about are those who are being heavily recruited by some institutions that are expensive to attend, there’s not substantial financial aid, and they’re not being adequately prepared for post-secondary success. Those students who fall prey to that tend to be our most vulnerable population of students. We try to address that by our magazine articles and by our speeches but without saying, don’t go to this type of institu-tion or that one by name.
WORKING WITH PARTNERS
How do you work with Pittsburgh Public Schools?
The Promise’s success is very directly linked to the Pittsburgh
Public Schools’ success. The Promise can access and open doors of opportu-nity, but preparation for post-secondary success is provided by the Pittsburgh Public Schools. Thankfully, they are a
very willing and active partner in this work. So the current conversation that we’re having is focusing on ensuring three things. First, we are looking at Promise eligibility at the basic, mini-mum standards, which is simply maintaining a 2.5 cumulative GPA and 90 percent school attendance. However, Promise eligibility does not equal college readiness. So the next focus is college readiness, which has three components. One is academic readi-ness. We think that while 2.5 and 90 percent gets you a scholarship, aiming for a 3.0 or higher and 95 percent attendance gives you a higher rate of return in terms of success in college. Second, college readiness includes greater preparation in college knowl-edge. We have one school, for example, that requires their juniors and seniors to take a half a credit course in their junior year and half a credit course in their senior year that’s all about post-secondary preparation and college knowledge. The third component is about the aspirations, dreams, behav-iors, and habits of students.
Is there any data you wish you had that the district isn’t able to provide?
Because we have such a great relationship with the district,
there’s hardly anything we ask for that we don’t get. We may not get it as quickly as we would like – sometimes we have to stand in line – but I understand that those folks are working about as hard as they can. Our district had to lay off five hundred employees in the last year and a half due to budget cuts. Many of them are teachers, but our superintendent made really bold student-centered decisions to make the very first set of substantial cuts from central administration, where the immediate impact won’t be felt quite as quickly by students. Then, eventually, we have to get to the classroom. Nearly three hundred teach-
QA
QA
Saleem Ghubril VUE Fall 2013 41
ers were furloughed last year. We are well aware that the IT staff and the data staff are working much harder than they were previously and there are fewer than there used to be. We don’t get things quickly, but we get them.
How does the Promise work with institutes of higher education?
It’s been interesting to see which institutes of higher education
seem to be motivated by the Promise and which are not. Not surprisingly, the very large universities, like the University of Pittsburgh and Penn State, though they have a significant number of our students, our students represent a small sliver of their student population. We don’t necessarily see the personalization that we see at either smaller state universities or smaller liberal arts, four-year private schools like California University of Pennsylva-nia, or Indiana University, the University of Pennsylvania, or Edinboro University, also a small state university, and other private schools like Robert Morris University, Franklin and Marshall University, and Point Park University. There are others, but for those institutions there is a higher degree of personal attention that we’re seeing toward the Promise scholars.
Of course, they’re motivated by doing what’s in the best interest of the kids, but they see that there is a business opportunity that the Promise provides to smaller private schools and more expensive schools by making their schools more accessible with our scholarships. They are working harder at recruiting our students. But to us, even more important than that, they’re working harder at figuring out ways to retain our students, and some have started school clubs that are just for the Promise scholars. They want to retain this population of students for lots of reasons. They add diversity to the student body. They come with money in hand. They’re graduating
from an urban district that is re-engi-neering itself. They’re pushing those services to students rather than letting them happen passively.
How do you work with the local nonprofit and community-based organizations in Pittsburgh?
We have direct interaction with dozens of nonprofit organiza-
tions and afterschool programs. I occasionally get phone calls from foundation executives who say to me, “We are looking at a proposal from such and such an agency. Are they partnering with the Promise?” My answer almost always is that anybody who is working with students who live in our urban neighborhoods and go to our urban schools and is providing some educational support is a partner. In some cases, these are very informal partnerships that are centered more on the common mission. But in other cases, it’s a much more formal partner-ship where we might even have a contract to buy a service or support a service with an existing nonprofit.
For example, right now we are work-ing with twenty-five other agencies, including the department of human services, the United Way, the City of Pittsburgh, Pittsburgh Public Schools, A+ schools, which is kind of the watchdog organization here, the Office of Childhood Development at the University of Pittsburgh, and other partners that are focusing on a cam-paign to eliminate chronic absenteeism in our schools.
We work with a whole assortment of mentoring organizations to run a program that we call Be a Middle School Mentor. The goal of that program is to put 2,000 adult volun-teers who spend forty-five minutes a week, every week for the whole school year, in school with one middle school student. The focus of that initiative is all about Promise eligibility and readiness but also to begin to put
QA
QA
42 Annenberg Institute for School Reform
together some habits and some patterns, some behaviors, some priorities in place in middle school that could result in moving the needle in later years.
WORK HARD, AIM HIGH,
DON’T GIVE UP
What can other communities learn from the Pittsburgh
Promise?
In a way, we promised the moon at the beginning. And now that
we’ve been doing it for five years, I’ve asked myself a few times if we’ve over-promised. The work has been really hard. I think there’s a reason why some people have given up on urban public education, because it’s really a tough nut to crack. We have not given up on urban public educa-tion. We can’t with a clear conscience give up on urban public education.
So our commitment is unwavering, but the recognition of how big this giant is, how hard it is to slay it, I grow more aware of that with each passing day. I would personally prefer to err on the side of big dreams and big aspirations and big vision and miss them, rather than aim for that which is guaranteed and reach it. So I want to tell other communities: sure, dream big, aim high, work hard, don’t give up, but don’t expect it to be easy. Transform-ing urban public education, transforming quality of life in urban neighborhoods, and raising the money to make it happen, all from private sources – those are daunting tasks.
QA
VUE Fall 2013 43
THE PROVIDENCE CHILDREN AND YOUTH CABINET
Angela Romans and Rebecca Boxx
Angela Romans is a principal associate in district redesign and leadership at the Annenberg Institute for School Reform at Brown University (AISR). Rebecca Boxx is a principal associate at AISR and director of the Children and Youth Cabinet in Providence, Rhode Island.
While the battle rages at the national and local level about education reform and the most effective way to introduce change, a diverse group of stakeholders in Providence, Rhode Island, are collaborat-ing in innovative ways to address the issue of college and career readiness.
The Providence Children and Youth Cabinet (CYC) is a coalition of more than seventy agencies and institutions dedicated to improving results for the city’s youngest residents from cradle to career. One of the CYC’s work groups, High School to College and Career (HSCC), represents higher education, community-based youth development and college access organizations, business/workforce develop-ment, the public school district, the state education department, and other stakeholders. Led by AISR’s Angela Romans and Rhode Island KIDS COUNT’s Stephanie Geller, HSCC’s goal is to generate real-world solutions to support college readiness. The group has supported the district’s participation in the U.S. Department of Education’s FAFSA Completion Project and developed communications tools for a district campaign around new, more challenging and controversial state high school graduation requirements. With the CYC housed at AISR, Providence is able to learn and apply lessons directly from the College Readiness Indicator Systems project, described in this issue of VUE.
Two innovative approaches gaining traction in Providence have implications for other communities embarking upon a collective college readiness strategy. The first is a unique mechanism to share student-level data in order to tailor community-based and school-based supports for college-bound students. For decades, the inability of youth-serving agencies to understand the needs of their clients has lead to a “spray and pray” approach to programs and services with limited impact. Under a partnership service agreement with Providence Public Schools (PPSD) and using a new district data platform developed by Richer Picture, a software developer that helps schools to use technology to personalize teaching and learning, a consortium of HSCC members will not only be able to access data in real time to provide services, but will also reciprocate by providing the school department informa-tion to evaluate the effectiveness of different interventions.
This approach has allowed another innovation to emerge: a case management strategy for college readiness. Often employed in a mental health or family stability context, case management is also effective in bringing together partners to provide wraparound supports for students. In this system, HSCC members will intentionally provide specific supports aligned to students’ personal graduation plans, focusing on college readiness. The vision for a case management model for college and career readiness at PPSD came initially from Superintendent Susan Lusi. In its execution, the case manage-ment model will build the framework for what AISR refers to as a smart education system* – a school district and multiple cross-sector stakeholders working in partnership to provide a comprehensive web of opportunities and supports for its students, inside and outside of schools – focused on college readiness.
The potential benefits of the innovations are many. With real-time data and a case management system, organizations can tailor their services more effectively to meet students’ needs, prioritize delivery to the neediest students and schools, and better document and quantify their impact.
* See http://annenberginstitute.org/about/smart-education-systems.
44 Annenberg Institute for School Reform
The school district can finally understand which students are being served by the wide range of community organizations working in schools, evaluate which services are working well for kids, and identify and fill gaps in student supports and interventions. The model puts the district in a position to truly achieve college readiness for all by equitably matching school and community supports and interventions with student needs across the district.
We do anticipate challenges with these innovations. PPSD, like most urban districts, is stretched thin in many ways and may face capacity issues around coordinating the case management model at scale. Funding to support the ongoing use of Richer Picture data past a one-year pilot is still being sought. And many in the district are feeling the strain of the new high school graduation requirements, which could be seen by some as a competing priority to preparing students for college.
As a cradle-to-career collective, however, CYC’s HSCC work group members are helping keep the conversation focused past the immediate urgency in the district around high school graduation rates toward a broader vision for college and career readiness for all. Through pioneering college readiness case management buttressed by access to real-time, student-level data, we are building a system to ensure that our children and youth have equitable access to myriad community resources to prepare them for post-secondary opportunities and life in the twenty-first century.
VUE Fall 2013 45
Research shows that the eco-nomic payoff for having a college degree, versus a high
school diploma, is higher than ever (Carnavale, Rose & Cheah 2011). Youth in the United States have an understanding of this new economic dynamic; almost all high school students now say they expect to enroll in college (Engle 2007). However, despite large increases in college enrollment in the past fifteen years, completion rates have barely moved (U.S. Department of Education 2012). For the first time in U.S. history, retirees have greater levels of educa-
Jenny Nagaoka is deputy director of the University of Chicago Consortium on Chicago School Research (CCSR). Camille A. Farrington is a research associate (assistant professor) at the University of Chicago, School of Social Service Administration (SSA). Melissa Roderick is the Hermon Dunlap Smith Professor at the University of Chicago SSA and a senior director at CCSR. Elaine Allensworth is Lewis-Sebring director of CCSR. Tasha Seneca Keyes is a research assistant at CCSR. David W. Johnson is associate director of post-secondary studies at the University of Chicago SSA and CCSR. Nicole O. Beechum is a research assistant at CCSR.
Research has shown that in addition to academic knowledge, a variety of noncognitive skills are essential to students’ post-secondary success.
Note: This article is adapted from Farrington et al., Teaching Adolescents to Become Learners. The Role of Noncognitive Factors in Shaping School Performance: A Critical Literature Review (Chicago: CCSR, 2012).
Readiness for College: The Role of Noncognitive Factors and Context
Jenny Nagaoka, Camille A. Farrington, Melissa Roderick,
Elaine Allensworth, Tasha Seneca Keyes, David W. Johnson,
and Nicole O. Beechum
tional attainment than young adults entering the workforce (OECD 2013).
A host of education policies, enacted with the hope of reversing this trend by increasing academic demands, are now being implemented across the country, from raising graduation requirements to increasing participation in advanced coursework. More recently, the Common Core and Next Generation Science Standards are being instituted in states across the country,1 with the expectation that an articulated frame-work of content knowledge and core academic skills will lead to high school graduates who are better prepared for college and the workforce. These efforts to increase academic demands have largely coalesced around the term college ready.
1 As of September 2013, the Common Core State Standards are being adopted by forty- five states, the District of Columbia, and four territories.
46 Annenberg Institute for School Reform
While most policy efforts have focused on increasing academic preparation, there is also a growing recognition that being ready for college means not only building students’ content knowledge and academic skills, but also fostering a host of noncognitive factors – sets of behaviors, skills, attitudes, and strate-gies that are crucial to students’ academic performance and persistence in post-secondary education.2
A range of studies have found that noncognitive factors have a direct positive relationship to students’ school performance as well as their future outcomes. Nobel prize-winning economist James Heckman (Heckman & Rubinstein 2001) popularized the term noncognitive and argues that beyond academic knowledge and technical skills, noncognitive factors such as motivation, time management, and self-regulation are critical for later life outcomes, including success in the labor market. While there are decades of research on the myriad factors that have been tied to later academic and job market success, it is difficult for school practitioners to know how all of these factors fit together to affect students’ success.
This article summarizes a review by the University of Chicago Consortium on Chicago School Research (CCSR) that brought together hundreds of studies of factors that have been tied to academic success into a coherent framework of noncognitive factors (Farrington et al. 2012). The review paid close attention to identifying which noncognitive factors matter for students’ long-term success, clarifying why and how these factors matter, and determining if these factors are malleable and responsive to context and how they are related to each other. The goal of the literature review was to develop a coherent and evidence-based framework for consid-ering the role of noncognitive factors in increasing student attainment and to identify critical gaps in the knowledge base and in the link between research and practice. Parts of that review are excerpted here.
The CCSR review also suggests that post-secondary performance and persistence depends not only on the readiness of the individual student, but also the context of the college and the extent to which there is a fit between a student’s needs and the college environ-ment. This calls for a more expansive understanding of noncognitive factors and college readiness, looking beyond individual-level skills to consider the ways students interact with the educa-tional context within which they are situated, and the effects of these interactions on students’ attitudes, motivation, and performance. Major life transitions like starting college require students to adapt to new experiences and meet changing aca-demic demands. This suggests that efforts to promote educational attain-ment need to be mindful of not just the cognitive and noncognitive skills that make students “ready for college,” but also college choice and the role colleges play in supporting students in the pursuit of their educational aspirations.
2 For example, David Conley (2013) lists four areas of college readiness: cognitive strategies, content knowledge, transition knowledge and skills, and learning skills and techniques. The College Readiness Indicator System initiative recognizes three areas of college readiness: academic preparation, academic tenacity, and college knowledge. See Borsato, Nagaoka, and Foley’s article in this issue of VUE for more information.
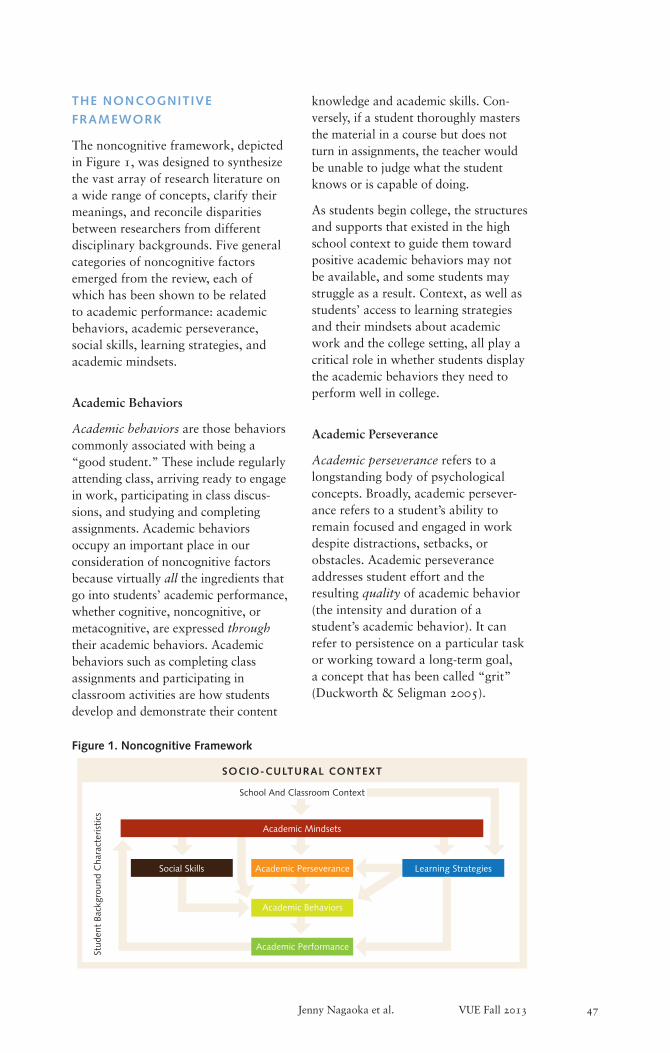
Jenny Nagaoka et al. VUE Fall 2013 47
THE NONCOGNITIVE
FRAMEWORK
The noncognitive framework, depicted in Figure 1, was designed to synthesize the vast array of research literature on a wide range of concepts, clarify their meanings, and reconcile disparities between researchers from different disciplinary backgrounds. Five general categories of noncognitive factors emerged from the review, each of which has been shown to be related to academic performance: academic behaviors, academic perseverance, social skills, learning strategies, and academic mindsets.
Academic Behaviors
Academic behaviors are those behaviors commonly associated with being a “good student.” These include regularly attending class, arriving ready to engage in work, participating in class discus-sions, and studying and completing assignments. Academic behaviors occupy an important place in our consideration of noncognitive factors because virtually all the ingredients that go into students’ academic performance, whether cognitive, noncognitive, or metacognitive, are expressed through their academic behaviors. Academic behaviors such as completing class assignments and participating in classroom activities are how students develop and demonstrate their content
knowledge and academic skills. Con-versely, if a student thoroughly masters the material in a course but does not turn in assignments, the teacher would be unable to judge what the student knows or is capable of doing.
As students begin college, the structures and supports that existed in the high school context to guide them toward positive academic behaviors may not be available, and some students may struggle as a result. Context, as well as students’ access to learning strategies and their mindsets about academic work and the college setting, all play a critical role in whether students display the academic behaviors they need to perform well in college.
Academic Perseverance
Academic perseverance refers to a longstanding body of psychological concepts. Broadly, academic persever-ance refers to a student’s ability to remain focused and engaged in work despite distractions, setbacks, or obstacles. Academic perseverance addresses student effort and the resulting quality of academic behavior (the intensity and duration of a student’s academic behavior). It can refer to persistence on a particular task or working toward a long-term goal, a concept that has been called “grit” (Duckworth & Seligman 2005).
Figure 1. Noncognitive Framework
COLLEGEREADINESS
COMMUNITY CONTEXT
LOCAL POLICY CONTEXT
HIGHER EDUCATION CONTEXT
STATE POLICYCONTEXT
INDICATORS
SUPPORTS
System
Level Individual L
evel
School Setting Level
COLLEGEREADINESS
DIMENSIONS
APAcademic Preparedness
CKCollege Knowledge
ATAcademic Tenacity
School And Classroom Context
SOCIO-CULTURAL CONTEXT
Academic Mindsets
Academic PerseveranceSocial Skills Learning Strategies
Academic Behaviors
Academic Performance
Stud
ent
Back
grou
nd C
hara
cter
istic
s
Ana
lyze
Res
ults
Take Stock
and Prioritize Identify
PlanIm
plem
ent
Strategies
Monitor ProgressAdjust
Strat
egie
s
Ana
lyze
Res
ults
48 Annenberg Institute for School Reform
Academic perseverance and its related concepts (e.g., grit, tenacity, self-control, delayed gratification) are defined in a range of ways. Dweck, Walton, and Cohen (2011) use the term academic tenacity to encompass not only whether students work hard or see work through to completion despite obstacles but also the factors that affect persever-ance – the mindsets and skills that underlie student persistence.3 Under this expanded definition, academic tenacity includes not only whether or not students persevere, but also the aca-demic mindsets (which encourage or inhibit continuing effort), academic skills (which make it easier or harder to complete tasks), learning strategies (which make students’ efforts more effective), and innate personality traits that shape behaviors.4 The CCSR framework keeps the specific mecha-nisms that can affect change in students’ academic persistence distinct so that practitioners can more easily under-stand how to develop more effective interventions and support programs.
In the college context, where students are being asked to do more challenging and often unfamiliar tasks, often with less support, academic perseverance becomes particularly important. Thus, both education policy and practice have sought ways to increase students’ academic perseverance to improve academic performance and college readiness. Educators might be tempted to try to increase students’ persever-ance by assigning large amounts of homework problems, or assigning particularly challenging tasks that will
be difficult to complete. However, such strategies are not supported by re-search; research suggests that perseverance is a trait that is not directly malleable and depends consid-erably on context. Instead, educators can increase students’ perseverance by affecting students’ beliefs and mindsets about their academic work (which encourage or inhibit continuing effort), increasing their academic skills (which make it easier or harder to complete tasks), and helping them develop learning strategies (which make their efforts more effective). Academic mindsets and learning strategies are two other categories of noncognitive factors; they are discussed later in this section.
Social Skills
Social skills include such interpersonal qualities as cooperation, assertion, responsibility, and empathy. Social skills are acceptable behaviors that improve social interactions, such as those between peers or between student and teacher. While there is evidence of the effect of social skills or behaviors on life and work outcomes, their effect on academic performance is unclear from the literature. Evidence is most clear that poor social skills are associated with negative outcomes. Most studies of social skills come from a broader field of research on social and emotional learning, which blends other noncogni-tive factors with social skills, making it difficult to assess the effect of enhanced social skills on academic outcomes.
Learning Strategies
Learning strategies are the processes and tactics employed to aid the cognitive work of thinking, remember-ing, or learning (e.g., mnemonic devices, metacognitive strategies, self-regulation). While much of the research is correlational rather than causal, there is a strong link between
3 Academic tenacity is one of the three dimensions of college readiness used by the College Readiness Indicator Systems framework described in Borsato, Nagaoka, and Foley’s article in this issue of VUE. 4 While there is strong evidence that these
other factors are associated with academic perseverance, the CCSR framework keeps them conceptually distinct from the degree to which one persists in academic work.

Jenny Nagaoka et al. VUE Fall 2013 49
the use of learning strategies and academic performance. Effective learning strategies allow students to leverage academic behaviors to engage in learning, which can be particularly important to meet the demands of more individualized learning in the college context. There is also evidence that suggests a strong relationship between learning strategies and perseverant behavior.
Academic Mindsets
Academic mindsets are beliefs, atti-tudes, or ways of perceiving oneself in relation to learning and intellectual work that promote academic perfor-mance. The theory and empirical evidence on academic mindsets draw on a long history of psychological research. Positive academic mindsets motivate students to be more persever-ant at tasks and display better academic behaviors, which lead to improved performance. The CCSR framework identifies four academic mindsets shown to contribute to academic performance, which are expressed in the first-person from the point of view of a student:
• I belong in this academic community (sense of belonging).
• My ability and competence grow with my effort (implicit theories of ability).
• I can succeed at this (self-efficacy).
• This work has value for me (expec-tancy-value theory).
Sense of belonging involves the perception that one has a rightful place in a given academic setting. Education-al theorists have long held that learning is a social activity and that understand-ing is constructed through interaction with others (Dewey 1958; Vygotsky 1978). Accordingly, students need to feel as though they belong to a commu-nity of learners (McMillan & Chavis
1986) and that their academic self is a “true” self (Harvey & Schroder 1963; Oyserman, Bybee & Terry 2006). As students transition to college, finding their place in an academic community can be a particular challenge, particu-larly for underrepresented minorities.
Implicit theories of ability rest on the belief that one’s academic ability can improve with effort, rather than ability being something one is born with. Students who believe they can increase their academic ability by their own effort are more likely to work hard, make the effort to build competence,
display academic perseverance, and exhibit behaviors associated with higher academic achievement (Cury et al. 2006; Dweck & Leggett 1988). A closely related line of research draws on attribution theory, exploring whether students attribute success and failure to ability versus effort and how these attributions affect their subse-quent reaction to similar tasks (Dweck 1975; Kelley 1973; Weiner 1986; Vispoel & Austin 1995).
Self-efficacy relates to beliefs that students have about their abilities to succeed at a given task. Individuals tend to engage in activities in which they feel confident in their ability to complete and to avoid those in which
“ “In the college context, where students are
being asked to do more challenging and
often unfamiliar tasks, often with less
support, academic perseverance becomes
particularly important.
50 Annenberg Institute for School Reform
they lack such confidence (Bandura 1986). Students are also more likely to persevere at a given task if they feel efficacious and are more likely to bounce back when faced with adversity (Pajares 1996).
Expectancy-value theory involves a student’s sense that the task at hand is interesting and holds value. Value can be variously defined as the importance of doing well on a task (attainment value); gaining enjoyment by doing a task (intrinsic value); or serving a useful purpose or meeting an end goal that is important by completing a task (utility value) (Wigfield & Eccles 2000). When students are interested in a subject or see a connection between academic tasks and their own future goals, they are more likely to exhibit academic and perseverant behaviors that make them likely to succeed in school.
The evidence clearly demonstrates that the four academic mindsets each increase students’ academic persever-ance and improve academic behaviors, leading to better performance. When students feel a sense of belonging in an academic community, believe that effort will increase ability and compe-tence, believe that success is possible and within their control, and see work as interesting or relevant to their lives, students are much more likely to persist at academic tasks despite setbacks and to exhibit the kinds of academic behaviors that lead to school success. Conversely, when students feel as though they do not belong, are not smart enough, will not be able to succeed, or cannot find relevance in the work at hand, they are much more likely to give up and withdraw from academic work and demonstrate poor academic behaviors.
Studies of college departure have also underscored the role of mindsets in whether students become integrated into the social and institutional life of colleges. For minority and first-genera-
tion college students, the transition to the college environment may also represent a first encounter with an unfamiliar and sometimes subtly hostile racial climate that may under-cut their commitment to obtaining a college degree and their academic behaviors and may even artificially depress their cognitive performance (Steele 1992, 1997; Yeager & Walton 2011). Recent research in social psychology suggests that isolated, relatively short interventions targeting students’ sense of belonging in a college setting can produce significant and lasting effects (Walton & Cohen 2007; Walton & Spencer 2009; Yeager & Walton 2011). This research suggests that the effects of students’ self-perceptions – as well as the underlying perceptions themselves – are largely dependent on context.
COLLEGE READINESS AND
THE ROLE OF CONTEXT
College readiness is often conceptual-ized as a set of skills, behaviors, attitudes, and knowledge, both cognitive and noncognitive, possessed by individual students that shape their likelihood of attaining a college degree. Our review of the literature on noncog-nitive factors suggests that college success rests on a combination of the cognitive and noncognitive factors that students bring from high school to the post-secondary context, as well as the post-secondary context itself. Persever-ance and academic behaviors can be thought of as the outcome of college contexts rather than simply personal qualities that students bring with them to college. Academic perseverance and academic behaviors can be improved upon by developing students’ academic mindsets and learning strategies. Academic mindsets strongly influence the degree to which students engage in academic behaviors, persevere at difficult tasks, and employ available learning strategies.
Jenny Nagaoka et al. VUE Fall 2013 51
Rather than seeing the goal as produc-ing students who are college ready regardless of where they enroll, it is equally important that students are making informed college choices.5 It may be most helpful to think about college readiness as a property of the interactions between students and the college context; students’ likelihood of attaining a degree also depends on the institutional characteristics of the colleges they attend. Students, particu-larly first-generation college students, may require differing levels of resourc-es and supports to make a successful transition to college.
Ultimately, the question is not just how to prepare students but also how to create college contexts that better support academic success. Thus, the responsibility for college readiness rests not just on students and their high schools developing cognitive skills and noncognitive factors, but also in post-secondary institutions being ready to support students in attaining a degree and high schools helping students make informed choices.
REFERENCES
Bandura, A. 1986. Social Foundations of Thought and Action: A Social Cognitive Theory. Englewood Cliffs, NJ: Prentice Hall.
Carnavale, A. P., S. J. Rose, and B. Cheah. 2011. The College Payoff: Education, Occupations, Lifetime Earnings. Washington, DC: Georgetown University Center on Education and the Workforce. www9.georgetown.edu/grad/gppi/hpi/cew/pdfs/collegepayoff-com-plete.pdf.
Coca, V., D. W. Johnson, T. Kelley-Kem-ple, M. Roderick, E. Moeller, N. Williams, and K. Moragne. 2012. Working to My Potential: The Post-secondary Experiences of CPS Students in the International Baccalaureate Diploma Programme. Chicago, IL: University of Chicago Consortium on Chicago School Research.
Conley, D. 2013. College and Career Ready and the Common Core: What Everyone Needs to Know. Portland, OR: Educational Policy Improvement Center.
Cury, F., A. J. Elliot, D. Da Fonseca, and A. C. Moller. 2006. “The Social-Cogni-tive Model of Achievement Motivation and the 2×2 Achievement Goal Frame-work,” Journal of Personality and Social Psychology 90:666–679.
Dewey, J. 1958. Experience and Education. New York: Macmillan.
Duckworth, A. L., and M. E. P. Selig-man. 2005. “Self-discipline Outdoes IQ in Predicting Academic Performance of Adolescents,” Psychological Science 16:939–944.
Dweck, C. S. 1975. “The Role of Expectations and Attributions in the Alleviation of Learned Helplessness,” Journal of Personality and Social Psychology 31, no. 4:674–685.
Dweck, C. S., and E. L. Leggett. 1988. “A Social-Cognitive Approach to Motivation and Personality,” Psycho-logical Review 95:256–273.
Dweck, C., G. M. Walton, and G. L. Cohen. 2011. Academic Tenacity: Mindsets and Skills That Promote Long-Term Learning. White paper prepared for the Gates Foundation. Seattle, WA: Gates Foundation.
Engle, J. 2007. “Post-secondary Access and Success for First-Generation College Students,” American Academic 3, no. 1:25–48.
5 For a closer look at the college choice process and role of noncognitive factors in the transition to college for urban students, see CCSR’s examination of International Baccalaureate students in Chicago neighborhood schools (Roderick et al. 2009; Coca et al. 2012).

52 Annenberg Institute for School Reform
Farrington, C., M. Roderick, E. Allen-sworth, J. Nagaoka, T. Keyes D. Johnson, and N. Beechum. 2012. Teaching Adolescents to Become Learners. The Role of Noncognitive Factors in Shaping School Performance: A Critical Literature Review. Chicago, IL: University of Chicago Consortium on Chicago School Research.
Harvey, O. J., and H. M. Schroder. 1963. “Cognitive Aspects of Self and Motiva-tion.” In Motivation and Social Interaction-Cognitive Determinants, edited by O. J. Harvey, pp. 95–133. New York: Ronald Press.
Heckman, J. J., and Y. Rubinstein. 2001. “The Importance of Noncognitive Skills: Lessons from the GED Testing Program,” American Economic Review 91, no. 2:145–149.
Kelley, H. H. 1973. “The Process of Causal Attribution,” American Psycholo-gist 28:107–128.
McMillan, D. W., and D. M. Chavis. 1986. “Sense of Community: A Definition and Theory,” Journal of Community Psychology 14 (January):6–23.
OECD. 2013. “Educational Attainment.” In OCED Factbook 2013: Economic, Environmental, and Social Statistics, OCED Publishing, http://dx.doi.org/10.1787/factbook-2013-77-en.
Oyserman, D., D. Bybee, and K. Terry. 2006. “Possible Selves and Academic Outcomes: How and When Possible Selves Impel Action,” Journal of Person-ality and Social Psychology 91:188–204.
Pajares, F. 1996. “Self-efficacy Beliefs in Academic Settings,” Review of Educa-tional Research 66:543–578.
Roderick, M., J. Nagaoka, V. Coca, and E. Moeller. 2009. From High School to the Future: Working to My Potential. Chicago, IL: University of Chicago Consortium on Chicago School Research.
Steele, C. M. 1992. “Race and the Schooling of Black Americans,” Atlantic Monthly 269, no. 4:68–78.
Steele, C. 1997. “A Threat in the Air: How Stereotypes Shape Intellectual Identity and Performance,” American Psychologist 52:613–629.
U.S. Department of Education, National Center for Education Statistics. 2012. The Condition of Education 2011. NCES 2012-045. Washington, DC: NCES.
Vispoel, W. P., and J. R. Austin. 1995. “Success and Failure in Junior High School: A Critical Incident Approach to Understanding Students’ Attributional Beliefs,” American Educational Research Journal 32, no. 2:377–412.
Vygotsky, L. S. 1978. Mind in Society: The Development of Higher Psychologi-cal Processes. Cambridge, MA: Harvard University Press.
Walton, G. M., and G. L. Cohen. 2007. “A Question of Belonging: Race, Social Fit, and Achievement,” Journal of Personality and Social Psychology 92:82–96.
Walton, G. M., and S. J. Spencer. 2009. “Latent Ability: Grades and Test Scores Systematically Underestimate the Intellec-tual Ability of Negatively Stereotyped Students,” Psychological Science 20:1132–1139.
Weiner, B. 1986. An Attributional Theory of Emotion and Motivation. New York: Springer-Verlag.
Wigfield, A., and J. S. Eccles. 2000. “Expectancy-Value Theory of Achieve-ment Motivation,” Contemporary Educational Psychology 25:68–81.
Yeager, D. S., and G. M. Walton. 2011. “Social-Psychological Interventions in Education: They’re Not Magic,” Review of Educational Research 81, no. 2:267–301.
FALL 2013
Annenberg Institute for School Reform • Voices in Urban Education
This book is printed on Environment® Paper. This 100 percent recycled paper reduces solid waste disposal and lessens landfill dependency. By utilizing this paper,
• 4.14 trees were preserved for the future.
• 2,979,128 BTUs of energy were conserved.
• 12.4 pounds of solid waste were not generated.
• 1,787 gallons of wastewater flow were saved.
• 389 pounds of greenhouse gases were prevented from forming.
Voices in U
rban Education C
olleg
e Read
iness In
dicato
r Systems: A
Framew
ork fo
r the Field
FA
LL
20
13
Building Capacity for College Readiness Indicator Systems
Jacob Mishook
Putting College and Career Readiness at the Forefront of District Priorities in Dallas
Shane Hall
Measuring Academic Tenacity: New Visions for Public Schools
Jared Carrano
Looking at the Right Data in the Right Way: Pittsburgh Public Schools
Peter Lavorini
San Jose Unified School District, 2010–2013: Building a Culture of Evidence-Based Practice around College Readiness
Lambrina Kless
College Readiness Indicator Systems Framework
Graciela N. Borsato, Jenny Nagaoka, and Ellen Foley
The Pittsburgh Promise: A Community’s Commitment to Its Young People
Saleem Ghubril
Readiness for College: The Role of Noncognitive Factors and Context
Jenny Nagaoka, Camille A. Farrington, Melissa Roderick, Elaine Allensworth, Tasha Seneca Keyes, David W. Johnson, and Nicole O. Beechum
Annenberg Institute for School Reform
Brown University, Box 1985
Providence, Rhode Island 02912
Web: www.annenberginstitute.org
Twitter: @AnnenbergInst
Facebook: www.facebook.com/AnnenbergInstituteForSchoolReform
Non Profit Org.
U.S. Postage
PAID
Providence, RI
Permit #202
College Readiness Indicator Systems:A Framework for the Field