WEATHERBURY COLLEGE MANAGEMENT ACCOUNTS FOR THE …
13
WEATHERBURY COLLEGE MANAGEMENT ACCOUNTS FOR THE PERIOD TO 31 JANUARY 2021 1. Headlines The operating performance for the year to date is an operating deficit of £575,000, which is £150,000 adverse to budget. This is principally accounted for by a shortfall in income to date of £202,000. The adverse performance to date is forecast to continue to year-end, the base case estimate is a forecast operating deficit for the year of £262,000 (£242,000 adverse to budget). Pay costs although lower than budget are forecast to be c68% of total income which is higher than the FEC financial benchmark of 65%. The forecast deficit is projected to result in a breach of loan covenants at year-end. The college is actively engaged with the bank to secure a waiver pending further dialogue to review the current covenants and loan facilities. Financial health is forecast to remain requires improvement, though with minimal headroom above the threshold for inadequate. Failure to secure timely agreement with the bank and external auditors would almost certainly result in a decline in the financial health grade to inadequate. Indicator Current Status RAG Change Operating surplus/deficit (excl. FRS102) Forecast outturn is £242k behind budget at £262k deficit Income Total income is £202k lower than budget YTD, and forecast to be £356k lower than budget by the end of the year. Main issues are AEB and HE. Pay costs Total pay costs are £84k less than budget after 6 months and this is forecast to further improve to £216k under budget by the end of the year Non-pay costs Non pay costs currently £28k over budget, and forecast to be £110k higher than budget by the end of the year. Small overspends forecast on several lines EBITDA EBITDA is a £37k deficit at 31 January 2021. Forecast for the year is a surplus of £655k (3.2% of total income), which is £250k worse than budget Cash Year end balance will reduce by £700k as insufficient cash being generated to cover debt servicing and planned capital expenditure. Cash will be £200k lower than budget Capital Programme All planned capital expenditure on track Asset Disposals No major asset disposals planned Loan facilities No new loan facilities planned. Covenant compliance Current full year forecast indicates that college will breach two of the three covenants. Discussions are planned with both the bank and external auditors Financial health Full year forecast is for 120 points which is the lowest score for grade of 'Requires Improvement'. A further small worsening of the EBITDA position for the year could cause the financial health grade to slip to 'Inadequate' Income & Expenditure Account Balance Sheet ESFA Financial Health WEATHERBURY COLLEGE MANAGEMENT ACCOUNTS FOR THE 6 MONTHS TO 31st JANUARY 2021 EXECUTIVE SUMMARY
Transcript of WEATHERBURY COLLEGE MANAGEMENT ACCOUNTS FOR THE …

WEATHERBURY COLLEGE
MANAGEMENT ACCOUNTS FOR THE PERIOD TO 31 JANUARY 2021
1. Headlines
The operating performance for the year to date is an operating deficit of £575,000, which is £150,000 adverse to budget. This is principally accounted for by a shortfall in income to date of £202,000. The adverse performance to date is forecast to continue to year-end, the base case estimate is a forecast operating deficit for the year of £262,000 (£242,000 adverse to budget). Pay costs although lower than budget are forecast to be c68% of total income which is higher than the FEC financial benchmark of 65%.
The forecast deficit is projected to result in a breach of loan covenants at year-end. The college is actively engaged with the bank to secure a waiver pending further dialogue to review the current covenants and loan facilities.
Financial health is forecast to remain requires improvement, though with minimal headroom above the threshold for inadequate. Failure to secure timely agreement with the bank and external auditors would almost certainly result in a decline in the financial health grade to inadequate.
Indicator Current Status RAG Change
Operating surplus/deficit (excl.
FRS102)Forecast outturn is £242k behind budget at £262k deficit
IncomeTotal income is £202k lower than budget YTD, and forecast to be £356k lower than budget by
the end of the year. Main issues are AEB and HE.
Pay costsTotal pay costs are £84k less than budget after 6 months and this is forecast to further improve
to £216k under budget by the end of the year
Non-pay costsNon pay costs currently £28k over budget, and forecast to be £110k higher than budget by the
end of the year. Small overspends forecast on several lines
EBITDAEBITDA is a £37k deficit at 31 January 2021. Forecast for the year is a surplus of £655k
(3.2% of total income), which is £250k worse than budget
CashYear end balance will reduce by £700k as insufficient cash being generated to cover debt
servicing and planned capital expenditure. Cash will be £200k lower than budget
Capital Programme All planned capital expenditure on track
Asset Disposals No major asset disposals planned
Loan facilities No new loan facilities planned.
Covenant complianceCurrent full year forecast indicates that college will breach two of the three covenants.
Discussions are planned with both the bank and external auditors
Financial health
Full year forecast is for 120 points which is the lowest score for grade of 'Requires
Improvement'. A further small worsening of the EBITDA position for the year could cause the
financial health grade to slip to 'Inadequate'
Income & Expenditure Account
Balance Sheet
ESFA Financial Health
WEATHERBURY COLLEGE
MANAGEMENT ACCOUNTS FOR THE 6 MONTHS TO 31st JANUARY 2021
EXECUTIVE SUMMARY

Cash reserves are relatively healthy at £2.09 million at the end of January 2021 and remain adequate to cover the normal March/April pinch point. The weak operating performance remains however a serious concern, that will steadily erode cash reserves over time unless the college can improve its underlying operating performance.
Targeted actions are being implemented aimed at reducing costs in-year by £242,000 and reducing the projected shortfall in Adult Education Budget (AEB) income. Taken together these could achieve a small operating surplus by year-end of £119,000 (best case). However, in the event that further possible shortfalls in income by year-end materialise, there is a risk (worst case) of the operating deficit increasing to £676,000.
2. Financial Health
The full year forecast predicts a financial health score of 120 points, which is the lowest point for being assessed as ‘requires improvement’. Again, it is the adverse EBITDA performance which has reduced the autoscore from the budgeted position. The significant concern as shown in the headroom column above is the very high risk that any further slippage will cause the college to be assessed as inadequate. A further deterioration in the EBITDA performance of just £37k could trigger this.
Ratio Points Ratio Points
Solvency (adjusted current ratio) 0.89 40 0.83 40 Net current assets down
by £133k
Performance (EBITDA as % of
adjusted income)4.3% 40 3.2% 30
EBITDA down by £37k
Borrowing (as % of adjusted
income)37.7% 50 38.3% 50
Income down by £870k
or borrowing up by
£351k
Total Points 130 120
Automated Financial Health
Grade
Self-Assessed Financial Health
GradeRequires Improvement Requires Improvement
ESFA Financial HealthBudget Forecast
RAG Headroom
Requires Improvement Requires Improvement

3. Income & Expenditure
Actual Budget Variance Forecast Budget Variance To Jan 20 To July 20
£000s £000s £000s £000s £000s £000s £000s £000s
INCOME
14-16 income 5 20 (15) 13 39 (26) 31 66
ESFA 16-19 income (incl. element 2) 6,511 6,511 0 13,022 13,022 0 6,389 12,778
Local Authority high needs - element 3 221 221 0 442 442 0 195 390
Apprenticeships 428 457 (29) 855 911 (56) 702 1,448
ESFA adult education budget (AEB) 1,270 1,345 (75) 2,848 2,987 (139) 1,348 2,995
Devolved AEB 0 0 0 0 0 0 0 0
Advanced learner loans 171 173 (2) 344 347 (3) 175 355
OFS 112 112 0 225 225 0 125 250
HE loans 952 997 (45) 1,901 1,993 (92) 1,107 2,215
Other funding body grants 99 99 0 198 198 0 82 163
European income 0 0 0 0 0 0 0 0
Full cost fees 88 108 (20) 244 270 (26) 138 320
HE fees (not loans) 0 0 0 0 0 0 0 0
Apprenticeship fees 49 60 (11) 101 120 (19) 89 184
Other tuition fee income 69 78 (9) 160 173 (13) 85 179
Catering 72 70 2 145 140 5 86 173
Nursery 70 67 3 130 115 15 79 142
Other commercial income 30 31 (1) 42 44 (2) 21 32
Other income 0 0 0 0 0 0 57 113
TOTAL OPERATING INCOME 10,147 10,349 (202) 20,670 21,026 (356) 10,709 21,803
of which is from sub-contracting 84 300 300 99 305
PAY
Teaching staff 3,248 3,295 47 6,490 6,591 101 2,975 5,971
Teaching - sessional 703 670 (33) 1,305 1,273 (32) 699 1,274
Contracted tuition services 42 50 8 99 118 19 55 132
Teaching and other support staff 1,220 1,140 (80) 2,440 2,280 (161) 1,248 2,269
Administration staff 1,616 1,760 144 3,234 3,519 286 1,654 3,506
Operational & maintenance staff 59 60 1 76 81 5 41 56
Catering staff 48 46 (2) 92 92 0 45 90
Nursery staff 45 44 (1) 91 88 (3) 43 86
Apprenticeship 0.5% levy 35 35 0 69 70 1 34 67
TOTAL PAY (excluding restructuring) 7,016 7,100 84 13,896 14,112 216 6,794 13,451
NON PAY
Teaching costs 477 492 15 765 798 33 510 851
Teaching and other support costs 194 190 (4) 361 347 (14) 181 359
Administration costs 223 243 20 496 487 (9) 280 625
Operational & maintenance costs 817 795 (22) 1,606 1,576 (30) 832 1,691
Examination costs 242 220 (22) 355 340 (15) 257 424
Rent and lease costs 901 886 (15) 1,788 1,755 (33) 862 1,745
Catering costs 39 35 (4) 74 65 (9) 47 89
Nursery costs 15 14 (1) 29 27 (2) 74 240
Subcontracting costs 65 80 15 240 240 0 23 45
Other operating expenditure 195 185 (10) 405 374 (31) 222 390
TOTAL NON PAY 3,168 3,140 (28) 6,119 6,009 (110) 3,288 6,459
Staff restructuring costs 0 0 0 0 0 0 0 0
Education-specific EBITDA (37) 109 (146) 655 905 (250) 627 1,893
EBITDA as % of Income -(0.4%) 1.1% (3.2%) 4.3% (5.9%) (8.7%)
Add: release of DCGs 51 51 0 102 102 0 51 102
Less: depreciation and amortisation 360 360 0 715 720 5 365 729
Add: interest and investment income 7 9 (2) 12 15 (3) 12 22
Less: interest and other finance costs 236 234 (2) 316 322 6 233 461
Add: other gains and losses 0 0 0 0 0 0 0 0
Operating Surplus/(Deficit) after ITDA (575) (425) (150) (262) (20) (242) 92 827
Surplus/(deficit) after ITDA (575) (425) (150) (262) (20) (242) 92 827
Less: FRS102 adj- current service costs (non-cash) 0 0 0 789 789 0 0 650
Total Surplus/(Deficit) (575) (425) (150) (1,051) (809) (242) 92 177
WEATHERBURY COLLEGE
INCOME & EXPENDITURE ACCOUNT FOR THE 6 MONTHS TO 31st JANUARY 2021
Cumulative YTD Full Year Prior Year

Income
Total income is £202,000 lower than budget year to date but is partially offset by an underspend on pay expenditure of £84,000. Total non-pay expenditure is slightly overspent by £28,000. This means that the year-to-date operating deficit is £150,000 worse than budget. The two main issues on income so far are in AEB and HE fee income. The AEB income is tracking around 15.5% behind plan at the moment, and whilst we expect to see some minor recovery of that position in the remaining months of this financial year, we are forecasting to finish the year at around 85.35% of contract. Despite moving as much adult provision as possible to an online basis, some practical and workshop-based courses have been difficult to deliver and recruit for during Covid-19 lockdown. For 2020/21 only, there is a tolerance of 10% on ESFA the adult budget reconciliation to recognise the operational impact of the pandemic, which results in a forecast clawback of 4.65%, or £139k. This is fully recognised in the forecast out-turn. For adult provision more generally, we are doing everything we can to minimise costs on these programmes without impacting on the learner experience, but the reality is we have some small group sizes. We will be taking this into consideration as part of our curriculum planning work for 2021/22. The HE fees income is currently £45,000 below budget, and as there is no further in year recruitment of full-time learners, the shortfall of income is expected to increase to £92,000 by the end of the year. The full-time learners are forecast to be 10 fewer than our target. Total income for the year is forecast to be £356,000 lower than budget, a shortfall of approximately 1.7% of total budgeted income.
Key Variances
Year to
date
Year end
forecast NotesOriginal budgeted operating
surplus excl FRS 102 (20) (262) Variance from budget is £242k adverse
Main Variances
Better/Worse
v Budget
AEB Worse (139) Forecast outturn is 85% of contract - potential clawback in Dec 21
Apprenticeships Worse (56) New starts behind on profile
HE Fees Worse (92) FT Learner numbers are 10 lower than target
Other income lines Worse (69)
LA 14-16 schools not willing to pay (£26k), full cost fees lower take up
on course offer (£26k), apprenticeship fees (£19k) lower new starts
Total Income Variances Worse (356) Overall 2% below budget
Expenditure Variances
Teaching pay costs Better 69
1% underspend, due to unfilled vacancies partially offset by higher
sessional staff
Non teaching pay costs Better 126 2% underspend due to slower filling of vacant roles
Agency staffing Worse 24 Lower need than anticipated
Other staff Better (3) Nursery staff
Teaching non-pay costs Better 33 4% underspend - saving across curriculum areas to offset IT overspend
Operational & maintenance costs Worse (30)
Increased in utlity charges, and some urgent maintenance work on
main site 2% overspend
Examination costs Worse (15) Change of exam entry mix
Rent and lease costs Worse (33) New lease for evening provision
Commercial costs Worse (11) Catering supplies cost increases
Other operating expenditure Worse (54) IT costs 31k over due to additional student laptops
Total Expenditure Variances Better 106 Overall 0.5% better than budget
Other Better 8 Depreciation and interest
Total of all variances Worse (242) Budgeted deficit £20k, Forecast deficit is £262k
WEATHERBURY COLLEGE
I & E Key Full year forecast variances to Budget as at 31st January 2021

Pay Costs
Total teaching staff costs are forecast to be £88,000 (1%) underspent by the end of the year, due to unfilled vacancies partially offset by higher sessional staff, combined with actions planned to minimise costs on remaining AEB delivery where possible. There is also an underspend in non-teaching staff. The budget was prepared on the assumption that all establishment roles would be fully occupied during the year, but recruitment to vacant posts has created some cost savings. Total pay costs as a percentage of turnover are forecast to as planned at 68%. This is 3% over the FEC financial benchmarks. We will be focusing on how we can improve this ratio as part of our budget planning for next year and have targeted a further £82k of in year cost savings through a temporary recruitment freeze unless it is a critical post. Non-pay costs The total non-pay expenditure is expected to finish the year £110,000 worse than budget. This is due to several different areas including:
• Rent and lease cost - forecast £33k overspend due to a new lease for evening provision
• Estates costs – forecast £30k overspend due to higher-than-expected increases in utility charges, and some urgent maintenance work on the main site;
• Other operating expenditure – forecast £31k overspend due to student laptops. This has been fully offset by a saving on education supplies and services.
We have requested all budget holders to try and identify in year savings from their remaining budgets, with a college wide target of £160k. we will report on progress with this initiative in the February management accounts. EBITDA
Total EBITDA is currently showing a deficit of £37k for the year to date and is forecast to be a £655k (3.2% of total income) surplus by the end of the year. This is against a full year budget target of £905k (4.3% of income), a shortfall of £250,000, and £1m lower than last year. The additional targeted cost savings on both pay and non-pay are not included in the full year forecast as we do not yet have certainty on whether they can be delivered.
Learner Numbers
HeadcountActuals
(current year)
Full year
budget
Full-year
forecast
Full Year
actuals (last
year)
RAG Financial Implications
16-19 ESFA 2,780 2,710 2,790 2,820 Increase in lagged funding in
2021/22 of c£350k
AEB: ESFA 743 1,230 1,150 1,120
Current projection is c95% of
contract value, could be a recovery
of funds up to c£139k in
December 21
AEB: Devolved - - - - N/A
16-18 Apprenticeships 115 136 128 210 New starts currently behind
profile, funding shortfall projected
as £36k for the year
19+ Apprenticeships 123 145 135 220 Budget shortfall will be a
maximum of £20k
HE: full-time 128 135 125 162 Shortfall in learners likely to result
in fee income being c£85k lower
than budget
HE: part-time 160 160 155 165 Marginally under budget by £7k
Advanced Learner Loans 155 180 180 185 Expect funding to be very close to
budget
Learner Numbers

Balance Sheet
Opening Actual Variance
Balance as at Movement Budget Forecast BudgetvForecast
1 Aug 2020 January 2021 ytd 31 July 2021 31 July 2021 Full year
£000s £000s £000s £000s £000s £000s
Fixed Assets
Land & Buildings 17,849 17,776 (73) 17,702 17,702 0
Equipment 690 724 34 818 813 (5)
Assets under construction 0 0 0 0 0 0
Total Fixed Assets 18,539 18,500 (39) 18,520 18,515 (5)
Current Assets
Stock 35 32 (3) 35 35 0
Trade Receivables 836 655 (181) 800 750 (50)
Other Receivables & Prepayments 264 302 38 228 240 12
Accrued income 0 0 0 0 0 0
Short-term Investments 0 0 0 0 0 0
Cash and cash equivalents 2,780 2,090 (690) 2,281 2,082 (199)
Total Current Assets 3,915 3,079 (836) 3,344 3,107 (237)
Creditors due within one year
Exceptional Financial Support (EFS) / (RF) Loans 0 0 0 0 0 0
Commercial Loans 396 396 0 396 396 0
Finance Lease Obligations 0 0 0 0 0 0
Interest Payable 0 0 0 0 0 0
Capital Grant Liability 102 102 0 102 102 0
Trade Payables 520 576 56 436 436 0
Other Payments on Account 729 756 27 729 729 0
Other Liabilities 0 0 0 0 0 0
Fixed Assets Retentions 0 0 0 0 0 0
Recovery of ESFA/DA Funding 0 0 0 0 0 0
Deferred Income 340 354 14 375 375 0
Accruals 1,565 1,401 (164) 1,565 1,565 0
Holiday and Sabbatical Pay Accrual 278 278 0 255 255 0
Bursary Deferred Income Account 0 0 0 0 0 0
Other Taxation and Social Security 241 257 16 241 241 0
Total Creditors due within one year 4,171 4,120 (51) 4,099 4,099 0
Net Current Assets/(Liabilities) (256) (1,041) (785) (755) (992) (237)
Adjusted current ratio 1.03 0.82 0.89 0.83
Total assets less current liabilities 18,283 17,459 (824) 17,765 17,523 (242)
Creditors: Amounts falling due after one year
Exceptional Financial Support (EFS) / (RF) Loans 0 0 0 0 0 0
Commercial loans 7,920 7,722 (198) 7,524 7,524 0
Finance Lease obligations 0 0 0 0 0 0
Capital Grants 2,539 2,488 (51) 2,437 2,437 0
Other Liabilities 0 0 0 0 0 0
Total Creditors: Amounts falling due after one
year 10,459 10,210 (249) 9,961 9,961 0
Total borrowing as % of income 38.1% 37.7% 38.3%
Provisions
Local Government Pension Scheme Provision 3,603 3,603 0 4,392 4,392 0
Enhanced Pension Provision 0 0 0 0 0 0
Other Provisions 0 0 0 0 0 0
Total Provisions 3,603 3,603 0 4,392 4,392 0
Total Net Assets 4,221 3,646 (575) 3,412 3,170 (242)
Reserves
Pension Reserve (3,603) (3,603) 0 (4,392) (4,392) 0
Revaluation Reserve 812 812 0 812 812 0
Restricted Reserve 0 0 0 0 0 0
Income and Expenditure Reserve 7,012 6,437 (575) 6,992 6,750 (242)
Total Reserves 4,221 3,646 (575) 3,412 3,170 (242)
WEATHERBURY COLLEGE
BALANCE SHEET AS AT 31st JANUARY 2021

The balance sheet as of 31 January 2021 has net current liabilities of £1.04m, giving a current ratio of 0.82. This is a significant movement from the opening balance sheet position which had net current liabilities of £256k. The main reason is a reduction in the current assets balance of £836k due to less cash, and lower debtors. By the end of the year, we expect net current liabilities to be £992k against a budget of £755k, which is £237k worse than expected. The primary reason for this is the expected under performance as highlighted above causing a lower than planned cash balance at the year end. Forecast current ratio is 0.83 against the budget of 0.89. This shows a deterioration in the solvency position from the start of the year when the current ratio was just over 1.
Debtors
Jul-20 Jan-21 Change
% of total Jan
2021
Current < 30 days 634 448 (186) 68%
30-60 days 123 141 18 22%
60-90 days 42 44 2 7%
Over 3 months 37 22 (15) 3%
Total 836 655 (181)
Creditors
Jul-20 Jan-21 Change
% of total Jan
2021
Current < 30 days 455 461 6 80%
30-60 days 41 50 9 9%
60-90 days 20 45 25 8%
Over 3 months 4 20 16 3%
Total 520 576 56
Debtors over 3 months have are fully provided for. All debtors below 90 days are currently expected to be fully recoverable.
Policy is to pay all suppliers within 30 days unless agreed terms state otherwise. Current balance over 3 months relates to one supplier where there is an outstanding query to resolve on the invoice. This is expected to be resolved in the next month.

Cash
The deterioration in solvency above is a direct impact of reducing cash balances. The current cash balance is just under £2.1m, which represents 38 days cash in hand. Whilst this is still a relatively healthy level of cash, it is declining, and that is not a sustainable position for future planning. The projected cash balance at the year end is very similar to the current balance at just under £2.1m. This will mean that overall cash balances will have reduced by c£700k for the full year. The low point in the cash forecast is expected to be end of March, with a projected balance of just under £900k, representing 16 days cash in hand. The budget plan for the year committed to utilising some of the cash reserve to provide much needed investment in capital equipment. The budget had planned to generate just over £900k of cash from operations during the year, with the majority of this cash (£720k) being required to meet the loan repayments. The capital budget agreed for the year was £700k meaning that we would need to dip into cash reserves by around £500k this year. The under performance on some income lines means that we will now only generate enough cash in year to meet our debt servicing, with nothing left to go towards our planned capital expenditure. Therefore, we will require c£700k of our cash reserves this year to fund the capex. This underlines the need to improve EBITDA performance going forward to avoid a continuing decline in cash reserves.
0500
100015002000250030003500
CA
SH B
ALA
NC
E £
'00
0S
MONTH
ROLLING 12 MONTH CASHFLOW BUDGET V ACTUAL
Budget closing balance Actual/forecast Cash

The cashflow reflects the forecast position in the income and expenditure schedule, including a potential repayment of AEB funding of £139k which is shown in December 2021.
Budget Forecast
Cash generation from Operations907 701
Cash received from interest 15 12
Total Cash available922 713
Cash used to service debt (720) (720)
Cash spent on routine capital (701) (691)
Cash Movement excl. major
capital projects & new loans (499) (698)
Net cash contribution to major capital
project 0 0
Cash from Loans/RCF 0 0
Total Cash Movement (499) (698)
Cash at Start of Year 2780 2780
Cash at End of Year 2281 2082
Budgeted Cash Movement for Year (499) (698)
% cash used to service debt 78% 101%
% cash used for routine capex 76% 97%
Total % use of cash 154% 198%
Use of Cash Summary 2020/21

all amounts £'000s Actual Forecast Forecast Forecast Forecast Forecast Forecast Forecast Forecast Forecast Forecast Forecast Forecast
Jan-21 Feb-21 Mar-21 Apr-21 May-21 Jun-21 Jul-21 Aug-21 Sep-21 Oct-21 Nov-21 Dec-21 Jan-22
Operating Receipts
ESFA 16-19 Allocation 969 701 698 1,653 1,330 1,133 748 1,936 1,150 1,162 949 762 997
ESFA - AEB 218 158 157 372 300 255 222 424 252 254 208 167 210
Apprenticeships 69 69 69 69 69 69 69 45 74 74 74 74 74
Student Loans (HE & ALL) 31 506 29 29 979 29 29 8 30 30 475 30 30
OfS 19 19 19 19 19 19 19 17 17 17 17 17 17
Other funding body grants 41 31 21 110 74 62 31 35 96 91 84 60 50
Other fees & contracts 54 34 38 35 34 34 12 7 70 99 51 60 55
Other income generating activities 24 24 24 24 25 25 25 - 25 25 25 25 25
Other Income - - - - - - - - - - - - -
Total Operating Receipts 1,425 1,543 1,055 2,312 2,830 1,627 1,156 2,472 1,713 1,752 1,882 1,195 1,458
Payroll
Salaries 705 688 692 688 695 701 666 680 720 720 720 720 720
Pension (TPS & LGPS) 175 170 171 170 173 176 165 170 180 180 180 180 180
HMRC 295 287 288 287 290 295 278 285 300 300 300 300 300
Other - - - - - - - - - - - - -
Staff Restructuring - - - - - - - - - - - - -
Total Payroll 1,175 1,145 1,151 1,145 1,158 1,172 1,109 1,135 1,200 1,200 1,200 1,200 1,200
Operating payments
Supplier payments 614 675 561 535 456 327 181 178 875 820 775 450 600
Sub Contractor 22 24 25 25 28 28 30 - 24 24 24 24 24
HMRC VAT - 30 - - 30 - - 32 - - 33 - -
Prior year funding adjust - - - - - - - - - - - 139 -
Other - - - - - - - - - - - - -
Total operating payments 636 729 586 560 514 355 211 210 899 844 832 613 624
Cash movement on operating
activities (386) (331) (682) 607 1,158 100 (164) 1,127 (386) (292) (150) (618) (366)
Annual Capex
Payments 25 76 120 70 35 40 - 225 175 60 40 - -
Grant receipts - - - - - - - - - - - - -
Net expenditure on Capex (25) (76) (120) (70) (35) (40) 0 (225) (175) (60) (40) 0 0
Financing
Interest received 3 - - 3 - - 2 - - 2 - - 2
Bank Loan repayments 180 - - 180 - - 180 - - 180 - - 180
RF/ESFA Loan repayment - - - - - - - - - - - - -
Finance Leases - - - - - - - - - - - - -
New loans - - - - - - - - - - - - -
RCF drawdown - - - - - - - - - - - - -
RCF repayment - - - - - - - - - - - - -
Total Financing (177) 0 0 (177) 0 0 (178) 0 0 (178) 0 0 (178)
Major Capital Project
Project payments - - - - - - - - - - - - -
Disposal receipts - - - - - - - - - - - - -
Grant receipts - - - - - - - - - - - - -
Net movement on Capital project 0 0 0 0 0 0 0 0 0 0 0 0 0
Net cash movement for period (588) (407) (802) 360 1,123 60 (342) 902 (561) (530) (190) (618) (544)
Opening Balance 2,678 2,090 1,683 881 1,241 2,364 2,424 2,082 2,984 2,424 1,894 1,704 1,704
Closing Balance 2,090 1,683 881 1,241 2,364 2,424 2,082 2,984 2,424 1,894 1,704 1,086 1,160
Overdraft Facilty 500 500 500 500 500 500 500 - - - - - -
RCF Facility - undrawn - - - - - - - - - - - - -
Cash Headroom 2,590 2,183 1,381 1,741 2,864 2,924 2,582 2,984 2,424 1,894 1,704 1,086 1,160
Cash Days - Closing balance 38 31 16 23 43 44 38 53 43 34 30 19 21
Total RCF Facility - - - - - - - - - - - - -
Budget closing balance 2201 1698 985 1290 2425 2569 2281 2,984 2,424 1,894 1,704 1,086 1,160
Actual closing balance 2,090 1,683 881 1,241 2,364 2,424 2,082
WEATHERBURY COLLEGE - 12 month rolling cashflow forecast

4. Loans
The long-term loan, which currently has an outstanding balance of c£8m is being repaid at a rate of £180,000 per quarter. The full year forecast is projecting that two of the three covenants will be breached. You will recall when the budget was agreed the debt service cover covenant was highlighted as a major risk, as there was virtually no headroom on the ratio. Given the adverse performance it is now very unlikely that we will now be able meet that covenant test. In addition, the forecast EBITDA means that we are also likely to breach the net borrowings to EBITDA ratio. Dialogue is ongoing with the bank to secure a waiver or agreement not to measure covenants at year-end. If agreement cannot be reached, and the bank loan has to be re-classified as a current liability, this will impact adversely on the solvency ratio and almost certainly push the financial health.
5. KPIs
It is worth noting that the college is not expecting to meet any of the six FEC financial benchmarks that were recently updated. Whilst these are issued for guidance only, it does signal that the college has some underlying financial weaknesses that we need to address with future financial plans. The KPI schedule also highlights that we are operating average class sizes that are too small, and this must be a key priority to address in curriculum planning for 2021/22 to help improve underlying efficiency.
Covenant Measure
Budget
2020/21
Forecast
2020/21
Covenant
Met HeadroomRAG Movement
Debt Service Cover >1.25 1.26 0.97 NO
Need to generate +£199k of cash
to meet covenant or reduce debt
costs by c£160k
Net borrowings:EBITDA <7.0 6.23 8.91 NONeed EBITDA to increase by
£179k to meet covenant
Net Assets (excl. pension liability)
>0 3412 3170 YES 3170
IndicatorActuals
YTDForecast
Budget /
Target (full
year)
Variance RAG Movement
Operating Surplus/Deficit as % of
Turnover-(5.7%) -(1.3%) -(0.1%) -(1.2%)
Cash Days in Hand 38 38 41 (3)
Pay as % of Turnover 69.7% 68.2% 68.1% 0%
Education EBITDA (£'000s) (37) 655 905 (250)
Cash Balance (£'000s) 2,090 2,082 2,281 (199)
Debtor Days 15 13 14 1
Creditor Days 31 26 26 0
Staff Numbers (fte’s) 329 336 7
Staff Utilisation 94.30% 95.00% 95.00% -(0.7%)
Average class size - overall 12.7 12.5 15 (2.3)
KPIs as at 31st January 2021
6. Capital
The capital expenditure plan for the year is largely on track, with a small projected underspend of £10k for the year. The refectory upgrade is progressing well and is expected to be ready for full operation after the February half term as planned. There has been a delay to the relocation of electrical due to a supplier issue, and this work will now be completed during the Easter holiday period.
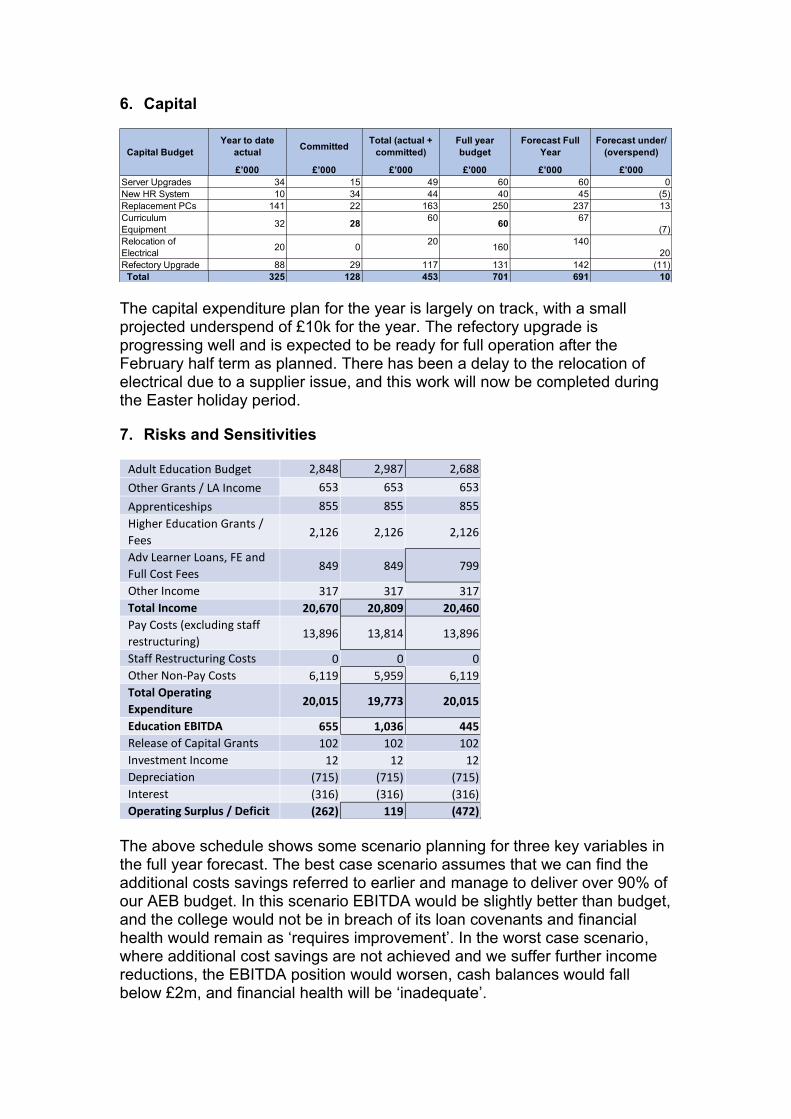
7. Risks and Sensitivities
The above schedule shows some scenario planning for three key variables in the full year forecast. The best case scenario assumes that we can find the additional costs savings referred to earlier and manage to deliver over 90% of our AEB budget. In this scenario EBITDA would be slightly better than budget, and the college would not be in breach of its loan covenants and financial health would remain as ‘requires improvement’. In the worst case scenario, where additional cost savings are not achieved and we suffer further income reductions, the EBITDA position would worsen, cash balances would fall below £2m, and financial health will be ‘inadequate’.
Year to date
actualCommitted
Total (actual +
committed)
Full year
budget
Forecast Full
Year
Forecast under/
(overspend)
£’000 £’000 £’000 £’000 £’000 £’000
Server Upgrades 34 15 49 60 60 0
New HR System 10 34 44 40 45 (5)
Replacement PCs 141 22 163 250 237 13
Curriculum
Equipment32 28
6060
67
(7)
Relocation of
Electrical20 0
20160
140
20
Refectory Upgrade 88 29 117 131 142 (11)
Total 325 128 453 701 691 10
Capital Budget
Adult Education Budget 2,848 2,987 2,688
Other Grants / LA Income 653 653 653
Apprenticeships 855 855 855
Higher Education Grants /
Fees2,126 2,126 2,126
Adv Learner Loans, FE and
Full Cost Fees849 849 799
Other Income 317 317 317
Total Income 20,670 20,809 20,460
Pay Costs (excluding staff
restructuring)13,896 13,814 13,896
Staff Restructuring Costs 0 0 0
Other Non-Pay Costs 6,119 5,959 6,119
Total Operating
Expenditure20,015 19,773 20,015
Education EBITDA 655 1,036 445
Release of Capital Grants 102 102 102
Investment Income 12 12 12
Depreciation (715) (715) (715)
Interest (316) (316) (316)
Operating Surplus / Deficit (262) 119 (472)
The table opposite indicates three scenarios for the forecast out1.under best case and shortfall of 10% worst case)2. FE / Full cost fees potential additional shortfall of £50,000 (worst case)3. Achievement incosts and £160,000 non
The operating surplus of £119,000 i.e. marginally better than budget.
The results in a operating deficit of £262,000 which will trigger a covenant breach. If a waiver can be secured financial health will remain requires improvement.
The deficit of £472,000 and covenant breach. Even if a waiver is secured, the financial health autoscore would fall to inadequate to a lower EBITDA and a weaker adjusted current ratio.

8. Issues for further consideration
Footnote on appendices There are three further optional schedules that can be included to cover:
• Staff numbers
• Sub-contracting activity
• Trading activities and/or projects These are currently shown on a separate excel file.
Ref Risk RAG Ref Issue for Review Timescale
1 Failure to achieve budget
targets for 2020/21 leads to a
breach of loan covenants that
could trigger a decline in to
financial health to inadequate RED
1
Monitoring of forecast loan
covenant breach and progress
with securing waiver before year-
end
Jul-21
2 Failure to improve the
underlying financial
sustainability of the college
leading to a possible case for
structural change RED
2 Monitoring of potential for
decline in forecast financial
health grade for 2020/21 to
inadequate (linked to covenant
breach)
Jul-21
3 Failure to secure agreement
with the bank regarding waiver
of the forecast covenant breach
and/or to revised covenant RED
3 Confirmation of cost reduction
actions aimed at achieving
target in-year savings of circa
£242,000
April 2021 (actions
agreed) July 2021
(actions
implemented)
4 Limited cash headroom at
March/April pinch point, with
increasing reliance on overdraft
facilities that may not be
renewable after 2022 AMBER
4Confirmation of strategies to
achieve AEB budget targets for
2020/21 i.e. closing projected
shortfall of £139,000
April 2021 (actions
agreed) July 2021
(actions
implemented)
Issues for Further ReviewSummary of Key Financial Risks