Weather Legends in - cloudfront.foreflight.comcloudfront.foreflight.com/docs/ff/9.6/v9.6 -...
24
Weather Legends in FOREFLIGHT MOBILE 15th Edition Covers ForeFlight Mobile v9.6 on iPad
Transcript of Weather Legends in - cloudfront.foreflight.comcloudfront.foreflight.com/docs/ff/9.6/v9.6 -...
Weather Legends in FOREFLIGHT MOBILE
15th EditionCovers ForeFlight Mobile v9.6 on iPad
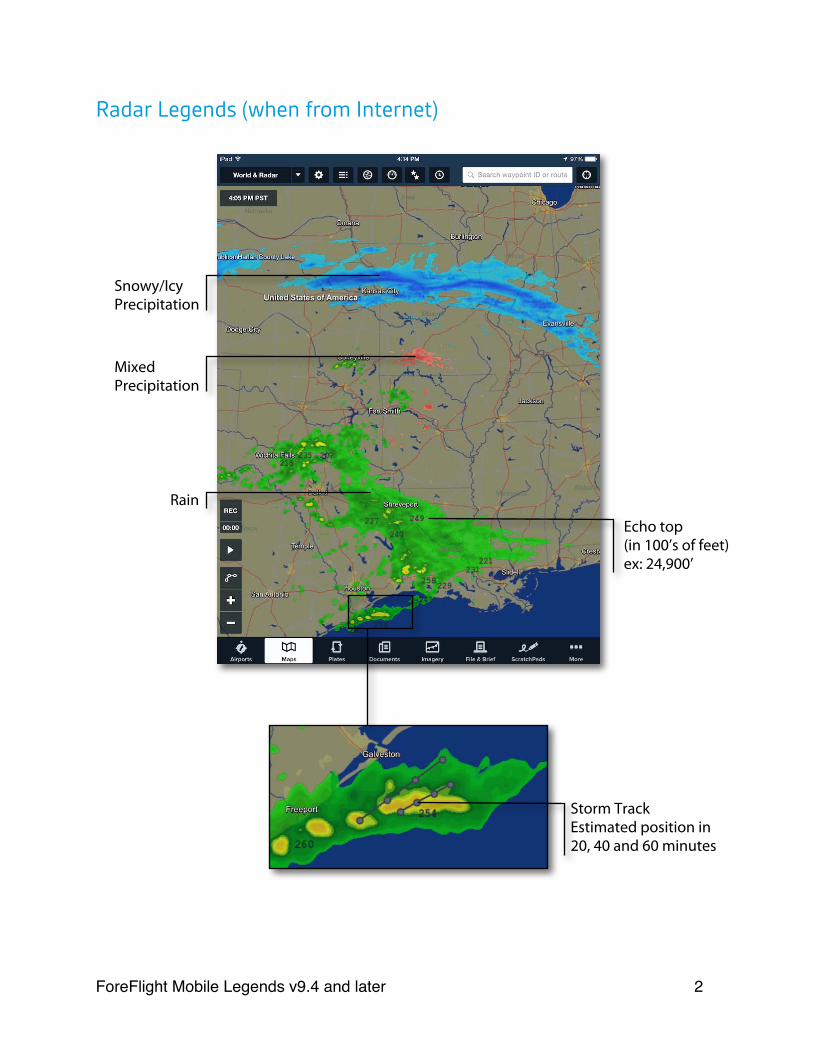
Radar Legends (when from Internet)
ForeFlight Mobile Legends v9.4 and later! 2
Rain
Snowy/Icy Precipitation
Mixed Precipitation
Echo top(in 100’s of feet)ex: 24,900’
Storm Track Estimated position in 20, 40 and 60 minutes
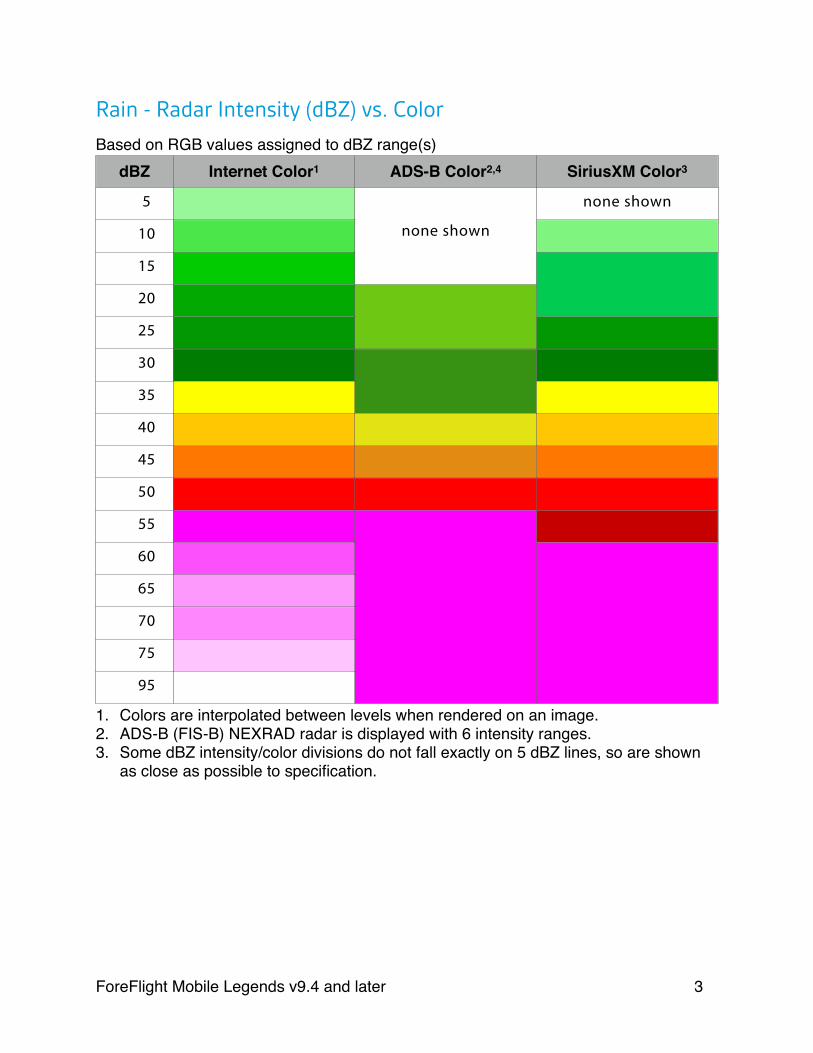
Rain - Radar Intensity (dBZ) vs. ColorBased on RGB values assigned to dBZ range(s)
dBZ Internet Color1 ADS-B Color2,4 SiriusXM Color3
5
none shown
none shown
10 none shown
15
none shown
20
25
30
35
40
45
50
55
60
65
70
75
95
1. Colors are interpolated between levels when rendered on an image.2. ADS-B (FIS-B) NEXRAD radar is displayed with 6 intensity ranges.3. Some dBZ intensity/color divisions do not fall exactly on 5 dBZ lines, so are shown
as close as possible to specification.
ForeFlight Mobile Legends v9.4 and later! 3
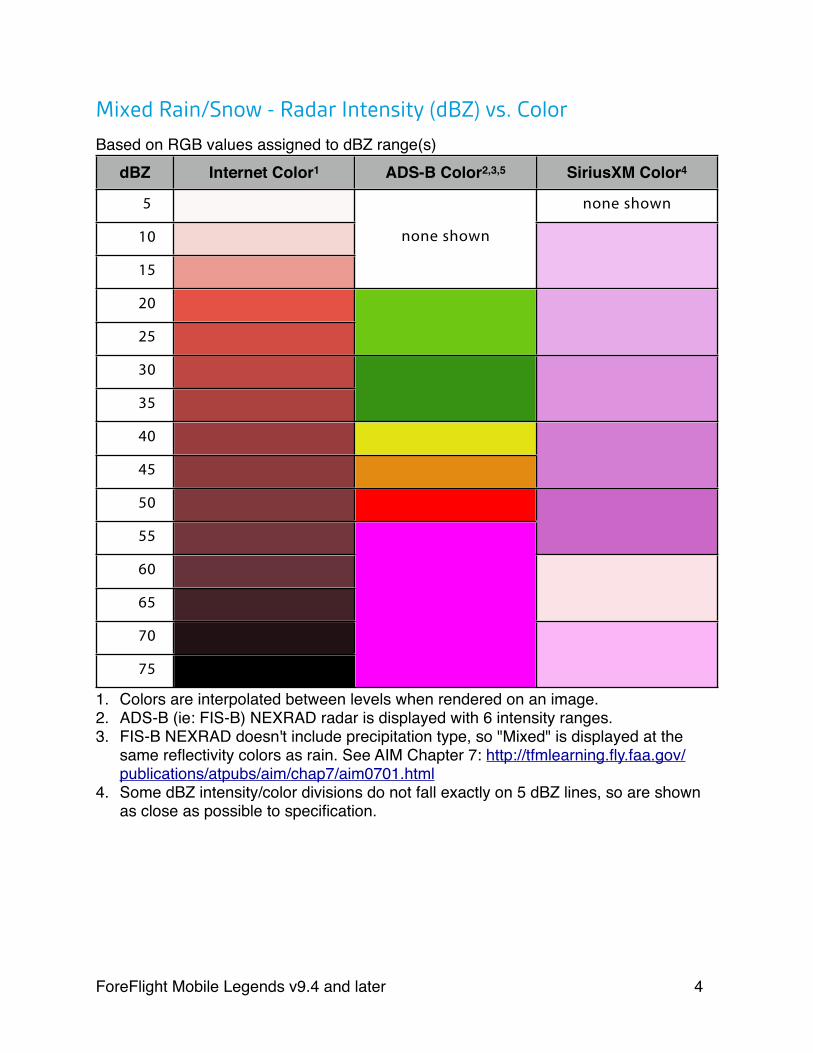
Mixed Rain/Snow - Radar Intensity (dBZ) vs. ColorBased on RGB values assigned to dBZ range(s)
dBZ Internet Color1 ADS-B Color2,3,5 SiriusXM Color4
5 none shown
10 none shown
15
20
25
30
35
40
45
50
55
60
65
70
75
1. Colors are interpolated between levels when rendered on an image.2. ADS-B (ie: FIS-B) NEXRAD radar is displayed with 6 intensity ranges.3. FIS-B NEXRAD doesn't include precipitation type, so "Mixed" is displayed at the
same reflectivity colors as rain. See AIM Chapter 7: http://tfmlearning.fly.faa.gov/publications/atpubs/aim/chap7/aim0701.html
4. Some dBZ intensity/color divisions do not fall exactly on 5 dBZ lines, so are shown as close as possible to specification.
ForeFlight Mobile Legends v9.4 and later! 4
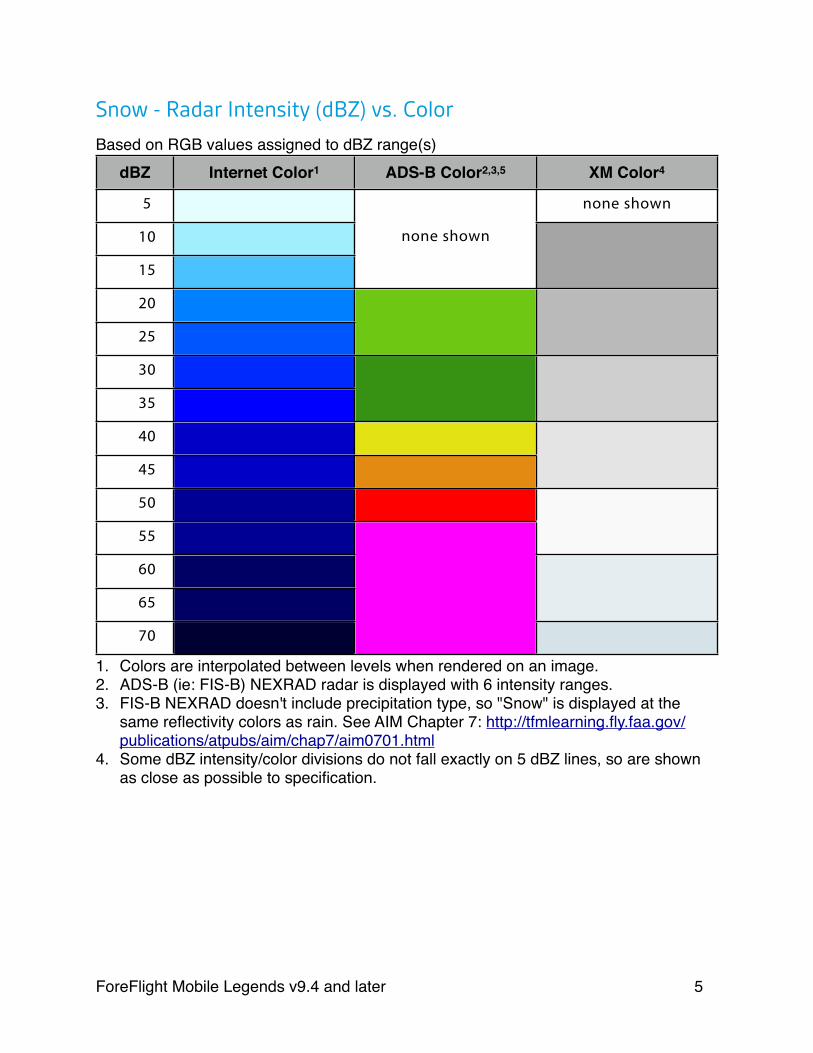
Snow - Radar Intensity (dBZ) vs. ColorBased on RGB values assigned to dBZ range(s)
dBZ Internet Color1 ADS-B Color2,3,5 XM Color4
5 none shown
10 none shown
15
20
25
30
35
40
45
50
55
60
65
70
1. Colors are interpolated between levels when rendered on an image.2. ADS-B (ie: FIS-B) NEXRAD radar is displayed with 6 intensity ranges.3. FIS-B NEXRAD doesn't include precipitation type, so "Snow" is displayed at the
same reflectivity colors as rain. See AIM Chapter 7: http://tfmlearning.fly.faa.gov/publications/atpubs/aim/chap7/aim0701.html
4. Some dBZ intensity/color divisions do not fall exactly on 5 dBZ lines, so are shown as close as possible to specification.
ForeFlight Mobile Legends v9.4 and later! 5
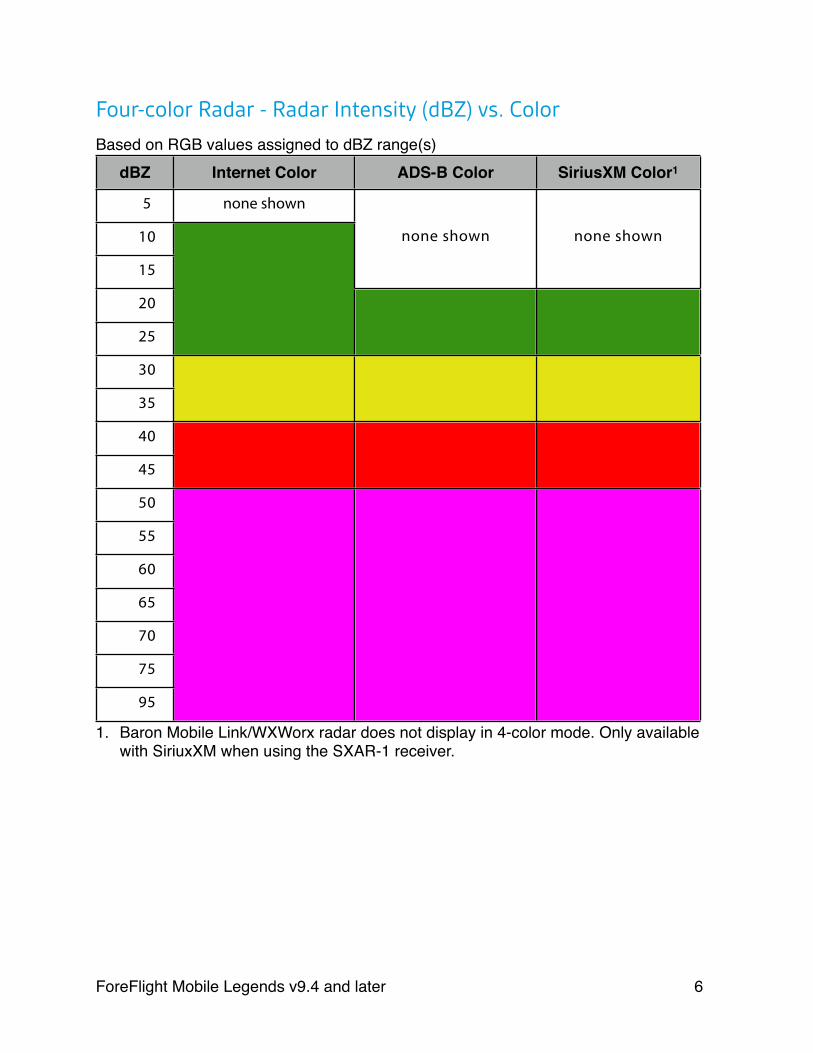
Four-color Radar - Radar Intensity (dBZ) vs. ColorBased on RGB values assigned to dBZ range(s)
dBZ Internet Color ADS-B Color SiriusXM Color1
5 none shown
10 none shown none shown
15
20
25
30
35
40
45
50
55
60
65
70
75
95
1. Baron Mobile Link/WXWorx radar does not display in 4-color mode. Only available with SiriuxXM when using the SXAR-1 receiver.
ForeFlight Mobile Legends v9.4 and later! 6
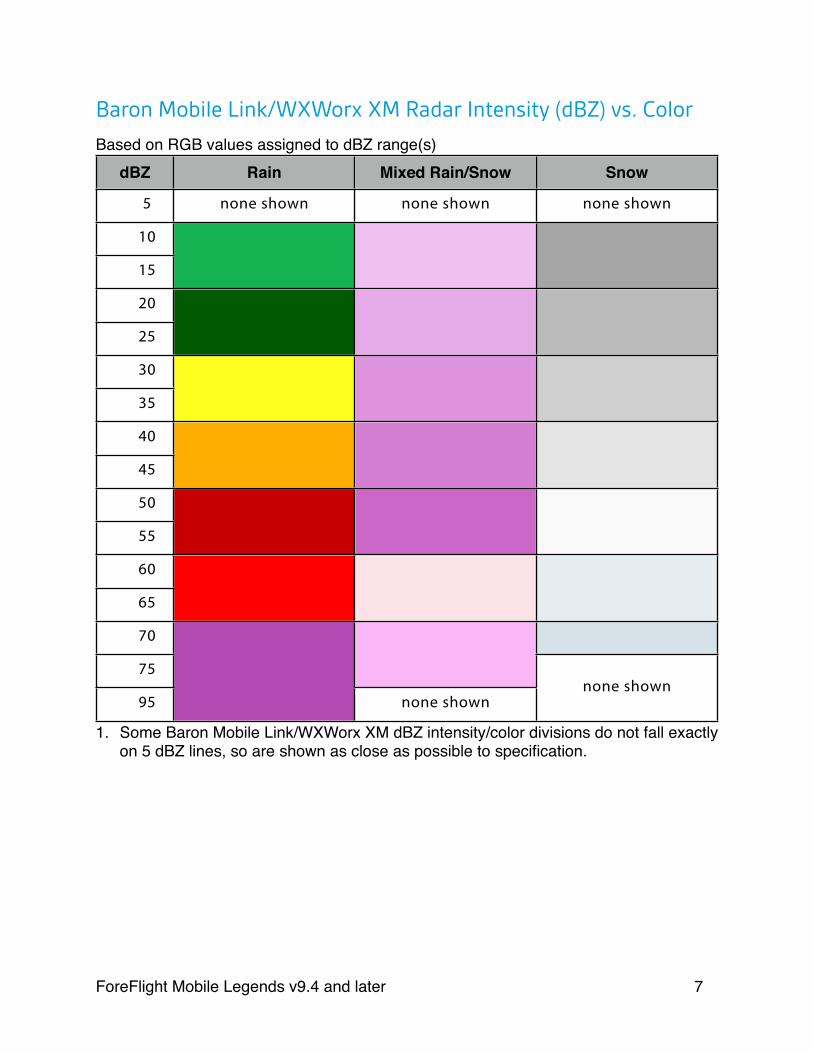
Baron Mobile Link/WXWorx XM Radar Intensity (dBZ) vs. ColorBased on RGB values assigned to dBZ range(s)
dBZ Rain Mixed Rain/Snow Snow
5 none shown none shown none shown
10
15
20
25
30
35
40
45
50
55
60
65
70
75none shown
95 none shownnone shown
1. Some Baron Mobile Link/WXWorx XM dBZ intensity/color divisions do not fall exactly on 5 dBZ lines, so are shown as close as possible to specification.
ForeFlight Mobile Legends v9.4 and later! 7
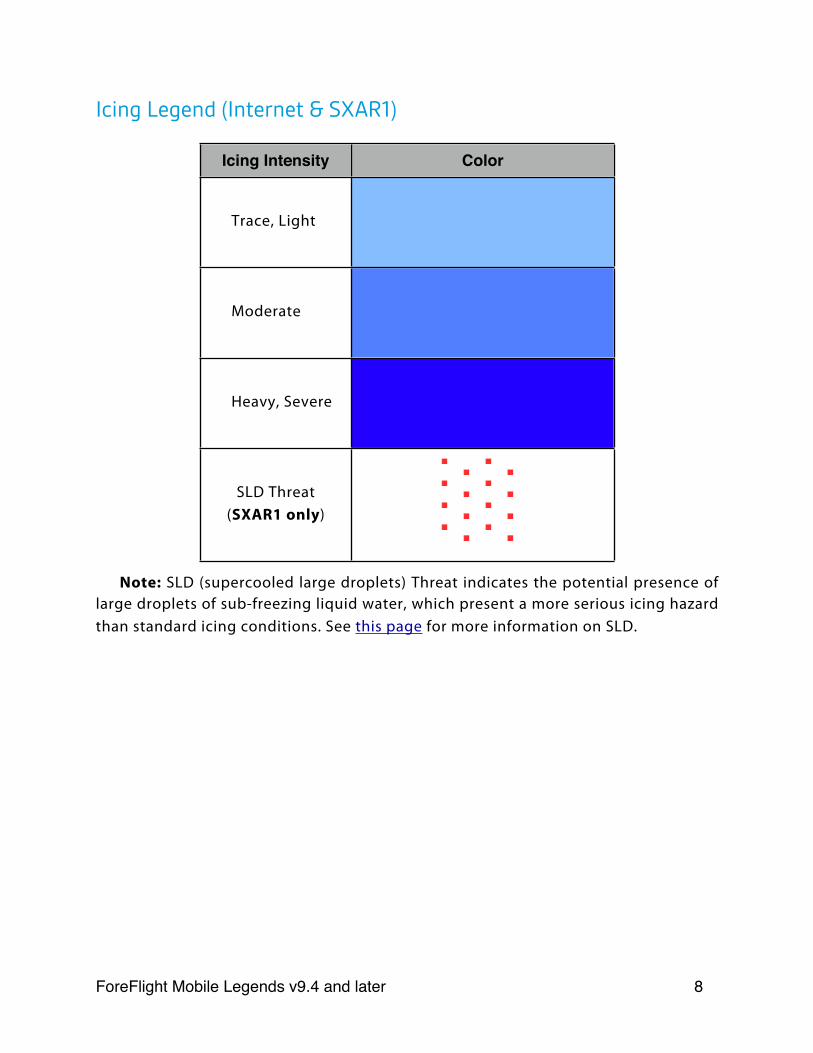
Icing Legend (Internet & SXAR1)
Icing Intensity Color
Trace, Light
Moderate
Heavy, Severe
SLD Threat (SXAR1 only)
Note: SLD (supercooled large droplets) Threat indicates the potential presence of large droplets of sub-freezing liquid water, which present a more serious icing hazard than standard icing conditions. See this page for more information on SLD.
ForeFlight Mobile Legends v9.4 and later! 8
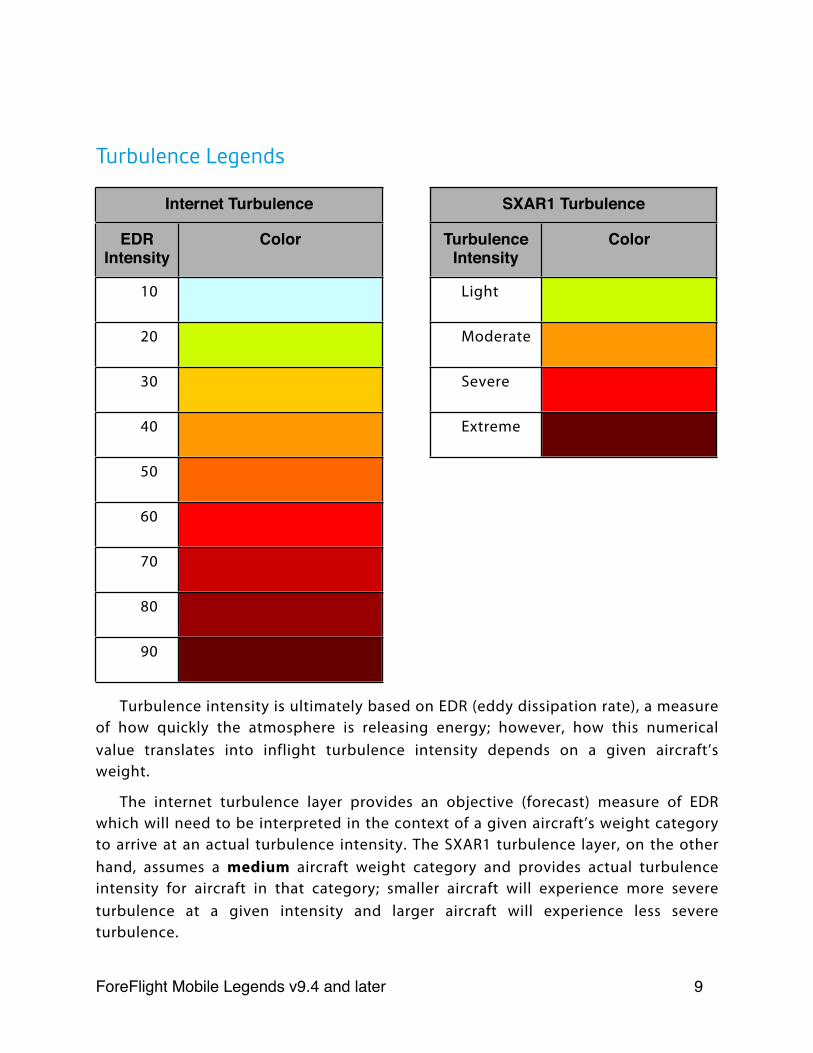
Turbulence Legends
Turbulence intensity is ultimately based on EDR (eddy dissipation rate), a measure of how quickly the atmosphere is releasing energy; however, how this numerical value translates into inflight turbulence intensity depends on a given aircraft’s weight.
The internet turbulence layer provides an objective (forecast) measure of EDR which will need to be interpreted in the context of a given aircraft’s weight category to arrive at an actual turbulence intensity. The SXAR1 turbulence layer, on the other hand, assumes a medium aircraft weight category and provides actual turbulence intensity for aircraft in that category; smaller aircraft will experience more severe turbulence at a given intensity and larger aircraft will experience less severe turbulence.
Internet TurbulenceInternet Turbulence
EDR Intensity
Color
10
20
30
40
50
60
70
80
90
SXAR1 TurbulenceSXAR1 Turbulence
Turbulence Intensity
Color
Light
Moderate
Severe
Extreme
ForeFlight Mobile Legends v9.4 and later! 9
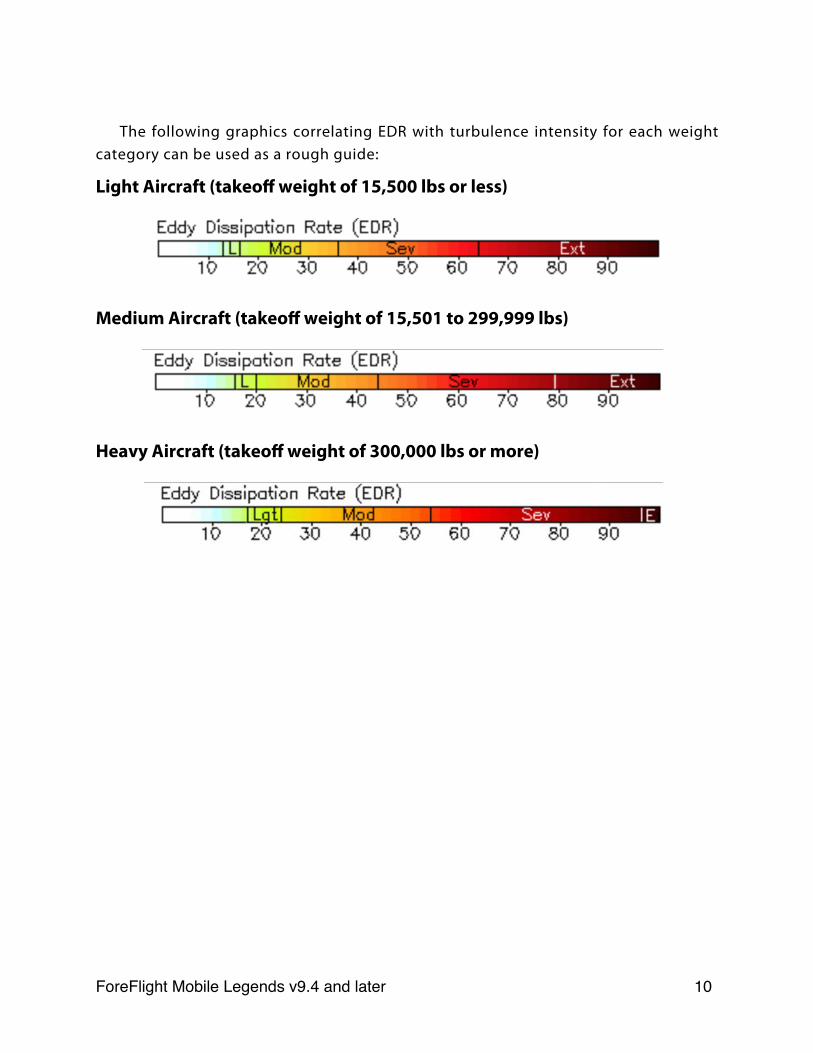
The following graphics correlating EDR with turbulence intensity for each weight category can be used as a rough guide:
Light Aircraft (takeoff weight of 15,500 lbs or less)
Medium Aircraft (takeoff weight of 15,501 to 299,999 lbs)
Heavy Aircraft (takeoff weight of 300,000 lbs or more)
ForeFlight Mobile Legends v9.4 and later! 10
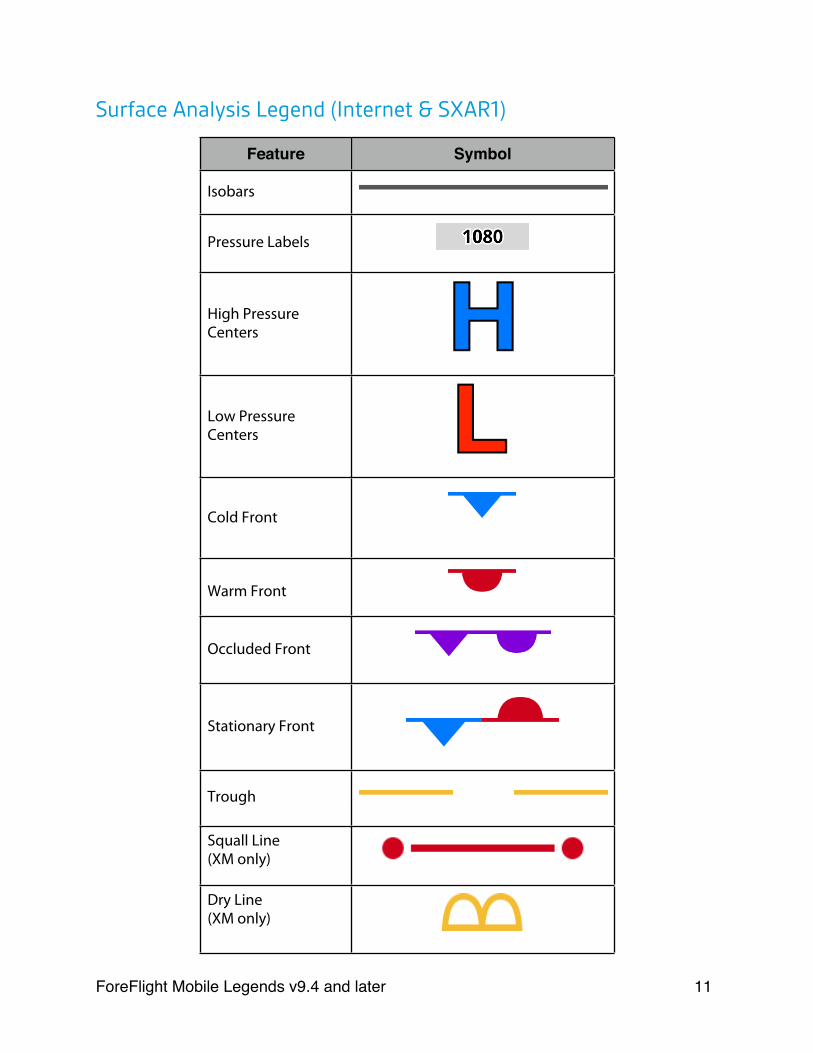
Surface Analysis Legend (Internet & SXAR1)
Feature Symbol
Isobars
Pressure Labels
High Pressure Centers
Low Pressure Centers
Cold Front
Warm Front
Occluded Front
Stationary Front
Trough
Squall Line (XM only)
Dry Line(XM only)
ForeFlight Mobile Legends v9.4 and later! 11
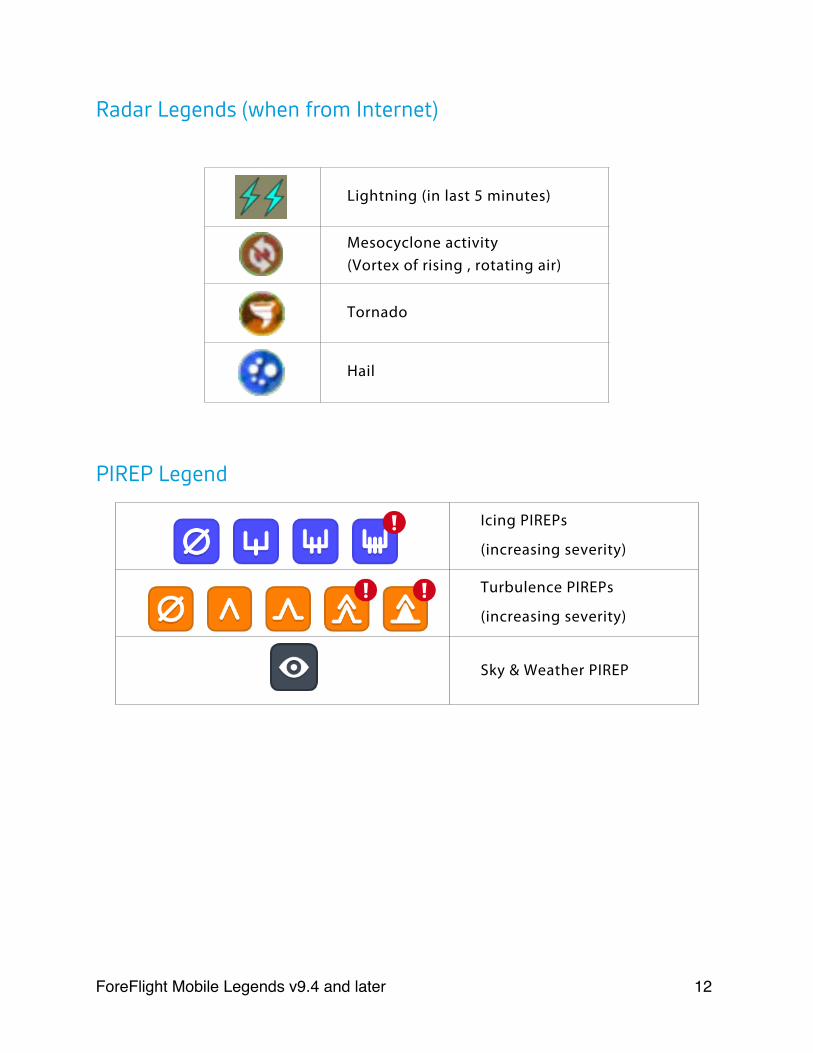
Radar Legends (when from Internet)
Lightning (in last 5 minutes)
Mesocyclone activity(Vortex of rising , rotating air)
Tornado
Hail
PIREP Legend
Icing PIREPs
(increasing severity)
Turbulence PIREPs
(increasing severity)
Sky & Weather PIREP
ForeFlight Mobile Legends v9.4 and later! 12
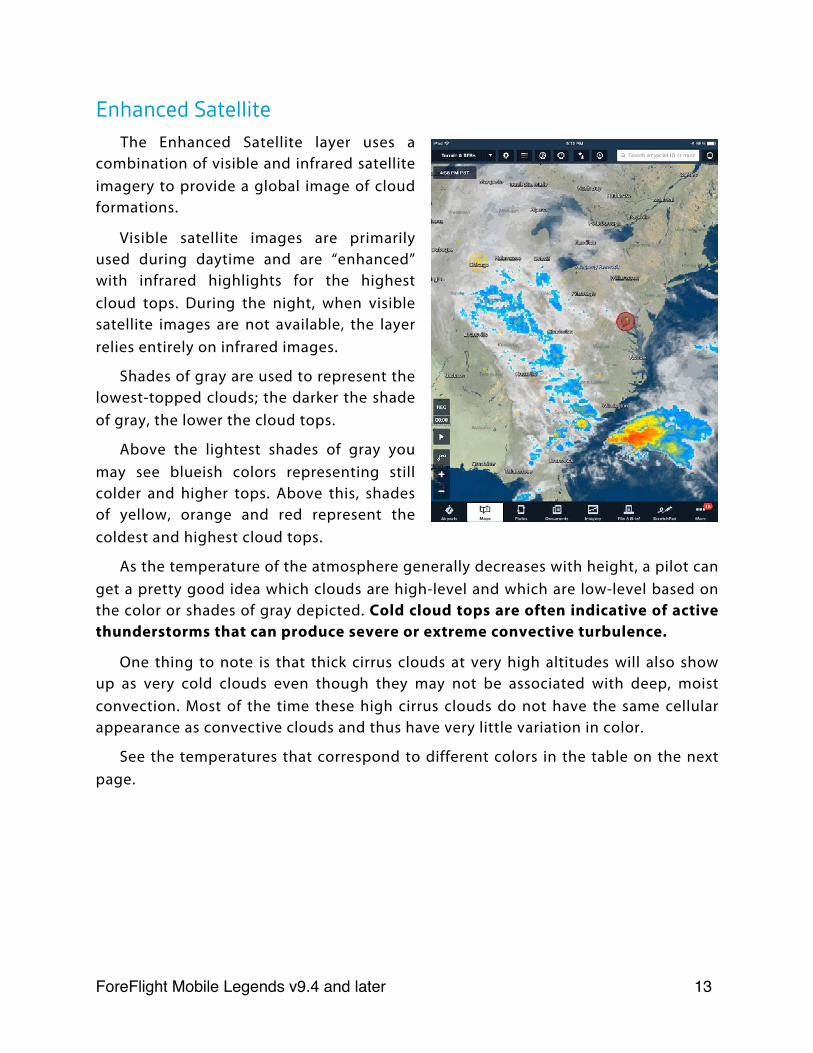
Enhanced SatelliteThe Enhanced Satellite layer uses a
combination of visible and infrared satellite imagery to provide a global image of cloud formations.
Visible satellite images are primarily used during daytime and are “enhanced” with infrared highlights for the highest cloud tops. During the night, when visible satellite images are not available, the layer relies entirely on infrared images.
Shades of gray are used to represent the lowest-topped clouds; the darker the shade of gray, the lower the cloud tops.
Above the lightest shades of gray you may see blueish colors representing still colder and higher tops. Above this, shades of yellow, orange and red represent the coldest and highest cloud tops.
As the temperature of the atmosphere generally decreases with height, a pilot can get a pretty good idea which clouds are high-level and which are low-level based on the color or shades of gray depicted. Cold cloud tops are often indicative of active thunderstorms that can produce severe or extreme convective turbulence.
One thing to note is that thick cirrus clouds at very high altitudes will also show up as very cold clouds even though they may not be associated with deep, moist convection. Most of the time these high cirrus clouds do not have the same cellular appearance as convective clouds and thus have very little variation in color.
See the temperatures that correspond to different colors in the table on the next page.
ForeFlight Mobile Legends v9.4 and later! 13
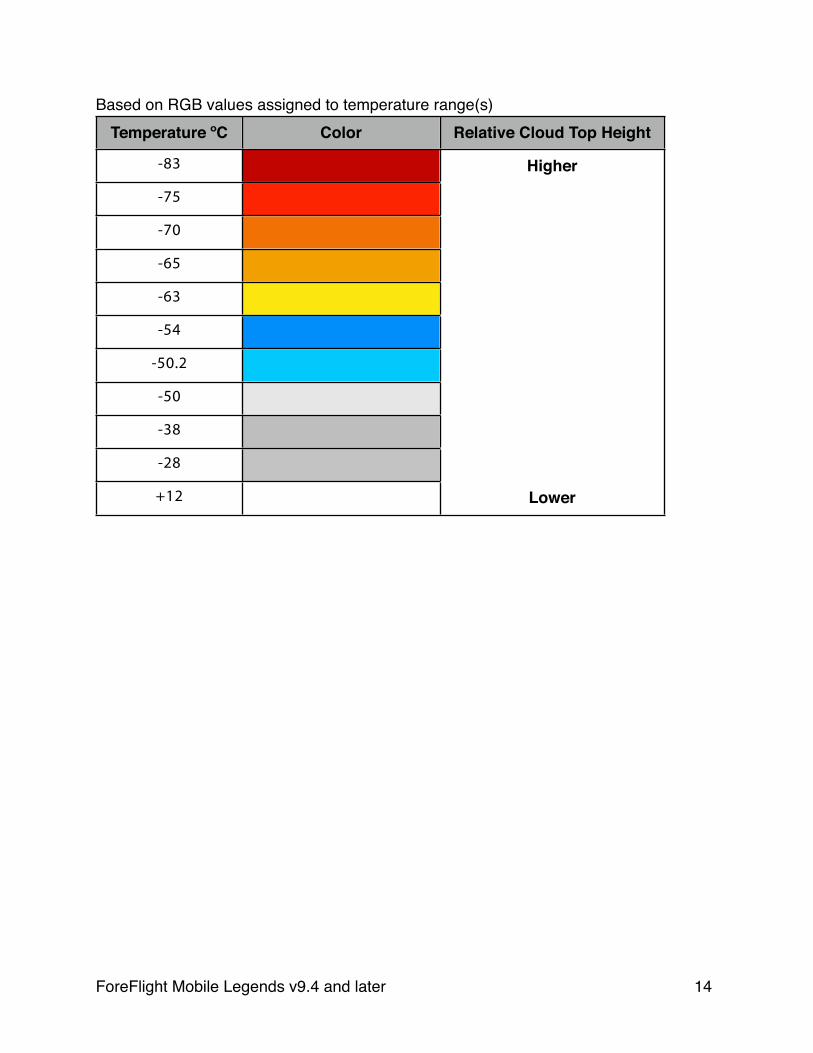
Based on RGB values assigned to temperature range(s)Temperature ºC Color Relative Cloud Top Height
-83 Higher
-75
-70
-65
-63
-54
-50.2
-50
-38
-28
+12 Lower
ForeFlight Mobile Legends v9.4 and later! 14
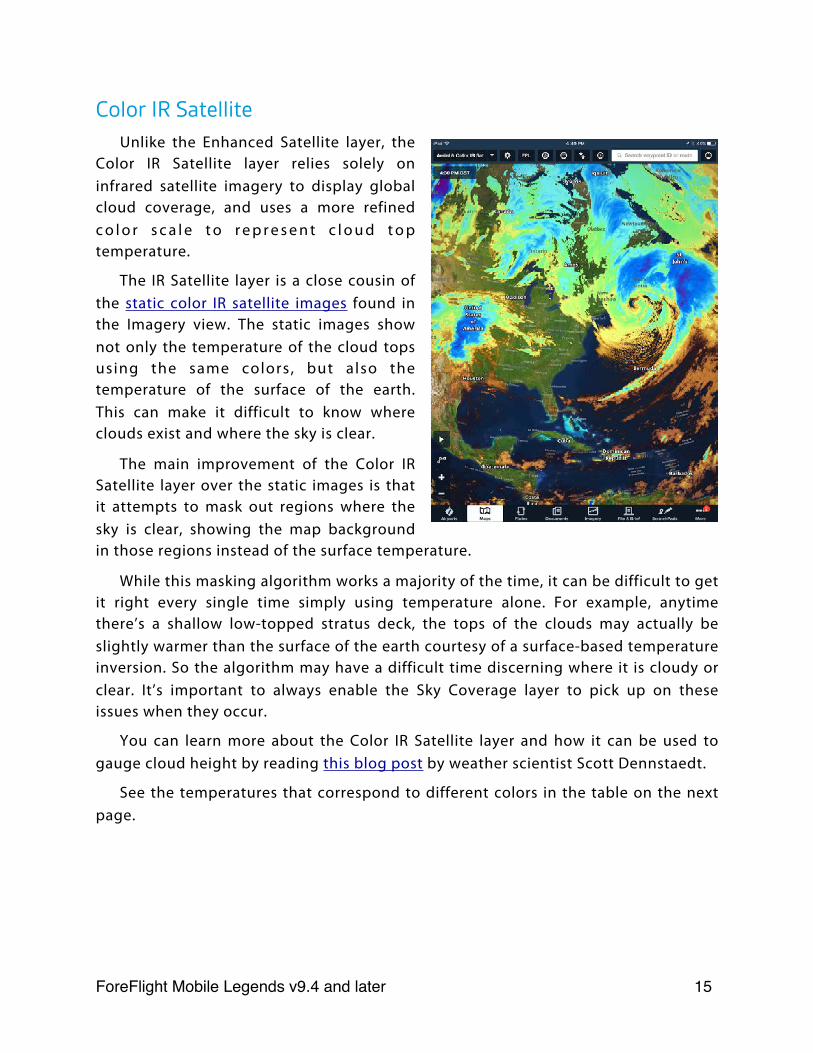
Color IR SatelliteUnlike the Enhanced Satellite layer, the
Color IR Satellite layer relies solely on infrared satellite imagery to display global cloud coverage, and uses a more refined c o l o r s c a l e t o r e p r e s e n t c l o u d t o p temperature.
The IR Satellite layer is a close cousin of the static color IR satellite images found in the Imagery view. The static images show not only the temperature of the cloud tops using the same colors , but also the temperature of the surface of the earth. This can make it difficult to know where clouds exist and where the sky is clear.
The main improvement of the Color IR Satellite layer over the static images is that it attempts to mask out regions where the sky is clear, showing the map background in those regions instead of the surface temperature.
While this masking algorithm works a majority of the time, it can be difficult to get it right every single time simply using temperature alone. For example, anytime there’s a shallow low-topped stratus deck, the tops of the clouds may actually be slightly warmer than the surface of the earth courtesy of a surface-based temperature inversion. So the algorithm may have a difficult time discerning where it is cloudy or clear. It’s important to always enable the Sky Coverage layer to pick up on these issues when they occur.
You can learn more about the Color IR Satellite layer and how it can be used to gauge cloud height by reading this blog post by weather scientist Scott Dennstaedt.
See the temperatures that correspond to different colors in the table on the next page.
ForeFlight Mobile Legends v9.4 and later! 15
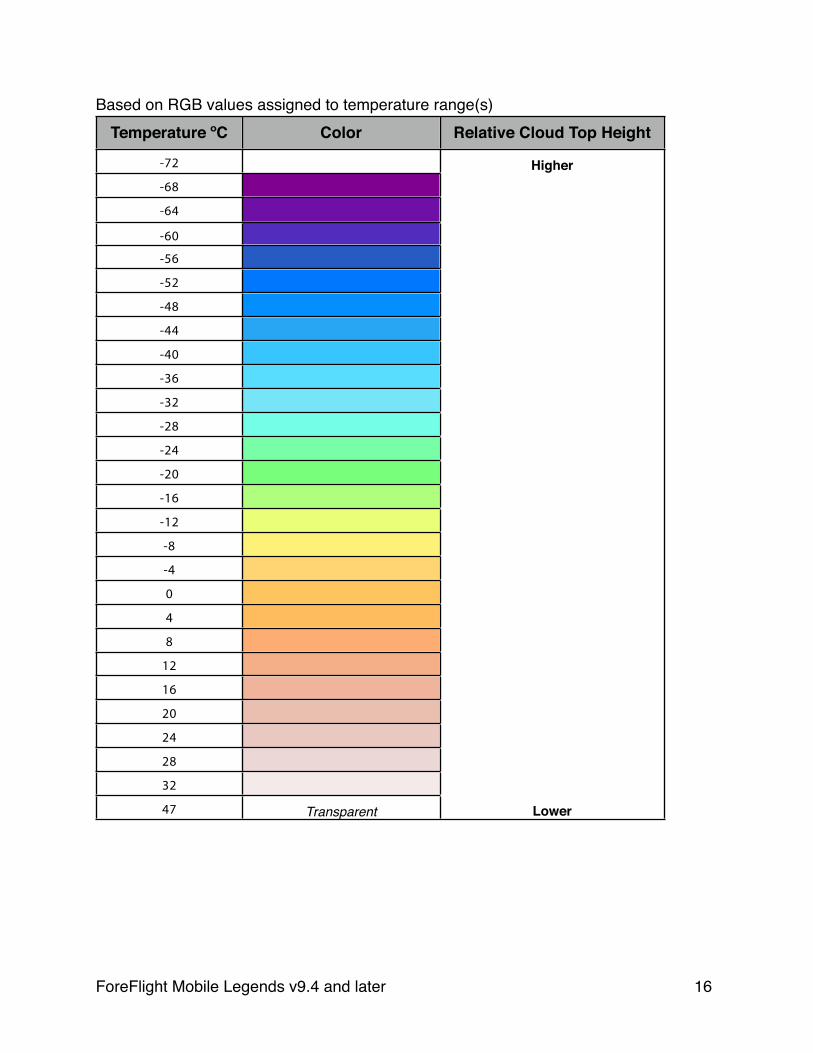
Based on RGB values assigned to temperature range(s)Temperature ºC Color Relative Cloud Top Height
-72 Higher-68
-64
-60
-56
-52
-48
-44
-40
-36
-32
-28
-24
-20
-16
-12
-8
-4
0
4
8
12
16
20
24
28
32
47 Transparent Lower
ForeFlight Mobile Legends v9.4 and later! 16
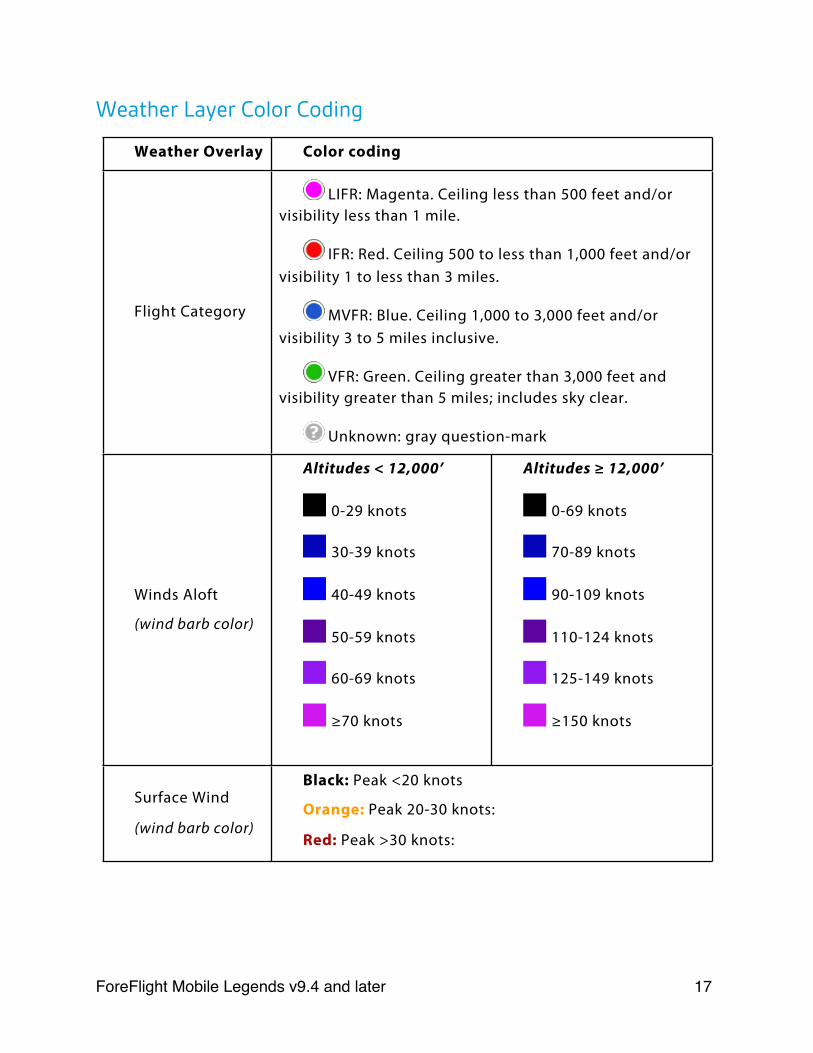
Weather Layer Color Coding
Weather Overlay Color codingColor coding
Flight Category
LIFR: Magenta. Ceiling less than 500 feet and/or visibility less than 1 mile.
IFR: Red. Ceiling 500 to less than 1,000 feet and/or visibility 1 to less than 3 miles.
MVFR: Blue. Ceiling 1,000 to 3,000 feet and/or visibility 3 to 5 miles inclusive.
VFR: Green. Ceiling greater than 3,000 feet and visibility greater than 5 miles; includes sky clear.
Unknown: gray question-mark
Winds Aloft
(wind barb color)
Altitudes < 12,000’
0-29 knots
30-39 knots
40-49 knots
50-59 knots
60-69 knots
≥70 knots
Altitudes ≥ 12,000’
0-69 knots
70-89 knots
90-109 knots
110-124 knots
125-149 knots
≥150 knots
Surface Wind
(wind barb color)
Black: Peak <20 knots
Orange: Peak 20-30 knots:
Red: Peak >30 knots:
Black: Peak <20 knots
Orange: Peak 20-30 knots:
Red: Peak >30 knots:
ForeFlight Mobile Legends v9.4 and later! 17
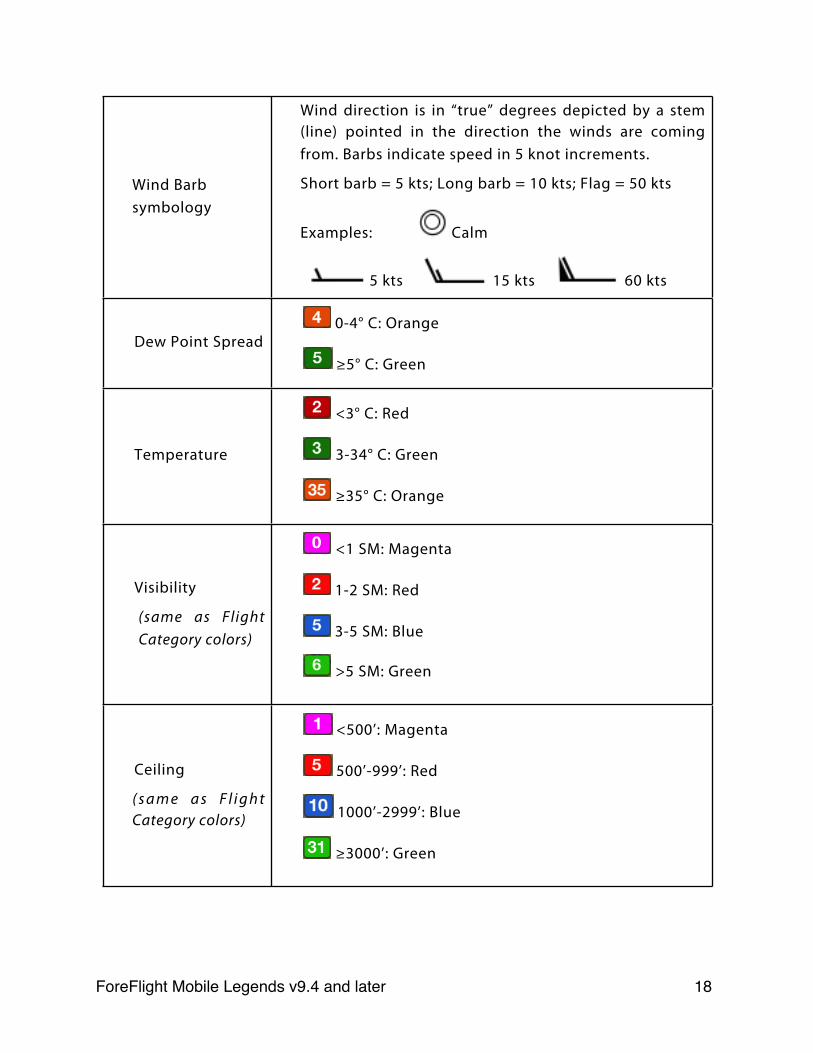
Wind Barb symbology
Wind direction is in “true” degrees depicted by a stem (line) pointed in the direction the winds are coming from. Barbs indicate speed in 5 knot increments.
Short barb = 5 kts; Long barb = 10 kts; Flag = 50 kts
Examples: Calm
5 kts 15 kts 60 kts
Wind direction is in “true” degrees depicted by a stem (line) pointed in the direction the winds are coming from. Barbs indicate speed in 5 knot increments.
Short barb = 5 kts; Long barb = 10 kts; Flag = 50 kts
Examples: Calm
5 kts 15 kts 60 kts
Dew Point Spread 0-4° C: Orange
≥5° C: Green
0-4° C: Orange
≥5° C: Green
Temperature
<3° C: Red
3-34° C: Green
≥35° C: Orange
<3° C: Red
3-34° C: Green
≥35° C: Orange
Visibility
(same as Flight Category colors)
<1 SM: Magenta
1-2 SM: Red
3-5 SM: Blue
>5 SM: Green
<1 SM: Magenta
1-2 SM: Red
3-5 SM: Blue
>5 SM: Green
Ceiling
( s a m e a s F l i g h t Category colors)
<500’: Magenta
500’-999’: Red
1000’-2999’: Blue
≥3000’: Green
<500’: Magenta
500’-999’: Red
1000’-2999’: Blue
≥3000’: Green
ForeFlight Mobile Legends v9.4 and later! 18
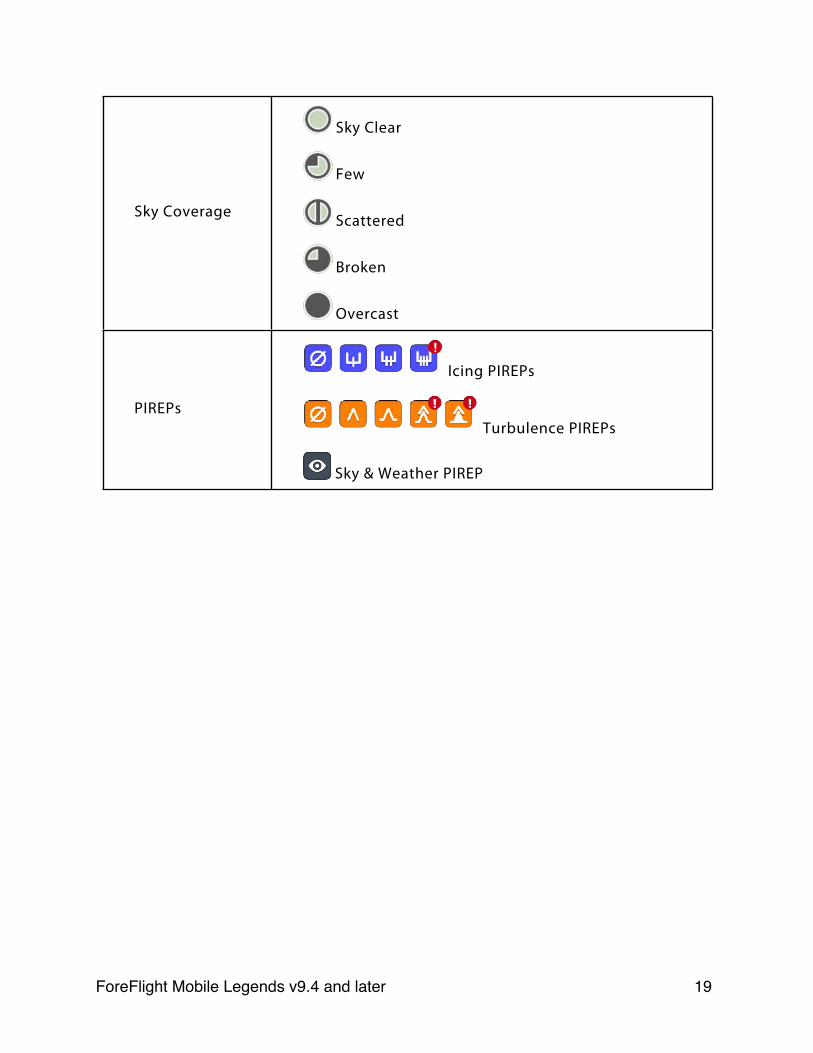
Sky Coverage
Sky Clear
Few
Scattered
Broken
Overcast
Sky Clear
Few
Scattered
Broken
Overcast
PIREPs
Icing PIREPs
Turbulence PIREPs
Sky & Weather PIREP
Icing PIREPs
Turbulence PIREPs
Sky & Weather PIREP
ForeFlight Mobile Legends v9.4 and later! 19
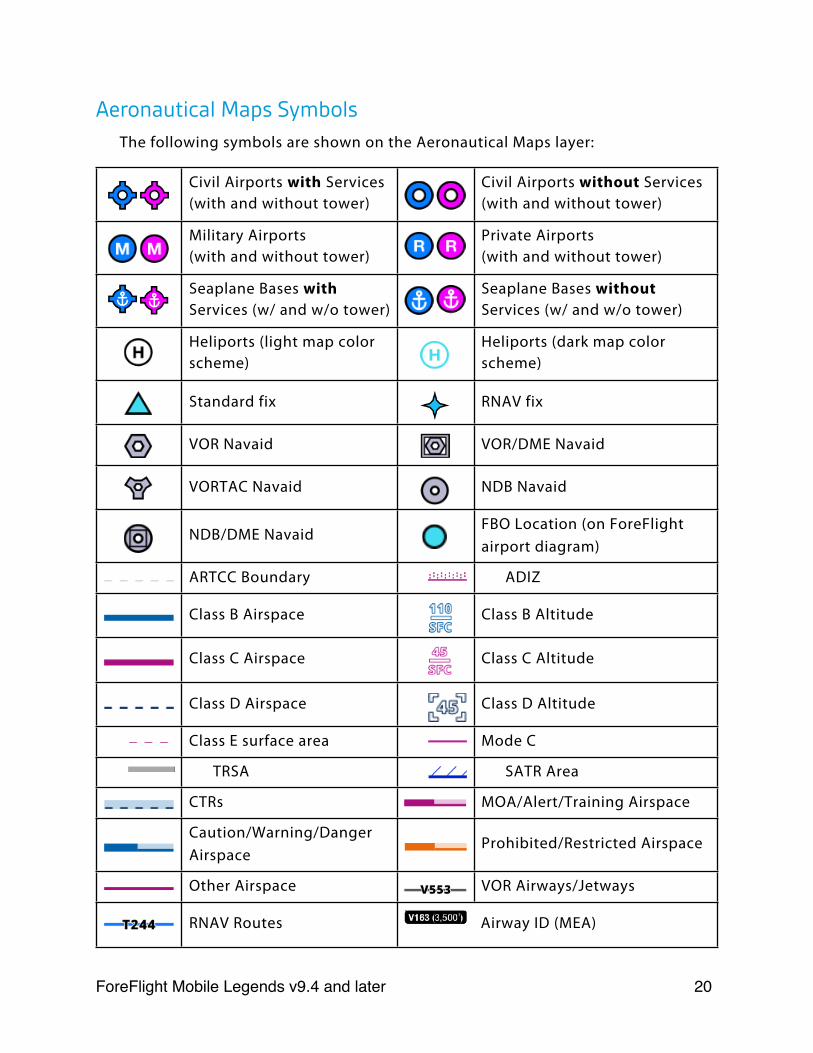
Aeronautical Maps SymbolsThe following symbols are shown on the Aeronautical Maps layer:
Civil Airports with Services (with and without tower)
Civil Airports without Services (with and without tower)
Military Airports(with and without tower)
Private Airports(with and without tower)
Seaplane Bases with Services (w/ and w/o tower)
Seaplane Bases without Services (w/ and w/o tower)
Heliports (light map color scheme)
Heliports (dark map color scheme)
Standard fix RNAV fix
VOR Navaid VOR/DME Navaid
VORTAC Navaid NDB Navaid
NDB/DME NavaidFBO Location (on ForeFlight airport diagram)
ARTCC Boundary ADIZ
Class B Airspace Class B Altitude
Class C Airspace Class C Altitude
Class D Airspace Class D Altitude
Class E surface area Mode C
TRSA SATR Area
CTRs MOA/Alert/Training Airspace
Caution/Warning/Danger Airspace
Prohibited/Restricted Airspace
Other Airspace VOR Airways/Jetways
RNAV Routes Airway ID (MEA)
ForeFlight Mobile Legends v9.4 and later! 20
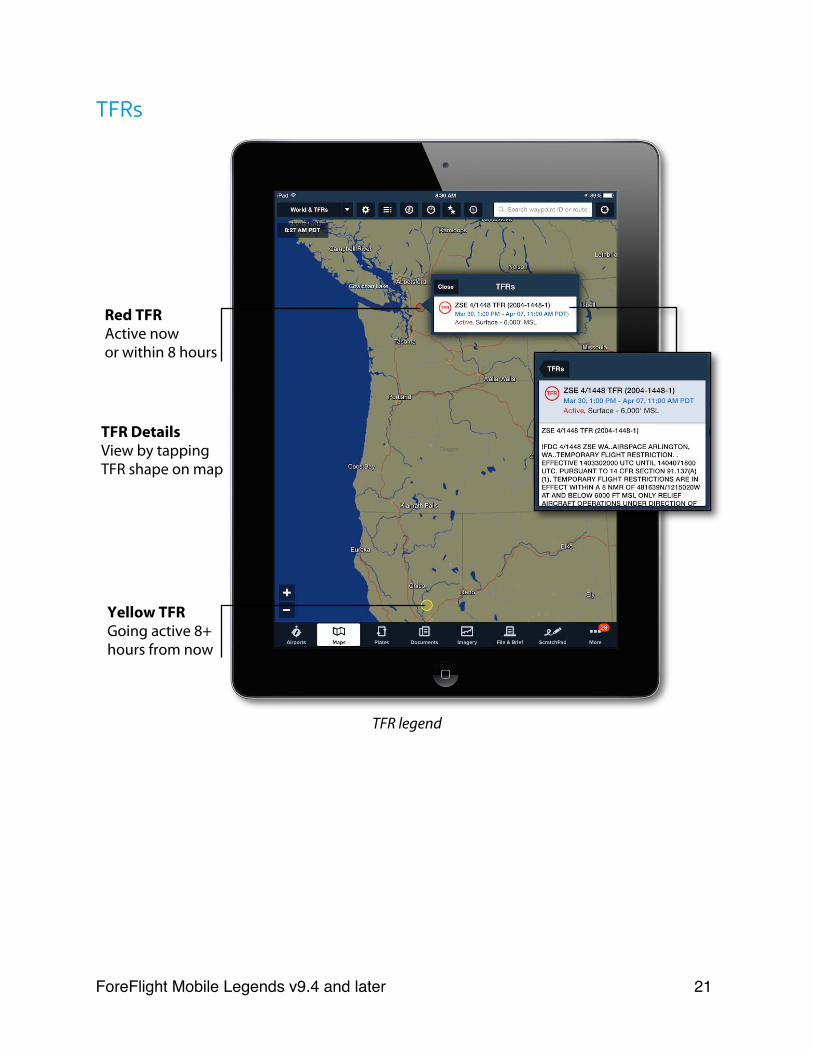
TFRs
TFR legend
Red TFRActive now or within 8 hours
TFR DetailsView by tapping TFR shape on map
Yellow TFRGoing active 8+ hours from now
ForeFlight Mobile Legends v9.4 and later! 21
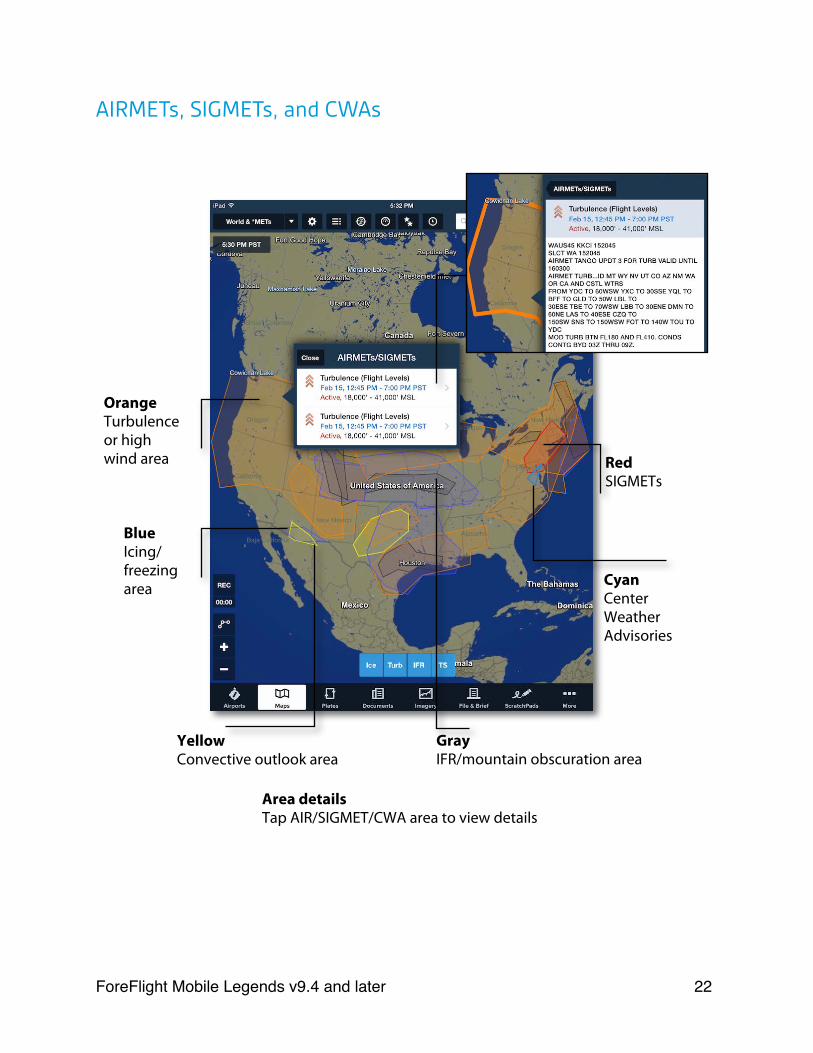
AIRMETs, SIGMETs, and CWAs
Area detailsTap AIR/SIGMET/CWA area to view details
GrayIFR/mountain obscuration area
BlueIcing/freezing area
OrangeTurbulence or high wind area Red
SIGMETs
CyanCenter Weather Advisories
YellowConvective outlook area
ForeFlight Mobile Legends v9.4 and later! 22
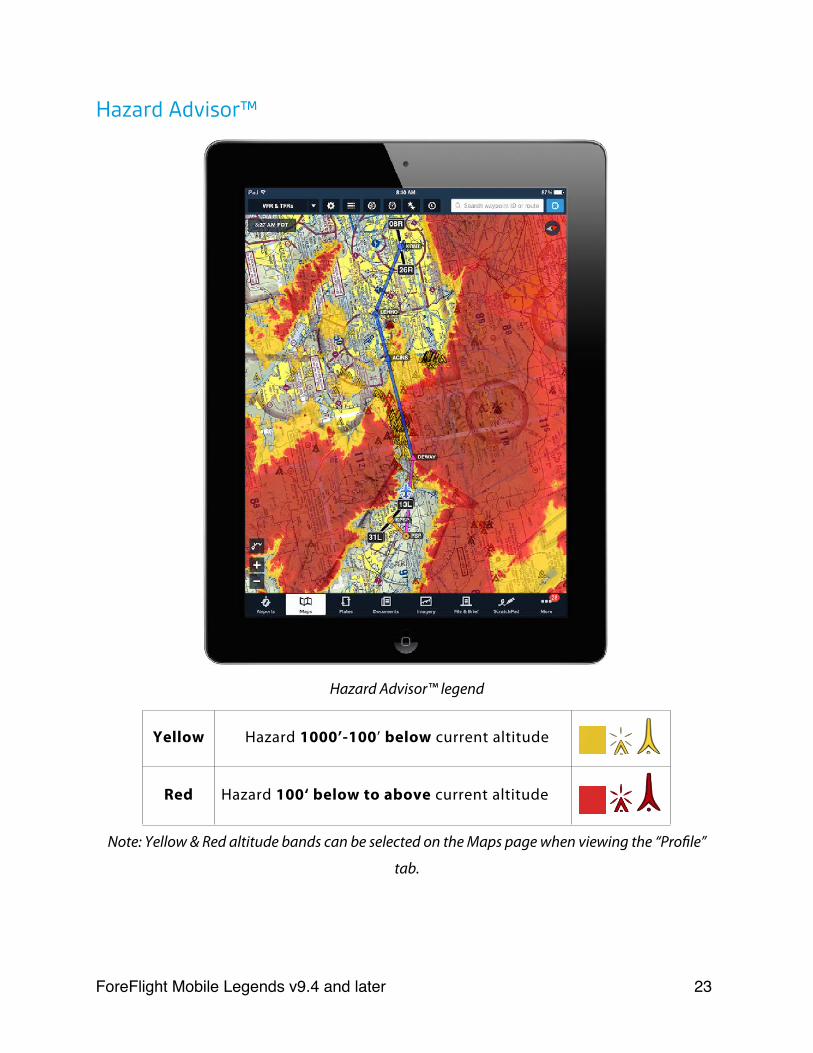
Hazard Advisor™
Hazard Advisor™ legend
Yellow Hazard 1000’-100’ below current altitude
Red Hazard 100‘ below to above current altitude
Note: Yellow & Red altitude bands can be selected on the Maps page when viewing the “Profile”
tab.
ForeFlight Mobile Legends v9.4 and later! 23
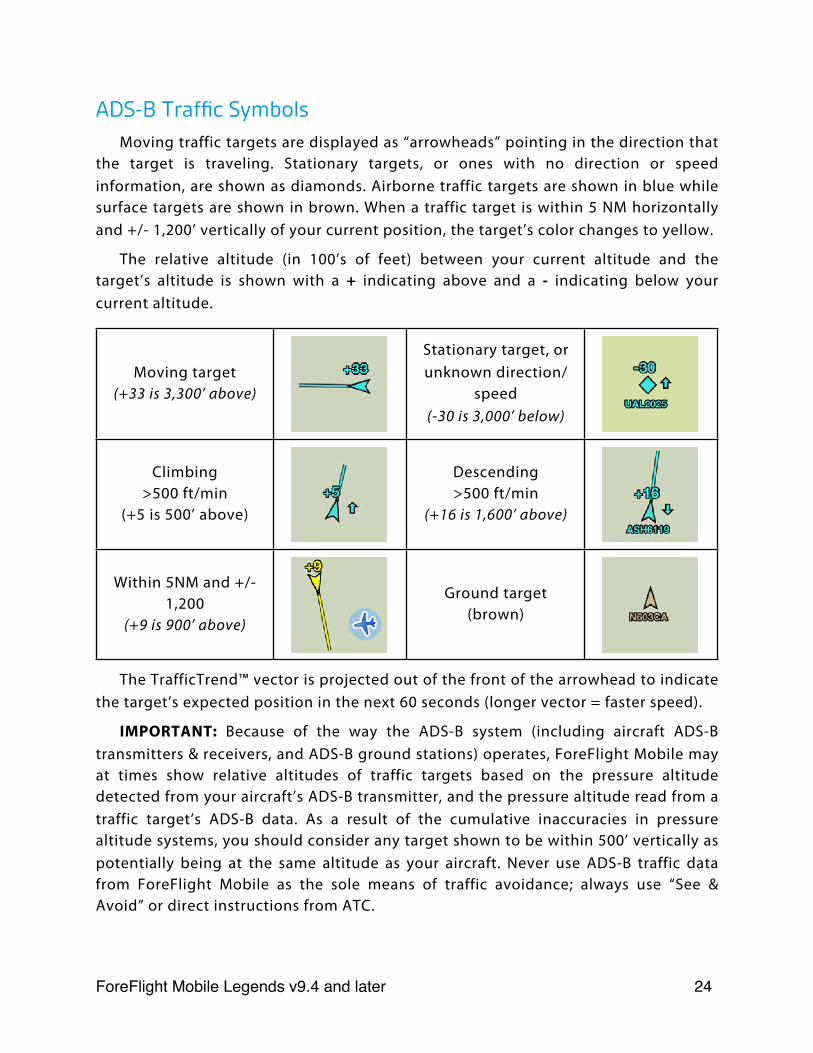
ADS-B Traffic SymbolsMoving traffic targets are displayed as “arrowheads” pointing in the direction that
the target is traveling. Stationary targets, or ones with no direction or speed information, are shown as diamonds. Airborne traffic targets are shown in blue while surface targets are shown in brown. When a traffic target is within 5 NM horizontally and +/- 1,200’ vertically of your current position, the target’s color changes to yellow.
The relative altitude (in 100’s of feet) between your current altitude and the target’s altitude is shown with a + indicating above and a - indicating below your current altitude.
Moving target(+33 is 3,300’ above)
Stationary target, or unknown direction/
speed(-30 is 3,000’ below)
Climbing >500 ft/min
(+5 is 500’ above)
Descending >500 ft/min
(+16 is 1,600’ above)
Within 5NM and +/- 1,200
(+9 is 900’ above)
Ground target (brown)
The TrafficTrend™ vector is projected out of the front of the arrowhead to indicate the target’s expected position in the next 60 seconds (longer vector = faster speed).
IMPORTANT: Because of the way the ADS-B system (including aircraft ADS-B transmitters & receivers, and ADS-B ground stations) operates, ForeFlight Mobile may at times show relative altitudes of traffic targets based on the pressure altitude detected from your aircraft’s ADS-B transmitter, and the pressure altitude read from a traffic target’s ADS-B data. As a result of the cumulative inaccuracies in pressure altitude systems, you should consider any target shown to be within 500’ vertically as potentially being at the same altitude as your aircraft. Never use ADS-B traffic data from ForeFlight Mobile as the sole means of traffic avoidance; always use “See & Avoid” or direct instructions from ATC.
ForeFlight Mobile Legends v9.4 and later! 24