Weather Home Companion - crh.noaa.gov · Weather Home Companion ... and check it out! ... up to...
10
National Weather Service Quad Cities IA/IL INSIDE THIS ISSUE: Weather Home Companion is a semiannual publication of the National Weather Service office in the Quad Cities. If you have an idea for an article or a question you would like to see answered, please write to us. Contact information can be found on page 10. Weather Home Companion Summer 2008 Welcome to Storm- Based Warnings 1 NWS Quad Cities Honored by NOAA 1 StormReady in Your Community 2 The 2007-08 Winter In Review 3 It Seems Like My NOAA Weather Ra- dio Keeps Waking Me Up… Severe Weather Statistics 5 Spring 2008 Flood Review 6 Update : 2008 Flooding Worsens 9 Volume 5 Issue 1 Welcome to Storm-Based Warnings Donna Dubberke NWS Quad Cities Honored by NOAA Steve Kuhl I am proud to announce National Oceanic and Atmospheric Ad- ministration (NOAA) officials selected the staff at the National Weather Service (NWS) Quad Cities forecast office for the rare honor of receiving two, prestig- ious Department of Commerce Bronze Medals. Our staff was recognized for issu- ing life-saving forecasts and warn- ings during the April 13, 2006, tornado outbreak in eastern Iowa and northwestern Illinois, and for the historic ice storm and blizzard of February and March 2007. April 13, 2006 Tornado Outbreak During the tornado outbreak, NWS Quad Cities staff issued more than 70 severe weather warnings, including 15 life- saving tornado warnings. At Effective last October, the National Weather Service began issuing Storm- Based Warnings. This marks a shift in philosophy from the former county—based warnings. Forecasters issuing warnings in the storm-based era strive to be more pre- cise than ever before. Early evaluations of this new philosophy suggest that by reducing the warned area to ¼ of the area of an average county, the economic value to the public due to reduced cost of shelter- ing is a minimum of $100 million per year. For the forecasters, the biggest change is a focus on outlining the area of greatest threat from the storm regardless of politi- cal boundaries. One of the biggest changes for citizens is that multiple warn- ings can be in effect for a county at the same time. For example, if you have a storm moving across the north and a com- pletely different storm moving across the southern part of the same county, there could be separate warnings for each of these storms. Storm-based warnings are best viewed (continued on page 2) (continued on page 2)
Transcript of Weather Home Companion - crh.noaa.gov · Weather Home Companion ... and check it out! ... up to...

Nat ional Weather Serv ice Quad Ci t ies IA/ IL
I N S I D E T H I S I S S U E :
Weather Home Companion is a semiannual publication of the National Weather Service office in the Quad Cities. If you have an idea for an article or a question you would like to see answered, please write to us. Contact information can be found on page 10.
Weather Home Companion
Summer 2008
Welcome to Storm-Based Warnings
1
NWS Quad Cities Honored by NOAA
1
StormReady in Your Community
2
The 2007-08 Winter In Review
3
It Seems Like My NOAA Weather Ra-dio Keeps Waking Me Up… Severe Weather Statistics
5
Spring 2008 Flood Review
6
Update : 2008 Flooding Worsens
9
Volume 5 Issue 1
Welcome to Storm-Based Warnings Donna Dubberke
NWS Quad Cities Honored by NOAA Steve Kuhl
I am proud to announce National Oceanic and Atmospheric Ad-ministration (NOAA) officials selected the staff at the National Weather Service (NWS) Quad Cities forecast office for the rare honor of receiving two, prestig-ious Department of Commerce Bronze Medals.
Our staff was recognized for issu-ing life-saving forecasts and warn-ings during the April 13, 2006, tornado outbreak in eastern Iowa and northwestern Illinois, and for the historic ice storm and blizzard of February and March 2007.
April 13, 2006 Tornado Outbreak During the tornado outbreak, NWS Quad Cities staff issued more than 70 severe weather warnings, including 15 life-saving tornado warnings. At
Effective last October, the National Weather Service began issuing Storm-Based Warnings. This marks a shift in philosophy from the former county—based warnings. Forecasters issuing warnings in the storm-based era strive to be more pre-cise than ever before. Early evaluations of this new philosophy suggest that by reducing the warned area to ¼ of the area of an average county, the economic value to the public due to reduced cost of shelter-ing is a minimum of $100 million per year. For the forecasters, the biggest change is a focus on outlining the area of greatest threat from the storm regardless of politi-cal boundaries. One of the biggest changes for citizens is that multiple warn-ings can be in effect for a county at the same time. For example, if you have a storm moving across the north and a com-pletely different storm moving across the southern part of the same county, there could be separate warnings for each of these storms. Storm-based warnings are best viewed
(continued on page 2)
(continued on page 2)

Welcome to Storm-Based Warnings (continued from page 1)
Page 2 Volume 5 , Issue 1
graphically because the threat area can be difficult to describe in words for text warnings and radio. Viewing the warnings graphically via the internet or TV allows you to see quickly where the threat has
St. Patrick’s Church in Iowa City, 75 parishioners attending services evacuated to an adjacent basement following a tornado warning and sirens, which sounded 37 minutes before the storm struck the church. When the tornado hit, the steeple, choir loft and part of the roof and walls collapsed onto the evacuated area. February and March 2007 Ice Storm and Blizzard Our forecasters coordinated with other weather service offices serv-
NWS Quad Cities Honored by NOAA (continued from page 1)
ing Iowa during the February 23-25 ice storm and March 1-2 bliz-zard of 2007. NWS staff coordi-nated closely with state and local officials and the media to collect and share information on the ice storm and blizzard developments. These storms resulted in four fatalities, 250,000 homes losing power and the closure of six inter-state highways and eight state highways. Accurate weather fore-casts and warnings prepared by Quad Cities and other NWS of-fices serving Iowa, enabled offi-cials to prepare storm shelters,
keep highways open, deploy Na-tional Guard troops, and keep the public advised of the adverse weather conditions. Retired Navy Vice Admiral Conrad C. Lautenbacher, Ph.D., undersecretary of commerce for oceans and atmosphere and NOAA administrator, presented the Bronze Medals to myself and Terry Simmons, Data Acquisition Program Manager, during a cere-mony on April 18th in Washing-ton, D.C.
been identified. GIS-based com-puter programs can also easily plot the warnings and display them with other relevant informa-tion such as radar. You can view Storm-Based warn-
ings in action on the new Watches/Warnings portion of our web site. Visit www.crh.noaa.gov/hazards/dvn and check it out!
StormReady in Your Community Donna Dubberke Since its inception in 1999, the StormReady program has been growing steadily. StormReady sets an industry standard for severe weather preparedness and commu-nication. Although it started with counties and cities, it has since spread to universities, businesses, Indian reservations, and even mili-tary bases. In the local area, 5 counties (Stephenson County, IL, McDonough County, IL, Benton County, IA, Johnson County, IA, and Des Moines County, IA), 5 towns (Galva, IL, Kewanee, IL, Good Hope, IL, Prairie City, IL, and Blandinsville, IL), as well as the University of Dubuque are currently recognized as Storm-Ready.
StormReady Supporters Many businesses and organizations have an effective severe weather strategy, but the full StormReady program guidelines (which were designed with governments entities in mind) don’t really apply. In these cases, the StormReady Sup-porter program fits the bill. StormReady Supporters apply the principles of the StormReady pro-gram to their own organization in an effective way. The Johnson County Conservation Board was
More About Storm-Based Warnings: www.weather.gov/sbwarnings
Weather Home Com-panion On-Line Archive has more in-formation on these events: Iowa City Tornado: www.crh.noaa.gov/images/ dvn/newsletters/Spring06.pdf
2007 Ice Storm and Blizzard: www.crh.noaa.gov/images/ dvn/downloads/fall07.pdf
More About the Storm-Ready program: www.weather.gov/quadcities/ ?n=stormready
the first StormReady Supporter recognized in our area (Oct. 2007), followed by the Howard H. Cherry Scout Reservation (Jan. 2008) and then Deere & Company World Headquarters (Jan. 2008). We would like to extend our congratulations to all of the com-munities, towns, and organiza-tions that have been recognized through the StormReady pro-gram for implementing excep-tional severe weather strategies.

Overview: The winter of 2007-08 was a long one. The weather pattern was very active beginning at the end of November and continuing through the end of April. Many people remarked how it re-minded them of the 1978-79 winter season. Forecasters at the National Weather Service office in the Quad Cities were kept very busy. There were a total of 23 separate precipitation events that required headlines (winter weather advisories, watches or warnings) compared to only 16 during the previous winter sea-son. Seasonal snowfall totals ranged from 50 to nearly 80 inches along and north of Interstate 80, to 30 to 45 inches to the south. A record seasonal total was es-tablished at Dubuque, Iowa with 76.5 inches. This broke the old record of 75.7 inches set during the 1961-62 season. The coop-erative observer at Lowden, Iowa in Cedar county measured a record 40.3 inches in the month of February, resulting in a total seasonal snowfall of a whopping 78.2 inches! This site had the most of any in eastern Iowa. In Illinois, Apple River Canyon State Park in Jo Daviess county, had 72.0 inches of snow. Fur-ther to the north, Madison, Wis-consin recorded over 100 inches during the winter season, far exceeding the previous winter record of 76.6 inches in 1978-79. Highlights: December There were two ice storms in December, each producing over an inch of ice accumulation at some locations. The ice storms occurred on December 1 and again on December 10-11, 2007. These were followed by an in-tense winter storm that struck on
December 22-23, 2007. January Incredibly, a big warm-up oc-curred during the first week of January melting much of the snow. At some locations, record high temperatures in the 60s were recorded on January 6-7, 2008. With the warm air melting the snow, several days of dense fog plagued the region. The warm air culminated in a few large hail reports during the early morning hours of January 7. Later that afternoon, a rare major winter tornado outbreak formed from southeast Wisconsin to Arkansas. A couple of strong tornadoes struck portions of northern Illinois into southeast Wisconsin. Not long afterwards, winter returned to the Midwest. February The month of February was very active with three major winter storms. A thundersnow event occurred on February 3, near re-cord snows fell on February 5-6, and a major winter storm struck on February 16-17. The February 5-6 event dumped near record
The 2007-08 Winter In Review John Haase
Bill Nichols
snows of 12 to 18 inches across a large portion of eastern Iowa and northwest Illinois. The most snow reported during this event was 18 inches at Winslow in northern Stephenson county. March Most of the month of March was quiet as far as snowfall, but due to several heavy rain events and melting of the snow depth, flood-ing became a concern for much of the month. April Cool weather continued well into April. In fact, the first 70 degree maximum temperature of the spring season did not occur in Moline until the 16th. Sleet and snow showers were observed as late as the 28th. This was fol-lowed by frost and freezing tem-peratures on April 29th. Causes: The reasons for our record snowy and colder winter are complex and still not fully understood. Increasing evidence leads to three
Weather Home Companion Page 3
(continued on page 4)
...there were 23 separate precipita-tion events requiring winter weather advi-sories, watches or warnings, compared to only 16 during the previous winter sea-son...
Inches of Snow
Highest seasonal totals in the NWS Quad Cities service area: Iowa: 78.2 inches, Lowden Coopera-tive observer (Cedar County) Illinois: 72.0 inches, Apple River Canyon State Park (Jo Daviess County)

Page 4 Volume 5 , Issue 1
critical relationships. We will dis-cuss these in order of impact on our local Upper Midwestern climate 1) Ocean Temperature
Several recent studies have empha-sized the strong relationship be-tween changes in sea surface tem-peratures and changes in the long term average temperatures over land. This is primarily for two reasons: 1) the world’s oceans cover over 70 percent of the planet’s surface; and 2) the amount of heat captured in the oceans (called specific heat capacity) is roughly five times that of the earth’s land mass. Because the oceans are also deep and undergo mixing (or convection), this allows for added heat storage or release of up to 5,000 times that of the land mass. Statistical data indicates a strong relationship between North American temperatures and sea surface temperatures in the Pacific and Atlantic, both of which have cooled noticeably over the past year. 2) Strength of the Sun Remarkably, the sun’s rays are not constant. Past evidence indicates that the strength of the sun’s rays (called solar irradiance) varies only slightly, yet still enough to have impacts on our climate. A key indi-cator of this relationship of changes in the strength of the sun appears to be related to the number of sun-spots. Increasing data suggest the number of observed sunspots are abnor-mally low and we are entering a “quiet phase” of sunspot activity. This would suggest a slight reduc-tion in the amount of energy from the sun reaching the earth’s sur-face. The discovery of this rela-tionship is fairly new, with signifi-cant amounts of additional research needed over the next several years.
The 2007-08 Winter In Review (continued from page 3)
3) La Niña This term relates to the tempera-ture in the Pacific Oceans within 5 degrees of the equator between South America to east of the Phil-ippines. La Niña is the “cold” phase of the more commonly known El Niño (warm phase). Since this phenomena covers smaller area of the world’s oceans, and is further away from
North America, the impact is less. So our remarkably snowy winter appears to be related to the re-cent cooling in ocean tempera-tures, and possibly to a slightly cooler sun. Scientists will con-tinue to monitor these factors and gather more information to better understand their impacts on our weather.
Snow totals for the winter of 2007-2008. A new record was set at Dubuque, where a total of 78.7 inches fell for the season. This broke the old record of 75.7, set in the winter of 1961-62.
...the amount of heat captured in the oceans is roughly 5 times that of the earth’s land mass...
...We are entering a “quiet phase” of sunspot activity...
Heavy snow and strong wind combined to produce this large drift by a house in Norway, Iowa, February 18, 2008. Norway is southwest of Cedar Rapids. Photo Courtesy of Richard Percifield.

Weather Home Companion Page 5
It Seems Like My NOAA Weather Radio Keeps Waking Me Up… Donna Dubburke
Does it seem like your weather radio is always wak-ing you up? We decided to take a look at some sta-tistics to find out more about warnings and when they are issued in our local area (eastern Iowa, west-ern Illinois, and extreme northeast Missouri). Here’s what we discovered… We have thunderstorms about forty days per year on average. Over the course of those days, we average
roughly ten severe thunderstorm warnings, one flash flood warning, and one tornado warning for any given county per year. That means that only about 25 percent of thunderstorms are intense enough to warrant some kind of warning. Of course, most thunderstorms occur during the warmer months from March through October and during the afternoon and evening (see graphs on this page).
Tornado Statistics
Did you know…
Only 1% of all tornadoes are rated EF4 or stronger (winds esti-
mated at 166 mph or higher) on the Enhanced Fujita scale. Yet this tiny percentage ac-counts for 67% of tornado fatalities.
The last EF5 rated tornado was…
Parkersburg, IA *- May 29, 2008 (6 fatalities - prelimi-nary) Prior to that: Greensburg, KS, May 4, 2007 (10 fatalities) Iowa (prior to Parkersburg): Jordan - June 13, 1976 (0 fatalities) Illinois: Plainfield - Aug. 28, 1990 (29 fatalities) Missouri: Kansas City - May 20, 1957 (44 fatalities)
40 years ago, on May 15, 1968, two F5 torna-does touched down in
Iowa within an hour of each other. Commonly referred to as the Oelwein tornado and the Charles City tornado, the two caused a combined 13 fatalities and over 50 million dollars in damage.
*More information about the devastating tornadoes that impacted Parkersburg, New Hartford, and Dunkerton, Iowa in May can be found at the following link from NWS Des Moines website:
www.crh.noaa.gov/dmx/?n=parkersburg

Page 6 Volume 5 , Issue 1
Editors Note: The excessively wet weather pattern has continued since this article was written. Widespread historic and devastating flooding occurred along the Iowa tribu-tary rivers and the Mississippi River south of the Quad Cities in June 2008. More information about this flooding will appear in later additions of this newsletter.
Spring 2008 Flood Review Jeff Zogg
The spring of 2008 brought widespread flooding to much of our region. In fact, this flood event was our region’s worst flood event since the spring of 1997. Although the flood of 2001 brought higher crests on the Mississippi River, that event was mainly confined to the Mississippi River itself. This spring, however, the Mississippi River as well as many of its tributaries saw major to near-record flooding. In addition, ice jams led to record flooding on the Rock River in Illinois early in the season.
What caused the flooding? The combination of heavy rainfall and snow melt produced the flooding. Snow pack across our region was much above normal. Some places reported record snow depths. In addition, much of our region saw heavy rainfall in April. Since our area rivers typically see their snow melt-related crests in April as well, the heavy rainfall com-bined with the snow melt to produce widespread flooding.
April Rainfall
% of Normal Cedar Rapids, IA 6.55 203 Dubuque, IA 6.03 173 Iowa City, IA 6.35 169 La Crosse, WI 6.74 199 Madison, WI 6.43 192 Quad Cities, IA/IL 3.89 102 Waterloo, IA 10.79 334
Map of rainfall totals for the month of April 2008 (in inches). Magenta color over northeast Iowa represents over 10 inches.
Map of rainfall totals for April 2008, in percent of normal (based on 30 year record 1970-2000). Dark blue over east cen-tral and northeast Iowa repre-sents totals exceeding 200 per-cent.
(continued on page 7)

Page 7 Weather Home Companion
Spring 2008 Flood Review (continued from page 6)
How severe was the flooding? As stated earlier, this flood event was the worst such event in our region since 1997. While many area rivers experienced flooding, the Mississippi River as
River Location Flood Stage
Crest Flood Severity
Mississippi River Dubuque, IA 17 20.3 Moderate
Camanche, IA 15 20.2 Major
Muscatine, IA 16 21.5 Major
Burlington, IA 15 21.2 Major
Keokuk, IA 16 19.8 Major
Maquoketa River Manchester, IA 14 19 Moderate
Maquoketa, IA 24 27.5 Moderate
Wapsipinicon River
Independence, IA
10 18.0 Major
Anamosa, IA 14 22.3 Major
De Witt, IA 11 13.3 Major
Cedar River Vinton, IA 15 17.2 Moderate
Cedar Rapids, IA 12 17.1 Major
Iowa River Marengo, IA 14 18.0 Moderate
Lone Tree, IA 15 16.9 Moderate
Columbus Jct, IA 19 24.5 Major
Wapello, IA 20 26.6 Major
Pecatonica River Freeport, IL 13 14.3 Moderate
Rock River Joslin, IL 12 13.6 Minor
Moline, IL 12 12.6 Minor
(continued on page 8)
...this flood event was the worst in our region since 1997...
Many locations from eastern Iowa into southwestern Wisconsin saw April rainfall totals of six or more inches, which was 150 to 400 percent of normal. Images on page 6 show the April rainfall totals and percents of normal for selected larger cities in our region.
...the amount of wa-ter passing by the Quad Cities was enough to fill over 160 Olympic size swimming pools every minute…
Table of Preliminary Crests From Spring 2008 Floods*
* These were later exceeded at many sites by the historic flooding in June 2008

Page 8 Volume 5 , Issue 1
...The Rock River at Joslin, Illinois was above flood stage for more than 74 consecutive days...
...It was the heavy rainfall that led to the severe flooding...
Spring 2008 Flood Review (continued from page 7)
well as its tributaries in east central Iowa were hit the hardest. The table on page 7 shows the prelimi-nary crests for selected locations on our area streams. It is interesting to put into perspec-tive the amount of water involved during the height of the flooding. In the Quad Cities, when the Mis-sissippi River crested at 19.2 feet, the volume of water passing by was 236,000 cubic feet per second. At that rate the Mississippi River would be able to fill 2 and 2/3rds Olympic-size swimming pools every second, or over 160 Olympic-size swimming pools every min-ute. It is also important to note that some locations saw prolonged flooding. One extreme example was the Rock River near Joslin, Illinois. The Rock River was above flood stage there from March 3rd through May 16th, or for 74 consecu-tive days. Ice jam flooding The Rock River experienced record flooding in the Moline, Illinois, area in early March due to an ice jam. The river crested there at 16.38 ft on March 6th. The previous record was 16.15 ft set on April 26, 1973. The rapidly rising water re-quired quick evacuations, in some cases by boat because of the already high river stages. Ice jams led to flooding in other locations, too. For exam-ple, ice jams on Mill Creek in Milan, Illinois, led to flooding that forced the closing of I-280 on March 3, 2008. This was the second time ever, and in nearly as many weeks, that flooding oc-curred there.
Flooding on the Wapsipicon River in downtown Independ-ence, April 27, 2008.
How well did the spring flood outlooks pre-dict the flooding? This spring we issued three spring flood outlooks. We issued them on February 22nd, March 6th and March 28th. The March 28th outlook called for a 50 to 60 percent chance of the Mississippi River reaching flood stage upstream of the Quad Cities, and a 70 to 80 percent chance downstream. The outlook called for varying chances of the tributaries reaching flood stage. In addition, our outlooks called for a higher than average risk of flooding. Upon considering the fact that the entire Mississippi River as well as many of its tributaries not only reached flood stage but also experienced major to near-record flooding, one may conclude that our last outlook under-forecast the rivers. This was not the case. It is important to understand the assumptions that go into our outlooks. That is, the outlooks as-
sume near normal temperatures and pre-cipitation during the outlook period. Both temperature and precipitation are important in the spring because (1) tem-perature affects the rate and amount of snow melt; and (2) precipitation can have a significant impact on the severity of flooding. If temperatures or precipitation are not near normal, then the actual risk of flooding may be different than what our outlook indicates. In the case of this spring, temperatures were nearly ideal and minimized the im-pact of snow melt on our rivers in spite of
Flooding along the Wapsipinicon River in Anamosa, April 28, 2008.
(continued on page 9)
...The wet weather pattern has continued, resulting in record and unprecedented flooding...
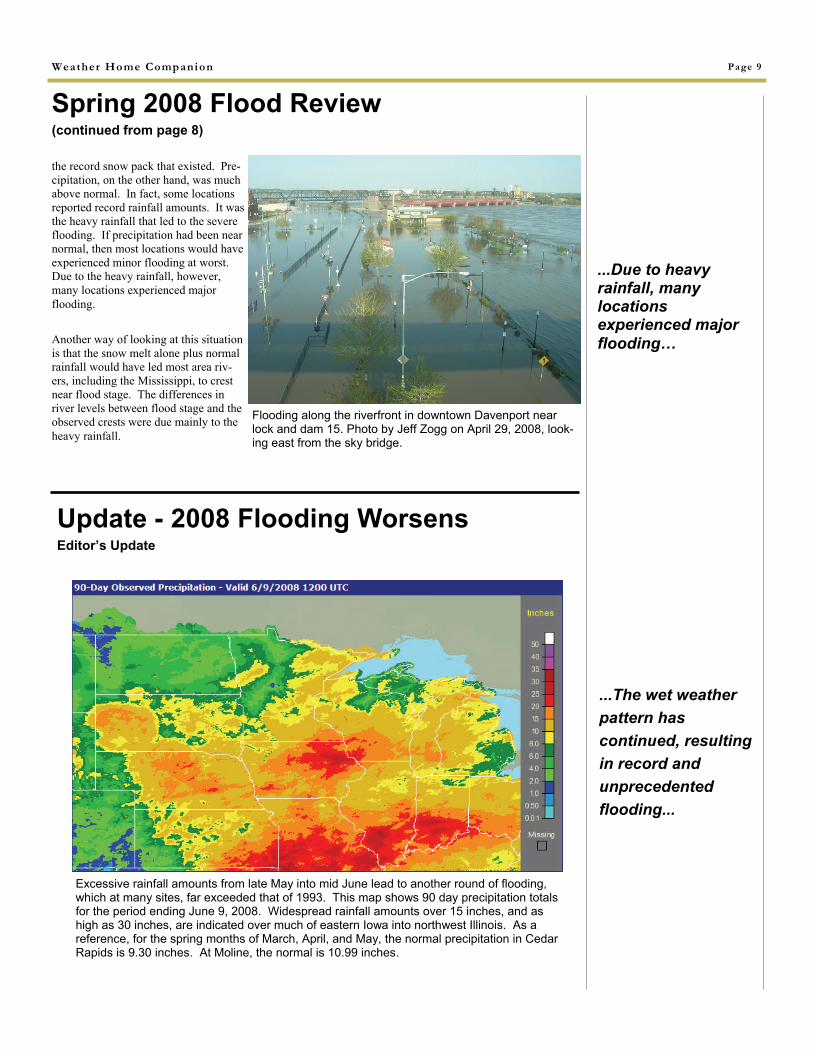
the record snow pack that existed. Pre-cipitation, on the other hand, was much above normal. In fact, some locations reported record rainfall amounts. It was the heavy rainfall that led to the severe flooding. If precipitation had been near normal, then most locations would have experienced minor flooding at worst. Due to the heavy rainfall, however, many locations experienced major flooding. Another way of looking at this situation is that the snow melt alone plus normal rainfall would have led most area riv-ers, including the Mississippi, to crest near flood stage. The differences in river levels between flood stage and the observed crests were due mainly to the heavy rainfall.
Flooding along the riverfront in downtown Davenport near lock and dam 15. Photo by Jeff Zogg on April 29, 2008, look-ing east from the sky bridge.
Update - 2008 Flooding Worsens Editor’s Update
Page 9
Spring 2008 Flood Review (continued from page 8)
Weather Home Companion
Excessive rainfall amounts from late May into mid June lead to another round of flooding, which at many sites, far exceeded that of 1993. This map shows 90 day precipitation totals for the period ending June 9, 2008. Widespread rainfall amounts over 15 inches, and as high as 30 inches, are indicated over much of eastern Iowa into northwest Illinois. As a reference, for the spring months of March, April, and May, the normal precipitation in Cedar Rapids is 9.30 inches. At Moline, the normal is 10.99 inches.
...Due to heavy rainfall, many locations experienced major flooding…

NWS Quad Cities 9050 Harrison Street Davenport, IA 52806
Weather Home Companion Page 10
NWS Quad Cities 9050 Harrison Street Davenport, IA 52806 Phone: (563) 386-3976 On the web: weather.gov/quadcities
Editor: David Sheets E-mail: [email protected] Contributors: Donna Dubberke, Warning Coordination Meteorologist John Haase, Forecaster Steve Kuhl, Meteorologist- in-Charge Bill Nichols, Senior Forecaster David Sheets, Forecaster Jeff Zogg, Hydrology Program Manager
Very heavy rainfall in the first half of June 2008, contributed to record and historic flooding across portions of eastern Iowa and northwest Illinois. More information on the conditions this past winter and spring that led up to the flooding can be found inside this newsletter. More complete details and photos from the historic June flooding will appear in later addi-tions of Weather Home Companion.
Total Precipitation (inches) June 1-15, 2008 This map was compiled using official preliminary
National Weather Service data and unofficial observations from the
Community Collaborative Rain, Hail, and Snow Network (CoCoRaHS)