WEATHER DATA FOR BUILDING ENERGY SIMULATIONS - CIBSE ASHRAE€¦ · WEATHER DATA FOR BUILDING...
38
WEATHER DATA FOR BUILDING ENERGY SIMULATIONS Joe Huang White Box Technologies, Inc. Moraga CA CIBSE-ASHRAE Webinar December 14, 2016 WHITE BOX TECHNOLOGIES
Transcript of WEATHER DATA FOR BUILDING ENERGY SIMULATIONS - CIBSE ASHRAE€¦ · WEATHER DATA FOR BUILDING...

WEATHER DATA FOR BUILDING ENERGY SIMULATIONS
Joe HuangWhite Box Technologies, Inc.
Moraga CA
CIBSE-ASHRAE WebinarDecember 14, 2016
WHITE BOX TECHNOLOGIES

Acknowledgements
• Lukas Lundström, Mälardalen University, Sweden for information on sources of satellite-derived solar in Europe
• Lachlan Strong, Australian Bureau of Meteorology for information on satellite-derived solar from the Japanese Himawari-8 satellite
• Aron Habte and Anthony Lopez, US National Renewable Energy Laboratory for information on the NSRDB (National Solar Radiation Data Base)
2

Self-intro• Formal training in physics and architecture
• Staff scientist at LBL 1981-2007, working in building energy simulations, and using simulations to evaluate new technologies and guide building energy policy.
• Interest in weather data stemmed from need on international projects, which expanded as data availability increased over time.
• Left LBNL 2007, and started a small consultant company called White Box Technologies.
• Developed weather sets for ASHRAE, Calif. Energy Comm., ISHRAE.
• Launched in 2012 http://weather.whiteboxtechnologies.com to provide weather products and services over the Web to the building simulation community.
• Former chair of ASHRAE TC 4.2 Climatic Information and TC 4.7 Energy Calculations.
3

• Hourly observations of temperature, humidity, pressure, wind speed and direction, and solar radiation.
• Virtually all digital weather stations today record all of the preceding elements, except for solar radiation.
• Simulations require two forms of solar radiation: Global Horizontal (GHI) and Direct Normal or beam (DNI). As rare as stations that measure GHI, those that measure DNI are even more rare and practically nonexistent.
• Solar radiation values found on weather files are almost always derived from models, although recently satellite-derived are now becoming more available.
Weather data needs for building energy simulations
4

Formats, FormatsRaw data formats• ISH DSI-3505 (previously DATSAV, TD-9685, TD-1440)• METAR (originally developed by the US FAA for aviation, since
adopted by WMO and used by many organizations)• Others (expect the unexpected!)
Processed data formats• TMY2/IWEC (142 column fixed field format)• TMY3/IWEC2 (CSV format with 68 fields)
Simulation program formats• *.epw (for EnergyPlus, contents identical to TMY2/TMY3)• *.bin/*.binm (for DOE-2, binary file in integer IP units, 15 fields
“packed” into 4 integer numbers)• *.fmt/.fmtm (ASCII equivalent of above; originally created for
transfering *.bin files across different OS)5

Types of weather data used in simulations
• Typical year vs actual year
• Observed data vs synthetic data
• Hourly data vs summary data, e.g., daily max-min data
6

What goes into a “typical year” weather file?
• Basically an exercise in selection, not in creation.
• 95% of the effort is in producing the historical weather data!
• Different methods have been proposed in the past (TRY, DRY, etc.), but the consensus has developed in favor of the TMY Method developed by NREL in the early 1980s.
• The TMY Method is a compilation of 12 actual months from the selected period of record, each of which has been chosen as the most representative using the Finkelstein-Schafer Statistic (FS).
7

Brief explanation of the TMY Method• The Finkelstein-Shafer (FS) statistic is the absolute area enclosed
between the Cumulative Frequency Distribution (CFD) of a climate parameter for each month and the long-term CFD for the same month over all years.
• The weighted sum of theFS statistic for all theparameter considered isthe Cumulative FS (CFS)for that month.
• The month with the smallest CFS is pickedas the “typical month”for that month.
8

How sensitive are the “typical year” files to the weighting used?
Climate Parameters and Weights used in different projects
Answer: not so much (see Su, Huang, Xu, and Zhang 2009)
Climate Variable TMYTMY2, TMY3 IWEC IWEC2
Maximum Daily Dry-Bulb Temperature 1/24 1/20 1/20 1/20Average Daily Dry-Bulb Temperature 1/24 2/20 6/20 2/20Minimum Daily Dry-Bulb Temperature 1/24 1/20 1/20 1/20Maximum Daily Dewpoint Temperature 1/24 1/20 0.5/20 1/20Average Daily Dewpoint Temperature 1/24 2/20 1/20 2/20Minimum Daily Dewpoint Temperature 1/24 1/20 0.5/20 1/20Average Daily Wind Speed 2/24 1/20 1/20 1/20Maximum Daily Wind Speed 2/24 1/20 1/20 1/20Daily Global Horizontal Solar Radiation 12/24 5/20 8/20 5/20Daily Direct Normal Solar Radiation not used 5/20 not used 5/20
9

“Typical year” weather data sets
• TMY2 (NREL 1993, 239 US, free)
• TMY3 (NREL 2005, 1020 US, free)*
• TMYX (NREL 2015, > 1 million grid points for Western Hemisphere from 60N to 20S latitude, free)
• CWEC2 (EnvCanada 1990, 47 Canada, free)*
• CZ2010 (CEC 2011, 88 California, free)*
• IWEC2 (ASHRAE 2011, 3012 international, cost)*
• ISHRAE (2015, 61 India, free)*
• CN2014 (WBT 2015, 224 Canada, cost)*
• MX2015 (WBT 2016, 119 Mexico, cost)*
• see EnergyPlus web site for other international weather data
* available at http://weather.whiteboxtechnologies.com10

Actual year weather data sets
Integrated Surface Database National Center for Environmental Information (NCEI), formerly the Nat’l Climatic Data Center (NCDC)(www.ncdc.noaa.gov/isd)
22747 stations, of which approx. 10,000 are active. For 2016, there are 8,140 stations with sufficientdata to create usable hourly weather files (2110 US, 275 Cana-dian, 5775 rest of the world)
11

ISD 2015 stations in the US
12

ISD 2015 stations in Europe
13

Going from DSI-3505 to *.DAT to *.FIN4
0188037720999992016010314504+51478-000461FM-15+002599999V0202001V005710131119N009999199+00901+00801999999ADDGA1021+005791999GA2071+013111999GE19MSL +99999+99999GF199999021999005791999999MA1098401999999REMMET081METAR COR EGLL 031450Z AUTO 20011KT 170V250 9999 FEW019 BKN043 09/08 Q0984 NOSIG=0235037720999992016010315004+51483-000450FM-12+002599999V0201901N00511013501CN035000199+00961+00851098471ADDAW1231GA1011+009901999GA2071+013501999GE19MSL +99999+99999GF199999011999009901999999MA1999999098171MD1510421+9999OD139901441999REMSYN09403772 47681 /1910 10096 20085 39817 49847 55042 723// 333 55300 20061 81/33 87/45 90710 91128=0186037720999992016010315204+51478-000461FM-15+002599999V0201901V004110091419N009999199+00901+00801999999ADDGA1071+009141999GE19MSL +99999+99999GF199999071999009141999999MA1098401999999OC100931REMMET087METAR COR EGLL 031520Z AUTO 19008G18KT 160V240 9999 BKN030 09/08 Q0984 TEMPO 4500 SHRA=0178037720999992016010315504+51478-000461FM-15+002599999V0201901V004610064019N009999199+00901+00801999999ADDGA1021+002131999GA2071+006401999GE19MSL
037720 201512302120 +0100 +0090 99999 0057 180 99 99 07 007000 00335 9999 999 0037720 201601010000 +0038 +0024 10209 0031 240 99 99 99 020000 99999 9999 999 1 06000091037720 201601010020 +0050 +0020 99999 0021 230 00 99 99 009999 22000 9999 999 0037720 201601010050 +0040 +0020 99999 0021 200 00 99 99 009999 22000 9999 999 0037720 201601010100 +0037 +0024 10216 0026 230 99 99 99 014000 99999 9999 999 0037720 201601010120 +0030 +0020 99999 0015 170 00 99 99 008000 22000 9999 999 0037720 201601010150 +0020 +0000 99999 0010 150 00 99 99 003500 22000 9999 999 0037720 201601010200 +0026 +0019 10219 0000 999 99 99 99 007000 99999 9999 999 0037720 201601010220 +0030 +0020 99999 0021 190 00 99 99 006000 22000 9999 999 0037720 201601010250 +0020 +0010 99999 0015 180 00 99 99 006000 22000 9999 999 0037720 201601010300 +0020 +0012 10223 0015 170 99 99 99 008000 99999 9999 999 0037720 201601010320 +0020 +0010 99999 0021 170 00 99 99 007000 22000 9999 999 0037720 201601010350 +0020 +0010 99999 0015 120 00 99 99 005000 22000 9999 999 0037720 201601010400 +0023 +0018 10227 0015 110 99 99 99 007000 99999 9999 999 0037720 201601010450 +0020 +0010 99999 0005 110 00 99 99 006000 22000 9999 999 0037720 201601010500 +0024 +0020 10230 0010 100 99 99 02 008000 99999 9999 999 0037720 201601010520 +0020 +0010 99999 0010 150 00 99 99 008000 22000 9999 999 0037720 201601010550 +0010 +0000 99999 0015 080 00 99 99 008000 22000 9999 999 0037720 201601010600 +0023 +0018 10230 0015 090 99 99 03 011000 99999 9999 999 2 12000091 24002231
GBR_LONDON-HEATHROW-AP 037720 51.478 -0.461 25 6 0.0 GMT Cfb DBT DPT Press Altim Sky Opq WSpd Wnd TotSol DirNorm Pres
Year Mo Dy Hr (C) (C) (mb) (inHg) Cov Cov (m/s) Dir (W/m2) (W/m2) Wth Rain Visib Ceil SolarZ2016 1 1 1 3.7 2.4 1018.5 0 99R 2.6 230 0.0 0.0 40R 0F 14000 22000 0.00002016 1 1 2 2.6 1.9 1018.7 0 99R 0.0 150 0.0 0.0 40R 0F 7000 22000 0.00002016 1 1 3 2.0 1.2 1019.1 0 99R 1.5 170 0.0 0.0 40R 0F 8000 22000 0.00002016 1 1 4 2.3 1.8 1019.5 0 99R 1.5 110 0.0 0.0 40R 0F 7000 22000 0.00002016 1 1 5 2.4 2.0 1019.8 0 99R 1.0 100 0.0 0.0 40R 0F 8000 22000 0.00002016 1 1 6 2.3 1.8 1019.8 0 99R 1.5 90 0.0 0.0 40R 0R 11000 22000 0.00002016 1 1 7 2.6 1.9 1019.3 0 99R 1.0 80 0.0 0.0 40R 0R 12000 5100 0.00002016 1 1 8 2.2 1.5 1019.1 0 99R 1.0 60 0.0 0.0 40R 0R 9000 5400 0.00002016 1 1 9 2.2 1.2 1018.8 0 99R 2.6 100 26.2 143.2 40R 0R 11000 4200 0.04212016 1 1 10 4.0 1.8 1017.8 0 99R 4.1 90 89.8 286.5 40R 0R 25000 3900 0.13882016 1 1 11 5.4 1.9 1017.3 0 99R 3.6 120 156.4 373.4 40R 0R 29000 3600 0.21512016 1 1 12 7.0 4.4 1016.0 0 99R 5.1 120 195.8 414.8 40R 0F 21000 3300 0.25662016 1 1 13 7.2 4.4 1014.5 0 99R 5.7 110 199.1 418.0 40R 0F 21000 3000 0.26002016 1 1 14 7.4 4.5 1013.1 0L 99R 5.1 100 165.8 383.8 40R 0F 19000 3000 0.22522016 1 1 15 7.5 5.6 1011.8 0L 99R 7.2 100 103.0 305.7 40R 0F 15000 450 0.15482016 1 1 16 7.6 6.7 1010.7 0L 99R 5.7 110 34.0 241.4 40R 0F 13000 330 0.05772016 1 1 17 8.0 7.1 1009.4 0L 99R 6.7 120 0.0 0.0 40R 0F 21000 270 0.00012016 1 1 18 8.1 6.5 1007.9 0L 99R 7.7 130 0.0 0.0 40R 2R 21000 2700 0.00002016 1 1 19 8.1 6.3 1007.1 0L 99R 8.8 120 0.0 0.0 40R 2R 17000 2700 0.0000
DSI-3505
*.DAT
*.FIN4
14

Actual year weather data setsWeb-based sources of weather dataWeather Underground (www.wunderground.com)
Commercial Internet weather service, with over 100,000 weather stations in the US Including links to 34,000to government weather stations (26,000 US, 6000 international (WU 2013, 2015).
100,000 +Includes both PWS and NWS,
12,246NWS only
15

Comparison of ISD and WU stations around Knox County, Tennessee
ISD Stations 68 WU stations 16

KCAMORAG2 at St. Mary’s College (operational through May 6, 2014)Frequency: every 5 minutesParameters: Dry-bulb and Dewpoint Temperatures, Pressure, Wind Speed, Wind Direction, Wind Speed Gusts, Relative Humidity, Liquid Precipitation, and Global Solar Radiation
KCAMORAG13 at Campolindo High School(online since March 2015)Frequency: every 5 minutesParameters: Dry-bulb and DewpointTemperatures, Pressure, Wind Speed, Wind Direction, Wind Speed Gusts, Relative Humidity
Two PWS in my home town Moraga CA
17

• Client with M&V project in Harvard needed onsite weather data for 2014.
• Nearest ISD station is Logan Airport 5.2 miles due east
• WU showed there were 11 PWS within a mile of the building site. Data was downloaded for three of the closest PWS (Agassiz, Porter Square, Central Square).
• Agassiz was chosen as the primary station because it’s the closest and has high quality 15-minute data.
• Logan AP weather data was used as a baseline station.
Building location
KMACAMBR19 (Agassiz)
KMACAMBR14 (PorterSq)
KMACAMBR4 (CentralSq)
Example use of Web weather data in Cambridge (1)
18

Example use of Web weather data in Cambridge (2)Temperature comparison
Winter week (Jan 1 – 7, 2014) Summer week (Aug. 1 – 7, 2014)
19

Logan AP vs Agassiz
Logan AP vs Central Square
Example use of Web weather data in Cambridge (3)Wind speed comparison
20

Recent Developments in Weather Data: Satellite-derived solar radiation
pros: 1. universal coverage on a grid scale (continental US 1998-2009available from Clean Power Research (www.solaranywhere.com)entire world will be made available by NOAA); North America20°S - 60° N 1998-2015 available from NREL as the NSRDB alongsurface conditions taken from MERRA )
2. accuracy significantly better than modeled solar; effort drivenprimarily by the needs of the PV industry.
cons: 1. data outside the released domains or time periods available onlyfrom commercial vendors and are prohibitively expensive.
21

Derivation of global horizontal solar radiation
• Used Zhang-Huang Model correlating global horizontal radiation to cloud cover, change in dry-bulb temperature over the past 3 hours, relative humidity, and wind speed
I = Io • sin h • {C0 + C1(CC)+ C2(CC)2
+ C3(Tn-Tn-3) + C4 ij + C5Vw} + D
when ET*0.10 > I > ET*0.90
= ET*0.90 when I > ET*0.90
= ET*0.10 when I < ET*0.10
• Coefficients C0 , C1 , C2 , C3, C4 , C5 , D taken from RP-1477 by Köppen Class:
Am = Miami BWh = KuwaitAw = Honolulu Cfa=NashvilleBSh = Phoenix ETh=Davos
22

https://maps.nrel.gov/nsrdb-viewer
23

https://www.strang.smhi.se
24

http://www.soda-pro.com/web-services/radiation/cams-radiation-service
25

Coverage of satellite-derived solar radiation in the public domain (2016)
Himawari-8
NSRDB 1998-2015
CAMS Feb 2004 to current – 2 days
NREL/SUNY 1998-2014
STRÅNG1999 to current
Himawari-8
26

Weather data for GBR_London-City_37683_16
27

Weather data for GBR_London-City_37683S_16
ISD (Cloud Cover always 0) CAMS satellite-derived
28

Synthetic or modeled weather data sets
• MeteoNorm – uses statistical models to generate “typical year” weather data for any location in the world
• Autodesk Green Building Studio Weather – combines NOAA’s Rapid Update Cycle (RUC) forecasting model that predicts weather conditions anywhere in the US on a 20-km grid with the Mesoscale Meteorological Model Version 5 (MM5) to fill data gaps.
• Reanalysis data – Climate Forecast System Reanalysis (CFSR), Modern Era Retrospective-Analysis (MERRA) from NOAA.
29

• Great promise, but results so far are still uneven, possibly due to “teething” errors.
• Benefit to building energy simulation needs to be evaluated
– Buildings are predominantly located in large urban areas, often with multiple weather stations
– Is there a “Catch 22” situation here? Climate forecasting is most accurate with ground observations to “seed” the model; however, if there are observed data, forecasting results would not be needed.
Synthetic or modeled weather data sets
30

Comparison of MERRA to observed dry-bulb temperatures for 3 reanalysis programs in two US cities
Temperature Comparison for Phoenix, AZ
Temperature Comparison for Minneapolis, MN
NARR CSFR MERRA
Source: Anthony Lopez NREL 201631

Comparison of NSRDB/MERRA to observed data for Oakland 2013
32

Comparison of NSRDB/MERRA to observed data for Patiala, India 2014
33

Things to watch out for when working with weather data
¾ What is the time stamp? (time is always in GMT for the ISD)
¾ How is pressure reported ? (pressures are all adjusted to sea level in the ISD)
¾ Does the station only report data during daytime hours? (roughly 5% of stations in ISD)
¾ Is the solar radiation the aggregate over the past timestep(North American convention), or the average rate at the time step (European convention)?
34
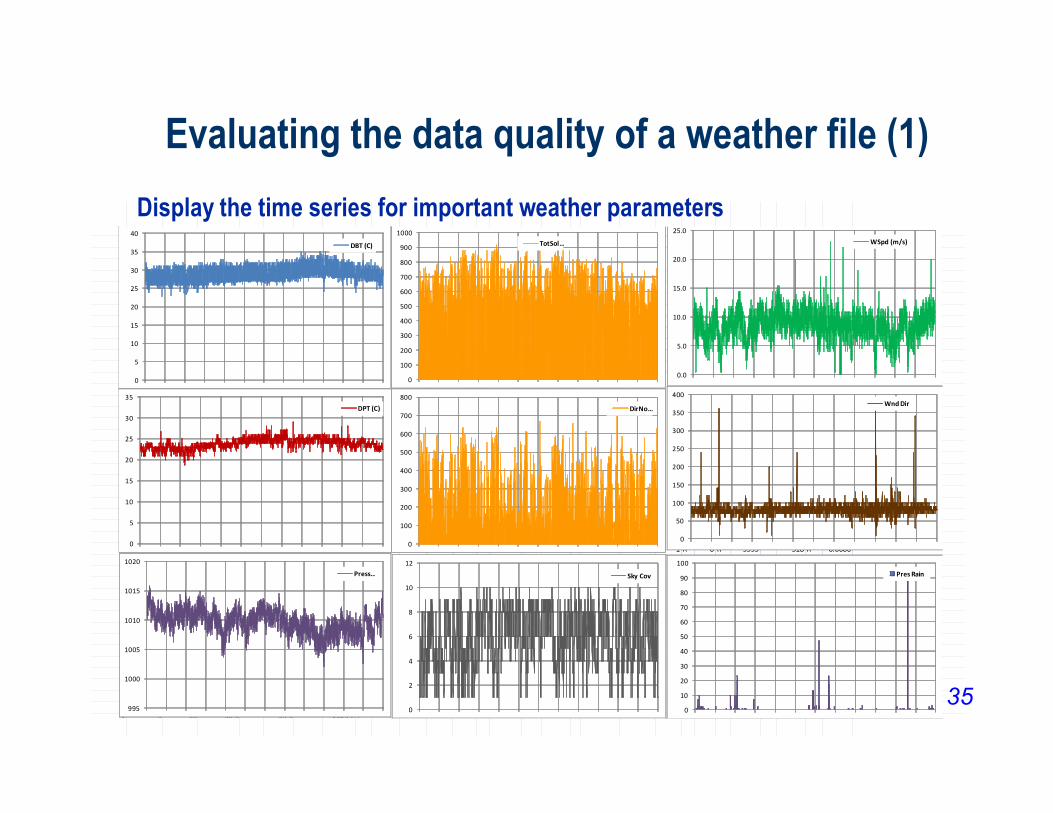
Evaluating the data quality of a weather file (1)
1 1 1 27.1 L 22.7 L 1012.0 L 1 L 99 R 7.0 L 60 R 0.0 0.0 1 R 0 R 30000 L 518 R 0.00001 1 2 27.1 L 22.7 L 1012.0 L 1 L 99 R 6.9 L 60 R 0.0 0.0 1 R 0 R 30000 L 518 R 0.00001 1 3 27.1 L 22.8 L 1011.9 L 1 L 99 R 6.8 L 60 R 0.0 0.0 1 R 0 R 30000 L 518 R 0.00001 1 4 27.1 22.8 1011.9 1 99 R 6.7 60 0.0 0.0 1 R 0 R 30000 518 R 0.00001 1 5 27.0 23.0 1012.2 L 1 L 99 R 8.2 70 0.0 0.0 1 R 0 R 9999 518 R 0.00001 1 6 27.0 23.0 1012.4 L 1 L 99 R 7.2 80 0.0 0.0 1 R 0 R 9999 518 R 0.00001 1 7 27.0 22.7 1012.6 1 99 R 7.7 70 0.0 0.0 1 R 0 R 30000 518 R 0.00001 1 8 27.0 22.0 1012.4 L 1 L 99 R 7.7 90 61.0 237.1 1 R 0 R 9999 518 R 0.10341 1 9 27.0 22.0 1012.2 L 1 L 99 R 7.2 80 238.4 384.7 1 R 0 R 9999 518 R 0.31581 1 10 26.7 22.5 1012.0 1 99 R 6.7 80 424.4 468.0 1 R 0 R 30000 518 R 0.50781 1 11 26.5 F 22.5 F 1011.9 L 2 L 99 R 6.5 L 80 R 561.8 469.5 1 R 0 R 30000 L 518 R 0.65981 1 12 26.4 F 22.5 F 1011.7 L 3 L 99 R 6.4 L 90 R 644.6 448.8 1 R 0 R 30000 L 518 R 0.76121 1 13 26.5 22.3 1011.5 4 99 R 6.2 90 676.6 433.0 1 R 0 R 30000 518 R 0.80511 1 14 27.0 23.0 1012.0 L 3 L 99 R 6.7 80 689.5 496.2 1 R 0 R 9999 518 R 0.78851 1 15 27.0 22.0 1012.5 L 2 L 99 R 7.7 90 639.2 545.7 1 R 0 R 9999 518 R 0.71241 1 16 27.3 22.1 1012.9 1 99 R 8.8 80 520.5 557.4 1 R 0 R 30000 518 R 0.58211 1 17 29.0 22.0 1013.3 L 1 L 99 R 10.8 90 337.1 479.4 1 R 0 R 9999 518 R 0.40661 1 18 30.0 22.0 1013.7 L 1 L 99 R 9.8 80 139.7 344.5 1 R 0 R 9999 518 R 0.19861 1 19 30.5 22.6 1014.0 1 99 R 11.3 80 7.0 172.3 1 R 0 R 30000 518 R 0.01641 1 20 30.0 23.0 1013.1 L 1 L 99 R 10.8 80 0.0 0.0 1 R 0 R 9999 518 R 0.00001 1 21 30.4 L 22.8 L 1012.2 L 1 L 99 R 10.8 90 0.0 0.0 1 R 0 R 19999 L 518 R 0.00001 1 22 30.8 22.5 1011.3 1 99 R 10.8 90 0.0 0.0 1 R 1 R 30000 518 R 0.00001 1 23 29.4 L 22.8 L 1010.9 L 1 L 99 R 10.6 L 90 R 0.0 0.0 1 R 1 R 19999 L 518 R 0.00001 1 24 28.0 23.0 1010.6 L 2 L 99 R 10.3 90 0.0 0.0 1 R 1 R 9999 518 R 0.00001 2 1 28.5 22.8 1010.2 3 99 R 11.3 80 0.0 0.0 1 0 R 30000 518 R 0.00001 2 2 28.0 23.0 1010.8 L 3 L 99 R 8.8 70 0.0 0.0 1 R 0 R 9999 518 R 0.00001 2 3 27.0 23.0 1011.4 L 3 L 99 R 8.8 80 0.0 0.0 1 R 0 R 9999 518 R 0.00001 2 4 27.2 22.6 1011.9 3 99 R 9.3 80 0.0 0.0 1 0 R 30000 518 R 0.00001 2 5 27.0 23.0 1012.3 L 3 L 99 R 9.8 80 0.0 0.0 1 R 0 R 9999 518 R 0.00001 2 6 27.0 23.0 1012.6 L 3 L 99 R 9.8 80 0.0 0.0 1 R 0 R 9999 518 R 0.00001 2 7 27.3 22.8 1012.9 3 99 R 9.3 80 0.0 0.0 1 R 1 R 30000 518 R 0.00001 2 8 26.0 24.0 1012.6 L 3 L 99 R 7.2 70 51.3 145.5 1 R 1 R 9999 518 0.10231 2 9 27.0 23.0 1012.3 L 4 L 99 R 8.2 70 213.2 274.4 1 R 1 R 9999 518 0.31471 2 10 26.4 23.2 1011.9 5 99 R 7.7 70 356.7 264.2 1 0 R 30000 787 L 0.50711 2 11 27.0 23.0 1011.7 L 4 L 99 R 9.3 80 557.2 457.7 16 R 0 R 9999 1057 L 0.65961 2 12 27.0 23.0 1011.5 L 3 L 99 R 9.3 80 670.0 508.5 16 R 0 R 9999 1327 L 0.76151 2 13 27.0 23.0 1011.2 3 99 R 9.3 70 734.6 564.1 16 R 0 R 30000 1597 L 0.80591 2 14 27.0 23.0 1011.9 L 3 L 99 R 9.8 80 696.6 510.2 16 R 0 R 9999 1866 L 0.78971 2 15 27.0 23.0 1012.6 L 3 L 99 R 7.7 80 608.4 463.4 16 R 0 R 9999 2136 L 0.71401 2 16 27.4 23.2 1013.3 4 99 R 9.3 80 470.3 402.4 16 R 0 R 30000 2406 L 0.58411 2 17 28.0 23.0 1013.6 L 4 L 99 R 10.3 80 292.7 303.1 16 R 0 R 9999 2676 L 0.40881 2 18 30.0 23.0 1013.9 L 5 L 99 R 12.9 90 120.6 211.4 16 R 0 R 9999 2946 L 0.20081 2 19 30.7 22.9 1014.1 6 99 R 12.9 80 8.0 105.7 16 R 0 N 30000 3215 L 0.01731 2 20 30.0 23.0 1013.6 L 5 L 99 R 12.9 80 0.0 0.0 16 R 0 N 9999 3485 L 0.0000
0
5
10
15
20
25
30
35
40
DBT (C)
0.0
5.0
10.0
15.0
20.0
25.0WSpd (m/s)
0
5
10
15
20
25
30
35DPT (C)
0
50
100
150
200
250
300
350
400Wnd Dir
995
1000
1005
1010
1015
1020
Press …
0
100
200
300
400
500
600
700
800
900
1000TotSol …
0
10
20
30
40
50
60
70
80
90
100Pres Rain
0
100
200
300
400
500
600
700
800DirNo…
0
2
4
6
8
10
12
Sky Cov
Display the time series for important weather parameters
35

Evaluating the data quality of a weather file (2)Look at average days per month and the number of observations by hour of day for possible problem areas
1 5 26.6 22.7 1011.2 3.7 7.5 72.3 0.0 0.0 0.0 0.0 0.0 1.01 6 26.5 22.7 1011.6 3.8 7.2 74.8 0.0 0.0 0.0 0.0 0.0 1.01 7 26.4 22.7 1011.9 4.0 7.4 76.1 0.0 0.0 0.0 0.0 0.0 0.01 8 26.4 22.7 1011.6 3.9 7.0 77.1 45.3 142.6 0.0 0.0 0.0 1.01 9 26.2 22.6 1011.2 4.1 6.9 75.8 198.9 241.7 0.0 0.0 0.0 1.01 10 26.1 22.5 1010.8 4.4 6.9 76.5 368.5 304.4 0.0 0.0 0.0 0.01 11 26.0 22.6 1010.8 4.3 6.6 78.4 513.3 344.6 0.1 0.1 0.1 1.01 12 25.9 22.6 1010.7 4.4 6.7 78.7 614.2 365.2 0.1 0.1 0.0 1.01 13 25.9 22.5 1010.5 4.6 6.4 84.5 661.9 379.4 0.1 0.1 0.1 0.01 14 26.0 22.5 1011.1 4.3 6.5 79.4 653.2 378.9 0.0 0.0 0.0 1.01 15 26.0 22.3 1011.7 4.2 6.5 82.3 587.9 370.8 0.1 0.1 0.1 1.01 16 26.6 22.5 1012.2 4.5 6.8 81.3 468.5 343.5 0.0 0.0 0.0 0.01 17 27.8 22.7 1012.4 4.4 8.5 83.2 310.1 290.3 0.0 0.0 0.0 1.01 18 28.8 22.6 1012.6 4.7 9.3 82.9 137.2 206.4 0.0 0.0 0.0 1.01 19 29.5 22.6 1012.8 5.3 10.0 83.9 16.1 103.2 0.0 0.0 0.0 0.01 20 29.9 22.7 1012.1 5.0 9.3 83.9 0.0 0.0 0.0 0.0 0.0 1.01 21 29.8 22.6 1011.3 5.0 9.3 83.9 0.0 0.0 0.1 0.1 0.0 1.01 22 29.7 22.6 1010.6 5.4 9.2 85.2 0.0 0.0 0.0 0.0 0.0 0.01 23 29.9 22.5 1010.3 4.8 9.2 82.6 0.0 0.0 0.0 0.0 0.0 1.01 24 29.2 22.6 1010.0 4.5 9.4 79.4 0.0 0.0 0.0 0.0 0.0 1.02 1 29.3 22.9 1008.8 6.1 8.9 73.2 0.0 0.0 0.0 0.0 0.0 0.02 2 28.3 23.1 1009.2 5.8 8.4 83.6 0.0 0.0 0.1 0.1 0.1 1.02 3 27.2 23.0 1009.6 5.7 7.8 81.8 0.0 0.0 0.0 0.0 0.0 1.02 4 27.0 22.8 1009.9 5.8 7.6 82.1 0.0 0.0 0.0 0.0 0.0 0.02 5 26.9 22.8 1010.4 5.5 7.3 71.4 0.0 0.0 0.0 0.0 0.0 1.02 6 26.8 22.8 1010.9 5.5 7.2 72.5 0.0 0.0 0.0 0.0 0.0 1.02 7 26.6 22.6 1011.4 5.8 7.1 76.4 0.0 0.0 0.0 0.0 0.0 0.02 8 26.6 22.8 1011.1 5.5 6.7 78.6 46.4 103.6 0.0 0.0 0.0 1.02 9 26.5 22.7 1010.8 5.4 6.5 80.0 198.4 188.3 0.0 0.0 0.0 1.02 10 26.3 22.6 1010.4 5.4 6.5 81.8 367.6 241.4 0.0 0.0 0.0 0.12 11 26.3 22.5 1010.2 5.4 6.4 81.4 510.4 270.1 0.0 0.0 0.0 1.02 12 26.1 22.6 1010.0 5.4 6.3 82.1 613.3 288.3 0.0 0.0 0.1 1.02 13 25.9 22.4 1009.8 5.6 6.0 80.4 663.7 305.5 0.0 0.0 0.0 0.02 14 26.0 22.3 1010.4 5.5 6.3 81.1 656.7 300.5 0.0 0.0 0.0 1.02 15 25.9 22.3 1010.9 5.6 6.2 82.5 591.8 283.9 0.0 0.0 0.0 1.02 16 26.9 22.5 1011.5 6.0 6.8 82.1 479.8 268.2 0.0 0.0 0.0 0.02 17 28.3 22.7 1011.8 5.9 8.2 86.1 331.4 232.8 0.0 0.0 0.0 1.02 18 29.4 22.6 1012.1 5.9 9.1 83.9 164.7 179.5 0.0 0.0 0.0 1.02 19 29.8 22.7 1012.4 6.3 9.2 89.6 27.0 103.6 0.0 0.0 0.0 0.02 20 30.3 23.1 1011.7 5.9 9.2 92.9 0.0 0.0 0.0 0.0 0.0 1.02 21 30.3 23.0 1011.0 5.9 9.2 91.8 0.0 0.0 0.0 0.0 0.0 1.02 22 30.4 23.1 1010.2 6.2 9.0 97.9 0.0 0.0 0.0 0.0 0.0 0.02 23 30.2 23.0 1009.8 5.8 9.0 97.1 0.0 0.0 0.0 0.0 0.0 1.02 24 29.9 23.0 1009.3 5.6 9.0 94.6 0.0 0.0 0.0 0.0 0.0 1.0
0
5
10
15
20
25
30
35
Te
mp
era
ture
(C
)
Dry Bulb and Dewpoint Temperatures
0
200
400
600
800
Global Horiz and Direct Normal Radiation
0
2
4
6
8
10
Cloud Cover
0
2
4
6
8
10
12
14Wind Speed
0
10
20
30
40
Dry-Bulb and Dewpoint Temperatures
0.0
0.2
0.4
0.6
0.8
1.0
Avg
Fra
ctio
n M
iss
Ob
s
Dry Bulb Temperature Fraction Missing Obs
0.0
0.2
0.4
0.6
0.8
1.0
Avg
Fra
ctio
n M
iss
Ob
s
Cloud Cover Fraction Missing Obs
0.0
0.2
0.4
0.6
0.8
1.0
Avg
. Fra
ctio
n M
Iss
Ob
s
Wind Speed Fraction Missing Obs
0.0
0.2
0.4
0.6
0.8
1.0
Avg
. Fra
ctio
n M
iss
Ob
s
Dewpoint Temperature Fraction Missing Obs
36

Conclusions
• “typical year” files provide just a snapshot view of the weather.
• Use historical year files any time you’re evaluating measured data.
• The availability of both raw and processed weather data has greatly expanded over the past decade.
• Satellite-derived solar radiation can transform what had been the most problematic to the most easily accessible climate parameter.
• Climate reanalysis shows promise for providing data for any place and time, but still some time away.
• More attention needs to be paid to temporal variations in climate and microclimate variations in urban areas.
• Use average days by month and number of observations by hour of day to detect data quality issues.
37

Thank you for your attention!
Please let me know if you have any questions
My contact information are:
Joe HuangWhite Box Technologies346 Rheem Blvd. Suite 205AMoraga CA [email protected](o) 925-388-0265
Weather web site: http://weather.whiteboxtechnologies.com
WHITE BOX TECHNOLOGIES


![Chapter 2 Psychrometry - LearnerThon...Tables and charts are available in handbooks on heating and air-conditioning, including the ASHRAE Handbook [1] and CIBSE Guide [2], to facilitate](https://static.fdocuments.us/doc/165x107/60faf5767aea7a089575f9a2/chapter-2-psychrometry-learnerthon-tables-and-charts-are-available-in-handbooks.jpg)