Weather Data and Probability
13
Renewable Energy 28 (2003) 1813–1824 www.elsevier.com/locate/renene Technical note Weather data and probability analysis of hybrid photovoltaic–wind power generation systems in Hong Kong H.X. Yang ∗ , L. Lu, J. Burnett Department of Building Services Engineering, The Hong Kong Polytechnic University, Hung Hom, Kowloon, Hong Kong Received 23 July 2002; accepted 19 December 2002 Abstract This paper des cri bes a simula tion mod el for analyz ing the probab ili ty of power sup ply failure in hybrid photovoltaic–wind power generation systems incorporating a storage battery ban k, and also ana lyz es the rel iabili ty of the sys tems. An ana lys is of the comple men tar y characteristics of solar irradiance and wind power for Hong Kong is presented. The analysis of local weather data patterns shows that solar power and wind power can compensate well for one another, and can provide a good utilization factor for renewable energy applications. For the loss of power supply probability (LPSP) analysis, the calculation objective functions and restraints are set up for the design of hybrid systems and to assess their reliability. To demonstrate the use of the model and LPSP functions, a case study of hybrid solar–wind power supply for a telecommunication system is presented. For a hybrid system on the islands surrounding Hong Kong, a battery bank with an energy storage capacity of 3 days is suitable for ensuring the desired LPSP of 1%, and a LPSP of 0% can be achieved with a battery bank of 5 days storage capacity. © 2003 Elsevier Science Ltd. All rights reserved. Keywords: Hybrid photovoltaic–wind system; Simulation model; LPSP method; Battery bank ∗ Corresponding author. Tel.: +852-2766-5863; fax: +852-2774-6146. E-mail address: [email protected] (H.X. Yang). 0960-1481/03/$ - see front matter © 2003 Elsevier Science Ltd. All rights reserved. doi:10.1016/S0960-1481(03)00015-6
-
Upload
domingo-ben -
Category
Documents
-
view
223 -
download
0
Transcript of Weather Data and Probability

8/12/2019 Weather Data and Probability
http://slidepdf.com/reader/full/weather-data-and-probability 1/12
8/12/2019 Weather Data and Probability
http://slidepdf.com/reader/full/weather-data-and-probability 2/12
1814 H.X. Yang et al. / Renewable Energy 28 (2003) 1813–1824
Nomenclature
Pw(v) The power generated by the wind turbine when the wind velocityis v, W
Pr The rated power generated by the wind turbine, W
vr The rated wind velocity of the wind turbine, m / svc The cut-in wind speed of the wind turbine, m / s
v Wind speed, m / s
v f The cut-off wind speed of the wind turbine, m / s
G The total solar radiation absorbed by the PV panels, W/m2
V Voltage generated by the PV module, V
I Current generated by the PV module, A
P Power output by the PV module, W
C 1,C 2,C 3 Parameters that can be identified by tests [12]
C 4,C 5,C 6 Parameters that can be identified by tests [12]
C 7 Parameter that can be identified by tests [12]
T ce Operating temperature of solar cells, K , determined by ambient airtemperature, the characteristics of the module, insulation on the
module, and other variables such as wind velocity.
SOC (t ) Battery state of charge of the battery bank at hour t , Ah
s Self-discharge rate of the battery bank, percentage
h( I bat (t )) Charging efficiency of the battery bank with the charging currentat hour t , assumed 1 during discharge, and 0.65 to 0.85 duringcharge
I bat (t ) Charging current at hour t , A
t Time interval, 1.0 h in this study
I bat ,max(t ) Possible maximum battery current rate at h t , A
I max The maximum battery current rate of the battery bank, A
C Constant, zero during discharge and 1 during charge
SOC max The maximum state of charge of the battery bank, Ah
SOC min The minimum state of charge of the battery bank, Ah
C (t ) Power input to the storage system at hour t , W P(t ) Power generated by the wind turbine and PV modules at hour t , W
L(t ) Electricity load needed by the demand system at hour t , W
PW (t ) Power generated by the wind turbine at hour t , W
PPV (t ) Power generated by PV modules at hour t , W
V L The nominal voltage need by the system, V
I needed (t ) Current needed for the load at hour t , A
I sup ply(t ) Current supplied by both PV modules and wind turbine at hour t , A
LPSP Loss of power supply probability
SOC The nominal capacity of the battery bank, equaling SOC max, Ah

8/12/2019 Weather Data and Probability
http://slidepdf.com/reader/full/weather-data-and-probability 3/12
1815 H.X. Yang et al. / Renewable Energy 28 (2003) 1813 – 1824
1. Introduction
For different districts and locations, climatic conditions, including solar irradiance,
variations in wind speed, temperature, and so forth, are always changing. In orderto ef ficiently utilize renewable energy using wind power and solar energy, an analysis
of the characteristics of solar irradiance and wind conditions at a potential site should
be made at the stage of inception.
There are a number of methods used to design a hybrid photovoltaic wind system
and to calculate the probability or reliability of its power generating capacity. Themost popular method, LPSP (loss of power supply probability) method has been
used to design a hybrid system using linear programming, goal programming and
probabilistic techniques [1–3]. LPSP is the probability that an insuf ficient power
supply results when the hybrid system (PV, wind power and energy storage) is not
able to satisfy the load demand. The LPSP is considered to be the implemented
criteria for a hybrid PV–wind system employing a battery bank. For one location,
long-term data on wind speed and irradiance records for every hour of the day are
deduced to produce the probability density function of the combined generation. For
a given load distribution, the probability density function of the storage is obtained
and the battery size calculated to give the relevant level of the system’s reliability
using the LPSP technique. Additionally, the trade-off/risk method is a recent theoreti-
cal advance to solve problems with multiple conflicting objectives and uncertainty
in system planning [4].
In this study, a simulation model of a hybrid system is established, and itsreliability or probability for a telecommunication system is analyzed using the LPSP
technique. For a given loss probability, different combinations of PV modules, wind
turbines and battery banks are determined.
2. Weather data analysis
For the Hong Kong Special Administrative region, the climate data for 1989 are
taken as the typical weather year, as shown in Ref. [5]. It is seen from Fig. 1 that
Fig. 1. Monthly accumulated solar radiation and wind power distribution in 1989.
8/12/2019 Weather Data and Probability
http://slidepdf.com/reader/full/weather-data-and-probability 4/12
1816 H.X. Yang et al. / Renewable Energy 28 (2003) 1813 – 1824
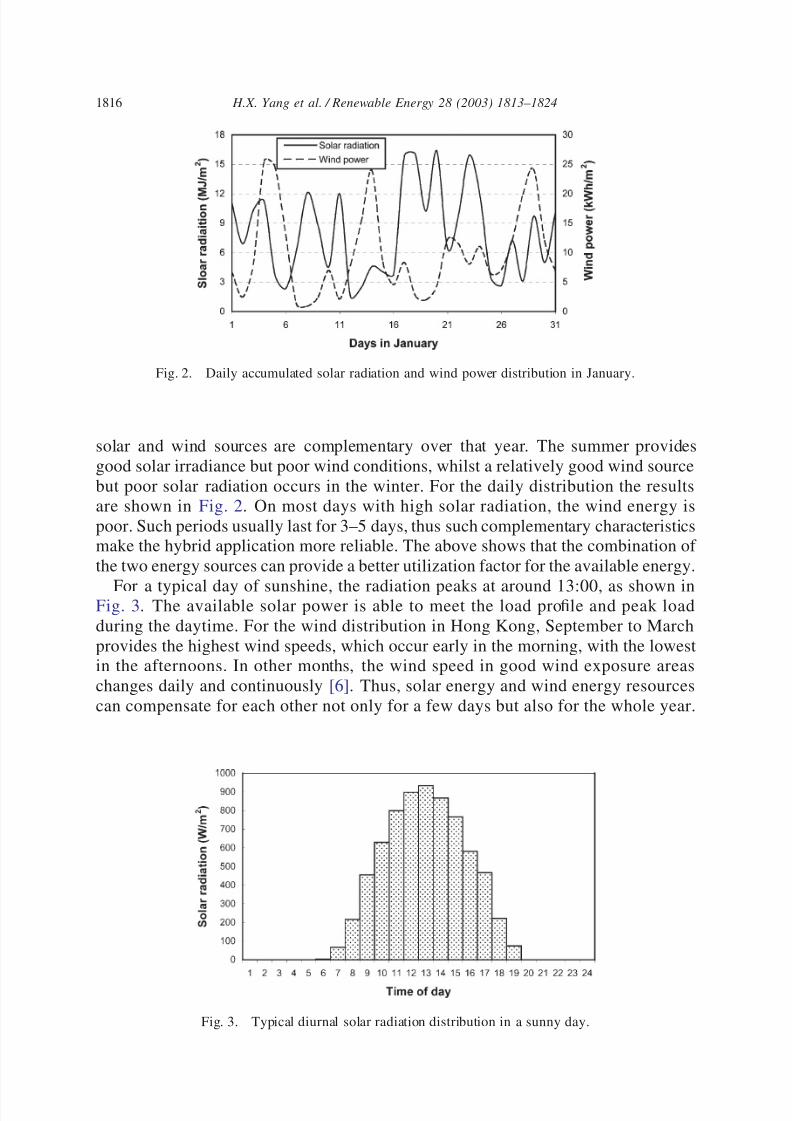
Fig. 2. Daily accumulated solar radiation and wind power distribution in January.
solar and wind sources are complementary over that year. The summer provides
good solar irradiance but poor wind conditions, whilst a relatively good wind source
but poor solar radiation occurs in the winter. For the daily distribution the results
are shown in Fig. 2. On most days with high solar radiation, the wind energy is
poor. Such periods usually last for 3–5 days, thus such complementary characteristicsmake the hybrid application more reliable. The above shows that the combination of
the two energy sources can provide a better utilization factor for the available energy.
For a typical day of sunshine, the radiation peaks at around 13:00, as shown inFig. 3. The available solar power is able to meet the load profile and peak load
during the daytime. For the wind distribution in Hong Kong, September to March
provides the highest wind speeds, which occur early in the morning, with the lowestin the afternoons. In other months, the wind speed in good wind exposure areas
changes daily and continuously [6]. Thus, solar energy and wind energy resources
can compensate for each other not only for a few days but also for the whole year.
Fig. 3. Typical diurnal solar radiation distribution in a sunny day.

8/12/2019 Weather Data and Probability
http://slidepdf.com/reader/full/weather-data-and-probability 5/12
1817 H.X. Yang et al. / Renewable Energy 28 (2003) 1813 – 1824
3. Probability analysis of hybrid photovoltaic–wind power generation systems
3.1. Methodology
In order to calculate the performance of an existing system, or to predict energy
consumption or energy generated from a system in the design stage, appropriate
weather data is required. The development of methodologies for generating the so-
called typical meteorological year (TMY) provides a standard for hourly data for
solar radiation and other meteorological parameters for a period of 1 year, rep-resenting climatic conditions considered to be typical over a longer time period.
Previous studies are mostly for solar energy systems and building energy studies [7–
10], but no appropriate TMY study is available for wind and hybrid solar–wind
application. In earlier studies, the weighting criteria for wind have been very small-
scale, so a TMY for a hybrid solar–wind system was required.
A suitable TMY for hybrid solar-wind systems should be studied and achieved
for Hong Kong and other areas to calculate the performance of the renewable energy
application [11]. Here, the typical weather year of 1989 is applied for the probability
study on an hourly basis instead of one appropriate TMY for Hong Kong. The results
achieved in this study are for the typical weather year of 1989 only. Thus, more
reliable results and fewer errors can be achieved if the appropriate TMY were
applied.
3.2. The simulation models
The system is shown in Fig. 4. The wind energy conversion system (WECS) and
photovoltaic system are paralleled in order to supply electrical power to the load,
and the excess energy generated is supplied to the batteries. Once the energy is
deficit, the batteries discharge to supply the shortfall in demand. The following simul-
ation determines the performance of a hybrid system.For the output power of the wind energy conversion system (WECS), the wind
Fig. 4. Schematic diagram of a hybrid solar–wind system.

8/12/2019 Weather Data and Probability
http://slidepdf.com/reader/full/weather-data-and-probability 6/12
1818 H.X. Yang et al. / Renewable Energy 28 (2003) 1813 – 1824
speed distribution for selected sites and chosen wind turbine type are the main factors
considered. The following simplified model is used to assess power generation prob-
ability as a function of wind velocity:
Pw(v) Pr
(vr vc)(vvc)······vcvvr
Pr ························vr vv f
0··························otherwise
(1)
For most PV modules, the power generation characteristic can be described by
[12]:
I C 1 C 2·GC 3 EXP V
C 4T ce1C 5· EXP V
C 6T ce1 V
C 7T ce(2)
P VI (3)
A maximum power point tracker (MPPT) is used to extract the maximum available
power at every isolation level. Here, the monocrystalline silicon PV modules are
used. The specifications are shown in Section 3.4. More details about the photovoltaic
modules are introduced in the literature [12]. The maximum power points are
found from:
∂P
∂V 0 (4)
Small-sized lead-acid batteries are used for energy storage. The selection of a
proper battery for these types of applications requires a complete analysis of the
battery’s charge and discharge requirements, including load, output and pattern of the solar or alternative energy source, the operating temperature, and the ef ficiency
of the charger and other system components.
Energy losses occur when charging a battery. The battery ef ficiency drops further
when as the battery ages or if it is not maintained correctly. The battery’s state of
charge (SOC) is computed using:
SOC (t 1) SOC (t )·s I bat (t )·t ·h( I bat (t )) (5)
The maximum possible battery current rate I bat,max at time t, is determined by:
I bat .max(t ) max{0,min[ I max,(C ·(SOC maxSOC (t )) (SOC (t ) (6)
SOC min)·(1C )) / t ]}
I bat,max depends on the battery’s state at each time instant. The battery’s state is
described by the amount of the battery’s state of charge, by the sign of the batterycurrent, as well as by the history of the battery. I max is given by manufactures as
around 20% of the value of nominal capacity.

8/12/2019 Weather Data and Probability
http://slidepdf.com/reader/full/weather-data-and-probability 7/12
1819 H.X. Yang et al. / Renewable Energy 28 (2003) 1813 – 1824
In this study, the electrical energy is supplied to a telecommunication system. The
main consumer is the telecommunication equipment, as well as four buoys of 40 W
each during the nighttime. The operation mode is about 30% in emission and 70%
in reception. The power consumption is 70 W from 7:00 to 19:00, and 230 W from19:00 to 7:00.
3.3. Loss of power supply probability (LPSP)
The power input to the storage system is controlled by the equation C (t ) =
P(t ) L(t ) in which P(t ) = PW (t ) + PPV (t ). It is evident that the power generated by
the hybrid system and the amount of energy stored are time dependent. For the
charging process of the battery, [PW (t ) + PPV (t )] L(t ), the objective function is:
SOC (t 1) SOC (t )·s PW (t ) PPV (t ) L(t )V L
·t ·h( I bat (t )) (7)
The charging ef ficiency is considered to be 0.75, and the self-discharge rate is
assumed to be zero since it is only 0.007% for 1 h. There are some constraints
restricting the range of the decision variables during the charging process:
PW (t ) PPV (t ) L(t )0.2SOC ·V L
t (8)
0.2SOC SOC (t )SOC (9)
For the discharging process, PW (t ) + PPV (t ) L(t ), the related equations are as fol-
lows:
I needed (t ) L(t )PW (t )PPV (t )
V L·h( I bat (t )) (10)
I sup ply(t ) min I max 0.2SOC
t ,
SOC (t )·s SOC min
t (11)
LPSP
n
i 1
hours( I sup ply(t ) I needed (t ))
n (12)
The discharging ef ficiency is considered to be 1. For longevity of battery, themaximum charging rate, SOC /5, is given as the upper limit. To avoid deep discharg-
ing, the battery cannot be discharged to 20% or less, so that SOC min is 20% of the
nominal capacity of the chosen battery.
3.4. Sizing selection of wind generator, PV module and battery
Using the LPSP technique, the size of the equipment is optimized and can beselected when economical constraints are not considered. The assumptions of this
study are as follows:
8/12/2019 Weather Data and Probability
http://slidepdf.com/reader/full/weather-data-and-probability 8/12
1820 H.X. Yang et al. / Renewable Energy 28 (2003) 1813 – 1824
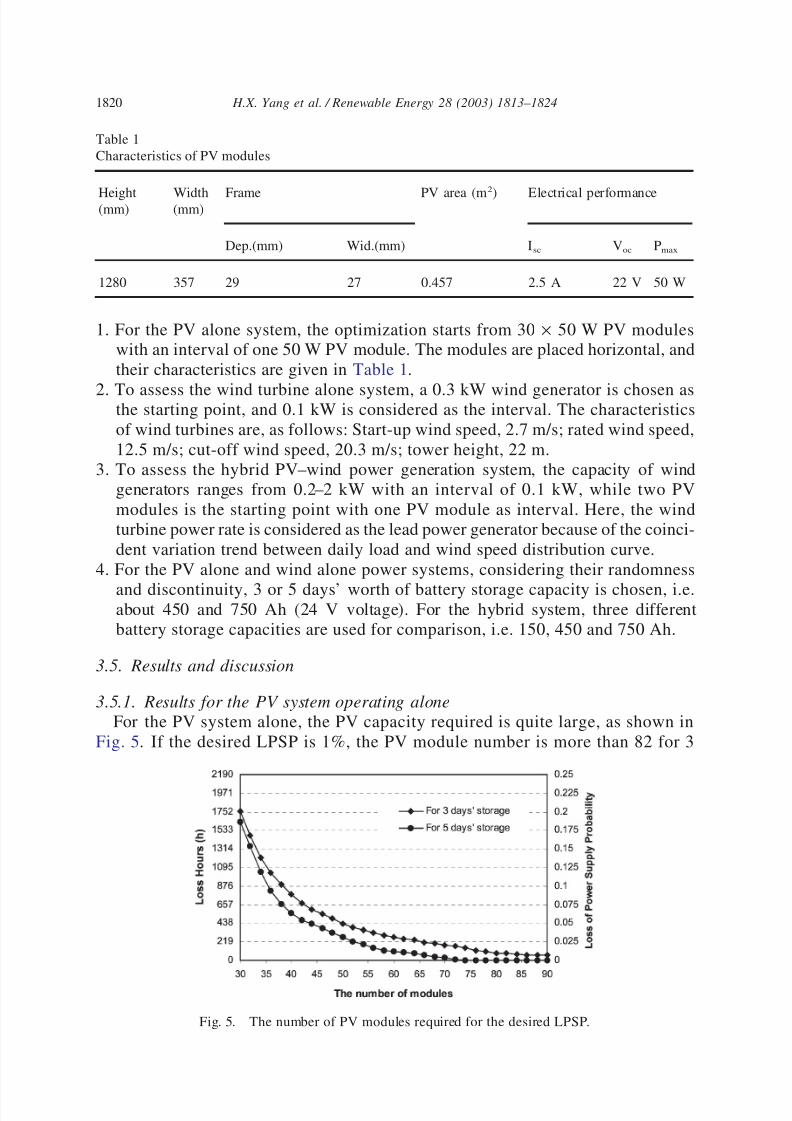
Table 1
Characteristics of PV modules
Height Width Frame PV area (m2
) Electrical performance(mm) (mm)
Dep.(mm) Wid.(mm) Isc Voc Pmax
1280 357 29 27 0.457 2.5 A 22 V 50 W
1. For the PV alone system, the optimization starts from 30 × 50 W PV moduleswith an interval of one 50 W PV module. The modules are placed horizontal, and
their characteristics are given in Table 1.
2. To assess the wind turbine alone system, a 0.3 kW wind generator is chosen asthe starting point, and 0.1 kW is considered as the interval. The characteristics
of wind turbines are, as follows: Start-up wind speed, 2.7 m/s; rated wind speed,
12.5 m/s; cut-off wind speed, 20.3 m/s; tower height, 22 m.
3. To assess the hybrid PV–wind power generation system, the capacity of wind
generators ranges from 0.2–2 kW with an interval of 0.1 kW, while two PV
modules is the starting point with one PV module as interval. Here, the wind
turbine power rate is considered as the lead power generator because of the coinci-
dent variation trend between daily load and wind speed distribution curve.
4. For the PV alone and wind alone power systems, considering their randomness
and discontinuity, 3 or 5 days’ worth of battery storage capacity is chosen, i.e.about 450 and 750 Ah (24 V voltage). For the hybrid system, three different
battery storage capacities are used for comparison, i.e. 150, 450 and 750 Ah.
3.5. Results and discussion
3.5.1. Results for the PV system operating alone
For the PV system alone, the PV capacity required is quite large, as shown in
Fig. 5. If the desired LPSP is 1%, the PV module number is more than 82 for 3
Fig. 5. The number of PV modules required for the desired LPSP.
8/12/2019 Weather Data and Probability
http://slidepdf.com/reader/full/weather-data-and-probability 9/12
1821 H.X. Yang et al. / Renewable Energy 28 (2003) 1813 – 1824
days’ battery storage capacity, and 64 for 5 days’ battery storage capacity. If the
desired LPSP is 0%, the PV system alone with 3 days’ battery storage cannot meet
the requirement, but the one with 5 days’ battery storage can meet the requirement
when the PV modules number 76. This is because heavy cloudy/rain weather maycontinue for more than 3 days, but less than 5 days.
Results also show that the LPSP reduction ratio declines with the increase in the
PV module numbers. Higher ratios exist when the number of the PV modules is less
than 40, while ratios become lower when the PV module number is more than 70.
Thus, for this system, it is not appropriate to increase the number of PV modulesfor satisfying reliability.
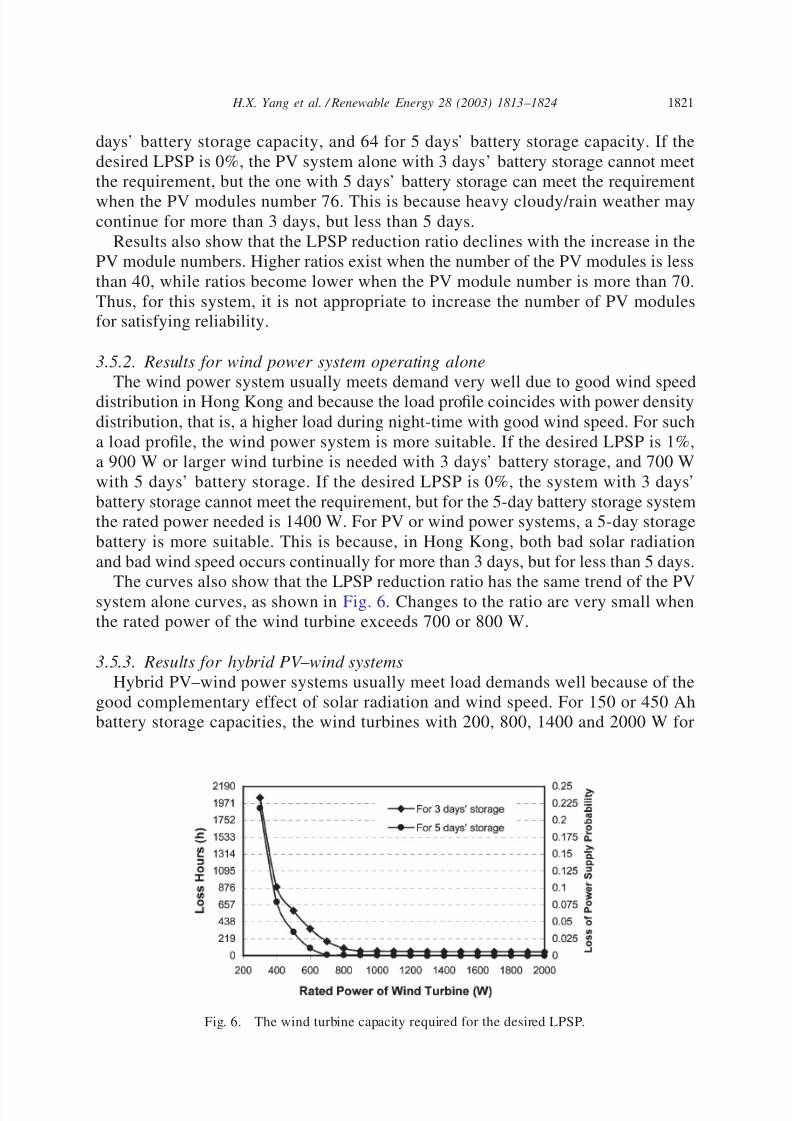
3.5.2. Results for wind power system operating alone
The wind power system usually meets demand very well due to good wind speed
distribution in Hong Kong and because the load profile coincides with power density
distribution, that is, a higher load during night-time with good wind speed. For such
a load profile, the wind power system is more suitable. If the desired LPSP is 1%,
a 900 W or larger wind turbine is needed with 3 days’ battery storage, and 700 W
with 5 days’ battery storage. If the desired LPSP is 0%, the system with 3 days’
battery storage cannot meet the requirement, but for the 5-day battery storage systemthe rated power needed is 1400 W. For PV or wind power systems, a 5-day storage
battery is more suitable. This is because, in Hong Kong, both bad solar radiation
and bad wind speed occurs continually for more than 3 days, but for less than 5 days.
The curves also show that the LPSP reduction ratio has the same trend of the PVsystem alone curves, as shown in Fig. 6. Changes to the ratio are very small when
the rated power of the wind turbine exceeds 700 or 800 W.
3.5.3. Results for hybrid PV – wind systems
Hybrid PV–wind power systems usually meet load demands well because of the
good complementary effect of solar radiation and wind speed. For 150 or 450 Ah
battery storage capacities, the wind turbines with 200, 800, 1400 and 2000 W for
Fig. 6. The wind turbine capacity required for the desired LPSP.

8/12/2019 Weather Data and Probability
http://slidepdf.com/reader/full/weather-data-and-probability 10/12
1822 H.X. Yang et al. / Renewable Energy 28 (2003) 1813 – 1824
different numbers of PV modules are chosen for comparison, as shown in Fig. 7.
For the 750 Ah storage, the trend is very similar to the 450 Ah case. The combi-
nations have very high reliability with very small LPSP, except for the 200 W wind
turbine system. Comparing the hybrid system with the PV system alone or the windsystem alone shows that the hybrid system can reduce both photovoltaic capacity
and wind turbine capacity.
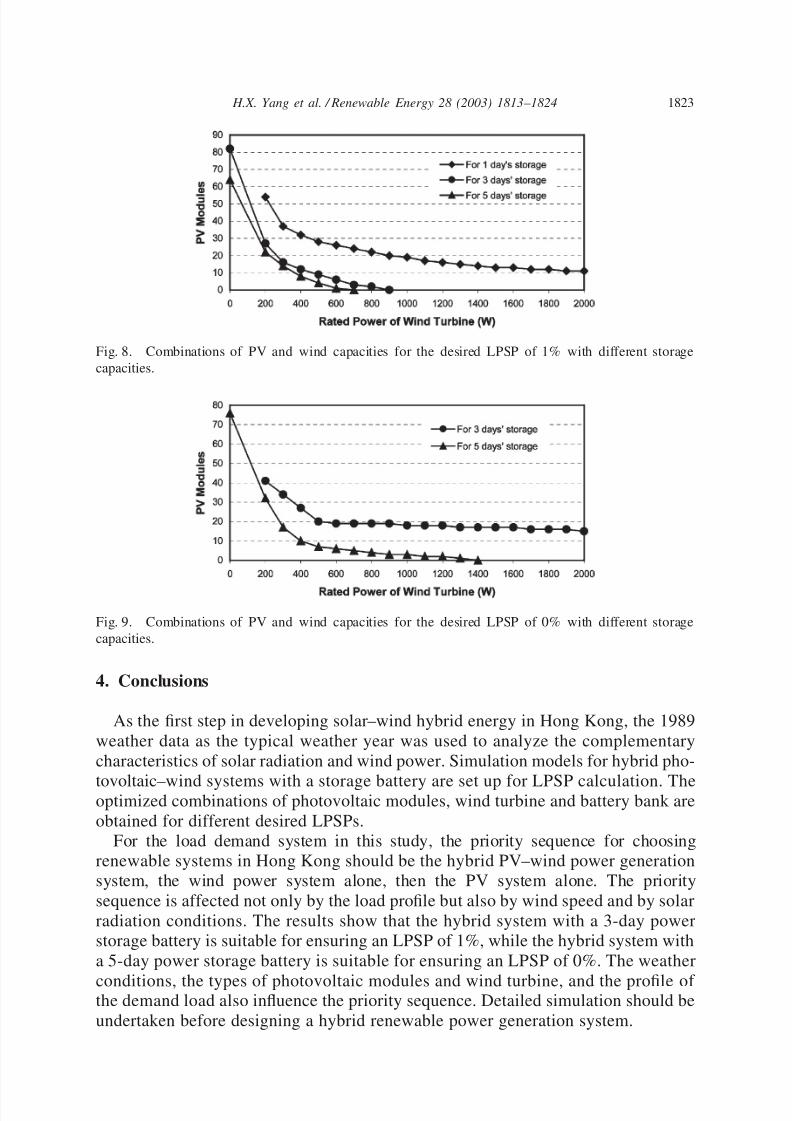
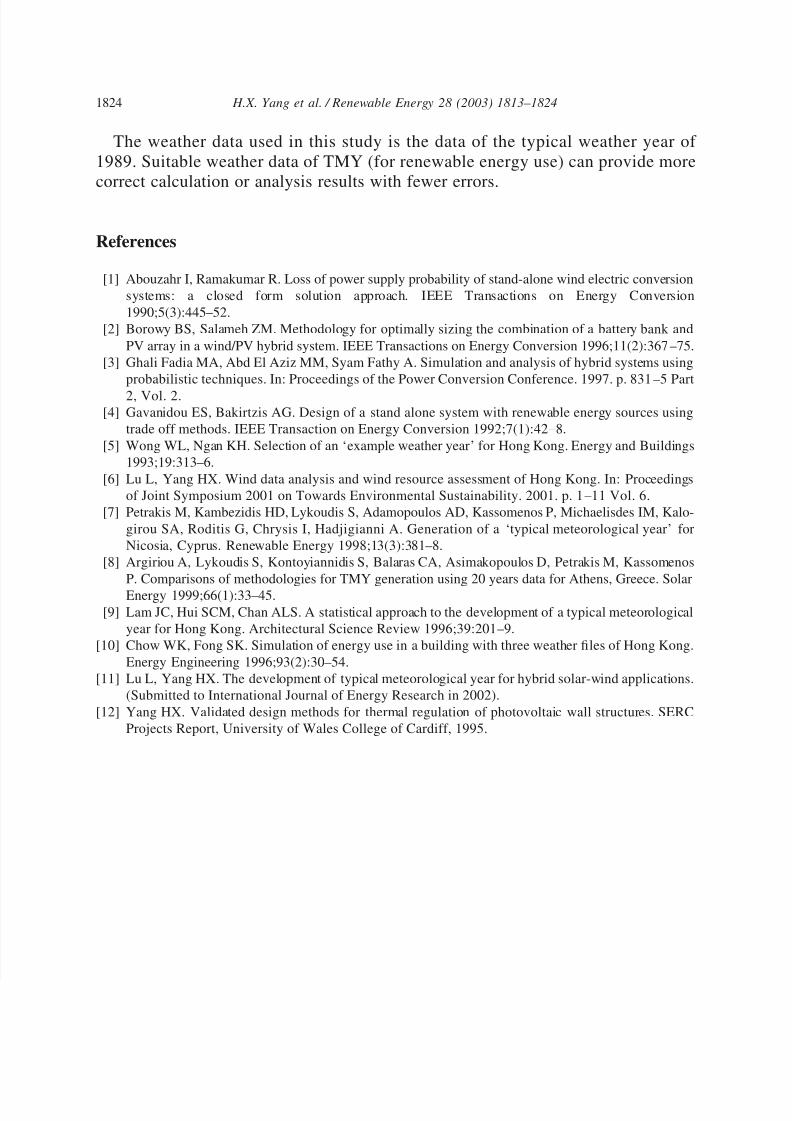
For different desired LPSPs, the calculation results are shown in Fig. 8 and Fig.
9. The areas above the curves are areas that can ensure the required probability. For
a desired LPSP of 1% it shows that the hybrid system with a 1-day storage batterycan also provide high reliability and good probability, but the system needs an
excessive number of PV modules. The combinations for the system with 3-day stor-
age and the ones with 5-day storage are very similar. The 3-day storage hybrid
system is very suitable for the needed LPSP of 1%. For the desired LPSP of 0%,
only the systems with 3 or 5-day storage can meet the need. The changing ratio is
also very gradual when the rated power of the wind turbine exceeds 500 W. The
number of PV modules needed is also very large, at least 15 for the 3-day storage
system, while the hybrid system with 5-day storage has good performance to meet
the no-loss operating hours.
Fig. 7. (a) Combinations of PV and wind power capacities for the desired LPSP (150 Ah battery); (b)
Combinations of PV and wind power capacities for the desired LPSP (450 Ah battery).
8/12/2019 Weather Data and Probability
http://slidepdf.com/reader/full/weather-data-and-probability 11/12
1823 H.X. Yang et al. / Renewable Energy 28 (2003) 1813 – 1824
Fig. 8. Combinations of PV and wind capacities for the desired LPSP of 1% with different storage
capacities.
Fig. 9. Combinations of PV and wind capacities for the desired LPSP of 0% with different storage
capacities.
4. Conclusions
As the first step in developing solar–wind hybrid energy in Hong Kong, the 1989
weather data as the typical weather year was used to analyze the complementary
characteristics of solar radiation and wind power. Simulation models for hybrid pho-
tovoltaic–wind systems with a storage battery are set up for LPSP calculation. Theoptimized combinations of photovoltaic modules, wind turbine and battery bank are
obtained for different desired LPSPs.
For the load demand system in this study, the priority sequence for choosing
renewable systems in Hong Kong should be the hybrid PV–wind power generation
system, the wind power system alone, then the PV system alone. The priority
sequence is affected not only by the load profile but also by wind speed and by solar
radiation conditions. The results show that the hybrid system with a 3-day power
storage battery is suitable for ensuring an LPSP of 1%, while the hybrid system with
a 5-day power storage battery is suitable for ensuring an LPSP of 0%. The weather
conditions, the types of photovoltaic modules and wind turbine, and the profile of the demand load also influence the priority sequence. Detailed simulation should be
undertaken before designing a hybrid renewable power generation system.
8/12/2019 Weather Data and Probability
http://slidepdf.com/reader/full/weather-data-and-probability 12/12
1824 H.X. Yang et al. / Renewable Energy 28 (2003) 1813 – 1824
The weather data used in this study is the data of the typical weather year of
1989. Suitable weather data of TMY (for renewable energy use) can provide more
correct calculation or analysis results with fewer errors.
References
[1] Abouzahr I, Ramakumar R. Loss of power supply probability of stand-alone wind electric conversion
systems: a closed form solution approach. IEEE Transactions on Energy Conversion
1990;5(3):445–52.
[2] Borowy BS, Salameh ZM. Methodology for optimally sizing the combination of a battery bank and
PV array in a wind/PV hybrid system. IEEE Transactions on Energy Conversion 1996;11(2):367 –75.
[3] Ghali Fadia MA, Abd El Aziz MM, Syam Fathy A. Simulation and analysis of hybrid systems using
probabilistic techniques. In: Proceedings of the Power Conversion Conference. 1997. p. 831–5 Part
2, Vol. 2.[4] Gavanidou ES, Bakirtzis AG. Design of a stand alone system with renewable energy sources using
trade off methods. IEEE Transaction on Energy Conversion 1992;7(1):42–8.
[5] Wong WL, Ngan KH. Selection of an ‘example weather year’ for Hong Kong. Energy and Buildings
1993;19:313–6.
[6] Lu L, Yang HX. Wind data analysis and wind resource assessment of Hong Kong. In: Proceedings
of Joint Symposium 2001 on Towards Environmental Sustainability. 2001. p. 1 –11 Vol. 6.
[7] Petrakis M, Kambezidis HD, Lykoudis S, Adamopoulos AD, Kassomenos P, Michaelisdes IM, Kalo-
girou SA, Roditis G, Chrysis I, Hadjigianni A. Generation of a ‘typical meteorological year’ for
Nicosia, Cyprus. Renewable Energy 1998;13(3):381–8.
[8] Argiriou A, Lykoudis S, Kontoyiannidis S, Balaras CA, Asimakopoulos D, Petrakis M, Kassomenos
P. Comparisons of methodologies for TMY generation using 20 years data for Athens, Greece. Solar
Energy 1999;66(1):33–45.
[9] Lam JC, Hui SCM, Chan ALS. A statistical approach to the development of a typical meteorological
year for Hong Kong. Architectural Science Review 1996;39:201–9.
[10] Chow WK, Fong SK. Simulation of energy use in a building with three weather files of Hong Kong.
Energy Engineering 1996;93(2):30–54.
[11] Lu L, Yang HX. The development of typical meteorological year for hybrid solar-wind applications.
(Submitted to International Journal of Energy Research in 2002).
[12] Yang HX. Validated design methods for thermal regulation of photovoltaic wall structures. SERC
Projects Report, University of Wales College of Cardiff, 1995.