Wear Mechanism in Automotive Brake Materials, Wear Debris ... · Wear Mechanism in Automotive Brake...
21
1 Wear Mechanism in Automotive Brake Materials, Wear Debris and Its Potential Environmental Impact J. Kukutschová *1 , V. Roubíček 1 , K. Malachová 2 , Z. Pavlíčková 2 , R. Holuša 2 , J. Kubačková 3 , V. Mička 3 , D. MacCrimmon 4 , P. Filip 4 1 Technical University Ostrava, 17. listopadu 15, 70833 Ostrava-Poruba, Czech Republic 2 University of Ostrava, Faculty of Science, 30. dubna 22, 70203 Ostrava, Czech Republic 3 Institute of Public Health, Partyzánské nám. 7, 70200 Ostrava, Czech Republic 4 Southern Illinois University Carbondale, Centre for Advanced Friction Studies, Carbondale, IL, 62901-4343 USA Received Date Line (to be inserted by Production) (8 pt) Abstract A model semi-metallic brake lining was subjected to full scale automotive brake dynamometer tests. The structural properties and surface topography of brake linings were analyzed at different stages of wear testing and correlated to frictional performance. Characteristics of released wear particles were also addressed. A combination of abrasive and adhesive wear with oxidative processes dominated the friction process. Formation of a friction layer adhering to the friction surfaces of pads and discs is the major feature responsible for friction performance. Characteristics of the friction layer depend mostly on surface temperature, normal pressure, and sliding speed. It is a newly formed sintered composite matter consisting of a mixture of wear particulates. Wear rates and friction levels depend on chemistry, structure and hardness of the friction layer covering the surface of a pad or a disc; however, there is no simple Archard-type relationship between wear and measured hardness. Wear debris generated during the dynamometer tests was collected from containers placed under the brake inside dynamometer chamber. The collected debris was compared with ball-milled particles from identical brake lining. It is necessary to combine several analytical methods to characterize wear particles properly. The presence of copper and iron oxides as well as carbonaceous components is typical for all collected debris samples. Chemistry of wear debris resembles chemistry of the friction layer. Composition, mutagenic potency and pulmonary toxicity of wear debris and ball-milled particles were also analyzed. Mutagenic potency of initial friction composite and wear particles was evaluated by two in vitro bacterial microbioassays (SOS Chromotest, Ames test). Obtained results show potency of wear particles for interacting with DNA after metabolic activation, which indicates the presence of indirect mutagens. The pulmonary toxicity test on rats revealed an acute response of the lung tissue to the ball-milled particles. Further research is necessary to address the role of brake wear particles and potential impact of sub-chronic exposure to wear debris. Keywords: wear, wear debris, friction composite, mutagenicity, pulmonary toxicity 1. Introduction *Corresponding author. Tel.: +420596991557; fax: +420596991640. E-mail address: [email protected] (Jana Kukutschova)
Transcript of Wear Mechanism in Automotive Brake Materials, Wear Debris ... · Wear Mechanism in Automotive Brake...
1
Wear Mechanism in Automotive Brake Materials, Wear Debris
and Its Potential Environmental Impact
J. Kukutschová*1, V. Roubíček1, K. Malachová2, Z. Pavlíčková2, R. Holuša2,
J. Kubačková3, V. Mička3, D. MacCrimmon4, P. Filip4
1Technical University Ostrava, 17. listopadu 15, 70833 Ostrava-Poruba, Czech Republic
2University of Ostrava, Faculty of Science, 30. dubna 22, 70203 Ostrava, Czech Republic 3Institute of Public Health, Partyzánské nám. 7, 70200 Ostrava, Czech Republic
4Southern Illinois University Carbondale, Centre for Advanced Friction Studies, Carbondale, IL, 62901-4343 USA
Received Date Line (to be inserted by Production) (8 pt)
Abstract
A model semi-metallic brake lining was subjected to full scale automotive brake dynamometer tests. The structural
properties and surface topography of brake linings were analyzed at different stages of wear testing and correlated to frictional
performance. Characteristics of released wear particles were also addressed. A combination of abrasive and adhesive wear with
oxidative processes dominated the friction process. Formation of a friction layer adhering to the friction surfaces of pads and
discs is the major feature responsible for friction performance. Characteristics of the friction layer depend mostly on surface
temperature, normal pressure, and sliding speed. It is a newly formed sintered composite matter consisting of a mixture of wear
particulates. Wear rates and friction levels depend on chemistry, structure and hardness of the friction layer covering the
surface of a pad or a disc; however, there is no simple Archard-type relationship between wear and measured hardness.
Wear debris generated during the dynamometer tests was collected from containers placed under the brake inside
dynamometer chamber. The collected debris was compared with ball-milled particles from identical brake lining. It is
necessary to combine several analytical methods to characterize wear particles properly. The presence of copper and iron
oxides as well as carbonaceous components is typical for all collected debris samples. Chemistry of wear debris resembles
chemistry of the friction layer. Composition, mutagenic potency and pulmonary toxicity of wear debris and ball-milled
particles were also analyzed. Mutagenic potency of initial friction composite and wear particles was evaluated by two in vitro
bacterial microbioassays (SOS Chromotest, Ames test). Obtained results show potency of wear particles for interacting with
DNA after metabolic activation, which indicates the presence of indirect mutagens. The pulmonary toxicity test on rats
revealed an acute response of the lung tissue to the ball-milled particles. Further research is necessary to address the role of
brake wear particles and potential impact of sub-chronic exposure to wear debris.
Keywords: wear, wear debris, friction composite, mutagenicity, pulmonary toxicity
1. Introduction
*Corresponding author. Tel.: +420596991557; fax: +420596991640.
E-mail address: [email protected] (Jana Kukutschova)
2
Brake lining composite materials are being manufactured in enormous quantities and have recently seen
dynamic development aiming for improvement of their wear resistance, friction level, and friction stability. They
represent a relevant element in transportation safety and, in spite of replacement of asbestos, also in environmental
loading. Brake wear contribution to PM10 (Particulate Matter smaller than 10μm in diameter) and PM2.5
(Particulate Matter < 2.5 μm in diameter) per light-duty vehicle could be 0-80mg/km and 0-5mg/km, respectively
[1]. Garg et al. report that 35% of wear debris becomes airborne [2], while Sanders et al. report up to 50% [3].
Wear debris contains several hazardous elements that may interact with DNA of living organisms and cause
carcinogenesis [4], although only the effects of copper have recently been addressed extensively. According to the
Brake Pad Partnership usage of copper in brake pads for new automobiles has increased almost by 40% in the last
few years [5]. Analysis of copper content in airborne wear particles revealed the highest levels of copper in the
respirable fraction smaller than 5µm which may easily enter deeper parts of respiratory tract [6]. Copper from
brake pad wear also finds its way into stormwater and tributaries feeding into the San Francisco Bay, killing
invertebrates and algae and harming fish [7]. Due to high number of automobiles worldwide, emission of wear
particles to environment may substantially contribute to air and water pollution and cause several adverse health
effects including myocardial infarction and lung diseases [8]. The currently used analytical methods fail to
properly characterize wear debris as demonstrated by Roubicek et al. [9]. Although there are more than 230
million vehicles on road and a conservative estimation indicates that approximately 30 thousand metric tons of
brake wear debris is being released in the US yearly, it is not clear what compounds are being released since the
raw materials used for manufacturing of brake linings are subjected to complex mechano-chemical interactions
and completely new chemical compounds are being formed during braking [10].
The objective of this study was to demonstrate complex wear mechanisms occurring in automotive brakes,
characterize brake wear debris released from a model semi-metallic brake lining, and to perform preliminary
evaluation of two possible interactions with living organisms: i) interaction with DNA and ii) pulmonary toxicity
related to inhalation of wear particles.
2. Experimental
2.1. Friction materials
The formulation of model semi-metallic polymer matrix composite brake material is presented in Table 1.
Total mass of one brake lining pad is 113g and two pads are used in one dynamometer test. The composition
given in Table 1 represents a typical semi-metallic brake materials available in the US, European, and Asian
markets. All brake linings were manufactured in CAFS (Center for Advanced Friction Studies at Southern Illinois
University Carbondale, IL USA) laboratories by mixing ingredients in a Littleford W-10 vertical batch mixer (30
minutes), molding, and hot pressing (180C/45,000 N/15 minutes) followed by post curing in air at 180C for 4
hours. Ford Crown Victoria 1999 set-up with corresponding original equipment cast iron disc and caliper was
3
used in this experiment (note that the brake pad is not the OEM Ford formulation and the mold type was used for
convenience only).
Table 1: Formulation of studied semi-metallic brake pad composites,
total mass of one sample brake lining is 113g after machining
2.2 Wear tests and wear debris generation
A modified version of the AO4D brake dynamometer wear test procedure was used for wear and friction
tests. This procedure consists of instrument check, burnishing, effectiveness, fade, recovery, and two high
temperature wear tests (Table 2). Several brake manufacturers and brake researchers use similar tests for wear
characterization of friction linings of passenger cars and small trucks since they “cover” a wide spectrum of
potential braking scenarios. It has to be noted, however, that the dynamometer simulations are not fully
representative of every car braking operation. Brake dynamometer tests were performed using the Link full scale
brake dynamometer model 2900 in an environmental chamber with wind tunnel simulating corresponding air
flow. The chamber was cleaned before each test and the wear debris was collected by sweeping the surfaces of the
enclosed dynamometer chamber after the entire test was completed. This way, the collected wear debris contains
both the airborne fraction and the settled fraction of wear debris. A total of eight AO4D full-scale brake
dynamometer tests were run on four sets of laboratory manufactured brake linings. Each lining set (two pads) was
run twice consecutively, the first run using a resurfaced brake rotor and the second using the same rotor from the
first run without any changes. Wear debris collected from AO4D dynamometer test was sieved using U.S.A.
Standard Testing Sieve with A.S.T.M.E.-11 specification (W.S. Tyler, Inc.) into three divisions: i) wear debris
smaller than 250μm (Lot 1), ii) wear debris with size between 250μm and 425μm (Lot 2), and iii) wear debris
larger than 425μm (Lot 3). For comparison, identical brake lining samples were also ball milled using a laboratory
Constituent Volume % Weight %
Steel Fiber 2.7 10
Synthetic Graphite 4.8 5
Resilient Graphitic Carbon (RGC) 5.3 5
Coke 16.8 15
Iron Powder 2.6 3
Vermiculite 3.5 5
ZrSiO4 0.9 2
Nitrile Rubber (NBR) 8.5 5
Twaron 3.0 2
BaSO4 6.6 9
Copper 0.9 4
MgO 3.3 3
Sb2S3 1.0 3
Tin 1.6 3
MoS2 0.4 1
Al2O3 1.4 1
Phenolic Resin 36.5 24
4
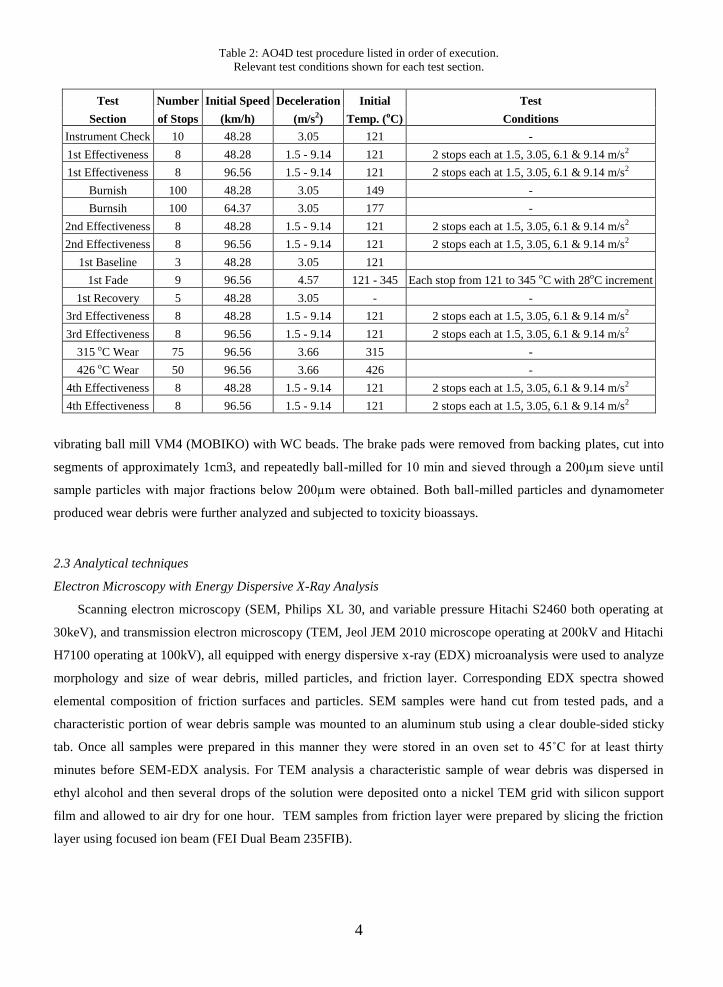
Table 2: AO4D test procedure listed in order of execution.
Relevant test conditions shown for each test section.
Test Number Initial Speed Deceleration Initial Test
Section of Stops (km/h) (m/s2) Temp. (oC) Conditions
Instrument Check 10 48.28 3.05 121 -
1st Effectiveness 8 48.28 1.5 - 9.14 121 2 stops each at 1.5, 3.05, 6.1 & 9.14 m/s2
1st Effectiveness 8 96.56 1.5 - 9.14 121 2 stops each at 1.5, 3.05, 6.1 & 9.14 m/s2
Burnish 100 48.28 3.05 149 -
Burnsih 100 64.37 3.05 177 -
2nd Effectiveness 8 48.28 1.5 - 9.14 121 2 stops each at 1.5, 3.05, 6.1 & 9.14 m/s2
2nd Effectiveness 8 96.56 1.5 - 9.14 121 2 stops each at 1.5, 3.05, 6.1 & 9.14 m/s2
1st Baseline 3 48.28 3.05 121
1st Fade 9 96.56 4.57 121 - 345 Each stop from 121 to 345 oC with 28oC increment
1st Recovery 5 48.28 3.05 - -
3rd Effectiveness 8 48.28 1.5 - 9.14 121 2 stops each at 1.5, 3.05, 6.1 & 9.14 m/s2
3rd Effectiveness 8 96.56 1.5 - 9.14 121 2 stops each at 1.5, 3.05, 6.1 & 9.14 m/s2
315 oC Wear 75 96.56 3.66 315 -
426 oC Wear 50 96.56 3.66 426 -
4th Effectiveness 8 48.28 1.5 - 9.14 121 2 stops each at 1.5, 3.05, 6.1 & 9.14 m/s2
4th Effectiveness 8 96.56 1.5 - 9.14 121 2 stops each at 1.5, 3.05, 6.1 & 9.14 m/s2
vibrating ball mill VM4 (MOBIKO) with WC beads. The brake pads were removed from backing plates, cut into
segments of approximately 1cm3, and repeatedly ball-milled for 10 min and sieved through a 200µm sieve until
sample particles with major fractions below 200µm were obtained. Both ball-milled particles and dynamometer
produced wear debris were further analyzed and subjected to toxicity bioassays.
2.3 Analytical techniques
Electron Microscopy with Energy Dispersive X-Ray Analysis
Scanning electron microscopy (SEM, Philips XL 30, and variable pressure Hitachi S2460 both operating at
30keV), and transmission electron microscopy (TEM, Jeol JEM 2010 microscope operating at 200kV and Hitachi
H7100 operating at 100kV), all equipped with energy dispersive x-ray (EDX) microanalysis were used to analyze
morphology and size of wear debris, milled particles, and friction layer. Corresponding EDX spectra showed
elemental composition of friction surfaces and particles. SEM samples were hand cut from tested pads, and a
characteristic portion of wear debris sample was mounted to an aluminum stub using a clear double-sided sticky
tab. Once all samples were prepared in this manner they were stored in an oven set to 45˚C for at least thirty
minutes before SEM-EDX analysis. For TEM analysis a characteristic sample of wear debris was dispersed in
ethyl alcohol and then several drops of the solution were deposited onto a nickel TEM grid with silicon support
film and allowed to air dry for one hour. TEM samples from friction layer were prepared by slicing the friction
layer using focused ion beam (FEI Dual Beam 235FIB).
5
Polarized Light Microscopy
A Nikon FX135 polarized light microscope (PLM) was used for microstructural analysis of polished samples
and surfaces of worn pads. Polished samples were molded into epoxy resin ground and polished using standard
metallography techniques.
Laser Scattering Particle Size Distribution Analysis
A Horiba model LA-910 laser scattering particle size distribution analyzer (LSPSDA) was used to obtain the
average particle size of wear debris. Used LSPSDA is rated to measure particle sizes from 20nm to 1000μm. The
sample chamber is ultrasonically vibrated for seven seconds and a mechanical stirrer is turned on with aim to keep
the wear debris particles separated while the dispersant and particles are pumped through the laser analysis
chamber.
2.4 Toxicity tests
Mutagenicity
Mutagenicity was evaluated using both dynamometer wear debris and ball milled particle extracts. For each
extraction, 20g of debris/particulate sample was mixed with 200ml of dichloromethane p.a. (Merck) per Soxhlet
extractor and extraction lasted for 5 hours. The crude extracts were placed into a vacuum evaporator and
concentrated to a volume of 10ml. Only 0.5ml was removed from each concentrated extract and completely dried
in vacuum to determine the extractable organic matter (EOM). Rest of each concentrated extract was further
evaporated under nitrogen atmosphere and redissolved in 2ml of dimethylsulphoxide p.a. (Merck). These
dimethylsulphoxide solutions were used for mutagenicity testing.
The detection of mutagenicity was carried out using two bacterial micro bioassays: i) Ames test and ii) SOS
chromotest. The plate-incorporation version of the Salmonella reversion assay (Ames test) was performed with
and without in vitro metabolic activation with a rat liver S9 microsomal fraction and cofactor mixture [11]. The
auxotrphic Salmonella typhimurium His- strain TA98 was used to detect frameshift mutations (insertion or
deletion of a DNA chain part). Mutagenic activity is expressed as the number of revertant colonies (Rt) in assays
conducted with test agents compared to the number of colonies in the control sample (RC) (mutagenicity index
IM = Rt/RC). A twofold increase in IM is considered to be significant and sample is qualified as mutagenic, i.e.
being able to cause permanent genetic alterations. Mutation potential was quantified from the linear relationship
between the dose of test agent and the effect (IM/c). Each test was repeated minimally three times using two
replicate plates for each sample. The results were evaluated using SALM software [12].
The quantitative bacterial colorimetric assay (SOS Chromotest) was used to detect the SOS response induced
by DNA-damaging substances. The bacterial strain Escherichia coli K12 PQ37 was used, which was kindly
provided by M. Hofnung (Pasteur Institute, Paris). The mutagenic activity of tested samples was evaluated via
enzymatic activity of the bacterial indicator strain. The activity was determined by the ratio (RC) of inducible β-
galactosidase activity against constitutively synthesized alkaline phosphatase. The induction factor (IC) for a
compound at concentration (c) is defined as IC = RC / R0 in which R0 is the mutagenic activity measured in the
6
absence of the compound tested. The SOS-inducing potency (SOSIP) is a single parameter representing the
induction factor per concentration of the compound tested. The SOSIP is determined from the linear region of a
dose-response curve [13]. An increase of IC of 0.5 or more in the induction factor is significant and is expressed
as positive (+) for mutagenicity. The mutagenicity of all samples was evaluated both in the presence and absence
of metabolic activation in vitro using S9 liver microsomal fraction and a cofactor mixture [14].
Pulmonary toxicity
Groups of male rats (Wistar SPF, Velaz, ltd. Prague, CZE) were used in the pulmonary toxicity test. The rats
were approximately 8 weeks old at study start (mean weights in the range of 210-280g). All procedures using
animals were reviewed and approved by the Ministry of Agriculture of the Czech Republic. Particle size fraction
smaller than 5μm was separated from the ball-milled sample by wet micro-sieving procedure (in distilled water)
on 40 and 5μm mesh sieves with ultrasonic bath and was used for animal testing. Due to very small amount of
wear debris with size fraction smaller than 5µm, only ball-milled particles were evaluated for pulmonary toxicity
at this initial stage of research. Nine groups of rats (3 rats/ group and dose time) were intratracheally instilled with
single dose (0.5, 1.0, and 3mg) of particle suspensions in 1ml of physiological (0.9% NaCl) solution and were
exposed for 1, 3, and 7 days. Pure physiological solution instilled rats without ball-milled particles served as
controls. Major endpoints of this study were: i) dose/response intensity of pulmonary inflammation and
cytotoxicity and ii) histopathological evaluation of lung, spleen, heart, and liver tissues.
3. Results and discussion
Dynamometer Test
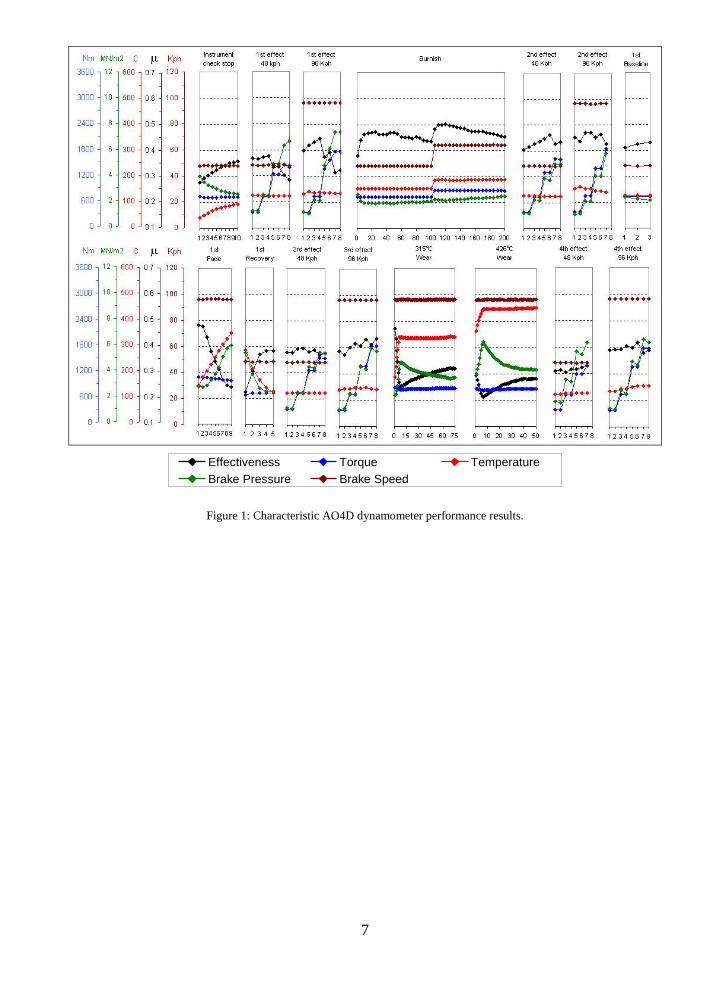
Characteristic performance data of brake linings run through the modified AO4D dynamometer test are
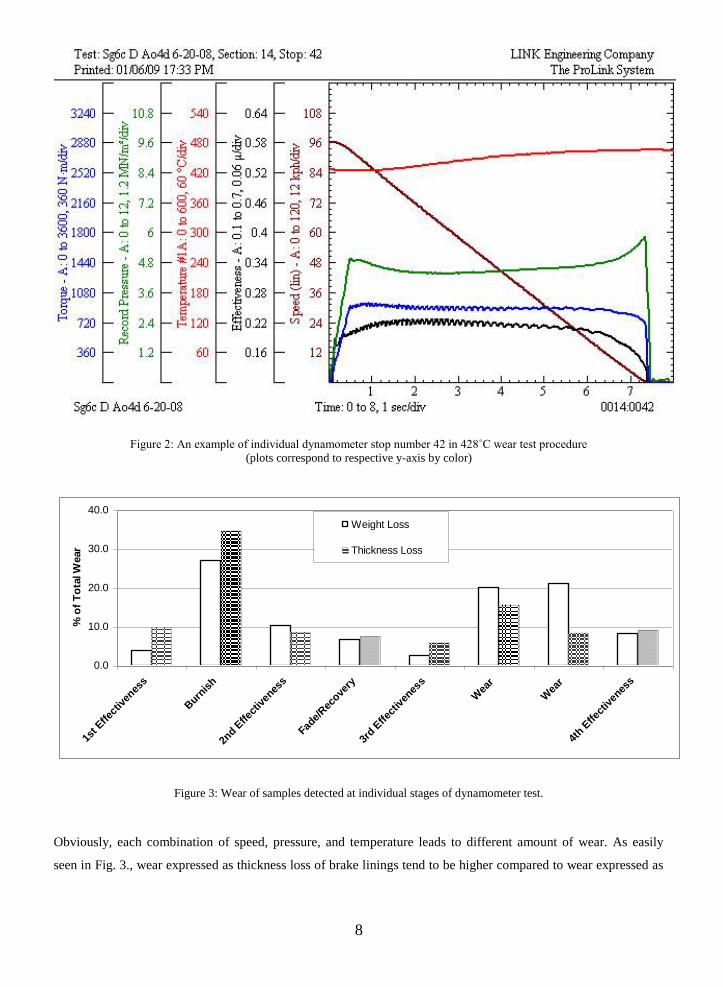
shown in Fig. 1, which plots the average values detected for individual stops (brake simulations). It has to be
noted that individual values of torque, pressure, temperature, speed, and friction effectiveness (effectiveness =
torque / (2 x hydraulic pressure in brake piston x pad area x effective radius)) vary during a single stop as
demonstrated in an example of a single stop given in Fig. 2. After one AO4D test, the average brake lining weight
loss was 7.94% of the original lining weight while the average thickness loss was 6.92% of the original lining
thickness. On average 18g of one pair of linings was lost after one AO4D test and only 2.5g of wear debris was
collected on average after one test. Samples do not wear linearly, however. Figure 3 shows amounts of wear
detected at the end of each testing procedure.
7
1 2 3 4 5 6 7 8
Effectiveness Torque Temperature
Brake Pressure Brake Speed
Figure 1: Characteristic AO4D dynamometer performance results.
8
Figure 2: An example of individual dynamometer stop number 42 in 428˚C wear test procedure
(plots correspond to respective y-axis by color)
0.0
10.0
20.0
30.0
40.0
1st E
ffec
tiven
ess
Burn
ish
2nd E
ffect
iven
ess
Fade/
Rec
overy
3rd E
ffec
tiven
ess
Wea
r
Wea
r
4th E
ffect
iven
ess
% o
f T
ota
l W
ear
Weight Loss
Thickness Loss
Figure 3: Wear of samples detected at individual stages of dynamometer test.
Obviously, each combination of speed, pressure, and temperature leads to different amount of wear. As easily
seen in Fig. 3., wear expressed as thickness loss of brake linings tend to be higher compared to wear expressed as
9
weight losses in majority of testing stages. Exceptions are the wear tests performed at elevated temperatures of
315 and 426C, respectively, and the 2nd effectiveness test, where mass losses increased considerably. In these
stages of testing, wear is dominated by oxidative processes and considerable amount of mass loss is due to
formation of volatile compounds. This is characteristic for high temperature braking scenarios when numerous
organic components (graphite, carbon, coke, rubber, and phenolic resin) interact with oxygen from ambient air.
Also vermiculite loses considerable amounts of water chemically bonded in (001) interplanar spaces [10]. On the
other hand, “mechanical” wear dominates at lower temperatures and wear expressed as thickness loss is higher
when compared to mass losses. Careful inspection of worn surfaces indicated that different amounts of total brake
pad surfaces are in direct contact with the cast iron discs at different stages of dynamometer testing. This can
obviously be ascribed to thermoelastic instabilities leading to thermal deformation of pads. The chemistry of
contacting areas also differs for different testing stages in dependence on applied testing conditions.
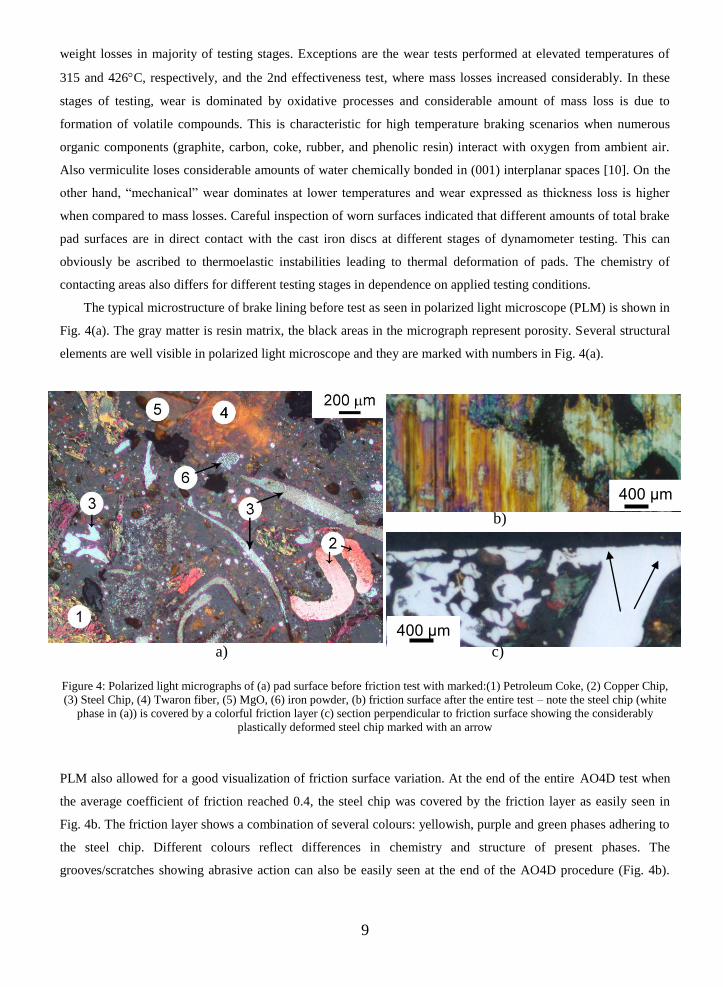
The typical microstructure of brake lining before test as seen in polarized light microscope (PLM) is shown in
Fig. 4(a). The gray matter is resin matrix, the black areas in the micrograph represent porosity. Several structural
elements are well visible in polarized light microscope and they are marked with numbers in Fig. 4(a).
b)
a) c)
Figure 4: Polarized light micrographs of (a) pad surface before friction test with marked:(1) Petroleum Coke, (2) Copper Chip,
(3) Steel Chip, (4) Twaron fiber, (5) MgO, (6) iron powder, (b) friction surface after the entire test – note the steel chip (white
phase in (a)) is covered by a colorful friction layer (c) section perpendicular to friction surface showing the considerably
plastically deformed steel chip marked with an arrow
PLM also allowed for a good visualization of friction surface variation. At the end of the entire AO4D test when
the average coefficient of friction reached 0.4, the steel chip was covered by the friction layer as easily seen in
Fig. 4b. The friction layer shows a combination of several colours: yellowish, purple and green phases adhering to
the steel chip. Different colours reflect differences in chemistry and structure of present phases. The
grooves/scratches showing abrasive action can also be easily seen at the end of the AO4D procedure (Fig. 4b).
400 µm
400 µm

10
Nevertheless, the adhesive wear mechanisms dominate the friction process. A perpendicular cross-section of a
steel chip heavily deformed in the adhesive friction process (see the arrow) is shown in Fig. 4(c).
We are using the term “friction layer” for description of the materials deposited on the friction surface. PLM
images clearly show that the friction layer is discontinuous and the chemistry of materials adhering to the friction
surface varies at different locations as evidenced by different colours (Fig. 4b). These findings further support
formerly published data by Filip [15] revealing the complex character of the “friction layer”. It is necessary to
note that the friction layer is called “friction film” by several authors [17, 18, 19], and it was also described as
“transfer layer” [20, 21], “transfer film” [22], “third body” layer [17, 23], “tribo-layer” [2], “tribofilm” [24],
“mechanically mixed layer” (MML) [25], and as “first and secondary plateaus” [16, 26]. Former work of Filip
[27] clearly demonstrated that the friction layer consists of very fine wear particulates that are pressed and sintered
together and chemistry of this layer can vary within one pad and also within one “patch”.
Most importantly, the inspection of brake lining surfaces at different stages of AO4D testing revealed that
every combination of temperature, pressure and sliding speed leads to formation of a specific friction layer having
its own chemistry and microstructure differing from microstructure and chemistry of phases present in the original
bulk materials (cast iron discs and semi-metallic pads in this case). These findings well correlate with earlier work
of Filip [10, 27] and were also supported by Eriksson and Jacobson [16] and Oesterle [17], although the last two
referenced authors did not show the complexity of the layer and its variation within one patch. Since the friction
layer most likely represents the major part of released wear particles, further analysis was performed. Two
examples are discussed below: one addressing the surfaces after entire AO4D procedure and the second focusing
on materials obtained after the fade stage of AO4D procedure. It has to be emphasized that it is necessary to
address the dominant areas which were in contact during friction, when analyzing the friction surface. They can be
identified by visual inspection or based on topography measurements.
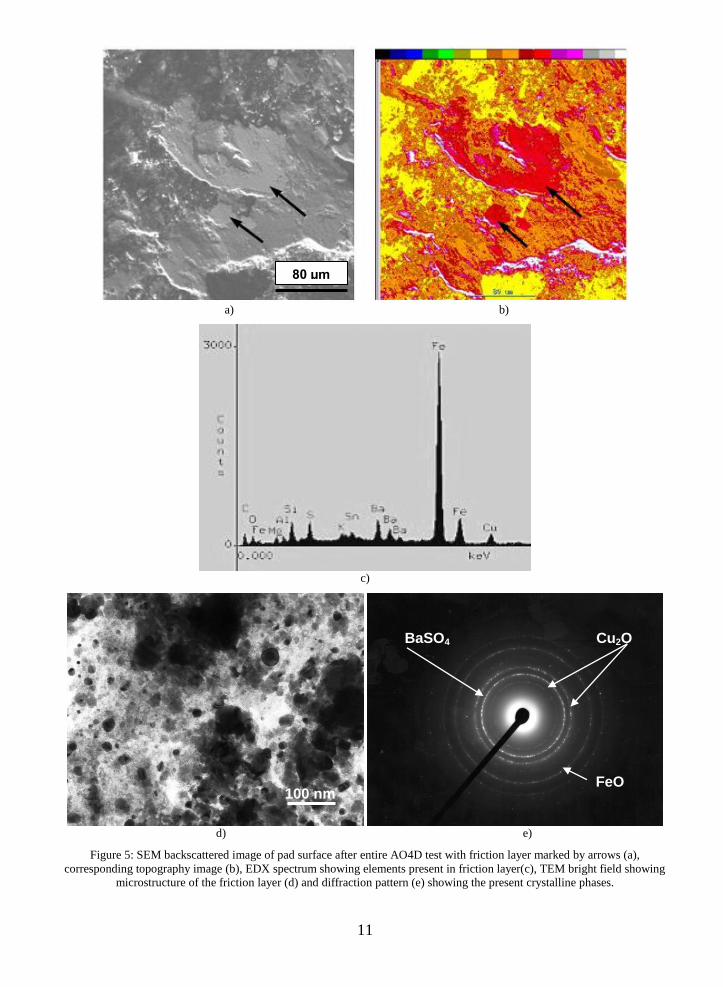
Figure 5(a) shows the characteristic SEM backscattered image of the surface of the pad after the completed
AO4D test, when the effectiveness (=friction level) value was ~0.4. Figure 5(b) is a corresponding surface
topography image showing that the majority of contact occurred on plastically deformed metallic chips (in this
case a steel chip) covered with a new matter: the friction layer. Since the chemistry of the friction layer differs
from the chemistry of the original chip, the friction layer can be easily identified in back scattered electron image
as brighter matter deposited on the chip. A majority of the particles forming the friction layer chemically react as
easily seen in Figs. 5(d) and (e) showing microstructure of characteristics friction layer and electron diffraction
pattern. Small crystalline particles in this layer are dominantly BaSO4, Cu and Fe oxides, nevertheless, there are
also amorphous particles, which will not diffract and hence will not be seen in diffraction patterns like Fig. 5(e).
Information about chemical composition of the friction layer is shown in Fig. 5(c). Based on EDX spectrum, it
can be easily seen that the friction layer also consists of alumina particles and charred carbonaceous constituents
(organic materials). A dominating adhesive wear mechanism is combined with abrasive wear, caused by hard
particulates forming grooves on the surface, and oxidative wear.
11
a) b)
c)
d) e)
Figure 5: SEM backscattered image of pad surface after entire AO4D test with friction layer marked by arrows (a),
corresponding topography image (b), EDX spectrum showing elements present in friction layer(c), TEM bright field showing
microstructure of the friction layer (d) and diffraction pattern (e) showing the present crystalline phases.
80 µm
100 nm
BaSO4 Cu2O
FeO
12
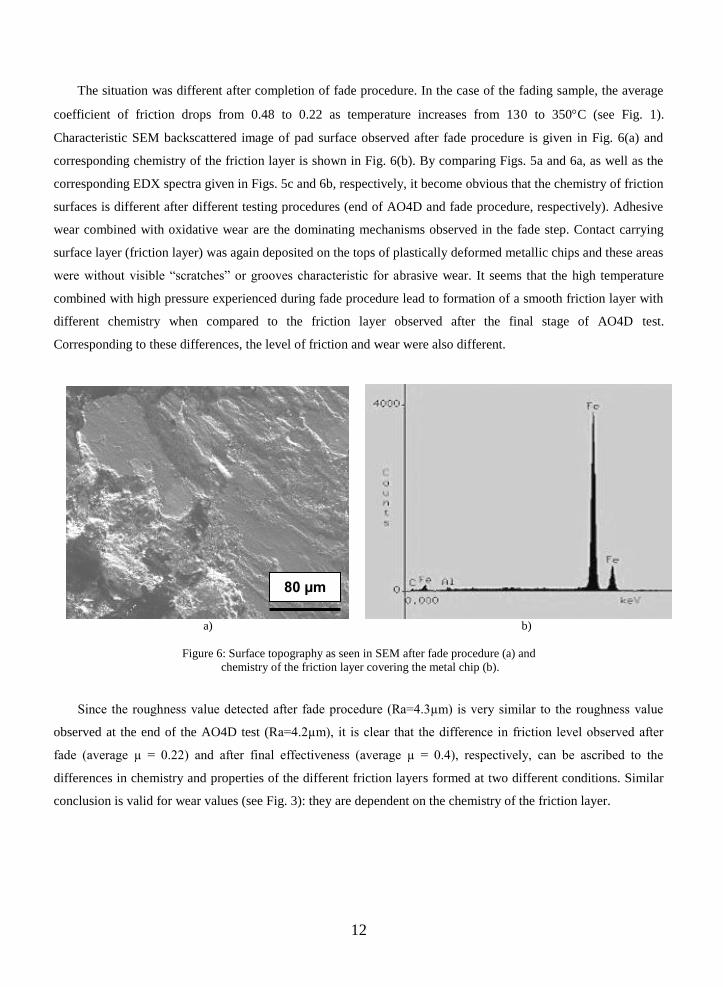
The situation was different after completion of fade procedure. In the case of the fading sample, the average
coefficient of friction drops from 0.48 to 0.22 as temperature increases from 130 to 350C (see Fig. 1).
Characteristic SEM backscattered image of pad surface observed after fade procedure is given in Fig. 6(a) and
corresponding chemistry of the friction layer is shown in Fig. 6(b). By comparing Figs. 5a and 6a, as well as the
corresponding EDX spectra given in Figs. 5c and 6b, respectively, it become obvious that the chemistry of friction
surfaces is different after different testing procedures (end of AO4D and fade procedure, respectively). Adhesive
wear combined with oxidative wear are the dominating mechanisms observed in the fade step. Contact carrying
surface layer (friction layer) was again deposited on the tops of plastically deformed metallic chips and these areas
were without visible “scratches” or grooves characteristic for abrasive wear. It seems that the high temperature
combined with high pressure experienced during fade procedure lead to formation of a smooth friction layer with
different chemistry when compared to the friction layer observed after the final stage of AO4D test.
Corresponding to these differences, the level of friction and wear were also different.
a) b)
Figure 6: Surface topography as seen in SEM after fade procedure (a) and
chemistry of the friction layer covering the metal chip (b).
Since the roughness value detected after fade procedure (Ra=4.3µm) is very similar to the roughness value
observed at the end of the AO4D test (Ra=4.2µm), it is clear that the difference in friction level observed after
fade (average µ = 0.22) and after final effectiveness (average µ = 0.4), respectively, can be ascribed to the
differences in chemistry and properties of the different friction layers formed at two different conditions. Similar
conclusion is valid for wear values (see Fig. 3): they are dependent on the chemistry of the friction layer.
80 µm
13
Wear Debris Analysis
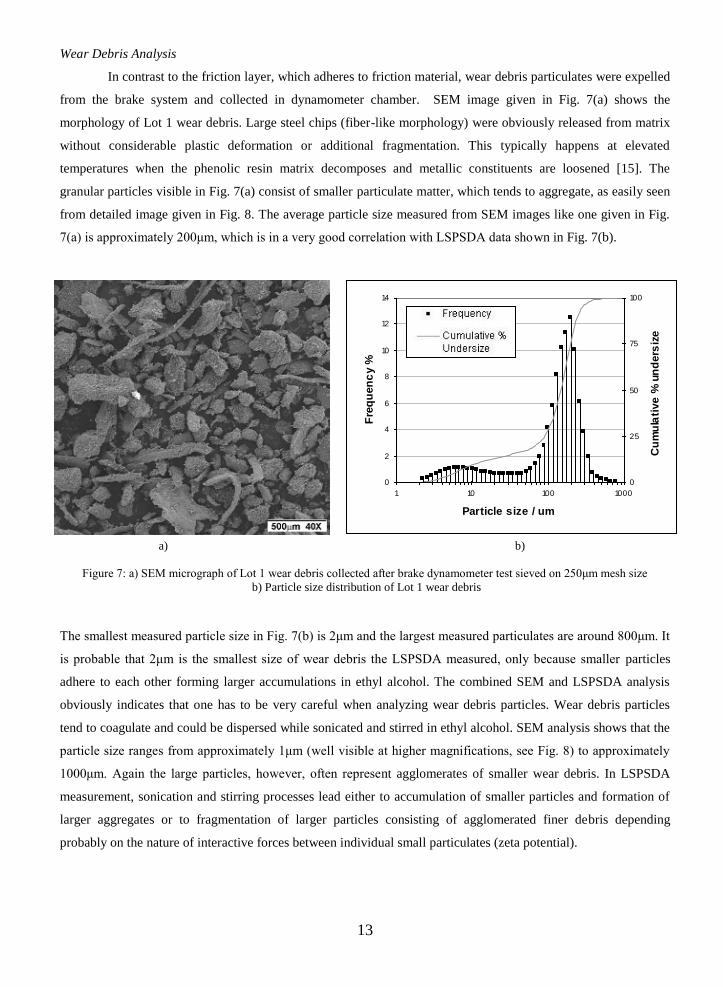
In contrast to the friction layer, which adheres to friction material, wear debris particulates were expelled
from the brake system and collected in dynamometer chamber. SEM image given in Fig. 7(a) shows the
morphology of Lot 1 wear debris. Large steel chips (fiber-like morphology) were obviously released from matrix
without considerable plastic deformation or additional fragmentation. This typically happens at elevated
temperatures when the phenolic resin matrix decomposes and metallic constituents are loosened [15]. The
granular particles visible in Fig. 7(a) consist of smaller particulate matter, which tends to aggregate, as easily seen
from detailed image given in Fig. 8. The average particle size measured from SEM images like one given in Fig.
7(a) is approximately 200μm, which is in a very good correlation with LSPSDA data shown in Fig. 7(b).
0
2
4
6
8
10
12
14
1 10 100 1000
Particle size / um
Fre
qu
en
cy %
0
25
50
75
100
Cu
mu
lati
ve
% u
nd
ers
ize
a) b)
Figure 7: a) SEM micrograph of Lot 1 wear debris collected after brake dynamometer test sieved on 250μm mesh size
b) Particle size distribution of Lot 1 wear debris
The smallest measured particle size in Fig. 7(b) is 2μm and the largest measured particulates are around 800μm. It
is probable that 2μm is the smallest size of wear debris the LSPSDA measured, only because smaller particles
adhere to each other forming larger accumulations in ethyl alcohol. The combined SEM and LSPSDA analysis
obviously indicates that one has to be very careful when analyzing wear debris particles. Wear debris particles
tend to coagulate and could be dispersed while sonicated and stirred in ethyl alcohol. SEM analysis shows that the
particle size ranges from approximately 1μm (well visible at higher magnifications, see Fig. 8) to approximately
1000μm. Again the large particles, however, often represent agglomerates of smaller wear debris. In LSPSDA
measurement, sonication and stirring processes lead either to accumulation of smaller particles and formation of
larger aggregates or to fragmentation of larger particles consisting of agglomerated finer debris depending
probably on the nature of interactive forces between individual small particulates (zeta potential).
14
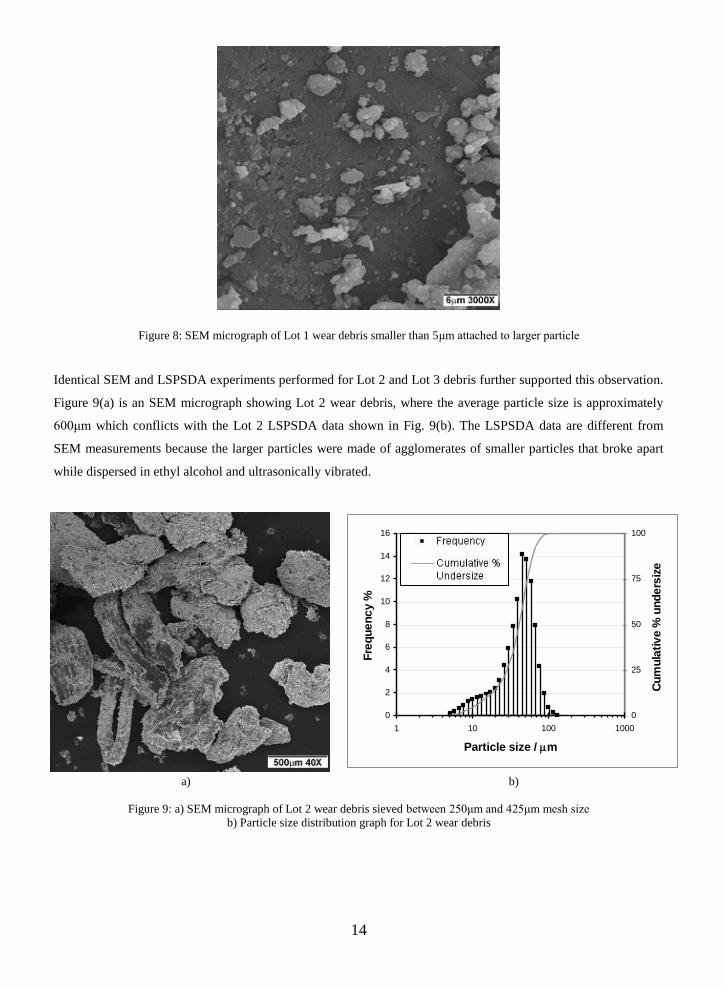
Figure 8: SEM micrograph of Lot 1 wear debris smaller than 5μm attached to larger particle
Identical SEM and LSPSDA experiments performed for Lot 2 and Lot 3 debris further supported this observation.
Figure 9(a) is an SEM micrograph showing Lot 2 wear debris, where the average particle size is approximately
600μm which conflicts with the Lot 2 LSPSDA data shown in Fig. 9(b). The LSPSDA data are different from
SEM measurements because the larger particles were made of agglomerates of smaller particles that broke apart
while dispersed in ethyl alcohol and ultrasonically vibrated.
0
2
4
6
8
10
12
14
16
1 10 100 1000
Particle size / m
Fre
qu
en
cy
%
0
25
50
75
100
Cu
mu
lati
ve
% u
nd
ers
ize
a) b)
Figure 9: a) SEM micrograph of Lot 2 wear debris sieved between 250μm and 425μm mesh size
b) Particle size distribution graph for Lot 2 wear debris
15
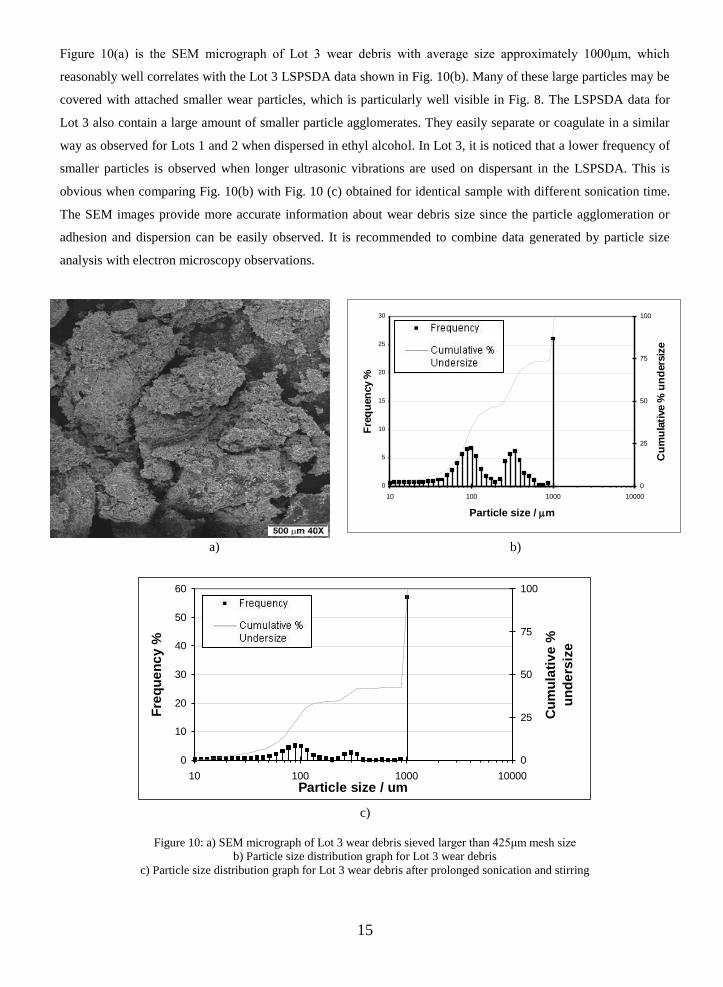
Figure 10(a) is the SEM micrograph of Lot 3 wear debris with average size approximately 1000μm, which
reasonably well correlates with the Lot 3 LSPSDA data shown in Fig. 10(b). Many of these large particles may be
covered with attached smaller wear particles, which is particularly well visible in Fig. 8. The LSPSDA data for
Lot 3 also contain a large amount of smaller particle agglomerates. They easily separate or coagulate in a similar
way as observed for Lots 1 and 2 when dispersed in ethyl alcohol. In Lot 3, it is noticed that a lower frequency of
smaller particles is observed when longer ultrasonic vibrations are used on dispersant in the LSPSDA. This is
obvious when comparing Fig. 10(b) with Fig. 10 (c) obtained for identical sample with different sonication time.
The SEM images provide more accurate information about wear debris size since the particle agglomeration or
adhesion and dispersion can be easily observed. It is recommended to combine data generated by particle size
analysis with electron microscopy observations.
0
5
10
15
20
25
30
10 100 1000 10000
Particle size / m
Fre
qu
en
cy %
0
25
50
75
100
Cu
mu
lati
ve %
un
ders
ize
a) b)
0
10
20
30
40
50
60
10 100 1000 10000
Particle size / um
Fre
qu
en
cy
%
0
25
50
75
100
Cu
mu
lati
ve
%
un
de
rsiz
e
c)
Figure 10: a) SEM micrograph of Lot 3 wear debris sieved larger than 425μm mesh size
b) Particle size distribution graph for Lot 3 wear debris
c) Particle size distribution graph for Lot 3 wear debris after prolonged sonication and stirring
16
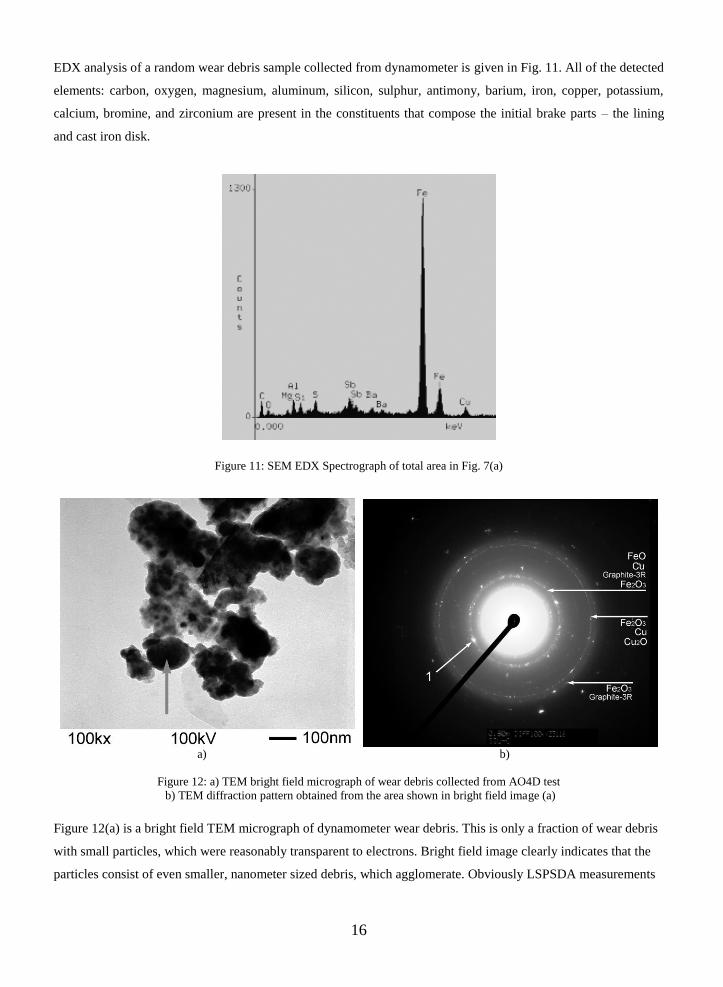
EDX analysis of a random wear debris sample collected from dynamometer is given in Fig. 11. All of the detected
elements: carbon, oxygen, magnesium, aluminum, silicon, sulphur, antimony, barium, iron, copper, potassium,
calcium, bromine, and zirconium are present in the constituents that compose the initial brake parts – the lining
and cast iron disk.
Figure 11: SEM EDX Spectrograph of total area in Fig. 7(a)
a) b)
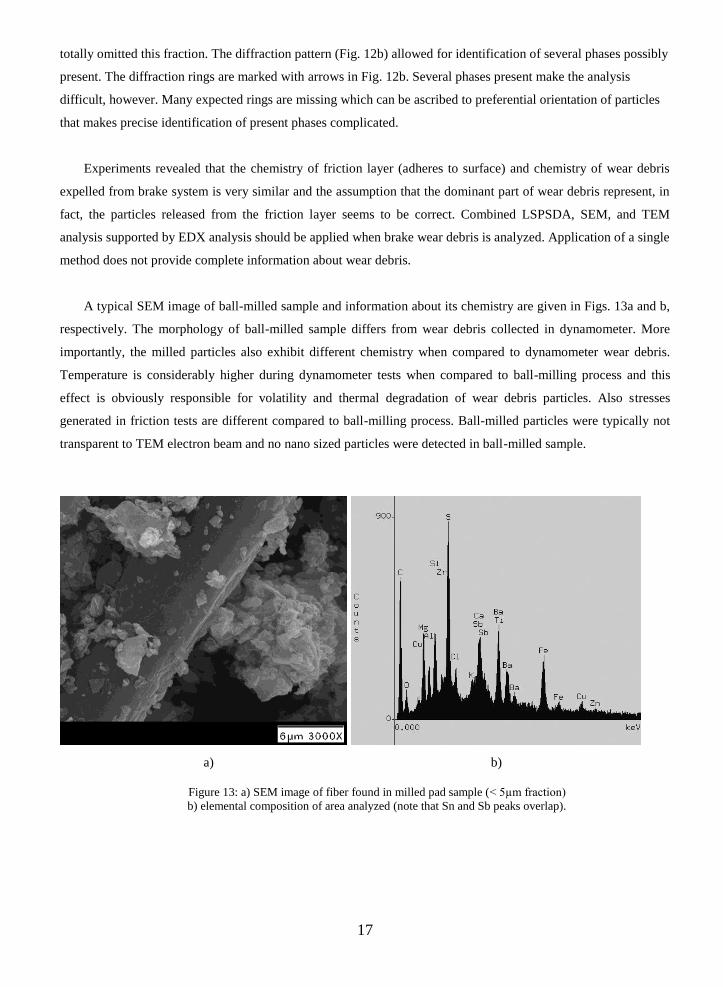
Figure 12: a) TEM bright field micrograph of wear debris collected from AO4D test
b) TEM diffraction pattern obtained from the area shown in bright field image (a)
Figure 12(a) is a bright field TEM micrograph of dynamometer wear debris. This is only a fraction of wear debris
with small particles, which were reasonably transparent to electrons. Bright field image clearly indicates that the
particles consist of even smaller, nanometer sized debris, which agglomerate. Obviously LSPSDA measurements
17
totally omitted this fraction. The diffraction pattern (Fig. 12b) allowed for identification of several phases possibly
present. The diffraction rings are marked with arrows in Fig. 12b. Several phases present make the analysis
difficult, however. Many expected rings are missing which can be ascribed to preferential orientation of particles
that makes precise identification of present phases complicated.
Experiments revealed that the chemistry of friction layer (adheres to surface) and chemistry of wear debris
expelled from brake system is very similar and the assumption that the dominant part of wear debris represent, in
fact, the particles released from the friction layer seems to be correct. Combined LSPSDA, SEM, and TEM
analysis supported by EDX analysis should be applied when brake wear debris is analyzed. Application of a single
method does not provide complete information about wear debris.
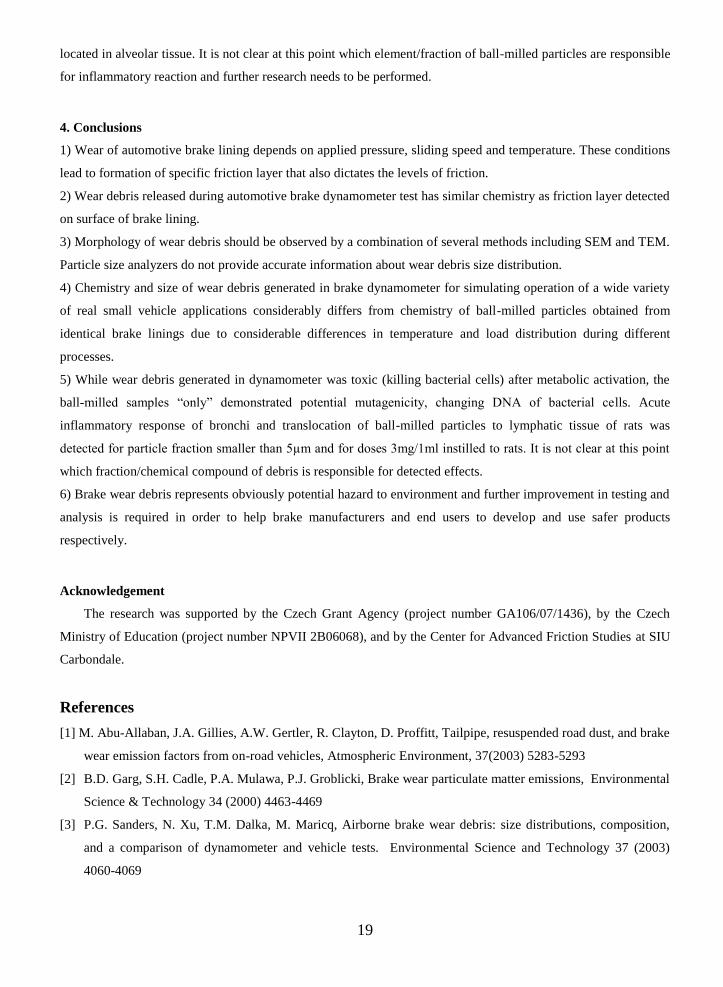
A typical SEM image of ball-milled sample and information about its chemistry are given in Figs. 13a and b,
respectively. The morphology of ball-milled sample differs from wear debris collected in dynamometer. More
importantly, the milled particles also exhibit different chemistry when compared to dynamometer wear debris.
Temperature is considerably higher during dynamometer tests when compared to ball-milling process and this
effect is obviously responsible for volatility and thermal degradation of wear debris particles. Also stresses
generated in friction tests are different compared to ball-milling process. Ball-milled particles were typically not
transparent to TEM electron beam and no nano sized particles were detected in ball-milled sample.
a) b)
Figure 13: a) SEM image of fiber found in milled pad sample (< 5µm fraction)
b) elemental composition of area analyzed (note that Sn and Sb peaks overlap).

18
Mutagenicity
The extracts of ball-milled particles and wear debris generated in dynamometer contained 5.4 and 8.5mg of
extractable organic matter per millilitre of dimethylsulphoxide, respectively. Table 3 summarizes the results of
mutagenic potency of ball-milled particulates and dynamometer wear debris extracts using Ames test and SOS
Chromotest without (S9-) and with (S9+) metabolic activation.
Table 3: Results of mutagenicity tests with (S9+) and without (S9-) metabolic activation
Sample Ames test SOS chromotest
S9- S9+ S9- S9+
Milled pad negative negative negative positive
Wear debris negative negative negative toxic
Without metabolic activation no mutagenic potency was detected for both sample types (ball-milled and
dynamometer wear debris) using the Ames test. However, the SOS Chromotest revealed the milled pad sample to
be potentially mutagenic after biotransformation due to significant increase of SOSIP in the S9+ test which
revealed the presence of indirect mutagens in the extract causing DNA damage. The dynamometer wear debris is
toxic to E. coli strain after metabolic activation. Bacterial cells were killed by a toxic component of the
dynamometer wear debris extract in the SOS Chromotest, therefore no mutagenicity could be observed.
Apparently the different response to ball-milled and wear debris particles has to be ascribed to the chemical
changes occurring when friction layer and consequently wear debris forms. Copper is able to form complexes
with numerous inorganic and organic ligands and it is well known that the phenolic groups form complexes with
copper [28]. Hence, organocopper compounds dissolved in DCM might be responsible for toxicity observed in the
SOS Chromotest. Hur et. al [29] analyzed copper from brake wear debris obtained from a brake dynamometer test
of a semi-metallic brake pad and when an oxidant (HNO3 and hydrogen peroxide) was added, approximately 10 %
of total copper was dissolved. This finding may indicate possible presence of organocopper in brake wear debris.
Further analysis has to be performed to identify the exact character of chemicals released from brakes and to
correlate these preliminary finding with potential impact on humans.
Pulmonary toxicity test
Only the fraction smaller than 5µm of ball-milled pad was used for pulmonary toxicity testing, because only
particles smaller than 5µm can enter alveolar region of lungs. Exposure to low doses (0.5 and 1mg) of ball-milled
pad particles produced slight pulmonary clearance response without damage of lung tissue. The doses of 3mg
induced much more intensive clearance response of alveolar macrophages associated with particle translocation to
lymphatic tissue and regional lymphatic nodes. However, significant portion of free particles still retained in
alveolar tissue and strong inflammatory reaction in bronchial branch was observed. Strong cell reaction was also
19
located in alveolar tissue. It is not clear at this point which element/fraction of ball-milled particles are responsible
for inflammatory reaction and further research needs to be performed.
4. Conclusions
1) Wear of automotive brake lining depends on applied pressure, sliding speed and temperature. These conditions
lead to formation of specific friction layer that also dictates the levels of friction.
2) Wear debris released during automotive brake dynamometer test has similar chemistry as friction layer detected
on surface of brake lining.
3) Morphology of wear debris should be observed by a combination of several methods including SEM and TEM.
Particle size analyzers do not provide accurate information about wear debris size distribution.
4) Chemistry and size of wear debris generated in brake dynamometer for simulating operation of a wide variety
of real small vehicle applications considerably differs from chemistry of ball-milled particles obtained from
identical brake linings due to considerable differences in temperature and load distribution during different
processes.
5) While wear debris generated in dynamometer was toxic (killing bacterial cells) after metabolic activation, the
ball-milled samples “only” demonstrated potential mutagenicity, changing DNA of bacterial cells. Acute
inflammatory response of bronchi and translocation of ball-milled particles to lymphatic tissue of rats was
detected for particle fraction smaller than 5µm and for doses 3mg/1ml instilled to rats. It is not clear at this point
which fraction/chemical compound of debris is responsible for detected effects.
6) Brake wear debris represents obviously potential hazard to environment and further improvement in testing and
analysis is required in order to help brake manufacturers and end users to develop and use safer products
respectively.
Acknowledgement
The research was supported by the Czech Grant Agency (project number GA106/07/1436), by the Czech
Ministry of Education (project number NPVII 2B06068), and by the Center for Advanced Friction Studies at SIU
Carbondale.
References
[1] M. Abu-Allaban, J.A. Gillies, A.W. Gertler, R. Clayton, D. Proffitt, Tailpipe, resuspended road dust, and brake
wear emission factors from on-road vehicles, Atmospheric Environment, 37(2003) 5283-5293
[2] B.D. Garg, S.H. Cadle, P.A. Mulawa, P.J. Groblicki, Brake wear particulate matter emissions, Environmental
Science & Technology 34 (2000) 4463-4469
[3] P.G. Sanders, N. Xu, T.M. Dalka, M. Maricq, Airborne brake wear debris: size distributions, composition,
and a comparison of dynamometer and vehicle tests. Environmental Science and Technology 37 (2003)
4060-4069
20
[4] O. Uexküll, S. Skerfving, R. Doyle, M. Braungart, Antimony in brake pads – a carcinogenic component?
J.Cleaner Production, 13 (2005) 19-31
[5] Brake Pad Partnership, Copper Released from Brake Lining Wear in the San Francisco Bay Area, 2006.
http://www.suscon.org/brakepad/documentArchive.asp
[6] Brake Pad Partnership, Characterization of Airborne Brake Wear Debris, Final Report, 2006.
http://www.suscon.org/brakepad/pdfs/ADPSDAmendedFinalReport(Jan2006).pdf
[7] R.A. Peters, Environmental Effects of Copper in Brake Pad Wear Debris, Brake Pad Partnership, Brake
Colloquium & Exhibition, Oct. 12-15, 2008. San Antonio, Texas, USA
[8] M. Riediker, R.B. Devlin, T.R. Griggs, M.C. Herbst, P.A. Bromberg, R.W. Williams, W.E. Cascio,
Cardiovascular effects in patrol officers are associated with fine particulate matter from brake wear and
engine emissions, Particle Fibre Toxicol. 1 (2004) 2-12
[9] V. Roubicek, H. Raclavska, D. Juchelkova, P. Filip, Wear and environmental aspects of composite materials
for automotive braking industry. Wear 265 (2008) 167-175
[10] P. Filip, Friction and wear of polymer matrix composite materials for automotive braking industry,
International Conference Braking 2002, Leeds UK, Professional Engineering Publishing, London, UK, 2002,
341 -354.
[11] B.N. Ames, J. McCann, E. Yamasaki, Methods for detecting carcinogens and mutagens with the Salmonella /
mammalian-microsome mutagenicity test, Mutat. Res., 31 (1975) 347-364
[12] L.H. Broekhoven, E.R. Nestmann, Statistical analysis of the Salmonella mutagenicity assay. In: D. Krewski
and C. Franklin (Ed.), Statistics in Toxicology, Gordon and Breach Science Publishers, Amsterdam, the
Netherlands pp. 28–34, 1991.
[13] P. Quillardet, C. DeBellecombe, M. Hofnung, The SOS Chromotest, a colorimetric bacterial assay for
genotoxins: validation study with 83 compounds, Mutat. Res. 147 (1985) 79-95
[14] D.M. Maron, B.N. Ames, Revised methods for the Salmonella mutagenicity test. Mutat. Res., 113 (1983)
173-215
[15] K.W. Hee, P. Filip, Performance of ceramic enhanced phenolic matrix brake lining materials for automotive
brake linings, Wear 259 (2005) 1088-1096
[16] M. Eriksson, S. Jacobson, Tribological surfaces of organic brake pads, Trib. Int. 33 (2000) 817-827.
[17] W. Osterle, I. Urban, Friction layers and friction films on PMC brake pads, Wear 257 (2004) 215-226
[18] H. Jang, S.J. Kim, The effects of antimony trisulphide (Sb2S3) and zirconium silicate (ZrSiO4) in the
automotive brake friction material on friction characteristics. Wear 239 (2000) 229-236.
[19] M.G. Jacko, P.H.S. Tsang, S.K. Rhee, Wear debris compaction and friction film formation of polymer
composites, Wear 133 (1989) 23-38.
[20] S. Bahadur, The development of transfer layers and their role in polymer tribology, Wear 245 (2000) 92-99.
[21] M.H. Cho, K.H. Cho, S.J. Kim, D.H. Kim, H. Jang, The role of transfer layers on friction characteristics in
the sliding interface between friction materials against gray iron brake disks, Trib. Lett. 20 (2005) 101-108.
21
[22] A. Wirth, R. Whitaker, An energy dispersive x-ray and imaging x-ray photoelectron spectroscopical study of
transfer film chemistry and its influence on friction coefficient, J. Phys. D: Phys. 25 (1992) 38-43.
[23] A. Wirth, D. Eggleston, R. Whitaker, A fundamental tribochemical study of the third body layer formed
during automotive friction braking, Wear 179 (1994) 75-81.
[24] S. Jacobson, S. Hogmark, Surface modifications in tribological contacts, Wear (2008), doi: 10.
1016/j.wear.2008.04.035.
[25] A. Kapoor, F.J. Franklin, Tribological layers and the wear of ductile materials, Wear 245 (2000) 204-215.
[26] M. Eriksson, F. Bergman, S. Jacobson, On the nature of tribological contact in automotive brakes, Wear 252
(2002) 26-36.
[27] P. Filip, M. A. Wright: Formulation–Performance Relationships in Phenolic Resin Matrix Composite
Materials for Friction Applications, Quarterly Report to The Center for Advanced Friction Studies, Vol. 1,
number 2, December 1996, pp. 35 – 98.
[28] K.T. Kim, Y.G. Lee, S.D. Kim, Combined toxicity of copper and phenol derivatives to Daphnia magna:
Effect of complexation reaction, Environ. Int. 32 (2006) 487-492
[29] J. Hur, S. Yim, M.A. Schlautman, Copper leaching from brake wear debris in standard extraction solutions, J.
Environ. Monit. 5 (2003) 837-843.