
Weak-Form Efficiency Testimony of Dhaka Stock Exchange
28
Electronic copy of this paper is available at: http://ssrn.com/abstract=940811 1 Weak-form Efficiency: Testimony of Dhaka Stock Exchange Shofiqur Rahman * Mohammad Farhad Hossain ** Abstract: The focus of this paper is to seek evidence whether Dhaka Stock Exchange (DSE) is efficient in the weak form or not by hypothesizing normality of the distribution series and random walk assumption. Both non-parametric tests [(Kolmogrov-Smirnov goodness of fit test), run test, Lilliefors test], Q-Q probability plots and parametric-tests [Auto-correlation coefficient test and ARIMA (0,1,0) for testing random walk model] have been used. Each statistical test has been performed separately on two data sets. The data sets include daily All-Share Price Indices (ASPI) and DSE General Price Indices (DSE-GEN) for 12 years ranging from 1994 to 2005. In addition, daily stock price data for 33 companies have been used. The daily return series, in the aspect of skewness and kurtosis, were found non- normal, which can be categorized as positively skewed distribution. Same thing resulted from Kolmogorov-Smirnov (K-S) test. As a result, null hypothesis of normality has been rejected and alternative hypothesis remained in effect. Run test and auto-correlation results rejected the randomness of the return series of DSE simultaneously. Overall results from the empirical analysis suggest that the Dhaka Stock Market of Bangladesh is not efficient in weak-form. INTRODUCTION Capital market efficiency has been a debatable issue since its inception. After Bachelier (1900), several researchers tried to reach a solid conclusion on it but could not. Because, efficiency, on a large extent depends on investment patterns, structure of market, investors’ risk appetite and practice etc. Unlike past security prices, all other factors make a capital market more vibrant. As a result, market efficiency has still become within the continuum of hypothesis. The concept of efficiency is extremely important in finance because the hypothesis that securities markets are efficient represents the basis for most research that is made in financial economics. For managers, efficient market implies that they can receive a “fair value” for the securities they sell and they can implement their goal of maximization of shareholders’ wealth by focusing on the effect each decision will * Lecturer in Finance, Faculty of Business, Northern University, Dhaka, Bangladesh ** Associate Professor, Faculty of Business Administration, American International University - Bangladesh
-
Upload
momenul-islam-mridha-murad -
Category
Documents
-
view
15 -
download
2
description
Case Study
Transcript of Weak-Form Efficiency Testimony of Dhaka Stock Exchange
Electronic copy of this paper is available at: http://ssrn.com/abstract=940811
1
Weak-form Efficiency: Testimony of Dhaka Stock Exchange
Shofiqur Rahman*
Mohammad Farhad Hossain**
Abstract: The focus of this paper is to seek evidence whether Dhaka Stock Exchange (DSE) is efficient in the weak form or not by hypothesizing normality of the distribution series and random walk assumption. Both non-parametric tests [(Kolmogrov-Smirnov goodness of fit test), run test, Lilliefors test], Q-Q probability plots and parametric-tests [Auto-correlation coefficient test and ARIMA (0,1,0) for testing random walk model] have been used. Each statistical test has been performed separately on two data sets. The data sets include daily All-Share Price Indices (ASPI) and DSE General Price Indices (DSE-GEN) for 12 years ranging from 1994 to 2005. In addition, daily stock price data for 33 companies have been used. The daily return series, in the aspect of skewness and kurtosis, were found non-normal, which can be categorized as positively skewed distribution. Same thing resulted from Kolmogorov-Smirnov (K-S) test. As a result, null hypothesis of normality has been rejected and alternative hypothesis remained in effect. Run test and auto-correlation results rejected the randomness of the return series of DSE simultaneously. Overall results from the empirical analysis suggest that the Dhaka Stock Market of Bangladesh is not efficient in weak-form.
INTRODUCTION
Capital market efficiency has been a debatable issue since its inception. After Bachelier
(1900), several researchers tried to reach a solid conclusion on it but could not. Because,
efficiency, on a large extent depends on investment patterns, structure of market,
investors’ risk appetite and practice etc. Unlike past security prices, all other factors make
a capital market more vibrant. As a result, market efficiency has still become within the
continuum of hypothesis. The concept of efficiency is extremely important in finance
because the hypothesis that securities markets are efficient represents the basis for most
research that is made in financial economics. For managers, efficient market implies that
they can receive a “fair value” for the securities they sell and they can implement their
goal of maximization of shareholders’ wealth by focusing on the effect each decision will
* Lecturer in Finance, Faculty of Business, Northern University, Dhaka, Bangladesh ** Associate Professor, Faculty of Business Administration, American International University - Bangladesh

Electronic copy of this paper is available at: http://ssrn.com/abstract=940811
2
have on the share price. Another implication of efficient markets is that creative
accounting will not result in price changes because accounting manipulations do not affect
cash flows, thus they are not reflected in prices. EMH also has strong implications for
security analysts. When future returns cannot be predicted from past returns, trading based
on an examination of the sequence of past prices becomes worthless. If the semi-strong
form of the hypothesis is supported, then financial analysts cannot devise trading rules
based on publicly available information. Most of the researches on the capital market
efficiency are concentrated on the major stock markets of the world (Summers (1986),
Fama and French (1988), Lo and MacKinlay (1988) and Poterba and Summers (1988)).
The focus of this study is to testify the efficiency of Dhaka Stock Exchange. The purpose
of this research is to seek evidence whether Dhaka Stock Exchange (DSE) is efficient in
the weak form or not. Before starting the discussion of the study finding, a discussion on
previous empirical studies would be
CONCEPTUAL FOUNDATION AND EVOLUTION OF EMH The concept of efficiency is central to finance. Market efficiency is a term that is used in
many contexts with many different meanings. For example, there can be informational
efficiency or operational efficiency. Economists refer to operational efficiency as
emphasizing the way resources are employed to facilitate the operation of the market. This
study is concerned with the informational efficiency only.
With respect to an information item (termed φa), a capital market is termed “efficient”
only if the prices of capital market securities fully impound the return implications of that
item. This definition can be expressed as: ƒ(Ri,t, Rj,t … … … ⏐ φMt-1) = ƒ( Ri,t, Rj,t … … …
⏐ φMt-1, φa
t-1), where ƒ(.) = a probability distribution function, Ri,t = the return on security i
in period t, φMt-1 = the information set used by the market at t – 1, φa
t-1 = the specific
information item placed in the public domain at t – 1. Defining market efficiency in this
way has two important implications, such as (1) an investor cannot use φat-1 to earn
nonzero abnormal return, and (2) in an efficient market, when a new information item is
added to the information set, φM, its revaluation implications for ƒ( Ri,t, Rj,t, … … ) are
instantaneously and unbiasedly impounded into the current market price.

3
The concept of market efficiency was originally anticipated by Bachelier (1900). There
were subsequent works such as Working (1934), Cowles and Jones (1937), Kendall
(1953). But Bachelier’s contribution receives more highlights after it was published in
English by Cootner (1964). Fama (1965) was, however, the first to use the term “efficient
market. Fama extended the process of formalizing the concept of ‘efficiency’ in economic
terms by defining an efficient market as one in which prices always fully reflects available
information. Fama (1970) stated that the sufficient – but not necessary – conditions for
efficiency are: (i) there are no transaction costs in trading securities; (ii) all available
information is costlessly available to all market participants, and (iii) all agree on the
implications of current information for the current price and distributions of future prices
of each security. In his review of literature, Fama (1970) divided his work on efficient
market into three categories depending on the types of information and how quickly this
information is impounded in prices: (1) weak-form EMH, (2) semi-strong EMH, and (3)
strong-form EMH. This classification was the first recognition that efficiency must be
defined with respect to a particular information set. Weak-form efficiency exists if security
prices fully reflect all the information contained in the history of past prices and returns. If
capital markets are weak-form efficient, then investors can earn excess profits from
trading rules based on past prices or returns. Under semistrong-form efficiency, security
prices fully reflect all public information. Thus, only traders with access to nonpublic
information (some corporate insiders) can earn excess profits. However, in semistrong-
form efficiency, the market reacts so quickly to the release of new information that there
are no profitable trading opportunities based on public information. Finally, under strong-
form efficiency, all information, even apparent company secrets, are incorporated in
security prices; thus, no investor can earn excess profit trading on public or nonpublic
information.
Fama’s (1970) review has stimulated a definitional debate that extended for almost two
decades. LeRoy (1976) criticized Fama’s definition of market efficiency, because it allows
any feasible set of return definition to be consistent with efficiency. Fama (1976) revised
the definition by requiring that ‘the market correctly uses all available information’ and
thus the joint distribution of future prices established by the market is identical to the
‘correct’ distribution implied by all available information at that time. Fama (1991)
reviewed again the literature on EMH but changed the previous classification to reflect the
new trend in academic research. He replaced the weak-form efficiency with tests for

4
predictability of returns, the semi-strong form with the event studies and the strong-form
with tests of private information.
EMPIRICAL EVIDENCE ON WEAK-FORM EFFICIENCY
There are two competing schools of thought about market efficiency. On the one hand,
one of them argues that markets are efficient and returns are unpredictable. Fama (1970)
summarizes the early works, which largely conclude that the stock market is efficient. On
the other hand, the works of Summers (1986), Keim (1988), Fama and French (1988), Lo
and MacKinlay (1988) and Poterba and Summers (1988), among others, document
empirical evidence of ‘anomalies’ that appeared to contradict the theory of efficient
markets. Among other findings, Stocks returns are found to be abnormally high during the
first few days of January (January effect) and negative from the close of trading on Friday
to the close of trading on Monday (Monday effect). Moreover, stocks with low price-
earnings ratios have higher average risk-adjusted returns than other stocks and smaller
companies generate substantially higher risk-adjusted abnormal returns than larger firms
(The Size effect). The existence or absence of a random walk nature in stock prices has
important implications. Indeed, if the stock return dynamics do not follow a random
process then it is possible to design a profitable trading strategy based on historical stock
prices.
The early studies on testing weak form efficiency started on the developed market,
generally agree with the support of weak-form efficiency of the market considering a low
degree of serial correlation and transaction cost (Working, 1934; Kendall, 1943, 1953;
Cootner, 1962; Osborne, 1962; Fama, 1965). All of the studies support the proposition that
price changes are random and past changes were not useful in forecasting future price
changes particularly after transaction costs were taken into account. However, there are
some studies, which found the predictability of share price changes (for example, Fama
and French, 1988; Poterba and Summers, 1988) in developed markets but they did not
reach to a conclusion about profitable trading rules. Poterba and Summers (1988) suggest
that noise trading, trading by investors whose demand for shares is determined by factors
other than their expected returns, provides a plausible explanation for the transitory
component in stock prices. Hudson, Dempsey and Keasey (1994) found that the technical
trading rules have predictive power but not sufficient to enable excess return in U.K
market. Similarly, Nicolaas, (1997) also conclude that past returns have predictive power
in Australian market but the degree of predictability of return is not so high. Overall, the

5
empirical studies on developed market show no profitability from using past records of
price series supports the weak-form efficiency of the EMH in general.
On the other hand, the research findings of weak-form efficiency on the market of
developing and less developed markets are controversial. Most of the less developed
market suffers with the problem of thin trading. In addition, in smaller markets, it is easier
for large traders to manipulate the market. Though it is generally believed that the
emerging markets are less efficient, the empirical evidence does not always support the
thought. There are two groups of findings; the first group finds weak-form efficiency in
developing and less developed markets [Branes (1986) on the Kuala Lumpur Stock
Exchange; Chan, Gup and Pan (1992) in major Asian markets; Dickinson and Muragu
(1994) on the Nairobi Stock Exchange; and Ojah and Karemera (1999) on the four Latin
American countries markets] despite the problems of thin trading. On the other hand, the
latter group, who evidenced that the market of developing and less developed markets are
not efficient in weak-sense are Cheung, Wong and Ho, (1993) on the stock market of
Korea and Taiwan. In a world bank study, Claessens, Dasgupta and Glen (1995) report
significant serial correlation in equity returns from 19 emerging markets and suggest that
stock prices in emerging markets violates weak form EMH; similar findings are reported
by Harvey (1994) for most emerging markets. Kababa (1998) has examined the behaviour
of stock price in the Saudi financial market seeking evidence that for weak-form efficiency
and find that the market is not weak-form efficient. He explained that the inefficiency
might be due to delay in operations and high transaction cost, thinness of trading and
illiquidity in the market. Roux and Gilberson (1978) and Poshakwale (1996) find the
evidence of non-randomness stock price behaviour and the market inefficiency (not weak-
form efficient) on the Johannesburg stock Exchange and on the Indian market.
Empirical Analysis on Dhaka Stock Exchange (DSE)
Several studies were performed on market return series of Dhaka Stock Exchange (DSE)
in previous years. Most of them are concerned with market efficiency especially weak
form. A study by Ahmed (2002) revealed that the behavior of stock prices can not be
described as obeying the random walk theory rather they follow some dependencies.
Ljung-Box statistic is used for the period from January 1990 through April 2001 and for
two sub-periods. The first sub-period is characterized with positive autocorrelation in
contrast to the second sub-period and full period where dominance of negative
6
autocorrelation is observed. The results also suggest that it may take close to one month
for new information to be completely incorporated into stock prices on DSE. Chowdhury,
Sadique, and Rahman (2001) investigates the mean daily returns of DSE around the turn
of the week, turn of the month, turn of the year, and around the holidays. Using the
dummy variable regression model, they found that there is robust evidence of seasonal
return regularities. Regarding the days of the week effect the findings of this study are:
Average return on the last trading day of the week produces significant negative return (at
10% level), no significant abnormal returns on the last day of the week (5% level), no
significant average return on the opening day of the week, Mondays produce persistent
significant average negative returns. In their study, the researchers used market index,
which is very common and widely used, to find out the calendar effect. Hossain (2004),
using a different methodology, finds that when portfolios of bank stocks are constructed
on day one of the week with the opening prices and sold on Monday or the last day of the
week, there is considerable chance that the portfolio will provide significantly higher mean
daily return (MDR). Even when the portfolios were produced randomly, the MDRs came
as significantly higher in D1M (buy on day one of the week and sell on Monday of the
same week) and D6M (buy on day six of the week and sell on next Monday) strategies.
According to Hassan, Islam and Basher (2000), DSE equity returns show positive
skewness of 0.11 and 22.93 (excluding July 1, 1996 - December 31, 1996), excess kurtosis
of 49.66 and 992.65 (excluding 1996) and deviation from normality. Total sample period
was September 1986 - November 1999 and the two sub-periods of September 1986 –
December 1990 and January 1991 – November 1999. The returns display significant serial
correlation of -0.07, implying stock market inefficiency. The results also show a
significant relationship between conditional volatility and the stock returns, but the risk-
return parameter is negative (-0.1072) and statistically significant. Mobarek (2000) sought
evidence supporting existence of at least weak-form efficiency of DSE. The sample
included the daily price indices of all listed securities on the DSE for the period of 1988 to
1997. The results provide evidence that the share return series do not follow random walk
model and the significant autocorrelation co-efficient at different lags reject the null
hypothesis of weak-form efficiency. Kader and Rahman (2004), by basically using k%
filter rule, find that abnormal profit is possible on regular basis by trading at a specific
pattern, which violates the random walk hypothesis.
METHODOLOGY

7
This paper gives an indication of the efficiency of the Dhaka stock market. We have
chosen only to test efficiency of the Dhaka Stock market in weak form. There are several
statistical tools to carry out such a study. The early tests about market efficiency
examined serial correlations of daily and weekly stock returns, which largely conclude that
the stock market is efficient. i. e., the stock prices follows a randomly process. For
example, Fama (1965) examined serial correlation coefficients for successive price
changes and had concluded that the behavior of the stock prices follows a randomly
process that was labeled as the random walk model. The hypothesis of a pure random walk
model is given as pt = α + pt-1+ εt , where pt is the natural logarithm of the securities price
series under consideration at time t, α is a drift parameter and εt is the random error term.
The usual stochastic assumptions of ε is that E(ε) = 0 and E(ε2) = σ2.
Summers (1986) challenges the way as the efficient market hypothesis is tested in the
early tests. He argues that the commonly used tests to evaluate market efficiency have
very low power. If a market is inefficient it means that prices have slowly decaying
stationary components. He shows that serial correlations of short-horizon returns cannot
give a clearer impression of the importance of these mean-reverting price components,
because the slow mean reversion can be missed with the short return horizons commonly
used in the efficiency tests. Based on these findings, Fama and French (1988) conduct
efficiency tests which try to identify if the behavior of long-horizon returns can shows the
importance of mean-reverting price components. They use a model for stock prices that is
the sum of a random walk and a stationary component. In their tests they find a pattern
that is consistent with the hypothesis that stock prices have a slowly decaying stationary
component. At the short return horizons the negative serial correlations generated by a
slowly decaying component is weak, but it becomes stronger as the return horizon
increases. So, it is clear that the random walk properties of securities returns are crucial for
the efficient market hypothesis. Indeed, if a security price series follows a random walk
process, it manifests significant permanent components and hence there is no mean-
reversion tendency. But on the other hand, if a security price series do not follows a
randomly process and presents significant temporary components, then it is possible to
predict the future security prices based on historical prices. In this case, it is possible to
design a profitable trading strategy based on historical data.
8
The subsequent research about the market efficiency has used a new methodology to test
the random walk nature of stock prices, which is known by unit root tests. This
methodology is used to examine the stationarity of the time series and was developed by
Dickey and Fuller (1979, 1981), among others. The most commonly used test to examine
the existence of a unit root is the augmented Dickey-Fuller (ADF) test. For example,
Käppi (1997) uses this procedure to test the stationarity of yield series before examine the
co-integration between yields on bonds and futures contracts on coupon bonds.
Due to the lack of power of the unit root tests and its failure to detect some deviations
from the random walk nature of time series, it was developed another type of tests for the
market efficiency hypothesis labeled as the variance ratio tests. This kind of tests was
originated from the pioneering works of Cochrane (1988), Lo and MacKinlay (1988,
1989) and Chow and Denning (1993). For example, Urrutia (1995) used the variance ratio
methodology to test the hypothesis that Latin American emerging equity market prices
(Argentina, Brazil, Chile and Mexico) follow a random walk.
The methodology of variance ratio test has been also used to analyze the efficiency of
other financial assets. For example, Liu and He (1991) use the procedure of Lo and
MacKinlay (1988) to provide empirical evidence of the random walk hypothesis in five
pairs of foreign exchange rates (CAN/USD, FRF/USD, DEM/USD, JPY/USD and
GBP/USD) and they reject the random walk hypothesis.
As stated above, serial correlation, unit root tests and variance ratio tests can be used to
test the efficiency hypothesis. Although the complementary of these tests, they can be used
all together to get a higher robustness of the conclusions. Lee, Gleason and Mathur (2000)
used all of them to test the efficiency of four financial futures contracts and have obtained
overwhelming evidence that the random walk hypothesis cannot be rejected for all of the
contracts. As suggested by the empirical evidence cited above, it should be mentioned that
we cannot conclude that any market is efficient or not without making an empirical test.
In our study, we choose some common tools only. These standpoints are in conformity
with Claesson’s (1987) reasoning concerning studies in the field of efficient markets. We
used both non-parametric tests [(Kolmogrov-Smirnov goodness of fit test), run test,
Lilliefors test], Q-Q probability plots and parametric-tests [Auto-correlation coefficient
9
test and Auto-Regressive Integrated Moving Average Model (ARIMA)]. Each statistical
test was performed separately on two index data. In some cases, total observation was
divided into two sub-samples for making the test result consistent and verified. In order to
avoid the possible bias originated from thin or infrequent trading we have used a longer
time-period, which reduces the problem of non-trading bias. Non-parametric test and
parametric-tests have been used to compare the results so that non-normal distribution can
not bias the findings.
The study includes daily All-Share Price Indices (ASPI) and DSE General Price Indices
(DSE-GEN) for 12 years. We used daily price indices of the Dhaka Stock Exchange for
the period of 1st January 1994 to 30th March 2005. Daily price indices were collected
from the Dhaka Stock Exchange (Research and Library Center). All the data came from
two indices for a certain period of time. The data of January 1994 to December 2001 are
all share price index (ASPI) data, and the data of January 2002 to March 2005 are general
price index (DSE-GEN) data. The sample included total 3026 daily observations for the
total sample period from 1994 to 2005. In addition, we also considered daily closing prices
of 33 companies. These companies represent Banks, Insurance and Pharmaceuticals
industries and are active in stock market. We executed run test on daily market returns of
these 33 companies.
Variables
We used daily market returns as individual time series variable. Market returns are
calculated from the daily price indices without adjustment of dividend, bonus and right
issues. Many researchers confirm that their conclusions remain unchanged whether they
adjusted their data for dividend or not [for example, Lakonishok and Smidt, (1988); Fishe,
Gosnell and Lasser, (1993)]. Daily market returns (Rmt ) are calculated from the daily price
indices as follows:
Rmt = Ln (PI t / PI t-1) … … … (1)
Where, Rmt refers to market return in period t; PIt, price index at day t; PIt-1, the price
index at period t-1 and Ln refers to natural log. We used logarithm just because, lognormal
returns are more likely to be normally distributed, which is prior condition of standard
statistical techniques (Strong, 1992). For individual companies, the daily return, (Rmtj)
equals
Ln [Pt / Pt-1] … … … (2)

10
Where, Pt refers to daily price per share at time t; Pt-1 is the daily price per share at time t -
1; and j is the individual security. Table 1 shows the variables used in this study.
Table 1: Variables and Description Name of the Variables Descriptions
Daily Price Index DSE daily price index (all shares)
Daily Market Returns (Rmt) Natural Log of Market returns
Daily Returns of individual share (Rmtj) Natural Log of individual share return
Hypotheses
This paper tests two hypotheses to determine the efficiency of the DSE in the weak form.
This concept of using hypotheses is similar to that of Moustafa (2004) who tested weak
form efficiency on United Arab Emirates stock market. Unlike Mobarek (2000), the first
hypothesis involves determining whether the stock returns follow a normal distribution or
not. The null and alternative hypotheses are:
H0: The stock returns in DSE stock market follow a normal distribution.
H1: The stock returns in DSE stock market do not follow a normal distribution.
The second hypothesis involves determining, whether the stock returns are random across
time. The null and alternative hypotheses are:
H0: The stock returns in DSE are random over the time period of the study.
H1: The stock returns in DSE are not random over the time period of the study.
Though hypothesis of normality and randomness are complementary, we used them
simultaneously in order to establish the robustness of the analysis. Besides, some specified
hypotheses have taken into consideration while using several parametric and non-
parametric tests.
EMPIRICAL ANALYSIS AND RESULTS
Weak form efficiency test is concerned with finding normality in the distribution and basic
assumptions of random walk model. If the distribution of the return series follows normal
distribution, it belongs to the assumption of random walk model hence market efficiency.
Though the concept of normality and randomness is complimentary, this paper illustrated
these two things separately with hypothesis testing. Before discussing the test results

11
Figure 1 and 2 illustrate daily market return series and daily price index series for getting
presumption.
Figure 1: Daily Market Return Series
Figure 2: Daily Price Index Series
Test of Normality
We start with test of normality. Descriptive statistics, Kolmogrov-Smirnov (K-S) test and
Lilliefors Coefficient test had been used to test the hypothesis of normality. Daily market
return data (Rmt) from both indices are used in this goodness of fit test. In order to test the
distribution of the return series, the descriptive statistics of the log of the market returns
are calculated and presented in Table 2. Result shows that the returns are not normally
distributed. Rather, characterized by significantly high skewness and kurtosis. In a
symmetrical distribution the values of mean, median and mode are alike. As the value of
mean is greater than the mode, so market return series follow positively skewed
distribution. Generally, values for skewness (zero) and kurtosis (3) represents that the
observed distribution is perfectly normally distributed. The kurtosis value of 61.754 for
ASPI and 7.815 for DSE-GEN exhibits extreme leptokurtic distribution. So, skewness and
leptokurtic frequency distribution of stock return series on the DSE rejects our null
Daily All Share Price Indices (1994-2001)
0.00500.00
1000.001500.002000.002500.003000.003500.004000.00
01-J
an-9
4
27-A
ug-9
4
20-A
pr-9
5
09-N
ov-9
5
08-A
ug-9
6
13-M
ar-9
7
15-N
ov-9
7
14-J
ul-9
8
2-M
ar-9
9
17-O
ct-9
9
13-J
un-0
0
17-J
an-0
1
16-S
ep-0
1
Daily Market Return Series (1994-2001)
-30
-20
-10
0
10
20
30
40
Daily Market Return Series (2002-2005)
-8
-6
-4
-2
0
2
4
6
Daily General Price Indices (2002-2005)
0.00500.00
1000.001500.002000.002500.00
1-Ja
n-02
17-A
pr-0
2
1-A
ug-0
2
13-N
ov-0
2
4-M
ar-0
3
16-J
un-0
3
30-S
ep-0
3
20-J
an-0
4
20-M
ay-0
4
4-S
ep-0
4
30-D
ec-0
4

12
hypothesis of normality as well as contradicts with the random walk model. We further
justify the hypothesis with K-S goodness of fit test.
Table 2: Descriptive Statistics of Log of the Daily Market Return
Statistic
Variable
Description All share price
index (1994-2001)
General price index (2002-
2005) Number of observations 2123 903Mean .0346 .0922Median .000 .0480Mode .00 .00Variance 3.63288 .85391Std. Deviation 1.90601 .92407Minimum -25.11 -7.36Maximum 29.21 4.83Range 54.32 12.19Skewness 2.123 -.428
Daily Market Return (Rmt)
Kurtosis 61.754 7.815
Kolmogorov-Smirnov (K-S) Goodness of Fit Test
Kolmogorov-Smirnov Goodness of fit test is a non-parametric test and compares the
observed cumulative distribution function for a variable with a specified theoretical
distribution, which may be normal, uniform, Poisson, or exponential. This goodness-of-fit
test, tests whether the observations could reasonably have come from the specified
distribution. Results show probability of (0.000) for the Z for both indices (Table 3).
Hence it is clearly evident that daily price indices of Dhaka Stock Exchange do not fit by
normal distribution. Thus we reject the null hypothesis of normality.
Table 3: Kolmogorov-Smirnov Goodness of Fit Test
One-Sample Kolmogorov-Smirnov Test
All share price index
(1994-2001)
General price index
(2002-2005) Number of observation 2123 903Normal Parameters Mean .0346 .0922 Std. Deviation 1.90601 .92407Most Extreme Differences Absolute .171 .078 Positive .171 .070 Negative -.156 -.078Kolmogorov-Smirnov Z 7.880 2.354Asymp. Sig. (2-tailed) .000 .000
* Test distribution is Normal

13
Lilliefors coefficient
Table 4 displays the Kolmogorov-Smirnov (K-S) statistic with a Lilliefors significance
level for testing normality. If non-integer weights are specified, the Shapiro-Wilk (S-W)
statistic is calculated when the weighted sample size lies between 3 and 50. For no weights
or integer weights, the statistic is calculated when the weighted sample size lies between 3
and 5000. The probability of (.000) for both (K-S) and (S-W) implies test statistics are
significant and asserts that market return series do not follow normal distribution.
Table 4: K-S & S-W statistics for market return series Kolmogorov-Smirnov (a) Shapiro-Wilk Statistic df Sig. Statistic df Sig.
All Share Price Index (1994-2001)
1.71 2123 .000 .691 2123 .000
General Price Index (2002-2005)
.078 903 .000 .921 903 .000
a. Lilliefors Significance Correction
Q-Q Probability Plots
Let us examine the data in the form of normal Q-Q chart. Observed values of a single
numeric variable are plotted against the expected values if the sample were from a normal
distribution. If the sample is from a normal distribution, points will cluster around a
straight line. Q-Q chart demonstrates that market return series of DSE are not from normal
distribution. Data do not cluster around the thin straight line for both All Share Price Index
(1994-2001) and General Price Index (2002-2005) (Figure 3).
Figure 3: Q-Q Plots of Daily Market Return Series
7. Test of Randomness on the Return Series
Normal Q-Q Plot of General Price Index
Observed Value
6420-2-4-6
Exp
ecte
d N
orm
al
4
3
2
1
0
-1
-2
-3
-4
Normal Q-Q Plot of All Share Price Index
Observed Value
3020100-10-20-30
Exp
ecte
d N
orm
al
4
3
2
1
0
-1
-2
-3
-4
Detrended Normal Q-Q Plot (General Price Ind
m N
orm
al
3
2
1
0
-1
-2
Detrended Normal Q-Q Plot (All Share Index
m N
orm
al
20
10
0
-10
14
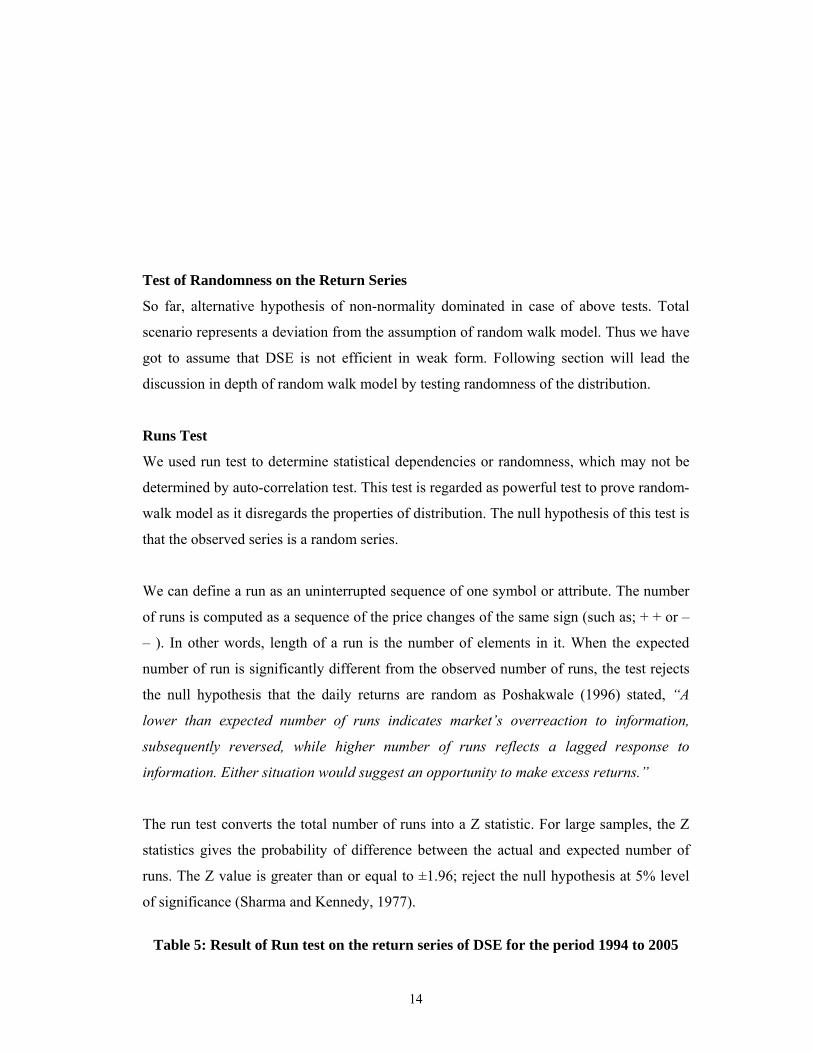
Test of Randomness on the Return Series
So far, alternative hypothesis of non-normality dominated in case of above tests. Total
scenario represents a deviation from the assumption of random walk model. Thus we have
got to assume that DSE is not efficient in weak form. Following section will lead the
discussion in depth of random walk model by testing randomness of the distribution.
Runs Test
We used run test to determine statistical dependencies or randomness, which may not be
determined by auto-correlation test. This test is regarded as powerful test to prove random-
walk model as it disregards the properties of distribution. The null hypothesis of this test is
that the observed series is a random series.
We can define a run as an uninterrupted sequence of one symbol or attribute. The number
of runs is computed as a sequence of the price changes of the same sign (such as; + + or –
– ). In other words, length of a run is the number of elements in it. When the expected
number of run is significantly different from the observed number of runs, the test rejects
the null hypothesis that the daily returns are random as Poshakwale (1996) stated, “A
lower than expected number of runs indicates market’s overreaction to information,
subsequently reversed, while higher number of runs reflects a lagged response to
information. Either situation would suggest an opportunity to make excess returns.”
The run test converts the total number of runs into a Z statistic. For large samples, the Z
statistics gives the probability of difference between the actual and expected number of
runs. The Z value is greater than or equal to ±1.96; reject the null hypothesis at 5% level
of significance (Sharma and Kennedy, 1977).
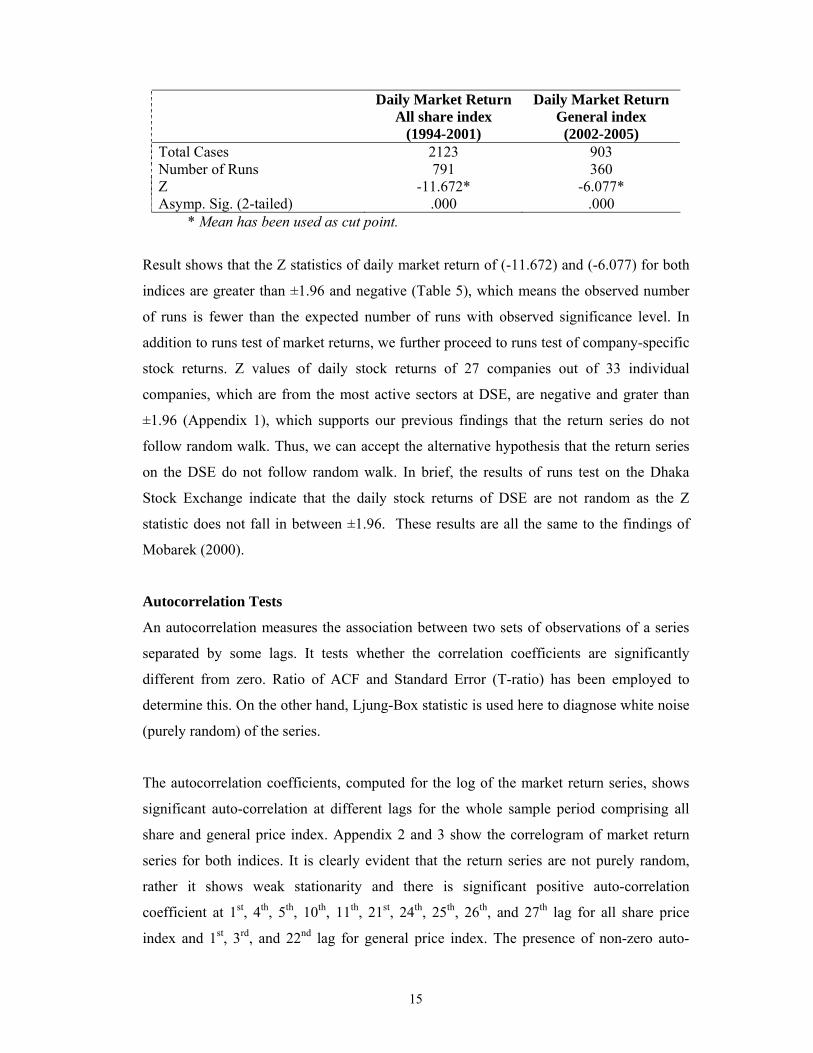
Table 5: Result of Run test on the return series of DSE for the period 1994 to 2005
15
Daily Market Return All share index
(1994-2001)
Daily Market Return General index
(2002-2005) Total Cases 2123 903 Number of Runs 791 360 Z -11.672* -6.077* Asymp. Sig. (2-tailed) .000 .000
* Mean has been used as cut point.
Result shows that the Z statistics of daily market return of (-11.672) and (-6.077) for both
indices are greater than ±1.96 and negative (Table 5), which means the observed number
of runs is fewer than the expected number of runs with observed significance level. In
addition to runs test of market returns, we further proceed to runs test of company-specific
stock returns. Z values of daily stock returns of 27 companies out of 33 individual
companies, which are from the most active sectors at DSE, are negative and grater than
±1.96 (Appendix 1), which supports our previous findings that the return series do not
follow random walk. Thus, we can accept the alternative hypothesis that the return series
on the DSE do not follow random walk. In brief, the results of runs test on the Dhaka
Stock Exchange indicate that the daily stock returns of DSE are not random as the Z
statistic does not fall in between ±1.96. These results are all the same to the findings of
Mobarek (2000).
Autocorrelation Tests
An autocorrelation measures the association between two sets of observations of a series
separated by some lags. It tests whether the correlation coefficients are significantly
different from zero. Ratio of ACF and Standard Error (T-ratio) has been employed to
determine this. On the other hand, Ljung-Box statistic is used here to diagnose white noise
(purely random) of the series.
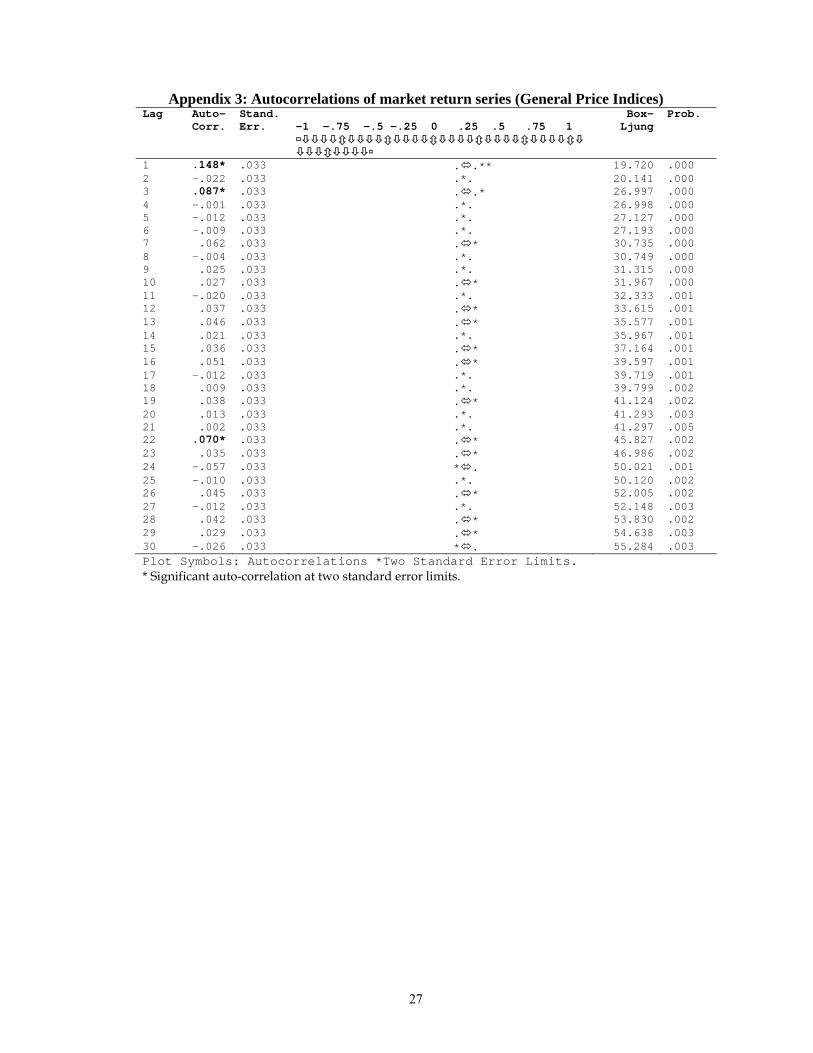
The autocorrelation coefficients, computed for the log of the market return series, shows
significant auto-correlation at different lags for the whole sample period comprising all
share and general price index. Appendix 2 and 3 show the correlogram of market return
series for both indices. It is clearly evident that the return series are not purely random,
rather it shows weak stationarity and there is significant positive auto-correlation
coefficient at 1st, 4th, 5th, 10th, 11th, 21st, 24th, 25th, 26th, and 27th lag for all share price
index and 1st, 3rd, and 22nd lag for general price index. The presence of non-zero auto-
16
correlation coefficients in the log of market returns series suggests serial dependence
between the values.
The nonzero auto-correlation of the series is further tested by Ljung-Box Q statistics,
which are jointly significant at 5% level at 30 degrees of freedom. As Ljung-Box
diagnoses white noise series which is completely random and has pattern less ACFs, a
constant variance and a mean of zero. We commonly infer the series is not white noise
when the level of significance is less then 0.05 and that it is consistent with white noise
when the level of significance is greater than of equal to 0.05 (DeLurgio, 1998).
All the probability falls below the tolerance level of .05 and all the LB statistics are greater
then the table value of Ljung-Box formula (such as for LB30, table value of 43.77 is
associated with 5% level of significance and 30 degrees of freedom, considering that it
follows chi-square distribution). We reject the hypothesis of white noise. In conclusion,
ACF patterns are statistically, significantly different than those of white noise. Hence the
results in Appendix 2 and 3 suggest that return series do not support random walk model.
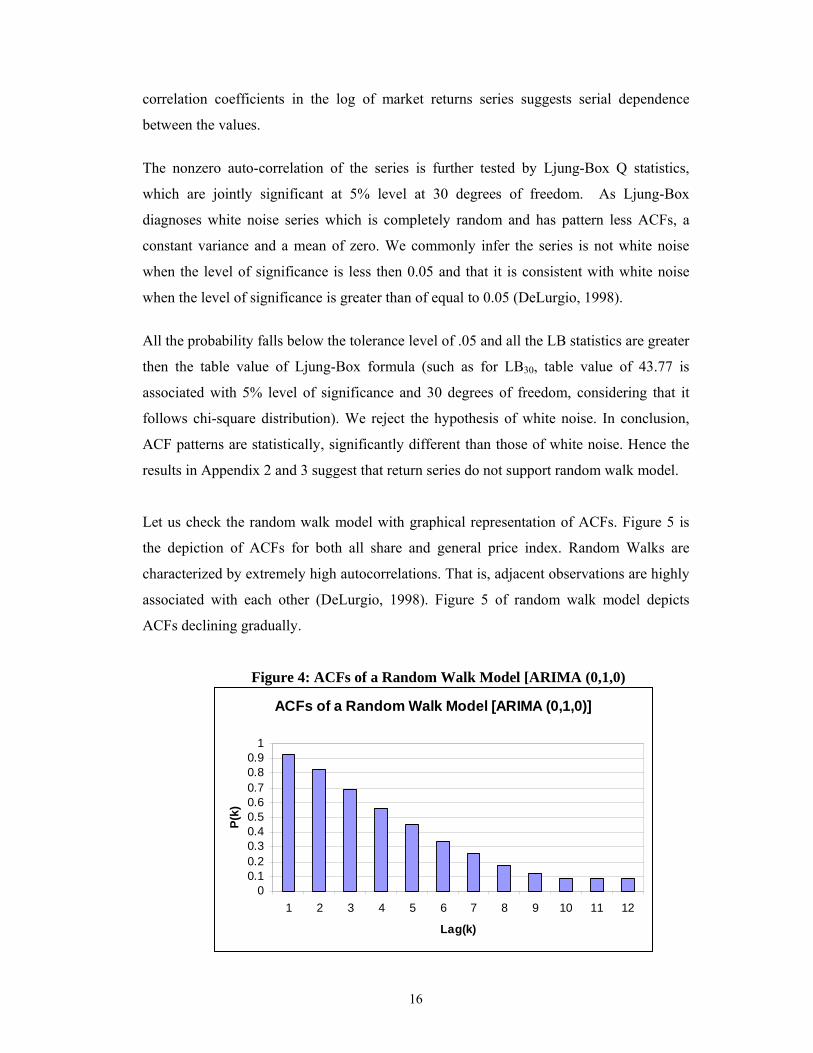
Let us check the random walk model with graphical representation of ACFs. Figure 5 is
the depiction of ACFs for both all share and general price index. Random Walks are
characterized by extremely high autocorrelations. That is, adjacent observations are highly
associated with each other (DeLurgio, 1998). Figure 5 of random walk model depicts
ACFs declining gradually.
Figure 4: ACFs of a Random Walk Model [ARIMA (0,1,0)
ACFs of a Random Walk Model [ARIMA (0,1,0)]
00.10.20.30.40.50.60.70.80.9
1
1 2 3 4 5 6 7 8 9 10 11 12
Lag(k)
P(k)

17
Figure 5: ACFs of Market Return Series (both index)
Upon closer inspection of Figure 5, we note that ACF starts with positive correlation and
remained positive and negative at different lags. ACFs in the Figure 5 do not show gradual
declination as random walk does. Hence it is proved that DSE market return series does
not support random walk.
The characteristics of ACFs of random series tell that if a series is completely random,
then 50 percent of the ACFs will be above and 50 percent below zero. Above figures do
not maintain this property properly. Thus, there may be some pattern left in the ACFs.
Once again it is proved that DSE market return series is not a white noise series as such
series is patternless.
ARIMA (Auto-Regressive Integrated Moving Average) Model
This section of this paper deals with ARIMA, the dynamic time series model to examine if
the stock return series depends not only on its past values of the return series but also past
and current disturbance terms. Weak-form efficiency of the market continues when we
cannot predict the share prices from its historical price information. ARIMA (0,1,0) is to
be fitted in a time series data if we claim it follows random walk model. In this case,
future share prices will not depend on past lag values of share prices. The coefficients
General Price Index (2002-2005)
Lag Number
2927252321191715131197531
.2
.1
0.0
-.1
Confidence Limits
Coefficient
All Share Price Index (1994-2001
Lag Number
2927252321191715131197531
AC
F
.2
.1
0.0
-.1

18
different from zero asserts dependency of the series, which violates the assumption of
random walk model and deviates from weak-form efficiency.
Table 6: Results of ARIMA (0,1,0) for all share & general price index
ARIMA (0,1,0) Coefficient SE T-ratio Prob. Constant (ASPI) .203 .640 .318 .750 Constant (DSE-GEN) 1.203 .429 2.800 .005
Table 7: Results of ARIMA (3,0,2) for market return series (ASPI) ARIMA (3,0,2) Coefficient SE T-ratio Prob. AR1 1.142* .105 10.863 .000 AR2 -.926* .110 -8.452 .000 AR3 .1627* .022 7.360 .000 MA1 1.00* .105 9.526 .000 MA2 -.764* .104 -7.354 .000 Constant .035 .050 .6942 .488
Table 8: Results of ARIMA (1,0,1) for market return series(DSE-GEN) ARIMA (1,0,1)
Coefficient SE T-ratio Prob.
AR1 -.559* .110 -5.080 .000 MA1 -.711* .093 -7.604 .000 Constant .092 .033 2.778 .005
* Denotes significant at 1% level
ARIMA (0,1,0) are used to check that a series supports random walk model. So we first
calculated ARIMA (0,1,0) of the two indices (ASPI and DSE-GEN). The coefficient of
(0.203) in Table 6 with a t-ratio (0.318) and probability of (0.750) rejects the null
hypothesis of random walk for all share price index series. Similarly, the coefficient of
(1.203) with a t-ratio (2.800) and probability of (0.005) compels general price index series
to be deviated form random walk. But the series is near to support random walk model for
later one. For the whole sample period for the both indices, ARIMA (3,0,2) and ARIMA
(1,0,1) respectively are found as the best fitted model with all coefficients significant at
1% level of significance. On the other hand, AIC (Akaike’s Information Criterion) of
(8714.76) and (2395.354) are found the lowest for these two ARIMA models respectively.
As the ARIMA process is called as series generating process, so we go for creating a
predictive model in compliance with the model selection criteria. If the model is applied to
19
a part of the observations, it can forecast the future values of the series and will also match
with the rest of the observations.
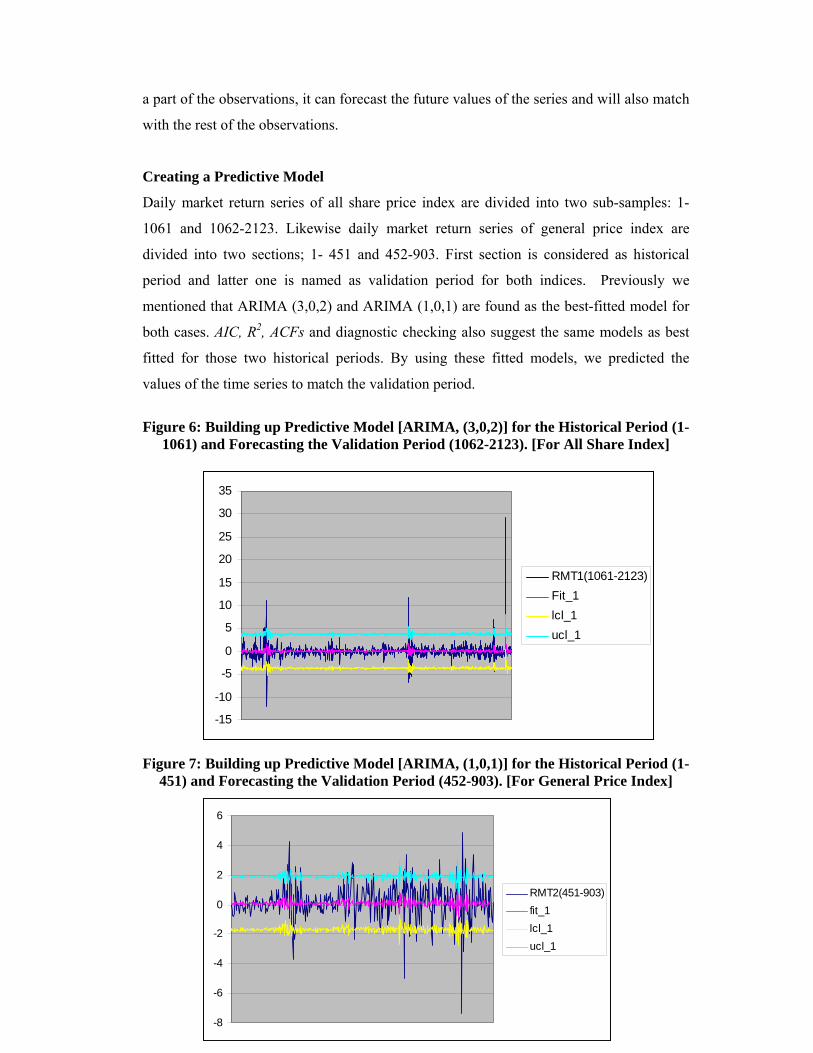
Creating a Predictive Model
Daily market return series of all share price index are divided into two sub-samples: 1-
1061 and 1062-2123. Likewise daily market return series of general price index are
divided into two sections; 1- 451 and 452-903. First section is considered as historical
period and latter one is named as validation period for both indices. Previously we
mentioned that ARIMA (3,0,2) and ARIMA (1,0,1) are found as the best-fitted model for
both cases. AIC, R2, ACFs and diagnostic checking also suggest the same models as best
fitted for those two historical periods. By using these fitted models, we predicted the
values of the time series to match the validation period.
Figure 6: Building up Predictive Model [ARIMA, (3,0,2)] for the Historical Period (1-
1061) and Forecasting the Validation Period (1062-2123). [For All Share Index]
Figure 7: Building up Predictive Model [ARIMA, (1,0,1)] for the Historical Period (1-
451) and Forecasting the Validation Period (452-903). [For General Price Index]
-15
-10
-5
0
5
10
15
20
25
30
35
RMT1(1061-2123)Fit_1lcl_1ucl_1
-8
-6
-4
-2
0
2
4
6
RMT2(451-903)fit_1lcl_1ucl_1
20
Hence, we employ ARIMA (3,0,2) and ARIMA (1,0,1) models to generate data for
validation period and examine how far the fitted value deviates from the actual value.
With a closer inspection in Figures 6 and 7, it is evident that the fitted value derived from
the models and actual value is all but well fitted.
We are now in a conclusion that validation period is the reflection of historical period.
More specifically, past price can be used to determine the future price of the stocks. Thus,
ARIMA model confirms the previous findings and results of various parametric and non-
parametric tests, and also these models are consistent all over the sampling period, sub-
sample period for daily market return series of all share price index and general price
index.
CONCLUSION
Overall results from the empirical analysis suggest that the Dhaka Stock Market of
Bangladesh is not efficient in weak-form. No analysis was undertaken on technical trading
rule or adjusting transaction cost. Though all the tests revealed the rejection of weak form
of efficiency, nevertheless emphasis should be given to interpretation and realization
process. Simply saying, evidence of auto-correlation, which violates the assumption of
random walk does not necessarily prove inefficiency of the market. There might some
other factors to be considered which will bring the capital market in the efficiency
spectrum.
As mentioned earlier, this research mainly hunted for the evidence of weak form
efficiency by hypothesizing normality of the distribution series and random walk
assumption. In other words, daily market return series were compared with the white noise
series, keeping in mind that white noise series is purely stationary. In the aspect of
skewness and kurtosis, the daily return series were found non-normal, which can be
categorized as positively skewed distribution and having a little bit resemblance with chi-
square distribution. Same thing resulted from Kolmogorov-Smirnov (K-S) test. As a
result, null hypothesis of normality has been rejected and alternative hypothesis remained
in effect. Run test and auto-correlation results rejected the randomness of the return series

21
of DSE simultaneously. Finally, ARIMA model, as the part of the time series forecasting,
strengthen the non-random walk situation of Dhaka Stock Exchange.
The absorption of good and bad news or any other price forming information may take late
effect on share price because of available advance technology, control system and
publication of business journals. So, before denouncing an inefficient market, above
factors should get priority. However, DSE deviated from weak form EMH. But it would
not be wise to label it as inefficient, because market efficiency changes over time and
capital market is subject to be tested continuously.
References
Ahmed, F. (2002). Market Efficiency in Emerging Stock Markets: The Case of Dhaka Stock Exchange, www.fgda.org/html/savings_2002-1.htm.
Bachelier, L. (1900). Théorie de la Spéculation. (Doctoral dissertation in Mathematical Sciences, Faculté des Sciences de Paris, defended March 29, 1900), Annales de /’École Normale Supérieure, Vol. 3, pp. 21 -86. Translated with permission of Gauthier-Villars, Paris, France, as Chapter 2 in Cootner, Paul H. (1964), Ed. The Random Character of Stock Market Prices, Cambridge, MA: The MIT Press.
Branes, Paul (1986). Thin trading and stock market efficiency: A case of the Kuala Lumpur Stock Exchange. Journal of Business Finance & Accounting, Vol. 13, No. 4 (Winter), pp. 609-617.
Chan, Kam C., Gup, Benton E., and Pan, Ming-shiun (1992). An Empirical Analysis of Stock Prices in Major Asian Markets and United States. The Financial Review, Vol. 27, No. 2 (May), pp. 289-307.
Cheung, Yan –Leung, Wong, Kie-Ann, and Ho, Yan-Ki (1993). The pricing of risky assets in two emerging Asian markets- Korea and Taiwan. Applied Financial Economics, Vol. 3, No. 4 (December), pp.315-324.
Chow, V. K., and Denning, K. D. (1993). A Simple Multiple Variance Ratio Test. Journal of Econometrics, Vol. 5, pp. 385-401.
Chowdhury, Shah S. H., Sadique, M. Shibley, and Rahman, M. Arifur (2001). Capital Market Seasonality: The Case of Dhaka Stock Exchange (DSE) Returns. South Asian Journal of Management, Vol. 8, No. 3 & 4 (July-Dec.), pp. 1-7.
Claessens, Stijin, Dasgupta, Susmita, and Glen, Jack, (1995). Return behaviour in emerging Stock Market. The World Bank Economic Review, Vol. 9, No.1, pp. 131-151.
Claesson, K. (1987). Effektiviteten på Stockholms fondbörs, Stockholm: EFI.
Cochrane, J. H. (1988). How Big is the Random Walk in GNP? Journal of Political Economy, Vol. 96, pp. 893-920.

22
Cootner, Paul H. (1962). Stock Prices: Random Vs. Systematic Changes. Industrial Management Review, Vol. 3 (Spring), pp. 24 – 45.
Cootner, Paul H. (1964). Ed., The Random Character of Stock Market Prices. Cambridge, MA: The MIT Press.
Cowles, A. III, and Jones, H. (1937). Some a Posteriori Probabilities in Stock Market Action. Econometrica, Vol. 5, pp. 280-294.
DeLurgio, Stephen A. (1998). Forecasting Principles and Applications. First Edition, USA: Irwin McGraw-Hill.
Dickey, D. A., and Fuller, W. A. (1979). Distribution of the Estimators for Autoregressive Time Series with a Unit Root. Journal of American Statistical Association, Vol. 74, No. 366, pp. 427-431.
Dickey, D. A., and Fuller, W. A. (1981). Likelihood Ratio Statistics for Autoregressive Time Series with a Unit Root. Econometrica, Vol. 49, pp. 1057-1072.
Dickinson and Muragu (1994). Market Efficiency in Developing Countries: A case study of the Nairobi Stock Exchange. Journal of Business Finance & Accounting, Vol. 21, No. 1 (January), pp. 133-150.
Fama, Eugene (1965). The Behavior of Stock Market Prices. Journal of Business, Vol. 38 (Jan), pp. 34-105.
Fama, Eugene (1970). Efficient Capital Markets: A Review of Theory and Empirical Work. Journal of Finance, Vol. XXV, No. 2 (March), pp. 383 – 417.
Fama, Eugene (1976). Foundation of Finance. New York: Basic Books.
Fama, Eugene (1991). Efficient Capital Markets II. Journal of Finance, Vol. 26, No. 5 (Dec.), pp. 1575-1617.
Fama, Eugene, and French, Kenneth R (1988). Permanent and Temporary Components of Stock Prices. Journal of Political Economy, Vol. 96 (April), pp. 246 – 273.
Fishe, R., Gosnell, T., and Lasser, D. (1993). Good news, bad news, volume and the Monday effect. Journal of Business Finance & Accounting, Vol. 20, 881-892.
Harvey, Campbell R. (1994). Conditional Asset allocation in Emerging Markets. Working Paper, No. 4623, Cambridge, MA.
Hassan, M. K., Islam, A. M. and Basher, S. A. (2000). Market Efficiency, Time-Varying Volatility and Equity Returns in Bangladesh Stock Market. http://econwpa.wustl.edu:80/eps/fin/papers/0310/0310015.pdf.
Hossain, M. Farhad (2004). Days of the Week Effect in Dhaka Stock Exchange: Evidence from Small Portfolios of Banking Sector. The Jahangirnagar Review, Part II: Social Science, Vol. XXVIII (Printed in 2005), pp. 73-82.
Hudson, R., Dempsey, M., and Keasey, Kevin. (1994). A note on the weak-form efficiency of capital markets: The application of simple technical trading rules to UK Stock prices-1935 to1994. Journal of Banking & Finance, Vol. 20, pp. 1121-1132.
Kababa, Nourrendine. (1998). Behavior of stock prices in the Saudi Arabian Financial Market: Empirical research findings. Journal of Financial Management & Analysis, Vol. 11, No. 1 (Jan-June), pp. 48-55.
23
Kader, M. A., and Rahman, A. F. M. A. (2004). Testing the Weak-Form Efficiency of an Emerging Market: Evidence from the Dhaka Stock Exchange of Bangladesh. AIUB Journal of Business and Economics, Vol. 4, No. 2, pp. 109-132.
Käppi, J. (1997). Pricing of Futures Contracts on Coupon Bonds: Empirical evidence from Finland. European Financial Management, Vol. 3, No. 3, pp. 321-332.
Keane, S. M. (1983). Stock Market Efficiency – Theory, Evidence, Implications. Oxford: Philip Allan Publishers Ltd.
Keim, D. B. (1988). Stock Market Regularities: A Synthesis of the Evidence and Explanations. In E. Dimson (ed.), Stock Market Anomalies, Cambridge: Cambridge University Press.
Kendall, M. G. (1943). The Advanced Theory of Statistics, Vol.1, London: Griffin.
Kendall, M. (1953). The Analysis of Economic Time Series. Journal of the Royal Statistical Society, Series A, Vol. 96, pp. 11-25.
Lakonishok, Josef, and Smidt, Seymour (1988). Are Seasonal Anomalies Real?: A Ninety-Year Perspective. Review of Financial Studies, Vol. 1 (Winter), pp. 435 – 455.
Lee, C. I., Gleason, K. C., and Mathur, I. (2000). Efficiency Tests in the French Derivatives Market. Journal of Banking and Finance, Vol. 24, pp. 787-807.
LeRoy, S.F. (1976). Efficient Capital Markets: A Comment. Journal of Finance, Vol. 31, No. 1, pp. 139-141.
Liu, C. Y., and He, J. (1991). A Variance-Ratio Test of Random Walks in Foreign Exchange Rates. Journal of Finance, Vol. 46, No. 2, pp. 773-785.
Lo, Andrew W., and MacKinlay, A. Craig (1988). Stock Market Prices Do Not Follow Random Walks: Evidence from a Simple Specification Test. Review of Financial Studies, Vol. 1, No. 1 (Spring), pp. 41-66.
Lo, A. W., and MacKinlay, A. C. (1989). The Size and Power of the Variance Ratio Test in Finite Samples: A Monte CarloInvestigation. Journal of Econometrics, Vol. 40, pp. 203-238.
Mobarek, A. (2000). Weak-form market efficiency of an emerging market: Evidence from Dhaka Stock Market of Bangladesh. http://www.bath.ac.uk/cds/enbs-papers-pdfs/mobarek-new.pdf.
Moustafa, M. A. (2004). Testing the Weak-Form Efficiency of the United Arab Emirates Stock Market. International Journal of Business, Vol. 9, No. 3.
Nicolaas, Groenewold (1997). Share market efficiency: Tests using daily data for Australia and New Zealand. Applied Financial Economics, Vol. 7, pp.645-657.
Ojah, Kalu, and Karemera (1999). Random walks and Market efficiency Tests of Latin Amaeracan Emerging Equity Markets: A Revisit. The Financial Review, Vol. 34, pp. 57-72.
Osborne, M. F. M. (1962). Periodic Structure in the Brownian Motion of Stock Prices. Operational Research, Vol. 10 (May- June), pp. 345 – 379.
Poshakwale, S. (1996). Evidence on the Weak-form efficiency and the day of the week effect in the Indian Stock Market. Finance India, Vol. 10, No. 3 (September), pp. 605-616.

24
Poterba, James, and Summers, Lawrence (1988). Mean Reversion in Stock Prices: Evidence and Implications. Journal of Financial Economics, Vol. 22, No. 1 (Oct.), pp. 27 – 59.
Roux and Gilberson (1978). The behavior of share prices on the Johannesburg Stock Exchange. Journal of Business Finance and Accounting, Vol. 5, No. 2, pp. 223-232.
Strong, N. (1992). Modelling Abnormal Returns: A Review Article. Journal of Business Finance and Accounting, Vol. 19, No. 4 (June), pp. 533-553.
Summers, Lawrence H. (1986). Does the Stock Market Rationally Reflect Fundamental Values? Journal of Finance, Vol. 41, No. 3 (July), pp. 591-601.
Urrutia, J. L. (1995). Tests of Random Walk and Market Efficiency for Latin American Equity Markets. Journal of Financial Research, Vol. 18, No. 3, pp. 299-309.
Working, H. (1934). A Random Difference Series for Use in the Analysis of Time Series. Journal of the American Statistical Association, Vol. 29, pp. 11-24.

25
Appendices
Appendix 1: Result of Run test of some selected DSE companies’ return for the period 1994 to 2005
Individual Company’s Daily Return No. Run Z Asymp. Sig. (2-tailed)
No. Name 1 1st ICB 421 -8.316* .000 2 ACI 1087 -3.623* .000 3 Aftab 1143 -4.752* .000 4 Bata 1242 -1.526 .127 5 Monno Ceramic 1223 -2.770* .006 6 BGIC 957 -4.277* .000 7 Ambee 1054 0.040 .968 8 GLAXO 442 -0.746 .455 9 Renata 426 -3.237* .001 10 Square 1030 -6.646* .000 11 Pharmaco 908 -14.597* .000 12 Reckitt 833 -17.060* .000 13 IBN Sina 773 -16.792* .000 14 Pharma Aids 323 -25.791* .000 15 Keya Cosmetics ltd. 335 -.482 .630 16 Libra Pharma 470 -4.373* .000 17 Orion Pharma 476 -6.330* .000 18 Bexmico Infusion 921 -3.005* .003 19 Eastern Insurance 854 -4.289* .000 20 Peoples Insurance 266 -8.331* .000 21 National Life Insurance 321 -2.711* .007 22 Pragati General 291 -2.682* .007 23 Sandhani Life insurance 288 -3.100* .002 24 Delta life isurance 331 -5.925* .000 25 Green Delta 548 -8.489* .000 26 Pubali Bank 35 -.153 .875 27 Rupali Bank 725 -7.425* .000 28 UCBL 685 -9.638* .000 29 Uttara Bank 691 -9.833* .000 30 Al-Arafah 559 -2.297* .022 31 Islami Bank 874 -9.925* .000 32 Oriental Bank 303 -11.881* .000 33 Social Investment Bank 157 -1.416 .157 Mean is used as cut point.

26
Appendix 2: Autocorrelations of market return series (All Share Price Indices) Lag Auto-
Corr. Stand. Err.
-1 -.75 -.5 -.25 0 .25 .5 .75 1
Box-Ljung
Prob.
1 .142* .022 . .** 42.789 .000 2 -.002 .022 .*. 42.794 .000 3 .032 .022 . * 44.954 .000 4 .068* .022 . * 54.711 .000 5 .053* .022 . * 60.651 .000 6 -.011 .022 .*. 60.931 .000 7 .000 .022 .*. 60.931 .000 8 .019 .022 .*. 61.721 .000 9 .032 .022 . * 63.886 .000 10 .065* .022 . * 72.832 .000 11 .065* .022 . * 81.899 .000 12 .028 .022 . * 83.547 .000 13 .031 .022 . * 85.572 .000 14 .009 .022 .*. 85.731 .000 15 -.010 .022 .*. 85.950 .000 16 -.016 .022 .*. 86.474 .000 17 .020 .022 .*. 87.342 .000 18 -.025 .022 .*. 88.655 .000 19 -.015 .022 .*. 89.149 .000 20 .002 .022 .*. 89.160 .000 21 .048* .022 . * 94.189 .000 22 .031 .022 . * 96.276 .000 23 .022 .022 .*. 97.301 .000 24 .057* .022 . * 104.405 .000 25 .052* .022 . * 110.140 .000 26 .055* .022 .*. 110.186 .000 27 -.048* .022 * . 115.232 .000 28 .033 .022 .*. 115.246 .000 29 .001 .022 .*. 115.249 .000 30 -.016 .022 .*. 115.768 .000 Plot Symbols: Autocorrelations * Two Standard Error Limits. * Significant auto-correlation at two standard error limits.
27
Appendix 3: Autocorrelations of market return series (General Price Indices) Lag Auto-
Corr. Stand. Err.
-1 -.75 -.5 -.25 0 .25 .5 .75 1
Box-Ljung
Prob.
1 .148* .033 . .** 19.720 .000 2 -.022 .033 .*. 20.141 .000 3 .087* .033 . .* 26.997 .000 4 -.001 .033 .*. 26.998 .000 5 -.012 .033 .*. 27.127 .000 6 -.009 .033 .*. 27.193 .000 7 .062 .033 . * 30.735 .000 8 -.004 .033 .*. 30.749 .000 9 .025 .033 .*. 31.315 .000 10 .027 .033 . * 31.967 .000 11 -.020 .033 .*. 32.333 .001 12 .037 .033 . * 33.615 .001 13 .046 .033 . * 35.577 .001 14 .021 .033 .*. 35.967 .001 15 .036 .033 . * 37.164 .001 16 .051 .033 . * 39.597 .001 17 -.012 .033 .*. 39.719 .001 18 .009 .033 .*. 39.799 .002 19 .038 .033 . * 41.124 .002 20 .013 .033 .*. 41.293 .003 21 .002 .033 .*. 41.297 .005 22 .070* .033 . * 45.827 .002 23 .035 .033 . * 46.986 .002 24 -.057 .033 * . 50.021 .001 25 -.010 .033 .*. 50.120 .002 26 .045 .033 . * 52.005 .002 27 -.012 .033 .*. 52.148 .003 28 .042 .033 . * 53.830 .002 29 .029 .033 . * 54.638 .003 30 -.026 .033 * . 55.284 .003 Plot Symbols: Autocorrelations *Two Standard Error Limits. * Significant auto-correlation at two standard error limits.
28
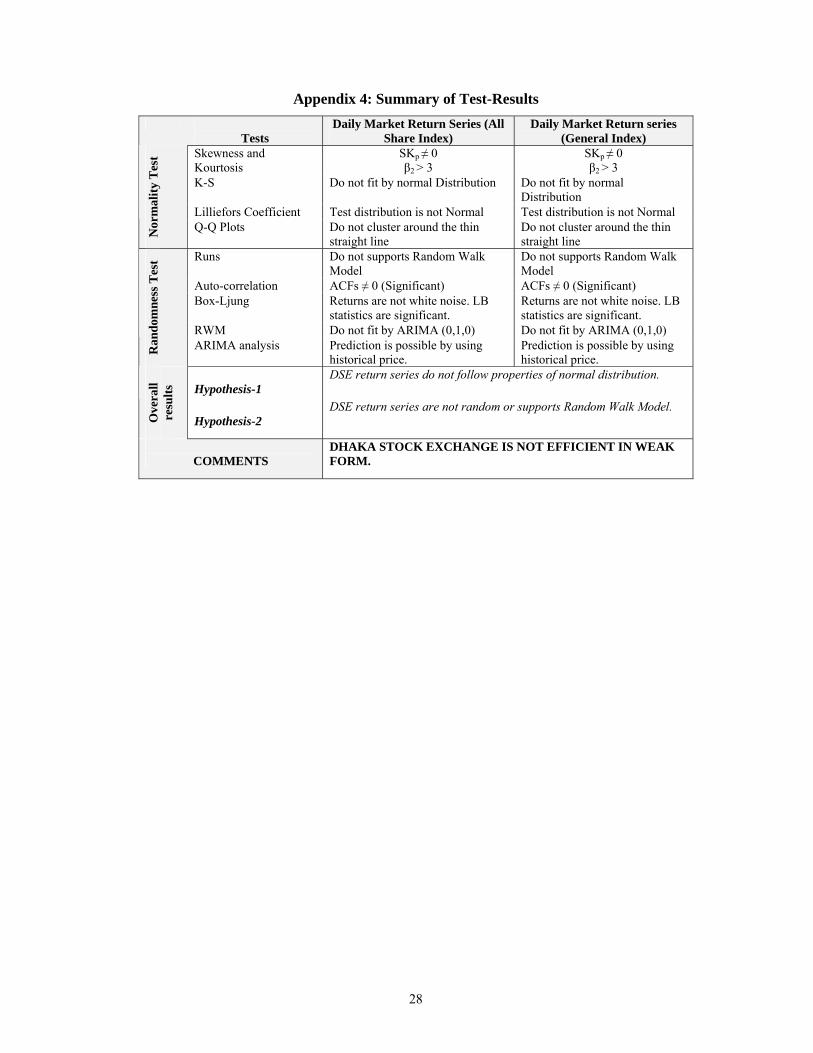
Appendix 4: Summary of Test-Results
Tests Daily Market Return Series (All
Share Index) Daily Market Return series
(General Index) Skewness and Kourtosis
SKp ≠ 0 β2 > 3
SKp ≠ 0 β2 > 3
K-S Do not fit by normal Distribution Do not fit by normal Distribution
Lilliefors Coefficient Test distribution is not Normal Test distribution is not Normal
Nor
mal
ity T
est
Q-Q Plots Do not cluster around the thin straight line
Do not cluster around the thin straight line
Runs Do not supports Random Walk Model
Do not supports Random Walk Model
Auto-correlation ACFs ≠ 0 (Significant) ACFs ≠ 0 (Significant) Box-Ljung Returns are not white noise. LB
statistics are significant. Returns are not white noise. LB statistics are significant.
RWM Do not fit by ARIMA (0,1,0) Do not fit by ARIMA (0,1,0)
Ran
dom
ness
Tes
t
ARIMA analysis Prediction is possible by using historical price.
Prediction is possible by using historical price.
Hypothesis-1
DSE return series do not follow properties of normal distribution.
Ove
rall
resu
lts
Hypothesis-2
DSE return series are not random or supports Random Walk Model.
COMMENTS
DHAKA STOCK EXCHANGE IS NOT EFFICIENT IN WEAK FORM.