We, the management of Verizon Communications Inc., are ...
41
36 VERIZON COMMUNICATIONS INC. AND SUBSIDIARIES We, the management of Verizon Communications Inc., are responsible for establishing and maintaining adequate internal control over financial reporting of the company. Management has evaluated internal control over financial reporting of the company using the criteria for effective internal control established in Internal Control–Integrated Framework issued by the Committee of Sponsoring Organizations of the Treadway Commission in 2013. Management has assessed the effectiveness of the company’s internal control over financial reporting as of December 31, 2014. Based on this assessment, we believe that the internal control over financial reporting of the company is effective as of December 31, 2014. In connection with this assessment, there were no material weaknesses in the company’s internal control over financial reporting identified by management. The company’s financial statements included in this Annual Report have been audited by Ernst & Young LLP, independent registered public accounting firm. Ernst & Young LLP has also provided an attestation report on the company’s internal control over financial reporting. Lowell C. McAdam Chairman and Chief Executive Officer Francis J. Shammo Executive Vice President and Chief Financial Officer Anthony T. Skiadas Senior Vice President and Controller REPORT OF MANAGEMENT ON INTERNAL CONTROL OVER FINANCIAL REPORTING REPORT OF INDEPENDENT REGISTERED PUBLIC ACCOUNTING FIRM ON INTERNAL CONTROL OVER FINANCIAL REPORTING To The Board of Directors and Shareowners of Verizon Communications Inc.: We have audited Verizon Communications Inc. and subsidiaries’ (Verizon) internal control over financial reporting as of December 31, 2014, based on criteria established in Internal Control–Integrated Framework issued by the Committee of Sponsoring Organizations of the Treadway Commission (2013 framework) (the COSO criteria). Verizon’s manage- ment is responsible for maintaining effective internal control over financial reporting, and for its assessment of the effectiveness of internal control over financial reporting included in the accompanying Report of Management on Internal Control Over Financial Reporting. Our respon- sibility is to express an opinion on the company’s internal control over financial reporting based on our audit. We conducted our audit in accordance with the standards of the Public Company Accounting Oversight Board (United States). Those standards require that we plan and perform the audit to obtain reasonable assur- ance about whether effective internal control over financial reporting was maintained in all material respects. Our audit included obtaining an understanding of internal control over financial reporting, assessing the risk that a material weakness exists, testing and evaluating the design and operating effectiveness of internal control based on the assessed risk, and performing such other procedures as we considered necessary in the circumstances. We believe that our audit provides a reasonable basis for our opinion. A company’s internal control over financial reporting is a process designed to provide reasonable assurance regarding the reliability of financial reporting and the preparation of financial statements for external pur- poses in accordance with generally accepted accounting principles. A company’s internal control over financial reporting includes those poli- cies and procedures that (1) pertain to the maintenance of records that, in reasonable detail, accurately and fairly reflect the transactions and dispositions of the assets of the company; (2) provide reasonable assur- ance that transactions are recorded as necessary to permit preparation of financial statements in accordance with generally accepted accounting principles, and that receipts and expenditures of the company are being made only in accordance with authorizations of management and direc- tors of the company; and (3) provide reasonable assurance regarding prevention or timely detection of unauthorized acquisition, use, or dis- position of the company’s assets that could have a material effect on the financial statements.
Transcript of We, the management of Verizon Communications Inc., are ...

36
v e r i zo n co m m u n i c at i o n s i n c . a n d s u b s i d i a r i e s
We, the management of Verizon Communications Inc., are responsible for establishing and maintaining adequate internal control over financial reporting of the company. Management has evaluated internal control over financial reporting of the company using the criteria for effective internal control established in Internal Control–Integrated Framework issued by the Committee of Sponsoring Organizations of the Treadway Commission in 2013.
Management has assessed the effectiveness of the company’s internal control over financial reporting as of December 31, 2014. Based on this assessment, we believe that the internal control over financial reporting of the company is effective as of December 31, 2014. In connection with this assessment, there were no material weaknesses in the company’s internal control over financial reporting identified by management.
The company’s financial statements included in this Annual Report have been audited by Ernst & Young LLP, independent registered public accounting firm. Ernst & Young LLP has also provided an attestation report on the company’s internal control over financial reporting.
Lowell C. McAdamChairman and Chief Executive Officer
Francis J. ShammoExecutive Vice President and Chief Financial Officer
Anthony T. SkiadasSenior Vice President and Controller
RepoRt of ManageMent on InteRnal ContRol oveR fInanCIal RepoRtIng
RepoRt of Independent RegIsteRed publIC aCCountIng fIRM on InteRnal ContRol oveR fInanCIal RepoRtIng
To The Board of Directors and Shareowners of Verizon Communications Inc.:
We have audited Verizon Communications Inc. and subsidiaries’ (Verizon) internal control over financial reporting as of December 31, 2014, based on criteria established in Internal Control–Integrated Framework issued by the Committee of Sponsoring Organizations of the Treadway Commission (2013 framework) (the COSO criteria). Verizon’s manage-ment is responsible for maintaining effective internal control over financial reporting, and for its assessment of the effectiveness of internal control over financial reporting included in the accompanying Report of Management on Internal Control Over Financial Reporting. Our respon-sibility is to express an opinion on the company’s internal control over financial reporting based on our audit.
We conducted our audit in accordance with the standards of the Public Company Accounting Oversight Board (United States). Those standards require that we plan and perform the audit to obtain reasonable assur-ance about whether effective internal control over financial reporting was maintained in all material respects. Our audit included obtaining an understanding of internal control over financial reporting, assessing the risk that a material weakness exists, testing and evaluating the design and operating effectiveness of internal control based on the assessed risk, and performing such other procedures as we considered necessary in the circumstances. We believe that our audit provides a reasonable basis for our opinion.
A company’s internal control over financial reporting is a process designed to provide reasonable assurance regarding the reliability of financial reporting and the preparation of financial statements for external pur-poses in accordance with generally accepted accounting principles. A company’s internal control over financial reporting includes those poli-cies and procedures that (1) pertain to the maintenance of records that, in reasonable detail, accurately and fairly reflect the transactions and dispositions of the assets of the company; (2) provide reasonable assur-ance that transactions are recorded as necessary to permit preparation of financial statements in accordance with generally accepted accounting principles, and that receipts and expenditures of the company are being made only in accordance with authorizations of management and direc-tors of the company; and (3) provide reasonable assurance regarding prevention or timely detection of unauthorized acquisition, use, or dis-position of the company’s assets that could have a material effect on the financial statements.

37
To The Board of Directors and Shareowners of Verizon Communications Inc.:
We have audited the accompanying consolidated balance sheets of Verizon Communications Inc. and subsidiaries (Verizon) as of December 31, 2014 and 2013, and the related consolidated statements of income, comprehensive income, cash flows and changes in equity for each of the three years in the period ended December 31, 2014. These financial statements are the responsibility of Verizon’s management. Our respon-sibility is to express an opinion on these financial statements based on our audits.
We conducted our audits in accordance with the standards of the Public Company Accounting Oversight Board (United States). Those stan-dards require that we plan and perform the audit to obtain reasonable assurance about whether the financial statements are free of material misstatement. An audit includes examining, on a test basis, evidence supporting the amounts and disclosures in the financial statements. An audit also includes assessing the accounting principles used and signifi-cant estimates made by management, as well as evaluating the overall financial statement presentation. We believe that our audits provide a reasonable basis for our opinion.
In our opinion, the financial statements referred to above present fairly, in all material respects, the consolidated financial position of Verizon at December 31, 2014 and 2013, and the consolidated results of its operations and its cash flows for each of the three years in the period ended December 31, 2014, in conformity with U.S. generally accepted accounting principles.
We also have audited, in accordance with the standards of the Public Company Accounting Oversight Board (United States), Verizon’s internal control over financial reporting as of December 31, 2014, based on cri-teria established in Internal Control–Integrated Framework issued by the Committee of Sponsoring Organizations of the Treadway Commission (2013 framework) and our report dated February 23, 2015 expressed an unqualified opinion thereon.
Ernst & Young LLPNew York, New York
February 23, 2015
Because of its inherent limitations, internal control over financial reporting may not prevent or detect misstatements. Also, projections of any evalu-ation of effectiveness to future periods are subject to the risk that controls may become inadequate because of changes in conditions, or that the degree of compliance with the policies or procedures may deteriorate.
In our opinion, Verizon maintained, in all material respects, effective internal control over financial reporting as of December 31, 2014, based on the COSO criteria.
We also have audited, in accordance with the standards of the Public Company Accounting Oversight Board (United States), the consolidated balance sheets of Verizon as of December 31, 2014 and 2013, and the related consolidated statements of income, comprehensive income, cash flows and changes in equity for each of the three years in the period ended December 31, 2014 and our report dated February 23, 2015 expressed an unqualified opinion thereon.
Ernst & Young LLPNew York, New York
February 23, 2015
RepoRt of Independent RegIsteRed publIC aCCountIng fIRM

38
v e r i zo n co m m u n i c at i o n s i n c . a n d s u b s i d i a r i e s
ConsolIdated stateMents of InCoMe
(dollars in millions, except per share amounts)
Years Ended December 31, 2014 2013 2012
Operating Revenues $ 127,079 $ 120,550 $ 115,846
Operating ExpensesCost of services and sales (exclusive of items shown below) 49,931 44,887 46,275Selling, general and administrative expense 41,016 27,089 39,951Depreciation and amortization expense 16,533 16,606 16,460
Total Operating Expenses 107,480 88,582 102,686
Operating Income 19,599 31,968 13,160Equity in earnings of unconsolidated businesses 1,780 142 324Other income and (expense), net (1,194) (166) (1,016)Interest expense (4,915) (2,667) (2,571)Income Before (Provision) Benefit For Income Taxes 15,270 29,277 9,897(Provision) Benefit for income taxes (3,314) (5,730) 660Net Income $ 11,956 $ 23,547 $ 10,557
Net income attributable to noncontrolling interests $ 2,331 $ 12,050 $ 9,682Net income attributable to Verizon 9,625 11,497 875Net Income $ 11,956 $ 23,547 $ 10,557
Basic Earnings Per Common ShareNet income attributable to Verizon $ 2.42 $ 4.01 $ .31Weighted-average shares outstanding (in millions) 3,974 2,866 2,853
Diluted Earnings Per Common ShareNet income attributable to Verizon $ 2.42 $ 4.00 $ .31Weighted-average shares outstanding (in millions) 3,981 2,874 2,862
See Notes to Consolidated Financial Statements

39
ConsolIdated stateMents of CoMpRehensIve InCoMe
(dollars in millions)
Years Ended December 31, 2014 2013 2012
Net Income $ 11,956 $ 23,547 $ 10,557Other Comprehensive Income, net of taxes
Foreign currency translation adjustments (1,199) 60 69Unrealized gain (loss) on cash flow hedges (197) 25 (68)Unrealized gain (loss) on marketable securities (5) 16 29Defined benefit pension and postretirement plans 154 22 936
Other comprehensive income (loss) attributable to Verizon (1,247) 123 966Other comprehensive income (loss) attributable to noncontrolling interests (23) (15) 10Total Comprehensive Income $ 10,686 $ 23,655 $ 11,533Comprehensive income attributable to noncontrolling interests 2,308 12,035 9,692Comprehensive income attributable to Verizon 8,378 11,620 1,841Total Comprehensive Income $ 10,686 $ 23,655 $ 11,533
See Notes to Consolidated Financial Statements
v e r i zo n co m m u n i c at i o n s i n c . a n d s u b s i d i a r i e s

40
ConsolIdated balanCe sheets
v e r i zo n co m m u n i c at i o n s i n c . a n d s u b s i d i a r i e s
(dollars in millions, except per share amounts)
At December 31, 2014 2013
AssetsCurrent assets
Cash and cash equivalents $ 10,598 $ 53,528Short-term investments 555 601Accounts receivable, net of allowances of $739 and $645 13,993 12,439Inventories 1,153 1,020Prepaid expenses and other 3,324 3,406
Total current assets 29,623 70,994
Plant, property and equipment 230,508 220,865Less accumulated depreciation 140,561 131,909
89,947 88,956
Investments in unconsolidated businesses 802 3,432Wireless licenses 75,341 75,747Goodwill 24,639 24,634Other intangible assets, net 5,728 5,800Other assets 6,628 4,535Total assets $ 232,708 $ 274,098
Liabilities and EquityCurrent liabilities
Debt maturing within one year $ 2,735 $ 3,933Accounts payable and accrued liabilities 16,680 16,453Other 8,649 6,664
Total current liabilities 28,064 27,050
Long-term debt 110,536 89,658Employee benefit obligations 33,280 27,682Deferred income taxes 41,578 28,639Other liabilities 5,574 5,653
EquitySeries preferred stock ($.10 par value; none issued) – – Common stock ($.10 par value; 4,242,374,240 and 2,967,610,119 shares
issued in each period, respectively) 424 297Contributed capital 11,155 37,939Reinvested earnings 2,447 1,782Accumulated other comprehensive income 1,111 2,358Common stock in treasury, at cost (3,263) (3,961)Deferred compensation – employee stock ownership plans and other 424 421Noncontrolling interests 1,378 56,580
Total equity 13,676 95,416Total liabilities and equity $ 232,708 $ 274,098
See Notes to Consolidated Financial Statements

41
v e r i zo n co m m u n i c at i o n s i n c . a n d s u b s i d i a r i e s
ConsolIdated stateMents of Cash flows
(dollars in millions)
Years Ended December 31, 2014 2013 2012
Cash Flows from Operating ActivitiesNet Income $ 11,956 $ 23,547 $ 10,557Adjustments to reconcile net income to net cash provided by operating activities:
Depreciation and amortization expense 16,533 16,606 16,460Employee retirement benefits 8,130 (5,052) 8,198Deferred income taxes (92) 5,785 (952)Provision for uncollectible accounts 1,095 993 972Equity in earnings of unconsolidated businesses, net of dividends received (1,743) (102) 77Changes in current assets and liabilities, net of effects from
acquisition/disposition of businessesAccounts receivable (2,745) (843) (1,717)Inventories (132) 56 (136)Other assets (695) (143) 306Accounts payable and accrued liabilities 1,412 925 1,144
Other, net (3,088) (2,954) (3,423)Net cash provided by operating activities 30,631 38,818 31,486
Cash Flows from Investing ActivitiesCapital expenditures (including capitalized software) (17,191) (16,604) (16,175)Acquisitions of investments and businesses, net of cash acquired (182) (494) (913)Acquisitions of wireless licenses (354) (580) (4,298)Proceeds from dispositions of wireless licenses 2,367 2,111 363Proceeds from dispositions of businesses 120 – – Other, net (616) 734 521
Net cash used in investing activities (15,856) (14,833) (20,502)
Cash Flows from Financing ActivitiesProceeds from long-term borrowings 30,967 49,166 4,489Repayments of long-term borrowings and capital lease obligations (17,669) (8,163) (6,403)Decrease in short-term obligations, excluding current maturities (475) (142) (1,437)Dividends paid (7,803) (5,936) (5,230)Proceeds from sale of common stock 34 85 315Purchase of common stock for treasury – (153) – Special distribution to noncontrolling interest – (3,150) (8,325)Acquisition of noncontrolling interest (58,886) – – Other, net (3,873) (5,257) (4,662)
Net cash provided by (used in) financing activities (57,705) 26,450 (21,253)
Increase (decrease) in cash and cash equivalents (42,930) 50,435 (10,269)Cash and cash equivalents, beginning of period 53,528 3,093 13,362Cash and cash equivalents, end of period $ 10,598 $ 53,528 $ 3,093
See Notes to Consolidated Financial Statements

42
ConsolIdated stateMents of Changes In equIty
(dollars in millions, except per share amounts, and shares in thousands)
Years Ended December 31, 2014 2013 2012Shares Amount Shares Amount Shares Amount
Common StockBalance at beginning of year 2,967,610 $ 297 2,967,610 $ 297 2,967,610 $ 297Common shares issued (Note 2) 1,274,764 127 – – – – Balance at end of year 4,242,374 424 2,967,610 297 2,967,610 297
Contributed CapitalBalance at beginning of year 37,939 37,990 37,919Acquisition of noncontrolling interest (Note 2) (26,898) – – Other 114 (51) 71Balance at end of year 11,155 37,939 37,990
Reinvested Earnings (Accumulated Deficit)Balance at beginning of year 1,782 (3,734) 1,179Net income attributable to Verizon 9,625 11,497 875Dividends declared ($2.16, $2.09, $2.03) per share (8,960) (5,981) (5,788)Balance at end of year 2,447 1,782 (3,734)
Accumulated Other Comprehensive IncomeBalance at beginning of year attributable to Verizon 2,358 2,235 1,269Foreign currency translation adjustments (1,199) 60 69Unrealized gains (losses) on cash flow hedges (197) 25 (68)Unrealized gains (losses) on marketable securities (5) 16 29Defined benefit pension and postretirement plans 154 22 936Other comprehensive income (loss) (1,247) 123 966Balance at end of year attributable to Verizon 1,111 2,358 2,235
Treasury StockBalance at beginning of year (105,610) (3,961) (109,041) (4,071) (133,594) (5,002)Shares purchased – – (3,500) (153) – – Employee plans (Note 16) 14,132 541 6,835 260 11,434 433Shareowner plans (Note 16) 4,105 157 96 3 13,119 498Other (37) – – – – – Balance at end of year (87,410) (3,263) (105,610) (3,961) (109,041) (4,071)
Deferred Compensation-ESOPs and OtherBalance at beginning of year 421 440 308Restricted stock equity grant 166 152 196Amortization (163) (171) (64)Balance at end of year 424 421 440
Noncontrolling InterestsBalance at beginning of year 56,580 52,376 49,938Acquisition of noncontrolling interest (Note 2) (55,960) – – Net income attributable to noncontrolling interests 2,331 12,050 9,682Other comprehensive income (loss) (23) (15) 10Total comprehensive income (loss) 2,308 12,035 9,692Distributions and other (1,550) (7,831) (7,254)Balance at end of year 1,378 56,580 52,376
Total Equity $ 13,676 $ 95,416 $ 85,533
See Notes to Consolidated Financial Statements
v e r i zo n co m m u n i c at i o n s i n c . a n d s u b s i d i a r i e s
43
notes to ConsolIdated fInanCIal stateMents
NOTE 1
DESCRIPTION OF BUSINESS AND SUMMARY OF SIGNIFICANT ACCOUNTING POLICIES
Revenue RecognitionMultiple Deliverable ArrangementsIn both our Wireless and Wireline segments, we offer products and services to our customers through bundled arrangements. These arrangements involve multiple deliverables which may include products, services, or a combination of products and services.
WirelessOur Wireless segment earns revenue primarily by providing access to and usage of its network. In general, access revenue is billed one month in advance and recognized when earned. Usage revenue is generally billed in arrears and recognized when service is rendered. Equipment sales revenue associated with the sale of wireless handsets and accessories is generally recognized when the products are delivered to and accepted by the customer, as this is considered to be a separate earnings process from providing wireless services. For agreements involving the resale of third-party services in which we are considered the primary obligor in the arrangements, we record the revenue gross at the time of the sale. For equipment sales, we generally subsidize the cost of wireless devices for plans under our traditional subsidy model. The amount of this sub-sidy is generally contingent on the arrangement and terms selected by the customer. In multiple deliverable arrangements which involve the sale of equipment and a service contract, the equipment revenue is rec-ognized up to the amount collected when the wireless device is sold.
In addition to the traditional subsidy model for equipment sales, we offer new and existing customers the option to participate in Verizon Edge, a program that provides eligible wireless customers with the ability to pay for handsets under an equipment installment plan. Under the Verizon Edge program, customers have the right to upgrade their handset after a minimum of 30 days, subject to certain conditions, including making a stated portion of the required device payments, trading in their handset in good working condition and signing a new contract with Verizon. Upon upgrade, the outstanding balance of the equipment installment plan is exchanged for the used handset. This trade-in right is accounted for as a guarantee obligation.
Verizon Edge is a multiple-element arrangement typically consisting of the trade-in right, handset and monthly wireless service. At the incep-tion of the arrangement, the amount allocable to the delivered units of accounting is limited to the amount that is not contingent upon the delivery of the monthly wireless service (the noncontingent amount). The full amount of the trade-in right’s fair value (not an allocated value) will be recognized as the guarantee liability and the remaining allocable consideration will be allocated to the handset. The value of the guar-antee liability effectively results in a reduction to revenue recognized for the sale of the handset. The guarantee liability is measured at fair value upon initial recognition based on assumptions lacking observ-able pricing inputs including the probability and timing of the customer upgrading to a new phone, the customer’s estimated remaining install-ment balance at the time of trade-in and the estimated fair value of the phone at the time of trade-in and therefore is classified within Level 3 of the fair value hierarchy. When the customer trades-in their used phone, the handset received is recorded to inventory and measured as the dif-ference between the remaining equipment installment plan balance at the time of trade-in and the guarantee liability. As a result of changes in the Verizon Edge program during 2014, and corresponding changes in related assumptions, the guarantee liability associated with Verizon Edge
v e r i zo n co m m u n i c at i o n s i n c . a n d s u b s i d i a r i e s
Description of BusinessVerizon Communications Inc. (Verizon or the Company) is a holding com-pany that, acting through its subsidiaries, is one of the world’s leading providers of communications, information and entertainment products and services to consumers, businesses and governmental agencies with a presence around the world. We have two reportable segments, Wireless and Wireline. For further information concerning our business segments, see Note 14.
The Wireless segment provides wireless communications products and services across one of the most extensive and reliable wireless networks in the United States (U.S.) and has the largest fourth-generation (4G) Long-Term Evolution (LTE) technology and third-generation (3G) net-works of any U.S. wireless service provider.
The Wireline segment provides voice, data and video communications products and enhanced services, including broadband video and data, corporate networking solutions, data center and cloud services, security and managed network services and local and long distance voice ser-vices. We provide these products and services to consumers in the United States, as well as to carriers, businesses and government customers both in the United States and around the world.
Consolidation The method of accounting applied to investments, whether consoli-dated, equity or cost, involves an evaluation of all significant terms of the investments that explicitly grant or suggest evidence of control or influence over the operations of the investee. The consolidated financial statements include our controlled subsidiaries. For controlled subsidiaries that are not wholly-owned, the noncontrolling interests are included in Net income and Total equity. Investments in businesses which we do not control, but have the ability to exercise significant influence over oper-ating and financial policies, are accounted for using the equity method. Investments in which we do not have the ability to exercise significant influence over operating and financial policies are accounted for under the cost method. Equity and cost method investments are included in Investments in unconsolidated businesses in our consolidated bal-ance sheets. Certain of our cost method investments are classified as available-for-sale securities and adjusted to fair value pursuant to the accounting standard related to debt and equity securities. All significant intercompany accounts and transactions have been eliminated.
Basis of PresentationWe have reclassified certain prior year amounts to conform to the current year presentation.
Use of EstimatesWe prepare our financial statements using U.S. generally accepted accounting principles (GAAP), which require management to make esti-mates and assumptions that affect reported amounts and disclosures. Actual results could differ from those estimates.
Examples of significant estimates include: the allowance for doubtful accounts, the recoverability of plant, property and equipment, the recoverability of intangible assets and other long-lived assets, unbilled revenues, fair values of financial instruments, unrecognized tax ben-efits, valuation allowances on tax assets, accrued expenses, pension and postretirement benefit assumptions, contingencies and allocation of pur-chase prices in connection with business combinations.

44
notes to ConsolIdated fInanCIal stateMents continued
agreements under the current program is not material. The guarantee liability may increase after initial recognition as a result of changes in facts or assumptions and we will account for any increase in the guar-antee liability with a corresponding decrease to revenue. The subsequent derecognition of the guarantee liability occurs when the guarantor is released from risk, which will occur at the earlier of the time the trade-in right is exercised or expires.
WirelineOur Wireline segment earns revenue based upon usage of its network and facilities and contract fees. In general, fixed monthly fees for voice, video, data and certain other services are billed one month in advance and recognized when earned. Revenue from services that are not fixed in amount and are based on usage is generally billed in arrears and rec-ognized when service is rendered.
We sell each of the services offered in bundled arrangements (i.e., voice, video and data), as well as separately; therefore each product or service has a standalone selling price. For these arrangements, revenue is allo-cated to each deliverable using a relative selling price method. Under this method, arrangement consideration is allocated to each separate deliver-able based on our standalone selling price for each product or service. These services include FiOS services, individually or in bundles, and High Speed Internet.
When we bundle equipment with maintenance and monitoring services, we recognize equipment revenue when the equipment is installed in accordance with contractual specifications and ready for the customer’s use. The maintenance and monitoring services are recognized monthly over the term of the contract as we provide the services.
Installation-related fees, along with the associated costs up to but not exceeding these fees, are deferred and amortized over the estimated cus-tomer relationship period.
For each of our segments, we report taxes imposed by governmental authorities on revenue-producing transactions between us and our cus-tomers on a net basis.
Maintenance and RepairsWe charge the cost of maintenance and repairs, including the cost of replacing minor items not constituting substantial betterments, princi-pally to Cost of services and sales as these costs are incurred.
Advertising Costs Costs for advertising products and services as well as other promotional and sponsorship costs are charged to Selling, general and administrative expense in the periods in which they are incurred (see Note 16).
Earnings Per Common ShareBasic earnings per common share are based on the weighted-average number of shares outstanding during the period. Where appropriate, diluted earnings per common share include the dilutive effect of shares issuable under our stock-based compensation plans.
There were a total of approximately 7 million, 8 million and 9 million out-standing dilutive securities, primarily consisting of restricted stock units, included in the computation of diluted earnings per common share for the years ended December 31, 2014, 2013 and 2012, respectively. Outstanding options to purchase shares that were not included in the computation of diluted earnings per common share, because to do so would have been anti-dilutive for the period, were not significant for the years ended December 31, 2014, 2013 and 2012, respectively.
On January 28, 2014, at a special meeting of our shareholders, we received shareholder approval to increase our authorized shares of common stock by 2 billion shares to an aggregate of 6.25 billion authorized shares of common stock. On February 4, 2014, this authorization became effec-tive. On February 21, 2014, we issued approximately 1.27 billion shares of common stock upon completing the acquisition of Vodafone Group Plc’s indirect 45% interest in Cellco Partnership d/b/a Verizon Wireless. See Note 2 for additional information.
Cash and Cash EquivalentsWe consider all highly liquid investments with a maturity of 90 days or less when purchased to be cash equivalents. Cash equivalents are stated at cost, which approximates quoted market value and include amounts held in money market funds.
Marketable Securities
We have investments in marketable securities, which are considered “available-for-sale” under the provisions of the accounting standard for certain debt and equity securities, and are included in the accompanying consolidated balance sheets in Short-term investments, Investments in unconsolidated businesses or Other assets. We continually evaluate our investments in marketable securities for impairment due to declines in market value considered to be other-than-temporary. That evalu-ation includes, in addition to persistent, declining stock prices, general economic and company-specific evaluations. In the event of a determi-nation that a decline in market value is other-than-temporary, a charge to earnings is recorded for the loss, and a new cost basis in the investment is established.
InventoriesInventory consists of wireless and wireline equipment held for sale, which is carried at the lower of cost (determined principally on either an average cost or first-in, first-out basis) or market.
Plant and DepreciationWe record plant, property and equipment at cost. Plant, property and equipment of wireline and wireless operations are generally depreciated on a straight-line basis.
Leasehold improvements are amortized over the shorter of the estimated life of the improvement or the remaining term of the related lease, calcu-lated from the time the asset was placed in service.
When the depreciable assets of our wireline and wireless operations are retired or otherwise disposed of, the related cost and accumulated depreciation are deducted from the plant accounts, and any gains or losses on disposition are recognized in income.
We capitalize and depreciate network software purchased or developed along with related plant assets. We also capitalize interest associated with the acquisition or construction of network-related assets. Capitalized interest is reported as a reduction in interest expense and depreciated as part of the cost of the network-related assets.
In connection with our ongoing review of the estimated remaining average useful lives of plant, property and equipment at our wireline and wireless operations, we determined that changes were necessary to the remaining estimated useful lives of certain assets as a result of technology upgrades, enhancements, and planned retirements. These changes resulted in an increase in depreciation expense of $0.6 billion in 2014. While the timing and extent of current deployment plans are subject to ongoing analysis and modification, we believe the current esti-mates of useful lives are reasonable.

45
notes to ConsolIdated fInanCIal stateMents continued
We test our wireless licenses for potential impairment annually. In 2014 and 2013, we performed a qualitative assessment to determine whether it is more likely than not that the fair value of our wireless licenses was less than the carrying amount. As part of our assessment, we consid-ered several qualitative factors including the business enterprise value of Wireless, macroeconomic conditions (including changes in interest rates and discount rates), industry and market considerations (including industry revenue and EBITDA (Earnings before interest, taxes, depreciation and amortization) margin projections), the projected financial perfor-mance of Wireless, as well as other factors. The most recent quantitative assessment of our wireless licenses occurred in 2012. Our quantitative assessment consisted of comparing the estimated fair value of our wire-less licenses to the aggregated carrying amount as of the test date. Using the quantitative assessment, we evaluated our licenses on an aggregate basis using a direct value approach. The direct value approach estimates fair value using a discounted cash flow analysis to estimate what a mar-ketplace participant would be willing to pay to purchase the aggregated wireless licenses as of the valuation date. If the fair value of the aggre-gated wireless licenses is less than the aggregated carrying amount of the licenses, an impairment is recognized.
Interest expense incurred while qualifying activities are performed to ready wireless licenses for their intended use is capitalized as part of wire-less licenses. The capitalization period ends when the development is discontinued or substantially complete and the license is ready for its intended use.
Intangible Assets Subject to Amortization and Long-Lived AssetsOur intangible assets that do not have indefinite lives (primarily customer lists and non-network internal-use software) are amortized over their esti-mated useful lives. All of our intangible assets subject to amortization and long-lived assets are reviewed for impairment whenever events or changes in circumstances indicate that the carrying amount of the asset may not be recoverable. If any indications were present, we would test for recoverability by comparing the carrying amount of the asset group to the net undiscounted cash flows expected to be generated from the asset group. If those net undiscounted cash flows do not exceed the carrying amount, we would perform the next step, which is to determine the fair value of the asset and record an impairment, if any. We reeval-uate the useful life determinations for these intangible assets each year to determine whether events and circumstances warrant a revision in their remaining useful lives.
For information related to the carrying amount of goodwill by segment, wireless licenses and other intangible assets, as well as the major com-ponents and average useful lives of our other acquired intangible assets, see Note 3.
Fair Value MeasurementsFair value of financial and non-financial assets and liabilities is defined as an exit price, representing the amount that would be received to sell an asset or paid to transfer a liability in an orderly transaction between market participants. The three-tier hierarchy for inputs used in mea-suring fair value, which prioritizes the inputs used in the methodologies of measuring fair value for assets and liabilities, is as follows:
Level 1 – Quoted prices in active markets for identical assets or liabilitiesLevel 2 – Observable inputs other than quoted prices in active markets
for identical assets and liabilitiesLevel 3 – No observable pricing inputs in the market
Financial assets and financial liabilities are classified in their entirety based on the lowest level of input that is significant to the fair value measure-ments. Our assessment of the significance of a particular input to the fair value measurements requires judgment, and may affect the valuation of the assets and liabilities being measured and their placement within the fair value hierarchy.
Computer Software CostsWe capitalize the cost of internal-use network and non-network software that has a useful life in excess of one year. Subsequent additions, modi-fications or upgrades to internal-use network and non-network software are capitalized only to the extent that they allow the software to perform a task it previously did not perform. Planning, software maintenance and training costs are expensed in the period in which they are incurred. Also, we capitalize interest associated with the development of internal-use network and non-network software. Capitalized non-network internal-use software costs are amortized using the straight-line method over a period of 3 to 7 years and are included in Other intangible assets, net in our consolidated balance sheets. For a discussion of our impairment policy for capitalized software costs, see “Goodwill and Other Intangible Assets” below. Also, see Note 3 for additional detail of internal-use non-network software reflected in our consolidated balance sheets.
Goodwill and Other Intangible AssetsGoodwillGoodwill is the excess of the acquisition cost of businesses over the fair value of the identifiable net assets acquired. Impairment testing for goodwill is performed annually in the fourth fiscal quarter or more frequently if impairment indicators are present. The Company has the option to perform a qualitative assessment to determine if the fair value of the entity is less than its carrying value. However, the Company may elect to perform an impairment test even if no indications of a poten-tial impairment exist. The impairment test for goodwill uses a two-step approach, which is performed at the reporting unit level. We have deter-mined that in our case, the reporting units are our operating segments since that is the lowest level at which discrete, reliable financial and cash flow information is available. Step one compares the fair value of the reporting unit (calculated using a market approach and/or a discounted cash flow method) to its carrying value. If the carrying value exceeds the fair value, there is a potential impairment and step two must be per-formed. Step two compares the carrying value of the reporting unit’s goodwill to its implied fair value (i.e., fair value of reporting unit less the fair value of the unit’s assets and liabilities, including identifiable intan-gible assets). If the implied fair value of goodwill is less than the carrying amount of goodwill, an impairment is recognized.
Intangible Assets Not Subject to AmortizationA significant portion of our intangible assets are wireless licenses that provide our wireless operations with the exclusive right to utilize des-ignated radio frequency spectrum to provide wireless communication services. While licenses are issued for only a fixed time, generally ten years, such licenses are subject to renewal by the Federal Communications Commission (FCC). License renewals have occurred routinely and at nominal cost. Moreover, we have determined that there are currently no legal, regulatory, contractual, competitive, economic or other factors that limit the useful life of our wireless licenses. As a result, we treat the wireless licenses as an indefinite-lived intangible asset. We reevaluate the useful life determination for wireless licenses each year to determine whether events and circumstances continue to support an indefinite useful life.

46
notes to ConsolIdated fInanCIal stateMents continued
Income TaxesOur effective tax rate is based on pre-tax income, statutory tax rates, tax laws and regulations and tax planning strategies available to us in the various jurisdictions in which we operate.
Deferred income taxes are provided for temporary differences in the bases between financial statement and income tax assets and liabili-ties. Deferred income taxes are recalculated annually at tax rates then in effect. We record valuation allowances to reduce our deferred tax assets to the amount that is more likely than not to be realized.
We use a two-step approach for recognizing and measuring tax benefits taken or expected to be taken in a tax return. The first step is recognition: we determine whether it is more likely than not that a tax position will be sustained upon examination, including resolution of any related appeals or litigation processes, based on the technical merits of the position. In evaluating whether a tax position has met the more-likely-than-not rec-ognition threshold, we presume that the position will be examined by the appropriate taxing authority that has full knowledge of all relevant information. The second step is measurement: a tax position that meets the more-likely-than-not recognition threshold is measured to determine the amount of benefit to recognize in the financial statements. The tax position is measured at the largest amount of benefit that is greater than 50 percent likely of being realized upon ultimate settlement. Differences between tax positions taken in a tax return and amounts recognized in the financial statements will generally result in one or more of the fol-lowing: an increase in a liability for income taxes payable, a reduction of an income tax refund receivable, a reduction in a deferred tax asset, or an increase in a deferred tax liability.
The accounting standard relating to income taxes generated by lever-aged lease transactions requires that changes in the projected timing of income tax cash flows generated by a leveraged lease transaction be rec-ognized as a gain or loss in the year in which the change occurs.
Significant management judgment is required in evaluating our tax posi-tions and in determining our effective tax rate.
Stock-Based CompensationWe measure and recognize compensation expense for all stock-based compensation awards made to employees and directors based on esti-mated fair values. See Note 11 for further details.
Foreign Currency Translation The functional currency of our foreign operations is generally the local currency. For these foreign entities, we translate income statement amounts at average exchange rates for the period, and we translate assets and liabilities at end-of-period exchange rates. We record these translation adjustments in Accumulated other comprehensive income, a separate component of Equity, in our consolidated balance sheets. We report exchange gains and losses on intercompany foreign currency transactions of a long-term nature in Accumulated other comprehensive income. Other exchange gains and losses are reported in income.
Employee Benefit PlansPension and postretirement health care and life insurance benefits earned during the year as well as interest on projected benefit obli-gations are accrued currently. Prior service costs and credits resulting from changes in plan benefits are generally amortized over the average remaining service period of the employees expected to receive benefits. Expected return on plan assets is determined by applying the return on assets assumption to the actual fair value of plan assets. Actuarial gains and losses are recognized in operating results in the year in which they occur. These gains and losses are measured annually as of December 31 or upon a remeasurement event. Verizon management employees no longer earn pension benefits or earn service towards the company retiree medical subsidy (see Note 12).
We recognize a pension or a postretirement plan’s funded status as either an asset or liability on the consolidated balance sheets. Also, we measure any unrecognized prior service costs and credits that arise during the period as a component of Accumulated other comprehensive income, net of applicable income tax.
Derivative InstrumentsWe have entered into derivative transactions primarily to manage our exposure to fluctuations in foreign currency exchange rates, interest rates, equity and commodity prices. We employ risk management strategies, which may include the use of a variety of derivatives including cross cur-rency swaps, foreign currency and prepaid forwards and collars, interest rate and commodity swap agreements and interest rate locks. We do not hold derivatives for trading purposes.
We measure all derivatives, including derivatives embedded in other financial instruments, at fair value and recognize them as either assets or liabilities on our consolidated balance sheets. Our derivative instru-ments are valued primarily using models based on readily observable market parameters for all substantial terms of our derivative contracts and thus are classified as Level 2. Changes in the fair values of deriva-tive instruments not qualifying as hedges or any ineffective portion of hedges are recognized in earnings in the current period. Changes in the fair values of derivative instruments used effectively as fair value hedges are recognized in earnings, along with changes in the fair value of the hedged item. Changes in the fair value of the effective portions of cash flow hedges are reported in Other comprehensive income (loss) and rec-ognized in earnings when the hedged item is recognized in earnings.
Recently Adopted Accounting StandardsDuring the first quarter of 2014, we adopted the accounting standard update relating to the presentation of an unrecognized tax benefit when a net operating loss carryforward, a similar tax loss, or a tax credit car-ryforward exists. The standard update provides that a liability related to an unrecognized tax benefit should be offset against same jurisdiction deferred tax assets for a net operating loss carryforward, a similar tax loss, or a tax credit carryforward if such settlement is required or expected in the event the uncertain tax position is disallowed. The adoption of this standard update did not have a significant impact on our consolidated financial statements.
Recently Issued Accounting StandardsIn April 2014, the accounting standard update related to the reporting of discontinued operations and disclosures of disposals of components of an entity was issued. This standard update changes the criteria for reporting discontinued operations and enhances convergence of the reporting requirements for discontinued operations. As a result of this standard update, a disposal of a component of an entity or a group of

47
notes to ConsolIdated fInanCIal stateMents continued
components of an entity is required to be reported in discontinued oper-ations if the disposal represents a strategic shift that has, or will have, a major effect on an entity’s operations and financial results. We will adopt this standard update during the first quarter of 2015. We are currently evaluating the impact that this standard update will have on our consoli-dated financial statements.
In May 2014, the accounting standard update related to the recogni-tion of revenue from contracts with customers was issued. This standard update clarifies the principles for recognizing revenue and develops a common revenue standard for U.S. GAAP and International Financial Reporting Standards. The standard update intends to provide a more robust framework for addressing revenue issues; improve comparability of revenue recognition practices across entities, industries, jurisdictions, and capital markets; and provide more useful information to users of financial statements through improved disclosure requirements. Upon adoption of this standard update, we expect that the allocation and timing of revenue recognition will be impacted. We expect to adopt this standard update during the first quarter of 2017.
There are two adoption methods available for implementation of the standard update related to the recognition of revenue from contracts with customers. Under one method, the guidance is applied retro-spectively to contracts for each reporting period presented, subject to allowable practical expedients. Under the other method, the guidance is applied to contracts not completed as of the date of initial applica-tion, recognizing the cumulative effect of the change as an adjustment to the beginning balance of retained earnings, and also requires addi-tional disclosures comparing the results to the previous guidance. We are currently evaluating these adoption methods and the impact that this standard update will have on our consolidated financial statements.
In June 2014, the accounting standard update related to the accounting for share-based payments when the terms of an award provide that a performance target could be achieved after the requisite service period was issued. The standard update resolves the diverse accounting treat-ment for these share-based payments by requiring that a performance target that affects vesting and that could be achieved after the requisite service period be treated as a performance condition. The requisite ser-vice period ends when the employee can cease rendering service and still be eligible to vest in the award if the performance target is achieved. We will adopt this standard update during the first quarter of 2016. The adoption of this standard update is not expected to have a significant impact on our consolidated financial statements.
In January 2015, the accounting standard update related to the reporting of extraordinary and unusual items was issued. This standard update eliminates the concept of extraordinary items from U.S. GAAP as part of an initiative to reduce complexity in accounting standards while main-taining or improving the usefulness of the information provided to the users of the financial statements. The presentation and disclosure guid-ance for items that are unusual in nature or occur infrequently will be retained and expanded to include items that are both unusual in nature and infrequent in occurrence. This standard update is effective as of the first quarter of 2016; however, earlier adoption is permitted.
NOTE 2
ACQUISITIONS AND DIVESTITURES
Wireless
Wireless TransactionOn September 2, 2013, Verizon entered into a stock purchase agreement (the Stock Purchase Agreement) with Vodafone Group Plc (Vodafone) and Vodafone 4 Limited (Seller), pursuant to which Verizon agreed to acquire Vodafone’s indirect 45% interest in Cellco Partnership d/b/a Verizon Wireless (the Partnership, and such interest, the Vodafone Interest) for aggregate consideration of approximately $130 billion.
On February 21, 2014, pursuant to the terms and subject to the conditions set forth in the Stock Purchase Agreement, Verizon acquired (the Wireless Transaction) from Seller all of the issued and outstanding capital stock (the Transferred Shares) of Vodafone Americas Finance 1 Inc., a subsidiary of Seller (VF1 Inc.), which indirectly through certain subsidiaries (together with VF1 Inc., the Purchased Entities) owned the Vodafone Interest. In consideration for the Transferred Shares, upon completion of the Wireless Transaction, Verizon (i) paid approximately $58.89 billion in cash, (ii) issued approximately 1.27 billion shares of Verizon’s common stock, par value $0.10 per share (the Stock Consideration), which was valued at approxi-mately $61.3 billion at the closing of the Wireless Transaction, (iii) issued senior unsecured Verizon notes in an aggregate principal amount of $5.0 billion (the Verizon Notes), (iv) sold Verizon’s indirectly owned 23.1% interest in Vodafone Omnitel N.V. (Omnitel, and such interest, the Omnitel Interest), valued at $3.5 billion and (v) provided other consideration, which included the assumption of preferred stock valued at approxi-mately $1.7 billion. The total cash paid to Vodafone and the other costs of the Wireless Transaction, including financing, legal and bank fees, were financed through the incurrence of third-party indebtedness. See Note 8 for additional information.
In accordance with the accounting standard on consolidation, a change in a parent’s ownership interest while the parent retains a controlling financial interest in its subsidiary is accounted for as an equity transaction and remeasurement of assets and liabilities of previously controlled and consolidated subsidiaries is not permitted. As a result, we accounted for the Wireless Transaction by adjusting the carrying amount of the noncon-trolling interest to reflect the change in Verizon’s ownership interest in the Partnership. Any difference between the fair value of the consideration paid and the amount by which the noncontrolling interest is adjusted has been recognized in equity attributable to Verizon.
Omnitel Transaction On February 21, 2014, Verizon and Vodafone also consummated the sale of the Omnitel Interest (the Omnitel Transaction) by a subsidiary of Verizon to a subsidiary of Vodafone in connection with the Wireless Transaction pursuant to a separate share purchase agreement. As a result, during 2014, we recognized a pre-tax gain of $1.9 billion on the disposal of the Omnitel interest in Equity in earnings of unconsolidated businesses on our consolidated statement of income.
Verizon Notes (Non-Cash Transaction)The Verizon Notes were issued pursuant to Verizon’s existing indenture. The Verizon Notes were issued in two separate series, with $2.5 billion due February 21, 2022 (the eight-year Verizon Notes) and $2.5 billion due February 21, 2025 (the eleven-year Verizon Notes). The Verizon Notes bear interest at a floating rate, which will be reset quarterly, with interest payable quarterly in arrears, beginning May 21, 2014. The eight-year Verizon notes bear interest at a floating rate equal to three-month London Interbank

48
notes to ConsolIdated fInanCIal stateMents continued
Offered Rate (LIBOR), plus 1.222%, and the eleven-year Verizon notes bear interest at a floating rate equal to three-month LIBOR, plus 1.372%. The indenture that governs the Verizon Notes contains certain negative cov-enants, including a negative pledge covenant and a merger or similar transaction covenant, affirmative covenants and events of default that are customary for companies maintaining an investment grade credit rating. An event of default for either series of the Verizon Notes may result in acceleration of the entire principal amount of all debt securities of that series. Beginning two years after the closing of the Wireless Transaction, Verizon may redeem all or any portion of the outstanding Verizon Notes held by Vodafone or any of its affiliates for a redemption price of 100% of the principal amount plus accrued and unpaid interest. The Verizon Notes may only be transferred by Vodafone to third parties in specified amounts during specified periods, commencing January 1, 2017. Any Verizon Notes held by third parties will not be redeemable by Verizon prior to their maturity dates. Verizon has agreed to file a registration statement with respect to the Verizon Notes at least three months prior to the Verizon Notes becoming transferable.
Other Consideration (Non-Cash Transaction)Included in the other consideration provided to Vodafone is the indirect assumption of long-term obligations with respect to 5.143% Class D and Class E cumulative preferred stock (Preferred Stock) issued by one of the Purchased Entities. Both the Class D shares (825,000 shares outstanding) and Class E shares (825,000 shares outstanding) are mandatorily redeem-able in April 2020 at $1,000 per share plus any accrued and unpaid dividends. Dividends accrue at 5.143% per annum and will be treated as interest expense. Both the Class D and Class E shares have been classified as liability instruments and were recorded at fair value as determined at the closing of the Wireless Transaction.
Deferred Tax LiabilitiesCertain deferred taxes directly attributable to the Wireless Transaction have been calculated based on an analysis of taxes attributable to the difference between the tax basis of the investment in the noncontrol-ling interest that is assumed compared to Verizon’s book basis. As a result, Verizon recorded a deferred tax liability of approximately $13.5 billion.
Spectrum License TransactionsSince 2012, we have entered into several strategic spectrum transactions including:
• During the third quarter of 2012, after receiving the required regula-tory approvals, Verizon Wireless completed the following previously announced transactions in which we acquired wireless spectrum that will be used to deploy additional 4G LTE capacity:
o Verizon Wireless acquired Advanced Wireless Services (AWS) spec-trum in separate transactions with SpectrumCo and Cox TMI Wireless, LLC for which it paid an aggregate of $3.9 billion. Verizon Wireless has also recorded a liability of $0.4 billion related to a three-year service obligation to SpectrumCo’s members pursuant to commercial agreements executed concurrently with the SpectrumCo transaction.
o Verizon Wireless completed license purchase and exchange transactions with Leap Wireless, Savary Island Wireless, which is majority owned by Leap Wireless, and a subsidiary of T-Mobile USA, Inc. (T-Mobile USA). As a result of these transactions, Verizon Wireless received an aggregate $2.6 billion of AWS and Personal Communication Services (PCS) licenses at fair value and net cash proceeds of $0.2 billion, transferred certain AWS licenses to T-Mobile USA and a 700 megahertz (MHz) lower A block license to Leap Wireless, and recorded an immaterial gain.
• During the first quarter of 2013, we completed license exchange trans-actions with T-Mobile License LLC and Cricket License Company, LLC, a subsidiary of Leap Wireless, to exchange certain AWS licenses. These non-cash exchanges included a number of intra-market swaps that we expect will enable Verizon Wireless to make more efficient use of the AWS band. As a result of these exchanges, we received an aggregate $0.5 billion of AWS licenses at fair value and recorded an immaterial gain.
• During the third quarter of 2013, after receiving the required regulatory approvals, Verizon Wireless sold 39 lower 700 MHz B block spectrum licenses to AT&T Inc. (AT&T) in exchange for a payment of $1.9 billion and the transfer by AT&T to Verizon Wireless of AWS (10 MHz) licenses in certain markets in the western United States. Verizon Wireless also sold certain lower 700 MHz B block spectrum licenses to an investment firm for a payment of $0.2 billion. As a result, we received $0.5 billion of AWS licenses at fair value and we recorded a pre-tax gain of approximately $0.3 billion in Selling, general and administrative expense on our con-solidated statement of income for the year ended December 31, 2013.
• During the second quarter of 2014, we completed license exchange transactions with T-Mobile USA to exchange certain AWS and PCS licenses. The exchange included a number of swaps that we expect will result in more efficient use of the AWS and PCS bands. As a result of these exchanges, we received $0.9 billion of AWS and PCS spectrum licenses at fair value and we recorded an immaterial gain.
• During the second quarter of 2014, we completed transactions pursuant to two additional agreements with T-Mobile USA with respect to our remaining 700 MHz A block spectrum licenses. Under one agreement, we sold certain of these licenses to T-Mobile USA in exchange for cash consideration of approximately $2.4 billion, and under the second agreement we exchanged the remainder of our 700 MHz A block spectrum licenses as well as AWS and PCS spectrum licenses for AWS and PCS spectrum licenses. As a result, we received $1.6 billion of AWS and PCS spectrum licenses at fair value and we recorded a pre-tax gain of approximately $0.7 billion in Selling, general and administrative expense on our consolidated statement of income for the year ended December 31, 2014.
• During the third quarter of 2014, we entered into a license exchange agreement with affiliates of AT&T Inc. to exchange certain AWS and PCS spectrum licenses. This non-cash exchange was completed in January 2015 at which time we recorded an immaterial gain.
• On January 29, 2015, the FCC completed an auction of 65 MHz of spec-trum, which it identified as the AWS-3 band. Verizon participated in that auction, and was the high bidder on 181 spectrum licenses, for which we will pay approximately $10.4 billion. During the fourth quarter of 2014, we made a deposit of $0.9 billion related to our participation in this auction. On February 13, 2015, we made a down payment of $1.2 billion for these spectrum licenses. Verizon has submitted an applica-tion for these licenses and must complete payment for them in the first quarter of 2015.

49
notes to ConsolIdated fInanCIal stateMents continued
Tower Monetization TransactionOn February 5, 2015, we announced an agreement with American Tower Corporation (American Tower) pursuant to which American Tower will have the exclusive rights to lease and operate over 11,300 of our wireless towers for an upfront payment of $5.0 billion. Under the terms of the leases, American Tower will have exclusive rights to lease and operate the towers over an average term of approximately 28 years. As part of this transaction, we will also sell 165 towers for $0.1 billion. We will sub-lease capacity on the towers from American Tower for a minimum of 10 years at current market rates, with options to renew. As the leases expire, American Tower will have fixed-price purchase options to acquire these towers based on their anticipated fair market values at the end of the lease terms. We plan to account for the upfront payment primarily as pre-paid rent and a portion as a financing obligation. This transaction, which is subject to customary closing conditions, is expected to close during the first half of 2015.
OtherDuring 2014 and 2013, we acquired various other wireless licenses and markets for cash consideration that was not significant. Additionally, during 2013, we obtained control of previously unconsolidated wire-less partnerships, which were previously accounted for under the equity method and are now consolidated, which resulted in an imma-terial gain. In 2013, we recorded $0.2 billion of goodwill as a result of these transactions.
During 2012, we acquired various other wireless licenses and markets for cash consideration that was not significant and recorded $0.2 billion of goodwill as a result of these transactions.
Wireline
Access Line SaleOn February 5, 2015, we announced that we have entered into a defini-tive agreement with Frontier Communications Corporation (Frontier) pursuant to which Verizon will sell its local exchange business and related landline activities in California, Florida, and Texas, including FiOS Internet and Video customers, switched and special access lines and high-speed Internet service and long distance voice accounts in these three states for approximately $10.5 billion. The transaction, which includes the acquisition by Frontier of the equity interests of Verizon’s incumbent local exchange carriers (ILECs) in California, Florida and Texas, does not involve any assets or liabilities of Verizon Wireless. The assets and liabilities that will be sold are currently included in Verizon’s continuing operations. As part of the transaction, Frontier will assume $0.6 billion of indebtedness from Verizon. The transaction is subject to the satisfaction of certain closing conditions including, among others, receipt of state and federal telecommunications regulatory approvals, and we expect this transac-tion to close during the first half of 2016.
The transaction will result in Frontier acquiring approximately 1.5 mil-lion FiOS Internet subscribers, 1.2 million FiOS Video subscribers and the related ILEC businesses from Verizon. This business generated revenues of approximately $5.4 billion, excluding revenue with affiliates, for Verizon in 2013, which is the most recent year for which audited stand-alone financial statements are currently available.
HUGHES Telematics, Inc.During July 2012, we acquired HUGHES Telematics, Inc. (HUGHES Telematics) for approximately $12 per share in cash for a total acquisition price of $0.6 billion. As a result of the transaction, HUGHES Telematics became a wholly-owned subsidiary of Verizon. The consolidated financial statements include the results of HUGHES Telematics’ operations from the date the acquisition closed. Upon closing, we recorded approximately $0.6 billion of goodwill, $0.1 billion of other intangibles, and assumed the debt obligations of HUGHES Telematics, which were approximately $0.1 billion as of the date of acquisition, and which were repaid by Verizon. Had this acquisition been completed on January 1, 2012, the results of the acquired operations of HUGHES Telematics would not have had a sig-nificant impact on the consolidated net income attributable to Verizon. The acquisition has accelerated our ability to bring more telematics offer-ings to market for existing and new customers.
The acquisition of HUGHES Telematics was accounted for as a business combination under the acquisition method. The cost of the acquisition was allocated to the assets and liabilities acquired based on their fair values as of the close of the acquisition, with the excess amount being recorded as goodwill.
Other On July 1, 2014, we sold a non-strategic Wireline business, which provides communications solutions to a variety of government agencies for net cash proceeds of $0.1 billion and recorded an immaterial gain.
OtherOn October 7, 2014, Redbox Instant by Verizon, a venture between Verizon and Redbox Automated Retail, LLC (Redbox), a wholly-owned subsidiary of Outerwall Inc., ceased providing service to its customers. In accordance with an agreement between the parties, Redbox withdrew from the venture on October 20, 2014 and Verizon wound down and dis-solved the venture during the fourth quarter of 2014. As a result of the termination of the venture, we recorded a pre-tax loss of $0.1 billion in the fourth quarter of 2014.
During February 2014, Verizon acquired a business dedicated to the development of Internet Protocol (IP) television for cash consideration that was not significant.
During the fourth quarter of 2013, Verizon acquired an industry leader in content delivery networks for $0.4 billion. Upon closing, we recorded $0.3 billion of goodwill. Additionally, we acquired a technology company for cash consideration that was not significant. The consolidated financial statements include the results of the operations of each of these acquisi-tions from the date each acquisition closed.

50
notes to ConsolIdated fInanCIal stateMents continued
The amortization expense for Other intangible assets was as follows:
Years (dollars in millions)
2014 $ 1,5672013 1,5872012 1,540
Estimated annual amortization expense for Other intangible assets is as follows:
Years (dollars in millions)
2015 $ 1,4282016 1,1932017 1,0082018 8432019 613
NOTE 3
WIRELESS LICENSES, GOODWILL AND OTHER INTANGIBLE ASSETS
Wireless LicensesChanges in the carrying amount of Wireless licenses are as follows:
(dollars in millions)
Balance at January 1, 2013 $ 77,744Acquisitions (Note 2) 579Dispositions (Note 2) (2,361)Capitalized interest on wireless licenses 566Reclassifications, adjustments and other (781)
Balance at December 31, 2013 $ 75,747Acquisitions (Note 2) 444Dispositions (Note 2) (1,978)Capitalized interest on wireless licenses 167Reclassifications, adjustments and other 961
Balance at December 31, 2014 $ 75,341
Reclassifications, adjustments and other includes the exchanges of wireless licenses in 2014 and 2013 as well as $0.3 and $0.9 billion of Wireless licenses that are classified as held for sale and included in Prepaid expenses and other on our consolidated balance sheets at December 31, 2014 and 2013, respectively. See Note 2 for additional details.
At December 31, 2014 and 2013, approximately $0.4 billion and $7.7 billion, respectively, of wireless licenses were under development for commercial service for which we were capitalizing interest costs. The decline is primarily due to the deployment of AWS licenses for commercial service during 2014.
The average remaining renewal period of our wireless license portfolio was 4.7 years as of December 31, 2014. See Note 1 for additional details.
GoodwillChanges in the carrying amount of Goodwill are as follows:
(dollars in millions)Wireless Wireline Total
Balance at January 1, 2013 $ 18,172 $ 5,967 $ 24,139Acquisitions (Note 2) 204 291 495
Balance at December 31, 2013 $ 18,376 $ 6,258 $ 24,634Acquisitions (Note 2) 15 40 55Dispositions (Note 2) – (38) (38)Reclassifications, adjustments and other (1) (11) (12)
Balance at December 31, 2014 $ 18,390 $ 6,249 $ 24,639
The increase in Goodwill at Wireless at December 31, 2013 was primarily due to obtaining control of previously unconsolidated wireless partnerships, which were previously accounted for under the equity method and are now consolidated. This resulted in an immaterial gain recorded during the year ended December 31, 2013. The increase in Goodwill at Wireline at December 31, 2013 was primarily due to the acquisition of a provider of content delivery networks.
Other Intangible AssetsThe following table displays the composition of Other intangible assets, net:
(dollars in millions)2014 2013
At December 31,Gross
AmountAccumulatedAmortization
NetAmount
GrossAmount
AccumulatedAmortization
NetAmount
Customer lists (5 to 13 years) $ 3,618 $ (2,924) $ 694 $ 3,639 $ (2,660) $ 979Non-network internal-use software (3 to 7 years) 13,194 (8,462) 4,732 11,770 (7,317) 4,453Other (2 to 25 years) 670 (368) 302 691 (323) 368Total $ 17,482 $ (11,754) $ 5,728 $ 16,100 $ (10,300) $ 5,800

51
Note 4
Plant, ProPert y and equiPment
the following table displays the details of Plant, property and equipment, which is stated at cost:
(dollars in millions)at december 31, Lives (years) 2014 2013
land – $ 763 $ 819Buildings and equipment 15 – 45 25,209 23,857Central office and other network
equipment 3 – 15 129,619 121,594Cable, poles and conduit 11 – 50 54,797 55,240leasehold improvements 5 – 20 6,374 5,877Work in progress – 4,580 4,176Furniture, vehicles and other 3 – 20 9,166 9,302
230,508 220,865less accumulated depreciation 140,561 131,909total $ 89,947 $ 88,956
Note 5
investments in unConsolidated Businesses
our investments in unconsolidated businesses are comprised of the following:
(dollars in millions)at december 31, ownership 2014 2013
equity Investeesvodafone omnitel(1) – $ – $ 2,511other Various 677 818total equity investees 677 3,329
Cost Investees Various 125 103total investments in
unconsolidated businesses $ 802 $ 3,432
(1) Prior to the completion of the Wireless transaction on February 21, 2014, verizon held a
23.1% ownership interest in vodafone omnitel.
dividends and repatriations of foreign earnings received from these investees were not significant in 2014 and 2013 and $0.4 billion in 2012. see note 13 regarding undistributed earnings of our foreign subsidiaries.
equity Method InvestmentsVodafone Omnitelvodafone omnitel n.v. (vodafone omnitel) is one of the largest wireless communications companies in italy. as part of the consideration of the Wireless transaction, a subsidiary of verizon sold its entire ownership interest in vodafone omnitel to a subsidiary of vodafone on February 21, 2014. see note 2 for additional information. at december 31, 2013, our investment in vodafone omnitel included goodwill of $1.1 billion.
Other Equity Investeesthe remaining investments include wireless partnerships in the u.s., lim-ited partnership investments in entities that invest in affordable housing projects and other smaller domestic and international investments.
Summarized Financial Information summarized financial information for our equity investees is as follows:
Balance Sheet (dollars in millions)at december 31, 2013
Current assets $ 3,983noncurrent assets 7,748total assets $ 11,731
Current liabilities $ 4,692noncurrent liabilities 5equity 7,034total liabilities and equity $ 11,731
Income Statement (dollars in millions)years ended december 31, 2013 2012
net revenue $ 8,984 $ 10,825operating income 1,632 2,823net income 925 1,679
the financial information for our equity method investees in 2014, including vodafone omnitel through the closing of the Wireless transaction in February 2014, was not significant and therefore is not reflected in the tables above.
Note 6
nonControlling interests
noncontrolling interests in equity of subsidiaries were as follows:
(dollars in millions)at december 31, 2014 2013
verizon Wireless $ – $ 55,465Wireless partnerships and other 1,378 1,115
$ 1,378 $ 56,580
Wireless Joint Venture our Wireless segment is primarily comprised of Cellco Partnership doing business as verizon Wireless (verizon Wireless). Cellco Partnership was formed as a joint venture in april 2000 by the combination of the u.s. wireless operations and interests of verizon and vodafone. on February 21, 2014, verizon completed the Wireless transaction and acquired 100% ownership of verizon Wireless. see note 2 for additional information.
Special Distributionsin may 2013, the Board of representatives of verizon Wireless declared a distribution to its owners, which was paid in the second quarter of 2013 in proportion to their partnership interests on the payment date, in the aggregate amount of $7.0 billion. as a result, vodafone received a cash payment of $3.15 billion and the remainder of the distribution was received by verizon.
in november 2012, the Board of representatives of verizon Wireless declared a distribution to its owners, which was paid in the fourth quarter of 2012 in proportion to their partnership interests on the payment date, in the aggregate amount of $8.5 billion. as a result, vodafone received a cash payment of $3.8 billion and the remainder of the distribution was received by verizon.
in July 2011, the Board of representatives of verizon Wireless declared a distribution to its owners, which was paid in the first quarter of 2012 in proportion to their partnership interests on the payment date, in the aggregate amount of $10 billion. as a result, vodafone received a cash payment of $4.5 billion and the remainder of the distribution was received by verizon.
Notes to CoNsolidated FiNaNCial statemeNts continued

52
notes to ConsolIdated fInanCIal stateMents continued
NOTE 7
LEASING ARRANGEMENTS
As LessorWe are the lessor in leveraged and direct financing lease agreements for commercial aircraft and power generating facilities, which comprise the majority of our leasing portfolio along with telecommunications equipment, commercial real estate property and other equipment. These leases have remaining terms of up to 36 years as of December 31, 2014. In addition, we lease space on certain of our cell towers to other wireless carriers. Minimum lease pay-ments receivable represent unpaid rentals, less principal and interest on third-party nonrecourse debt relating to leveraged lease transactions. Since we have no general liability for this debt, which is secured by a senior security interest in the leased equipment and rentals, the related principal and interest have been offset against the minimum lease payments receivable in accordance with U.S. GAAP. All recourse debt is reflected in our consolidated balance sheets.
At each reporting period, we monitor the credit quality of the various lessees in our portfolios. Regarding the leveraged lease portfolio, external credit reports are used where available and where not available we use internally developed indicators. These indicators or internal credit risk grades factor his-toric loss experience, the value of the underlying collateral, delinquency trends, and industry and general economic conditions. The credit quality of our lessees varies from AAA to CCC+. For each reporting period, the leveraged leases within the portfolio are reviewed for indicators of impairment where it is probable the rent due according to the contractual terms of the lease will not be collected. All significant accounts, individually or in the aggregate, are current and none are classified as impaired.
Finance lease receivables, which are included in Prepaid expenses and other and Other assets in our consolidated balance sheets, are comprised of the following:
(dollars in millions)At December 31, 2014 2013
Leveraged Leases
Direct Finance Leases Total
Leveraged Leases
Direct Finance Leases Total
Minimum lease payments receivable $ 1,095 $ 8 $ 1,103 $ 1,069 $ 16 $ 1,085Estimated residual value 600 2 602 780 5 785Unearned income (535) (2) (537) (589) (4) (593)Total $ 1,160 $ 8 $ 1,168 $ 1,260 $ 17 $ 1,277Allowance for doubtful accounts (78) (90)Finance lease receivables, net $ 1,090 $ 1,187Prepaid expenses and other $ 4 $ 5Other assets 1,086 1,182
$ 1,090 $ 1,187
Accumulated deferred taxes arising from leveraged leases, which are included in Deferred income taxes, amounted to $0.9 billion at December 31, 2014 and $1.0 billion at December 31, 2013.
The future minimum lease payments to be received from noncancelable capital leases (direct financing and leveraged leases), net of nonrecourse loan payments related to leveraged leases and allowances for doubtful accounts, along with expected receipts relating to operating leases for the periods shown at December 31, 2014, are as follows:
(dollars in millions)
YearsCapital Leases
Operating Leases
2015 $ 46 $ 1962016 115 1682017 39 762018 57 512019 44 19Thereafter 802 20Total $ 1,103 $ 530

53
NOTE 8
DEBT
Changes to debt during 2014 are as follows:
(dollars in millions)Debt Maturing
within One YearLong-term
Debt Total
Balance at January 1, 2014 $ 3,933 $ 89,658 $ 93,591Proceeds from long-term borrowings – 30,967 30,967Verizon Notes – 5,000 5,000Preferred Stock (Mandatorily Redeemable) – 1,650 1,650Repayments of long-term borrowings and capital leases obligations (4,022) (13,647) (17,669)Decrease in short-term obligations, excluding current maturities (475) – (475)Reclassifications of long-term debt 2,739 (2,739) – Other 560 (353) 207
Balance at December 31, 2014 $ 2,735 $ 110,536 $ 113,271
Debt maturing within one year is as follows:(dollars in millions)
At December 31, 2014 2013
Long-term debt maturing within one year $ 2,397 $ 3,486Short-term notes payable 319 –Commercial paper and other 19 447Total debt maturing within one year $ 2,735 $ 3,933
The weighted-average interest rate for our commercial paper outstanding was 0.4% and 0.2% at December 31, 2014 and 2013, respectively.
Credit FacilitiesOn July 31, 2014, we amended our $6.2 billion credit facility to increase the availability to $8.0 billion and extend the maturity to July 31, 2018. At the same time, we terminated our $2.0 billion 364-day revolving credit agreement. As of December 31, 2014, the unused borrowing capacity under this credit facility was approximately $7.9 billion. The credit facility does not require us to comply with financial covenants or maintain specified credit rat-ings, and it permits us to borrow even if our business has incurred a material adverse change. We use the credit facility for the issuance of letters of credit and for general corporate purposes.
As LesseeWe lease certain facilities and equipment for use in our operations under both capital and operating leases. Total rent expense under operating leases amounted to $2.7 billion in 2014, $2.6 billion in 2013 and $2.5 bil-lion in 2012, respectively.
On February 5, 2015, we announced an agreement with American Tower pursuant to which American Tower will have the exclusive rights to lease and operate over 11,300 of our wireless towers for an upfront payment of $5.0 billion. We will sublease capacity on the towers from American Tower for a minimum of 10 years at current market rates, with options to renew. Under this agreement, we expect to make minimum future lease payments of approximately $2.8 billion. See Note 2 for additional information.
Amortization of capital leases is included in Depreciation and amortiza-tion expense in the consolidated statements of income. Capital lease amounts included in Plant, property and equipment are as follows:
(dollars in millions)At December 31, 2014 2013
Capital leases $ 319 $ 353Less accumulated amortization 171 188Total $ 148 $ 165
notes to ConsolIdated fInanCIal stateMents continued
The aggregate minimum rental commitments under noncancelable leases for the periods shown at December 31, 2014, are as follows:
(dollars in millions)
YearsCapital Leases
Operating Leases
2015 $ 181 $ 2,4992016 137 2,2452017 113 1,9602018 68 1,6602019 39 1,369Thereafter 60 4,670Total minimum rental commitments 598 $ 14,403Less interest and executory costs 82Present value of minimum lease payments 516Less current installments 158Long-term obligation at December 31, 2014 $ 358

54
notes to ConsolIdated fInanCIal stateMents continued
Long-Term DebtOutstanding long-term debt obligations are as follows:
(dollars in millions)At December 31, Interest Rates % Maturities 2014 2013
Verizon Communications - notes payable and other 0.30 – 3.85 2015 – 2042 $ 27,617 $ 20,4164.15 – 5.50 2018 – 2054 40,701 20,2265.85 – 6.90 2018 – 2054 24,341 31,9657.35 – 8.95 2018 – 2039 2,264 5,023
Floating 2015 – 2025 14,600 5,500
Verizon Wireless - notes payable and other 8.75 – 8.88 2015 – 2018 676 3,931
Verizon Wireless - Alltel assumed notes 6.80 – 7.88 2029 – 2032 686 1,300
Telephone subsidiaries - debentures 5.13 – 6.86 2027 – 2033 1,075 1,0757.38 – 7.88 2022 – 2032 1,099 1,0998.00 – 8.75 2019 – 2031 880 880
Other subsidiaries - debentures and other 6.84 – 8.75 2018 – 2028 1,432 1,700
Capital lease obligations (average rate of 4.0% and 8.1% in 2014 and 2013, respectively) 516 293Unamortized discount, net of premium (2,954) (264)Total long-term debt, including current maturities 112,933 93,144Less long-term debt maturing within one year 2,397 3,486Total long-term debt $ 110,536 $ 89,658
following: $1.5 billion aggregate principal amount of 3.00% Notes due 2021, $2.5 billion aggregate principal amount of 3.50% Notes due 2024, and $2.5 billion aggregate principal amount of 4.40% Notes due 2034. The net proceeds from the issuance was used to redeem (i) in whole the following series of outstanding notes which were called for early redemp-tion in November 2014 (collectively, November Early Debt Redemption): $0.5 billion aggregate principal amount of Verizon Communications 4.90% Notes due 2015 at 103.7% of the principal amount of such notes, $0.6 billion aggregate principal amount of Verizon Communications 5.55% Notes due 2016 at 106.3% of the principal amount of such notes, $1.3 billion aggregate principal amount of Verizon Communications 3.00% Notes due 2016 at 103.4% of the principal amount of such notes, $0.4 billion aggregate principal amount of Verizon Communications 5.50% Notes due 2017 at 110.5% of the principal amount of such notes, $0.7 billion aggregate principal amount of Verizon Communications 8.75% Notes due 2018 at 125.2% of the principal amount of such notes, $0.1 billion aggregate principal amount of Alltel Corporation 7.00% Debentures due 2016 at 108.7% of the principal amount of such notes and $0.4 billion aggregate principal amount of Cellco Partnership and Verizon Wireless Capital LLC 8.50% Notes due 2018 at 124.5% of the principal amount of such notes; and (ii) $1.0 billion aggregate principal amount of Verizon Communications 2.50% Notes due 2016 at 103.0% of the principal amount of such notes. Proceeds not used for the redemp-tion of these notes will be used for general corporate purposes. Any accrued and unpaid interest was paid to the date of redemption (see “Early Debt Redemption and Other Costs”).
During December 2014, we issued €1.4 billion aggregate principal amount of 1.625% Notes due 2024 and €1.0 billion aggregate principal amount of 2.625% Notes due 2031. The issuance of these Notes resulted in cash proceeds of approximately $3.0 billion, net of discounts and issuance costs and after reimbursement of certain expenses. The net pro-ceeds were used for general corporate purposes.
Verizon Notes (Non-Cash Transaction)During February 2014, in connection with the Wireless Transaction, we issued $5.0 billion aggregate principal amount of floating rate notes. The Verizon Notes were issued in two separate series, with $2.5 billion due February 21, 2022 and $2.5 billion due February 21, 2025. The Verizon Notes bear interest at a floating rate, which will be reset quarterly, with
2014During February 2014, we issued €1.75 billion aggregate principal amount of 2.375% Notes due 2022, €1.25 billion aggregate principal amount of 3.25% Notes due 2026 and £0.85 billion aggregate principal amount of 4.75% Notes due 2034. The issuance of these Notes resulted in cash pro-ceeds of approximately $5.4 billion, net of discounts and issuance costs. The net proceeds were used, in part, to finance the Wireless Transaction. Net proceeds not used to finance the Wireless Transaction were used for general corporate purposes. Also, during February 2014, we issued $0.5 billion aggregate principal amount of 5.90% Notes due 2054 resulting in cash proceeds of approximately $0.5 billion, net of discounts and issu-ance costs. The net proceeds were used for general corporate purposes.
During March 2014, we issued $4.5 billion aggregate principal amount of fixed and floating rate notes resulting in cash proceeds of approximately $4.5 billion, net of discounts and issuance costs. The issuances consisted of the following: $0.5 billion aggregate principal amount Floating Rate Notes due 2019 that bear interest at a rate equal to three-month LIBOR plus 0.77% which rate will be reset quarterly, $0.5 billion aggregate prin-cipal amount of 2.55% Notes due 2019, $1.0 billion aggregate principal amount of 3.45% Notes due 2021, $1.25 billion aggregate principal amount of 4.15% Notes due 2024 and $1.25 billion aggregate principal amount of 5.05% Notes due 2034. During March 2014, the net proceeds were used to purchase notes in the Tender Offer described below.
Also, during March 2014, $1.0 billion of LIBOR plus 0.61% Verizon Communications Notes and $1.5 billion of 1.95% Verizon Communications Notes matured and were repaid.
During September 2014, we issued $0.9 billion aggregate principal amount of 4.8% Notes due 2044. The issuance of these Notes resulted in cash proceeds of approximately $0.9 billion, net of discounts and issu-ance costs. The net proceeds were used for general corporate purposes. Also, during September 2014, we redeemed $0.8 billion aggregate prin-cipal amount of Verizon 1.25% Notes due November 2014 and recorded an immaterial amount of early debt redemption costs.
During October 2014, we issued $6.5 billion aggregate principal amount of fixed rate notes. The issuance of these notes resulted in cash proceeds of approximately $6.4 billion, net of discounts and issuance costs and after reimbursement of certain expenses. The issuance consisted of the

notes to ConsolIdated fInanCIal stateMents continued
55
interest payable quarterly in arrears, beginning May 21, 2014 (see Note 2). The eight-year Verizon notes bear interest at a floating rate equal to three-month LIBOR, plus 1.222%, and the eleven-year Verizon notes bear interest at a floating rate equal to three-month LIBOR, plus 1.372%.
Preferred Stock (Non-Cash Transaction)As a result of the Wireless Transaction, we assumed long-term obliga-tions with respect to 5.143% Class D and Class E cumulative Preferred Stock issued by one of the Purchased Entities. Both the Class D shares (825,000 shares outstanding) and Class E shares (825,000 shares out-standing) are mandatorily redeemable in April 2020 at $1,000 per share plus any accrued and unpaid dividends. Dividends accrue at 5.143% per annum and will be treated as interest expense. Both the Class D and Class E shares have been classified as liability instruments and were recorded at fair value as determined at the closing of the Wireless Transaction.
Term Loan AgreementsDuring February 2014, we drew $6.6 billion pursuant to a term loan agreement, which was entered into during October 2013, with a group of major financial institutions to finance, in part, the Wireless Transaction. $3.3 billion of the loans under the term loan agreement had a maturity of three years (the 3-Year Loans) and $3.3 billion of the loans under the term loan agreement had a maturity of five years (the 5-Year Loans). The 5-Year Loans provide for the partial amortization of principal during the last two years that they are outstanding. Loans under the term loan agreement bear interest at floating rates. The term loan agreement contains certain negative covenants, including a negative pledge covenant, a merger or similar transaction covenant and an accounting changes covenant, affirmative covenants and events of default that are customary for com-panies maintaining an investment grade credit rating. In addition, the term loan agreement requires us to maintain a leverage ratio (as defined in the term loan agreement) not in excess of 3.50:1.00, until our credit rat-ings are equal to or higher than A3 and A- at Moody’s Investors Service and Standard & Poor’s Ratings Services, respectively.
The Tender Offer for each series of notes was subject to a financing con-dition, which was either satisfied or waived with respect to all series. The Tender Offer expired on March 17, 2014 and settled on March 19, 2014. In addition to the purchase price, any accrued and unpaid interest on the purchased notes was paid to the date of purchase. During March 2014, we recorded early debt redemption costs in connection with the Tender Offer (see “Early Debt Redemption and Other Costs”).
During June 2014, we issued $3.3 billion aggregate principal amount of fixed and floating rate notes resulting in cash proceeds of approximately $3.3 billion, net of discounts and issuance costs. The issuances consisted of the following: $1.3 billion aggregate principal amount of Floating Rate Notes due 2017 that will bear interest at a rate equal to three-month LIBOR plus 0.40% which will be reset quarterly and $2.0 billion aggregate principal amount of 1.35% Notes due 2017. We used the net proceeds from the offering of these notes to repay the 3-Year Loans on June 12, 2014.
During July 2014, we amended the term loan agreement, settled the out-standing $3.3 billion of 5-Year Loans and borrowed $3.3 billion of new loans. The new loans mature in July 2019, bear interest at a lower interest rate and require lower amortization payments in 2017 and 2018. In con-nection with the transaction, which primarily settled on a net basis, we recorded approximately $0.5 billion of proceeds from long-term borrow-ings and of repayments of long-term borrowings, respectively.
During January 2015, we entered into a term loan agreement with a major financial institution, pursuant to which we can borrow up to $6.5 billion for general corporate purposes, including the acquisition of spec-trum licenses. Borrowings under the term loan agreement mature in March 2016, with a partial mandatory prepayment required in June 2015. The term loan agreement contains certain negative covenants, including a negative pledge covenant, a merger or similar transaction covenant and an accounting changes covenant, affirmative covenants and events of default that are customary for companies maintaining an investment grade credit rating. In addition, the term loan agreement requires us to maintain a leverage ratio (as defined in the term loan agreement) not in excess of 3.50:1.00, until our credit ratings are equal to or higher than A3 and A- at Moody’s Investors Service and Standard & Poor’s Ratings Services, respectively.
May Exchange OfferOn May 29, 2014, we announced the commencement of a private exchange offer (the May Exchange Offer) to exchange up to all Cellco Partnership and Verizon Wireless Capital LLC’s £0.6 billion outstanding aggregate principal amount of 8.875% Notes due 2018 (the 2018 Old Notes) for Verizon’s new sterling-denominated Notes due 2024 (the New Notes) and an amount of cash. This exchange offer has been accounted for as a modification of debt. In connection with the May Exchange Offer, which expired on June 25, 2014, we issued £0.7 billion aggregate prin-cipal of New Notes and made a cash payment of £22 million in exchange for £0.6 billion aggregate principal amount of tendered 2018 Old Notes. The New Notes bear interest at a rate of 4.073% per annum.
Tender OfferOn March 10, 2014, we announced the commencement of a tender offer (the Tender Offer) to purchase for cash any and all of the series of notes listed in the following table:
(dollars in millions, except for Purchase Price)Interest
Rate MaturityPrincipal Amount
OutstandingPurchase
Price (1)Principal Amount
Purchased
Verizon Communications 6.10% 2018 $ 1,500 $ 1,170.07 $ 7485.50% 2018 1,500 1,146.91 7638.75% 2018 1,300 1,288.35 5645.55% 2016 1,250 1,093.62 6525.50% 2017 750 1,133.22 353
Cellco Partnership and Verizon Wireless Capital LLC 8.50% 2018 1,000 1,279.63 619
Alltel Corporation 7.00% 2016 300 1,125.26 157
GTE Corporation 6.84% 2018 600 1,196.85 266$ 4,122
(1) Per $1,000 principal amount of notes

56
Concurrent with the issuance of the New Notes, we entered into cross currency swaps to fix our future interest and principal payments in U.S. dollars (see Note 10).
July Exchange OffersOn July 23, 2014, we announced the commencement of eleven sepa-rate private offers to exchange (the July Exchange Offers) specified series of outstanding Notes issued by Verizon and Alltel Corporation (collec-tively, the Old Notes) for new Notes to be issued by Verizon. The July Exchange Offers have been accounted for as a modification of debt.
2013During March 2013, we issued $0.5 billion aggregate principal amount of floating rate Notes due 2015 in a private placement resulting in cash pro-ceeds of approximately $0.5 billion, net of discounts and issuance costs. The proceeds were used for the repayment of commercial paper.
During April 2013, $1.25 billion of 5.25% Verizon Communications Notes matured and were repaid. In addition, during June 2013, $0.5 billion of 4.375% Verizon Communications Notes matured and were repaid.
During September 2013, in connection with the Wireless Transaction, we issued $49.0 billion aggregate principal amount of fixed and floating rate notes resulting in cash proceeds of approximately $48.7 billion, net of discounts and issuance costs. The issuances consisted of the fol-lowing: $2.25 billion aggregate principal amount of floating rate Notes due 2016 that bear interest at a rate equal to three-month LIBOR plus 1.53% which rate will be reset quarterly, $1.75 billion aggregate prin-cipal amount of floating rate Notes due 2018 that bear interest at a rate equal to three-month LIBOR plus 1.75% which rate will be reset quar-terly, $4.25 billion aggregate principal amount of 2.50% Notes due 2016, $4.75 billion aggregate principal amount of 3.65% Notes due 2018, $4.0
notes to ConsolIdated fInanCIal stateMents continued
On August 21, 2014, Verizon issued $3.3 billion aggregate principal amount of 2.625% Notes due 2020 (the 2020 New Notes), $4.5 billion aggregate principal amount of 4.862% Notes due 2046 (the 2046 New Notes) and $5.5 billion aggregate principal amount of 5.012% Notes due 2054 (the 2054 New Notes) in satisfaction of the exchange offer consider-ation on tendered Old Notes (not including accrued and unpaid interest on the Old Notes). The following tables list the series of Old Notes included in the July Exchange Offers and the principal amount of each such series accepted by Verizon for exchange.
billion aggregate principal amount of 4.50% Notes due 2020, $11.0 bil-lion aggregate principal amount of 5.15% Notes due 2023, $6.0 billion aggregate principal amount of 6.40% Notes due 2033 and $15.0 billion aggregate principal amount of 6.55% Notes due 2043 (collectively, the new notes). The proceeds of the new notes were used to finance, in part, the Wireless Transaction and to pay related fees and expenses. As a result of the issuance of the new notes, we incurred interest expense related to the Wireless Transaction of $0.7 billion during 2013.
Bridge Credit AgreementDuring September 2013, we entered into a $61.0 billion bridge credit agreement with a group of major financial institutions. The credit agreement provided us with the ability to borrow up to $61.0 billion to finance, in part, the Wireless Transaction and to pay related transaction costs. Following the September 2013 issuance of notes, borrowing avail-ability under the bridge credit agreement was reduced to $12.0 billion. Following the effectiveness of the term loan agreement in October 2013, the bridge credit agreement was terminated in accordance with its terms and as such, the related fees of $0.2 billion were recognized in Other income and (expense), net during the fourth quarter of 2013.
The table below lists the series of Old Notes included in the July Exchange Offers for the 2020 New Notes:
(dollars in millions)Interest
Rate MaturityPrincipal Amount
Outstanding
Principal Amount Accepted For
Exchange
Verizon Communications 3.65% 2018 $ 4,750 $ 2,0522.50% 2016 4,250 1,068
$ 3,120
The table below lists the series of Old Notes included in the July Exchange Offers for the 2046 New Notes:
(dollars in millions)Interest
Rate MaturityPrincipal Amount
Outstanding
Principal Amount Accepted For
Exchange
Verizon Communications 6.40% 2033 $ 6,000 $ 1,6457.75% 2030 2,000 7947.35% 2039 1,000 5207.75% 2032 400 149
Alltel Corporation 7.875% 2032 700 2486.80% 2029 300 65
$ 3,421
The table below lists the series of Old Notes included in the July Exchange Offers for the 2054 New Notes:
(dollars in millions)Interest
Rate MaturityPrincipal Amount
Outstanding
Principal Amount Accepted For
Exchange
Verizon Communications 6.55% 2043 $ 15,000 $ 4,3306.40% 2038 1,750 –6.90% 2038 1,250 –
$ 4,330

notes to ConsolIdated fInanCIal stateMents continued
57
of Cellco Partnership and Verizon Wireless Capital LLC 8.50% Notes due 2018, $0.2 billion of the then outstanding $0.3 billion aggregate principal amount of Alltel Corporation 7.00% Debentures due 2016 and $0.3 billion of the then outstanding $0.6 billion aggregate principal amount of GTE Corporation 6.84% Debentures due 2018.
During the fourth quarter of 2014, we recorded net debt redemption costs of $0.5 billion in connection with the early redemption of $0.5 bil-lion aggregate principal amount of Verizon 4.90% Notes due 2015, $0.6 billion aggregate principal amount of Verizon 5.55% Notes due 2016, $1.3 billion aggregate principal amount of Verizon 3.00% Notes due 2016, $0.4 billion aggregate principal amount of Verizon 5.50% Notes due 2017, $0.7 billion aggregate principal amount of Verizon 8.75% Notes due 2018, $1.0 billion of the then outstanding $3.2 billion aggregate principal amount of Verizon 2.50% Notes due 2016, $0.1 billion aggregate principal amount Alltel Corporation 7.00% Debentures due 2016 and $0.4 billion aggregate principal amount of Cellco Partnership and Verizon Wireless Capital LLC 8.50% Notes due 2018, as well as $0.3 billion of other costs.
We recognize early debt redemption costs in Other income and (expense), net on our consolidated statements of income.
Additional Financing Activities (Non-Cash Transaction)During 2014 and 2013, we financed, primarily through vendor financing arrangements, the purchase of approximately $0.7 billion and $0.1 billion, respectively, of long-lived assets, consisting primarily of network equip-ment. At December 31, 2014, $0.7 billion of these financing arrangements remained outstanding. These purchases are non-cash financing activities and therefore not reflected within Capital expenditures on our consoli-dated statements of cash flows.
Guarantees We guarantee the debentures and first mortgage bonds of our operating telephone company subsidiaries. As of December 31, 2014, $3.1 billion aggregate principal amount of these obligations remained outstanding. Each guarantee will remain in place for the life of the obligation unless terminated pursuant to its terms, including the operating telephone company no longer being a wholly-owned subsidiary of Verizon.
We also guarantee the debt obligations of GTE Corporation that were issued and outstanding prior to July 1, 2003. As of December 31, 2014, $1.4 billion aggregate principal amount of these obligations remain outstanding.
Debt CovenantsWe and our consolidated subsidiaries are in compliance with all of our debt covenants.
Maturities of Long-Term DebtMaturities of long-term debt outstanding at December 31, 2014 are as follows:
Years (dollars in millions)
2015 $ 2,3972016 6,1142017 3,9112018 6,5292019 6,088Thereafter 87,894
Verizon Wireless – Notes Payable and OtherVerizon Wireless Capital LLC, a wholly-owned subsidiary of Verizon Wireless, is a limited liability company formed under the laws of Delaware on December 7, 2001 as a special purpose finance subsidiary to facilitate the offering of debt securities of Verizon Wireless by acting as co-issuer. Other than the financing activities as a co-issuer of Verizon Wireless indebtedness, Verizon Wireless Capital LLC has no material assets, oper-ations or revenues. Verizon Wireless is jointly and severally liable with Verizon Wireless Capital LLC for co-issued notes.
2014In addition to the retirements of debt securities in connection with the Tender Offer, the May Exchange Offer, the July Exchange Offers and the November Early Debt Redemption, as noted above, during March 2014, Verizon Wireless redeemed $1.25 billion aggregate principal amount of the Cellco Partnership and Verizon Wireless Capital LLC 8.50% Notes due 2018 at 127.135% of the principal amount of such notes, plus accrued and unpaid interest (see “Early Debt Redemption and Other Costs”).
2013During November 2013, $1.25 billion of 7.375% Verizon Wireless Notes and $0.2 billion of 6.50% Verizon Wireless Notes matured and were repaid. Also during November 2013, Verizon Wireless redeemed $3.5 bil-lion of 5.55% Notes, due February 1, 2014 at a redemption price of 101% of the principal amount of the notes. Any accrued and unpaid interest was paid to the date of redemption.
Telephone and Other Subsidiary Debt
2014During 2014, a series of notes held by GTE Corporation were included in the Tender Offer described above.
2013During May 2013, $0.1 billion of 7.0% Verizon New York Inc. Debentures matured and were repaid. During June 2013, $0.1 billion of 7.0% Verizon New York Inc. Debentures matured and were repaid. In addition, during June 2013, we redeemed $0.25 billion of 7.15% Verizon Maryland LLC Debentures, due May 2023 at a redemption price of 100% of the prin-cipal amount of the debentures. During October 2013, $0.3 billion of 4.75% Verizon New England Inc. Debentures matured and were repaid. During November 2013, we redeemed $0.3 billion of 6.70% Verizon New York Inc. Debentures, due November 2023 at a redemption price of 100% of the principal amount of the debentures. During December 2013, we redeemed $0.2 billion of 7.0% Verizon New York Inc. Debentures, due December 2033 at a redemption price of 100% of the principal amount of the debentures and $20 million of 7.0% Verizon Delaware LLC Debentures, due December 2023 at a redemption price of 100% of the principal amount of the debentures. Any accrued and unpaid interest was paid to the date of redemption.
Early Debt Redemption and Other CostsDuring March 2014, we recorded net debt redemption costs of $0.9 bil-lion in connection with the early redemption of $1.25 billion aggregate principal amount of Cellco Partnership and Verizon Wireless Capital LLC 8.50% Notes due 2018, and the purchase of the following notes pursuant to the Tender Offer: $0.7 billion of the then outstanding $1.5 billion aggre-gate principal amount of Verizon 6.10% Notes due 2018, $0.8 billion of the then outstanding $1.5 billion aggregate principal amount of Verizon 5.50% Notes due 2018, $0.6 billion of the then outstanding $1.3 billion aggregate principal amount of Verizon 8.75% Notes due 2018, $0.7 bil-lion of the then outstanding $1.25 billion aggregate principal amount of Verizon 5.55% Notes due 2016, $0.4 billion of the then outstanding $0.75 billion aggregate principal amount of Verizon 5.50% Notes due 2017, $0.6 billion of the then outstanding $1.0 billion aggregate principal amount

58
notes to ConsolIdated fInanCIal stateMents continued
NOTE 9
WIRELESS EQUIPMENT INSTALLMENT PLANSWe offer new and existing customers the option to participate in Verizon Edge, a program that provides eligible wireless customers with the ability to pay for their handset over a period of time (an equipment installment plan) and the right to upgrade their handset after a minimum of 30 days, subject to certain conditions, including making a stated portion of the required device payments, trading in their handset in good working condition and signing a new contract with Verizon. The gross guarantee liability related to this program, which was approximately $0.7 billion at December 31, 2014 and was not material at December 31, 2013, was primarily included in Other current liabilities on our consolidated balance sheets.
At the time of sale, we impute risk adjusted interest on the receivables associated with Verizon Edge. We record the imputed interest as a reduction to the related accounts receivable. Interest income, which is included within Other income and (expense), net on our consolidated statements of income, is recognized over the financed installment term.
We assess the collectability of our Verizon Edge receivables based upon a variety of factors, including the credit quality of the customer base, payment trends and other qualitative factors. The current portion of our receivables related to Verizon Edge included in Accounts receivable was $2.3 billion at December 31, 2014 and was not material at December 31, 2013. The long-term portion of the equipment installment plan receiv-ables included in Other assets was $1.2 billion at December 31, 2014 and was not material at December 31, 2013.
The credit profiles of our customers with a Verizon Edge plan are similar to those of our customers with a traditional subsidized plan. Customers with a credit profile which carries a higher risk are required to make a down payment for equipment financed through Verizon Edge.
NOTE 10
FAIR VALUE MEASUREMENTS AND FINANCIAL INSTRUMENTS
Recurring Fair Value MeasurementsThe following table presents the balances of assets and liabilities mea-sured at fair value on a recurring basis as of December 31, 2014:
(dollars in millions)Level 1(1) Level 2(2) Level 3(3) Total
Assets: Short-term investments:
Equity securities $ 295 $ – $ – $ 295Fixed income securities – 260 – 260
Other assets:Fixed income securities 250 893 – 1,143Interest rate swaps – 72 – 72Cross currency swaps – 6 – 6
Total $ 545 $ 1,231 $ – $ 1,776
Liabilities:Other current liabilities:
Cross currency swaps and other $ – $ 74 $ – $ 74
Other liabilities:Forward interest rate swaps – 216 – 216Cross currency swaps – 528 – 528
Total $ – $ 818 $ – $ 818
(1) quoted prices in active markets for identical assets or liabilities
(2) observable inputs other than quoted prices in active markets for identical assets and liabilities
(3) no observable pricing inputs in the market
Equity securities consist of investments in common stock of domestic and international corporations measured using quoted prices in active markets.
Fixed income securities consist primarily of investments in municipal bonds as well as U.S. Treasury securities. We use quoted prices in active markets for our U.S. Treasury securities, therefore these securities are classified as Level 1. For all other fixed income securities that do not have quoted prices in active markets, we use alternative matrix pricing resulting in these debt securities being classified as Level 2.
Derivative contracts are valued using models based on readily observable market parameters for all substantial terms of our derivative contracts and thus are classified within Level 2. We use mid-market pricing for fair value measurements of our derivative instruments. Our derivative instru-ments are recorded on a gross basis.
We recognize transfers between levels of the fair value hierarchy as of the end of the reporting period. There were no transfers within the fair value hierarchy during 2014.
Fair Value of Short-term and Long-term DebtThe fair value of our debt is determined using various methods, including quoted prices for identical terms and maturities, which is a Level 1 mea-surement, as well as quoted prices for similar terms and maturities in inactive markets and future cash flows discounted at current rates, which are Level 2 measurements. The fair value of our short-term and long-term debt, excluding capital leases, was as follows:
(dollars in millions)At December 31, 2014 2013
CarryingAmount
FairValue
CarryingAmount
FairValue
Short- and long-term debt, excluding capital leases $ 112,755 $ 126,549 $ 93,298 $ 103,527
Derivative InstrumentsInterest Rate SwapsWe enter into domestic interest rate swaps to achieve a targeted mix of fixed and variable rate debt. We principally receive fixed rates and pay variable rates based on LIBOR, resulting in a net increase or decrease to Interest expense. These swaps are designated as fair value hedges and hedge against changes in the fair value of our debt portfolio. We record the interest rate swaps at fair value on our consolidated balance sheets as assets and liabilities.
During the second quarter of 2013, interest rate swaps with a notional value of $1.25 billion matured and the impact to our consolidated finan-cial statements was not material. During the third quarter of 2013, we entered into interest rate swaps with a total notional value of $1.8 billion. At December 31, 2014 and 2013, the fair value of these interest rate swaps was not material. At December 31, 2014, the total notional amount of these interest rate swaps was $1.8 billion. The ineffective portion of these interest rate swaps was not material at December 31, 2014 and 2013.

notes to ConsolIdated fInanCIal stateMents continued
59
Forward Interest Rate Swaps In order to manage our exposure to future interest rate changes, during the fourth quarter of 2013, we entered into forward interest rate swaps with a notional value of $2.0 billion. In March 2014, we settled these for-ward interest rate swaps and the pre-tax gain was not material. During 2014, we entered into forward interest rate swaps with a total notional value of $4.8 billion. We designated these contracts as cash flow hedges. During the fourth quarter of 2014, we settled $2.8 billion of forward interest rate swaps and the pre-tax loss was not material. The fair value of these contracts was $0.2 billion, which was included within Other liabili-ties on our consolidated balance sheet, at December 31, 2014 and was not material at December 31, 2013.
Cross Currency SwapsVerizon Wireless previously entered into cross currency swaps designated as cash flow hedges to exchange approximately $1.6 billion of British Pound Sterling and Euro-denominated debt into U.S. dollars and to fix our future interest and principal payments in U.S. dollars, as well as to mitigate the impact of foreign currency transaction gains or losses. In June 2014, we settled $0.8 billion of these cross currency swaps and the gains with respect to these swaps were not material.
During the first quarter of 2014, we entered into cross currency swaps designated as cash flow hedges to exchange approximately $5.4 billion of Euro and British Pound Sterling denominated debt into U.S. dollars. During the second quarter of 2014, we entered into cross currency swaps designated as cash flow hedges to exchange approximately $1.2 bil-lion of British Pound Sterling denominated debt into U.S. dollars. During the fourth quarter of 2014, we entered into cross currency swaps des-ignated as cash flow hedges to exchange approximately $3.0 billion of Euro denominated debt into U.S. dollars and to fix our future interest and principal payments in U.S. dollars. Each of these cross currency swaps was entered into in order to mitigate the impact of foreign currency transac-tion gains or losses.
A portion of the gains and losses recognized in Other comprehensive income was reclassified to Other income and (expense), net to offset the related pre-tax foreign currency transaction gain or loss on the underlying debt obligations. The fair value of the outstanding swaps was $0.6 billion, which was primarily included within Other liabilities on our consolidated balance sheet, at December 31, 2014 and was not material at December 31, 2013. During 2014 and 2013, a pre-tax loss of $0.1 billion and an immaterial pre-tax gain, respectively, were recognized in Other compre-hensive income with respect to these swaps.
Concentrations of Credit RiskFinancial instruments that subject us to concentrations of credit risk con-sist primarily of temporary cash investments, short-term and long-term investments, trade receivables, certain notes receivable, including lease receivables, and derivative contracts. Our policy is to deposit our tempo-rary cash investments with major financial institutions. Counterparties to our derivative contracts are also major financial institutions with whom we have negotiated derivatives agreements (ISDA master agreement) and credit support annex agreements which provide rules for collateral exchange. We generally apply collateralized arrangements with our coun-terparties for uncleared derivatives to mitigate credit risk. At December 31, 2014, we posted collateral of approximately $0.6 billion related to derivative contracts under collateral exchange arrangements, which were recorded as Prepaid expenses and other in our consolidated balance sheet. At December 31, 2013, we held an immaterial amount of collateral related to derivative contracts under collateral exchange arrangements, which were recorded as Accounts payable and accrued liabilities in our consolidated balance sheet. We may enter into swaps on an uncollateral-ized basis in certain circumstances. While we may be exposed to credit losses due to the nonperformance of our counterparties, we consider the risk remote and do not expect the settlement of these transactions to have a material effect on our results of operations or financial condition.
Nonrecurring Fair Value MeasurementsThe Company measures certain assets and liabilities at fair value on a nonrecurring basis. During the fourth quarter of 2014, certain long-lived assets met the criteria to be classified as held for sale. At that time, the fair value of these long-lived assets was measured, resulting in expected disposal losses of $0.1 billion. The fair value of these assets held for sale was measured with the assistance of third-party appraisals and other esti-mates of fair value, which used market approach techniques as part of the analysis. The fair value measurement was categorized as Level 3, as significant unobservable inputs were used in the valuation. The expected disposal losses, which represented the difference between the fair value less cost to sell and the carrying amount of the assets held for sale, were included in Selling, general and administrative expenses.

notes to ConsolIdated fInanCIal stateMents continued
60
NOTE 11
STOCk-BASED COMPENSATION
Verizon Communications Long-Term Incentive PlanThe Verizon Communications Inc. Long-Term Incentive Plan (the Plan) permits the granting of stock options, stock appreciation rights, restricted stock, restricted stock units, performance shares, performance stock units and other awards. The maximum number of shares available for awards from the Plan is 119.6 million shares.
Restricted Stock UnitsThe Plan provides for grants of Restricted Stock Units (RSUs) that gener-ally vest at the end of the third year after the grant. The RSUs are classified as equity awards because the RSUs will be paid in Verizon common stock upon vesting. The RSU equity awards are measured using the grant date fair value of Verizon common stock and are not remeasured at the end of each reporting period. Dividend equivalent units are also paid to par-ticipants at the time the RSU award is paid, and in the same proportion as the RSU award.
Performance Stock Units The Plan also provides for grants of Performance Stock Units (PSUs) that generally vest at the end of the third year after the grant. As defined by the Plan, the Human Resources Committee of the Board of Directors determines the number of PSUs a participant earns based on the extent to which the corresponding performance goals have been achieved over the three-year performance cycle. The PSUs are classified as liability awards because the PSU awards are paid in cash upon vesting. The PSU award liability is measured at its fair value at the end of each reporting period and, therefore, will fluctuate based on the price of Verizon common stock as well as performance relative to the targets. Dividend equivalent units are also paid to participants at the time that the PSU award is determined and paid, and in the same proportion as the PSU award. The granted and cancelled activity for the PSU award includes adjustments for the performance goals achieved.
The following table summarizes Verizon’s Restricted Stock Unit and Performance Stock Unit activity:
(shares in thousands)Restricted
Stock UnitsPerformance
Stock Units
Outstanding January 1, 2012 19,836 27,614Granted 6,350 20,537Payments (7,369) (8,499)Cancelled/Forfeited (148) (189)Outstanding December 31, 2012 18,669 39,463Granted 4,950 7,470Payments (7,246) (22,703)Cancelled/Forfeited (180) (506)Outstanding December 31, 2013 16,193 23,724Granted 5,278 7,359Payments (6,202) (9,153)Cancelled/Forfeited (262) (1,964)Outstanding December 31, 2014 15,007 19,966
As of December 31, 2014, unrecognized compensation expense related to the unvested portion of Verizon’s RSUs and PSUs was approxi-mately $0.4 billion and is expected to be recognized over approximately two years.
The RSUs granted in 2014 and 2013 have weighted-average grant date fair values of $47.23 and $47.96 per unit, respectively. During 2014, 2013 and 2012, we paid $0.6 billion, $1.1 billion and $0.6 billion, respectively, to settle RSUs and PSUs classified as liability awards.
Verizon Wireless’ Long-Term Incentive PlanThe Verizon Wireless Long-Term Incentive Plan (the Wireless Plan) pro-vided compensation opportunities to eligible employees of Verizon Wireless (the Partnership). Under the Wireless Plan, Value Appreciation Rights (VARs) were granted to eligible employees. We have not granted new VARs since 2004. As of December 31, 2014, there are no VARs that remain outstanding.
Stock-Based Compensation ExpenseAfter-tax compensation expense for stock-based compensation related to RSUs, PSUs, and VARs described above included in Net income attrib-utable to Verizon was $0.3 billion, $0.4 billion and $0.7 billion for 2014, 2013 and 2012, respectively.
Stock OptionsThe Plan provides for grants of stock options to participants at an option price per share of no less than 100% of the fair market value of Verizon common stock on the date of grant. Each grant has a 10-year life, vesting equally over a three-year period, starting at the date of the grant. We have not granted new stock options since 2004. As of December 31, 2014, there are no stock options that remain outstanding.

notes to ConsolIdated fInanCIal stateMents continued
61
NOTE 12
EMPLOYEE BENEFITS
We maintain non-contributory defined benefit pension plans for many of our employees. In addition, we maintain postretirement health care and life insurance plans for our retirees and their dependents, which are both contributory and non-contributory, and include a limit on our share of the cost for certain recent and future retirees. In accordance with our accounting policy for pension and other postretirement ben-efits, operating expenses include pension and benefit related credits and/or charges based on actuarial assumptions, including projected discount rates and an estimated return on plan assets. These estimates are updated in the fourth quarter to reflect actual return on plan assets and updated actuarial assumptions. The adjustment is recognized in the income statement during the fourth quarter or upon a remeasurement event pursuant to our accounting policy for the recognition of actuarial gains and losses.
Pension and Other Postretirement BenefitsPension and other postretirement benefits for many of our employees are subject to collective bargaining agreements. Modifications in bene-fits have been bargained from time to time, and we may also periodically amend the benefits in the management plans. The following tables summarize benefit costs, as well as the benefit obligations, plan assets, funded status and rate assumptions associated with pension and postre-tirement health care and life insurance benefit plans.
Obligations and Funded Status (dollars in millions)
Pension Health Care and LifeAt December 31, 2014 2013 2014 2013
Change in Benefit Obligations
Beginning of year $ 23,032 $ 26,773 $ 23,042 $ 26,844Service cost 327 395 258 318Interest cost 1,035 1,002 1,107 1,095Plan amendments (89) (149) (412) (119)Actuarial (gain) loss, net 2,977 (2,327) 4,645 (3,576)Benefits paid (1,566) (1,777) (1,543) (1,520)Curtailment and termination
benefits 11 4 – – Settlements paid (407) (889) – – End of year $ 25,320 $ 23,032 $ 27,097 $ 23,042
Change in Plan AssetsBeginning of year $ 17,111 $ 18,282 $ 3,053 $ 2,657Actual return on plan assets 1,778 1,388 193 556Company contributions 1,632 107 732 1,360Benefits paid (1,566) (1,777) (1,543) (1,520)Settlements paid (407) (889) – – End of year $ 18,548 $ 17,111 $ 2,435 $ 3,053
Funded StatusEnd of year $ (6,772) $ (5,921) $ (24,662) $ (19,989)
(dollars in millions)Pension Health Care and Life
At December 31, 2014 2013 2014 2013
Amounts recognized on the balance sheet
Noncurrent assets $ 337 $ 339 $ – $ – Current liabilities (122) (137) (528) (710)Noncurrent liabilities (6,987) (6,123) (24,134) (19,279)Total $ (6,772) $ (5,921) $ (24,662) $ (19,989)
Amounts recognized in Accumulated Other Comprehensive Income (Pre-tax)
Prior Service Benefit (Cost) $ (56) $ 25 $ (2,280) $ (2,120)Total $ (56) $ 25 $ (2,280) $ (2,120)
Beginning in 2013, as a result of federal health care reform, Verizon no longer files for the Retiree Drug Subsidy (RDS) and instead contracts with a Medicare Part D plan on a group basis to provide prescription drug benefits to Medicare eligible retirees.
The accumulated benefit obligation for all defined benefit pension plans was $25.3 billion and $22.9 billion at December 31, 2014 and 2013, respectively.
Information for pension plans with an accumulated benefit obligation in excess of plan assets follows:
(dollars in millions)At December 31, 2014 2013
Projected benefit obligation $ 24,919 $ 22,610Accumulated benefit obligation 24,851 22,492Fair value of plan assets 17,810 16,350

62
notes to ConsolIdated fInanCIal stateMents continued
Net Periodic CostThe following table summarizes the benefit (income) cost related to our pension and postretirement health care and life insurance plans:
(dollars in millions)Pension Health Care and Life
Years Ended December 31, 2014 2013 2012 2014 2013 2012
Service cost $ 327 $ 395 $ 358 $ 258 $ 318 $ 359Amortization of prior service cost (credit) (8) 6 (1) (253) (247) (89)Expected return on plan assets (1,181) (1,245) (1,795) (161) (143) (171)Interest cost 1,035 1,002 1,449 1,107 1,095 1,284Remeasurement (gain) loss, net 2,380 (2,470) 5,542 4,615 (3,989) 1,262Net periodic benefit (income) cost 2,553 (2,312) 5,553 5,566 (2,966) 2,645Curtailment and termination benefits 11 4 – – – – Total $ 2,564 $ (2,308) $ 5,553 $ 5,566 $ (2,966) $ 2,645
Other pre-tax changes in plan assets and benefit obligations recognized in other comprehensive (income) loss are as follows:(dollars in millions)
Pension Health Care and LifeAt December 31, 2014 2013 2014 2013
Prior service cost $ (89) $ (149) $ (413) $ (119)Reversal of amortization items
Prior service cost 8 (6) 253 247Total recognized in other comprehensive (income) loss (pre-tax) $ (81) $ (155) $ (160) $ 128
The estimated prior service cost for the defined benefit pension plans that will be amortized from Accumulated other comprehensive income (loss) into net periodic benefit (income) cost over the next fiscal year is not significant. The estimated prior service cost for the defined benefit postretirement plans that will be amortized from Accumulated other comprehensive income into net periodic benefit (income) cost over the next fiscal year is $0.3 billion.
AssumptionsThe weighted-average assumptions used in determining benefit obligations follow:
Pension Health Care and LifeAt December 31, 2014 2013 2014 2013
Discount Rate 4.20 % 5.00 % 4.20 % 5.00 %Rate of compensation increases 3.00 3.00 N/A N/A
The weighted-average assumptions used in determining net periodic cost follow:
Pension Health Care and LifeAt December 31, 2014 2013 2012 2014 2013 2012
Discount Rate 5.00 % 4.20 % 5.00 % 5.00 % 4.20 % 5.00 %Expected return on plan assets 7.25 7.50 7.50 5.50 5.60 7.00Rate of compensation increases 3.00 3.00 3.00 N/A N/A N/A
In order to project the long-term target investment return for the total portfolio, estimates are prepared for the total return of each major asset class over the subsequent 10-year period. Those estimates are based on a combination of factors including the current market interest rates and valuation levels, consensus earnings expectations and historical long-term risk premiums. To determine the aggregate return for the pension trust, the projected return of each individual asset class is then weighted according to the allocation to that investment area in the trust’s long-term asset allocation policy.

notes to ConsolIdated fInanCIal stateMents continued
63
The assumed health care cost trend rates follow:
Health Care and LifeAt December 31, 2014 2013 2012
Healthcare cost trend rate assumed for next year 6.50 % 6.50 % 7.00 %
Rate to which cost trend rate gradually declines 4.75 4.75 5.00
Year the rate reaches the level it is assumed to remain thereafter 2022 2020 2016
A one-percentage point change in the assumed health care cost trend rate would have the following effects:
(dollars in millions)One-Percentage Point Increase Decrease
Effect on 2014 service and interest cost $ 193 $ (155)Effect on postretirement benefit obligation as of
December 31, 2014 3,760 (3,023)
Plan AssetsThe company’s overall investment strategy is to achieve a mix of assets which allows us to meet projected benefit payments while taking into consideration risk and return. While target allocation percentages will vary over time, the current target allocation for plan assets is designed so that 70% of the assets have the objective of achieving a return in excess of the growth in liabilities (comprised of public equities, private equities, real estate, hedge funds and emerging debt) and 30% of the assets are invested as liability hedging assets (where cash flows from investments better match projected benefit payments, typically longer duration fixed income). This allocation will shift as funded status improves to a higher allocation of liability hedging assets. Target policies will be revisited periodically to ensure they are in line with fund objectives. Both active and passive management approaches are used depending on perceived market efficiencies and various other factors. Due to our diversification and risk control processes, there are no significant concentrations of risk, in terms of sector, industry, geography or company names.
Pension and healthcare and life plans assets do not include significant amounts of Verizon common stock.
Pension PlansThe fair values for the pension plans by asset category at December 31, 2014 are as follows: (dollars in millions)Asset Category Total Level 1 Level 2 Level 3
Cash and cash equivalents $ 1,983 $ 1,814 $ 169 $ – Equity securities 4,339 2,952 1,277 110Fixed income securities
U.S. Treasuries and agencies 1,257 830 427 – Corporate bonds 2,882 264 2,506 112International bonds 582 39 524 19Other 3 – 3 –
Real estate 1,792 – – 1,792Other
Private equity 3,748 – 204 3,544Hedge funds 1,962 – 1,164 798
Total $ 18,548 $ 5,899 $ 6,274 $ 6,375
The fair values for the pension plans by asset category at December 31, 2013 are as follows: (dollars in millions)Asset Category Total Level 1 Level 2 Level 3
Cash and cash equivalents $ 968 $ 881 $ 87 $ – Equity securities 4,200 3,300 900 – Fixed income securities
U.S. Treasuries and agencies 1,097 691 406 – Corporate bonds 2,953 212 2,579 162International bonds 364 51 313 – Other 3 – 3 –
Real estate 1,784 – – 1,784Other
Private equity 3,942 – – 3,942Hedge funds 1,800 – 604 1,196
Total $ 17,111 $ 5,135 $ 4,892 $ 7,084

64
Notes to CoNsolidated FiNaNCial statemeNts continued
Equity securities are investments in common stock of domestic and international corporations in a variety of industry sectors, and are valued primarily using quoted market prices or other valuation methods, and thus are classified within Level 1 or Level 2.
Fixed income securities include U.S. Treasuries and agencies, debt obli-gations of foreign governments and domestic and foreign corporations. Fixed income also includes investments in collateralized mortgage obli-gations, mortgage backed securities and interest rate swaps. The fair value of fixed income securities is based on observable prices for iden-tical or comparable assets, adjusted using benchmark curves, sector grouping, matrix pricing, broker/dealer quotes and issuer spreads, and thus is classified within Level 1 or Level 2.
Real estate investments include those in limited partnerships that invest in various commercial and residential real estate projects both domesti-cally and internationally. The fair values of real estate assets are typically determined by using income and/or cost approaches or a comparable sales approach, taking into consideration discount and capitalization rates, financial conditions, local market conditions and the status of the capital markets, and thus are classified within Level 3.
Private equity investments include those in limited partnerships that invest in operating companies that are not publicly traded on a stock exchange. Investment strategies in private equity include leveraged buy-outs, venture capital, distressed investments and investments in natural resources. These investments are valued using inputs such as trading multiples of comparable public securities, merger and acquisition activity and pricing data from the most recent equity financing taking into con-sideration illiquidity, and thus are classified within Level 3.
Hedge fund investments include those seeking to maximize absolute returns using a broad range of strategies to enhance returns and provide additional diversification. The fair values of hedge funds are estimated using net asset value per share (NAV) of the investments. Verizon has the ability to redeem these investments at NAV within the near term and thus are classified within Level 2. Investments that cannot be redeemed in the near term are classified within Level 3.
Employer ContributionsIn 2014, we contributed $1.5 billion to our qualified pension plans, $0.1 billion to our nonqualified pension plans and $0.7 billion to our other postretirement benefit plans. We anticipate a minimum contribution of $0.7 billion to our qualified pension plans in 2015. Nonqualified pension plans contributions are estimated to be $0.1 billion and contributions to our other postretirement benefit plans are estimated to be $0.8 billion in 2015.
Health Care and Life PlansThe fair values for the other postretirement benefit plans by asset cat-egory at December 31, 2014 are as follows:
(dollars in millions)Asset Category Total Level 1 Level 2 Level 3
Cash and cash equivalents $ 208 $ 6 $ 202 $ – Equity securities 1,434 1,172 262 – Fixed income securities
U.S. Treasuries and agencies 105 98 7 – Corporate bonds 461 119 296 46International bonds 111 14 97 – Other 116 – 116 –
Total $ 2,435 $ 1,409 $ 980 $ 46
The fair values for the other postretirement benefit plans by asset cat-egory at December 31, 2013 are as follows:
(dollars in millions)Asset Category Total Level 1 Level 2 Level 3
Cash and cash equivalents $ 237 $ 12 $ 225 $ – Equity securities 2,178 1,324 854 – Fixed income securities
U.S. Treasuries and agencies 121 94 27 – Corporate bonds 252 45 207 – International bonds 104 18 86 – Other 161 40 121 –
Total $ 3,053 $ 1,533 $ 1,520 $ –
The following is a reconciliation of the beginning and ending balance of the other postretirement benefit plans assets that are measured at fair value using significant unobservable inputs:
Corporate Bonds Total
Balance at December 31, 2013 $ – $ – Actual gain on plan assets 1 1Purchases and sales 45 45Balance at December 31, 2014 $ 46 $ 46
The following are general descriptions of asset categories, as well as the valuation methodologies and inputs used to determine the fair value of each major category of assets.
Cash and cash equivalents include short-term investment funds, primarily in diversified portfolios of investment grade money market instruments and are valued using quoted market prices or other valuation methods, and thus are classified within Level 1 or Level 2.
The following is a reconciliation of the beginning and ending balance of pension plan assets that are measured at fair value using significant unob-servable inputs:
(dollars in millions)Equity
SecuritiesCorporate
BondsInternational
BondsReal
EstatePrivate Equity
Hedge Funds Total
Balance at January 1, 2013 $ – $ 196 $ – $ 2,018 $ 5,039 $ 558 $ 7,811Actual gain on plan assets – 12 – 81 674 84 851Purchases and sales – (13) – (315) (1,732) (124) (2,184)Transfers in (out) – (33) – – (39) 678 606Balance at December 31, 2013 $ – $ 162 $ – $ 1,784 $ 3,942 $ 1,196 $ 7,084Actual gain (loss) on plan assets (1) 5 – 42 73 33 152Purchases and sales 106 (50) 8 (34) (471) 144 (297)Transfers in (out) 5 (5) 11 – – (575) (564)Balance at December 31, 2014 $ 110 $ 112 $ 19 $ 1,792 $ 3,544 $ 798 $ 6,375

notes to ConsolIdated fInanCIal stateMents continued
65
Severance BenefitsThe following table provides an analysis of our actuarially determined severance liability recorded in accordance with the accounting standard regarding employers’ accounting for postemployment benefits:
(dollars in millions)
YearBeginning
of YearCharged
to Expense Payments Other End of Year
2012 $ 1,113 $ 396 $ (531) $ 32 $ 1,0102013 1,010 134 (381) (6) 7572014 757 531 (406) (7) 875
Severance, Pension and Benefit (Credits) Charges During 2014, we recorded net pre-tax severance, pension and benefits charges of approximately $7.5 billion primarily for our pension and post-retirement plans in accordance with our accounting policy to recognize actuarial gains and losses in the year in which they occur. The charges were primarily driven by a decrease in our discount rate assumption used to determine the current year liabilities from a weighted-average of 5.0% at December 31, 2013 to a weighted-average of 4.2% at December 31, 2014 ($5.2 billion), a change in mortality assumptions primarily driven by the use of updated actuarial tables (RP-2014 and MP-2014) issued by the Society of Actuaries in October 2014 ($1.8 billion) and revisions to the retirement assumptions for participants and other assumption adjust-ments, partially offset by the difference between our estimated return on assets of 7.25% and our actual return on assets of 10.5% ($0.6 billion). As part of this charge, we recorded severance costs of $0.5 billion under our existing separation plans.
During 2013, we recorded net pre-tax severance, pension and benefits credits of approximately $6.2 billion primarily for our pension and post-retirement plans in accordance with our accounting policy to recognize actuarial gains and losses in the year in which they occur. The credits were primarily driven by an increase in our discount rate assumption used to determine the current year liabilities from a weighted-average of 4.2% at December 31, 2012 to a weighted-average of 5.0% at December 31, 2013 ($4.3 billion), lower than assumed retiree medical costs and other assumption adjustments ($1.4 billion) and the difference between our estimated return on assets of 7.5% at December 31, 2012 and our actual return on assets of 8.6% at December 31, 2013 ($0.5 billion).
During 2012, we recorded net pre-tax severance, pension and benefits charges of approximately $7.2 billion primarily for our pension and post-retirement plans in accordance with our accounting policy to recognize actuarial gains and losses in the year in which they occur. The charges were primarily driven by a decrease in our discount rate assumption used to determine the current year liabilities from a weighted-average of 5% at December 31, 2011 to a weighted-average of 4.2% at December 31, 2012 ($5.3 billion) and revisions to the retirement assumptions for participants and other assumption adjustments, partially offset by the difference between our estimated return on assets of 7.5% and our actual return on assets of 10% ($0.7 billion). As part of this charge, we also recorded $1.0 billion related to the annuitization of pension liabilities, as described above, as well as severance charges of $0.4 billion.
Estimated Future Benefit PaymentsThe benefit payments to retirees are expected to be paid as follows:
(dollars in millions)Year Pension Benefits Health Care and Life
2015 $ 2,855 $ 1,4812016 2,024 1,4562017 1,937 1,4522018 1,427 1,4362019 1,396 1,3982020-2024 6,890 6,996
Savings Plan and Employee Stock Ownership PlansWe maintain four leveraged employee stock ownership plans (ESOP). We match a certain percentage of eligible employee contributions to the savings plans with shares of our common stock from this ESOP. At December 31, 2014, the number of allocated shares of common stock in this ESOP was 61 million. There were no unallocated shares of common stock in this ESOP at December 31, 2014. All leveraged ESOP shares are included in earnings per share computations.
Total savings plan costs were $0.9 billion in 2014, $1.0 billion in 2013 and $0.7 billion in 2012.
Pension AnnuitizationOn October 17, 2012, we, along with our subsidiary Verizon Investment Management Corp., and Fiduciary Counselors Inc., as independent fidu-ciary of the Verizon Management Pension Plan (the Plan), entered into a definitive purchase agreement with The Prudential Insurance Company of America (Prudential) and Prudential Financial, Inc., pursuant to which the Plan would purchase a single premium group annuity contract from Prudential.
On December 10, 2012, upon issuance of the group annuity contract by Prudential, Prudential irrevocably assumed the obligation to make future annuity payments to approximately 41,000 Verizon management retirees who began receiving pension payments from the Plan prior to January 1, 2010. The amount of each retiree’s annuity payment equals the amount of such individual’s pension benefit. In addition, the group annuity con-tract is intended to replicate the same rights to future payments, such as survivor benefits, that are currently offered by the Plan.
We contributed approximately $2.6 billion to the Plan between September 1, 2012 and December 31, 2012 in connection with the trans-action so that the Plan’s funding percentage would not decrease as a result of the transaction.

66
notes to ConsolIdated fInanCIal stateMents continued
NOTE 13
TAxES
The components of income before (provision) benefit for income taxes are as follows: (dollars in millions)Years Ended December 31, 2014 2013 2012
Domestic $ 12,992 $ 28,833 $ 9,316Foreign 2,278 444 581Total $ 15,270 $ 29,277 $ 9,897
The components of the provision (benefit) for income taxes are as follows:
(dollars in millions)Years Ended December 31, 2014 2013 2012
CurrentFederal $ 2,657 $ (197) $ 223Foreign 81 (59) (45)State and Local 668 201 114Total 3,406 (55) 292
DeferredFederal (51) 5,060 (559)Foreign (9) 8 10State and Local (32) 717 (403)Total (92) 5,785 (952)
Total income tax provision (benefit) $ 3,314 $ 5,730 $ (660)
The following table shows the principal reasons for the difference between the effective income tax rate and the statutory federal income tax rate:
Years Ended December 31, 2014 2013 2012
Statutory federal income tax rate 35.0 % 35.0 % 35.0 %State and local income tax rate, net of
federal tax benefits 2.7 2.1 (1.9)Affordable housing credit (1.0) (0.6) (1.9)Employee benefits including ESOP
dividend (0.7) (0.4) (1.1)Disposition of Omnitel Interest (5.9) - -Noncontrolling interests (5.0) (14.3) (33.7)Other, net (3.4) (2.2) (3.1)Effective income tax rate 21.7 % 19.6 % (6.7) %
The effective income tax rate for 2014 was 21.7% compared to 19.6% for 2013. The increase in the effective income tax rate was primarily due to additional income taxes on the incremental income from the Wireless Transaction completed on February 21, 2014 and was partially offset by the utilization of certain tax credits in connection with the Omnitel Transaction in 2014 and the effective income tax rate impact of lower income before income taxes due to severance, pension and benefit charges recorded in 2014 compared to severance, pension and ben-efit credits recorded in 2013. The decrease in the provision for income taxes was primarily due to lower income before income taxes due to severance, pension and benefit charges recorded in 2014 compared to severance, pension and benefit credits recorded in 2013.
The effective income tax rate for 2013 was 19.6% compared to (6.7)% for 2012. The increase in the effective income tax rate and provision for income taxes was primarily due to higher income before income taxes as a result of severance, pension and benefit credits recorded during 2013 compared to lower income before income taxes as a result of sever-ance, pension and benefit charges as well as early debt redemption costs recorded during 2012.
The amounts of cash taxes paid are as follows:
(dollars in millions)Years Ended December 31, 2014 2013 2012
Income taxes, net of amounts refunded $ 4,093 $ 422 $ 351Employment taxes 1,290 1,282 1,308Property and other taxes 1,797 2,082 1,727Total $ 7,180 $ 3,786 $ 3,386

67
notes to ConsolIdated fInanCIal stateMents continued
Unrecognized Tax BenefitsA reconciliation of the beginning and ending balance of unrecognized tax benefits is as follows: (dollars in millions)
2014 2013 2012
Balance at January 1, $ 2,130 $ 2,943 $ 3,078Additions based on tax positions related to
the current year 80 116 131Additions for tax positions of prior years 627 250 92Reductions for tax positions of prior years (278) (801) (415)Settlements (239) (210) 100Lapses of statutes of limitations (497) (168) (43)Balance at December 31, $ 1,823 $ 2,130 $ 2,943
Included in the total unrecognized tax benefits at December 31, 2014, 2013 and 2012 is $1.3 billion, $1.4 billion and $2.1 billion, respectively, that if recognized, would favorably affect the effective income tax rate.
We recognized the following net after-tax benefits related to interest and penalties in the provision for income taxes:
Years Ended December 31, (dollars in millions)
2014 $ 922013 332012 82
The after-tax accruals for the payment of interest and penalties in the consolidated balance sheets are as follows:
At December 31, (dollars in millions)
2014 $ 1692013 274
The decrease in unrecognized tax benefits was primarily due to the reso-lution of issues with the Internal Revenue Service (IRS) involving tax years 2007 through 2009, and was partially offset by an increase in unrecog-nized tax benefits related to the Wireless Transaction. The uncertain tax benefits related to the Wireless Transaction concern pre-acquisition tax controversies and are the subject of an indemnity from Vodafone for which a corresponding indemnity asset has been established.
Verizon and/or its subsidiaries file income tax returns in the U.S. federal jurisdiction, and various state, local and foreign jurisdictions. As a large taxpayer, we are under audit by the IRS and multiple state and foreign jurisdictions for various open tax years. The IRS is currently examining the Company’s U.S. income tax returns for tax years 2010-2012 and Cellco Partnership’s U.S. income tax returns for tax years 2012-2013. Significant tax controversies are ongoing in Massachusetts for tax years as early as 2001. The amount of the liability for unrecognized tax benefits will change in the next twelve months due to the expiration of the statute of limitations in various jurisdictions and it is reasonably possible that various current tax examinations will conclude or require reevaluations of the Company’s tax positions during this period. An estimate of the range of the possible change cannot be made until these tax matters are further developed or resolved.
Deferred taxes arise because of differences in the book and tax bases of certain assets and liabilities. The presentation of significant components of deferred tax assets and liabilities is updated to reflect the Wireless Transaction. Significant components of deferred tax assets and liabilities are as follows:
(dollars in millions)At December 31, 2014 2013
Employee benefits $ 13,350 $ 10,413Tax loss and credit carry forwards 2,255 2,912Other – assets 2,247 1,783
17,852 15,108Valuation allowances (1,841) (1,685)Deferred tax assets 16,011 13,423
Spectrum and other intangible amortization 28,283 18,280Depreciation 23,423 18,913Other – liabilities 5,754 4,315Deferred tax liabilities 57,460 41,508Net deferred tax liability $ 41,449 $ 28,085
At December 31, 2014, undistributed earnings of our foreign subsid-iaries indefinitely invested outside the United States amounted to approximately $1.3 billion. The majority of Verizon's cash flow is gener-ated from domestic operations and we are not dependent on foreign cash or earnings to meet our funding requirements, nor do we intend to repatriate these undistributed foreign earnings to fund U.S. opera-tions. Furthermore, a portion of these undistributed earnings represent amounts that legally must be kept in reserve in accordance with certain foreign jurisdictional requirements and are unavailable for distribution or repatriation. As a result, we have not provided U.S. deferred taxes on these undistributed earnings because we intend that they will remain indefinitely reinvested outside of the United States and therefore unavail-able for use in funding U.S. operations. Determination of the amount of unrecognized deferred taxes related to these undistributed earnings is not practicable.
At December 31, 2014, we had net after-tax loss and credit carry forwards for income tax purposes of approximately $2.3 billion. Of these net after-tax loss and credit carry forwards, approximately $1.8 billion will expire between 2015 and 2034 and approximately $0.5 billion may be carried forward indefinitely.
During 2014, the valuation allowance increased approximately $0.2 bil-lion. The balance of the valuation allowance at December 31, 2014 and the 2014 activity is primarily related to state and foreign tax losses.

68
notes to ConsolIdated fInanCIal stateMents continued
NOTE 14
SEGMENT INFORMATION
Reportable SegmentsWe have two reportable segments, which we operate and manage as strategic business units and organize by products and services. We mea-sure and evaluate our reportable segments based on segment operating income, consistent with the chief operating decision maker’s assessment of segment performance.
Corporate, eliminations and other includes unallocated corporate expenses, intersegment eliminations recorded in consolidation, the results of other businesses, such as our investments in unconsolidated businesses, pension and other employee benefit related costs, lease financing, as well as the historical results of divested operations, other adjustments and gains and losses that are not allocated in assessing seg-ment performance due to their non-operational nature. Although such transactions are excluded from the business segment results, they are included in reported consolidated earnings. Gains and losses that are not individually significant are included in all segment results as these items are included in the chief operating decision maker’s assessment of segment performance. Effective January 1, 2014, we have also reclassified the results of certain businesses, such as development stage businesses that support our strategic initiatives, from our Wireline segment to Corporate, eliminations and other. The impact of this reclassification was not material to our consolidated financial statements or our segment results of operations.
On July 1, 2014, our Wireline segment sold a non-strategic business (see Note 2). Accordingly, the historical Wireline results for these operations have been reclassified to Corporate, eliminations and other to reflect comparable segment operating results.
The reconciliation of segment operating revenues and expenses to con-solidated operating revenues and expenses below also includes those items of a non-operational nature. We exclude from segment results the effects of certain items that management does not consider in assessing segment performance, primarily because of their non-operational nature.
We have adjusted prior period consolidated and segment information, where applicable, to conform to current year presentation.
Our segments and their principal activities consist of the following:
Segment Description
Wireless Wireless’ communications products and services include wire-less voice and data services and equipment sales, which are provided to consumer, business and government customers across the United States.
Wireline Wireline’s voice, data and video communications products and enhanced services include broadband video and data, cor-porate networking solutions, data center and cloud services, security and managed network services and local and long distance voice services. We provide these products and ser-vices to consumers in the United States, as well as to carriers, businesses and government customers both in the United States and around the world.
The following table provides operating financial information for our two reportable segments:(dollars in millions)
2014 Wireless Wireline Total Segments
External Operating RevenuesRetail service $ 69,451 $ – $ 69,451Other service 3,104 – 3,104
Service revenue 72,555 – 72,555
Equipment 10,957 – 10,957Other 4,021 – 4,021
Consumer retail – 15,583 15,583Small business – 2,464 2,464
Mass Markets – 18,047 18,047
Strategic services – 8,318 8,318Core – 5,355 5,355
Global Enterprise – 13,673 13,673
Global Wholesale – 5,240 5,240Other – 462 462
Intersegment revenues 113 1,007 1,120Total operating revenues 87,646 38,429 126,075
Cost of services and sales 28,825 21,332 50,157Selling, general and administrative expense 23,602 8,180 31,782Depreciation and amortization expense 8,459 7,882 16,341
Total operating expenses 60,886 37,394 98,280Operating income $ 26,760 $ 1,035 $ 27,795
Assets $ 160,385 $ 76,673 $ 237,058Plant, property and equipment, net 38,276 50,318 88,594Capital expenditures 10,515 5,750 16,265

69
notes to ConsolIdated fInanCIal stateMents continued
(dollars in millions)2013 Wireless Wireline Total Segments
External Operating RevenuesRetail service $ 66,282 $ – $ 66,282Other service 2,691 – 2,691
Service revenue 68,973 – 68,973
Equipment 8,096 – 8,096Other 3,851 – 3,851
Consumer retail – 14,842 14,842Small business – 2,537 2,537
Mass Markets – 17,379 17,379
Strategic services – 8,129 8,129Core – 6,028 6,028
Global Enterprise – 14,157 14,157
Global Wholesale – 5,583 5,583Other – 442 442
Intersegment revenues 103 1,063 1,166Total operating revenues 81,023 38,624 119,647
Cost of services and sales 23,648 21,396 45,044Selling, general and administrative expense 23,176 8,571 31,747Depreciation and amortization expense 8,202 8,327 16,529
Total operating expenses 55,026 38,294 93,320Operating income $ 25,997 $ 330 $ 26,327
Assets $ 146,429 $ 84,573 $ 231,002Plant, property and equipment, net 35,932 51,885 87,817Capital expenditures 9,425 6,229 15,654

70
notes to ConsolIdated fInanCIal stateMents continued
(dollars in millions)2012 Wireless Wireline Total Segments
External Operating RevenuesRetail service $ 61,383 $ – $ 61,383Other service 2,290 – 2,290
Service revenue 63,673 – 63,673
Equipment 8,010 – 8,010Other 4,096 – 4,096
Consumer retail – 14,145 14,145Small business – 2,589 2,589
Mass Markets – 16,734 16,734
Strategic services – 7,737 7,737Core – 6,833 6,833
Global Enterprise – 14,570 14,570
Global Wholesale – 6,031 6,031Other – 498 498
Intersegment revenues 89 1,112 1,201Total operating revenues 75,868 38,945 114,813
Cost of services and sales 24,490 21,657 46,147Selling, general and administrative expense 21,650 8,860 30,510Depreciation and amortization expense 7,960 8,424 16,384
Total operating expenses 54,100 38,941 93,041Operating income $ 21,768 $ 4 $ 21,772
Assets $ 142,485 $ 84,815 $ 227,300Plant, property and equipment, net 34,545 52,911 87,456Capital expenditures 8,857 6,342 15,199

71
notes to ConsolIdated fInanCIal stateMents continued
Reconciliation to Consolidated Financial InformationA reconciliation of the segment operating revenues to consolidated operating revenues is as follows:
(dollars in millions)Years Ended December 31, 2014 2013 2012
Operating RevenuesTotal reportable segments $ 126,075 $ 119,647 $ 114,813Reconciling items:
Impact of divested operations (Note 2) 256 599 835Corporate, eliminations and other 748 304 198
Consolidated operating revenues $ 127,079 $ 120,550 $ 115,846
A reconciliation of the total of the reportable segments' operating income to consolidated Income before (provision) benefit for income taxes is as follows:
(dollars in millions)Years Ended December 31, 2014 2013 2012
Operating IncomeTotal segment operating income $ 27,795 $ 26,327 $ 21,772
Severance, pension and benefit credits (charges) (Note 12) (7,507) 6,232 (7,186)Gain on spectrum license transactions (Note 2) 707 278 –Litigation settlements (Note 17) – – (384)Impact of divested operations (Note 2) 12 43 56Other costs (334) – (276)Corporate, eliminations and other (1,074) (912) (822)
Consolidated operating income 19,599 31,968 13,160
Equity in earnings of unconsolidated businesses 1,780 142 324Other income and (expense), net (1,194) (166) (1,016)Interest expense (4,915) (2,667) (2,571)Income Before (Provision) Benefit for Income Taxes $ 15,270 $ 29,277 $ 9,897
A reconciliation of the total of the reportable segments' assets to consolidated assets is as follows:
(dollars in millions)At December 31, 2014 2013
AssetsTotal reportable segments $ 237,058 $ 231,002Corporate, eliminations and other (4,350) 43,096Total consolidated $ 232,708 $ 274,098
Corporate, eliminations and other at December 31, 2013 is primarily comprised of cash and cash equivalents which were used to complete the Wireless Transaction on February 21, 2014.
We generally account for intersegment sales of products and services and asset transfers at current market prices. No single customer accounted for more than 10% of our total operating revenues during the years ended December 31, 2014, 2013 and 2012. International operating revenues and long-lived assets are not significant.
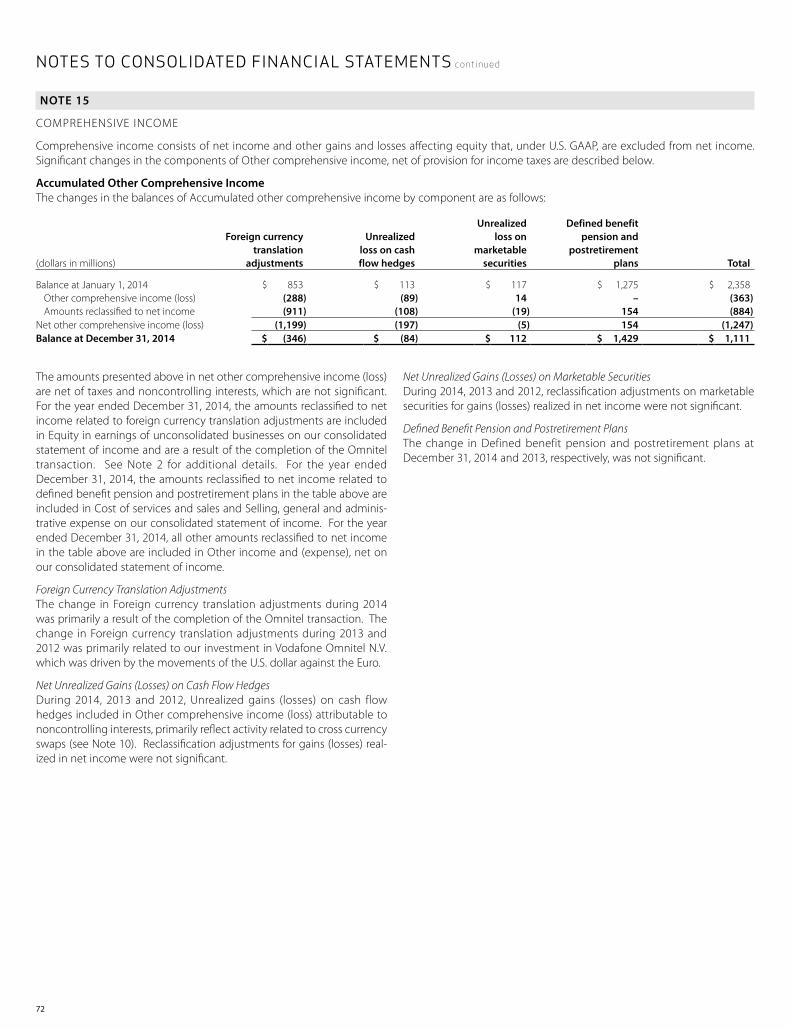
72
notes to ConsolIdated fInanCIal stateMents continued
NOTE 15
COMPREHENSIVE INCOME
Comprehensive income consists of net income and other gains and losses affecting equity that, under U.S. GAAP, are excluded from net income. Significant changes in the components of Other comprehensive income, net of provision for income taxes are described below.
Accumulated Other Comprehensive IncomeThe changes in the balances of Accumulated other comprehensive income by component are as follows:
(dollars in millions)
Foreign currency translation
adjustments
Unrealized loss on cash flow hedges
Unrealized loss on
marketable securities
Defined benefit pension and
postretirement plans Total
Balance at January 1, 2014 $ 853 $ 113 $ 117 $ 1,275 $ 2,358Other comprehensive income (loss) (288) (89) 14 – (363)Amounts reclassified to net income (911) (108) (19) 154 (884)
Net other comprehensive income (loss) (1,199) (197) (5) 154 (1,247)Balance at December 31, 2014 $ (346) $ (84) $ 112 $ 1,429 $ 1,111
Net Unrealized Gains (Losses) on Marketable SecuritiesDuring 2014, 2013 and 2012, reclassification adjustments on marketable securities for gains (losses) realized in net income were not significant.
Defined Benefit Pension and Postretirement PlansThe change in Defined benefit pension and postretirement plans at December 31, 2014 and 2013, respectively, was not significant.
The amounts presented above in net other comprehensive income (loss) are net of taxes and noncontrolling interests, which are not significant. For the year ended December 31, 2014, the amounts reclassified to net income related to foreign currency translation adjustments are included in Equity in earnings of unconsolidated businesses on our consolidated statement of income and are a result of the completion of the Omnitel transaction. See Note 2 for additional details. For the year ended December 31, 2014, the amounts reclassified to net income related to defined benefit pension and postretirement plans in the table above are included in Cost of services and sales and Selling, general and adminis-trative expense on our consolidated statement of income. For the year ended December 31, 2014, all other amounts reclassified to net income in the table above are included in Other income and (expense), net on our consolidated statement of income.
Foreign Currency Translation AdjustmentsThe change in Foreign currency translation adjustments during 2014 was primarily a result of the completion of the Omnitel transaction. The change in Foreign currency translation adjustments during 2013 and 2012 was primarily related to our investment in Vodafone Omnitel N.V. which was driven by the movements of the U.S. dollar against the Euro.
Net Unrealized Gains (Losses) on Cash Flow HedgesDuring 2014, 2013 and 2012, Unrealized gains (losses) on cash flow hedges included in Other comprehensive income (loss) attributable to noncontrolling interests, primarily reflect activity related to cross currency swaps (see Note 10). Reclassification adjustments for gains (losses) real-ized in net income were not significant.

73
NOTE 16
ADDITIONAL FINANCIAL INFORMATION
The tables that follow provide additional financial information related to our consolidated financial statements:
Income Statement Information(dollars in millions)
Years Ended December 31, 2014 2013 2012
Depreciation expense $ 14,966 $ 15,019 $ 14,920Interest costs on debt balances 5,291 3,421 2,977Capitalized interest costs (376) (754) (406)Advertising expense 2,526 2,438 2,381
Balance Sheet Information(dollars in millions)
At December 31, 2014 2013
Accounts Payable and Accrued LiabilitiesAccounts payable $ 5,598 $ 4,954Accrued expenses 4,016 3,954Accrued vacation, salaries and wages 4,131 4,790Interest payable 1,478 1,199Taxes payable 1,457 1,556
$ 16,680 $ 16,453
Other Current LiabilitiesAdvance billings and customer deposits $ 3,125 $ 2,829Dividends payable 2,307 1,539Other 3,217 2,296
$ 8,649 $ 6,664
Cash Flow Information(dollars in millions)
Years Ended December 31, 2014 2013 2012
Cash PaidInterest, net of amounts capitalized $ 4,429 $ 2,122 $ 1,971
Common stock has been used from time to time to satisfy some of the funding requirements of employee and shareowner plans, including 18.2 mil-lion common shares issued from Treasury stock during the year ended December 31, 2014, which had an aggregate value of $0.7 billion.
In addition to the previously authorized three-year share buyback program, in February 2015, the Verizon Board of Directors authorized Verizon to enter into an accelerated share repurchase (ASR) agreement to repurchase $5.0 billion of the Company’s common stock. The total number of shares that Verizon will repurchase under the ASR agreement will be based generally upon the volume-weighted average share price of Verizon’s common stock during the term of the transaction. On February 10, 2015, in exchange for an up-front payment totaling $5.0 billion, Verizon received an initial delivery of 86.2 million shares having a value of approximately $4.25 billion. Final settlement of the transaction under the ASR agreement, including delivery of the remaining shares, if any, that Verizon is entitled to receive, is scheduled to occur in the second quarter of 2015.
notes to ConsolIdated fInanCIal stateMents continued

74
notes to ConsolIdated fInanCIal stateMents continued
NOTE 17
COMMITMENTS AND CONTINGENCIES
In the ordinary course of business Verizon is involved in various commer-cial litigation and regulatory proceedings at the state and federal level. Where it is determined, in consultation with counsel based on litigation and settlement risks, that a loss is probable and estimable in a given matter, the Company establishes an accrual. In none of the currently pending matters is the amount of accrual material. An estimate of the reasonably possible loss or range of loss in excess of the amounts already accrued cannot be made at this time due to various factors typical in contested proceedings, including (1) uncertain damage theories and demands; (2) a less than complete factual record; (3) uncertainty con-cerning legal theories and their resolution by courts or regulators; and (4) the unpredictable nature of the opposing party and its demands. We continuously monitor these proceedings as they develop and adjust any accrual or disclosure as needed. We do not expect that the ultimate resolution of any pending regulatory or legal matter in future periods, including the Hicksville matter described below, will have a material effect on our financial condition, but it could have a material effect on our results of operations for a given reporting period.
Reserves have been established to cover environmental matters relating to discontinued businesses and past telecommunications activities. These reserves include funds to address contamination at the site of a former Sylvania facility in Hicksville NY, which had processed nuclear fuel rods in the 1950s and 1960s. In September 2005, the Army Corps of Engineers (ACE) accepted the site into its Formerly Utilized Sites Remedial Action Program. As a result, the ACE has taken primary responsibility for addressing the contamination at the site. An adjustment to the reserves may be made after a cost allocation is conducted with respect to the past and future expenses of all of the parties. Adjustments to the envi-ronmental reserve may also be made based upon the actual conditions found at other sites requiring remediation.
Verizon is currently involved in approximately 70 federal district court actions alleging that Verizon is infringing various patents. Most of these cases are brought by non-practicing entities and effectively seek only monetary damages; a small number are brought by companies that have sold products and seek injunctive relief as well. These cases have progressed to various stages and a small number may go to trial in the coming 12 months if they are not otherwise resolved. In the third quarter of 2012, we settled a number of patent litigation matters, including cases with ActiveVideo Networks Inc. (ActiveVideo) and TiVo Inc. (TiVo). In con-nection with the settlements with ActiveVideo and TiVo, we recorded a charge of $0.4 billion in the third quarter of 2012 and will pay and recog-nize over the following six years an additional $0.2 billion.
In connection with the execution of agreements for the sales of busi-nesses and investments, Verizon ordinarily provides representations and warranties to the purchasers pertaining to a variety of nonfinancial mat-ters, such as ownership of the securities being sold, as well as indemnity from certain financial losses. From time to time, counterparties may make claims under these provisions, and Verizon will seek to defend against those claims and resolve them in the ordinary course of business.
Subsequent to the sale of Verizon Information Services Canada in 2004, we continue to provide a guarantee to publish directories, which was issued when the directory business was purchased in 2001 and had a 30-year term (before extensions). The preexisting guarantee continues, without modification, despite the subsequent sale of Verizon Information Services Canada and the spin-off of our domestic print and Internet yellow pages directories business. The possible financial impact of the guarantee, which is not expected to be adverse, cannot be reasonably estimated as a variety of the potential outcomes available under the guarantee result in costs and revenues or benefits that may offset each other. We do not believe performance under the guarantee is likely.
As of December 31, 2014, letters of credit totaling approximately $0.1 bil-lion, which were executed in the normal course of business and support several financing arrangements and payment obligations to third parties, were outstanding.
We have several commitments primarily to purchase programming and network services, equipment, software, handsets and peripherals, and marketing activities, which will be used or sold in the ordinary course of business, from a variety of suppliers totaling $21.0 billion. Of this total amount, $8.4 billion is attributable to 2015, $8.5 billion is attributable to 2016 through 2017, $2.5 billion is attributable to 2018 through 2019 and $1.6 billion is attributable to years thereafter. These amounts do not rep-resent our entire anticipated purchases in the future, but represent only those items that are the subject of contractual obligations. Our commit-ments are generally determined based on the noncancelable quantities or termination amounts. Purchases against our commitments for 2014 totaled approximately $21.0 billion. Since the commitments to purchase programming services from television networks and broadcast stations have no minimum volume requirement, we estimated our obligation based on number of subscribers at December 31, 2014, and applicable rates stipulated in the contracts in effect at that time. We also purchase products and services as needed with no firm commitment.

notes to ConsolIdated fInanCIal stateMents continued
75
NOTE 18
QUARTERLY FINANCIAL INFORMATION (UNAUDITED)
(dollars in millions, except per share amounts)Net Income (Loss) attributable to Verizon(1)
Quarter EndedOperatingRevenues
Operating Income (Loss) Amount
Per Share-Basic
Per Share-Diluted
Net Income(Loss)
2014March 31 $ 30,818 $ 7,160 $ 3,947 $ 1.15 $ 1.15 $ 5,986June 30 31,483 7,685 4,214 1.02 1.01 4,324September 30 31,586 6,890 3,695 .89 .89 3,794December 31 33,192 (2,136) (2,231) (.54) (.54) (2,148)
2013March 31 $ 29,420 $ 6,222 $ 1,952 $ .68 $ .68 $ 4,855June 30 29,786 6,555 2,246 .78 .78 5,198September 30 30,279 7,128 2,232 .78 .78 5,578December 31 31,065 12,063 5,067 1.77 1.76 7,916
• Resultsofoperationsforthefirstquarterof2014includeafter-tax-creditsattributabletoVerizonof$1.9billionrelatedtothesaleofitsentireownershipinterestinVodafoneOmnitel,aswellasafter-tax costs attributable to Verizon of $0.6 billion related to early debt redemptions and $0.3 billion related to the Wireless Transaction.
• Resultsofoperationsforthesecondquarterof2014includeafter-taxcreditsattributabletoVerizonof$0.4billionrelatedtoagainonspectrumlicensetransactions.• Resultsofoperationsforthefourthquarterof2014includeafter-taxchargesattributabletoVerizonof$4.7billionrelatedtoseverance,pensionandbenefitcharges,aswellasafter-taxcosts
attributable to Verizon of $0.5 billion related to early debt redemption and other costs. • Resultsofoperationsforthesecondquarterof2013includeafter-taxcreditsattributabletoVerizonof$0.1billionrelatedtoapensionremeasurement.• Resultsofoperationsforthethirdquarterof2013includeimmaterialafter-taxcreditsattributabletoVerizonrelatedtoagainonaspectrumlicensetransaction,aswellasimmaterialafter-tax
costs attributable to Verizon related to the Wireless Transaction.• Resultsofoperationsforthefourthquarterof2013includeafter-taxcreditsattributabletoVerizonof$3.7billionrelatedtoseverance,pensionandbenefitcredits,aswellasafter-taxcosts
attributable to Verizon of $0.5 billion related to the Wireless Transaction.
(1) Net income (loss) attributable to Verizon per common share is computed independently for each quarter and the sum of the quarters may not equal the annual amount.

76
boaRd of dIReCtoRs*
CoRpoRate offICeRs and exeCutIve leadeRshIp
Shellye L. Archambeau Chief Executive Officer MetricStream, Inc.
Mark T. Bertolini Chairman and Chief Executive Officer Aetna Inc.
Richard L. Carrión Chairman and Chief Executive Officer Popular, Inc. and Chairman and Chief Executive Officer Banco Popular de Puerto Rico
Melanie L. Healey Group President and Advisor to the Chairman and Chief Executive Officer The Procter & Gamble Company
M. Frances Keeth Retired Executive Vice President Royal Dutch Shell plc
Lowell C. McAdam Chairman and Chief Executive Officer Verizon Communications Inc.
Donald T. Nicolaisen Former Chief Accountant United States Securities and Exchange Commission
Clarence Otis, Jr. Former Chairman and Chief Executive Officer Darden Restaurants, Inc.
Rodney E. Slater Partner Squire Patton Boggs LLP
Kathryn A. Tesija Executive Vice President and Chief Merchandising and Supply Chain Officer Target Corporation
Gregory D. Wasson Former President and Chief Executive Officer Walgreens Boots Alliance, Inc.
Lowell C. McAdam Chairman and Chief Executive Officer
Francis J. Shammo Executive Vice President and Chief Financial Officer
Roy H. Chestnutt Executive Vice President – Strategy, Development and Planning
Matthew D. Ellis Senior Vice President and Treasurer
James J. Gerace Chief Communications Officer
Roger Gurnani Executive Vice President and Chief Information and Technology Architect
William L. Horton, Jr. Senior Vice President, Deputy General Counsel and Corporate Secretary
Daniel S. Mead Executive Vice President and President of Strategic Initiatives
Marc C. Reed Executive Vice President and Chief Administrative Officer
Shane A. Sanders Senior Vice President – Internal Auditing
Diego Scotti Executive Vice President and Chief Marketing Officer
Craig L. Silliman Executive Vice President – Public Policy and General Counsel
Anthony T. Skiadas Senior Vice President and Controller
John G. Stratton Executive Vice President and President of Operations
Marni M. Walden Executive Vice President and President of Product Innovation and New Businesses
* Directors standing for election at the May 2015 Annual Meeting