We put the customer at the heart of everything we do.
74
Transcript of We put the customer at the heart of everything we do.


We put the customer at the heart of everything we do. We believe in delivering consistent growth with a core focus on service, execution and differentiation. We drive for growth. We drive for success.SCOTT EVANS CEO NONI B GROUP
1 Company Description
2 Results in Brief
3 Chairman’s Report
4 Managing Director’s Report
8 Noni B
9 Rockmans
10 W.Lane
11 beme
12 Online
14 Our Culture and Values
15 Ethical Sourcing
16 Board of Directors
18 Financial Statements
70 Corporate Directory
Contents

Noni B Group has grown to be one of the largest specialty fashion retailer groups in Australia.Our brands include Noni B, Rockmans, W.Lane, beme and the recently acquired Millers, Katies, Crossroads, Autograph and Rivers. We span the country with over 1,400 stores nationally.
Our collective purpose is to help our customers express their love of life – by embracing the truth that every occasion is a special occasion worth feeling fabulous for.
NONI B GROUP ANNUAL REPORT 2018 1

RESULTSIN BRIEF
The following charts reflect Noni B’s journey since 2014 encompassing the acquisition of the Pretty Girl Fashion Group in September 2016
GROUP REVENUE $m COMPARABLE STORE GROWTH %
EARNINGS PER SHARE cents
EBITDA1 $m
NET PROFIT AFTER TAX $m ONLINE SALES % of group revenue
400
300
200
100
0
14 15 16 17 18
40
30
20
10
0
(5)
20
15
10
5
0
(5)
(10)
5
4
3
2
1
0
20
10
0
(10)
(20)
(30)
6
5
4
3
2
1
0
14 15 16 17 18
14 15 16 17 18
16
16
17
17
18
1814 15 16 17 18
1. EBITDA is a non-AAS financial measure, defined for the purposes of this document as earnings before interest, tax, depreciation, amortisation, non-recurring income/expenditure and certain non-cash items such as share based payments and unrealised foreign exchange gains/losses
2 We put the customer at the heart of everything we do.

CHAIRMAN'SREPORT
I am pleased to report another successful year for Noni B Group – in terms of both financial performance and corporate activity. We continued to strengthen the company’s operational base, building on the expanded, scalable platform created through the acquisition and integration of Pretty Girl Fashion Group in FY2017, and we announced the acquisition of five complementary brands from Specialty Fashion Group. The acquisition of these brands, which completed on 2 July 2018, has established Noni B Group as a leader in the Australian women’s apparel market.
Group revenue for the financial year to 1 July 2018 was $372.4 million, an increase of 17.6% over FY2017 which included a 10-month contribution by Pretty Girl. Significantly, like-for-like sales were up +4.5% for the year. This was particularly pleasing, given an increasingly competitive market.
Underlying earnings before interest, tax, depreciation and amortisation (EBITDA)1 were $37.2 million, an increase of 62.7% over FY2017 underlying EBITDA of $22.9 million, and statutory after-tax profit grew by 431.6% to $17.3 million, compared with $3.3 million in FY2017. These increases reflected synergies achieved from the integration of Pretty Girl with Noni B, strong sales performance and the achievement of efficiencies throughout the Group’s operations. Earnings per share were 21.3 cents, compared with 4.6 cents in FY2017.
In line with the strong improvement in earnings, shareholders received a fully-franked interim dividend of 9.0 cents per share in March 2018, and a fully-franked final dividend of 4.0 cents per share will be paid in October 2018. These compare with a single dividend of 4.0 cents per share paid from FY2017 profit.
I would like to emphasise that all four brands contributed to our strong result. Over the four years since Alceon acquired a controlling interest in Noni B, our team has returned the business to profit and delivered like-for-like sales growth and increased earnings in each subsequent year. Likewise, the performance of the three brands acquired from Pretty Girl in September 2016 – Rockmans, W.Lane and beme – has improved substantially since they joined the Group. During this four-year period, the company’s share price has increased from 51 cents to over $3.00, creating significant shareholder value.
Our team’s experience in turning around underperforming retail businesses and setting them on the path to
sustainable, profitable growth will be important following our acquisition of the five additional Specialty Fashion Group brands and their assets. The acquisition, for $31 million, is another step-change for Noni B Group, adding 785 stores to our previous portfolio of 641 and nearly trebling our annual revenue to approximately $1 billion. We are now a significant force in the women’s apparel market, providing the opportunity to take advantage of scale to drive further increases in sales and earnings.
To fund the acquisition and integration costs and to provide additional working capital, in May 2018 we raised $40 million through an institutional placement and accelerated non-renounceable entitlement offer at $2.50 per share. This was well supported by shareholders, with Noni B’s largest shareholder, Alceon, taking up its full pro-rata entitlement under the entitlement offer.
The five new brands have recently traded at a loss, but we are confident we can address the business’ underlying issues. Early indications following completion of the acquisition are encouraging. As with Pretty Girl, there are substantial cost, supply chain and other operational synergies, and we anticipate that the businesses will be restored to profitability in the 2020 financial year.
Noni B Group’s increased scale will open up significant opportunities. While our overall results are likely to be impacted in the short term by the inclusion of the new brands’ trading performance, we are confident of our ability to continue to increase the four Noni B brands’ sales and earnings.
The Group has a highly committed and experienced executive team, focused on driving sustainable sales growth by placing the customer at the heart of everything we do and on achieving efficiencies in our supply chain and operating expenses. I thank Scott and our entire team for their outstanding achievements during the past year and for creating a solid platform for the growth of our expanded business. I also thank my fellow non-executive directors, Sue Morphet and David Wilshire, for their ongoing guidance.
Richard Facioni Chairman 29 August 2018
NONI B GROUP ANNUAL REPORT 2018 3

MANAGING DIRECTOR'SREPORT
We are pleased with the progress made by Noni B Group during FY2018. Despite a challenging market environment, undivided focus on our customers led to higher like-for-like sales for all our four brands and increases in cash flow and earnings.
There is still a long way to go to capitalise on all our opportunities, but there is a feeling of growing momentum throughout the Group.
Our performance during the year was the result of hard work by all members of our team – in our stores and in our support centre – which achieved positive like-for-like growth for all brands. The total Group’s like-for-like sales were +3% in the first half and a strong +6% in the second half, reflecting our team’s focus on exceeding every customer’s expectations. I sincerely thank them for delivering these results and for their support and flexibility as the Group changes and grows.
PROGRESS DURING THE YEARWe began the 2018 financial year with the integration of Pretty Girl Fashion Group completed and having achieved the forecast synergies to create scalable infrastructure to support further growth. Pretty Girl’s acquisition in September 2016 had given us three additional brands – Rockmans, W.Lane and beme – and our immediate goal was to make material operational efficiencies and financial improvements throughout the expanded business, as well as to focus on driving the customer experience across all brands.
One of our core goals and beliefs is to create an environment in our stores in which customers feel comfortable and confident and that builds their emotional engagement with our collections and store teams.
In all stores, seasonal stock has been increased and purchase pathways have been reset to make it easier for customers to shop. In addition, new store design concepts have been introduced for the Noni B and beme brands and are being rolled out across their networks.
In all our operations, we continuously challenge ourselves to improve efficiency, listening to what our customers tell us and fine-tuning our ranges, store layouts, merchandising and service. We analyse data to learn more about our customers’ behaviours and what they want, and we invest in training to help our store teams provide personal service.
Improvements in the supply chain reduced sourcing and other costs during the year, and initiatives in January 2018 have begun to shorten the lead time to deliver new stock to stores, with further reductions expected in the coming year.
Rockmans had a record year, benefiting from increased stock levels and greater focus on customer experience and store density. The brand also increased its accessories offering three-fold in April 2018 to capitalise on the global trend towards buying accessories.
Noni B recorded its fourth consecutive year of like-for-like sales growth with a strong response to the Group’s winter categories, particularly during the key weeks leading up to Mother’s Day.
W.Lane and beme also had a successful year and are well placed for further sales and earnings growth in FY2019.
By the end of the financial year, our network had expanded to 641 stores from 614 at the beginning. We continued to optimise the portfolio through opening 50 stores in new locations and closing 23 stores.
All four brands have continued to achieve considerable growth through our online channels. The Group’s online sales increased by 67.8% over the previous year to $20 million, representing 5.8% of Group sales. Online visits were up 33% and there was 12.5% growth in online customers as we improved the mobile experience and increased the range of products available on each brand’s website.
We are continuing to invest in our online team to take full advantage of the opportunities that online channels offer and to increase speed of delivery. Our products are now available through multiple marketplaces
4 We put the customer at the heart of everything we do.

Store portfolioNTNoni B Group: 8Acquired Brands: 3
QLDNoni B Group: 167
Acquired Brands: 176
NSW & ACTNoni B Group: 226
Acquired Brands: 248
VICNoni B Group: 96
Acquired Brands: 174
NZNoni B Group: 0
Acquired Brands: 28
TASNoni B Group: 13Acquired Brands: 22
SANoni B Group: 45Acquired Brands: 56
WANoni B Group: 86Acquired Brands: 78
such as Amazon and Ebay, enabling us to offer our collections internationally.
Throughout our operations, we have built a strong culture based on shared values and behaviours, as outlined on page 14 of this report. These values underpin everything we do, including our ethical sourcing policy summarised on page 15. From August 2018, partnering with Clean Up Australia, we have stopped providing customers with plastic bags, instead offering them the opportunity to purchase paper bags.
LOOKING AHEAD TO FY2019We have started the new financial year with a major expansion through the acquisition of five well-known women’s fashion brands from Specialty Fashion Group, which was completed at the beginning of July. This has transformed the Group into one of Australia’s pre-eminent women’s apparel retailers with over 1,400 stores, pro-forma revenue of approximately $1 billion and annual sales of more than 40 million garments.
Our new brands, as outlined on page 7, complement the Group’s existing brand portfolio and enhance our product offering to our core women’s market. There are substantial synergies through combining the supply chains and logistics, integrating online infrastructure and systems, optimising the store portfolio and leveraging the Group’s expanded purchasing size; we expect these to be achieved
by the end of the current financial year, with the five brands combined making a positive contribution to the Group’s 2020 profit.
Since the proposed transaction was announced in May 2018, the two management teams have been working together on detailed plans in line with the successful approach adopted for the turnaround of Noni B and the acquisition of the Pretty Girl brands. We are developing a deep understanding of the five brands and their operations and are pleased with progress to date.
THE FUTUREWe will continue to invest in improving customers’ instore experience, learning from the ‘big data’ we obtain from our stores, and will roll out new stores according to demand.
The Group has made strong progress during the past four years, turning around four underperforming businesses and delivering consecutive annual like-for-like growth in the Noni B brand and, in-turn, the Pretty Girl brands. We now look forward to taking advantage of the many opportunities offered by our newly expanded Group.
Scott Evans Managing Director 29 August 2018
NONI B GROUP ANNUAL REPORT 2018 5

Rockmans and Noni B store transformations
NONI B BEFORE
ROCKMANS BEFORE
NONI B AFTER
ROCKMANS AFTER
In all our operations, we continuously challenge ourselves to improve efficiency, listening to what our customers tell us and fine‑tuning our ranges, store layouts, merchandising and service. SCOTT EVANS CEO NONI B GROUP
6 We put the customer at the heart of everything we do.

Operational efficiencies
FY2019
FY2019
FY2019
FY2019
FY2019
IMPROVED WORKING CAPITAL
PRODUCT SUPPLIER CONSOLIDATION
COST OF GOODS SCALE BENEFITS
LOGISTICS CONSOLIDATION
COMMON ON-LINE PLATFORM
Drive growth
ONGOING
ONGOING
ONGOING
ONGOING
ONGOING
STORE ROLL OUT W-LANE AND BEME
LOCATION MAXIMISATION ALL BRANDS
CURRENT STORE NETWORK OPTIMISATION
IMPROVED SPEED TO MARKET
ONLINE ACROSS ALL BRANDS AND CHANNELS
Integration
FY2019
FY2020
FY2019
FY2019
FY2019
FY2019
COMBINE TO ONE SUPPORT CENTRE
INTEGRATED IT SYSTEMS
IMPROVED WORKING CAPITAL
SUPPORT CENTRE SYNERGIES
ACQUIRED BRANDS STOCK RE-BUILDING
AGED STOCK EXIT EXECUTION
Integration and growth plans
Acquired brands portfolio
PropositionFemale apparel
MatureFemale apparel
MatureFemale apparel
MatureLifestyle
Female apparel Plus Sized
Overview
Thoughtful and affordable fashion
for the mature woman
Value based fashion for the
ageless and feminine woman
Affordable fashion in sizes 8 to 22 for the
fashion-conscious woman
The destination of stylish,
quality fashion for everyday Australians
Modern, relaxed fashion that
flatters women sized 14 to 26
Number of stores 312 142 102 135 94
Complementary Noni B brand(s)
NONI B GROUP ANNUAL REPORT 2018 7

3.9%COMPARABLE STORE GROWTH
228kEMAIL SUBSCRIBERS
1.4mMEMBERS
4.37mONLINE VISITS
223STORES
2018 BRANDS IN REVIEW
The Noni B woman is looking for classic, timeless style that makes her beautiful.
Whether she’s working, retired or spending time with family, the Noni B woman embraces life.
Every day is a special occasion worth feeling fabulous for.
Achievements of the year ● Online sales grew 47.8% on the previous year.
● Transformed customer experience with easy to shop in store Installations.
● Continued to push the boundaries with emotional windows.
● Continued growth in loyalty sales through a strong personalised engagement.
8 We put the customer at the heart of everything we do.

5.7%COMPARABLE STORE GROWTH
516kEMAIL SUBSCRIBERS
3.5mMEMBERS
6.7mONLINE VISITS
291STORES
A desire for FREEDOM – our customer wants to feel carefree, comfortable and confident. To be and act the way she wants to be.
A desire to be INSPIRED – life wasn’t meant to be mundane. She loves to feel inspired and she wants to look stylish, every day.
A desire for VALUE – while she is cost-conscious, she understands quality fabrication and wants value.
Achievements of the year ● Online sales grew 84% on the previous year.
● An in-depth understanding of the customer and a unique hand writing in the industry.
● Increased stock levels.
● Investment in an accessory destination in April has delivered a 40.5% growth in quarter 4.
● Enhanced customer experience through more emotive windows and more engaging instore theatre.
● A continued approach to creating a Fun, Bright and Happy place to shop which refers back to the Rockmans personality.
NONI B GROUP ANNUAL REPORT 2018 9

2018 BRANDS IN REVIEW
The W.Lane lady has an active and fulfilling social life with family, friends and travel keeping her busy, busy, busy.
She is understated and timeless, with quality, fit & fabric at the heart of her wardrobe. She wears her clothes, they don’t wear her.
Achievements of the year ● Online sales growth of 125% over the previous
year, Online now contributes 5% of total brand turnover
● 21 new stores opened during FY18.
● 21% increase in transactions through our customer loyalty program.
(+52 EMPORIUM AND COMBINATION)
210kEMAIL SUBSCRIBERS
998kMEMBERS
3.4mONLINE VISITS
97
STORES
1.1%COMPARABLE STORE GROWTH
10 We put the customer at the heart of everything we do.

Being young at heart, confident and full of life, the beme woman thrives on looking good no matter what the occasion.
She wants modern and on-trend designs that flatter her silhouette and complement her style.
Achievements of the year ● Online grew by 41% over the previous period and
represents 13% of total brand sales.
● Store expansion in FY18 of 7 standalone stores.
● Fit & size blocks redesigned for the modern woman.
156kEMAIL SUBSCRIBERS
498kMEMBERS
2.3mONLINE VISITS
30STORES
4.3%COMPARABLE STORE GROWTH
NONI B GROUP ANNUAL REPORT 2018 11

67.8% online sales growth (versus 56% in FY17)
Accelerated sales growthand participation achieved across all our brands
ONLINE
12 We put the customer at the heart of everything we do.

Online sales growth 2018We continued to invest in our Online capability:
● Launched onto domestic and international marketplaces including Amazon and Ebay.
● Invested in building and strengthening the Online team.
● Increased product choice for the customer on each brands website.
● Improved mobile customer experience.
● Invested in new digital marketing channels.
ONLINE VISITSGREW BY
+33%ON PREVIOUS YEAR
6.5 millionCUSTOMERS
12.5%
WE DELIVERED
322kORDERS IN THE LAST 12 MONTHS
ONLINE SALES WERE
5.8%OF GROUP SALES IN FY18 (3.6% IN FY17)
MOBILE SALES TRAFFICGREW BY
+119%VERSUS FY17
ONLINE CONVERSIONRATE INCREASED BY
+40%ON PREVIOUS YEAR
INCREASE ON PREVIOUS YEAR
100%
80%
60%
40%
20%
0%
83.1%
61.4% 62.5%69.0%
1.6%7.3% 6.0%
19.1%
Q1 Q2 Q3 Q4
Noni B Group Online Sales Growth
Fashion Online Sales Growth*
*Source: NAB Report.
NONI B GROUP ANNUAL REPORT 2018 13

OUR CULTURE& VALUES
We put the customer at the heart of everything we do, we believe in delivering consistent growth with a core focus on service, execution and differentiation. We drive for growth, we drive for success.
Our values reflect the heart and soul of Noni B Group. When we interact with our team and our customers, our values help us develop and grow.
Individually these values seem obvious, but together they form a culture that we think is unique and different from many other companies.
WE LOVE WHAT WE DO ● At the heart of the business are the CUSTOMERS /
PRODUCTS / BRANDS.
● The product needs to be unique and the shopping experience is of equal importance.
● We aim to create a positive customer experience.
● It’s all about discovery, about creating surprise, and great service.
In-storeWe’ve invested in our stores and teams to ensure we deliver an optimal in-store experience and service which keep our customers coming back for more!
On-lineWe’ve listened to what customers want and built an omni-channel that’s simple, seamless and fast to deliver!
Living our purpose with shared values and behaviours
Customers are at the heart of everything we do
Inspire and motivate each other
Own what you do
Go above and beyond
Know and share and talk more
14 We put the customer at the heart of everything we do.

ETHICALSOURCING
SOURCING POLICYAn effective and sustainable supply chain is integral to the Noni B Group business model, and our supply partners are required to meet certain standards in relation to human rights, workplace safety, environmental impacts and ethical business practices.
We choose, promote and develop relationships with suppliers who are aligned with our expectations of ethical and socially responsible behaviour.
We currently source products in several countries, including China, India, Bangladesh and Vietnam. Buying products from these regions creates economic benefits for them. Noni B Group’s ethical sourcing standards are aligned to the Ethical Trading Initiative (ETI) base code and its principles of continuous improvement. We will not knowingly work with any company that does not comply with the ETI base code. In addition to complying with local laws and regulations, suppliers, their factories and authorised subcontractors must demonstrate continuous improvement towards the following standards.
● Child labour shall not be used.
● Employment is freely chosen.
● Freedom of association and the right to collective bargaining is respected.
● All working conditions are safe and hygienic.
● Living wages are paid.
● Working hours are not excessive.
● No discrimination is practised.
● Regular employment is provided.
● No harsh or inhumane treatment is allowed.
All suppliers must sign our supply terms and conditions, of which the ETI Code is part, prior to any orders being placed. We will not do business with a supplier who does not comply with the ETI Code.
SOURCING POLICY ASSURANCEThe Noni B Group’s ethical sourcing program starts with the engagement of a new supplier and continues throughout the Company’s sourcing and ongoing supplier relationship management processes. We rely on independent third-party reports and factory visits to manage and audit the Ethical Sourcing policy across our main suppliers. Supplier factories in the audit program are required to have a current audit certificate, which means they have been audited by us or another party whose audits we accept. We will consider a supplier to be low risk if they operate in more regulated countries, or if they are supplying recognised international brands.
Where a supplier is unwilling to achieve compliance, the Noni B Group may terminate the relevant supply contract. Where a supplier is unable to achieve compliance, the Group will work with that supplier to help them become compliant within a specific period of time, however, contract termination may apply if compliance cannot be achieved in critical areas.
Given the size and scope of the Group’s supply chain, and the available resources, there is a need to prioritise and focus the Group’s audit efforts.
The scope of the Group’s supplier auditing program focuses mainly on significant direct finished product suppliers to the Noni B Group. However, the Group’s direct suppliers are made responsible for ensuring that second tier suppliers comply with the Group’s trading terms and conditions.
Bangladesh sourcing: Noni B Group currently sources a portion of its products in Bangladesh. Since 2013, we have been a signatory and member of the Bangladesh Accord. This is a legally binding five-year commitment to work with some of the world’s largest apparel retailers. Together we have invested in worker safety, improved conditions and transparent reporting.
ETHICAL RAW MATERIAL PROCUREMENTOur sourcing commitment is supported by the following initiatives relating to raw materials:
Rabbit Angora: Noni B Group will not source products containing rabbit angora.
Cotton: Noni B Group is committed to ensuring that child workers are not used anywhere in its supply chain and that employment is freely chosen. An area of concern for the Group is reports of forced child and adult labour being used in cotton cultivation in Uzbekistan. Although we do not have any direct business relationships with cotton producers, we seek to avoid the use of Uzbekistan cotton. We have requested our suppliers avoid sourcing cotton from Uzbekistan in relation to the manufacture of any product supplied to the Noni B Group until such time as the practice of using forced and underage labour ceases.
Azo Dyes: We have voluntarily adopted the EU standard whereby we prohibit the manufacture and sale of goods which contain prohibited levels of the specific aromatic amines originating from a small number of azo dyes.
Sandblasted Denim: The harmful practice of ‘sandblasting’ denim with silica based powders was discontinued in our business in 2014.
NONI B GROUP ANNUAL REPORT 2018 15

BOARDOF DIRECTORS
Richard FacioniCHAIRMAN, NON–EXECUTIVE DIRECTOR
Joined the Board in November 2014
Background: Richard is an experienced corporate finance and investment professional, with over 25 years’ experience in investment banking, mergers and acquisitions, corporate advice, restructurings and principal investment. Richard leads the private equity practice of Alceon Group and represents Alceon’s investment in Noni B. He also oversees and is a Director of Alceon’s other retail investments in EziBuy Limited, SurfStitch Pty Limited and Cheap as Chips Discount Stores Pty Ltd. Prior to Alceon, Richard was a Managing Director of Silverfern Group, a global private equity origination and co-investment firm, where he co-led the group’s activities in Australasia. He previously spent 15 years with Macquarie Group where he held a number of roles including Head of Acquisition Finance and Head of Principal Transactions Group, and was a co-founder of Shearwater Capital Group, a private credit opportunities investment firm.
Qualifications: Bachelor of Engineering (Honours I) from the University of Sydney; Master of Business Administration from the Wharton School at the University of Pennsylvania; Graduate Member of the Australian Institute of Company Directors; Fellow of the Financial Services Institute of Australasia (FINSIA)
Special responsibilities: Chair of the Remuneration Committee and member of the Audit and Risk Committee
Scott EvansCHIEF EXECUTIVE OFFICER, MANAGING DIRECTOR
Joined the Board in November 2014
Background: Scott has over 20 years’ experience in international retailing leading both private and public companies. Scott started in the United Kingdom with Marks & Spencer before transitioning to Managing Director of Greenwoods Menswear (150 store chain) where Scott orchestrated the sale of the business to Chinese brand Bosideng. Scott moved to Australia and joined Specialty Fashion Group leading both Millers (largest ladies specialty business in the country with a 400 store chain) and Crossroads (150 store chain). Scott then transitioned to the role of CEO at Bras N Things under the BBRC Group before taking on the opportunity at Noni B in November 2014.
Qualifications: Scott holds a BTEC National Diploma in Business and Finance
16 We put the customer at the heart of everything we do.

David WilshireNON-EXECUTIVE DIRECTOR
Joined the Board in November 2014
Background: David has over 15 years’ experience in mergers and acquisitions, capital markets and principal investment. David is a member of Alceon’s corporate finance and private equity practice and represents Alceon’s investment in Noni B. He is also a Director of EziBuy Limited, SurfStitch Pty Limited and Cheap as Chips Discount Stores Pty Ltd. Prior to Alceon, David held roles within the corporate finance group of Babcock & Brown and the investment banking divisions of Goldman Sachs and Macquarie Group, where he helped numerous leading Australian and international companies across a broad range of industries with acquisitions, divestments and capital market transactions, as well as strategic advice.
Qualifications: David holds a Bachelor of Commerce from the Monash University
Special responsibilities: Member of the Remuneration Committee and Audit and Risk Committee
Sue MorphetNON-EXECUTIVE DIRECTOR
Joined the Board in February 2015
Background: Sue Morphet has over 30 years of brand management and retail experience across Australia and New Zealand. Sue is currently a Non-Executive Director of Asaleo Care Ltd (since 2014), a Director of Chief Executive Women and Chairperson of National Tiles Pty Ltd. Sue was previously CEO of Pacific Brands Limited (2007 – 2012) having worked in the organisation for 12 years, most notably as Group General Manager of Bonds. Other prior roles include Chairperson of Manufacturing Australia (2013 – 2015), Non-Executive Director at Fisher & Paykel Appliances Ltd (2014 – 2018) and Non-Executive Director of Godfreys Group Limited (2014 – 2018)
Qualifications: Sue holds a Bachelor of Science and Education, University of Melbourne; Scholar, Mt Eliza Business School
Special responsibilities: Member of the Remuneration Committee and Chair of the Audit and Risk Committee
Luke SoftaCHIEF FINANCIAL OFFICER, COMPANY SECRETARY
Joined the Board in March 2015
Background: Luke has over 15 years’ experience as a Chief Financial Officer within the Asian, American and Australian markets. Luke has spent 18 years in the service industry and held a number of roles within the Millward Brown Group, including regional Chief Financial Officer for Africa Asia Pacific, before transitioning to Michael Page International as their Asia Pacific Chief Financial Officer. Luke then moved into the retail industry as the Chief Financial Officer at Bras N Things before taking on the opportunity at Noni B in March 2015.
Qualifications: Luke holds a Bachelor of Commerce and is a Fellow Certified Practising Accountant
Special responsibilities: Secretary to the Remuneration Committee and Audit and Risk Committee
NONI B GROUP ANNUAL REPORT 2018 17

FINANCIAL STATEMENTS
18 We put the customer at the heart of everything we do.

DIRECTORS' REPORT
Your Directors present their report on the Consolidated Group (referred to herein as the ‘Group’ or ‘Consolidated Entity’) consisting of Noni B Limited and its controlled entities for the 52 week period ended 1 July 2018. The information in the preceding operating and financial review forms part of this Directors’ report for the financial year ended 1 July 2018 and is to be read in conjunction with the following information:
GENERAL INFORMATIONDIRECTORS The following persons were Directors of Noni B Limited during the financial year and up to the date of this report, unless otherwise stated:
Richard Facioni Non-Executive Director
Scott Evans Chief Executive Officer and Managing Director
David Wilshire Non-Executive Director
Sue Morphet Non-Executive Director
PRINCIPAL ACTIVITIESThe principal continuing activities of the Group and the entities it controlled during the financial year were the retailing of women’s apparel and accessories. There were no significant changes in the nature of these activities during the financial year.
DIVIDENDS PAID, DECLARED OR RECOMMENDEDOn 29 August 2018, the Noni B Board announced a final dividend of 4.0 cents (2017: 4.0 cents) per share with a record date of 17 September 2018 and payable to shareholders on 12 October 2018 (2017: 9 October 2017). This follows the interim dividend of 9.0 cents for the first-half ended 31 December 2017 which was paid to shareholders on 29 March 2018 taking total dividends for the year to 13.0 cents. In determining the final dividend, the Board considered the continuing improvement in the trading performance in addition to the strong cash generation during the year.
SIGNIFICANT CHANGES IN THE STATE OF AFFAIRSThere have been no significant changes in the state of affairs of the Group during the year.
EVENTS AFTER THE REPORTING PERIODOn 2 July 2018 the Group successfully acquired a portfolio of brands from the Specialty Fashion Group. With brands such as Millers, Autograph, Crossroads, Rivers and Katies now forming part of the Noni B Group, this will see an increase in the store portfolio to over 1,400 (2018: 641).
No other matters or circumstances has arisen since 1 July 2018 that has significantly affected, or may significantly affect the Group’s operations, the results of those operations, or the Group’s state of affairs in future financial years.
LIKELY FUTURE DEVELOPMENTS AND EXPECTED RESULTSThe likely developments in the operations of the Group and the expected results of those operations in financial years subsequent to the year ended 1 July 2018 is included in the operational and financial highlights section of this report. No additional information is included on the likely developments in the operations of the Group and the expected results of those operations as the Directors reasonably believe that the disclosure of such information would be likely to result in unreasonable prejudice to the economic entity if included in this report, and it has therefore been excluded in accordance with section 299(3) of the Corporations Act 2001.
ENVIRONMENTAL REGULATIONThe Group’s operations are not subject to any significant environmental obligations or regulations under Australian Commonwealth or State Law.
OPERATING AND FINANCIAL REVIEWReview of operations
Noni B Limited operates within the women’s fashion and retail sector in Australia through a national network of boutique stores. During the 2018 financial year, the Group comprised of the Noni B, Liz Jordan, Rockmans, W.Lane and beme brands which were sold exclusively through the Noni B Group stores. On 2 July 2018 the Group successfully acquired a portfolio of brands from the Specialty Fashion Group. The addition of the Millers, Autograph, Crossroads, Rivers and Katies brands to the Noni B Group will see an increase in the store portfolio to over 1,400 (2018: 641).
The retail trading environment is competitive with changing customer needs and other external and internal risk drivers. The Group is committed to delivering on our strategies as defined in our 3 key pillars (Integration, Operational Efficiencies, and Drive Growth) and keeping the customer at the heart of everything we do.
Review of financial performance
Group revenue for FY2018 ended on $372.4m (17.6% higher than the previous year which included the 53 weeks) with a like for like sales growth of +4.5%. The total gross margin was 64.1% of sales and expenses
NONI B GROUP ANNUAL REPORT 2018 19

DIRECTORS' REPORT
(excluding cost of sales, finance costs and impairment) were 58% of sales (vs. prior year 61%). The Group delivered an Underlying Earnings Before Interest, Taxation, Depreciation and Amortisation (adjusted)1 (EBITDA) of $37.2m, compared with the Underlying EBITDA for the prior year of $22.9m (note 2).
Review of financial position
Noni B Limited ended the year with a cash and cash equivalent balance of $58.7m and a total bank debt of $20.8m. The Group holds a positive cash position of $38.3m inclusive of $38.6m of funds received from equity raising (net of transaction costs) and had access to total facilities of $12.2m (note 13) comprising of working capital, bank guarantee and line of credit facilities. Cash from operating activities resulted in an inflow of $21.7m, compared to $33.4m in FY2017 with the primary change being an increase in taxes paid ($7.2m) and a stock build ($20.9m) for FY2018. Cash outflow from investing activities was $17.8m in comparison to $76.8m in FY2017 (due to a $65.5m payment for the acquisition of Pretty Girl Fashion Group). Cash from financing activities resulted in an inflow of $26.6m which was attributed to $38.6m from the capital raising offset by the payment of debt ($2.3m) and dividends ($9.7m).
The Groups inventory on 1 July 2018 was $45.5m, 155.5% higher than 2017 ($29.2m).
Half-on-half comparison to prior year:
H1 2018 $
H1 2017 $
H2 2018 $
H2 2017 $
FY 2018 $
FY 2017 $ Growth
Sales 190,597 140,537 173,555 170,946 364,152 311,483
Less: 53rd week – – – (5,169) – (5,169)
Total 190,597 140,537 173,555 165,777 364,152 306,314 18.9%
COGS (68,349) (50,914) (62,518) (65,304) (130,867) (116,218)
Less: 53rd week – – – 2,434 – 2,434
Total (68,439) (50,914) (62,518) (62,870) (130,867) (113,784) 15.0%
Gross Margin 122,248 89,623 111,037 105,642 233,285 195,265
Less: 53rd week – – – (2,735) – (2,735)
Total 122,248 89,623 111,037 102,907 233,285 192,530 21.2%
Outlook
The Group has started the 2019 Financial Year with a major expansion through the acquisition of five women’s fashion brands from Speciality Fashion Group. This has transformed the Group into one of Australia’s pre-eminent women’s apparel retailers with over 1,400 stores, pro-forma revenue of approximately $1 billion and annual sales of more than 40 million garments.
The five new brands have recently traded at a loss, but we are confident we can address the business' underlying issues. Early indications following completion of the acquisition are encouraging. There are substantial costs, supply chain and other operational synergies, and we anticipate that the businesses will be restored to profitability in the 2020 financial year.
MEETINGS OF DIRECTORSThe number of meetings of the Company's Board of Directors (‘the Board’) held during the year ended 1 July 2018, and the number of meetings attended by each Director were:
Board meetingAudit and risk
management committeeRemuneration
committee
Held Attended Held Attended Held Attended
Richard Facioni 12 12 3 3 3 3
Scott Evans 12 12 – – – –
David Wilshire 12 12 3 3 3 3
Sue Morphet 12 11 3 3 3 3
1. EBITDA is a non-AAS financial measure, defined for the purposes of this document as earnings before interest, tax, depreciation, amortisation, non-recurring income/expenditure and certain non-cash items such as share based payments and unrealised foreign exchange gains/losses
20 We put the customer at the heart of everything we do.

Held: Represents the number of meetings held during the time the Directors held office.
INDEPENDENT DIRECTORSThe Director considered by the Board to be independent is Sue Morphet.
In determining whether a Non Executive Director is considered by the Board to be independent, the following relationships affecting independence will be taken into account:
(1) whether the Director is a substantial shareholder of the Group or an officer of, or otherwise associated directly with a substantial shareholder of the Group (as defined in section 9 of the Corporations Act);
(2) whether the Director is employed or has been employed in an Executive capacity by the Group or another group member and there has not been a period of at least three years between ceasing such employment and serving on the Board;
(3) whether the Director is or has been a principal of a material professional adviser or a material consultant to the Group or another group member, or an employee materially associated with the service provided;
(4) whether the Director is or has been employed by, or a partner in, any firm that has been the Group’s external auditors;
(5) whether the Director is a material supplier or customer of the Group or any other group member, or an officer of or otherwise associated, directly or indirectly, with a material supplier or customer;
(6) whether the Director has a material contractual relationship with the Group or another group member other than as a Director of the Group; and,
(7) whether the Director is free from any interest and any business or other relationship which could materially interfere with the Director’s ability to act in the best interests of the Group.
REMUNERATION REPORT [AUDITED] The remuneration report, which has been audited as required by section 308 (3C) of the Corporations Act 2001, outlines the key management personnel remuneration arrangements for the Group, in accordance with the requirements of the Corporations Act 2001 and its Regulations. The Directors (Executive and Non-Executive) and the Senior Executives received the amounts set out in the table of benefits and payments and explained in this section of the report as compensation for
their services as Directors and/or Executives of the Group during the financial year ended 1 July 2018.
Specific matters included in this Report are set out below under separate headings, as follows:
1. Details of remuneration
2. Remuneration policy
3. Service Agreements
4. Additional information
1. DETAILS OF REMUNERATIONKey Management PersonnelKey management personnel are those persons having authority and responsibility for planning, directing and controlling the activities of the Group, directly or indirectly, including all Directors.
The key management personnel of the Group consisted of the following directors of Noni B Limited for the full financial year:
Richard Facioni Chairman
Scott Evans Chief Executive Officer and Managing Director
David Wilshire Non-Executive Director
Sue Morphet Non-Executive Director
And the following Senior Executives:
Luke Softa Chief Financial Officer and Company Secretary
NONI B GROUP ANNUAL REPORT 2018 21

DIRECTORS' REPORT
Remuneration of Key Management PersonnelDetails of the nature and amount of each element of compensation for services for key management personnel of the Group paid in the financial year are as follows:
2018
Short term benefitsPost employment
benefitsLong term benefits
Share based
payments
Cash salary and
fees $
Cash bonuses
STI $
Cash bonuses
LTI $
Non-monetary benefits
$
Super-annuation
$
Termi-nation
benefits $
Long service leave
$
Equity settled
$Total
$
Directors
Executive directors
Scott Evans 784,262 – – 25,880 24,299 – 11,579 316,037 1,162,057
Non-executive directors
Richard Facioni 185,000 – – – – – – 153,586 338,586
David Wilshire 100,000 – – – – – – – 100,000
Sue Morphet 100,000 – – – – – – 66,465 166,465
Other key management personnel
Luke Softa 431,275 – – 46 24,299 – 6,164 45,439 507,223
Total 1,600,537 – – 25,926 48,598 – 17,743 581,527 2,274,331
2017
Short term benefitsPost employment
benefitsLong term benefits
Share based
payments
Cash salary and
fees $
Cash bonuses
STI $
Cash bonuses
LTI $
Non-monetary benefits
$
Super-annuation
$
Termi-nation
benefits $
Long service leave
$
Equity settled
$Total
$
Directors
Executive directors
Scott Evans 752,845 232,295 – 23,856 35,353 – 19,392 548,332 1,612,073
Non-executive directors
Richard Facioni 169,394 – – – – – – 140,787 310,181
David Wilshire 94,264 – – – – – – – 94,264
Sue Morphet 94,264 – – – – – – 66,464 160,728
Bradley Kady* 52,329 – – – – – – – 52,329
Other key management personnel
Luke Softa 414,397 105,096 – 1,050 33,164 – 10,536 143,045 707,288
Total 1,577,493 337,391 – 24,906 68,517 – 29,928 898,628 2,936,863
* Director fees for Bradley Kady (5 September 2016 – 14 March 2017) were paid to Consolidated Press Holdings Pty Limited.
22 We put the customer at the heart of everything we do.

2. REMUNERATION POLICYNon-Executive Directors Non-Executive Director remuneration is set by the Board’s Remuneration Committee and is subject to shareholder approval as detailed below based on independent external advice with regard to market practice, relativities, and Director duties and accountability. Company policy is designed to attract and retain competent and suitably qualified Non-Executive Directors, to motivate these Non-Executive Directors to achieve Noni B’s long term strategic objectives and to protect the long term interests of shareholders.
Fee Pool
Non-Executive Directors’ fees are set by resolution of shareholders at the annual general meeting. It is currently set at $200,000 per person per annum in aggregate. The remuneration does not include any participation by Independent Directors in Company Share schemes which is separately approved by the Board and ratified by shareholders at the annual general meeting.
Fees
The Non-Executive Directors’ base fee is set at $100,000 per annum and the Chairman’s fee is set at $185,000 per annum. During the financial year ended 1 July 2018 the Group held a total of 18 formal meetings, including committee, Board and shareholder meetings.
Equity participation
Non-Executive Directors may receive rights, options or shares as part of their remuneration, subject only to shareholder approval. As referenced below, no rights, options or shares have been issued to any of the Non-Executive Directors during the financial year.
Retiring Allowance
No retiring allowances are paid to Non-Executive Directors.
Superannuation
Noni B pays management fees to the related party of the Non-Executive Directors (note 26). Therefore no contribution is made to their respective superannuation fund.
Executive Directors and Senior ExecutivesNoni B’s overall Group remuneration policy is set by the Board’s Remuneration Committee. The policy is reviewed on a regular basis to ensure it remains contemporary and competitive.
For the specified Executives, the policy is intended to be consistent with the remuneration recommendations and guidelines set down in Principle 8 of the Australian
Security Exchange’s “best practice” corporate governance guidelines. Broadly, Noni B’s policy is intended to ensure:
● for each role, that the balance between fixed and variable (performance) components is appropriate having regard to both internal and external factors;
● that individual set objectives will result in sustainable beneficial outcomes;
● that all performance remuneration components are appropriately linked to measurable personal, business unit or Group performance; and
● that total remuneration (that is the sum of fixed plus variable components of the remuneration) for each Executive is fair, reasonable and market competitive.
Noni B’s achievement of these objectives is checked on a regular basis using independent external remuneration consultants.
Components of Executive remuneration
Generally, Noni B provides selected Senior Executives with three components of remuneration, as follows:
● fixed remuneration is made up of basic salary, benefits, superannuation and other salary sacrifices. This is reflective of their roles, experience and level of responsibility and is reviewed annually against market data for comparable positions. Benefits may include car allowances;
● short term incentives (STI) – paid in cash / options, directly earned upon the successful achievement of specific financial and operational targets. A portion of this STI may be provided in Noni B shares subject to service and/or performance conditions. All STI awards are based on performance measures which are set and reviewed by the Remuneration Committee annually;
● long term incentives (LTI) – provides selected and invited Senior Executives with the right to acquire shares, only where specific future service requirements and future financial and operational targets that improve shareholder returns have been exceeded. Performance measures are set and reviewed by the Remuneration Committee annually.
The objective of the reward schemes (STI and LTI) is to both reinforce the key financial goals of the Group and to provide a common interest between management and shareholders.
The fair value at grant date is independently determined using a Binomial Approximation Option Valuation Model and the Black Scholes Valuation Model that takes into account the exercise price, the term of the rights over shares, the share price at grant date and expected price volatility of the underlying share, the expected dividend yield and the risk free interest rate for the term of the rights over shares.
NONI B GROUP ANNUAL REPORT 2018 23

DIRECTORS' REPORT
Details of rights over ordinary shares in the Group provided as remuneration to each of the key management personnel of the Company and the Group are set out below.
Offer for investment shares, share plan rights, and performance rights Service conditions only apply to these offers as follows:
Investment Shares
Shares will be issued, upon completion of the application form and approval by shareholders at the Group’s annual general meeting.
Details of rights over ordinary shares in the Company provided as remuneration to each of the key management personnel of the Company and the Group are set out below:
Name
Held at the start of the
period
Granted as compen-
sation during the period
Excercised during the
period
Held at the end of the
period
Vested at the end of the
period*
Scott Evans 784,313 – – 784,313 784,313*
Sue Morphet 980,392 – – 980,392 980,392*
Total 1,764,705 – – 1,764,705 1,764,705
*these shares were expensed in FY2016
Grant date Expiry dateFair value at grant date
Share price at grant date
Exercise price Volatility
Risk free interest rate
Number of rights available
26/06/2015 31/10/2015 $ 0.20 $ 0.70 $ 0.51 47% 2.78% 1,764,705*
*these shares were expensed in FY2016
Share Plan RightsScott Evans
Grant date Expiry date
Fair value at grant
date
Share price at grant
dateExercise
price VolatilityRisk free
interest rate
Number of rights available
Number of rights vested
26/06/2015 31/10/2018 $ 0.20 $ 0.70 $ 0.51 47% 2.78% 1,568,627 1,568,627
Sue Morphet
Grant date Expiry date
Fair value at grant
date
Share price at grant
dateExercise
price VolatilityRisk free
interest rate
Number of rights available
Number of rights vested
26/06/2015 31/10/2018 $ 0.20 $ 0.70 $ 0.51 47% 2.78% 980,392 980,392
Performance Share RightsThese have a variety of market and non-market conditions based on the volume weighted average price (VWAP).
Richard Facioni
Grant date Expiry date
Fair value at grant
date
Share price at grant
dateExercise
price VolatilityRisk free
interest rate
Number of rights available
Number of rights vested
19/08/2016 18/08/2021 $ 0.47 $ 1.33 $ 1.25 35% 1.54% 1,200,000 460,000
19/08/2016 18/08/2021 $ 0.39 $ 1.33 $ 1.50 35% 1.54% 300,000 115,000
19/08/2016 18/08/2021 $ 0.32 $ 1.33 $ 1.75 35% 1.54% 300,000 115,000
24 We put the customer at the heart of everything we do.

Luke Softa
Grant date Expiry date
Fair value at grant
date
Share price at grant
dateExercise
price VolatilityRisk free
interest rate
Number of rights available
Number of rights vested
27/10/2015 27/10/2018 $ 0.10 $ 1.00 $ 0.90 – – 500,000 444,444
19/08/2016 18/08/2021 $ 0.47 $ 1.33 $ 1.25 35% 1.54% 250,000 95,833
Tranche 1 Performance Rights – these shares are issued to Scott Evans only
Grant date Expiry date
Fair value at grant
date
Share price at grant
dateExercise
price VolatilityRisk free
interest rate
Number of rights available
Number of rights vested
26/06/2015 01/07/2020 $ 0.36 $ 0.70 $ 0.51 43.8% 2.78% 882,479 882,479
Tranche 2 Performance Rights – these shares are issued to Scott Evans only
Grant date Expiry date
Fair value at grant
date
Share price at grant
dateExercise
price VolatilityRisk free
interest rate
Number of rights available
Number of rights vested
26/06/2015 01/07/2020 $ 0.37 $ 0.70 $ 0.51 43.8% 2.78% 882,479 882,479
The proportion of remuneration linked to performance and the fixed proportion are as follows:
Name
Fixed remuneration Short term incentive Long term incentive
2018 2017 2018 2017 2018 2017
Non-Executive Directors
Richard Facioni 55% 55% 45% 45%
David Wilshire 100% 100% – – – –
Sue Morphet 60% 59% – – 40% 41%
Bradley Kady* – 100% – – – –
Executive Directors
Scott Evans 73% 52% – 14% 27% 34%
Other key management personnel
Luke Softa 91% 65% – 15% 9% 20%
* Remuneration for Bradley Kady (5 September 2016 – 14 March 2017) were paid to Consolidated Press Holdings Pty Limited.
The portion of the cash bonus paid/payable is as follows:
Name 2018 2017
Executive Directors
Scott Evans – 100%
Other key management personnel
Luke Softa – 100%
NONI B GROUP ANNUAL REPORT 2018 25

DIRECTORS' REPORT
3. SERVICE AGREEMENTSRemuneration and other terms of employment for key management personnel are formalised in service agreements.
Details of these agreements are as follows:
Name: Scott Evans
Title: Chief Executive Officer
Duration of agreement: Employment agreement for Chief Executive Officer operative until terminated by either party.
Termination payment: Maximum payment to be made to Chief Executive Officer on termination is 3 months. Total Remuneration (being Total Fixed Remuneration plus Short Term Incentives, Long Term Incentives and benefits). To be paid in the following circumstances:
1) Redundancy; or
2) Fundamental Change.
Notice of termination: On termination by Noni B or the Executive – 3 months’ notice.
Payment in lieu of notice can be made by Noni B in all circumstances, if Noni B chooses
Restraint Conditions: Restraint period of 6 months
Name: Luke Softa
Title: Chief Financial Officer and Company Secretary
Duration of agreement: Employment agreement for Chief Financial Officer operative until terminated by either party.
Termination payment: Maximum payment to be made to the Chief Financial Officer on termination is 3 months. Total Remuneration (being Total Fixed Remuneration plus Short Term Incentives, Long Term Incentives and benefits). To be paid in the following circumstances:
1) Redundancy; or
2) Fundamental Change.
Notice of termination: On termination by Noni B or the Executive – 3 months’ notice.
Payment in lieu of notice can be made by Noni B in all circumstances, if Noni B chooses
Restraint Conditions: Restraint period of 6 months
4. ADDITIONAL INFORMATIONThe earnings of the Group for the five years to 1 July 2018 are summarised below:
2018
$'000
2017
$'000
2016
$'000
2015
$'000
2014
$'000
Revenue 372,426 316,756 110,478 110,412 115,078
Profit / (Loss) after income tax 17,293 3,253 2,210 (4,790) (7,843)
The factors that are considered to affect total shareholders return (‘TSR’) are summarised below:
2018 2017 2016 2015 2014
Share price at financial year end ($) $2.94 $1.75 $1.00 $0.66 $0.47
Basic earnings per share (cents per share) 21.3 4.6 6.1 (14.9) (24.4)
Total dividends (cents) 13 – – – 1.5
26 We put the customer at the heart of everything we do.

Options held by Directors and key management personnelThere are no options outstanding at end of the financial year ended 1 July 2018 and no options were granted during the year or prior year.
Relevant interest in shares by Directors and key management personnelThe number of shares in the parent entity held during the financial year by each director and other members of key management personnel of the consolidated entity, including their personally related parties, is set out below.
Directors and key management personnel
Shareholding at 2 July 2017
No.
Shares purchased or
(sold) ordinary No.
Shares acquired under performance rights plan ordinary
No.
Shareholding at 1 July 2018
No.
Richard Facioni 1,800,000 – – 1,800,000
Scott Evans 4,563,175 40,000 142,139 4,745,314
David Wilshire – – – –
Sue Morphet 2,360,784 100,000 – 2,460,784
Luke Softa 1,017,574 (88,230) 28,565 957,909
TOTAL 9,741,533 51,770 170,704 9,964,007
This concludes the remuneration report which has been audited.
INDEMNITY AND INSURANCE OF DIRECTORS AND OFFICERSThe Group has indemnified the Directors and Executives of the Group for costs incurred, in their capacity as a Director or Executive, for which they may be held personally liable, except where there is a lack of good faith.
During the financial year, the Group paid a premium in respect of a contract to insure the Directors and Executives of the Group against a liability to the extent permitted by the Corporations Act 2001. The contract of insurance prohibits disclosure of the nature of the liability and the amount of the premium.
INDEMNITY AND INSURANCE OF AUDITORThe Group has not, during or since the end of the financial year, indemnified or agreed to indemnify the auditor of the Group or any related entity against a liability incurred by the auditor.
During the financial year, the Group has not paid a premium in respect of a contract to insure the auditor of the Group or any related entity.
PROCEEDINGS ON BEHALF OF THE COMPANYNo person has applied to the Court under section 237 of the Corporations Act 2001 for leave to bring proceedings on behalf of the Group, or to intervene in any proceedings to which the Group is a party for the purpose of taking responsibility on behalf of the Group for all or part of those proceedings.
NONI B GROUP ANNUAL REPORT 2018 27

DIRECTORS' REPORT
NON-AUDIT SERVICESThe details of amounts paid or payable to the auditor for non-audit services provided during the financial year by the auditor are outlined in note 23 to the financial statements.
The Directors are satisfied that the provision of non-audit services during the financial year by the auditor is compatible with the general standard of independence for auditors imposed by the Corporations Act 2001.
The directors are of the opinion that the services as disclosed in note 23 to the financial statements do not compromise the external auditor’s independence requirements of the Corporations Act 2001 for the following reasons:
● all non-audit services have been reviewed and approved to ensure that they do not impact the integrity and objectivity of the auditor, and
● none of the services undermine the general principles relating to auditor independence as set out in APES 110 Code of Ethics for Professional Accountants issued by the Accounting Professional & Ethical Standards Board, including reviewing or auditing the auditors own work, acting in a management or decision-making capacity for the Group, acting as advocate for the Group or jointly sharing economic risks and rewards.
AUDITOR BDO continues in office in accordance with section 327 of the Corporations Act 2001.
AUDITOR’S INDEPENDENCE DECLARATIONA copy of the auditor’s independence declaration as required under section 307C of the Corporations Act 2001 is set out immediately after this director’s report.
ROUNDING OF AMOUNTS The Group is of a kind referred to in Corporations Instrument 2016/191, issued by the Australian Securities and Investments Commission, relating to ‘rounding’. Amounts in this report have been rounded off in accordance with that Corporations Instrument to the nearest thousand dollars, or in certain cases, the nearest dollar.
This report is made in accordance with a resolution of Directors, pursuant to section 298(2) (a) of the Corporations Act 2001.
On behalf of the Directors
Richard Facioni Chairman
Sydney 29 August 2018
Scott Evans Managing Director
Sydney 29 August 2018
28 We put the customer at the heart of everything we do.

AUDITOR'S INDEPENDENCE DECLARATION
Level 11, 1 Margaret St Sydney NSW 2000 Australia
Tel: +61 2 9251 4100 Fax: +61 2 9240 9821 www.bdo.com.au
BDO East Coast Partnership ABN 83 236 985 726 is a member of a national association of independent entities which are all members of BDO Australia Ltd ABN 77 050 110 275, an Australian company limited by guarantee. BDO East Coast Partnership and BDO Australia Ltd are members of BDO International Ltd, a UK company limited by guarantee, and form part of the international BDO network of independent member firms. Liability limited by a scheme approved under Professional Standards Legislation, other than for the acts or omissions of financial services licensees.
DECLARATION OF INDEPENDENCE BY GILLIAN SHEA TO THE DIRECTORS OF NONI B LIMITED
As lead auditor of Noni B Limited for the year ended 1 July 2018, I declare that, to the best of my knowledge and belief, there have been:
1. No contraventions of the auditor independence requirements of the Corporations Act 2001 in relation to the audit; and
2. No contraventions of any applicable code of professional conduct in relation to the audit.
This declaration is in respect of Noni B Limited and the entities it controlled during the period.
Gillian Shea Partner
BDO East Coast Partnership
Sydney, 29 August 2018
NONI B GROUP ANNUAL REPORT 2018 29

CONSOLIDATED STATEMENT OF PROFIT OR LOSSAND OTHER COMPREHENSIVE INCOME FOR THE YEAR ENDED 1 JULY 2018
Note
Consolidated Group
2018
$’000
2017
$’000
Continuing Operations
Revenue 3 364,152 311,483
Other income 3 8,274 5,273
Cost of goods sold (130,867) (116,218)
Expenses (excluding finance costs) 4 (215,024) (193,285)
Finance costs 4 (1,424) (1,343)
Profit before income tax from continuing operations 25,111 5,910
Income tax expense 5 (7,818) (2,657)
Net profit after income tax from continuing operations 17,293 3,253
Other comprehensive income, net of tax – –
Total comprehensive income for the year attributable to the owners of Noni B Limited 17,293 3,253
Earnings per share
From continuining operations:
Basic earnings per share (cents) 31 21.3 4.6
Diluted earnings per share (cents) 31 21.3 4.6
The accompanying notes form part of these financial statements.
30 We put the customer at the heart of everything we do.

CONSOLIDATED STATEMENT OF FINANCIAL POSITIONAS AT 1 JULY 2018
Note
Consolidated Group
2018
$’000
2017
$’000
ASSETS
CURRENT ASSETS
Cash and cash equivalents 6 58,697 28,167
Trade and other receivables 7 5,213 3,749
Inventories 8 45,482 29,243
Derivative financial instruments 9 653 –
Other current assets 766 563
TOTAL CURRENT ASSETS 110,811 61,722
NON-CURRENT ASSETS
Trade and other receivables 7 1,210 –
Property, plant and equipment 10 32,234 28,266
Intangible assets 11 75,979 75,547
Deferred tax assets 5 16,622 15,026
Other non-current assets 119 120
TOTAL NON-CURRENT ASSETS 126,164 118,959
TOTAL ASSETS 236,975 180,681
LIABILITIES
CURRENT LIABILITIES
Trade and other payables 12 59,701 46,428
Loans and borrowings 13 3,479 2,729
Provisions 14 9,570 11,120
Derivative financial instruments 15 8 1,774
Tax liabilities 5 4,467 3,842
Other current liabilities 16 6,179 4,794
TOTAL CURRENT LIABILITIES 83,404 70,687
NON-CURRENT LIABILITIES
Loans and borrowings 13 16,955 19,683
Provisions 14 1,126 1,272
Deferred tax liabilities 5 11,463 11,206
Contingent consideration 24 – 3,173
Other non-current liabilities 16 14,009 12,232
TOTAL NON-CURRENT LIABILITIES 43,553 47,566
TOTAL LIABILITIES 126,957 118,253
NET ASSETS 110,018 62,428
EQUITY
Issued capital 17 107,651 68,340
Reserves 13,271 4,992
Accumulated losses (10,904) (10,904)
TOTAL EQUITY 110,018 62,428
The accompanying notes form part of these financial statements.
NONI B GROUP ANNUAL REPORT 2018 31

CONSOLIDATED STATEMENT OF CHANGES IN EQUITYFOR THE YEAR ENDED 1 JULY 2018
Note
Consolidated Group
Issued capital
$’000
(Accum-ulated losses)
$’000
Equity reserve
$'000
Dividend profit reserve
$'000
Total
$'000
Balance at 26 June 2016 21,710 (10,904) 1,144 – 11,950
Net profit after income tax expense for the year – 3,253 – – 3,253
Transfer to dividend profit reserve 20 – (3,253) – 3,253 –
Other comprehensive income for the year, net of tax – – – – –
Total comprehensive income for the year – – – 3,253 3,253
Transactions with owners in their capacity as owners:
Shares issued during the year 46,630 – – – 46,630
Share based payment expense 32 – – 595 – 595
Balance at 2 July 2017 17 68,340 (10,904) 1,739 3,253 62,428
Net profit after income tax expense for the year – 17,293 – – 17,293
Transfer to dividend profit reserve 20 – (17,293) – 17,293 –
Other comprehensive income for the year – – – – –
Total comprehensive income for the year – – – 17,293 17,293
Transactions with owners in their capacity as owners:
Shares issued during the year 39,311 – – – 39,311
Share based payment expense 32 – – 649 – 649
Dividends paid or provided for 18, 19 – – 771 (10,434) (9,663)
Balance at 1 July 2018 17 107,651 (10,904) 3,159 10,112 110,018
The accompanying notes form part of these financial statements.
32 We put the customer at the heart of everything we do.

CONSOLIDATED STATEMENT OF CASH FLOWSFOR THE YEAR ENDED 1 JULY 2018
Note
Consolidated Group
2018
$’000
2017
$’000
CASH FLOWS FROM OPERATING ACTIVITIES
Receipts from customers (inclusive of GST) 406,404 346,258
Payments to suppliers and employees (inclusive of GST) (375,208) (305,500)
Transaction and restructuring costs paid (496) (5,482)
Interest received 198 144
Interest and other finance costs paid (1,091) (1,115)
Income taxes paid (8,079) (900)
Net cash from operating activities 30 21,728 33,405
CASH FLOWS FROM INVESTING ACTIVITIES
Payments for purchase of business, net of cash acquired – (65,529)
Payment of contingent consideration on prior year acquisition 24 (3,000) –
Payments for property, plant and equipment (14,214) (11,096)
Payments for software assets (703) (223)
Proceeds from sale of property, plant and equipment 38 71
Net cash used in investing activities (17,879) (76,777)
CASH FLOWS FROM FINANCING ACTIVITIES
Proceeds from the issue of share capital, net of transaction costs 38,596 36,467
Payment for buy-back of shares (2) –
Proceeds from borrowings – 30,000
Repayment of borrowings (2,250) (7,000)
Payment for borrowing costs – (814)
Dividends paid (9,663) –
Payments for finance lease and other liabilities – (33)
Net cash from financing activities 26,681 58,620
Net increase in cash and cash equivalents 30,530 15,248
Cash and cash equivalents at the beginning of the financial year 28,167 12,919
Cash and cash equivalents at the end of the financial year 6 58,697 28,167
The accompanying notes form part of these financial statements.
NONI B GROUP ANNUAL REPORT 2018 33
NOTES TO THE FINANCIAL STATEMENTS
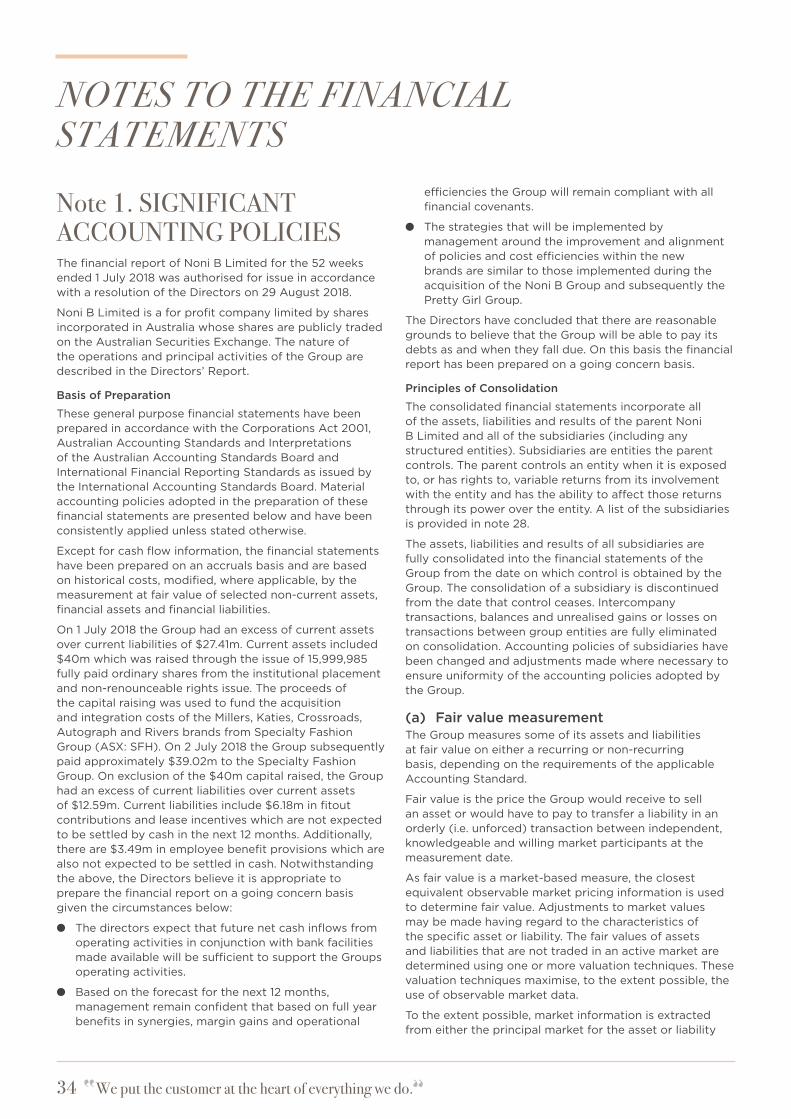
Note 1. SIGNIFICANT ACCOUNTING POLICIES The financial report of Noni B Limited for the 52 weeks ended 1 July 2018 was authorised for issue in accordance with a resolution of the Directors on 29 August 2018.
Noni B Limited is a for profit company limited by shares incorporated in Australia whose shares are publicly traded on the Australian Securities Exchange. The nature of the operations and principal activities of the Group are described in the Directors’ Report.
Basis of Preparation
These general purpose financial statements have been prepared in accordance with the Corporations Act 2001, Australian Accounting Standards and Interpretations of the Australian Accounting Standards Board and International Financial Reporting Standards as issued by the International Accounting Standards Board. Material accounting policies adopted in the preparation of these financial statements are presented below and have been consistently applied unless stated otherwise.
Except for cash flow information, the financial statements have been prepared on an accruals basis and are based on historical costs, modified, where applicable, by the measurement at fair value of selected non-current assets, financial assets and financial liabilities.
On 1 July 2018 the Group had an excess of current assets over current liabilities of $27.41m. Current assets included $40m which was raised through the issue of 15,999,985 fully paid ordinary shares from the institutional placement and non-renounceable rights issue. The proceeds of the capital raising was used to fund the acquisition and integration costs of the Millers, Katies, Crossroads, Autograph and Rivers brands from Specialty Fashion Group (ASX: SFH). On 2 July 2018 the Group subsequently paid approximately $39.02m to the Specialty Fashion Group. On exclusion of the $40m capital raised, the Group had an excess of current liabilities over current assets of $12.59m. Current liabilities include $6.18m in fitout contributions and lease incentives which are not expected to be settled by cash in the next 12 months. Additionally, there are $3.49m in employee benefit provisions which are also not expected to be settled in cash. Notwithstanding the above, the Directors believe it is appropriate to prepare the financial report on a going concern basis given the circumstances below:
● The directors expect that future net cash inflows from operating activities in conjunction with bank facilities made available will be sufficient to support the Groups operating activities.
● Based on the forecast for the next 12 months, management remain confident that based on full year benefits in synergies, margin gains and operational
efficiencies the Group will remain compliant with all financial covenants.
● The strategies that will be implemented by management around the improvement and alignment of policies and cost efficiencies within the new brands are similar to those implemented during the acquisition of the Noni B Group and subsequently the Pretty Girl Group.
The Directors have concluded that there are reasonable grounds to believe that the Group will be able to pay its debts as and when they fall due. On this basis the financial report has been prepared on a going concern basis.
Principles of Consolidation
The consolidated financial statements incorporate all of the assets, liabilities and results of the parent Noni B Limited and all of the subsidiaries (including any structured entities). Subsidiaries are entities the parent controls. The parent controls an entity when it is exposed to, or has rights to, variable returns from its involvement with the entity and has the ability to affect those returns through its power over the entity. A list of the subsidiaries is provided in note 28.
The assets, liabilities and results of all subsidiaries are fully consolidated into the financial statements of the Group from the date on which control is obtained by the Group. The consolidation of a subsidiary is discontinued from the date that control ceases. Intercompany transactions, balances and unrealised gains or losses on transactions between group entities are fully eliminated on consolidation. Accounting policies of subsidiaries have been changed and adjustments made where necessary to ensure uniformity of the accounting policies adopted by the Group.
(a) Fair value measurementThe Group measures some of its assets and liabilities at fair value on either a recurring or non-recurring basis, depending on the requirements of the applicable Accounting Standard.
Fair value is the price the Group would receive to sell an asset or would have to pay to transfer a liability in an orderly (i.e. unforced) transaction between independent, knowledgeable and willing market participants at the measurement date.
As fair value is a market-based measure, the closest equivalent observable market pricing information is used to determine fair value. Adjustments to market values may be made having regard to the characteristics of the specific asset or liability. The fair values of assets and liabilities that are not traded in an active market are determined using one or more valuation techniques. These valuation techniques maximise, to the extent possible, the use of observable market data.
To the extent possible, market information is extracted from either the principal market for the asset or liability
34 We put the customer at the heart of everything we do.

(i.e. the market with the greatest volume and level of activity for the asset or liability) or, in the absence of such a market, the most advantageous market available to the entity at the end of the reporting period (i.e. the market that maximises the receipts from the sale of the asset or minimises the payments made to transfer the liability, after taking into account transaction costs and transport costs).
For non-financial assets, the fair value measurement also takes into account a market participant’s ability to use the asset in its highest and best use or to sell it to another market participant that would use the asset in its highest and best use.
The fair value of liabilities and the entity’s own equity instruments (excluding those related to share-based payment arrangements) may be valued, where there is no observable market price in relation to the transfer of such financial instruments, by reference to observable market information where such instruments are held as assets. Where this information is not available, other valuation techniques are adopted and, where significant, are detailed in the respective note to the financial statements.
(b) Financial InstrumentsFinancial assets and financial liabilities are recognised when the entity becomes a party to the contractual provisions to the instrument. For financial assets, this is equivalent to the date that the entity commits itself to either the purchase or sale of the asset (i.e. trade date accounting is adopted).
Financial instruments are initially measured at fair value plus transaction costs, except where the instrument is classified “at fair value through profit or loss”, in which case transaction costs are expensed to profit or loss immediately.
Classification and subsequent measurement
Financial instruments are subsequently measured at fair value, amortised cost using the effective interest method, or cost.
Amortised cost is calculated as the amount at which the financial asset or financial liability is measured at initial recognition less principal repayments and any reduction for impairment, and adjusted for any cumulative amortisation of the difference between that initial amount and the maturity amount calculated using the effective interest method.
The effective interest method is used to allocate interest income or interest expense over the relevant period and is equivalent to the rate that discounts estimated future cash payments or receipts (including fees, transaction costs and other premiums or discounts) over the expected life (or when this cannot be reliably predicted, the contractual term) of the financial instrument to the net carrying amount of the financial asset or financial liability. Revisions to expected future net cash flows will necessitate an adjustment to the carrying amount with a consequential recognition of an income or expense item in profit or loss.
The Group does not designate any interests in subsidiaries, associates or joint ventures as being subject to the requirements of Accounting Standards specifically applicable to financial instruments
i. Financial assets at fair value through profit or loss
Financial assets are classified at “fair value through profit or loss” when they are held for trading for the purpose of short-term profit taking, derivatives not held for hedging purposes, or when they are designated as such to avoid an accounting mismatch or to enable performance evaluation where a group of financial assets is managed by key management personnel on a fair value basis in accordance with a documented risk management or investment strategy. Such assets are subsequently measured at fair value with changes in carrying amount being included in profit or loss.
ii. Loans and receivables
Loans and receivables are non-derivative financial assets with fixed or determinable payments that are not quoted in an active market and are subsequently measured at amortised cost. Gains or losses are recognised in profit or loss through the amortisation process and when the financial asset is derecognised.
iii. Financial liabilities
Non-derivative financial liabilities other than financial guarantees are subsequently measured at amortised cost. Gains or losses are recognised in profit or loss through the amortisation process and when the financial liability is derecognised.
(c) Foreign currency transactions and balancesFunctional and presentation currency
The functional currency of each of the Group’s entities is measured using the currency of the primary economic environment in which that entity operates. The consolidated financial statements are presented in Australian dollars, which is the parent entity’s functional currency.
Transactions and balances
Foreign currency transactions are translated into functional currency using the exchange rates prevailing at the date of the transaction. Foreign currency monetary items are translated at either the year-end or hedged exchange rate. Non-monetary items measured at historical cost continue to be carried at the exchange rate at the date of the transaction. Non-monetary items measured at fair value are reported at the exchange rate at the date when fair values were determined.
Exchange differences arising on the translation of monetary items are recognised in profit or loss, except where deferred in equity as a qualifying cash flow or net investment hedge.
NONI B GROUP ANNUAL REPORT 2018 35

NOTES TO THE FINANCIAL STATEMENTS
Exchange differences arising on the translation of non-monetary items are recognised directly in other comprehensive income to the extent that the underlying gain or loss is recognised in other comprehensive income; otherwise the exchange difference is recognised in profit or loss.
(d) Employee benefitsRetirement benefit obligations
Defined contribution superannuation benefits
Employees of the Group receive defined contribution superannuation entitlements for which the Group pays the fixed superannuation guarantee contribution (currently 9.5% of the employee’s average ordinary salary) to the employee’s superannuation fund of choice. All contributions in respect of employees’ defined contribution entitlements are recognised as an expense when they become payable. The Group’s obligation with respect to employees’ defined contribution entitlements is limited to its obligation for any unpaid superannuation guarantee contributions at the end of the reporting period. All obligations for unpaid superannuation guarantee contributions are measured at the (undiscounted) amounts expected to be paid when the obligation is settled and are presented as current liabilities in the Group’s statement of financial position.
Termination benefits
When applicable, the Group recognises a liability and expense for termination benefits at the earlier of: (i) the date when the Group can no longer withdraw the offer for termination benefits; and (ii) when the Group recognises costs for restructuring pursuant to AASB 137: Provisions, Contingent Liabilities and Contingent Assets and the costs include termination benefits. In either case, unless the number of employees affected is known, the obligation for termination benefits is measured on the basis of the number of employees expected to be affected. Termination benefits that are expected to be settled wholly before 12 months after the annual reporting period in which the benefits are recognised are measured at the (undiscounted) amounts expected to be paid. All other termination benefits are accounted for on the same basis as other long-term employee benefits.
(e) Goods and Services Tax (GST)Revenues, expenses and assets are recognised net of the amount of goods and services tax (GST) except where the amount of GST incurred is not recoverable from the Australian Taxation Office (ATO).
Receivables and payables are stated inclusive of the amount of GST receivable or payable. The net amount of GST recoverable from, or payable to, the tax authority is included in Trade and other receivables or payables in the statement of financial position.
Cash flows are presented on a gross basis. The GST components of cash flows arising from investing or financing activities which are recoverable from, or payable to, the tax authority are presented as operating cash flows included in receipts from customers or payments to suppliers.
Commitments and contingencies are disclosed net of the amount of GST recoverable from, or payable to, the taxation authority.
(f) Comparative figuresWhen required by Accounting Standards, comparative figures have been adjusted to conform to changes in presentation for the current financial year.
The current reporting period, 3 July 2017 to 1 July 2018, represents 52 weeks and the comparative reporting period is from 27 June 2016 to 2 July 2017 which represents 53 weeks.
(g) Rounding of amountsThe Company is a company of the kind specified in ASIC Corporations (Rounding in Financial/Directors’ Reports) Instrument 2016/191, dated 24 March 2016. In accordance with that ASIC instrument amounts in the financial statements and the Director’s Report have been rounded to the nearest thousand dollars, unless specifically stated to be otherwise.
(h) Critical accounting estimates and judgmentsThe Directors evaluate estimates and judgements incorporated into the financial statements based on historical knowledge and best available current information. Estimates assume a reasonable expectation of future events and are based on current trends and economic data, obtained both externally and within the Group. The key estimates and judgments have been included within the notes to the financial report.
(i) New Accounting Standards for Application in Future PeriodsAccounting Standards issued by the AASB that are not yet mandatorily applicable to the Group, together with an assessment of the potential impact of such pronouncements on the Group when adopted in future periods, are discussed below:
– AASB 9: Financial Instruments and associated Amending Standards (applicable to annual reporting periods beginning on or after 1 July 2018).
The Standard will be applicable retrospectively (subject to the provisions on hedge accounting outlined below) and includes revised requirements for the classification and measurement of financial instruments, revised recognition and derecognition
Note 1. SIGNIFICANT ACCOUNTING POLICIES (continued)
36 We put the customer at the heart of everything we do.

requirements for financial instruments and simplified requirements for hedge accounting.
The key changes that may affect the Group on initial application include certain simplifications to the classification of financial assets, simplifications to the accounting of embedded derivatives, upfront accounting for expected credit loss, and the irrevocable election to recognise gains and losses on investments in equity instruments that are not held for trading in other comprehensive income. AASB 9 also introduces a new model for hedge accounting that will allow greater flexibility in the ability to hedge risk, particularly with respect to hedges of non-financial items. Should the entity elect to change its hedge policies in line with the new hedge accounting requirements of the Standard, the application of such accounting would be largely prospective.
As retail sales revenue is recognised at the point of sale, the Group is not materially exposed to credit loss. Trade and other receivables included in the accounts are amounts due from repeat customers, suppliers and landlords at the end of the period and as a result collection is highly probable. As such the Group does not expect to be impacted by the new expected credit loss model introduced in the standard.
– AASB 15: Revenue from Contracts with Customers (applicable to annual reporting periods beginning on or after 1 July 2018, as deferred by AASB 2015-8: Amendments to Australian Accounting Standards – Effective Date of AASB 15).
When effective, this Standard will replace the current accounting requirements applicable to revenue with a single, principles-based model. Apart from a limited number of exceptions, including leases, the new revenue model in AASB 15 will apply to all contracts with customers as well as non-monetary exchanges between entities in the same line of business to facilitate sales to customers and potential customers.
The core principle of the Standard is that an entity will recognise revenue to depict the transfer of promised goods or services to customers in an amount that reflects the consideration to which the entity expects to be entitled in exchange for the goods or services. To achieve this objective, AASB 15 provides the following five-step process:
● identify the contract(s) with a customer;
● identify the performance obligations in the contract(s);
● determine the transaction price;
● allocate the transaction price to the performance obligations in the contract(s); and
● recognise revenue when (or as) the performance obligations are satisfied.
The transitional provisions of this Standard permit an entity to either: restate the contracts that existed in each prior period presented per AASB 108: Accounting Policies, Changes in Accounting Estimates and Errors (subject to certain practical expedients in AASB 15); or recognise the cumulative effect of retrospective application to incomplete contracts on the date of initial application. There are also enhanced disclosure requirements regarding revenue.
At 1 July 2018, the Group had $1.63m in gift cards. As revenue from the sale of gift cards is recognised on redemption of the gift card and the Group does not run loyalty promotions and gift with purchase offers over the half-year and year-end periods, the Group does not expect to be impacted by the adoption of AASB 15.
– AASB 16: Leases (applicable to annual reporting periods beginning on or after 1 July 2019).
When effective, this Standard will replace the current accounting requirements applicable to leases in AASB 117: Leases and related Interpretations. AASB 16 introduces a single lessee accounting model that eliminates the requirement for leases to be classified as operating or finance leases.
The main changes introduced by the new Standard are as follows:
● recognition of a right-of-use asset and liability for all leases (excluding short-term leases with less than 12 months of tenure and leases relating to low-value assets);
● depreciation of right-of-use assets in line with AASB 116: Property, Plant and Equipment in profit or loss and unwinding of the liability in principal and interest components;
● inclusion of variable lease payments that depend on an index or a rate in the initial measurement of the lease liability using the index or rate at the commencement date;
● application of a practical expedient to permit a lessee to elect not to separate non-lease components and instead account for all components as a lease; and
● inclusion of additional disclosure requirements.
The transitional provisions of AASB 16 allow a lessee to either retrospectively apply the Standard to comparatives in line with AASB 108 or recognise the cumulative effect of retrospective application as an adjustment to opening equity on the date of initial application.
As the Group operates all its retail stores through operating property leases, the Directors anticipate that the adoption of AASB 16 will have a material effect due to the significant amount of property leases which will be brought onto the financial statements.
NONI B GROUP ANNUAL REPORT 2018 37

NOTES TO THE FINANCIAL STATEMENTS
Note 2. OPERATING SEGMENTS Management has determined the operating segments based on internal reports reviewed and used by the Chief Executive Officer (“CEO”) in assessing performance and in determining the allocation of resources. The Group operates wholly within one geographic region – Australia and is organised into one operating segment (fashion retail). Whilst the Group sells across different brands it was determined, based on similarities, to aggregate into one segment. The similarities include marketing (both in the processes and the target customer) as well as the production and distribution processes (standardised across the Group).
The CEO assesses the performance of the operations based on a measure of underlying EBITDA (earnings before interest, tax, depreciation and amortisation adjusted for fair value revaluation of derivative financial instruments through profit or loss and restructuring costs). The accounting policies adopted for internal reporting to the CEO are consistent with those adopted in the financial statements. The information reported to the CEO is on at least a monthly basis, including weekly reporting on key revenue metrics.
A reconciliation of operating profit before income tax to underlying EBITDA is provided as follows:
Consolidated Group
2018
$’000
2017
$’000
Underlying EBITDA 37,245 22,896
Transaction and restructuring costs1 (496) (5,482)
Net interest (1,303) (1,199)
Other finance income / (expenses)2 183 (1,136)
Depreciation, amortisation and impairment expenses (10,518) (9,169)
Profit before income tax 25,111 5,910
1 Breakdown of the transaction and restructuring costs consisted of $283k in respect to the acquisition of the Millers, Katies, Crossroads, Autograph and Rivers brands (transaction related) and $213k in respect to internal cost (restructure related)
2 Other finance income / expenses includes both the share based payment expense and unrealised foreign exchange (gain) / loss
Note 3. REVENUE AND OTHER INCOMEConsolidated Group
2018
$’000
2017
$’000
Revenue:
Sale of goods 364,152 311,483
Other income:
Interest 121 144
Jewellery commission 4,848 4,063
Other 3,305 1,066
Total other income 8,274 5,273
Recognition and measurement
Revenue is measured at the fair value of the consideration received or receivable after taking into account any trade discounts and volume rebates allowed. When the inflow of consideration is deferred, it is treated as the provision of financing and is discounted at a rate of interest that is generally accepted in the market for similar arrangements. The difference between the amount initially recognised and the amount ultimately received is interest revenue.
i. Retail sales revenue is recognised at the point of sale, which is where the customer has taken delivery of the goods, the risks and rewards are transferred to the customer and there is a valid sales contract. Amounts disclosed as revenue are net of sales returns, trade discounts and commission paid.
38 We put the customer at the heart of everything we do.

ii. Jewellery commission is recognised at the point of sale, which is where the customer has taken delivery of the goods, the risks and rewards.
iii. Lay-by revenue is recognised upon receiving final payment from the customer.
iv. Revenue from the sale of gift cards is recognised upon redemption of the gift card, or when the card is no longer expected to be redeemed, based on analysis of historical non-redemption rates.
v. The Group operates a customer loyalty scheme which provides rebate vouchers to be issued to customers twice yearly, based on customer’s purchases during the loyalty period. The vouchers have expiry dates six weeks after issue. The Group allocates a portion of sales revenue to the liability for customer loyalty based on the historical redemption rate. The deferred portion is recognised as revenue only after all the rebate obligations have been fulfilled.
vi. Interest revenue is recognised when it is earned.
All revenue is stated net of the amount of goods and services tax.
Note 4. PROFIT FOR THE YEARConsolidated Group
2018
$’000
2017
$’000
a) Expenses (excluding finance costs)
Marketing and selling expenses 104,989 89,752
Occupancy expenses 84,326 72,282
Administrative expenses 25,299 30,855
Other expenses 410 396
Total expenses (excluding finance costs) 215,024 193,285
b) Profit before income tax from continuing operations includes the following specific expenses:
Expenses
Finance costs comprising interest attributed to:
– interest and borrowing expenses 1,424 1,343
Total finance costs 1,424 1,343
Depreciation 10,156 7,849
Amortisation 271 178
Impairment and write-off of non-current assets 91 1,142
Write-off of obsolete stock 525 228
Write-down of inventories to net realisable value 1,213 1,791
Operating lease rental expenses 68,394 59,055
Employee benefits expense 89,877 82,985
Superannuation expense 8,031 7,276
Share based payment expense 649 595
Unrealised foreign exchange (gain) / loss (832) 541
NONI B GROUP ANNUAL REPORT 2018 39

NOTES TO THE FINANCIAL STATEMENTS
Note 5. INCOME TAXConsolidated Group
2018
$’000
2017
$’000
Major components of income tax expense
Deferred tax (1,413) (2,323)
Current tax 9,231 4,980
Income tax expense 7,818 2,657
Reconciliation between income tax expense and prima facie tax on accounting profit
Accounting profit 25,111 5,910
Tax at 30% (2017-30%) 7,533 1,773
Tax effect on non-deductible expenses / (non-assessable items):
Share based payment expense 195 179
Acquisition costs – 536
Non-deductible items 43 296
Over provision from prior year – (181)
Recoupment of tax losses not recognised in prior years – (13)
Deferred tax asset not recognised on tax losses 1 217
Adjustment to goodwill balance – (150)
Other 46 –
Income tax expense 7,818 2,657
Tax Liabilities
Current tax liabilities 4,467 3,842
Applicable tax rate
The applicable tax rate is the national corporate tax rate in Australia of 30%
Analysis of deferred tax assets:
Employee entitlements 3,089 3,198
Lessors fit out contribution 6,056 5,108
Accruals 1,637 754
Provision for shrinkage / obsolescence / absorption costs 1,197 681
Depreciation temporary differences 1,787 1,172
Foreign currency balances – 532
Provision for customer loyalty 268 267
Future tax benefit of tax losses 1,551 2,079
Business capital expenditure 725 506
Other 312 729
Total deferred tax assets 16,622 15,026
Analysis of deferred tax liabilities:
Depreciation and temporary differences 23 4
Brand names 10,890 10,890
Foreign currency balances 509 288
Other 41 24
Total deferred tax liabilities 11,463 11,206
40 We put the customer at the heart of everything we do.

Recognition and measurement
The income tax expense or benefit for the period is the tax payable on that period’s taxable income based on the income tax rate, adjusted by changes in deferred tax assets and liabilities attributable to temporary differences, unused tax losses and the adjustment recognised for prior periods, where applicable.
Deferred tax assets and liabilities are recognised for temporary differences at the tax rate expected to be applied when the assets are recovered or liabilities are settled, based on those tax rates that are enacted or substantively enacted, except for:
● When the deferred income tax asset or liability arises from the initial recognition of goodwill or an asset or liability in a transaction that is not a business combination and that, at the time of the transaction, affects neither the accounting profit nor taxable profit or loss; and
● When the taxable temporary difference is associated with interests in subsidiaries, associates or joint ventures, and the timing of the reversal of the temporary differences can be controlled and it is probable that the temporary differences will not reverse in the foreseeable future.
The carrying amount of recognised deferred tax assets are reviewed at each reporting date. Deferred tax assets recognised are reduced to the extent that it is no longer probable that future taxable profits will be available for the carrying amount to be recovered. Previously unrecognised deferred tax assets are recognised to the extent that it is probable that there are future taxable profits available to recover the asset.
Key estimate and judgment
Deferred tax assets are recognised for deductible temporary differences only if the Group considers it is probable that future taxable amounts will be available to utilise those temporary differences and losses.
Tax consolidation
Noni B Limited (the ‘head entity’) and its wholly-owned Australian controlled entities formed an income tax consolidated group under the tax consolidation regime as of 1 July 2005. The head entity and the controlled entities in the tax consolidated group continue to account for their own current and deferred tax amounts. In addition to its own current and deferred amount, the head entity also recognises the current tax assets / liabilities of each subsidiary in the tax consolidated group.
The entities have also entered into a tax funding agreement under which the wholly-owned entities fully compensate Noni B Limited for any current tax payable and are compensated by Noni B Limited for any current tax receivable and deferred tax assets relating to unused tax losses or unused tax credits that are determined by reference to the amounts recognised in the wholly-owned entities’ financial statements.
Note 6. CASH AND CASH EQUIVALENTSConsolidated Group
2018
$’000
2017
$’000
Cash at bank and on hand 58,697 28,167
Recognition and measurement
Cash and cash equivalents include cash on hand, deposits held at call with financial institutions, other short-term highly liquid investments with original maturities and bank overdrafts. Bank overdrafts are reported within borrowings in current liabilities on the statement of financial position.
NONI B GROUP ANNUAL REPORT 2018 41

NOTES TO THE FINANCIAL STATEMENTS
Note 7. TRADE AND OTHER RECEIVABLESConsolidated Group
2018
$’000
2017
$’000
CURRENT
Sundry debtors 5,213 3,749
NON-CURRENT
Sundry debtors 1,210 –
Recognition and measurement
Sundry debtors include amounts due from repeat customers, suppliers and landlord contributions. Receivables expected to be collected within 12 months of the end of the reporting period are classified as current assets. All other receivables are classified as non-current assets and are subsequently measured at amortised cost which have not been discounted.
The Group assesses at the end of each reporting period whether there is objective evidence that the Group’s receivables are impaired. A provision for impairment is not recognised until objective evidence is available that a loss event has occurred. At reporting date trade and other receivables are not past due and not impaired.
Note 8. INVENTORIESConsolidated Group
2018
$’000
2017
$’000
CURRENT
Finished goods at cost 47,505 30,532
Provision for obsolescence and shrinkage (2,023) (1,289)
45,482 29,243
Recognition and measurement
Inventories are measured at the lower of cost and net realisable value. Costs are assigned on a first-in first-out basis. Cost comprises all costs of purchase and conversion and an appropriate proportion of fixed and variable overheads, net of settlement discounts. Net realisable value is the estimated selling price in the ordinary course of business less the estimated costs of completion and the estimated costs necessary to make the sale.
Stock in transit is stated at the lower of cost and net realisable value. Costs comprise of purchase and delivery costs, net of rebates and discounts received or receivable.
Key estimate and judgment
The provision for impairment of inventories assessment requires a degree of estimation and judgement. The level of the provision is assessed by taking into account the recent sales experience, the ageing of inventories and other factors that affect inventory obsolescence.
Note 9. DERIVATIVE FINANCIAL INSTRUMENTSConsolidated Group
2018
$’000
2017
$’000
Forward exchange forward contracts 653 –
653 –
Refer to note 21 for further information on financial instruments
42 We put the customer at the heart of everything we do.

Note 10. PROPERTY, PLANT AND EQUIPMENTConsolidated Group
2018
$’000
2017
$’000
a) Plant and Equipment
Plant and equipment:
At cost 74,127 62,045
Accumulated depreciation (41,893) (33,779)
32,234 28,266
b) Movements in carrying amounts
Plant and equipment
$’000
Leased plant and
equipment
$'000
Total
$’000
Consolidated Group:
Balance at 26 June 2016 6,405 11 6,416
Additions 11,165 – 11,165
Additions from prior year business combination 19,756 – 19,756
Disposals (999) – (999)
Depreciation expense (8,061) (11) (8,072)
Balance at 2 July 2017 28,266 – 28,266
Additions 14,191 – 14,191
Disposals (154) – (154)
Depreciation expense (10,069) – (10,069)
Balance at 1 July 2018 32,234 – 32,234
Recognition and measurement
Property, Plant and equipment is stated at historical cost less accumulated depreciation and any accumulated impairment losses. Depreciation is calculated on a straight-line basis over the estimated useful lives covering a period of three to six years. Assets which have been allocated to the low value pool are depreciated at the rates between 18.75% – 37.5%.
The carrying values of property, plant and equipment are reviewed for impairment annually for events or changes in circumstances that may indicate the carrying value may not be recoverable. If an indication of impairment exists, and where the carrying values exceeds the estimated recoverable amount, the assets are written down to their recoverable amount.
Key estimate and judgment
The Group determines the estimated useful lives and related depreciation and amortisation charges for its property, plant and equipment and finite life intangible assets. The useful lives could change significantly as a result of technical innovations or some other event. The depreciation and amortisation charge will increase where the useful lives are less than previously estimated lives, or technically obsolete or non-strategic assets that have been abandoned or sold or will be written off or written down.
NONI B GROUP ANNUAL REPORT 2018 43

NOTES TO THE FINANCIAL STATEMENTS
Note 11. INTANGIBLE ASSETSConsolidated Group
2018
$’000
2017
$’000
Goodwill – at cost 38,625 38,625
Brand valuation 36,300 36,300
Other intangible assets – at cost 1,501 797
Less: accumulated amortisation (447) (175)
Net carrying value 1,054 622
Total intangibles 75,979 75,547
Reconciliations of the written down values at the beginning and end of the current and previous financial year are set out below:
Consolidated Group
Goodwill
$’000
Brand names
$'000
Other*
$'000
Total
$’000
Consolidated Group:
Balance at 26 June 2016 – – 494 494
Additions – – 295 295
Additions from prior year business combination 38,625 36,300 – 74,925
Amortisation expense – – (167) (167)
Balance at 2 July 2017 38,625 36,300 622 75,547
Additions – – 703 703
Amortisation expense – – (271) (271)
Balance at 1 July 2018 38,625 36,300 1,054 75,979
* Includes software and development costs in relation to the IP and e-commerce related activities
Goodwill and Brand namesRecognition and measurement
Goodwill acquired in a business combination is initially measured at cost, being the excess of the cost of the business combination over the Group’s interest in the net fair value of the acquiree’s identifiable assets, liabilities and contingent liabilities. Goodwill on acquisition is included in intangible assets and is allocated to cash generating units for the purposes of impairment testing. Goodwill is assessed as having an indefinite useful life and is tested annually for impairment or more frequently if events or changes in circumstances indicate that it might be impaired. Goodwill is carried at cost less accumulated impairment losses. Impairment losses on goodwill are taken to the profit or loss and are not subsequently reversed. On 5 September 2016, the Group acquired 100% of the shares of the Pretty Girl Fashion Group. The brands within the Pretty Girl Fashion Group include Rockmans, W.Lane and beme. An independent valuation of the brand names acquired as part of the transaction resulted in a brand valuation of $36.3m. The fair value was determined based upon the royalty method at acquisition date. The royalty rates used in the valuation model were based on rates observed in the market. Brand names are assessed as having an indefinite useful life. The indefinite useful life reflects management’s intention to continue to operate these brands to generate net cash inflows into the foreseeable future.
Key estimates and judgement on impairment of goodwill and brand names
Impairment of goodwill and brand names is determined by assessing the recoverable amount of the cash generating units (CGU) to which it relates which has been assessed at the brand level. When the recoverable amount of the CGU is less than the carrying amount, an impairment loss is recognised. The recoverable amount of the CGU has been determined based upon the fair value less costs to sell approach. The fair value less costs to sell calculation is based on
44 We put the customer at the heart of everything we do.

the cash flow projections as at July 2018 for a period of three years. The cash flow projections are based on the FY2019 budget that has been approved by the board and are projected for a further two years based on estimated growth rates of 3% to 7% (2017: 3% to 5%) and a terminal growth rate of 1% (2017: 1%). As part of the annual impairment test for goodwill and brand valuation, management assesses the reasonableness of growth rate assumptions by reviewing historical cash flow and projections as well as future growth objectives.
During the year the annual impairment test was based on the fair value less cost of disposal method. Management believe this was the appropriate method in order to account for the expected growth of each cash generating unit including the store network expansion and potential restructuring of underperforming stores. The inputs used in testing for impairment are level 3 of the fair value hierarchy (note 21). Based on the impairment testing no impairment loss was recognised in relation to goodwill and brand names (2017: nil).
The post-tax discount rates applied to the cash flow projections is 13.5%. The discount rate has been determined using the weighted average cost of capital which incorporates both the cost of debt and the cost of capital.
The tax rate applied in the valuation model is based on the corporate tax rate in Australia of 30%.
Management believes that no reasonably possible change in any of the above key assumptions would cause the carrying value of the cash generating unit to materially exceed its recoverable amount.
Software and development costsCosts associated with software are amortised on a straight-line basis over the period of their expected benefit being their finite life of 5 years and is tested for impairment when there is indication of impairment.
Note 12. TRADE AND OTHER PAYABLESConsolidated Group
2018
$’000
2017
$’000
Trade payable 40,536 24,348
Sundry payables 19,165 22,080
59,701 46,428
Recognition and measurement
Trade and other payables represent the liabilities for goods and services received by the Group that remain unpaid at the end of the reporting period. The balance is recognised as a current liability with the amounts normally paid within 30 – 90 days of recognition of the liability. Due to the short-term nature they are measured at amortised cost and are not discounted.
Key estimate and judgment
The Group operates a loyalty program where customers accumulate points for purchases made which entitles them to discounts on future purchases. This is recognised as a customer loyalty provision and is based on (i) loyalty events and (ii) an estimate of the loyalty redemption by the loyalty customers. The estimate considers historical experience and other factors relevant to customer spending.
NONI B GROUP ANNUAL REPORT 2018 45

NOTES TO THE FINANCIAL STATEMENTS
Note 13. LOANS AND BORROWINGSConsolidated Group
2018
$’000
2017
$’000
CURRENT
Secured liabilities:
Lease liability – –
Bank loans 3,479 2,729
Total current borrowings 3,479 2,729
NON-CURRENT
Secured liabilities:
Bank loans 16,955 19,683
Total non-current borrowings 16,955 19,683
Bank loans are recognised at the fair value of the consideration less directly attributable transaction costs. Fees paid on establishment of loan facilities are amortised over the term of the facility. At 1 July 2018, the Group had outstanding loans and borrowings of $20m (2017: $22m) with $3m made available. The decrease in loans and borrowings for FY2018 consist of $2.25m in loan repayments and $272k in amortised borrowing costs (fees on establishment of the loan). Bank loans are secured by both the warehouse inventory and a general security deed which is a fixed and floating charge over the business.
Recognition and measurement
Borrowing costs are directly attributable to the loan. They are subsequently measured at amortised costs using the effective interest method.
Finance facilities
The following lines of credit were available at reporting date:
Consolidated Group
2018
$’000
2017
$’000
Amount of credit facilities available
Bank card 150 150
Market rate facility 5,000 5,000
Bank guarantees and lines of credit 7,000 7,000
Total 12,150 12,150
Amount of credit facilities unused
Bank card 75 32
Market rate facility 5,000 5,000
Bank guarantees and lines of credit 5,000 2,935
Total 10,075 7,967
As at 1 July 2018, the Group bank loan was $20.75m with $3m made available. The bank loans and finance facilities available contain specific financial covenants which the Group is required to meet. For the period ending 1 July 2018 the Group was able to meet its financial covenants and remained compliant for the period ended.
46 We put the customer at the heart of everything we do.

Note 14. PROVISIONSConsolidated Group
2018
$’000
2017
$’000
Current
Employee benefits 9,160 9,373
Other provisions 410 1,747
Total current provisions 9,570 11,120
Non-current
Employee benefits 1,126 1,272
Total non-current provisions 1,126 1,272
Movements in provisions during the current financial year, other than employee benefits, are set out below:
Lease make good
$’000
Bonus
$’000
Carrying amount at the start of the year 200 1,547
Additional provisions recognised 110 300
Amounts used (200) (1,547)
Carrying amount at the end of the year 110 300
Other long-term employee benefitsRecognition and measurement
Provision for employee benefits represents amounts accrued for annual leave and long service leave.
The current portion for this provision includes the total amount accrued for annual leave entitlements and the amounts accrued for long service leave entitlements that have vested due to employees having completed the required period of service. Based on past experience, the Group does not expect the full amount of annual leave or long service leave balances classified as current liabilities to be settled within the next 12 months. However, these amounts must be classified as current liabilities since the Group does not have an unconditional right to defer the settlement of these amounts in the event employees wish to use their leave entitlement. The amount that is not expected to be taken within the next twelve months including on costs is $3.49m.
Long-term benefits are benefits (other than termination benefits) that are not expected to be settled wholly within 12 months after the end of the annual reporting period in which the employees render the related service. Other long-term employee benefits are measured at the present value of the expected future payments to be made to employees. Expected future payments incorporate anticipated future wage and salary levels, durations of service and employee departures and are discounted at rates determined by reference to market yields at the end of the reporting period on government bonds that have maturity dates that approximate the terms of the obligations. Any remeasurements for changes in assumptions of obligations for other long-term employee benefits are recognised in profit or loss in the periods in which the changes occur. The non-current portion for this provision includes amounts accrued for long service leave entitlements that have not yet vested in relation to those employees who have not yet completed the required period of service.
Key estimate and judgment
The liability for long service leave is recognised and measured at the present value of the estimated future cash flows to be made in respect of all employees at the reporting date. In determining the present value of the liability, estimates of attrition rates and pay increases through promotion and inflation have been taken into account.
ProvisionsProvisions are recognised when the Group has a legal or constructive obligation, as a result of past events, for which it is probable that an outflow of economic benefits will result and that outflow can be reliably measured.
NONI B GROUP ANNUAL REPORT 2018 47

NOTES TO THE FINANCIAL STATEMENTS
Provisions are measured using the best estimate of the amounts required to settle the obligation at the end of the reporting period.
Other provisions include:Lease make good
The provision represents the present value of the estimated costs to make good the store closures for the premises leased by the Group.
Bonus
The provision represents the estimated amount to be paid to team members based on the FY2018 performance which were approved prior to year end.
Note 15. DERIVATIVE FINANCIAL INSTRUMENTSConsolidated Group
2018
$’000
2017
$’000
Forward exchange forward contracts – 1,773
Interest rate swaps 8 1
8 1,774
Refer to note 21 for further information on financial instruments
Note 16. OTHER LIABILITIESConsolidated Group
2018
$’000
2017
$’000
CURRENT
Fitout contributions and lease incentives 6,179 4,794
6,179 4,794
NON-CURRENT
Fitout contributions and lease incentives 14,009 12,232
14,009 12,232
Deferred lease incentives
The liability represents operating lease incentives received. The incentives are allocated to the profit and loss on a straight-line basis over the lease term.
Note 14. PROVISIONS (continued)
48 We put the customer at the heart of everything we do.

Note 17. ISSUED CAPITALConsolidated Group
2018
$’000
2017
$’000
Fully paid ordinary shares
Balance at the beginning of the financial year 68,340 21,710
Issue of shares 40,821 48,341
Less transaction costs in relation to capital raising (1,510) (1,711)
Ordinary shares 107,651 68,340
NO. NO.
Balance at the beginning of the financial period 80,033,300 39,081,040
Issue of shares during the period (i) 16,603,945 40,952,260
Share buy-back (ii) (276,000) –
Balance at the end of the financial period 96,361,245 80,033,300
(i) a total of 16,603,945 shares were issued in relation to the Capital Raising (15,999,985), Performance (375,000) and Bonus (228,960) shares. This includes shares issued under limited recourse loans issued to Directors and Senior Management.
(ii) 275,000 shares were issued to Senior Management however they were cancelled by the Company during the year. A further 1,000 shares were bought and cancelled by the Company as part of the share buy-back.
Ordinary shares
Ordinary shares are classified as equity and entitle the holder to participate in dividends and the proceeds on the winding up of the Group in proportion to the number of and amounts paid on the shares held. The fully paid ordinary shares have no par value and the Group does not have a limited amount of authorised capital.
On a show of hands every member present at a meeting in person or by proxy shall have one vote and upon a poll each share shall have one vote. Incremental costs directly attributable to the issue of new shares are shown in equity as a deduction, net of tax, from proceeds.
Note 18. EQUITY RESERVE The equity reserve is used to record the value of the share based payments provided to employees. In accordance to the Rules of the Director and Senior Management Share Plan, dividends paid on the Plan Shares will be applied to the value of shares. The dividend amount which was applied to the Plan Shares during the 2018 Financial Year was $771,050 and this amount was not paid in cash.
NONI B GROUP ANNUAL REPORT 2018 49

NOTES TO THE FINANCIAL STATEMENTS
Note 19. DIVIDENDS PAIDDividends
Consolidated Group
2018 2017
Cents per share
Date of payment
Total amount
$’000Cents per
shareDate of
payment
Total amount
$'000
Current year interim 9.0 29/03/2018 7,233 – – –
Prior year final 4.0 09/10/2017 3,201 – – –
10,434 –
All dividends are fully franked at a 30% tax rate.
On 29 August 2018, the board of directors declared a final dividend in respect of the 2018 year of 4.0 cents (2017: 4.0 cents) per share fully franked at a 30% tax rate. The amount will be paid on 12 October 2018 (2017: 9 October 2017). As the dividend was declared subsequent to 1 July 2018, no provision has been made as at 1 July 2018.
Franking creditsConsolidated Group
2018
$’000
2017
$’000
Franking credits available for future financial years (tax paid basis, 30% tax rate) 14,941 10,709
The above amount represents the balance of the franking account as at the end of the financial year, adjusted for:
● Franking credits that will arise from the payment of the amount of the provision for income tax at the reporting date
● Franking debits that will arise from the payment of dividends recognised as a liability at the reporting date
● Franking credits that will arise from the receipt of dividends recognised as receivables at the reporting date
Note 20. DIVIDEND PROFIT RESERVETo the extent that any current year profits are not distributed as dividends, the Group may set aside some or all of the undistributed profits to a separate dividend profit reserve to facilitate the payment of future dividends, rather than maintaining these profits within accumulated losses. During the year the Directors decided to transfer the FY2018 profit to the dividend profit reserve which will enable the declaration of a future dividend.
Consolidated Group
2018
$’000
2017
$’000
Dividend profit reserve 10,112 3,253
50 We put the customer at the heart of everything we do.

Note 21. FINANCIAL RISK MANAGEMENTCapital Risk ManagementManagement controls the capital of the Group in order to maintain a sustainable debt to equity ratio, generate long-term shareholder value and ensure that the Group can fund its operations and continue as a going concern.
The Group’s debt and capital include ordinary share capital and financial liabilities, supported by financial assets. The Group is not subject to any externally imposed capital requirements.
Management effectively manages the Group’s capital by assessing the Group’s financial risks and adjusting its capital structure in response to changes in these risks and in the market. These responses include the management of debt levels, distributions to shareholders and share issues.
There have been no changes in the strategy adopted by management to control the capital of the Group since the prior year. The gearing ratios for the years ended 1 July 2018 and 2 July 2017 are as follows:
Note
Consolidated Group
2018
$’000
2017
$’000
Total debt 13 20,434 22,412
Total equity 110,018 62,428
Total capital 130,452 84,840
Gearing ratio 15.7% 26.4%
Financial Risk Management Policies
The Board monitors the Group’s financial risk management policies and exposures and approves financial transactions within the scope of its authority. It also reviews the effectiveness of internal controls relating to commodity price risk, counterparty credit risk, currency risk, liquidity risk, and interest rate risk.
The Boards overall risk management strategy seeks to assist the Group in meeting its financial targets, while minimising potential adverse effects on financial performance. Its functions include the review of the use of hedging derivative instruments, credit risk policies and future cash flow requirements.
Specific Financial Risk Exposures and Management
The main risks the Group is exposed to through its financial instruments are credit risk, liquidity risk, and market risk consisting of interest rate risk, foreign currency risk and other price risk (commodity and equity price risk). There have been no substantive changes in the types of risks the Group is exposed to, how these risks arise, or the Board’s objectives, policies and processes for managing or measuring the risks from the previous period.
Credit RiskCredit risk refers to the risk that a counterparty will default on its contractual obligations resulting in financial loss to the Group. Credit risk arises from cash and cash equivalents, derivatives and deposits with banks. As sales to retail customers are settled in cash or using major credit cards within 24 hours, the Group is mitigated from any material credit risk exposure to any single debtor or group of debtors. Current trade account receivables are non-interest bearing loans and are generally on 45 day terms.
Market RiskForeign currency risk
The Group undertakes certain transactions denominated in foreign currency and is exposed to foreign currency risk through foreign exchange rate fluctuations.
Foreign exchange risk arises from future commercial transactions and recognised financial assets and financial liabilities denominated in a currency that is not the entity's functional currency. The risk is measured using sensitivity analysis and cash flow forecasting.
In order to protect against exchange rate movements, the Group has entered into forward foreign exchange contracts. These contracts are hedging highly probable forecasted cash flows for the ensuing financial year.
NONI B GROUP ANNUAL REPORT 2018 51

NOTES TO THE FINANCIAL STATEMENTS
The contracts are timed to mature when payments for certain shipments of inventory are scheduled to be made. The fair value of forward exchange contracts is determined using forward exchange market rates at reporting date.
The maturity, settlement amounts and the average contractual exchange rates of the Group's outstanding forward foreign exchange contracts at the reporting date was as follows:
Buy US dollars
Sell AUD dollars Average exchange rate
2018
$’000
2017
$’000
2018
$’000
2017
$’000
Maturity:
Less than 1 year 28,519 30,528 0.7549 0.7236
The derivatives that are not effective accounting hedges are measured at fair value through profit or loss.
Price risk
The Group is not exposed to any significant price risk.
Interest Rate Risk
The Group’s main interest rate risk arises from loans and borrowings. Borrowings with variable rates expose the Group to interest rate risk with borrowings issued at fixed rates exposing the Group to fair value interest risk. The Group currently has interest swaps in order to reduce the exposure to interest rate risk.
As at the reporting date, the group had the following interest rate borrowings outstanding:
Loan balance Average interest rate
2018
$’000
2017
$’000
2018
%
2017
%
Bank loans 20,434 22,412 4.17% 4.54%
Liquidity riskLiquidity risk arises from the possibility that the Group might encounter difficulty in settling its debts or otherwise meeting its obligations related to financial liabilities.
The Group manages liquidity risk by maintaining adequate cash reserves and available borrowing facilities by continuously monitoring actual and forecast cash flows. At reporting date, bank loan facilities of $5m were available to the Group (2017: $5m). Of this facility, $5m was unused (2017: $5m).
The following table reflects the Groups financial liabilities, net and gross settled derivative financial instruments into relevant maturity groupings based on the remaining period at the reporting date to the contractual maturity date. The amounts disclosed in the table are the contractual undiscounted cash flows. The tables include both principal and interest cash flows disclosed as remaining contractual maturities and therefore the totals may differ from their carrying amount in the statement of financial position.
Consolidated Group
2018
$’000
2017
$’000
Maturity < 1 month 33,739 32,326
Maturity 1 – 3 months 27,463 14,696
Maturity 3 – 12 months 2,250 2,250
Maturity > 1 year 17,000 20,000
80,452 69,272
Note 21. FINANCIAL RISK MANAGEMENT (continued)
52 We put the customer at the heart of everything we do.

Fair Value of financial instruments AASB 13, fair value measurement requires the disclosure of fair value information by level of the fair value hierarchy, which categorises fair value measurements into one of three possible levels based on the lowest level that an input that is significant to the measurement can be categorised into as follows:
Level 1 – the fair value is calculated using quoted price in active markets for identical assets or liabilities.
Level 2 – the fair value is estimated using inputs other than quoted prices included in Level 1 that are observable for the asset or liability, either directly (as prices) or indirectly (derived from prices).
Level 3 – the fair value is estimated using inputs for the asset or liability that are not based on observable market data.
The fair values of assets and liabilities that are not traded in an active market are determined using one or more valuation techniques. These valuation techniques maximise, to the extent possible, the use of observable market data. If all significant inputs required to measure fair value are observable, the asset or liability is included in Level 2. If one or more significant inputs are not based on observable market data, the asset or liability is included in Level 3.
Valuation techniquesThe Group selects a valuation technique that is appropriate for the circumstances. The valuation technique on the derivatives is based on quoted mark to market data provided by the bank. There has been no movement between levels and no changes in valuation techniques.
The following tables provide the fair values of the Group’s assets and liabilities measured and recognised on a recurring basis after initial recognition and their categorisation within the fair value hierarchy:
Level 1 Level 2 Level 3 Total
2018
$'000
2017
$'000
2018
$'000
2017
$'000
2018
$'000
2017
$'000
2018
$'000
2017
$'000
Recurring fair value measurements
Derivatives Asset/(Liability) held for hedging:
– Forward exchange forward contracts – – 653 (1,773) – – 653 (1,773)
– Interest swaps – – (8) (1) – – (8) (1)
Contingent consideration – – – – – (3,173) – (3,173)
Total liabilities recognised at fair value – – 645 (1,774) – (3,173) 645 (4,947)
NONI B GROUP ANNUAL REPORT 2018 53

NOTES TO THE FINANCIAL STATEMENTS
Note 22. KEY MANAGEMENT PERSONNELInformation regarding individual key management personnel (KMP), shareholdings of key management personnel, as well as other transactions and balances with key management personnel and their related parties, as required by Regulation 2M.3.03 of the Corporations Regulations 2001 is provided in the Remuneration Report section of the Directors’ Report
Directors
The following persons were directors of Noni B Limited during the financial year
● Richard Facioni, Chairman
● Scott Evans, Chief Executive Officer
● Sue Morphet, Non-Executive Director
● David Wilshire, Non-Executive Director
Other key management personnel
The following persons also had the authority and responsibility for planning, directing and controlling the major activities of the Group directly or indirectly, during the financial year:
● Luke Softa, Chief Financial Officer
Compensation
The aggregate remuneration of the directors and other key management personnel of the Group are as follows:
Consolidated Group
2018
$’000
2017
$’000
Short-term employee benefits 1,626,463 1,939,790
Post-employment benefits 48,598 68,517
Other long-term benefits 17,743 29,928
Share based payments 581,527 898,628
Total benefits 2,274,331 2,936,863
Short-term employee benefits These amounts include fees and benefits paid as well all salary, paid leave benefits, fringe benefits and cash bonuses.
Post-employment benefitsThese amounts are the current-year’s estimated costs of providing for the Group’s defined benefits scheme post-retirement, superannuation contributions made during the year and post-employment life insurance benefits.
Other long-term benefits These amounts represent long service leave benefits accruing during the year, long-term disability benefits and deferred bonus payments.
Share-based payments These amounts represent the expense related to the participation of the key management personnel in equity-settled benefit schemes as measured by the fair value of the options, rights and shares granted on grant date.
54 We put the customer at the heart of everything we do.

Note 23. AUDITORS’ REMUNERATIONDuring the financial year the following fees were paid or payable for services provided by BDO, the auditor of the Group and its network firms.
Consolidated Group
2018
$
2017
$
Audit services – BDO
– Audit and review of the financial statements 251,000 264,000
Other services – BDO
– Tax compliance services including review of company income tax returns 4,350 13,010
– Tax advisory services – 17,960
– Other advisory services* – 64,270
– Other assurance services – 38,760
255,350 398,000
* 2017 advisory fees relate to the acquisition of the Pretty Girl Fashion Group
Note 24. CONTINGENCIES Consolidated Group
2018
$'000
2017
$'000
Contingent consideration – 3,173
As part of the purchase of the Pretty Girl Fashion Group from Consolidated Press Holdings Pty Ltd in FY2017, it was agreed that the seller will be entitled to deferred payments which are dependent on sales measures in the 2017 and 2018 financial year. Based on key measures and trading for the first-half of FY2018, an early settlement was agreed between the buyer and seller whereby $3.0m would be paid prior to 31 December 2017. This caused a $173,524 variation which was recognised as income against other expenses in the Consolidated Statement of Profit or Loss and other Comprehensive Income in the 2018 financial year. The contingent consideration in the prior year was measured using a formula which incorporated the 2017 base sales and applied a marginal growth rate for FY2018 which was measured using a Level 3 fair value technique (note 21). The Group had no other contingencies as at 1 July 2018.
NONI B GROUP ANNUAL REPORT 2018 55

NOTES TO THE FINANCIAL STATEMENTS
Note 25. COMMITMENTSOperating Lease CommitmentsNon-cancellable operating leases contracted for but not recognised in the financial statements
Consolidated Group
2018
$’000
2017
$’000
Payable – minimum lease payments
– no later than 12 months 58,638 58,518
– between 12 months and 5 years 91,473 104,919
– later than 5 years 262 2,376
150,373 165,813
Property leases on retail stores are mostly non-cancellable with rent payable monthly in advance. Contingent rental provisions within lease agreements generally require minimum lease payments be increased by CPI or a percentage factor. Certain agreements have option arrangements to renew the lease for an additional term.
Recognition and measurement
Lease payments for operating leases, where substantially all the risks and benefits remain with the lessor, are recognised as expenses in the periods in which they are incurred.
Lease incentives under operating leases are recognised as a liability and amortised on a straight-line basis over the lease term.
Note 26. RELATED PARTY TRANSACTIONSParent entity
Noni B Limited is the parent entity.
Subsidiaries
Interests in subsidiaries are set out in note 28.
Key management personnel
Disclosures relating to key management personnel are set out in note 22 and the Remuneration report is included in the Directors report.
Transactions with related parties
A total of $120k was paid in management fees to related party of the Non-Executive Directors during the financial period.
Receivables from and payable to related parties
There were no trade receivables from or trade payables to related parties at the current and previous reporting date.
Loans to/from related parties
There were no loans to or from related parties at the current and previous reporting date.
56 We put the customer at the heart of everything we do.

Note 27. PARENT ENTITY INFORMATIONThe following information has been extracted from the books and records of the parent and has been prepared in accordance with Australian Accounting Standards.
Consolidated Group
2018
$’000
2017
$’000
Statement of profit or loss and other comprehensive income
Net profit after income tax expense 17,293 3,253
Total comprehensive income for the year 17,293 3,253
Statement of financial position
ASSETS
Current assets 85,720 35,327
Non-current assets 92,041 92,955
TOTAL ASSETS 177,761 128,282
LIABILITIES
Current liabilities 35,248 27,388
Non-current liabilities 32,495 38,466
TOTAL LIABILITIES 67,743 65,854
EQUITY
Issued capital 107,651 68,340
Reserves 13,271 4,992
Accumulated losses (10,904) (10,904)
TOTAL EQUITY 110,018 62,428
As at 1 July 2018, the parent entity has net current assets of $50.47m (2017: $7.94m)
Contingent liabilities
As at 1 July 2018, the parent entity had no contingent liabilities (2017: nil).
Significant accounting policies
The accounting policies of the parent entity are consistent with those of the Group, except for the following:
● Investments in subsidiaries are accounted for at cost, less any impairment, in the parent entity.
● Investments in associates are accounted for at cost, less any impairment, in the parent entity.
Contractual commitments
As at 1 July 2018, the parent entity had no contractual commitments apart from standard operating lease commitments (note 25).
NONI B GROUP ANNUAL REPORT 2018 57

NOTES TO THE FINANCIAL STATEMENTS
Note 28. INTERESTS IN SUBSIDIARIESInformation about the Principal Subsidiaries The subsidiaries listed below have share capital consisting solely of ordinary shares which are held directly by the Group. The proportion of ownership interests held equals the voting rights held by the Group. Each subsidiary’s principal place of business is also its country of incorporation.
Name of Subsidiary Incorporation
Ownership Interest
2018 2017
Pretty Girl Fashion Group Holdings Pty Ltd Australia 100% 100%
Pretty Girl Fashion Group Pty Ltd Australia 100% 100%
Noni B Holdings Pty Limited Australia 100% 100%
W.Lane Pty Ltd Australia 100% 100%
Hapago Pty Ltd Australia 100% 100%
Stellvine Pty Ltd Australia 100% 100%
La Voca Pty Ltd Australia 100% 100%
Bostide Pty Ltd Australia 100% 100%
Note 29. DEED OF CROSS GUARANTEE The following entities are party to a deed of cross guarantee under which each party guarantees the debts of the others:
● Noni B Limited
● Pretty Girl Fashion Group Holdings Pty Ltd
● Noni B Holdings Pty Limited
● Pretty Girl Fashion Group Pty. Ltd.
By entering into the deed, the wholly-owned entities have been relieved from the requirement to prepare financial statements and directors’ report under ASIC Legislative Instrument 2016/785.
The above companies (excluding Noni B Limited as parent entity) represent a ‘Closed Group’ for the purposes of the legislative instrument. The financial information pertaining to the Closed Group is the consolidated financial information in the report less the information of the parent entity as disclosed in Note 27.
Closed Group
2018
$’000
2017
$'000
Statement of financial position
ASSETS
Current assets 25,092 26,395
Non-current assets 34,123 26,004
TOTAL ASSETS 59,215 52,399
LIABILITIES
Current liabilities 48,157 43,299
Non-current liabilities 11,058 9,100
TOTAL LIABILITIES 59,215 52,399
The financial results of the Closed Group contributed $6.98m in profit which was distributed to the parent entity by way of a dividend during the year.
58 We put the customer at the heart of everything we do.

Note 30. CASH FLOW INFORMATIONConsolidated Group
2018
$’000
2017
$’000
Reconciliation of Cash Flows from Operating Activities with Profit after income tax
Profit after income tax 17,293 3,253
Non-cash flows in profit:
– depreciation 10,156 7,849
– amortisation 271 178
– write-off of obsolete stock 1,972 2,709
– impairment and write-off of non-current assets 91 1,142
– net gain on disposal of property, plant and equipment (38) (71)
– unrealised foreign exchange (gain) / loss (832) 541
– share based payment expense 649 595
– adjustment to goodwill balance – (458)
Change in assets and liabilities:
– increase in trade and other receivables (2,875) (2,448)
– increase in inventories (18,211) (20,534)
– increase in deferred tax assets (1,596) (11,289)
– increase in deferred tax liabilities 257 11,162
– increase in trade and other payables 18,080 27,903
– (decrease)/increase in financial instruments (2,419) 1,459
– increase in tax liability 625 3,843
– (decrease)/increase in provisions (1,695) 7,571
Net cash flow from operating activities 21,728 33,405
Changes in liabilities arising from finance activities relate solely to movements in loans and borrowings (note 13).
NONI B GROUP ANNUAL REPORT 2018 59

NOTES TO THE FINANCIAL STATEMENTS
Note 31. EARNINGS PER SHAREConsolidated Group
2018
$’000
2017
$’000
Earnings per share for profit
Profit after income tax 17,293 3,253
Profit after income tax attributable to the owners of Noni B Limited 17,293 3,253
Consolidated Group
Number
$’000
Number
$’000
Weighted average number of ordinary shares used in calculating:
– basic earnings per share 81,386 70,637
– diluted earnings per share 81,386 70,637
Basic earnings per share (cents) 21.3 4.6
Diluted earnings per share (cents) 21.3 4.6
Basic earnings per shareBasic earnings per share is calculated by dividing the profit attributable to the owners of Noni B Limited, excluding any costs of servicing equity other than ordinary shares, by the weighted average number of ordinary shares outstanding during the financial year, adjusted for bonus elements in ordinary shares issued during the financial year.
Diluted earnings per shareDiluted earnings per share adjusts the figures used in the determination of basic earnings per share to take into account the after income tax effect of interest and other financing costs associated with dilutive potential ordinary shares and the weighted average number of shares assumed to have been issued for no consideration in relation to dilutive potential ordinary shares.
Note 32. SHARE BASED PAYMENTSThe fair value at grant date is independently determined using a Binomial Approximation Option Valuation Model and the Black Scholes Valuation model that takes into account the exercise price, the term of the rights over shares, the share price at grant date and expected price volatility of the underlying share, the expected dividend yield and the risk free interest rate for the term of the rights over shares. The volatility calculation is based on historical share prices. These have a variety of market and non-market conditions based on the volume weighted average price (VWAP). The accounting estimates and assumptions relating to equity-settled share-based payments would have no impact on the carrying amounts of assets and liabilities within the next annual reporting period but may impact profit or loss and equity.
60 We put the customer at the heart of everything we do.

A summary of the movement of all rights over share grants during the year ended 1 July 2018 include:
Performance Share RightsPerformance share rights which were outstanding as at 1 July 2018 were as follows:
Grant date Expiry date
Fair value at grant
date
Share price at grant
dateExercise
price VolatilityInterest
rate
Number of rights available
27/10/2015 27/10/2018 $ 0.10 $ 1.00 $ 0.90 – – 850,000
08/08/2016 07/08/2021 $ 0.44 $ 1.33 $ 1.33 35% 1.54% 100,000
19/08/2016 18/08/2021 $ 0.47 $ 1.33 $ 1.25 35% 1.54% 1,450,000
19/08/2016 18/08/2021 $ 0.39 $ 1.33 $ 1.50 35% 1.54% 300,000
19/08/2016 18/08/2021 $ 0.32 $ 1.33 $ 1.75 35% 1.54% 300,000
17/02/2017 16/02/2022 $ 0.48 $ 1.46 $ 1.47 35% 1.54% 100,000
10/05/2017 09/05/2022 $ 0.55 $ 1.65 $ 1.63 35% 1.54% 50,000
24/05/2017 23/05/2022 $ 0.54 $ 1.63 $ 1.64 35% 1.54% 100,000
07/08/2017 06/08/2022 $ 0.38 $ 1.96 $ 1.86 15% 1.55% 225,000
25/08/2017 24/08/2022 $ 0.38 $ 2.00 $ 1.95 16% 1.55% 25,000
26/09/2017 25/09/2022 $ 0.45 $ 2.06 $ 2.05 21% 1.55% 25,000
11/11/2017 10/11/2022 $ 0.39 $ 2.02 $ 2.01 25% 1.55% 25,000
12/01/2018 11/01/2023 $ 0.45 $ 2.09 $ 1.93 24% 1.55% 75,000
The weighted average price for the above performance share rights was $1.32.
During the financial period a total of 375,000 share rights were exercised at the agreed upon exercise price on the grant date.
Performance share rights which were forfeited during the period 3 July 2017 to 1 July 2018 were as follows:
Grant date Expiry date
Fair value at grant
date
Share price at grant
dateExercise
price VolatilityInterest
rate
Number of rights available
17/02/2017 16/02/2022 $ 0.48 $ 1.46 $ 1.47 35% 1.54% 150,000
24/05/2017 23/05/2022 $ 0.54 $ 1.63 $ 1.64 35% 1.54% 75,000
Investment shares Service conditions only apply to these offers as follows:
Grant date Expiry date
Fair value at grant
date
Share price at grant
dateExercise
price VolatilityInterest
rate
Number of rights available
26/06/2015 31/10/2015 $ 0.20 $ 0.70 $ 0.51 47% 2.78% 1,764,705
The total charge arising from share based payment transactions during the year as part of employee benefit expense was $648,506 (2017: $595,054).
Recognition and measurement
Share-based payments to employees are measured at the fair value of the instruments issued and amortised over the vesting periods. Share-based payments to non-employees are measured at the fair value of goods or services received or the fair value of the equity instruments issued, if it is determined the fair value of the goods or services cannot be reliably measured, and are recorded at the date the goods or services are received. The corresponding amount is recorded to the equity reserve. The fair value is determined using the Black-Scholes pricing model. The number of shares expected to vest is reviewed and adjusted at the end of each reporting period such that the amount recognised for services received as consideration for the equity instruments granted is based on the number of equity instruments that eventually vest.
NONI B GROUP ANNUAL REPORT 2018 61

NOTES TO THE FINANCIAL STATEMENTS
Note 33. EVENTS AFTER THE REPORTING DATEOn 14 May 2018 Noni B announced an agreement to acquire certain assets and no equity interests from Specialty Fashion Group (ASX: SFH) being the Millers, Katies, Crossroads, Autograph and Rivers Brands. On 2 July 2018, being the date of completion the Noni B Group announced the control of the assets and businesses in accordance with the agreement for consideration of $31.0 million in cash plus an estimated $7.67m working capital payment (final working capital payment will be disclosed during the December half-year results) with no attached contingent consideration.
The total transactional costs associated with the acquisition included $283k paid pre 1 July 2018 with $350k paid post FY2018. Further costs associated with the acquisition will be disclosed in FY2019.
The acquisition of these brands will allow the Noni B Group to become one of the pre-eminent women’s apparel retailers in Australia strengthening its focused market position which currently includes the Noni B, Rockmans, W.Lane and beme brands.
At the end of July 2018, the Millers, Katies, Crossroads, Autograph and Rivers brands contributed revenue from 749 retail stores in Australia and 28 stores in New Zealand.
AASB 3 Business Combinations requires disclosure of acquired receivables, major class of assets acquired and liabilities assumed, at fair value as of the acquisition date.
At the time of the financial statements being authorised for issue, indicative carrying values of assets and liabilities based on available information as at 2nd July 2018 (subject to fair value assessments and alignment to the Group’s accounting policies) included:
● Payables $55.4m
● Gift Vouchers $4.1m
● Employee benefit provisions $16.9m
At the time of issue, the carrying and fair value of inventory acquired was unable to be disclosed due to the fact an extensive review needs to be undertaken of the fixed and variable overhead costs included in inventory at acquisition which need to be aligned with the Noni B policies and procedures. Likewise, acquired plant and equipment needs to undergo a similar process to ensure the accounting policies are aligned to those of Noni B and adjustments are expected before the carrying and fair values of acquired assets can be disclosed. Receivables and prepayments are in the process of being assessed for recoverability and collectability and can not be reasonability estimated at this stage. No accruals have been assumed as part of the acquisition. Provisional accounting for the business combination will be recorded and disclosed in the half year financial report for the period ended 30 December 2018 with the final position confirmed in the 2019 full year financial report. At this time the Group will disclose any acquired intangibles and goodwill or discount on acquisition which can only be finalised after the above reviews are completed. Any acquired intangibles such as brand names will be valued using an appropriate valuation methodology.
Except as noted above, no other matters or circumstances have arisen since 1 July 2018 that has significantly affected, or may significantly affect the Group’s operations, the results of those operations, or the Group’s state of affairs in future financial years.
62 We put the customer at the heart of everything we do.

DIRECTORS' DECLARATION
In accordance with a resolution of the Directors of Noni B Limited, the Directors of the Company declare that:
1. the financial statements and notes of Noni B Limited for the financial year ended 1 July 2018 are in accordance with the Corporations Act 2001 including:
a) complying with Australian Accounting Standards, the Corporations Regulations 2001 and other mandatory professional reporting requirements, and
b) give a true and fair view of the financial position as at 1 July 2018 and of its performance for the financial year ended on that date, and
2. in the Directors’ opinion there are reasonable grounds to believe that the Company will be able to pay its debts as and when they become due and payable
3. in the opinion of the Directors, as at the date of this declaration, there are reasonable grounds to believe that the members of the Closed Group will be able to meet any obligations or liabilities to which they are or may become subject, by virtue of the Deed of Cross Guarantee
The Directors have been given the declarations required by s 295A of the Corporations Act 2001 from the Chief Executive Officer and Chief Financial Officer for the financial year ended 1 July 2018.
Richard Facioni Chairman
Sydney 29 August 2018
Scott Evans Managing Director
Sydney 29 August 2018
NONI B GROUP ANNUAL REPORT 2018 63

INDEPENDENT AUDITOR'S REPORTTO THE MEMBERS OF NONI B LIMITED
Level 11, 1 Margaret St Sydney NSW 2000 Australia
Tel: +61 2 9251 4100 Fax: +61 2 9240 9821 www.bdo.com.au
BDO East Coast Partnership ABN 83 236 985 726 is a member of a national association of independent entities which are all members of BDO Australia Ltd ABN 77 050 110 275, an Australian company limited by guarantee. BDO East Coast Partnership and BDO Australia Ltd are members of BDO International Ltd, a UK company limited by guarantee, and form part of the international BDO network of independent member firms. Liability limited by a scheme approved under Professional Standards Legislation, other than for the acts or omissions of financial services licensees.
INDEPENDENT AUDITOR'S REPORT
To the members of Noni B Limited
Report on the Audit of the Financial Report
Opinion
We have audited the financial report of Noni B Limited (the Company) and its subsidiaries (the Group), which comprises the consolidated statement of financial position as at 1 July 2018, the consolidated statement of profit or loss and other comprehensive income, the consolidated statement of changes in equity and the consolidated statement of cash flows for the year then ended, and notes to the financial report, including a summary of significant accounting policies and the directors’ declaration.
In our opinion the accompanying financial report of the Group, is in accordance with the Corporations Act 2001, including:
(i) Giving a true and fair view of the Group’s financial position as at 1 July 2018 and of its financial performance for the year ended on that date; and
(ii) Complying with Australian Accounting Standards and the Corporations Regulations 2001.
Basis for opinion
We conducted our audit in accordance with Australian Auditing Standards. Our responsibilities under those standards are further described in the Auditor’s responsibilities for the audit of the Financial Report section of our report. We are independent of the Group in accordance with the Corporations Act 2001 and the ethical requirements of the Accounting Professional and Ethical Standards Board’s APES 110 Code of Ethics for Professional Accountants (the Code) that are relevant to our audit of the financial report in Australia. We have also fulfilled our other ethical responsibilities in accordance with the Code.
We confirm that the independence declaration required by the Corporations Act 2001, which has been given to the directors of the Company, would be in the same terms if given to the directors as at the time of this auditor’s report.
We believe that the audit evidence we have obtained is sufficient and appropriate to provide a basis for our opinion.
Key audit matters
Key audit matters are those matters that, in our professional judgement, were of most significance in our audit of the financial report of the current period. These matters were addressed in the context of our audit of the financial report as a whole, and in forming our opinion thereon, and we do not provide a separate opinion on these matters.
64 We put the customer at the heart of everything we do.

INDEPENDENT AUDITOR'S REPORTTO THE MEMBERS OF NONI B LIMITED
Revenue recognition
Key audit matter How the matter was addressed in our audit
Revenue, totalling $364,152,000 as disclosed in Note 3 to the financial statements, is a key audit matter due to the significance of the balance and the volume of transactions. The Group's management focuses on revenue as a key driver by which the performance of the Group is measured.
The Group records revenue at the fair value of consideration received at the point of sale, which is when the customer has taken delivery of the goods.
To ensure that revenue was recorded properly, our audit procedures included, amongst others:
• Reviewing the revenue recognition policy for all material sources of revenue to ensure that revenue was being recognised appropriately, in line with Australian Accounting Standards and the policies disclosed within the financial statements;
• Testing, with the assistance of internal IT audit experts, the operating effectiveness of controls surrounding the transfer of sales data from the point of sale system (at stores) to the general ledger. We also tested the operating effectiveness of controls surrounding the processing and recognition of revenue;
• Performing cut-off testing to ensure that revenue transactions around year end have been recorded in the correct reporting period; and
• Performing a variety of analytical procedures which included comparing revenue on a monthly basis with expectations.
Valuation of inventory
Key audit matter How the matter was addressed in our audit
The valuation of inventory is a key audit matter because as at 1 July 2018, the Group held a material inventory balance of $45,482,000 as disclosed in note 8. Due to the industry in which the Group operates, the items held in inventory have an inherent risk of obsolescence.
The Group determined the inventory obsolescence provision based on the age of inventory and expected future sales. The valuation process is judgemental and is based on assumptions, specifically those in relation to expected future sales, which is affected by the general economic environment.
To determine whether inventory was properly valued, our audit procedures included, amongst others:
• Agreeing a sample of inventory on hand to initial purchase invoices and subsequent sales invoices and comparing the carrying amount to the net realisable value;
• Performing a detailed analysis of inventory turnover compared to prior periods; and
• Discussing with management the Group’s current performance and future strategies to assist in evaluating the underlying assumptions applied in the calculation of the inventory obsolescence provision.
NONI B GROUP ANNUAL REPORT 2018 65

INDEPENDENT AUDITOR'S REPORTTO THE MEMBERS OF NONI B LIMITED
Other information
The directors are responsible for the other information. The other information comprises the information in the Group’s annual report for the year ended 1 July 2018, but does not include the financial report and the auditor’s report thereon.
Our opinion on the financial report does not cover the other information and we do not express any form of assurance conclusion thereon.
In connection with our audit of the financial report, our responsibility is to read the other information and, in doing so, consider whether the other information is materially inconsistent with the financial report or our knowledge obtained in the audit or otherwise appears to be materially misstated.
If, based on the work we have performed, we conclude that there is a material misstatement of this other information, we are required to report that fact. We have nothing to report in this regard.
Responsibilities of the directors for the Financial Report
The directors of the Company are responsible for the preparation of the financial report that gives a true and fair view in accordance with Australian Accounting Standards and the Corporations Act 2001 and for such internal control as the directors determine is necessary to enable the preparation of the financial report that gives a true and fair view and is free from material misstatement, whether due to fraud or error.
In preparing the financial report, the directors are responsible for assessing the ability of the group to continue as a going concern, disclosing, as applicable, matters related to going concern and using the going concern basis of accounting unless the directors either intend to liquidate the Group or to cease operations, or has no realistic alternative but to do so.
Auditor’s responsibilities for the audit of the Financial Report
Our objectives are to obtain reasonable assurance about whether the financial report as a whole is free from material misstatement, whether due to fraud or error, and to issue an auditor’s report that includes our opinion. Reasonable assurance is a high level of assurance, but is not a guarantee that an audit conducted in accordance with the Australian Auditing Standards will always detect a material misstatement when it exists. Misstatements can arise from fraud or error and are considered material if, individually or in the aggregate, they could reasonably be expected to influence the economic decisions of users taken on the basis of this financial report.
A further description of our responsibilities for the audit of the financial report is located at the Auditing and Assurance Standards Board website (http://www.auasb.gov.au/Home.aspx) at:
http://www.auasb.gov.au/auditors_responsibilities/ar1.pdf
This description forms part of our auditor’s report.
66 We put the customer at the heart of everything we do.

INDEPENDENT AUDITOR'S REPORTTO THE MEMBERS OF NONI B LIMITED
Report on the Remuneration Report
Opinion on the Remuneration Report
We have audited the Remuneration Report included in the directors’ report for the year ended 1 July 2018.
In our opinion, the Remuneration Report of Noni B Limited, for the year ended 1 July 2018, complies with section 300A of the Corporations Act 2001.
Responsibilities
The directors of the Company are responsible for the preparation and presentation of the Remuneration Report in accordance with section 300A of the Corporations Act 2001. Our responsibility is to express an opinion on the Remuneration Report, based on our audit conducted in accordance with Australian Auditing Standards.
BDO East Coast Partnership
Gillian Shea Partner
Sydney, 29 August 2018
NONI B GROUP ANNUAL REPORT 2018 67

ADDITIONAL INFORMATION
In accordance with ASX Listing Rule 4.10, the Company provides the following information to shareholders not elsewhere disclosed in this Annual Report. The information provided is current as at 31 July 2018 (Reporting date).
CORPORATE GOVERNANCE STATEMENTThe Company’s Directors and management are committed to conducting the business of the Group’s business in an ethical manner and in accordance with the highest standards of corporate governance. The Company has adopted and substantially complies with the ASX Corporate Governance Principles and Recommendations (Third Edition) (Recommendations) to the extent appropriate to the size and nature of the Group’s operations.
The Company has prepared a statement which sets out the corporate governance practices that were in operation throughout the financial year for the Company, identifies any Recommendations that have not been followed, and provides reasons for not following such Recommendations (Corporate Governance Statement).
In accordance with ASX Listing Rules 4.10.3 and 4.7.4, the Corporate Governance Statement will be available for review on the Company’s website (www.nonib.com.au), and will be lodged together with an Appendix 4G with ASX at the same time that this Annual Report is lodged with ASX.
The Appendix 4G will particularise each Recommendation that needs to be reported against by the Company, and will provide shareholders with information as to where relevant governance disclosures can be found.
The Company’s corporate governance policies and charters are all available on its website www.nonib.com.au.
NUMBER OF HOLDERS As at the Reporting Date, the number of holders in each class of equity securities:
Class of Equity SecuritiesNumber of
holdersNumber of
shares on issue
Fully paid ordinary shares 881 96,336,245
VOTING RIGHTS OR EQUITY SECURITIESThe only class of equity securities on issue in the Company are ordinary shares.
At a general meeting of the Company, every holder of ordinary shares present in person or by proxy, attorney or representative has one vote on a show of hands and on a poll, one vote for each ordinary share held. On a poll, every member (or his or her proxy, attorney or representative) is entitled to vote for each fully paid share held and in respect of each partly paid share, is entitled to a fraction of a vote equivalent to the proportion which the amount paid up (not credited) on that partly paid share bears to the total amounts paid and payable (excluding amounts credited) on that share. Amounts paid in advance of a call are ignored when calculating the proportion.
DISTRIBUTION OF HOLDERS OF EQUITY SECURITIESThe distribution of holders of equity securities on issue in the Company as at the Reporting date is as follows:
Distribution of ordinary shareholdings Holders Total units %
Size of Holding
1 – 1,000 217 100,886 0.10
1,001 – 5,000 323 889,218 0.92
5,001 – 10,000 143 1,065,775 1.11
10,001 – 100,000 157 4,171,502 4.33
100,001 and over 41 90,108,864 93.54
Total number of shares 881 96,336,245 100.00
LESS THAN MARKETABLE PARCELS OF ORDINARY SHARES (UMP SHARES)The number of holders of less than a marketable parcel of ordinary shares based on the closing market price at the Reporting date is as follows:
Total shares UMP shares UMP holders
% of issued shares held by UMP holders
96,336,245 1,345 49 0.001396
68 We put the customer at the heart of everything we do.

ADDITIONAL INFORMATION
SUBSTANTIAL HOLDERSAs at the Reporting Date, the names of the substantial holders of the Company and the number of equity securities in which those substantial holders and their associates have a relevant interest, as disclosed in substantial holding notices given to the Company, are as follows:
Holder of Equity SecuritiesNumber of Equity
Securities held% of total issued
securities
Alceon Group Pty Limited 34,821,570 36.15
LHC Capital Partners Pty Ltd 10,910,954 11.33
Wilson Asset Management 7,920,153 8.22
Cadence Asset Management 6,537,779 6.79
TWENTY LARGEST SHAREHOLDERSThe Company only has one class of quoted securities, being ordinary shares. The names of the 20 largest holders of ordinary shares, and the number of ordinary shares and percentage of capital held by each holder is as follows:
Holder Name
Ordinary shares
Number held% of total
shares issued
HSBC Custody Nominees (Australia) Limited 15,304,752 15.89
Alceon Group Pty Ltd 12,353,308 12.82
Alceon Group Pty Ltd 11,601,027 12.04
Alceon Group Pty Ltd 8,379,980 8.70
UBS Nominees Pty Ltd 8,075,559 8.38
J P Morgan Nominees Australia Limited 7,931,823 8.23
HSBC Custody Nominees (Australia) Limited 3,464,064 3.60
Mr. Scott Graham Evans 3,418,862 3.55
National Nominees Limited 2,507,435 2.60
Alceon Group Pty Ltd 2,487,255 2.58
BNP Paribas Nominees Pty Ltd 1,867,360 1.94
Vacuna Nominees Pty Ltd 1,800,000 1.87
Citicorp Nominees Pty Limited 1,523,572 1.58
Morphet Investments Pty Ltd 1,448,392 1.50
Mrs. Simone Robyn Evans 1,184,313 1.23
Fitzroy Super Pty Ltd 1,012,392 1.05
AMP Life Limited 699,221 0.73
Aust Executor Trustees Ltd 523,980 0.54
Mr. Luke Anthony Softa 500,000 0.52
Moat Investments Pty Ltd 338,131 0.35
Total 86,421,426 89.71
OTHER INFORMATIONOn 17 November 2017, the Company announced that it intended to conduct an on-market buy-back program up to the maximum aggregate amount of $5 million between 2 December 2017 and 30 November 2018. The maximum number of shares which the Company is permitted to acquire is 7,728,441 shares.
There are no issues of securities approved for the purposes of item 7 of section 611 of the Corporations Act which have not yet been completed.
No securities were purchased on-market during the reporting period under or for the purposes of an employee incentive scheme or to satisfy the entitlements of the holders of options or other rights to acquire securities granted under an employee incentive scheme.
NONI B GROUP ANNUAL REPORT 2018 69

CORPORATE DIRECTORY
DIRECTORS Richard Facioni Scott Evans David Wilshire Sue Morphet
COMPANY SECRETARYLuke Softa
NOTICE OF ANNUAL GENERAL MEETING The Annual General Meeting of Noni B Limited will be held at:
Museum of SydneyCnr of Phillip Street and Bridge StreetWarrane TheatreSydney, NSW 2000Date: Thursday 22nd November 2018
REGISTERED OFFICENoni B Limited
Ground Floor, 61 Dunning AvenueRosebery NSW 2018
Telephone: (02) 8577 7777Facsimile: (02) 8577 7887
ABN: 96 003 321 579
SHARE REGISTERComputershare Registry Services Pty LimitedLevel 5, 115 Grenfell StreetAdelaide SA 5000
Telephone: 1300 556 161
AUDITORBDO East Coast Partnership (“BDO”)1 Margaret StreetSydney NSW 2000
BANKERS ANZ242 Pitt StreetSydney NSW 2000
STOCK EXCHANGE LISTINGNoni B Limited shares are listed on the Australian Securities Exchange
ASX Code: NBL
WEBSITEwww.nonib.com.au
CORPORATE GOVERNANCE STATEMENT www.nonib.com.au/nonibgroup/corporate-governance
70 We put the customer at the heart of everything we do.


We put the customer at the heart of everything we do.