We Feel Fine and Searching the Emotional Web
11
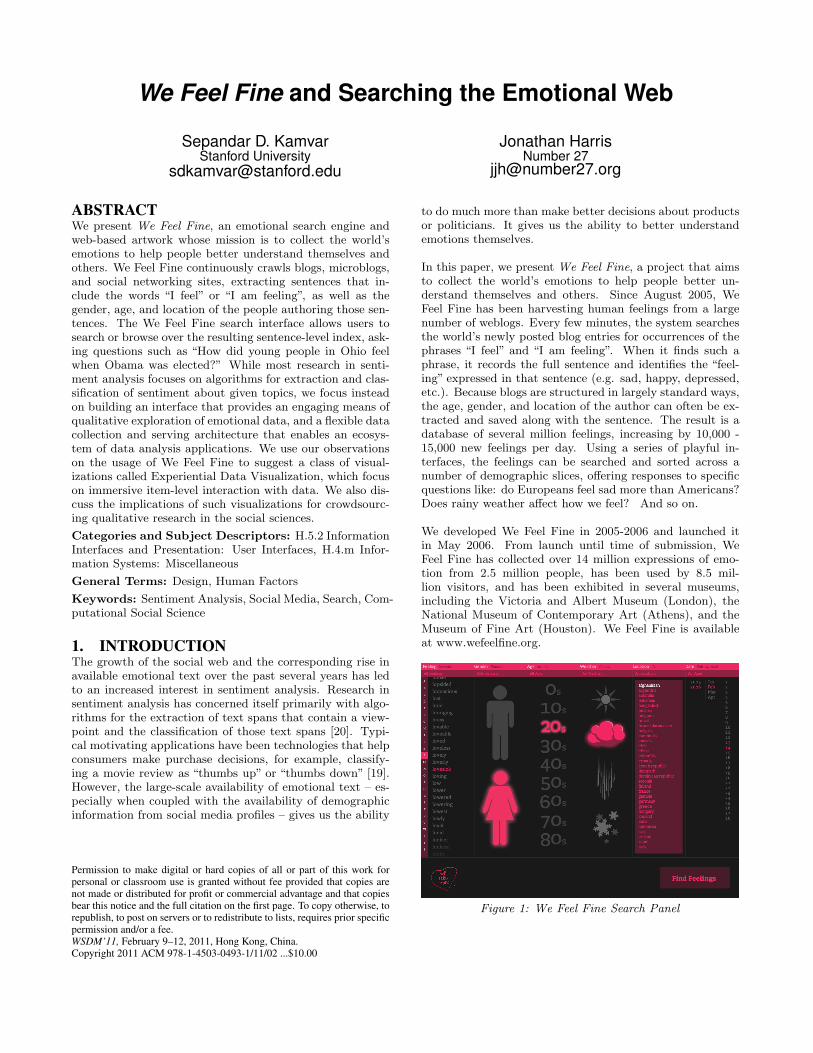
We Feel Fine and Searching the Emotional Web Sepandar D. Kamvar Stanford University [email protected] Jonathan Harris Number 27 [email protected] ABSTRACT We present We Feel Fine, an emotional search engine and web-based artwork whose mission is to collect the world’s emotions to help people better understand themselves and others. We Feel Fine continuously crawls blogs, microblogs, and social networking sites, extracting sentences that in- clude the words “I feel” or “I am feeling”, as well as the gender, age, and location of the people authoring those sen- tences. The We Feel Fine search interface allows users to search or browse over the resulting sentence-level index, ask- ing questions such as “How did young people in Ohio feel when Obama was elected?” While most research in senti- ment analysis focuses on algorithms for extraction and clas- sification of sentiment about given topics, we focus instead on building an interface that provides an engaging means of qualitative exploration of emotional data, and a flexible data collection and serving architecture that enables an ecosys- tem of data analysis applications. We use our observations on the usage of We Feel Fine to suggest a class of visual- izations called Experiential Data Visualization, which focus on immersive item-level interaction with data. We also dis- cuss the implications of such visualizations for crowdsourc- ing qualitative research in the social sciences. Categories and Subject Descriptors: H.5.2 Information Interfaces and Presentation: User Interfaces, H.4.m Infor- mation Systems: Miscellaneous General Terms: Design, Human Factors Keywords: Sentiment Analysis, Social Media, Search, Com- putational Social Science 1. INTRODUCTION The growth of the social web and the corresponding rise in available emotional text over the past several years has led to an increased interest in sentiment analysis. Research in sentiment analysis has concerned itself primarily with algo- rithms for the extraction of text spans that contain a view- point and the classification of those text spans [20]. Typi- cal motivating applications have been technologies that help consumers make purchase decisions, for example, classify- ing a movie review as “thumbs up” or “thumbs down” [19]. However, the large-scale availability of emotional text – es- pecially when coupled with the availability of demographic information from social media profiles – gives us the ability Permission to make digital or hard copies of all or part of this work for personal or classroom use is granted without fee provided that copies are not made or distributed for profit or commercial advantage and that copies bear this notice and the full citation on the first page. To copy otherwise, to republish, to post on servers or to redistribute to lists, requires prior specific permission and/or a fee. WSDM’11, February 9–12, 2011, Hong Kong, China. Copyright 2011 ACM 978-1-4503-0493-1/11/02 ...$10.00 to do much more than make better decisions about products or politicians. It gives us the ability to better understand emotions themselves. In this paper, we present We Feel Fine, a project that aims to collect the world’s emotions to help people better un- derstand themselves and others. Since August 2005, We Feel Fine has been harvesting human feelings from a large number of weblogs. Every few minutes, the system searches the world’s newly posted blog entries for occurrences of the phrases “I feel” and “I am feeling”. When it finds such a phrase, it records the full sentence and identifies the “feel- ing” expressed in that sentence (e.g. sad, happy, depressed, etc.). Because blogs are structured in largely standard ways, the age, gender, and location of the author can often be ex- tracted and saved along with the sentence. The result is a database of several million feelings, increasing by 10,000 - 15,000 new feelings per day. Using a series of playful in- terfaces, the feelings can be searched and sorted across a number of demographic slices, offering responses to specific questions like: do Europeans feel sad more than Americans? Does rainy weather affect how we feel? And so on. We developed We Feel Fine in 2005-2006 and launched it in May 2006. From launch until time of submission, We Feel Fine has collected over 14 million expressions of emo- tion from 2.5 million people, has been used by 8.5 mil- lion visitors, and has been exhibited in several museums, including the Victoria and Albert Museum (London), the National Museum of Contemporary Art (Athens), and the Museum of Fine Art (Houston). We Feel Fine is available at www.wefeelfine.org. Figure 1: We Feel Fine Search Panel
Transcript of We Feel Fine and Searching the Emotional Web
We Feel Fine and Searching the Emotional Web
Sepandar D. KamvarStanford University
Jonathan HarrisNumber 27
ABSTRACTWe present We Feel Fine, an emotional search engine andweb-based artwork whose mission is to collect the world’semotions to help people better understand themselves andothers. We Feel Fine continuously crawls blogs, microblogs,and social networking sites, extracting sentences that in-clude the words “I feel” or “I am feeling”, as well as thegender, age, and location of the people authoring those sen-tences. The We Feel Fine search interface allows users tosearch or browse over the resulting sentence-level index, ask-ing questions such as “How did young people in Ohio feelwhen Obama was elected?” While most research in senti-ment analysis focuses on algorithms for extraction and clas-sification of sentiment about given topics, we focus insteadon building an interface that provides an engaging means ofqualitative exploration of emotional data, and a flexible datacollection and serving architecture that enables an ecosys-tem of data analysis applications. We use our observationson the usage of We Feel Fine to suggest a class of visual-izations called Experiential Data Visualization, which focuson immersive item-level interaction with data. We also dis-cuss the implications of such visualizations for crowdsourc-ing qualitative research in the social sciences.
Categories and Subject Descriptors: H.5.2 InformationInterfaces and Presentation: User Interfaces, H.4.m Infor-mation Systems: Miscellaneous
General Terms: Design, Human Factors
Keywords: Sentiment Analysis, Social Media, Search, Com-putational Social Science
1. INTRODUCTIONThe growth of the social web and the corresponding rise inavailable emotional text over the past several years has ledto an increased interest in sentiment analysis. Research insentiment analysis has concerned itself primarily with algo-rithms for the extraction of text spans that contain a view-point and the classification of those text spans [20]. Typi-cal motivating applications have been technologies that helpconsumers make purchase decisions, for example, classify-ing a movie review as “thumbs up” or “thumbs down” [19].However, the large-scale availability of emotional text – es-pecially when coupled with the availability of demographicinformation from social media profiles – gives us the ability
Permission to make digital or hard copies of all or part of this work forpersonal or classroom use is granted without fee provided that copies arenot made or distributed for profit or commercial advantage and that copiesbear this notice and the full citation on the first page. To copy otherwise, torepublish, to post on servers or to redistribute to lists, requires prior specificpermission and/or a fee.WSDM’11, February 9–12, 2011, Hong Kong, China.Copyright 2011 ACM 978-1-4503-0493-1/11/02 ...$10.00
to do much more than make better decisions about productsor politicians. It gives us the ability to better understandemotions themselves.
In this paper, we present We Feel Fine, a project that aimsto collect the world’s emotions to help people better un-derstand themselves and others. Since August 2005, WeFeel Fine has been harvesting human feelings from a largenumber of weblogs. Every few minutes, the system searchesthe world’s newly posted blog entries for occurrences of thephrases “I feel” and “I am feeling”. When it finds such aphrase, it records the full sentence and identifies the “feel-ing” expressed in that sentence (e.g. sad, happy, depressed,etc.). Because blogs are structured in largely standard ways,the age, gender, and location of the author can often be ex-tracted and saved along with the sentence. The result is adatabase of several million feelings, increasing by 10,000 -15,000 new feelings per day. Using a series of playful in-terfaces, the feelings can be searched and sorted across anumber of demographic slices, offering responses to specificquestions like: do Europeans feel sad more than Americans?Does rainy weather affect how we feel? And so on.
We developed We Feel Fine in 2005-2006 and launched itin May 2006. From launch until time of submission, WeFeel Fine has collected over 14 million expressions of emo-tion from 2.5 million people, has been used by 8.5 mil-lion visitors, and has been exhibited in several museums,including the Victoria and Albert Museum (London), theNational Museum of Contemporary Art (Athens), and theMuseum of Fine Art (Houston). We Feel Fine is availableat www.wefeelfine.org.
Figure 1: We Feel Fine Search Panel
2. DESIGN CONSIDERATIONSOur goal with with We Feel Fine was to enable both a quali-tative and statistical exploration of other people’s emotions.Our belief was that statistical analyses would support a cog-nitive understanding of emotional patterns, while immersiveinteraction with individual stories would support a more vis-ceral understanding of the nature of emotions. This lat-ter focus on intuitive understanding through qualitative ex-ploration is a markedly different approach from most workin sentiment analysis, which largely focuses on algorithmicanalysis of sentiment text around a given topic.
We found that creating an immersive means of interactingwith individual data items directly affected the end user inline with our mission of helping people to understand them-selves and others. Further, the qualitative and statisticalexploration of data that is personal and universal appealedto a broad set of users, enabling crowdsourced data anal-ysis. We discuss these effects in Section 6; in this sectionwe discuss the principles that engendered these effects. Weconsidered the following principles in our design:
1. Sentence-level analysis. The basic atom of the in-formational web is the web page, so it is natural for in-formational search engines to analyze and return pages.On the social web, the basic unit is often much shorter– the post or tweet or short social network message.Further, people often express emotions at the sentence-level; rarely is an entire document about a single emo-tion. For these reasons, we use sentences rather thanweb pages as the canonical “documents” in the searchengine.
2. Indexing context. Through public profiles and times-tamps, there is much useful context to an emotion out-side of the words in the expression itself, for example,the time of the emotion, or the location, gender, andage of the person expressing the emotion. Appropriateindex and interface design enable users to ask ques-tions like: “how do women feel right now?” or “howdid people in the U.S. feel on September 11th?”
3. Sentiment as the primary organizing principle.Most sentiment analysis search engines aim to under-stand more about certain topics by exploring the pre-vailing emotions around those topics. With We FeelFine, the primary aim is to understand more aboutemotions themselves. As such, we focus on sentimentas the primary organizing principle. This dictates awide range of design decisions. For example, we use afaceted search interface that focuses on emotions andpeople rather than a free-form search box, and we in-dex a wide range of emotions rather than simply clas-sifying emotions as positive or negative.
4. De-emphasizing ranking. While factual informa-tion can be ranked by validity or authority of the source,it is much more difficult to rank sentiment. In keepingwith the old adage “feelings are never wrong”, thou-sands of different expressions can be equally reason-able responses for a query like “how do you feel aboutgoing to college?” For this reason we don’t introducethe notion of ranking in We Feel Fine.
5. Emphasizing browsing and summarization. Ratherthan ranking expressions of emotion, we prefer to to
summarize them — allowing the user to quickly get thegestalt of how a population feels. Further, since userscan gain intuition through qualitative exploration of apopulation, we aim to provide easy browsing as well.
6. Enabling the user to easily shift between macroand micro. In the last bullet, we emphasized theability to see data at the macro-level (summarization)and the micro-level (browsing). It’s also important toallow the user to easily shift between the two. In shift-ing from micro to macro, the user can better under-stand trends exposed through summarization. And inshifting from micro to macro, the user can generalizeintuitions gained from browsing. Where possible, wewish to create graphs from individual clickable atomsof data (macro to micro transition). And we wish tolabel items of data with search terms, allowing the userto easily summarize or see more data of that type (mi-cro to macro transition).
7. Visualizations that reflect the data. The interfaceshould be functional, but not cold — after all, this isa search engine about emotions. An ideal UI shouldreflect the subject matter, and in this case, we craftedthe elements of the visualization to have human qual-ities to reflect the people they represent.
8. Direct Access to the Data. We recognize the valueof We Feel Fine’s underlying data for social scientists,particularly those interested in large-scale studies ofemotion. We also recognize the difficulty in designingan interface that is intended to be both an artwork anda scientific tool. It is with this in mind that we builta data API for direct data access.
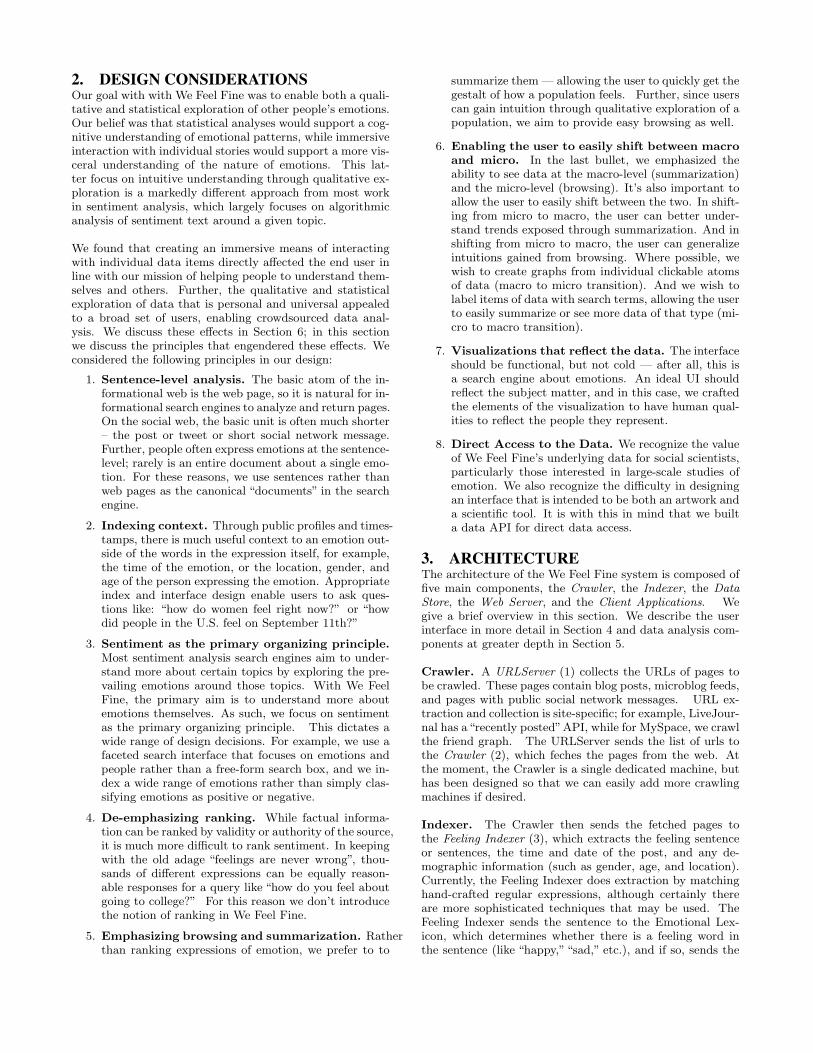
3. ARCHITECTUREThe architecture of the We Feel Fine system is composed offive main components, the Crawler, the Indexer, the DataStore, the Web Server, and the Client Applications. Wegive a brief overview in this section. We describe the userinterface in more detail in Section 4 and data analysis com-ponents at greater depth in Section 5.
Crawler. A URLServer (1) collects the URLs of pages tobe crawled. These pages contain blog posts, microblog feeds,and pages with public social network messages. URL ex-traction and collection is site-specific; for example, LiveJour-nal has a“recently posted”API, while for MySpace, we crawlthe friend graph. The URLServer sends the list of urls tothe Crawler (2), which feches the pages from the web. Atthe moment, the Crawler is a single dedicated machine, buthas been designed so that we can easily add more crawlingmachines if desired.
Indexer. The Crawler then sends the fetched pages tothe Feeling Indexer (3), which extracts the feeling sentenceor sentences, the time and date of the post, and any de-mographic information (such as gender, age, and location).Currently, the Feeling Indexer does extraction by matchinghand-crafted regular expressions, although certainly thereare more sophisticated techniques that may be used. TheFeeling Indexer sends the sentence to the Emotional Lex-icon, which determines whether there is a feeling word inthe sentence (like “happy,”“sad,” etc.), and if so, sends the
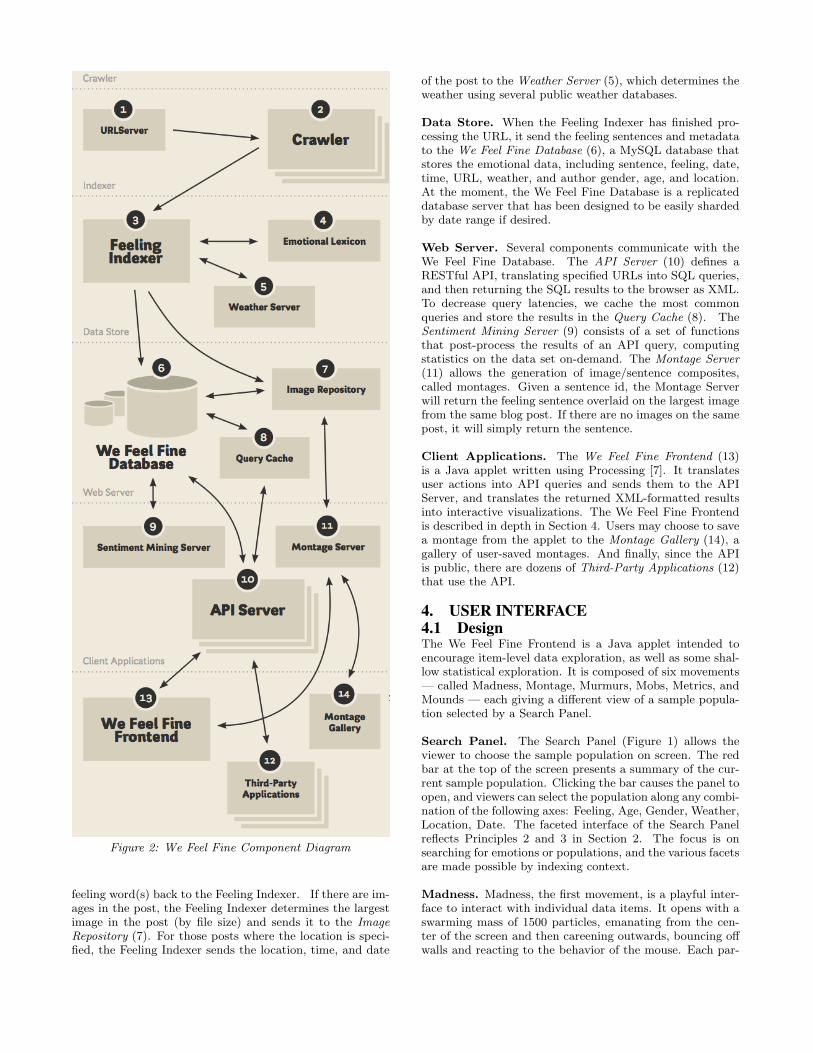
Figure 2: We Feel Fine Component Diagram
feeling word(s) back to the Feeling Indexer. If there are im-ages in the post, the Feeling Indexer determines the largestimage in the post (by file size) and sends it to the ImageRepository (7). For those posts where the location is speci-fied, the Feeling Indexer sends the location, time, and date
of the post to the Weather Server (5), which determines theweather using several public weather databases.
Data Store. When the Feeling Indexer has finished pro-cessing the URL, it send the feeling sentences and metadatato the We Feel Fine Database (6), a MySQL database thatstores the emotional data, including sentence, feeling, date,time, URL, weather, and author gender, age, and location.At the moment, the We Feel Fine Database is a replicateddatabase server that has been designed to be easily shardedby date range if desired.
Web Server. Several components communicate with theWe Feel Fine Database. The API Server (10) defines aRESTful API, translating specified URLs into SQL queries,and then returning the SQL results to the browser as XML.To decrease query latencies, we cache the most commonqueries and store the results in the Query Cache (8). TheSentiment Mining Server (9) consists of a set of functionsthat post-process the results of an API query, computingstatistics on the data set on-demand. The Montage Server(11) allows the generation of image/sentence composites,called montages. Given a sentence id, the Montage Serverwill return the feeling sentence overlaid on the largest imagefrom the same blog post. If there are no images on the samepost, it will simply return the sentence.
Client Applications. The We Feel Fine Frontend (13)is a Java applet written using Processing [7]. It translatesuser actions into API queries and sends them to the APIServer, and translates the returned XML-formatted resultsinto interactive visualizations. The We Feel Fine Frontendis described in depth in Section 4. Users may choose to savea montage from the applet to the Montage Gallery (14), agallery of user-saved montages. And finally, since the APIis public, there are dozens of Third-Party Applications (12)that use the API.
4. USER INTERFACE4.1 DesignThe We Feel Fine Frontend is a Java applet intended toencourage item-level data exploration, as well as some shal-low statistical exploration. It is composed of six movements— called Madness, Montage, Murmurs, Mobs, Metrics, andMounds — each giving a different view of a sample popula-tion selected by a Search Panel.
Search Panel. The Search Panel (Figure 1) allows theviewer to choose the sample population on screen. The redbar at the top of the screen presents a summary of the cur-rent sample population. Clicking the bar causes the panel toopen, and viewers can select the population along any combi-nation of the following axes: Feeling, Age, Gender, Weather,Location, Date. The faceted interface of the Search Panelreflects Principles 2 and 3 in Section 2. The focus is onsearching for emotions or populations, and the various facetsare made possible by indexing context.
Madness. Madness, the first movement, is a playful inter-face to interact with individual data items. It opens with aswarming mass of 1500 particles, emanating from the cen-ter of the screen and then careening outwards, bouncing offwalls and reacting to the behavior of the mouse. Each par-
ticle represents a single feeling. The color of each particlecorresponds to the tone of the feeling inside — happy feelingsare bright yellow, angry feelings are red, and so on. Anyparticle can be clicked at any time, revealing the sentenceinside (along with the photo if there as one) and informationabout the sentence’s author. As the particles move aroundthe screen, they lose speed and eventually freeze as they ap-proach the mouse cursor, allowing them to be clicked. As theparticles approach the bottom left corner of the screen, theybecome attracted to it and swarm around it, drawing theeye to a menu that gives access to the other five movementsof We Feel Fine.
The design of the Madness movement was motivated byPrinciple 7 in Section 2. The tiny colorful particles rep-resent a bird’s eye view of humanity — like standing atopa skyscraper and looking down at the street. People bus-tle to and fro, darting in and out of shops, hailing taxis,falling in love, laughing, handling personal crises. From theskyscraper, the notion of individuality is hard to recognize.However, once a particle is clicked, it explodes into its con-stituent letters, which form its sentence, and that particlebecomes the center of attention. At this moment, the viewersees the open sentence as the only one that matters.
Figure 3: Madness
Murmurs. Murmurs presents a structured environment inwhich to view feelings. As this movement begins, every par-ticle on screen gently floats upwards, eventually bouncing offthe ceiling several times before settling. Then, one by one,the particles drop from the ceiling to join a simple scrollinglist of feelings, organized in reverse chronological order. Thesentences appear letter by letter, as if being typed by theirauthor, and fade to black as new sentences appear. Thestrict formal constraints of Murmurs help to emphasize thepolarities in the types of feelings present in the world. Someare mundane, some are funny, some are poignant. As theymarch along, the feelings begin to strike a common chord.
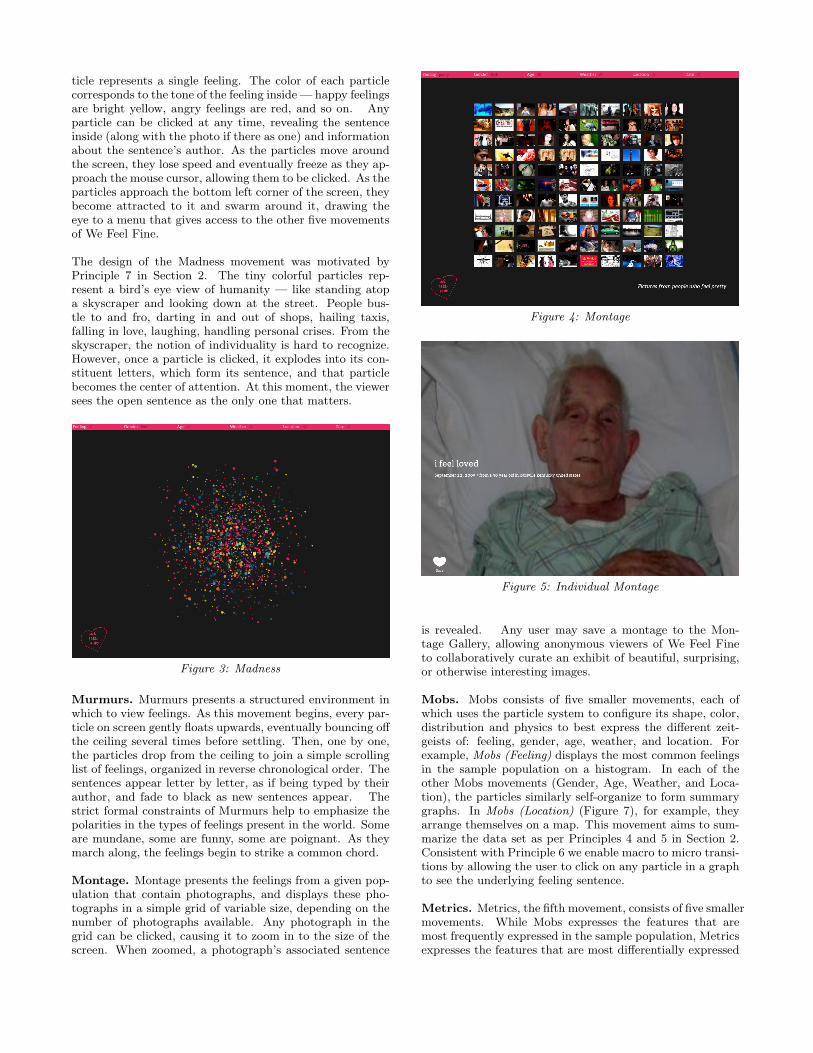
Montage. Montage presents the feelings from a given pop-ulation that contain photographs, and displays these pho-tographs in a simple grid of variable size, depending on thenumber of photographs available. Any photograph in thegrid can be clicked, causing it to zoom in to the size of thescreen. When zoomed, a photograph’s associated sentence
Figure 4: Montage
Figure 5: Individual Montage
is revealed. Any user may save a montage to the Mon-tage Gallery, allowing anonymous viewers of We Feel Fineto collaboratively curate an exhibit of beautiful, surprising,or otherwise interesting images.
Mobs. Mobs consists of five smaller movements, each ofwhich uses the particle system to configure its shape, color,distribution and physics to best express the different zeit-geists of: feeling, gender, age, weather, and location. Forexample, Mobs (Feeling) displays the most common feelingsin the sample population on a histogram. In each of theother Mobs movements (Gender, Age, Weather, and Loca-tion), the particles similarly self-organize to form summarygraphs. In Mobs (Location) (Figure 7), for example, theyarrange themselves on a map. This movement aims to sum-marize the data set as per Principles 4 and 5 in Section 2.Consistent with Principle 6 we enable macro to micro transi-tions by allowing the user to click on any particle in a graphto see the underlying feeling sentence.
Metrics. Metrics, the fifth movement, consists of five smallermovements. While Mobs expresses the features that aremost frequently expressed in the sample population, Metricsexpresses the features that are most differentially expressed
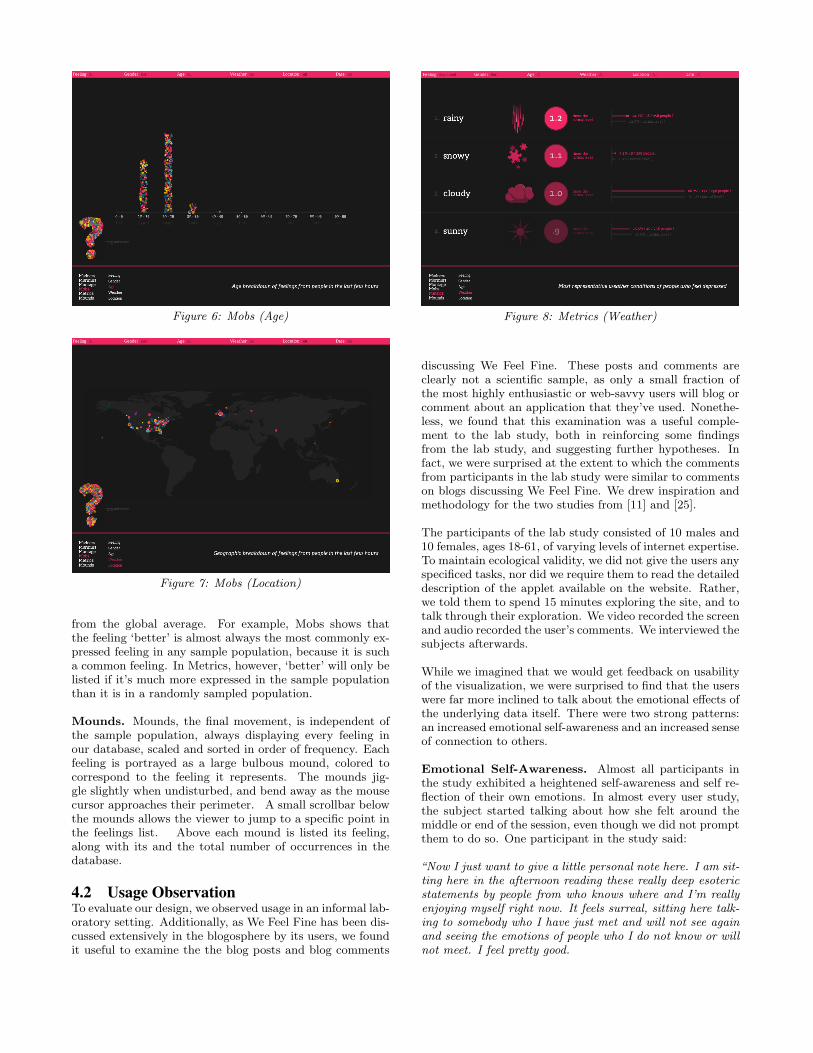
Figure 6: Mobs (Age)
Figure 7: Mobs (Location)
from the global average. For example, Mobs shows thatthe feeling ‘better’ is almost always the most commonly ex-pressed feeling in any sample population, because it is sucha common feeling. In Metrics, however, ‘better’ will only belisted if it’s much more expressed in the sample populationthan it is in a randomly sampled population.
Mounds. Mounds, the final movement, is independent ofthe sample population, always displaying every feeling inour database, scaled and sorted in order of frequency. Eachfeeling is portrayed as a large bulbous mound, colored tocorrespond to the feeling it represents. The mounds jig-gle slightly when undisturbed, and bend away as the mousecursor approaches their perimeter. A small scrollbar belowthe mounds allows the viewer to jump to a specific point inthe feelings list. Above each mound is listed its feeling,along with its and the total number of occurrences in thedatabase.
4.2 Usage ObservationTo evaluate our design, we observed usage in an informal lab-oratory setting. Additionally, as We Feel Fine has been dis-cussed extensively in the blogosphere by its users, we foundit useful to examine the the blog posts and blog comments
Figure 8: Metrics (Weather)
discussing We Feel Fine. These posts and comments areclearly not a scientific sample, as only a small fraction ofthe most highly enthusiastic or web-savvy users will blog orcomment about an application that they’ve used. Nonethe-less, we found that this examination was a useful comple-ment to the lab study, both in reinforcing some findingsfrom the lab study, and suggesting further hypotheses. Infact, we were surprised at the extent to which the commentsfrom participants in the lab study were similar to commentson blogs discussing We Feel Fine. We drew inspiration andmethodology for the two studies from [11] and [25].
The participants of the lab study consisted of 10 males and10 females, ages 18-61, of varying levels of internet expertise.To maintain ecological validity, we did not give the users anyspecificed tasks, nor did we require them to read the detaileddescription of the applet available on the website. Rather,we told them to spend 15 minutes exploring the site, and totalk through their exploration. We video recorded the screenand audio recorded the user’s comments. We interviewed thesubjects afterwards.
While we imagined that we would get feedback on usabilityof the visualization, we were surprised to find that the userswere far more inclined to talk about the emotional effects ofthe underlying data itself. There were two strong patterns:an increased emotional self-awareness and an increased senseof connection to others.
Emotional Self-Awareness. Almost all participants inthe study exhibited a heightened self-awareness and self re-flection of their own emotions. In almost every user study,the subject started talking about how she felt around themiddle or end of the session, even though we did not promptthem to do so. One participant in the study said:
“Now I just want to give a little personal note here. I am sit-ting here in the afternoon reading these really deep esotericstatements by people from who knows where and I’m reallyenjoying myself right now. It feels surreal, sitting here talk-ing to somebody who I have just met and will not see againand seeing the emotions of people who I do not know or willnot meet. I feel pretty good.
(a) (b)
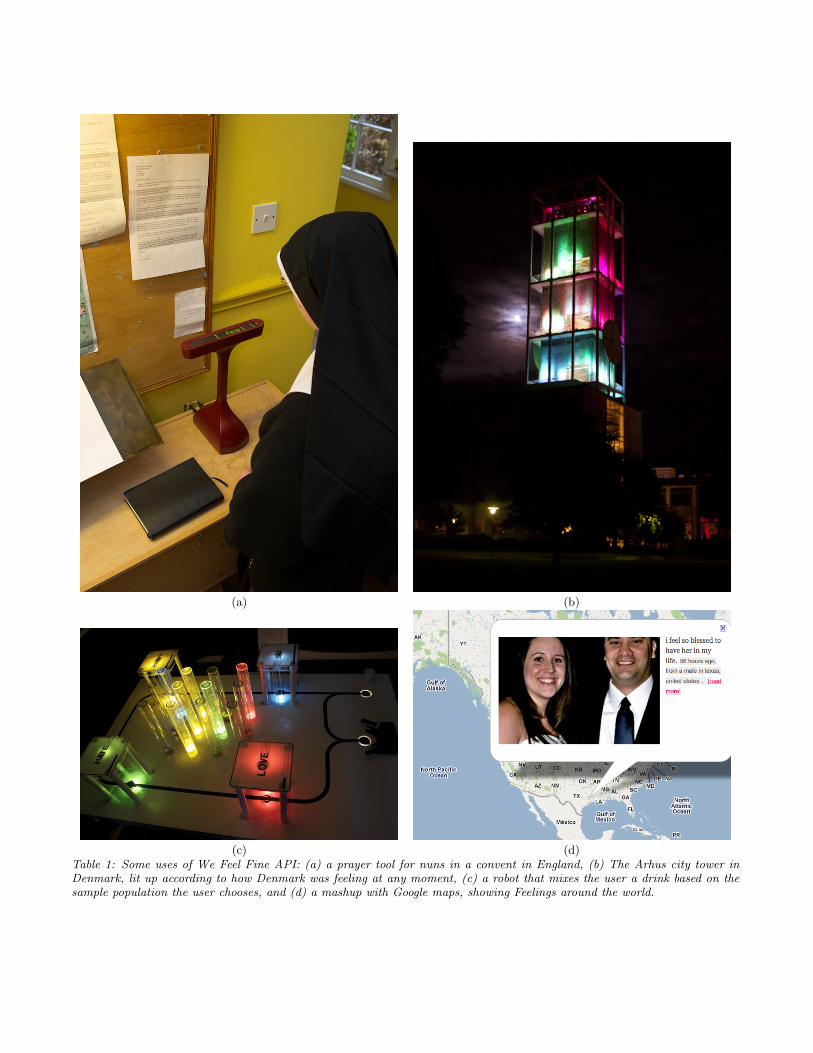
(c) (d)Table 1: Some uses of We Feel Fine API: (a) a prayer tool for nuns in a convent in England, (b) The Arhus city tower inDenmark, lit up according to how Denmark was feeling at any moment, (c) a robot that mixes the user a drink based on thesample population the user chooses, and (d) a mashup with Google maps, showing Feelings around the world.

This heightened emotional self-awareness was echoed in theblogs that discussed We Feel Fine. It was very commonfor a blog post describing We Feel Fine to end with howthe blogger was feeling (and many of them emphasized thewords “I feel”). For example:
I feel happy, tired, and lucky to have such great friends (on-line and offline).
Interestingly, the commenters on these blog posts would alsooften chime in with how they were feeling, resulting in astream of feelings in the comments section. Many par-ticipants in the study also noticed that their own emotionsmirrored those of the people in the piece:
“I searched the word ‘abhorrent’ and I actually felt a lit-tle of what the bloggers were feeling. I felt I needed to getto a different (non-negative) feeling soon after reading thesentences. And, of course, I felt fat (which I am) when Isearched for that feeling. This is very interesting to me.”
Empathy. In addition to self-awareness, the participantsalso reported a feeling of connection and empathy. In manyof the sessions, the subjects talked back to a feeling sentencein the applet as if it were the person:
Applet: “I feel like I’m way too abrasive or mean to people.”Participant: “Well, that’s very honest of you.”
In the interviews afterwards, several participants expressedfeeling “empathetic,” “close,” “more connected,” and “lesslonely”. One participant noted:
“I could see myself using this to find people who are feelingbad and try to cheer them up.”
And many participants and bloggers commented that theyproject their own experience on to the emotions that theysee. One blogger noted:
“While using We Feel Fine, I see the words ‘I feel scared be-cause...’ and I immediately recall what that feels like. Sud-denly my experience becomes much more personal and I feelconnected with a person I have never met. I then observethousands of other dots like it and my thoughts are bouncingbetween this micro and macro level of connectivity.”
Study participants and bloggers described feeling a sense ofconnection and belonging to the world around them.
“It is comforting if you are feeling down to search by ‘sad’ or‘sorry’, and see millions of others who share your sentiment.You feel less alone and the world seems smaller.”
“I feel that witnessing everyone’s feelings of failure and suc-cess gives me a keen sense of belonging in the world.”
Perhaps as a result of both the feelings of self-awarenessand connection, several people in the study expressed feelingcalm, relaxed, or grounded after their exploration. Somedescribe an increased ability to manage their own emotions.One study participant noted:
“I feel much more relaxed right now than I have certainlytoday and probably all week. I feel like I can take a breathand look outside and actually enjoy the rain. A little whileago it was just annoying me, because it meant I had to docleanup in the yard and all the other things that responsibilityentails in instead of enjoying what’s going on in the worldand smelling the roses.”
5. APIWhile the We Feel Fine frontend gives the user a qualita-tive view of emotions (along with some shallow statistics),large-scale quantitative analysis of the data requires differ-ent tools. To support such statistical analyses, we built theWe Feel Fine API and Sentiment Mining Server.
5.1 DesignWe Feel Fine’s API consists of two components: a REST-ful API that returns data given a query, and a SentimentMining Server that computes basic statistics over an APIquery. The API is an RESTful API that translates a url toa SQL query on the We Feel Fine database, and returns theresults in XML, HTML, CSV, or plain text. A user mayquery by feeling, gender, agerange, weather conditions, lo-cation, and date. The API returns the feeling sentence andany additional information requested by the user. The APIis open and documented at http://wefeelfine.org/api.html.The Sentiment Mining Server consists of a set of functionsthat postprocess an API query to compute elementary statis-tics on the data set. It includes functions that:
• return the feeling frequency histogram for a given query
• return the word frequency histogram for a given query
• give the demographic breakdown for feelings expressedby a given query
• give a time breakdown for feelings expressed by a givenquery (by date, month, year, and day-of-week)
• categorize feelings into the eight principle emotions asdescribed in Plutchik [21].
• categorize feelings into positive or negative
• scores sentences for valence, arousal, and dominancebased on the ANEW [1] scoring system.
• compare any of the above functions to a reference query,so that, for example, the user can see if a certain feelingis overexpressed as compared to average.
What is remarkable about the We Feel Fine data servinginfrastructure is how expressive it is given its simplicity.The data collected by We Feel Fine uses regular expressionmatching for information extraction rather than more so-phisticated extraction methods [20, 16]. And the statisticaltools provided by the Sentiment Mining Server give only fre-quencies and hand-assigned categorizations. Nevertheless,the API and Sentiment Mining Server support a wide arrayof uses, and We Feel Fine has been surprisingly accurateboth in replicating existing results in the psychology litera-ture [12] and in suggesting new hypotheses that have thenbeen confirmed by controlled lab experiments [17]. Someexamples use cases are described below.
5.2 Usage ObservationThe Meaning of Happiness. The study by Mogilner et al. [17]on the “meaning” of happiness is one of the most interesting

examples of how We Feel Fine works in tandem with tradi-tional experimental methods in emotions research. TheWe Feel Fine data showed that the co-occurrence of excitedfeelings and happy feelings decrease as people grow older,while the co-occurrence of peaceful feelings and happy feel-ings increase. This was tested by a controlled lab experimentwhere a group of subjects were influenced to feel excited orpeaceful, and then measured for their happiness levels after-wards. In the lab study, younger people felt happier wheninfluenced to feel excited, while older people felt happierwhen influenced to feel peaceful [17].
Hedonometer. Dodds and Danforth [4] have built a “hedo-nometer”based on We Feel Fine data and the ANEW scoringsystem [1], computing a happiness score for any population.Using this hedonometer, they measured happiness levels inthe United States over time, and correlated it with the hap-piness measures from song lyrics and presidential addresses.
The Emotions of Aging. One of the most pronounced re-sults to come from our own study of this data set was howpeople’s emotions vary with age [12]. Figure 9 shows thatpeople express considerably less anger, disgust, and sadnessas they get older. This is consistent with the psychologyliterature [15], but allows for greater granularity in deter-mining, for example, what kinds of sadness decrease most.
Time-series Analyses. Figure 10 shows several time-basedanalyses of emotions [12]. When Obama was elected onNovember 4th, 2008, there was a spike in the feeling “proud”— it was the proudest day on record since we started col-lecting emotions in 2005. There were also spikes in “excited”and “hopeful” and a smaller spike in “depressed.” On Valen-tine’s Day, we see a recurring spike in people feeling “loved”and“special”, and also a spike in people feeling“lonely.” Wealso see a marked difference in stress between the week andweekend, and happiness expressed in the morning vs. night.
The Emotional Graph. Figure 11 shows emotions that arefrequently co-expressed in the same sentence [12]. It showsthat there are strong relationships between anger and de-pression, disgust and shame, and happiness and gratitude.Moreover, it shows that broadly, positive feelings tend tonot co-occur often with negative feelings, with a few ex-ceptions. While there exist studies that show connectionsbetween anger and depression [18] and gratitude and happi-ness [24], this graph suggests links that are less well-studied,such as pride and shame.
Artistic Purposes. The API has been also used widely forartistic and emotional purposes. For example, Gaver etal. [8] designed a “Prayer Companion” as a resource for thespiritual activities of a group of cloistered nuns in NorthernEngland. Podenphant [22] created an installation in whichhe lit up the historic Arhus, Denmark city hall tower ac-cording to how people were feeling at any time in Denmark.And Molenaar and Grob created a robot that mixes a drinkfor a user based on the feelings returned by the user’s WeFeel Fine Query.
6. DISCUSSIONPerhaps the most interesting contribution of We Feel Fineis in its focus on engaging the user at an emotional level.
Figure 10: Time Series Analyses
While we chose to do so because it seemed appropriate in atool intended to study emotions, it has had a couple of un-intended and broad-reaching consequences. First, it showedthat exposition of data can confer non-cognitive benefits,suggesting new areas for data visualization. Second, theemotional effect of the visualization led to broad and ex-tensive usage that effectively involved millions of people insmall-scale qualitative research on emotion. Both of thesemerit further discussion.
6.1 Experiential Data VisualizationOur aim for We Feel Fine was to collect the world’s emotionsto help people better understand themselves and others. Itappears to have succeeded in this aim in a surprising way.While data visualization has been defined as a tool to am-plify cognition [2], the primary responses in the user studywere affective. Indeed, cultivating emotional self-awareness
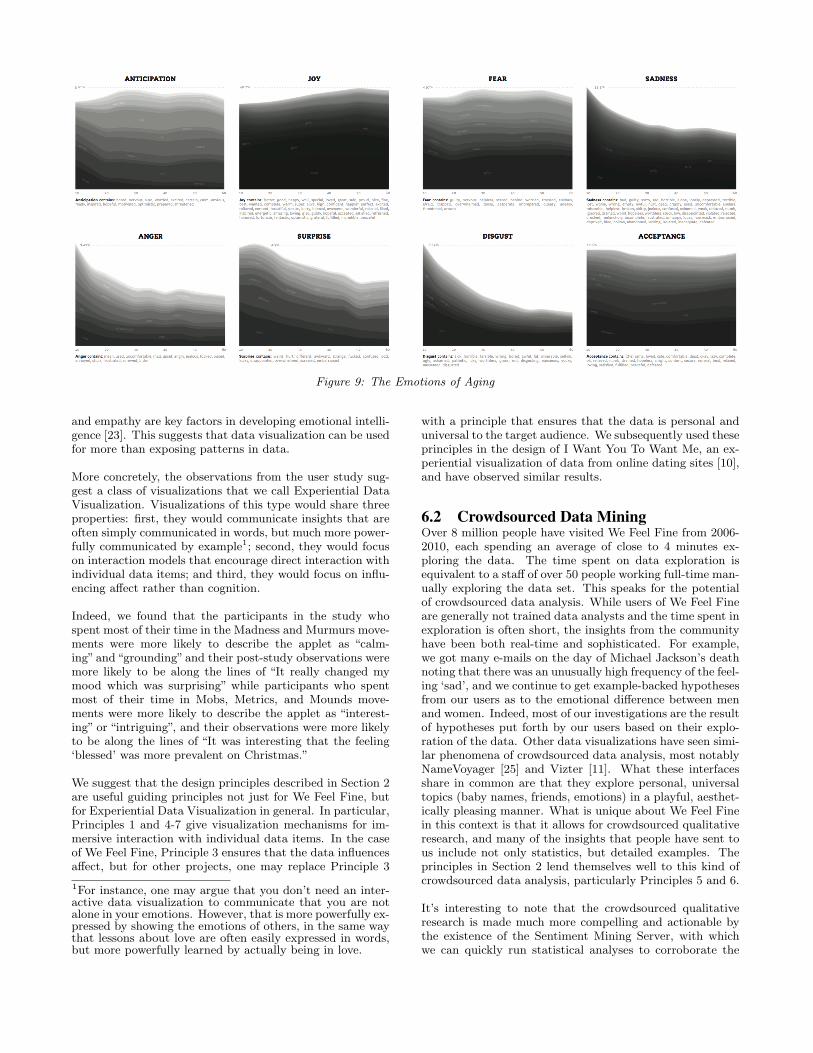
Figure 9: The Emotions of Aging
and empathy are key factors in developing emotional intelli-gence [23]. This suggests that data visualization can be usedfor more than exposing patterns in data.
More concretely, the observations from the user study sug-gest a class of visualizations that we call Experiential DataVisualization. Visualizations of this type would share threeproperties: first, they would communicate insights that areoften simply communicated in words, but much more power-fully communicated by example1; second, they would focuson interaction models that encourage direct interaction withindividual data items; and third, they would focus on influ-encing affect rather than cognition.
Indeed, we found that the participants in the study whospent most of their time in the Madness and Murmurs move-ments were more likely to describe the applet as “calm-ing”and“grounding”and their post-study observations weremore likely to be along the lines of “It really changed mymood which was surprising” while participants who spentmost of their time in Mobs, Metrics, and Mounds move-ments were more likely to describe the applet as “interest-ing” or “intriguing”, and their observations were more likelyto be along the lines of “It was interesting that the feeling‘blessed’ was more prevalent on Christmas.”
We suggest that the design principles described in Section 2are useful guiding principles not just for We Feel Fine, butfor Experiential Data Visualization in general. In particular,Principles 1 and 4-7 give visualization mechanisms for im-mersive interaction with individual data items. In the caseof We Feel Fine, Principle 3 ensures that the data influencesaffect, but for other projects, one may replace Principle 3
1For instance, one may argue that you don’t need an inter-active data visualization to communicate that you are notalone in your emotions. However, that is more powerfully ex-pressed by showing the emotions of others, in the same waythat lessons about love are often easily expressed in words,but more powerfully learned by actually being in love.
with a principle that ensures that the data is personal anduniversal to the target audience. We subsequently used theseprinciples in the design of I Want You To Want Me, an ex-periential visualization of data from online dating sites [10],and have observed similar results.
6.2 Crowdsourced Data MiningOver 8 million people have visited We Feel Fine from 2006-2010, each spending an average of close to 4 minutes ex-ploring the data. The time spent on data exploration isequivalent to a staff of over 50 people working full-time man-ually exploring the data set. This speaks for the potentialof crowdsourced data analysis. While users of We Feel Fineare generally not trained data analysts and the time spent inexploration is often short, the insights from the communityhave been both real-time and sophisticated. For example,we got many e-mails on the day of Michael Jackson’s deathnoting that there was an unusually high frequency of the feel-ing ‘sad’, and we continue to get example-backed hypothesesfrom our users as to the emotional difference between menand women. Indeed, most of our investigations are the resultof hypotheses put forth by our users based on their explo-ration of the data. Other data visualizations have seen simi-lar phenomena of crowdsourced data analysis, most notablyNameVoyager [25] and Vizter [11]. What these interfacesshare in common are that they explore personal, universaltopics (baby names, friends, emotions) in a playful, aesthet-ically pleasing manner. What is unique about We Feel Finein this context is that it allows for crowdsourced qualitativeresearch, and many of the insights that people have sent tous include not only statistics, but detailed examples. Theprinciples in Section 2 lend themselves well to this kind ofcrowdsourced data analysis, particularly Principles 5 and 6.
It’s interesting to note that the crowdsourced qualitativeresearch is made much more compelling and actionable bythe existence of the Sentiment Mining Server, with whichwe can quickly run statistical analyses to corroborate the

crowdsourced hypotheses. Aggregating, communicating,and corroborating the insights of the crowd more seamlesslyis an area of future work and has been explored in a differentcontext in [25].
6.3 Related WorkSentiment Analysis. There is a large body of work in sen-timent analysis; an extensive review of such work is givenin [20]. Research in this area has focused largely on algo-rithms for opinion extraction and categorization. This is notthe focus of this paper, and We Feel Fine uses deliberatelysimple methods for extraction and categorization. The con-tribution of this work to the sentiment analysis literaturelies instead in outlining systems architecture and interfacedesign principles for a sentiment analysis search engine, inshowing some non-cognitive effects of item-level explorationof sentiment data, and in introducing the idea of crowd-sourced sentiment mining.
Computational Social Psychology. Computational tech-niques for large-scale data-driven experiments in psychologyare a fairly new development [13]. Pennebaker et al. haveperformed linguistic analysis on blogs to study personalityand mood, for example, before and after 9/11 [3]. Chris-takis and Fowler have studied the spread of many emotionsover social networks, as in [6]. While much of the existingliterature is focused on specific scientific findings by com-putational means, in this work we are more concerned withdeveloping a robust experimental infrastructure for use byothers. We believe that well-designed computational infras-tructure to perform large-scale association experiments willhave a similar effect on the social sciences as the microar-ray [5] has had on the biological sciences. In this case, ratherthan looking at gene expression levels in tissue samples, welook at emotional expression levels in population samples.
Data Visualization. We Feel Fine was inspired in part byListening Post [9], an installation piece that culls text frag-ments from online chat rooms in real time and displays themon a grid of several hundred electronic screens. There existother engaging artistic representations of human communi-cation data as well, as well: The Dumpster [14] visualizesexpressions of breaking up from blogs. I Want You To WantMe [10] crawls online dating sites for sentences that startwith “I am” and “I am looking for” as well as other snip-pets. The contribution of this work is in defining a classof visualizations called Experiential Data Visualization, andsuggesting design principles for such visualizations.
7. CONCLUSIONTo date, most research in sentiment analysis has been fo-cused on algorithms to extract, classify, and summarize sen-timent. While this has clearly been useful, there remainsa broad opportunity for researchers to build immersive in-terfaces that allow for item-level exploration of sentimentdata. This item-level exploration of data can bring its ownexperiential benefits to the user, as well as enable crowd-sourced qualitative data analysis. Further, while traditionalmotivating applications for sentiment analysis have been inconsumer research and decision-support tools, available sen-timent data on the web can be used to build scalable compu-tational tools to support social science research. Such toolshave the potential to make a significant impact, allowing
for social science researchers to run inexpensive large-scalestudies to generate data-driven hypotheses. We present WeFeel Fine as an exploration of these opportunities.
AcknowledgementsWe’d like to thank Susan Dumais, Martin Wattenberg, andMor Naaman for their extensive comments on drafts of thispaper.
8. REFERENCES[1] M. M. Bradley and P. Lang. Affective norms for English
words. University of Florida Technical Report, 1999.[2] S. Card, J. Mackinlay, and B. Shneiderman. Readings in
Information Visualization. Morgan Kaufman, SanFrancisco, 1999.
[3] M. Cohn, M. Mehl, and J. Pennebaker. Linguistic markersof psychological change surrounding September 11, 2001.Psychological Science, 15(10):687–693, 2004.
[4] P. Dodds and C. Danforth. Measuring the happiness oflarge-scale written expression: songs, blogs, and presidents.Journal of Happiness Studies, 2009.
[5] S. Fodor et al. Light-directed, spatially addressable parallelchemical synthesis. Science, 1991.
[6] J. Fowler and N. Christakis. Dynamic spread of happinessin a large social network. British Medical Journal, 3, 2008.
[7] B. Fry and C. Reas. Processing. MIT Press, Cambridge,2007.
[8] W. Gaver et al. The prayer companion. In CHI, 2010.[9] M. Hansen and B. Rubin. Listening post. Whitney Museum
of American Art, 2003.[10] J. Harris and S. D. Kamvar. I want you to want me.
Museum of Modern Art, 2008.[11] J. Heer and D. Boyd. Vizster: Visualizing online social
networks. In INFOVIS, 2005.[12] S. D. Kamvar and J. Harris. We Feel Fine: An Almanac of
Human Emotion. Scribner, New York, 2009.[13] D. Lazer et al. Computational social science. Science,
323(5915):721–723, 2009.[14] G. Levin and K. Nigam. The dumpster. Whitney Museum
of American Art, 2006.[15] M. Lewis and J. Haviland-Jones. Handbook of Emotions,
Third Edition. Guilford Press, New York, 2008.[16] A. McCallum, D. Freitag, and F. C. N. Pereira. Maximum
entropy markov models for information extraction andsegmentation. In ICML, 2000.
[17] C. Mogilner, S. D. Kamvar, and J. Aaker. How the meaningof happiness shifts across the life course. SocialPsychological and Personality Science, 2010.
[18] J. Mook et al. Anxiety, anger and depression: Relationshipsat the trait level. Anxiety, Stress, and Coping, 3(1):17–31,1990.
[19] B. Pang and L. Lee. A sentimental education: sentimentanalysis using subjectivity summarization based onminimum cuts. In ACL, 2004.
[20] B. Pang and L. Lee. Opinion mining and sentimentanalysis. Found. Trends Inf. Retr., 2(1-2):1–135, 2008.
[21] R. Plutchik. The emotions: facts, theories, and a newmodel. Random House, New York, 1962.
[22] K. Podenphant. I am feeling. 2009.
[23] P. Salovey and J. Mayer. Emotional intelligence.Imagination, Cognition, and Personality, 9:185–211, 1990.
[24] P. Watkings et al. Gratitude and happiness: Developmentof a measure of gratitude, and relationships with subjectivewell-being. Social Behavior and Personality, 31(5):431–451,2003.
[25] M. Wattenberg and J. Kriss. Designing for social dataanalysis. IEEE Transactions on Visualization andComputer Graphics, 12(4):549–557, 2006.

Figure 11: The Emotional Graph