We care - Ontex · in 2014 is due to building Ontex and retailer brands which are ... Chairman’s...
108
Annual Review 2014 We care
Transcript of We care - Ontex · in 2014 is due to building Ontex and retailer brands which are ... Chairman’s...

Annual Review 2014
We care
Ontex Annual Review
2014
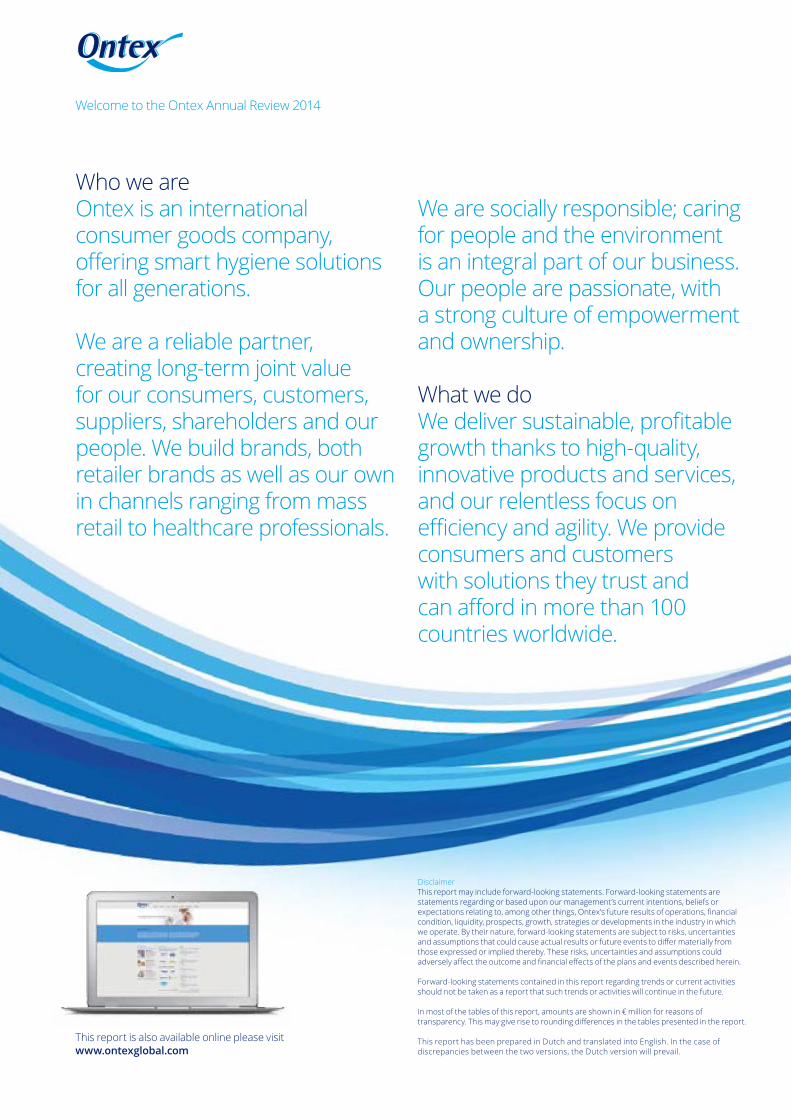
Who we areOntex is an international consumer goods company, offering smart hygiene solutions for all generations.
We are a reliable partner, creating long-term joint value for our consumers, customers, suppliers, shareholders and our people. We build brands, both retailer brands as well as our own in channels ranging from mass retail to healthcare professionals.
We are socially responsible; caring for people and the environment is an integral part of our business. Our people are passionate, with a strong culture of empowerment and ownership.
What we doWe deliver sustainable, profitable growth thanks to high-quality, innovative products and services, and our relentless focus on efficiency and agility. We provide consumers and customers with solutions they trust and can afford in more than 100 countries worldwide.
This report is also available online please visit www.ontexglobal.com
DisclaimerThis report may include forward-looking statements. Forward-looking statements are statements regarding or based upon our management’s current intentions, beliefs or expectations relating to, among other things, Ontex’s future results of operations, financial condition, liquidity, prospects, growth, strategies or developments in the industry in which we operate. By their nature, forward-looking statements are subject to risks, uncertainties and assumptions that could cause actual results or future events to differ materially from those expressed or implied thereby. These risks, uncertainties and assumptions could adversely affect the outcome and financial effects of the plans and events described herein.
Forward-looking statements contained in this report regarding trends or current activities should not be taken as a report that such trends or activities will continue in the future.
In most of the tables of this report, amounts are shown in € million for reasons of transparency. This may give rise to rounding differences in the tables presented in the report.
This report has been prepared in Dutch and translated into English. In the case of discrepancies between the two versions, the Dutch version will prevail.
Welcome to the Ontex Annual Review 2014
Contents
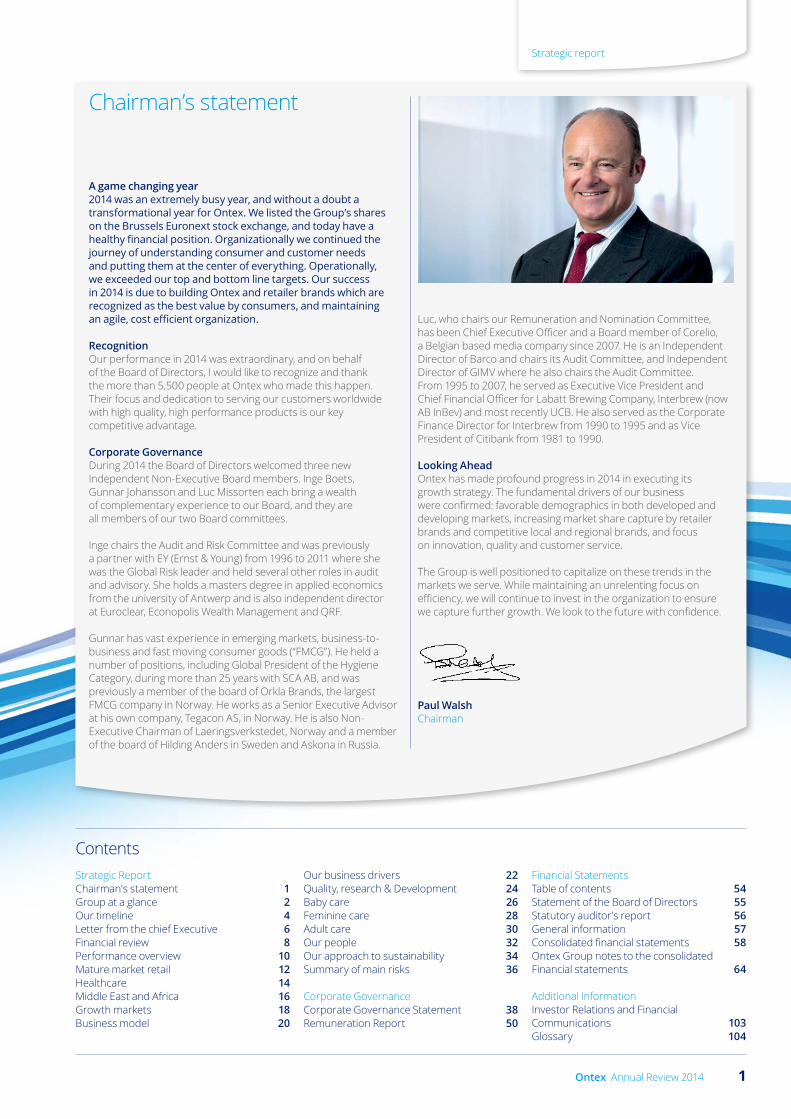
A game changing year2014 was an extremely busy year, and without a doubt a transformational year for Ontex. We listed the Group’s shares on the Brussels Euronext stock exchange, and today have a healthy financial position. Organizationally we continued the journey of understanding consumer and customer needs and putting them at the center of everything. Operationally, we exceeded our top and bottom line targets. Our success in 2014 is due to building Ontex and retailer brands which are recognized as the best value by consumers, and maintaining an agile, cost efficient organization.
RecognitionOur performance in 2014 was extraordinary, and on behalf of the Board of Directors, I would like to recognize and thank the more than 5,500 people at Ontex who made this happen. Their focus and dedication to serving our customers worldwide with high quality, high performance products is our key competitive advantage.
Corporate GovernanceDuring 2014 the Board of Directors welcomed three new Independent Non-Executive Board members. Inge Boets, Gunnar Johansson and Luc Missorten each bring a wealth of complementary experience to our Board, and they are all members of our two Board committees.
Inge chairs the Audit and Risk Committee and was previously a partner with EY (Ernst & Young) from 1996 to 2011 where she was the Global Risk leader and held several other roles in audit and advisory. She holds a masters degree in applied economics from the university of Antwerp and is also independent director at Euroclear, Econopolis Wealth Management and QRF.
Gunnar has vast experience in emerging markets, business-to-business and fast moving consumer goods (“FMCG”). He held a number of positions, including Global President of the Hygiene Category, during more than 25 years with SCA AB, and was previously a member of the board of Orkla Brands, the largest FMCG company in Norway. He works as a Senior Executive Advisor at his own company, Tegacon AS, in Norway. He is also Non-Executive Chairman of Laeringsverkstedet, Norway and a member of the board of Hilding Anders in Sweden and Askona in Russia.
Chairman’s statement
Luc, who chairs our Remuneration and Nomination Committee, has been Chief Executive Officer and a Board member of Corelio, a Belgian based media company since 2007. He is an Independent Director of Barco and chairs its Audit Committee, and Independent Director of GIMV where he also chairs the Audit Committee. From 1995 to 2007, he served as Executive Vice President and Chief Financial Officer for Labatt Brewing Company, Interbrew (now AB InBev) and most recently UCB. He also served as the Corporate Finance Director for Interbrew from 1990 to 1995 and as Vice President of Citibank from 1981 to 1990.
Looking AheadOntex has made profound progress in 2014 in executing its growth strategy. The fundamental drivers of our business were confirmed: favorable demographics in both developed and developing markets, increasing market share capture by retailer brands and competitive local and regional brands, and focus on innovation, quality and customer service.
The Group is well positioned to capitalize on these trends in the markets we serve. While maintaining an unrelenting focus on efficiency, we will continue to invest in the organization to ensure we capture further growth. We look to the future with confidence.
Paul WalshChairman
Strategic ReportChairman's statement 1Group at a glance 2Our timeline 4Letter from the chief Executive 6Financial review 8Performance overview 10Mature market retail 12Healthcare 14Middle East and Africa 16Growth markets 18Business model 20
Our business drivers 22Quality, research & Development 24Baby care 26Feminine care 28Adult care 30Our people 32Our approach to sustainability 34Summary of main risks 36
Corporate GovernanceCorporate Governance Statement 38Remuneration Report 50
Financial StatementsTable of contents 54Statement of the Board of Directors 55Statutory auditor's report 56General information 57Consolidated financial statements 58Ontex Group notes to the consolidated Financial statements 64
Additional InformationInvestor Relations and Financial Communications 103Glossary 104
1Ontex Annual Review 2014
Strategic report

Group at a glance A growing international business
We make, sell and distribute our products in more than 100 countries through leading retailer brands, as well as under our own brands. Our 15 manufacturing sites are strategically placed across Europe, North Africa and Asia Pacific, with four specialized R&D centers offering continuous innovation to our consumers and customers.
One international business with sales in more than 100 countries
15 production facilities
23 sales and marketing sites
5,500 employees
€1.6 billion in sales in over 100 countries
A strong and diversified business
Baby Care 52% Adult Care 34% Femcare 13%
Retailer Brands 63% Ontex Brands 37%
UK 17% France 14% Italy 11% Other Western European countries 27% MEA & RoW 18% Eastern Europe 13%
Largest customer 7% 2nd to 10th largest customers 31%
All other customers 62%
Focused on 3 attractive categories…
…in diverse markets…
…offering quality Retailer and Ontex brands…
...for a diversified blue chip customer base
Key Ontex locations Sales office (11) Production facility (3)
Sales office/Production facility (12)
Category split excludes 1% of “Other”
Charts based upon 2014 revenue
2 Ontex Annual Review 2014
Strategic report

Our products – performance at the right price
Baby Care Feminine Care Adult Care
We develop feminine care products such as sanitary pads, panty liners and tampons. We introduce new products in response to market insights, ensuring comfort and confidence for women.
We provide baby care products, such as diapers, baby pants and wet wipes. Panel tests, lab tests and independent reviews regularly confirm the focus on quality, innovation and performance of our products.
Our adult care products, mainly distributed through healthcare providers but increasingly through retail, are disposable devices designed to manage light, moderate and heavy incontinence. We constantly combine new technology, and consumer and customer feedback to ensure our products provide high protection, are comfortable and easy to use.
Mature Market Retail focuses on retailer-branded baby care, feminine care and adult care products through strong relationships with established international and national retailers in Western Europe, Poland and Australia.
●● Growing retailer brand share●● Partnership model with leading retailers●● Ageing population●● High product adoption rate
●● Strong Ontex brands recognition and market positions●● Favorable population growth and product adoption rate trends●● Fragmented retail and distribution network●● Low retailer brand penetration
Our Divisions – winning by adapting our strategy
Mature Market Retail
Middle East and Africa
Our Growth Markets Division serves markets defined by high growth rate areas with a mix of traditional and modern retail. Depending on how developed the retail trade is in a particular geography, we sell either retailer brands, or Ontex brands to national and international retailers, as well as through distributors. This Division covers Russia and a diverse range of countries, mainly in Central and Eastern Europe but also in the rest of the world.
●● Growing adoption rates for hygienic disposables●● Growing share of retailer brands from a low base●● Strategy adaptable to maturity of retailer brands
Growth Markets
Our Healthcare Division supplies mainly Ontex-branded adult incontinence products mostly through institutional channels. Our commercial approach is tailored in each country to the specific needs according to the local re-imbursement system. Our customers are mainly in Western Europe, and include government healthcare organizations, local authorities, insurers, hospitals and nursing homes; we also ship directly to consumers through home delivery.
●● Demand driven by a growing ageing population●● Trend towards direct consumer purchase●● Distribution driven by national healthcare payment systems●● Close Ontex relationships with healthcare professionals and institutions
Healthcare
Our Middle East and Africa Division markets Ontex branded products in Turkey, Algeria, Pakistan (where we have production facilities), as well as Morocco and other countries in the region. The retail trade is highly fragmented, with a large number of smaller independent stores and a limited number of international retailers, which we supply through distributors and wholesalers.
3Ontex Annual Review 2014
Strategic report

1993Opening of production facility in Czech Republic
Our timelineFrom family business to an international market player
ONTEX began 35 years ago as a family company in Belgium. Since then, it has grown into an international business, with 15 manufacturing facilities in 12 countries – in Western & Eastern Europe, Middle East, North Africa, Australia, and China – with more than 5,500 employees across the globe by the end of 2014.
2000Acquired distribution and production facility in Turkey, including Canbebe and Canped brands
1979The beginning of Ontex in Buggenhout, Belgium
1981Launch panty liners 1984
Launch disposable diapers
1993 – 2000Acquired several distribution and production facilities in Europe (Spain, Belgium, Germany, France)
2000 – 2003New acquistions in Germany and France
1980Launch first product range – underpads– for care institutions in Belgium
1983Launch incontinence products
4 Ontex Annual Review 2014
Strategic report

2008Opening of production facility in Algeria
2010New acquistions in Germany
2011New acquistion in France
2011Opening of production facility in Sydney, Australia
2013Opening of production facility in Karachi Pakistan
2006Opening of production facility in China
2011Opening of production facility in Noginsk, Russia
2014 Ontex company listed at Euronext
2013Acquired Serenity including Ortona plant in Italy
5Ontex Annual Review 2014
Strategic report

Letter from the Chief Executive OfficerPositioned for sustainable, profitable growth
Purpose From a family company, Ontex has grown into an international business. To do so, we leverage our expertise and focus on flexibility and scale, innovation and quality, making us a competitive force in delivering high-performance, best-value personal hygiene solutions to our partners and consumers. Our success and our people are inspired by our vision, and driven by our mission.
Vision To be a leading international personal hygiene partner, providing smart personal hygiene solutions for all generations.
Mission To constantly deliver high-quality, innovative, smart personal hygiene solutions to improve people’s lives across the world. We care for our employees and the environment, while creating value for our customers and for our shareholders
2014 was an exceptional year for Ontex.”
Looking back over the year, I am proud of what we have achieved:
●● we delivered another year of strong growth, outperforming market trends;
●● we transformed our financial structure through a successful IPO and refinancing; and
●● we reshaped and strengthened the organization to support our strategic growth plans.
Ontex is a growth company, as demonstrated by the doubling of our sales revenue over the past ten years, with a compound annual growth rate of 7%. Nearly five percentage points have been organic growth, and two percentage points have come from carefully chosen acquisitions. A uniquely positioned company focused on the hygienic disposables market, we are diversified by region, by product and by channel, which builds resilience into our business model. We aim to achieve sustainable, profitable growth. Our ambition is to continue delivering organic top line growth of 4% to 6% a year, based on estimated market growth of 3% to 4% annually, with continued EBITDA margin expansion.
6 Ontex Annual Review 2014
Strategic report

Outstanding performanceIn 2014, on the back of a strong 2013, we delivered very good growth and significantly outperformed our markets.
●● We won market share and grew revenue in Western Europe retail, as well as in countries such as Turkey, Morocco, Pakistan and Russia.
●● We drove productivity improvements, enabling us to mitigate raw material and foreign exchange headwinds, reflecting our agility and flexibility.
●● We leveraged our innovation capability, a key driver of growth, profit and differentiation for Ontex. Among many examples of innovation in 2014 we rolled out our Flexfit product, a high performing, thin baby diaper providing perfect dryness and more comfort for active babies.
●● We continued to build on the momentum created in 2013. We seized the opportunity created by the withdrawal of a major competitor from the Western European baby diapers market. Our flexible, entrepreneurial approach allowed us to rapidly mobilize our organization to support our retail customers.
Establishing a new platform for growth2014 was also a significant year as we completely transformed our financial structure through a successful IPO and a subsequent refinancing.
The IPO in June was a milestone for Ontex, which not only helped to reduce our debt, but significantly improved our profile towards customers, suppliers and employees.
In November 2014 we saw an opportunity to bring forward our refinancing plans to take advantage of the low cost of debt. Our debt funding costs fell significantly and this stronger financial position is reflected in our rating with the credit agencies.
This means we start 2015 with a clean slate and in a healthy financial position, allowing us to focus entirely on growth.
Focusing on consumers and customers2014 was also the year we transformed our Group from an R&D and manufacturing company operating in the consumer goods business, into a more consumer and customer-focused company. We put the consumer at the center of our organization and started building capabilities to strengthen our relationships with customers. In a tough competitive environment, our customers want our insight and understanding of consumer needs across our product categories. We deliver products that meet consumer expectations – combining performance and affordability, and anticipate new trends, fueling our future growth.
Reorganized to focus on our marketsOur new organizational structure allows us to be more focussed. We have evolved to four Divisions, each aiming to take advantage of different market opportunities. As a result the operating model and product mix varies across the Divisions:
Mature Markets focuses on large, sophisticated retailer groups who build their own strong brands to complete their product range. We are supporting them in order to achieve their objectives.
The Healthcare Division operates mainly via medical channels, institutional channels such as health systems, nursing homes and
also pharmacies, mostly with Ontex own brands. In these channels, service, product design and cost competitiveness are absolutely critical and Ontex flexibility and agility is praised by our customers.
The Middle East and Africa is a geographically organized Division where branded products and traditional distribution predominate. Here we sell Ontex brands in competition with international brands or local players.
Growth Markets focuses on markets where retailer groups are growing but not predominant. Here we are responsive to evolving market conditions, selling Ontex brands where retail brands are still under-developed due to the retail structure, and helping our customers build strong retailer brands as retail becomes more developed.
People and performance managementI believe that to be successful, a company must care for its people, invest in them, but also challenge them. As we grow, our people have an increasingly important part to play in realizing our ambitions. We empower them and recognize their performance against specific measures aligned with the company’s goals.
We are very fortunate that the Ontex culture, its DNA, is one of operational excellence. Our people are skilled, proud of their work, flexible and entrepreneurial. The people at Ontex were doing an outstanding job before I joined the company and they have continued to do so. Their commitment and expertise drive our strong performance.
An outlook based on positive trendsOur business is positioned to take advantage of positive trends in our markets, especially favorable demographics and increasing product adoption rates are key drivers of future growth. Additionally, spending patterns in Western Europe and other mature markets are changing, as consumers recognize more and more that retailer brands are a smart choice. Furthermore, as well as sourcing incontinence products through healthcare services, consumers are increasingly buying them through retail channels or home delivery. These are both areas in which we have expertise.
Finally, our disciplined approach to entering new territories is an effective model that we are continuing to roll out successfully. Our operational excellence, entrepreneurial spirit and ability to act with speed and agility is what we will continue to focus on.
We had an outstanding 2014, and we are looking to 2015 with a lot of excitement!
Charles BouazizChief Executive Officer
Our new organizational structure allows us to be more focused.”
7Ontex Annual Review 2014
Strategic report

Financial transformationFor Ontex, 2014 was a transformational year. We raised the profile of the company significantly, and built a solid financial foundation for our stated aim of profitable, sustainable growth.
This change in our status is a result of the IPO in June, but also of the refinancing in November. Before the IPO, at the end of 2013, we made sure that our strategic plan was well-defined and the whole company was aligned behind our strategic goals and forward financial planning. Our ‘equity story’ included goals that we believed were stretching but realistic.
Strengthened positionThe IPO was a major project led by a lean, hands-on Ontex Finance team supported by Legal and IT, who managed a number of external stakeholders such as bankers, lawyers and regulators. To complete it in four months was a remarkable achievement. The roadshows which followed the IPO went on to lay the foundations for our refinancing. This reduced our cost of debt from 8.1% to slightly above 3.5%, generating sizable savings in interest payments.
Post-IPO, we are naturally under more scrutiny than before, from analysts, investors and regulators; we present quarterly results, and we are benchmarked with our peers. We have continued to develop our financial processes, and strengthened our team, to engage proactively with our investors. Beyond the finance function, the IPO’s impact has been very motivational across the entire company.
Financial reviewSignificant progress in all areas
Financial highlights(€m unless otherwise specified) 2014 2013
Change(%)
Revenue 1,615.9 1,491.9 8.3Gross margin 446.7 397.1 12.5Adjusted EBITDA 196.1 173.6 13.0Adjusted Net Profit 64.9 41.2 57.5Adjusted Free Cash Flow 105.5 140.0 (24.6)Net debt 585.1 849.2 (31.1)Leverage (x) 2.98 4.89
●●Revenue at €1.6 billion, up 8.3% on a reported basis and 7.0% on a like-for-like (LFL) basis
●●Solid growth of Adjusted EBITDA by 13.0% to €196.1 million despite an adverse FX impact of €9.8 million, resulting in an Adjusted EBITDA margin expansion of 50 basis points to 12.1%
●●Adjusted Free Cash Flow below last year mainly due to rebuild of inventory in the first half of the year from low levels at the end of 2013, partly offset by higher EBITDA
●●Net Debt was €585.1 million as of December 31, 2014, leading to a net financial debt/LTM Adjusted EBITDA ratio of 2.98x
Definitions for financial terms can be found in the glossary.
8 Ontex Annual Review 2014
Strategic report

With the IPO we strengthen our presence and credibility, raising our profile with customers and opening up opportunities for increased partnership with suppliers. We have better access to capital markets to finance our growth, and received two-notch credit rating increases in a matter of months from two major rating agencies, which is an exceptional achievement. Our progress is reflected in our stock price, which has increased from €18 a share at the IPO to €23.72 on December 31, 2014.
A platform for growthOur new financial foundation provides the platform for our profitable, sustainable growth. We aim to increase the EBITDA margin steadily by 30 basis points a year. Cost of sales represents about 75% of our total sales, managing this effectively gives us the greatest scope to increase the margin. We create operational efficiencies in product design, waste management, logistics and raw materials usage through our culture of continuous improvement projects. R&D, manufacturing, supply chain and procurement all collaborate to increase our cost efficiency, never compromising on performance and quality. Our product innovation pipeline generates an improved sales mix. Our continuous investments in marketing, account management, consumer and shopper insights, and entering new markets, drive further revenues.
We diversified our sources of funding by moving with a combination of bank loans and bonds. So we have more financial flexibility to finance our growth.
Our engineering strength means that we can support our growth, needing capital investment of only 3%.
Our aim of organic revenue growth of 4% to 6%, combined with margin growth, will lead to strong value creation.
We have established a strong financial foundation – a virtuous circle which generates more cash every year for potential growth to fuel our future.
So, for sure, 2014 was a game-changing year for the company.
Jacques PurnodeChief Financial Officer
With the IPO we strengthen our presence and credibility... we have established a strong financial foundation.”
Revenue by Division €m
Mature Market Retail 56% Healthcare 26% MEA 12% Growth Markets 6%
2013
Net debt€m
20142013
585.1
849.2
20132014 2014
Leverage(x)
20142013
2.98
4.89
Revenue growth €m
20132012 2014
1,491.9
1,309.0
1,615.9
Definitions for financial terms can be found in the glossary.
9Ontex Annual Review 2014
Strategic report
Financial review
Gross Margin Gross margin amounted to €446.7 million for 2014, a 12.5% increase compared to 2013. As a percentage of sales, 2014 gross margin expanded to 27.6%, 102 basis points over last year. The gross margin improvements can be partly attributed to increased operating leverage due to top line growth, an incremental contribution in Q1 from the Serenity acquisition as well as efficiency programs.
Non-recurring revenue and expensesNon-recurring revenue and expenses were €56.3 million. The majority of the 2014 non-recurring expenses relates to the IPO from June, 2014 (€21.1 million recognized in the income statement) and the refinancing of existing debt in the last quarter of 2014 (€32.7 million recognized in the income statement).
Adjusted EBITDA2014 Adjusted EBITDA rose by 13.0% to €196.1 million. Growth for the full year was due to higher gross margins, while our main operating expenses increased broadly in line with revenue, reflecting the further strengthening of our organization as well as stronger geographical focus and increased functional support.
Foreign ExchangeThe impact of changes in foreign exchange rates on revenue for 2014 was negative, primarily in the first half of the year. This was mainly due to the negative evolution of the Turkish Lira, Russian Rouble and Australian Dollar versus the Euro, which was only partly compensated by a strengthening British Pound.
Changes in foreign exchange rates impacted Adjusted EBITDA negatively in 2014, due to the above mentioned currency fluctuations.
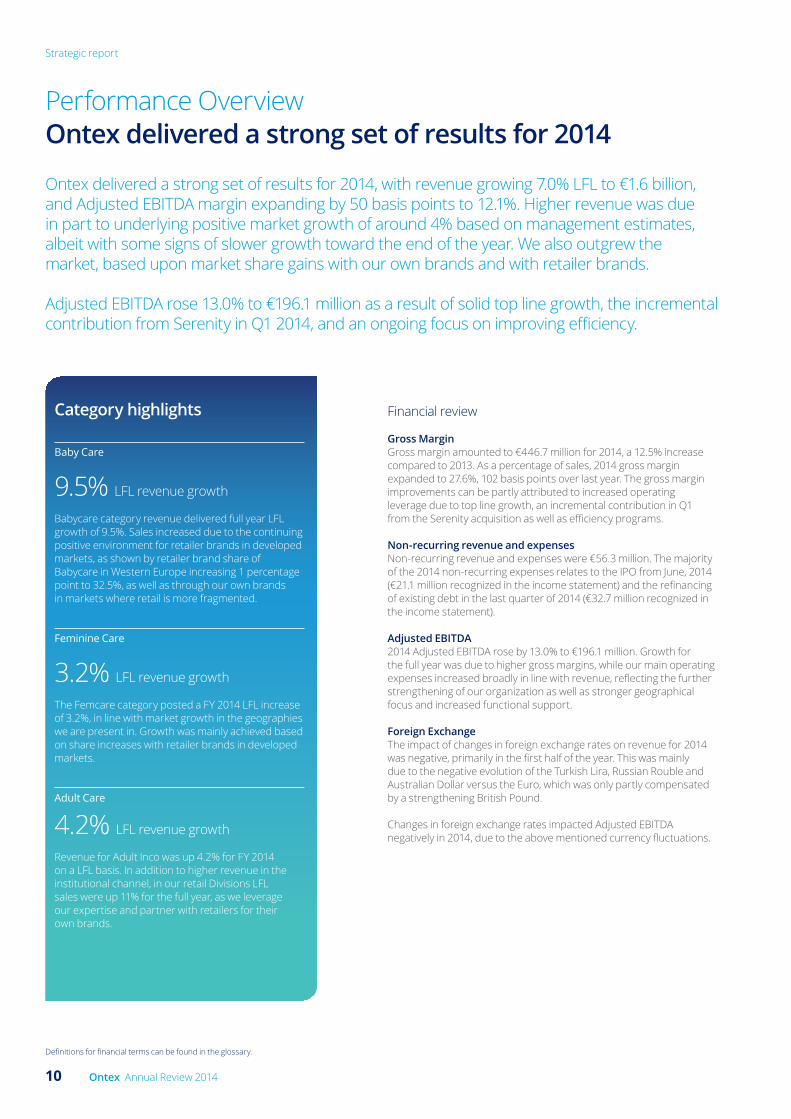
Performance Overview Ontex delivered a strong set of results for 2014
Ontex delivered a strong set of results for 2014, with revenue growing 7.0% LFL to €1.6 billion, and Adjusted EBITDA margin expanding by 50 basis points to 12.1%. Higher revenue was due in part to underlying positive market growth of around 4% based on management estimates, albeit with some signs of slower growth toward the end of the year. We also outgrew the market, based upon market share gains with our own brands and with retailer brands.
Adjusted EBITDA rose 13.0% to €196.1 million as a result of solid top line growth, the incremental contribution from Serenity in Q1 2014, and an ongoing focus on improving efficiency.
Baby Care
9.5% LFL revenue growth
Babycare category revenue delivered full year LFL growth of 9.5%. Sales increased due to the continuing positive environment for retailer brands in developed markets, as shown by retailer brand share of Babycare in Western Europe increasing 1 percentage point to 32.5%, as well as through our own brands in markets where retail is more fragmented.
Feminine Care
3.2% LFL revenue growth
The Femcare category posted a FY 2014 LFL increase of 3.2%, in line with market growth in the geographies we are present in. Growth was mainly achieved based on share increases with retailer brands in developed markets.
Adult Care
4.2% LFL revenue growth
Revenue for Adult Inco was up 4.2% for FY 2014 on a LFL basis. In addition to higher revenue in the institutional channel, in our retail Divisions LFL sales were up 11% for the full year, as we leverage our expertise and partner with retailers for their own brands.
Category highlights
Definitions for financial terms can be found in the glossary.
10 Ontex Annual Review 2014
Strategic report
Net Finance Costs The net finance cost for 2014 totalled €90.3 million, 7.5% higher than the previous year. Interest expenses on the group’s debt decreased in 2014 by 12% or nearly €8 million due to a lower average level of debt since redemption of the €280 million Floating Rate Notes in July. However, these savings were more than offset by €11.6 million accelerated amortization of borrowing expenses related to the early redemptions of notes in July and December. In 2015, we will fully benefit from this refinancing which brings €29 million of annual interest costs savings on the remaining debt.
Income Tax ExpenseIncome Tax Expense was €8.7 million in 2014, a decrease of 38% compared to previous year.
Profit for the periodProfit for 2014 was €8.6 million, mainly due to the operating profit being impacted by non-recurring expenses of the IPO and refinancing.
Working Capital2014 working capital was at 11.4% of revenue compared to 10.9% in 2013. The increase is mainly due to a temporary buildup of VAT receivables in Italy, which is expected to unwind in 2016, as well as rebuilding baby diaper inventories in the first half of 2014 from low levels at the end of 2013 as previously disclosed.
CapexCapital expenditures for 2014 were €48.9 million, representing 3% of sales and in line with our model.
Adjusted Free Cash Flow (post tax)For 2014 adjusted free cash flow was €105.5 million, a decrease of 24.6% compared to 2013 primarily due to the increase of working capital detailed above, partly compensated by higher Adjusted EBITDA.
Financing and LiquidityCash and cash equivalents were €35.5 million at December 31, 2014.
Net debt at December 31, 2014 amounted to €585.1 million, and net leverage based on the last twelve months Adjusted EBITDA was 2.98x.
The revolving credit facility of €100 million was undrawn at the end of December 2014, and available liquidity was €135.5 million.
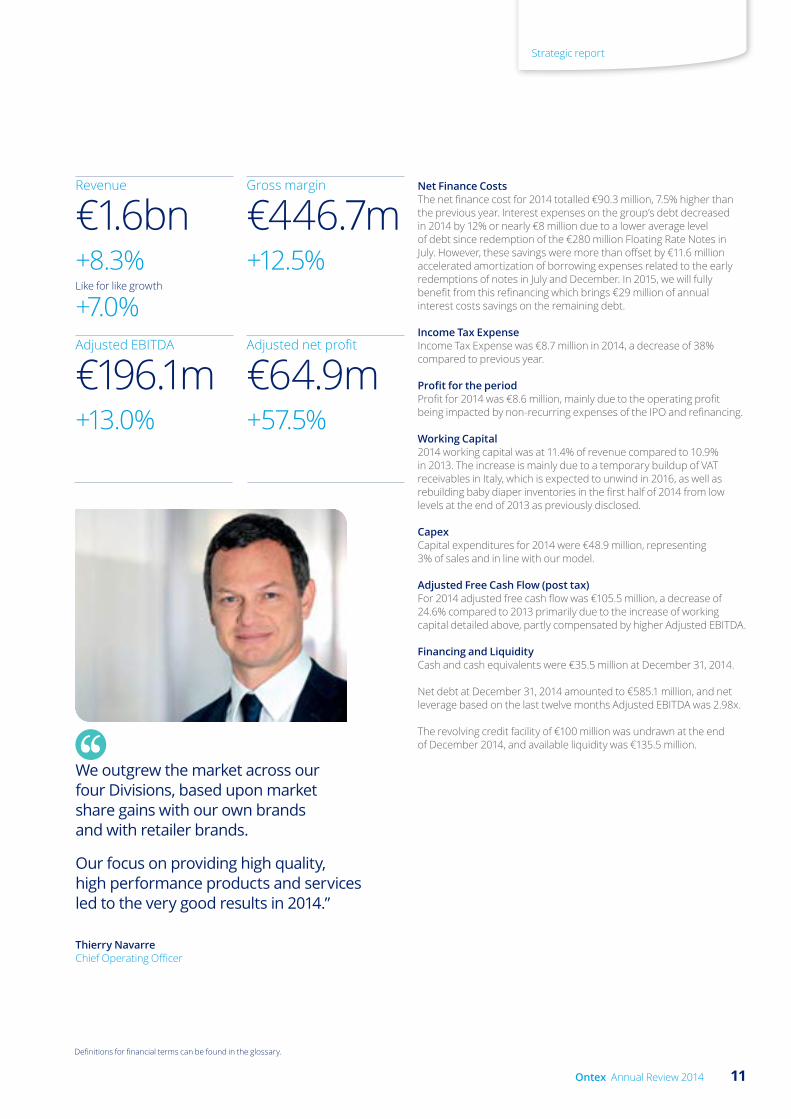
Adjusted EBITDA
€196.1m+13.0%
Adjusted net profit
€64.9m+57.5%
Revenue
€1.6bn +8.3%Like for like growth
+7.0%
Gross margin
€446.7m +12.5%
We outgrew the market across our four Divisions, based upon market share gains with our own brands and with retailer brands.
Our focus on providing high quality, high performance products and services led to the very good results in 2014.”
Thierry NavarreChief Operating Officer
Definitions for financial terms can be found in the glossary.
11Ontex Annual Review 2014
Strategic report
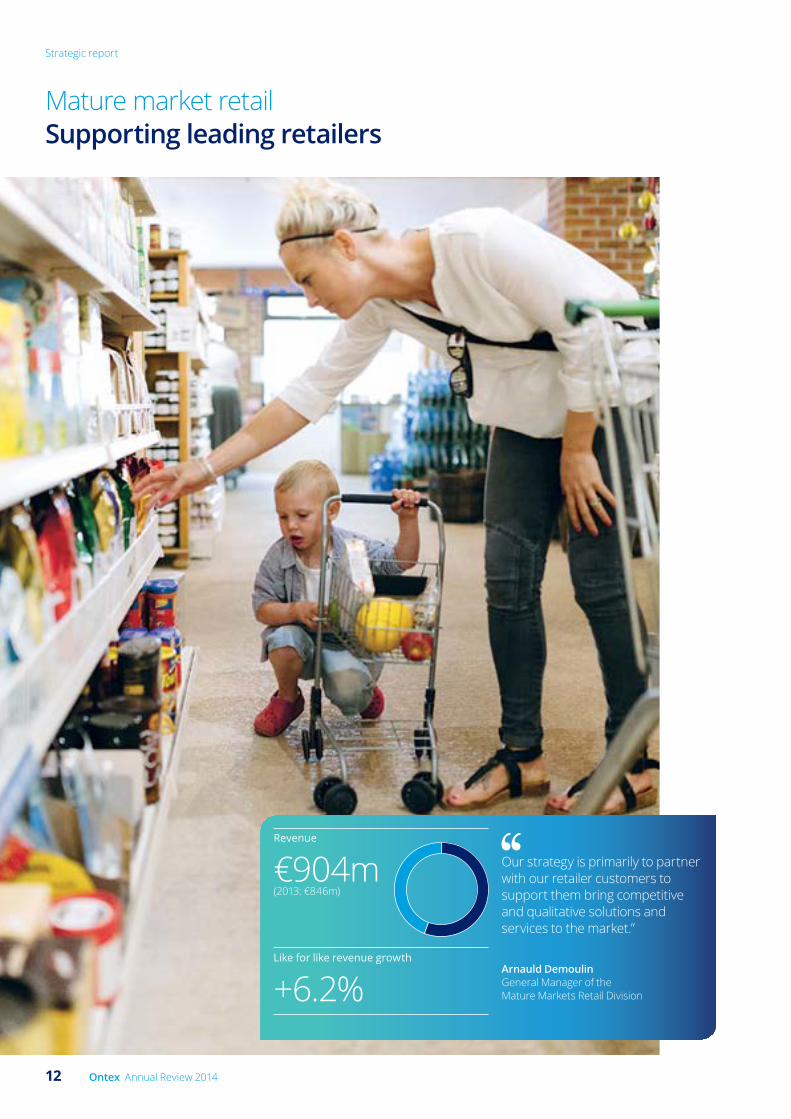
Mature market retailSupporting leading retailers
Our strategy is primarily to partner with our retailer customers to support them bring competitive and qualitative solutions and services to the market.”
Arnauld DemoulinGeneral Manager of the Mature Markets Retail Division
Revenue
€904m(2013: €846m)
Like for like revenue growth
+6.2%
12 Ontex Annual Review 2014
Strategic report

Mature market retailSupporting leading retailers
Mature Market Retail focuses on retailer-branded baby care, feminine care and adult care products through strong relationships with established international and national retailers in Western Europe, Poland and Australia. Market environmentIn 2014, the size of the Western European hygienic disposable products market, which accounts for most of our Divisional sales, was estimated to be €9.0 billion.
The demographic profile in Western Europe is broadly stable, and adoption rates for baby care and feminine care products are already at relatively high levels. At the same time, a growing aging population is supporting expansion of the adult incontinence category. These different trends lead to low single digit growth of the hygienic disposables market overall.
The retail sector is highly competitive across this Division, with ongoing consolidation over several years. Today, while retailers offer international brands, they have strongly increased their focus on developing their own brands as attractive alternatives in a wide variety of categories. Consumer perceptions of these retailer brands continues to grow, and they view more and more retailer brands as the smart, value-for-money choice. As a result, retailer brand share in Western Europe has grown steadily, reaching an estimated 39% in our categories in 2014. This trend accelerated the past couple of years, following the exit of the baby diaper market by a major branded competitor in 2012, essentially leaving one remaining major branded supplier. Collectively, retailer brands make up nearly the balance of the market, and we are the leading retailer brand producer for all three categories, more than twice the size of the next competitor.
StrategyOur strategy for this Division is to be the partner of choice for leading retailers, leveraging our superior scale to support them by bringing competitive, high-quality solutions and services to the market. For each customer, depending on their needs we can provide a full service for retail brand management. This can include building a joint business plan, and supporting them with consumer and shopper insights, innovative products, supply chain and marketing strategy. To build brand equity for the retailer, we can offer to them products at different price points, allowing them to compete with global brands, and helping them to grow the entire category.
PerformanceRevenue in the Mature Market Retail Division grew 6.2% on a LFL basis for FY 2014 versus a strong comparable result in the prior year. FY 2014 sales in the majority of our top markets increased or were in line with the strong results of last year. Gains were seen in key markets such as the UK, Poland, Spain and Australia.
This growth is partly driven by the continuing increase of retailer brands share in our three personal hygiene categories, but also by significant own share gains as retailer brands supplier, including capturing significant volumes following the exit of a major baby diapers supplier in several countries. 2014 demonstrated one of the underlying strengths of our model, supplying the high performance products and services retailers are looking for to build their brands.
OutlookGiven the demographic profiles of the countries in this Division as well as high adoption rates, we expect that the hygienic disposables market will continue to increase annually at a low single digit rate, primarily due to growth of incontinence products in the retail channel. In addition, retailer brands are expected to continue growing faster than the overall market due to a combination of quality, innovation, and attractive pricing.
Key markets
Retailer brand growth potential
Winning with Mature Market Retailers Retailers want >50% retailer brands
Note 1: Estimated Market size, 2014, by value.Note 2: Estimated retailer brand share, 2014, by volume. Note 3: Scope: Baby, feminine and adult care products.
Italy
Market size (€m)1
Reta
iler b
rand
s sh
are
of m
arke
t (vo
lum
e)2
19%
1,216
39%
Sweden
Western Europe Aggregate Mature Market aspiration
22%
213
Norway
24%
142
UK
30%
1,418
Austria
39%
167
Germany
45%
1,609
France
45%
1,558
13Ontex Annual Review 2014
Strategic report

Healthcare Innovating to meet customer and consumer needs
Revenue
€426m(2013: €380m)
Like for like revenue growth
+1.8%
We work in partnership with health professionals and their procurement departments to provide the best service to patients.”
Xavier LambrechtGeneral Manager of the Healthcare Division
14 Ontex Annual Review 2014
Strategic report

Healthcare Innovating to meet customer and consumer needs
Our Healthcare Division supplies mainly Ontex-branded adult incontinence products to consumers mostly through institutional channels. Our commercial approach is tailored in each country to the specific needs, varying widely according to the local reimbursement system. Our customers are mainly in Western Europe, and include government healthcare organizations, local authorities, healthcare insurers, hospitals and nursing homes; we also sell directly to consumers via home delivery and in pharmacies.
Market environmentWe estimate that the size of the healthcare market for adult incontinence products in Western Europe was approximately €1.9 billion in 2014, driven by the ongoing demand from a growing segment of the Western European population. At the same time, sustained budgetary pressures on government spending lead to rather flat industry revenues. Given the necessity of these products for the user, it is expected that any limitation of reimbursement in healthcare channels will be compensated by a switch over to retail channels over time. The institutional marketplace is complex as healthcare systems and payment methods vary by country, and distribution is fragmented across several channels, including hospitals, pharmacies and home delivery where we are a clear leader in many countries.
StrategyOur strategy for the Healthcare Division encompasses supplying high quality Ontex brands and a broad range of customer services. We aim to help our customers provide the best service to patients, while tightly controlling costs and better managing their operations. Working in partnership with health professionals and procurement departments, our services include nurse training programs, online training, automated order systems and budget management. Innovation plays a key role, with consumer insights shaping product development, helping us to meet evolving end-user needs within stringent cost guidelines.
PerformanceOn a LFL basis, Healthcare revenue moved up 1.8% for the year, slightly ahead of estimated market growth for the institutional channels we supply the most. Reported revenue was higher due to the first quarter contribution of Serenity. Revenue grew in Italy, Spain and Benelux, which more than offset lower revenue in Germany primarily due to the scaling back of some contracts.
OutlookDemand for incontinence products will continue to grow due to long-term demographic trends. Not only are the number of elderly people rising, but on top, within this group more and more people are living active and dynamic lives. Furthermore, governments increasingly favor longer-term home care over nursing homes due to restrictions on public funding. The same funding limitations are expected to translate into very low single digit growth. Meeting customer and patient needs within a context of limited budgets will require a relentless focus on costs, innovation and service levels.
Key brands and products
Key markets
15Ontex Annual Review 2014
Strategic report

Middle East and Africa Driving growth through ‘local hero’ brands
Revenue
€187m(2013: €178m)
Like for like revenue growth
+12.8%
Ontex brands enjoy strong market positions in many emerging markets.”
Özgür AkyıldızGeneral Manager of the Middle East & Africa Division
16 Ontex Annual Review 2014
Strategic report
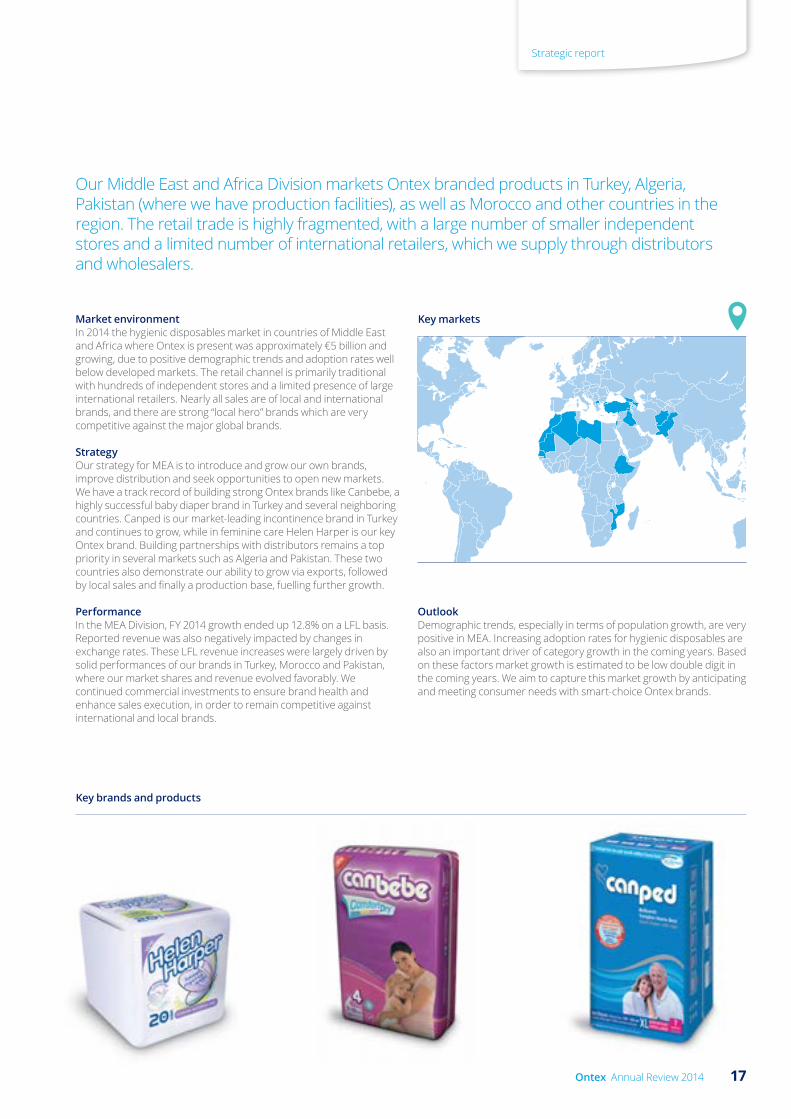
Our Middle East and Africa Division markets Ontex branded products in Turkey, Algeria, Pakistan (where we have production facilities), as well as Morocco and other countries in the region. The retail trade is highly fragmented, with a large number of smaller independent stores and a limited number of international retailers, which we supply through distributors and wholesalers.
Market environmentIn 2014 the hygienic disposables market in countries of Middle East and Africa where Ontex is present was approximately €5 billion and growing, due to positive demographic trends and adoption rates well below developed markets. The retail channel is primarily traditional with hundreds of independent stores and a limited presence of large international retailers. Nearly all sales are of local and international brands, and there are strong “local hero” brands which are very competitive against the major global brands.
StrategyOur strategy for MEA is to introduce and grow our own brands, improve distribution and seek opportunities to open new markets. We have a track record of building strong Ontex brands like Canbebe, a highly successful baby diaper brand in Turkey and several neighboring countries. Canped is our market-leading incontinence brand in Turkey and continues to grow, while in feminine care Helen Harper is our key Ontex brand. Building partnerships with distributors remains a top priority in several markets such as Algeria and Pakistan. These two countries also demonstrate our ability to grow via exports, followed by local sales and finally a production base, fuelling further growth.
PerformanceIn the MEA Division, FY 2014 growth ended up 12.8% on a LFL basis. Reported revenue was also negatively impacted by changes in exchange rates. These LFL revenue increases were largely driven by solid performances of our brands in Turkey, Morocco and Pakistan, where our market shares and revenue evolved favorably. We continued commercial investments to ensure brand health and enhance sales execution, in order to remain competitive against international and local brands.
OutlookDemographic trends, especially in terms of population growth, are very positive in MEA. Increasing adoption rates for hygienic disposables are also an important driver of category growth in the coming years. Based on these factors market growth is estimated to be low double digit in the coming years. We aim to capture this market growth by anticipating and meeting consumer needs with smart-choice Ontex brands.
Key brands and products
Key markets
17Ontex Annual Review 2014
Strategic report

Growth markets Serving faster growing markets
Revenue
€99m(2013: €88m)
Like for like revenue growth
+25.8%
As use of hygienic disposable brands increases and retailer brand penetration strengthens in these markets, we see high potential for growth.”
Thierry VialeGeneral Manager of the Growth Markets Division
18 Ontex Annual Review 2014
Operating review
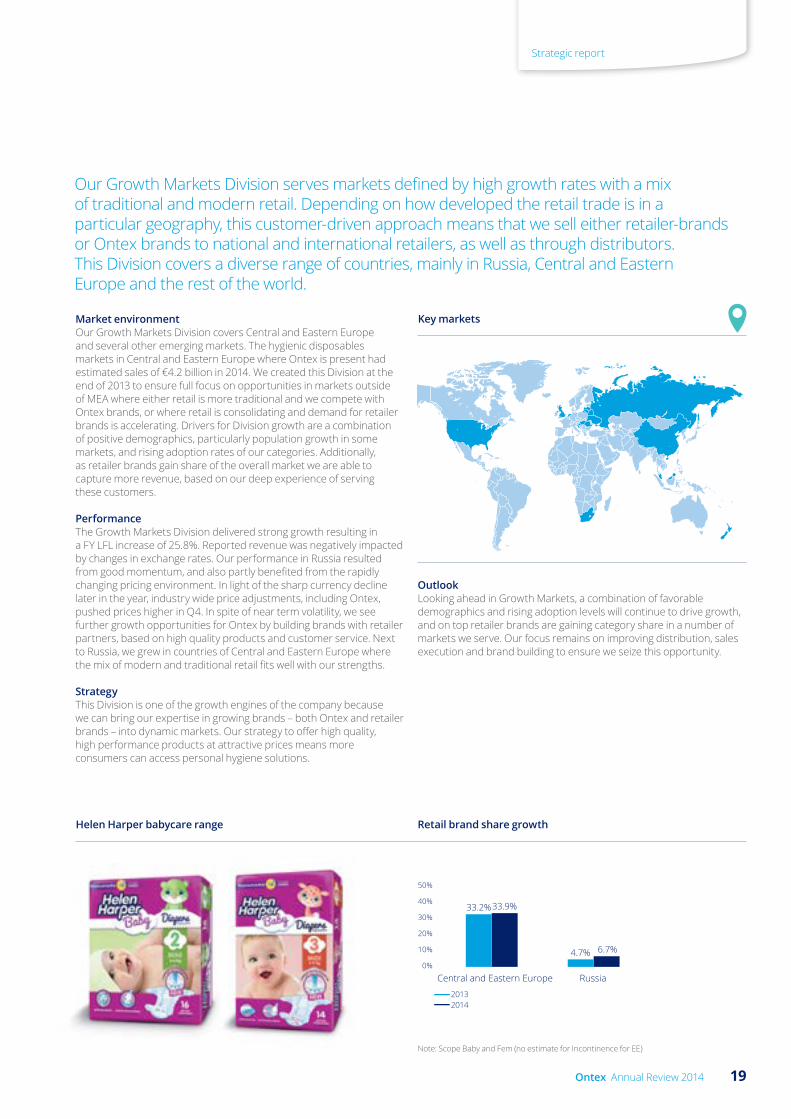
Our Growth Markets Division serves markets defined by high growth rates with a mix of traditional and modern retail. Depending on how developed the retail trade is in a particular geography, this customer-driven approach means that we sell either retailer-brands or Ontex brands to national and international retailers, as well as through distributors. This Division covers a diverse range of countries, mainly in Russia, Central and Eastern Europe and the rest of the world.
Market environmentOur Growth Markets Division covers Central and Eastern Europe and several other emerging markets. The hygienic disposables markets in Central and Eastern Europe where Ontex is present had estimated sales of €4.2 billion in 2014. We created this Division at the end of 2013 to ensure full focus on opportunities in markets outside of MEA where either retail is more traditional and we compete with Ontex brands, or where retail is consolidating and demand for retailer brands is accelerating. Drivers for Division growth are a combination of positive demographics, particularly population growth in some markets, and rising adoption rates of our categories. Additionally, as retailer brands gain share of the overall market we are able to capture more revenue, based on our deep experience of serving these customers.
PerformanceThe Growth Markets Division delivered strong growth resulting in a FY LFL increase of 25.8%. Reported revenue was negatively impacted by changes in exchange rates. Our performance in Russia resulted from good momentum, and also partly benefited from the rapidly changing pricing environment. In light of the sharp currency decline later in the year, industry wide price adjustments, including Ontex, pushed prices higher in Q4. In spite of near term volatility, we see further growth opportunities for Ontex by building brands with retailer partners, based on high quality products and customer service. Next to Russia, we grew in countries of Central and Eastern Europe where the mix of modern and traditional retail fits well with our strengths.
StrategyThis Division is one of the growth engines of the company because we can bring our expertise in growing brands – both Ontex and retailer brands – into dynamic markets. Our strategy to offer high quality, high performance products at attractive prices means more consumers can access personal hygiene solutions.
OutlookLooking ahead in Growth Markets, a combination of favorable demographics and rising adoption levels will continue to drive growth, and on top retailer brands are gaining category share in a number of markets we serve. Our focus remains on improving distribution, sales execution and brand building to ensure we seize this opportunity.
Helen Harper babycare range
Key markets
Central and Eastern Europe
Growing share of retailer brands1
2013
Russia
6.7%4.7%0%
10%
20%
30%
40%
50%
2014
33.2%33.9%
Retail brand share growth
Note: Scope Baby and Fem (no estimate for Incontinence for EE)
19Ontex Annual Review 2014
Strategic report
Business modelA winning formula
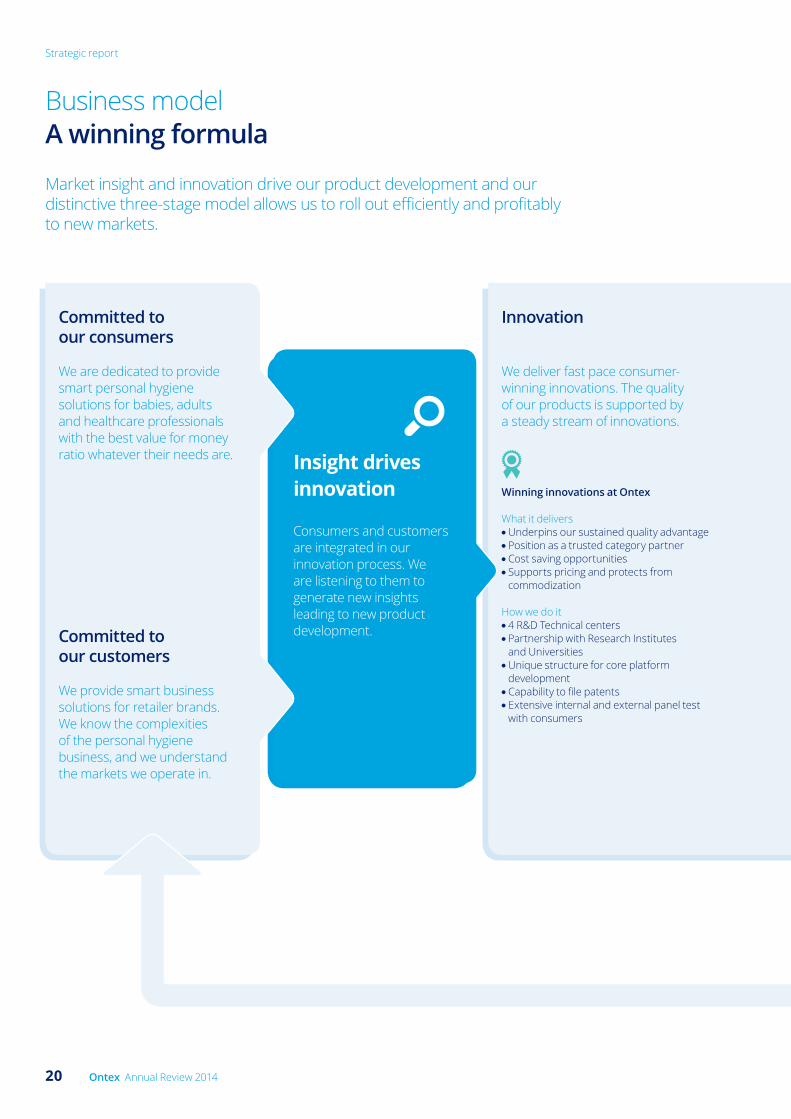
Market insight and innovation drive our product development and our distinctive three-stage model allows us to roll out efficiently and profitably to new markets.
Committed to our consumers
Committed to our customers
Innovation
We are dedicated to provide smart personal hygiene solutions for babies, adults and healthcare professionals with the best value for money ratio whatever their needs are.
We provide smart business solutions for retailer brands. We know the complexities of the personal hygiene business, and we understand the markets we operate in.
We deliver fast pace consumer-winning innovations. The quality of our products is supported by a steady stream of innovations.
Winning innovations at Ontex
What it delivers●● Underpins our sustained quality advantage ●● Position as a trusted category partner ●● Cost saving opportunities ●● Supports pricing and protects from commodization
How we do it●● 4 R&D Technical centers ●● Partnership with Research Institutes and Universities ●● Unique structure for core platform development ●● Capability to file patents●● Extensive internal and external panel test with consumers
Insight drives innovation
Consumers and customers are integrated in our innovation process. We are listening to them to generate new insights leading to new product development.
20 Ontex Annual Review 2014
Strategic report

1 Exports●● No local support●● Via distributors
2 Local sales●● Local office managing sales and coordinating logistics●● Distributors owns trade marketing & key account management
3 Local production●● Local integrated office with local production, logistics functions, and brand management
Organic roll out to new markets – the “three stage” model
Our business is aligned with our go to market model
Size underpins our leading market position
Winning by expanding in stages
Winning by adapting to where we play
Scale drives competitive advantage
Our retail focus
74% Adapting brand strategy to market maturity
MEA Growth markets Mature markets
Our Healthcare focus
26% Adapting channel strategy to opportunities
Hospitals & nursing homes Home delivery Pharmacy
Scale advantage in salesThe largest retailer brandsProvider in Western Europe
2.8x Larger than the next competitor in our categories
Why scale matters to usAccelerating capabilities Industrial Culture●● Manufacturing flexibility and excellence●● Quality of products●● Innovation
Upgrading capabilities Brand & customer Culture●● Brand and customer management expertise●● Enhanced procurement capabilities
Based upon 2014 estimate.
21Ontex Annual Review 2014
Strategic report

Our business driversA unique competitive advantage
Continually listening and responding to consumers’ evolving needs, the unique set of attributes shown here make Ontex a competitive force in delivering high-performance, best-value personal hygiene solutions to our partners and consumers.
Flexibility and scale Our business is flexible, delivering products through multiple channels, with the agility to adapt technology and respond to market preferences. Being the leading retail brand supplier brings significant scale advantages for us, and also for our customers: security of supply from our 15 production sites, and procurement advantages to make sure we stay at the forefront of consumer demands.
Manufacturing expertise Our manufacturing facilities are world class, and our years of experience make us experts in navigating the complexities of evolving markets and consumer needs. We adapt our technology and machinery to suit the purpose. From engineering capability to consumer insights, we offer the appropriate response to customer and market preferences.
Focused on cost saving efficiencyUnparalleled engineering capabilities
22 Ontex Annual Review 2014
Strategic report
Trusted by partners Delivering smart hygiene solutions
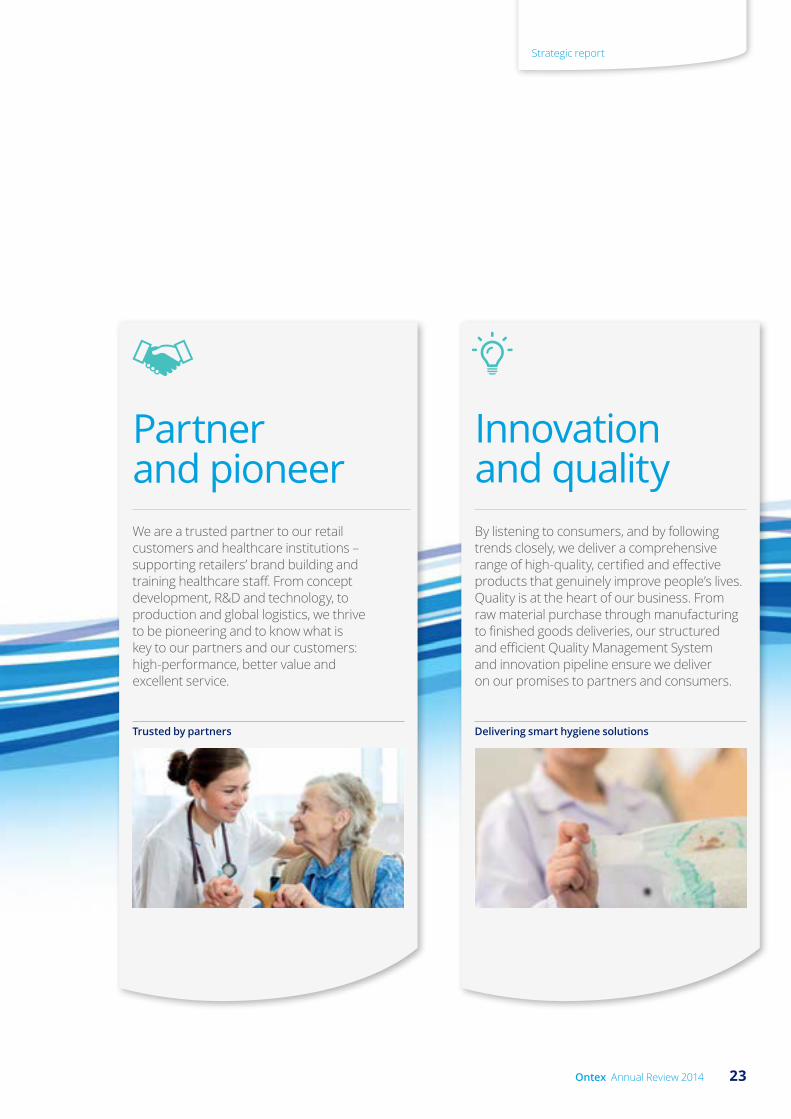
Partner and pioneer
Innovation and quality
We are a trusted partner to our retail customers and healthcare institutions – supporting retailers’ brand building and training healthcare staff. From concept development, R&D and technology, to production and global logistics, we thrive to be pioneering and to know what is key to our partners and our customers: high-performance, better value and excellent service.
By listening to consumers, and by following trends closely, we deliver a comprehensive range of high-quality, certified and effective products that genuinely improve people’s lives. Quality is at the heart of our business. From raw material purchase through manufacturing to finished goods deliveries, our structured and efficient Quality Management System and innovation pipeline ensure we deliver on our promises to partners and consumers.
23Ontex Annual Review 2014
Strategic report

Innovation is a key driver of growth, profit and differentiation for Ontex. It underpins the competitive advantage we derive from our manufacturing quality, and positions us with retailers as a trusted category partner. Hygienic disposables are complex products: innovation creates smarter purchasing choices, brings greater comfort and confidence to our consumers and creates long-lasting loyalty.
A growing pipeline fed by consumer insightsWe have delivered an average of five to six major innovations a year during the past ten years and now have a growing pipeline. We aim to create value by increasing the pace of the innovations we bring to customers and consumers, strengthening our own brands and our retailer brands. We re-engineered our whole approach to innovation during 2014, bringing more consumer and customer insights into the entire development process. Cross-functional teams, including sales, marketing, legal, purchasing, engineering, supply chain and production, also feed into the R&D process.
The objective is to deliver ‘bigger, better, faster innovations’.We prioritize and allocate the right resources to each project by classifying product innovation under four pillars:
new product platforms – technological developments we can roll out across our categories, such as the structural parts of our products
2 product upgrades – including new features or ‘delighters’, such as a more efficient closure system, softer materials or general product enhancements and range extensions
3 cost control projects – in cooperation with purchasing and operations, these are optimization projects needing little or no capital expenditure on equipment, such as maintaining or improving product performance with fewer materials
4 differentiators – small innovations such as changes in color and print differentiation, or packaging design.
1
Quality, Research & Development Innovation drives competitive advantage
We re-engineered our approach bringing more consumer insights into the development process.” Annick De PoorterGroup R&D and Quality Director
24 Ontex Annual Review 2014
Strategic report
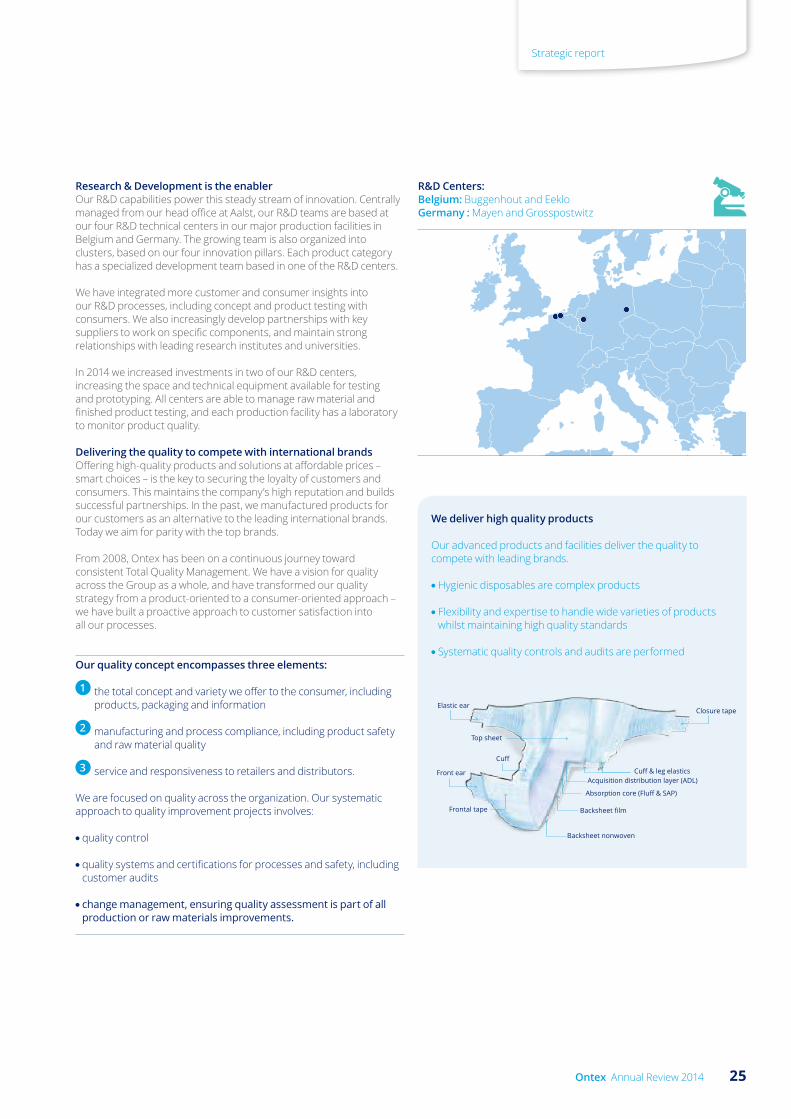
Research & Development is the enablerOur R&D capabilities power this steady stream of innovation. Centrally managed from our head office at Aalst, our R&D teams are based at our four R&D technical centers in our major production facilities in Belgium and Germany. The growing team is also organized into clusters, based on our four innovation pillars. Each product category has a specialized development team based in one of the R&D centers.
We have integrated more customer and consumer insights into our R&D processes, including concept and product testing with consumers. We also increasingly develop partnerships with key suppliers to work on specific components, and maintain strong relationships with leading research institutes and universities.
In 2014 we increased investments in two of our R&D centers, increasing the space and technical equipment available for testing and prototyping. All centers are able to manage raw material and finished product testing, and each production facility has a laboratory to monitor product quality.
Delivering the quality to compete with international brandsOffering high-quality products and solutions at affordable prices – smart choices – is the key to securing the loyalty of customers and consumers. This maintains the company’s high reputation and builds successful partnerships. In the past, we manufactured products for our customers as an alternative to the leading international brands. Today we aim for parity with the top brands.
From 2008, Ontex has been on a continuous journey toward consistent Total Quality Management. We have a vision for quality across the Group as a whole, and have transformed our quality strategy from a product-oriented to a consumer-oriented approach – we have built a proactive approach to customer satisfaction into all our processes.
Our quality concept encompasses three elements:
1 the total concept and variety we offer to the consumer, including products, packaging and information
2 manufacturing and process compliance, including product safety and raw material quality
3 service and responsiveness to retailers and distributors.
We are focused on quality across the organization. Our systematic approach to quality improvement projects involves:
●● quality control
●● quality systems and certifications for processes and safety, including customer audits
●● change management, ensuring quality assessment is part of all production or raw materials improvements.
R&D Centers:Belgium: Buggenhout and EekloGermany : Mayen and Grosspostwitz
We deliver high quality products
Our advanced products and facilities deliver the quality to compete with leading brands.
● Hygienic disposables are complex products
● Flexibility and expertise to handle wide varieties of products whilst maintaining high quality standards
● Systematic quality controls and audits are performed
Elastic ear
Top sheet
Closure tape
Front ear
Frontal tape
Acquisition distribution layer (ADL)
Cuff
Cuff & leg elastics
Absorption core (Fluff & SAP)
Backsheet nonwoven
Backsheet film
25Ontex Annual Review 2014
Strategic report

Innovation
FlexfitWith Flexfit, we’ve engineered a new standard of high-performing baby diaper. Tested and qualified externally to feel dry and protect the baby for 12 hours, Flexfit is actually 20% thinner than our previous diapers, thanks to advanced materials. The slim design provides a perfect fit that adapts to the baby’s movement whether night or day. What’s more, the reduced thickness is bringing even more convenience for consumers and retailers, and logistical efficiencies for all stakeholders.
26 Ontex Annual Review 2014

Baby CareWe provide baby care products, such as diapers, baby pants and wet wipes. Panel tests, lab tests and independent reviews regularly confirm the focus on quality, innovation and performance of our products.
Innovation in action
Effectively DryFeeling of dryness, prevention of leakage and irritation.
Skin-FriendlyA soft diaper to protect the baby’s sensitive skin.
Thin & FlexibleAdapted to baby movements.
No LeaksThanks to a perfect body fit.
27Ontex Annual Review 2014

Innovation
FelicityActive women want to continue living their life to the full even during their periods. Ontex has developed a new ultra towel – highly flexible and leak free: it allows women to forget they are wearing one, helping them to feel free and confident by staying fully protected throughout the day.
This is possible through a combination of three exclusive technologies:
A short sophisticated multi-layer towel in combination with a new surface embossing specifically created to feel comfortable all day long
An ultra-thin absorbent core, soft and specially designed to adapt and fit perfectly to the wearer’s body form
The double anti-leak side barriers – exclusive for reinforced protection
1
2
3
28 Ontex Annual Review 2014

Innovation in action
Feminine CareWe develop feminine care products such as sanitary pads, panty liners and tampons. We introduce new products in response to market insights, ensuring comfort and confidence for women.
High absorption power that gels and locks the liquid in
Blue protection zone with new design
Cotton surface provides comfort
Perforated topsheet
Secure wings perfectly protect the underwear
Thinness provides move comfort
29Ontex Annual Review 2014

Innovation
Fit and feelWe innovate continuously to deliver improved performance and wearability for consumers, developing the ‘fit & feel’ system for our iD brand of incontinence pants to offer greater protection and discretion. We have improved comfort for users with a very soft waistband, and curved elastic around the legs to give a discreet slim fit. We are also focused on product performance, introducing enhancements that include a high absorption core with anti-leak protection and odor control.
30 Ontex Annual Review 2014

Innovation in action
Adult CareOur adult care products, distributed mainly through healthcare providers, are disposable devices designed to manage light, moderate and heavy incontinence. We constantly combine new technologies and consumer and customer feedback to ensure our solutions provide a comfortable fit, ease of use and high protection for users.
Maximum level of protection:● Dry zone● Double anti leakage barriers
Maximum discretion:● New curved back elastics for an improved fit● Odour control prevents the formation
of ammonia and thus of unpleasant odours
Soft cotton-feel texture assuring an outstanding wearing comfort:● Elastifit supersoft waist band
31Ontex Annual Review 2014
The people at Ontex are the reason for our success. Ontex started as a family manufacturing company and has developed into a leading international consumer goods company. The entrepreneurial drive, flexibility and sheer pride of Ontex people are the keys to this growth.
Can do attitudeFrom this background comes a very ‘can-do’ attitude, pragmatic people who make things happen, and an environment where employee initiatives are valued. This is the attitude we want to retain at Ontex as the company continues to foster, and overlay it with a professional company-wide HR structure, to consolidate and build on our strengths as we grow.
In 2014, we undertook an organizational culture survey, with the results benchmarked against 1,000 companies worldwide. The results showed that in relation to our employees’ understanding of company goals and their contribution to achieving them, Ontex is in the top quartile. All this has happened naturally and organically over the years. Now we are creating the structure to translate Ontex’s innate cultural strengths into HR programs, to ensure that as new people join, they can integrate easily, and quickly feel part of the Ontex family.
Reinforcing our culture Over the past two years, we have rolled out the basic fundamentals for the senior managerial positions, such as a performance management and review system, function classification, and a compensation & benefits framework. In 2015 we will be rolling out these programs to all management employees, and adding more elements to it, such as the definition of leadership competencies, a training curriculum for people managers and a career development framework. We want to reinforce the strong culture that we have by engaging all employees in the definition of our values, and will be taking initiatives to make Ontex a good place to work and showing employees we care.
Ontex is the smart choice for customers and we offer employees an equally compelling value proposition: a company which makes the most of their diverse talents, skills and personalities and recognizes their contribution to our success.
Business growth creates new career and development opportunities for our people to develop and be part of the next exciting stage of our journey.
Our people Business growth means people growth
Business growth creates new career and development opportunities for our people to develop and be part of the next exciting stage of our journey.”
Astrid De LathauwerGroup HR Director
32 Ontex Annual Review 2014
Strategic report

Our people in action
One individual can make a differenceEspecially one with Ontex’s entrepreneurial spirit. A colleague in Turkey decided there might be potential in Algeria. Having travelled there and identified a distributor, and overcome many hurdles with customs and regulations, he started exporting. Soon we opened a sales office and after a number of years, a production plant. One man, one new idea and the drive to execute it. And the result? Ontex’s new expansion outside of Europe.
Pride and team spirit combine to overcome disasterIn 2009, our Turkish production plant was totally incapacitated after over two meters of flood water ruined equipment and deposited fine sand everywhere. For other firms it might have spelt disaster. For Ontex people, it was simply a challenge to be dealt with. Half the Turkish team stayed to clean the plant and rebuild the equipment lines, while the other half staff travelled to our other European plants to help fill production capacity. Within ten days, we were servicing our Turkish customers with product again, and within three months, the Turkish plant was back up and running – much to the surprise of our insurance company.
Helping people grow, in a role they loveWith an early career in the hotel sector and a later degree in business administration, Ulla Budday’s professional path may not be the most typical. But it does demonstrate what is possible. Joining Ontex as a management trainee in 2002, Ulla became fascinated by the production roles she experienced. Taking the opportunity of a company-wide initiative for Lean 6 Sigma training, combined with some sound coaching and mentoring from the former Mayen factory manager, and several secondments to help set up Ontex’s Australian operation – Ulla soon developed the skills and experience to be offered the position of Plant Manager at Ontex Mayen in 2009 – a post she still holds today.
33Ontex Annual Review 2014
Strategic report

Our approach to sustainability Integrating care for people and the environment into our businessAs our business grows, our responsibilities also grow – to our employees, to our customers and to the environment. To meet these responsibilities, we aim for sustainability to be an integral part of our future success.
There are two reasons for companies to operate sustainably. One is economical – because it can help you reduce costs – the other is business ethics – because you want to do business in a positive way.” Charles BouazizCEO, Ontex
Our sustainability vision is to:
●● Belong to the top league of sustainability in the hygiene sector
●● Be a reliable partner for our consumers and customers
●● Increase access to high quality hygiene products for as many people as possible
Our sustainability strategy has been developed with reference to the UN Global Compact, the principles of the Global Reporting Initiative (GRI), ISO 26000, and the OECD guidelines for international enterprises. Based on these frameworks, we are guided by the following fundamental sustainability principles:
●● Ethical behaviour ●● Include social and environmental considerations in the decision-making process●● Accountability and transparency●● Respect for stakeholders’ interests●● Legal compliance●● Long-term thinking
Sustainability ReportMore detail on our sustainability strategy and our activities under each of the pillars can be found in our dedicated Sustainability Report:
www.ontexglobal.com/sustainability for more information
Sustainability strategyOur sustainability journey started as far back as 1996, when we started introducing the ISO systems and eco-labels. Today, care for people and the environment is included in our mission and sustainability is rooted in our organization, our know-how and our products.
34 Ontex Annual Review 2014
Strategic report

The policies that have been created at Ontex Group reflect our way of doing business.
Our way of doing business
How we do businessWe expect high standards of business integrity in all that we do and our employees are expected to comply with all legal requirements as well as the Ontex Business Code of Conduct. This Code serves as a guide for doing business the Ontex way. It includes our corporate compliance requirements and a range of business integrity policies.
Ontex aims to implement the vision through its three pillars of sustainability
Our three pillars of sustainability
Integrating sustainability… In our productsOntex products are disposable, single-use products. For this reason it is important that we take into account their environmental impact. Our two main ambitions within this sustainability pillar are sustainable sourcing and product responsibility.
We aim to achieve the lowest possible impact by:●● Ensuring all products are safe●● Only using third-party certified sustainable cellulose, the fluff pulp and forest products used as raw materials for our products ●● Reducing product and packaging weight●● Focusing on sustainable sourcing for raw materials●● Developing new eco-conscious products.
Highlights: Sustainable sourcing●● Our manufacturing plants hold 53% PEFC or 27% FSC chain-of-custody certificates. In addition, we hold a multisite SFI Sustainable sourcing certificate
Product responsibility●● In the last five-years, we have reduced the raw materials in our baby diapers by 14%. This has contributed to a 10% reduction in weight over the last decade.
Integrating sustainability… In our organizationSustainability in our organization covers our ambition to be a good employer and to minimize our impact on the environment. Transport of raw materials and finished products, energy consumption, and waste from manufacturing are some of the impacts that we manage. Our Environmental and Energy Policy commits us to minimize the environmental impact of our activities. We are implementing ISO 14001 and ISO 50001 environmental and energy management systems to achieve these aims. We have a similar commitment to being a good employer. We deliver this goal by providing the best and safest working conditions, a positive work/life balance, and by making the most of our employees’ diverse talents, skills and personalities and recognizing their contribution to our success. Our global Health and Safety Policy and people management processes support our approach.
Highlights: Being a good employer●● In 2014, we established a group HR function to improve the professional development opportunities for all our employees.
Reducing production impact●● Nine of our 15 manufacturing plants have a certified environmental management system and we aim to get one additional plant certified in 2015.●● Four of our 15 manufacturing plants have a certified energy management system and we aim for two more plants to be certified in 2015.
Integrating sustainability… In our know-howWe value the exchange of knowledge regarding sustainability, both externally with suppliers and customers, and internally across our production facilities and departments. To help deliver our sustainability ambitions, we invest in close partnerships with stakeholders along our value chain and we work hard to deliver efficient and effective communication. We are also members of key associations and trade bodies that support and enable our sustainability strategy. These memberships are mainly specific for the non-woven and disposable hygiene products industry.
HighlightsShared value creation●● Ontex created and continues to develop the Continence Institute – an initiative that offers education and advice on continence assessment, management and treatment. Currently, the Institute has more than 500 students across Australia, Belgium, France, Germany and UK.
Business code of conduct●● Anti-Trust Policy ●● Anti-Bribery Policy●● Political and Charitable Contribution Policy●● Exchange of gifts, entertainment, items of value Policy●● Economic sanction and Anti-Boycott Policy ●● Anti-Money Laundering Policy
35Ontex Annual Review 2014
Strategic report
Summary of Main Risks
We view managing risk with various stakeholders, in order to satisfy consumer and customer expectations, as an inherent part of doing business. The following summary provides the main risks we have identified and manage; however, this is not an exhaustive list, and there may be additional risks which we are not aware of.
Although for most of these risks we have set up mitigating efforts, these efforts are no guarantee that risks will not materialize. The order in which these risks are listed is not an indication of their importance or probability.
For more information about our risk management framework and internal control framework, please refer to section 9 of the Corporate Governance report. For details related to financial risk management, please refer to section 7.4 of the financial statements.
The personal hygiene industry is very competitive and features local, regional and global suppliers. For all Divisions, we face competition from branded product manufacturers who sell products under their own names or brands. In the Divisions Mature Market Retail and to a lesser extent Growth Markets, we also compete with retailer brand manufacturers who mainly or exclusively supply products to national and international retailers, who then sell the products under their own brands or labels.
We also face competition from competing manufacturers in product innovation. Rapid time to market is key to our competitiveness. If we are unable to develop innovative products, or are unable to obtain and license such proprietary rights, we may lose market share.
Revenue for our Healthcare Division is related to government spending. Governments may reduce their spending on healthcare, which could adversely affect the business that we do with public institutions.
We sell in more than 100 countries worldwide, and as a result are subject to risks associated with operating internationally. Recent and ongoing unrest in some of the countries in which we operate may adversely affect our business.
We may not be successful at retaining our key customers. Our customers range from distributors to large international retailers to institutional channels such as government healthcare organizations. Our total sales are the results of gains and losses of contracts, which are on a non-exclusive basis.
Our customer’s policies and requirements may change at any time, which can impact our sales.
If we are unable to maintain our on-time delivery record, this could adversely affect our ability to attract new customers and retain existing customers.
Our ability to serve our customers depends on our 15 manufacturing operations. We may experience disruptions at our production facilities or in extreme cases, our production facilities may be shut down. Should a disruption occur in one of our production facilities, we could experience temporary shortfalls in production and/or an increase in our cost of sales. We may also be subject to losses that might be completely or partially uninsured (specific cases resulting from terrorist activities and wars).
We are dependent upon the availability of raw materials for the manufacture of our products. Raw materials and packaging costs account on average for between 75% and 80% of our cost of sales. The key raw materials we use are fluff, super-absorber and non-woven fabrics.
Furthermore, the raw materials we use are subject to price volatility due to a number of factors that are beyond our control, including, but not limited to, the availability of supply, general economic conditions, commodity price fluctuations and demand in the market.
The majority of our customers contracts are based on fixed pricing models and do not contain raw materials price indexation clauses.
We make substantial sales in currencies other than Euros, which exposes us to risks resulting from exchange rate fluctuations. We also make purchases of certain raw materials, primarily fluff, in US Dollars (USD).
The quality and reliability of our information systems and software are vital to our success, and any failure of these systems and software could adversely affect our operations.
Health, safety and environmental regulations may subject us to significant costs and liabilities.
We may fail to realize the anticipated business growth opportunities, revenue benefits, cost synergies, operational efficiencies and other benefits anticipated from, or may incur unanticipated costs associated with potential future acquisitions.
We rely on our employees to execute our strategy. Our ability to attract, retain and develop people is critical to the group’s success.
Our business could be adversely affected if we are unable to extend, renew or renegotiate our collective bargaining agreements or if our relationship with our employees or trade unions deteriorates.
Increasing labor costs may adversely affect our profitability.
As detailed in section 7.4 of the financial statements the group’s activities expose it to a variety of financial risks: market risk (including currency risk, interest rate risk and price risk), credit risk and liquidity risk.
We are subject to obligations, restrictions and covenants under our external borrowings. If we are unable to meet our obligations, restrictions or covenants, this might have a material adverse effect on our business, financial condition and results of operations.
Changes in tax rates, tax legislation, tax liabilities or accounting rules could affect future results
Changes in assumptions underlying the carrying value of our assets, including as a result of adverse market conditions, could result in impairment of such assets, including intangible assets such as goodwill.
We may be affected by product recall or liability claims or otherwise be subject to adverse publicity.
We are subject to the laws of the countries we do business in and certain competition and antitrust laws. Failure to comply in full with these laws can have a significant impact on our financial position.
36 Ontex Annual Review 2014
Strategic report
Table of Contents
Corporate Governance Statement 381. Reference Code 382. Capital and Shareholders 38
2.1 Capital and capital evolutions 382.2 Shareholder evolutions 382.3 Shareholder structure 392.4 Relationship with and between the Company’s shareholders 392.5 Dealing and Disclosure Code 40
3. Board and Board Committees 403.1 Board composition 403.2 Board: evolutions in composition during 2014 423.3 Gender diversity 423.4 Functioning of the Board 433.5 Board Committees 43
4. Relevant information in the event of a takeover bid 454.1 Capital Structure 454.2 Restrictions on transfers of securities 454.3 Holders of securities with special control rights 454.4 Employee stock plans where the control rights are not exercised directly by the employees 454.5 Restriction on voting rights 454.6 Shareholders’ agreements 454.7 Rules on appointment and replacement of members of the Board and amendments to the Articles of Association 454.8 Authorized capital – Acquisition of own shares 454.9 Material agreements to which Ontex is a party containing change of control provisions 464.10 Severance pay pursuant to termination of contract of Board members or employees pursuant to a take-over bid 46
5. Conflicts of interest 466. Related Party Transactions 49
6.1 Revolving Credit Facility 496.2 Term Loan Agreement and Senior Notes Indenture 496.3 ISDA Agreements 496.4 Monitoring Services Agreement 506.5 Other transactions 50
7. Compliance with the 2009 Belgian Code on Corporate Governance 508. Remuneration Report 50
8.1 Remuneration policy and procedure for the Board of Directors 508.2 Remuneration policy and procedure for the Executive Management Team 518.3 Fixed and short term variable remuneration 2014 of the CEO (total cost) 518.4 Fixed and short term variable remuneration 2024 for the members of the Executive Management Team (excluding the CEO) 518.5 2014 Long Term Incentives 518.6 Termination Provisions 52
9. Risk management and internal control framework 529.1 Introduction 529.2 Control Environment 529.3 Risk management 539.4 Control activities 539.5 Information and communication 539.6 Monitoring of control mechanisms 539.7 Risk management and internal control with regard to the process of financial reporting 53
37Ontex Annual Review 2014
Corporate Governance

Corporate Governance Statement
In accordance with the Belgian Companies Code and the 2009 Belgian Code on Corporate Governance (hereafter the “Corporate Governance Code”), the following chapter provides information about Ontex Group NV’s (hereafter also referred to as the “Company”) corporate governance.
This includes changes to Ontex Group NV’s corporate governance, together with the relevant events that took place during 2014, such as changes in Ontex Group NV’s capital or shareholder structure, the modifications in Ontex Group NV’s governance and in the composition of the Board of Directors of Ontex Group NV (hereafter also the “Board”) and its committees, the main features of the internal control and risk management systems of the Ontex group, and the Remuneration Report. This chapter also includes explanations, where applicable, of any deviations from the Corporate Governance Code (see chapter 7).
1. Reference CodePursuant to Article 96, § 2 of the Belgian Companies Code and the Royal Decree of June 6, 2010, Ontex Group NV has adopted the Corporate Governance Code as its reference code on corporate governance.1
As a Belgian headquartered listed company with a commitment to high standards of corporate governance, the Board adopted a Corporate Governance Charter in June 2014, as required by the Corporate Governance Code. The Corporate Governance Charter has most recently been updated on December 8, 2014, and can be consulted on the Ontex website2 hereinafter referred to as the Corporate Governance Charter.
This Corporate Governance Charter describes the main aspects of Ontex Group NV’s corporate governance, including its governance structure and the terms of reference of the Board, as well as those of the Board committees and the Executive Management Team. The Corporate Governance Charter is regularly updated and will be annually reviewed by the Board to be in line with applicable laws and regulations, the Corporate Governance Code and their interpretation.
2. Capital and Shareholders 2.1 Capital and capital evolutionsThe capital of Ontex Group NV, listed on Euronext Brussels, amounted to €680,650,828 as at December 31, 2014, and was represented by 68,055,555 shares without nominal value. Each share carries one vote.
On June 10, 2014, the Extraordinary Shareholders’ Meeting approved a long term incentive plan consisting of stock options and restricted stock units (hereafter “LTIP 2014”). The stock options and restricted stock units do not confer any shareholder rights. The shares to be delivered to participants upon exercise of their stock options or upon vesting of their restricted stock units are existing shares of Ontex with all rights and benefits attached to such shares. For a more detailed description of the LTIP 2014, reference is made to the Remuneration Report.
The following capital movements took place in 2014.
On April 24, 2014, the Company was incorporated with a capital of €70,000, represented by 7,000 shares without nominal value, of which 6,999 shares were subscribed to by Whitehaven B S.à r.l. and one share was subscribed to by Whitehaven A S.à r.l.
On June 30 2014, Whitehaven A S.à r.l. sold his share to Whitehaven B S.à r.l.
On June 30, 2014, as part of the Company’s IPO, the capital was increased to €680,650,828, represented by 68,055,555 ordinary shares, as follows:
A. contributions in kind of (i) all ordinary shares in Ontex I SARL held by Whitehaven B SARL, (ii) all options over Ontex I SARL shares held by the Ontex Group NV current Executive Management Team and (iii) all ordinary shares in Ontex I SARL held by the Ontex’ 2010 executive management team, resulting in an increase of the Company’s capital in an amount of €499,930,000 by issuance of 49,993,000 shares and an increase of the Company’s issue premium in an amount of €400,070,000. After this capital increase, the Company’s capital amounted to €500,000,000, represented by 50,000,000 shares. For a description of the details of (ii) and (iii), reference is made to chapter 2.4.
B. the incorporation in the capital of the Company of the issue premium referred to under (A) above in an amount of €400,070,000 (without issuance of new shares), resulting in a capital of €900,070,000;
C. a capital decrease in an amount of €400,000,000 without cancellation of shares, resulting in a capital of €500,070,000, and an increase of the available reserves of the Company in the same amount; and
D. capital increase in cash in an amount of €180,580,828 by issuance of 18,055,555 shares and an increase of the issue premium in an amount of €144,419,162, resulting in a capital of €680,650,828, represented by 68,055,555 shares.
2.2 Shareholder evolutions Pursuant to our Articles of Association and Corporate Governance Charter, the applicable successive thresholds as regards the application of the law of 2 May 2007 (title II) on the disclosure of significant shareholdings in issuers whose shares are admitted to trading on a regulated market and other provisions and the Royal Decree of 14 February 2008 on the disclosure of significant shareholdings are set at 3%, 5%, 7.5%, 10% and any subsequent multiples of 5%.
In the course of 2014, the Company received the following transparency declarations:
1 The ‘2009 Belgian Code on Corporate Governance’ is available on the website of the Belgian Corporate Governance Committee (http://www.corporategovernancecommittee.be).
2 The English version of Ontex’ Corporate Governance Charter is available on the Ontex website (http://www.ontexglobal.com/sites/default/files/corporate_governance_charter_english.pdf).
38 Ontex Annual Review 2014
Corporate Governance
On June 27, 2014, the Company received a transparency declaration from Ameriprise Financial Inc stating that, on June 25, 2014, its affiliated entity Threadneedle Asset Management Holdings Limited held 2,620,726 shares of the Company, representing 3,85 % of the shares of the Company.
On June 27, 2014, the Company received a transparency declaration from GIC Private Ltd stating that, on June 25, 2014, GIC Private Ltd held 2,300,000 shares of the Company, representing 3,38 % of the shares of the Company.
On June 30, 2014, the Company received a transparency declaration from Aviva Plc and Aviva Investors Global Services Ltd stating that, on June 25, 2014, Aviva Investors Global Services Ltd held 2,080,783 shares of the Company, representing 3.06 % of the shares of the Company.
On July 1, 2014, the Company received a transparency declaration from The Goldman Sachs Group, Inc. and TPG Group Holdings (SBS) Advisors, Inc., and their affiliated entity Whitehaven B S.à r.l., and former/current members of the Executive Management Team of Ontex, acting in concert, stating that, on June 25, 2014, on an aggregated basis they held 39,045,816 shares of the Company, representing 57.37% of the shares of the Company.
On August 4, 2014, the Company received a transparency declaration from The Goldman Sachs Group, Inc. and TPG Group Holdings (SBS) Advisors, Inc., and their affiliated entity Whitehaven B S.à r.l., and former/current members of the Executive Management Team of Ontex, acting in concert, stating that, on July 29, 2014, on an aggregated basis they held 34,723,733 shares of the Company, representing 51.02% of the shares of the Company.
On September 16, 2014, the Company received a transparency declaration from AXA Investment Managers SA stating that, on August 7, 2014, AXA Investment Managers SA held 2,053,236 shares of the Company, representing 3.02 % of the shares of the Company.
On December 4, 2014, the Company received a transparency declaration from GIC Private Limited stating that GIC Private Limited, pursuant to the sale of shares on 4 December 2014, crossed the threshold of 3% of the total number of voting rights in the Company downwards as a result of sales of shares.
On December 8, 2014, the Company received a transparency declaration from Janus Capital Management LLC stating that, on December 5, 2014, Janus Capital Management held 2,293,433 shares of the Company, representing 3,37 % of the shares of the Company.
On December 9, 2014, the Company received a transparency declaration from GIC Private Ltd stating that, on December 9, 2014, GIC Private Ltd held 2,600,783 shares of the Company, representing 3,82 % of the shares of the Company.
On December 12, 2014, the Company received a transparency declaration from The Goldman Sachs Group, Inc. and TPG Group Holdings (SBS) Advisors, Inc., and their affiliated entity Whitehaven B S.à r.l., and former/current members of the Executive Management Team of Ontex, acting in concert, stating that, on December 8, 2014, on an aggregated basis they held 18,223,733 shares of the Company, representing 26,78 % of the shares of the Company.
In the course of 2015, the Company received additional transparency declarations, available on its website.
Amongst other, On March 13, 2015, the Company received a transparency declaration from The Goldman Sachs Group, Inc. and TPG Group Holdings (SBS) Advisors, Inc., and their affiliated entity Whitehaven B S.à r.l., and former/current members of the Executive Management Team of Ontex, acting in concert, stating that, on March 10, 2015, they crossed the threshold of 3% of the total number of voting rights in the Company downwards as a result of sales of shares.
2.3 Shareholder structureThe shareholder structure of the Company as at December 31, 2014, based on all transparency declarations received by the Company as at that date, was as follows:
Ownership structureNumber of
shares heldPercentage
(rounded)Whitehaven B S.à r.l. 14,941,338 22.0%Former Ontex management 1,179,111 1.7%Directors 1,139,307 1.7%Other members current management 963,977 1.4%Threadneedle Asset Management Holdings Ltd 2,620,726 3.9%GIC Private Ltd 2,600,783 3.8%Janus Capital Management LLC 2,293,433 3.4%Aviva Investors Global Services Ltd 2,080,783 3.1%AXA Investment Managers SA 2,053,236 3.0%Public 38,182,861 56.1%Total 68,055,555 100.0%
An actual overview of the shareholder structure pursuant to the transparency declaration received during 2015 can be consulted on our website http://www.ontexglobal.com/shares.
2.4 Relationship with and between the Company’s shareholdersGoldman Sachs Group, Inc. and TPG Global, LLCThe Goldman Sachs Group, Inc. (“GSCP”) and certain affiliates of TPG Global, LLC (“TPG”) have entered into a shareholders’ agreement as shareholders of Whitehaven A S.à r.l. and, indirectly, Whitehaven B S.à r.l. (the “Shareholders’ Agreement”) on June 30, 2014.
The Shareholders’ Agreement addresses certain matters relating to the governance and management of Whitehaven A S.à r.l., Whitehaven B S.à r.l. and the Company as well as the ownership and transfer of Whitehaven A S.à r.l. and Whitehaven B S.à r.l. shares and shares in the Company held by Whitehaven B S.à r.l. Pursuant to the terms of the Shareholders’ Agreement, GSCP and TPG have equal interests and voting rights in Whitehaven A S.à r.l., Whitehaven B S.à r.l. and the shares in the Company held by the latter. Among other things, GSCP and TPG have agreed that Whitehaven A S.à r.l. and Whitehaven B S.à r.l. are being managed by a board of directors and that each of GSCP and TPG will have the right to appoint an equal number of directors on that board. If however their shareholding interests in Whitehaven A S.à r.l. change, their director nomination rights may change accordingly. Please see chapter 4.7.
All decisions of Whitehaven B S.à r.l. with respect to the shares in the Company it holds, including how its shares in the Company will be voted at all Shareholders’ Meetings of the Company will be made by the Whitehaven B S.à r.l. board of directors. The Shareholders’ Agreement provides for restrictions on the ability of GSCP and TPG to transfer their Whitehaven A S.à r.l. shares.
Following the sale by Whitehaven B S.à r.l. of its shares in the Company on March 10, 2015 The Shareholders’ Agreement ceased to apply.
39Ontex Annual Review 2014
Corporate Governance

Arrangements with management shareholdersAlthough all of the Ontex II S.à r.l. shares and Ontex I S.à r.l. options held by the current executive management team and former managers prior to the IPO, were converted into shares of the Company immediately prior to the IPO (based on the offer price in the IPO), such management shareholders and Whitehaven B S.à r.l. agreed, prior to the IPO, that the economic entitlements under the Ontex II S.à r.l. shares and Ontex I S.à r.l. options should be preserved.
Accordingly, a substantial part of the shares in the Company issued to holders of Ontex II S.à r.l. shares at the time of the IPO represented their rollover investment in the Company at the time of its acquisition in 2010 and had definitively been earned by their holders. For the balance of the shares in the Company issued in respect of shares in Ontex II S.à r.l. and for the shares in the Company issued in respect of options in Ontex I S.à r.l., the entitlements of their holders were based on the exit multiple on a cash received basis for the Ontex II S.à r.l. shares and on the gain achieved on a cash received basis over a hurdle rate for the Ontex I S.à r.l. options, in each case in connection with realization on the investments of Whitehaven B S.à r.l. in the Ontex group.
Accordingly, the management shareholders agreed, prior to the IPO, with Whitehaven B S.à r.l. that the number of shares in the Company that each manager would hold immediately following the IPO could be adjusted later to give effect to the original economic entitlements. This was been formalized by the grant of call options by managers and Whitehaven B S.à r.l. permitting a manager to acquire shares from Whitehaven B S.à r.l. at a symbolic price in the case of an upwards adjustment and vice versa. Normally, as the entitlements are based on a cash received basis, the adjustments cannot be made until Whitehaven B S.à r.l. has disposed of all its shares in the Company;
however it was agreed that final adjustments would be made at an earlier date. This was when Whitehaven B S.à r.l. had disposed of 75% of the shares it held pre-IPO, or four years from the date of completion of the IPO if earlier. In the case where the 75% threshold is passed, the shares still owned at the adjustment date were to be valued at the price received in the transaction that causes the 75% threshold to be passed. Where the four-year time limit is exceeded, the shares still owned at the adjustment date will be valued based on the 30-day volume weighted average share price at that time.
Following the sale of shares by Whitehaven B S.à r.l. on March 10, 2015, the 75% threshold was passed and the adjustment mechanism was triggered.
The shares owned by managers are subject to lock-up and are held within an escrow arrangement. As and when shares are no longer subject to lock-up, the respective manager will be free to dispose of these shares.
2.5 Dealing and Disclosure CodeOn June 3, 2014, the Board approved the Ontex Dealing and Disclosure Code in accordance with provision 3.7 of the Corporate Governance Code. The Ontex Dealing and Disclosure Code restricts transactions in Ontex Group NV securities by members of the Board and the Executive Management Team and by the employees of Ontex and its subsidiaries during closed and prohibited periods. The Dealing and Disclosure Code also contains rules concerning the mandatory internal notification of intended transactions, as well as the disclosure of executed transactions through a notification to the Belgian Financial Services and Markets Authority. The Corporate Legal Counsel is the Compliance Officer for purposes of the Ontex Dealing and Disclosure Code.
3. Board and Board Committees 3.1 Board compositionOn December 31, 2014, the Board was composed as follows:
Name Position Other mandatesPosition
sinceMandate
expiresPaul Walsh Chairman Unilever PLC, Fedex Corporation, Avanti
Communications Group Plc, Compass Group plc, RM2 International SA, Formula 1
2014 2018
Charles Bouaziz Chief Executive Officer ESSEC Business School, Les Amis de Vaulserre et du Trieves, PAI Partners
2014 2018
Cepholli BVBA, represented by Jacques Purnode Chief Financial Officer Cepholli BVBA, John Martin's Breweries 2014 2018Artipa BVBA, represented by Thierry Navarre Chief Operating Officer Artipa BVBA 2014 2018Kite Consulting Ltd, represented by Richard Butland
Non-Executive Director Goldman Sachs International, Kite Capital, Kite Consulting Ltd, Influit UK Limited, Influit Asia Limited
2014 2018
Antonio Capo Non-Executive Director TPG Capital LLP, TES Global, Victoria Plumb, Business Club Italia
2014 2018
Stockbridge Mgt Ltd, represented by Simon Henderson
Non-Executive Director Stockbridge Mgt Ltd, TPG Capital LLP, Wessex Drainage Solutions Limited, Farleigh School
2014 2018
Uwe Krüger Non-Executive Director Atkins plc, SUSI Partners 2014 2018Alex Mignotte Non-Executive Director 2014 2018Michele Titi-Cappelli Non-Executive Director Goldman Sachs International, Hastings Insurance
Group (Investments) plc, Sigla S.A., GSCP V S.à r.l., 1 Cranley Gardens (Freehold) Limited
2014 2018
Inge Boets BVBA, represented by Inge Boets Independent Director Inge Boets Bvba, Euroclear plc, Econopolis Wealth Management NV, QRF Management NV, La Scoperta BVBA, VZW Altijd Mooi
2014 2018
Tegacon AS, Gunnar Johansson Independent Director Tegacon AS, Laeringsverkstedet AS, Hilding Anders AB, Askona Vek
2014 2018
Luc Missorten Independent Director Corelio NV, Barco NV, GIMV 2014 2018
40 Ontex Annual Review 2014
Corporate Governance
Marc Gallet has been appointed as corporate secretary by the Board of June 3, 2014.
The following paragraphs set out the biographical information of the current members of the Board, including information on other director mandates held by these members.
Paul Walsh, Chairman. Mr. Walsh was appointed Chairman of Compass Group PLC in February 2014 having previously been Chief Executive of Diageo plc since September 2000. Mr. Walsh has been Chairman of Avanti Communications plc since March 2014 and is a non-executive director of FedEx Corporation, Unilever plc and, RM2, and Formula 1. He is a senior advisor at TPG. Mr. Walsh has been appointed Business Ambassador for the food and drink industries by the UK Department for Business, Innovation and Skills. Mr. Walsh was appointed as Non-executive Director of Ontex Group NV as of June 2, 2014.
Charles Bouaziz, Chief Executive Officer. Prior to joining Ontex, Mr. Bouaziz held a number of senior positions during his 25 years in the consumer goods industry. He spent his early career at Michelin (in Canada) and Procter and Gamble before joining PepsiCo in 1991. Mr. Bouaziz joined PepsiCo as Marketing Director of France & Belgium and in 1996 became General Manager for France. In 2006, he became General Manager of a group of countries including France, Germany, Italy, Switzerland and Austria. In 2008, Mr. Bouaziz was appointed President of PepsiCo Western Europe. In 2010, he left PepsiCo and became CEO of Monoprix. Charles joined PAI Partners in 2010 as member of the Food & Consumer Goods sector team and later as head of the Portfolio Performance Group. Mr. Bouaziz graduated from École Supérieure des Sciences Economiques et Commerciales (ESSEC). Mr. Bouaziz was appointed as a manager of Ontex BVBA as of January 22, 2013 and as an Executive Director of Ontex Group NV as of April 24, 2014.
Jacques Purnode, Chief Financial Officer. Prior to joining Ontex, Mr. Purnode held a number of senior positions at AB InBev in various roles in finance as well as in information technology. From 2007, he worked for Coca Cola Enterprises, Inc. in London, where he most recently held the position of CFO for Europe. Mr. Purnode, as permanent representative of Cepholli BVBA, was appointed as a manager of Ontex BVBA as of August 1, 2013 and as an Executive Director of Ontex Group NV as of April 24, 2014.
Thierry Navarre, Chief Operating Officer. Mr. Navarre joined ONV Topco NV in May 2006 as the Group Supply Chain Director and was appointed Chief Operating Officer in February 2009. Before joining Ontex he was Director of Strategy & Development at InBev in France (now AB InBev), between July 2005 and May 2006, and held other senior management positions in supply and distribution at InBev, between 2001 and 2005. Prior to that, he held various roles in logistics and distribution at Fort James (now Georgia Pacific), between 1997 and 2001, and at Jamont (now Georgia Pacific) between 1991 and 1997. Mr. Navarre holds a degree in Business Administration from École Supérieure de Commerce de Nantes, France, and also has a master’s degree in Industrial Logistics from the Institut Supérieur de Logistique Industrielle (Groupe École Supérieure de Commerce), Bordeaux, France. Mr. Navarre, as permanent representative of Artipa Bvba, was appointed as a manager of Ontex BVBA as of March 29, 2011 and as an Executive Director of Ontex Group NV as of April 24, 2014.
Richard Butland, Non-Executive Director. Mr. Butland joined the board of Ontex in November 2010 as a representative of GSCP VI Funds. Mr. Butland joined Goldman Sachs in 2000 as an associate in the UK Advisory Group and was named managing director in 2006.
He was promoted to run UK M&A Advisory in 2007 and subsequently moved to the Merchant Banking Division to head its private equity activities in the UK and Consumer and Retail across Europe. On June 21, 2014 Mr. Butland’s employment with the firm has ceased. Going forward, Mr. Butland will continue to provide services to the firm on a consultancy basis. Prior to joining the firm, Mr. Butland worked at IBJ Schroder Bank for two years and at PricewaterhouseCoopers for five years. He earned a bachelor’s degree from Victoria University of Wellington in 1992 and qualified as a chartered accountant in 1995. Mr Butland was appointed as Non-Executive Director of Ontex Group NV as of June 2, 2014.
Antonio Capo, Non-Executive Director. Mr. Capo is an Operations Partner at TPG, which he joined in 2009. Prior to joining TPG, Mr. Capo was a Senior Director at Alvarez & Marsal from 2004 to 2009. He holds a BSc. in Economics from Bocconi University — Milan, an MA in European Economic Studies from the College of Europe — Bruges and an MBA from Stanford University’s Graduate School of Business. Mr Capo was appointed as Non-Executive Director of Ontex Group NV as of June 2, 2014.
Simon Henderson, Non-Executive Director. Mr. Henderson joined TPG as a partner in April 2010 and became a Senior Adviser in September 2014. He oversaw TPG’s investment in Ontex in November 2010 and has been a director of Ontex since that time. He has over 20 years of experience in finance and private equity. From 2005 to 2008, Mr. Henderson was a founder and Co-head of European Capital Financial Services, an affiliate of American Capital Strategies. During this time he made, monitored and realised control investments across a wide range of industries and sat on the investment committee of American Capital. He served on the boards of Farrow & Ball and Avery Weigh-Tronics during this period. From 1995 to 2005, Mr. Henderson made, monitored and realised a number of investments across a wide range of industries for Barclays Private Equity where he sat on the UK Investment Committee. This included board roles at London Luton Airport, Edotech, Fosbel, CRP and Lasercom. In 1994, he qualified as an Associate Chartered Accountant at PricewaterhouseCoopers in London. He graduated from the University of Durham with a BA degree in Economics in 1991. Mr Henderson was appointed as Non-Executive Director of Ontex Group NV as of June 2, 2014.
Dominique Le Gal, Non-Executive Director. Mr. Le Gal joined the board of Ontex in May 2012 as a representative of GSCP VI Funds. In January 2012, Mr. Le Gal became Co-General Manager of GS Lux Management Services S.à r.l. where he has a key role supporting the operational infrastructure for all investments made for Goldman Sachs funds in Luxembourg. From 1999 to 2011 he was in the Fund Reporting team at Archon Group (France) in Paris, a wholly owned subsidiary of The Goldman Sachs Group, Inc., where he served as head of investment accounting. Mr. Le Gal earned an Accounting and Finance degree in 1995 from ENGDE, Paris 9ème. Dominique Le Gal was appointed as a Non-Executive Director of Ontex Group NV as from June 2, 2014 and resigned with effect as of August 28, 2014.
Alexandre Mignotte, Non-Executive Director. Alexandre Mignotte is an Executive Director in the Merchant Banking Division (MBD) of Goldman Sachs in London, where he is responsible for sourcing, executing and managing corporate debt investments in France and Benelux. He joined the Merchant Banking Division of Goldman Sachs in May 2006, and was named Executive Director in 2012. Mr Mignotte represents GS Mezzanine Partners on the boards of Financiere Médisquare S.A.S. (Médi-Partenaires – MédipôleSud Santé) as an observer. He graduated from ESSEC Business School in 2006. Alex Mignotte was appointed as a Non-Executive Director of Ontex Group NV as of September 9, 2014, replacing Dominique Le Gal.
41Ontex Annual Review 2014
Corporate Governance
Uwe Krüger, Non-Executive Director. Prof. Dr. Krüger is the Chief Executive Officer of WS Atkins plc and a supervisory board member of SUSI Partners, Zurich. He started his career at AT Kearney and worked at Hochtief Group from 1997 to 2007, most recently as Chairman of Turner International. From 2007 to 2009, he was Chief Executive Officer of OC Oerlikon and subsequently served as President of Cleantech Switzerland and as a senior advisor at TPG. Prof. Dr. Krüger studied Physics, Mathematics and Business Sciences at Frankfurt University and researched at Columbia University, New York and École Normale Supérieure, Paris. He lectures as an Honorary Professor of Physics at Frankfurt University. Mr Krüger was appointed as Non-Executive Director of Ontex Group NV as of June 2, 2014.
Michele Titi-Cappelli, Non-Executive Director. Mr. Titi-Cappelli is a managing director in the Merchant Banking Division (MBD) of Goldman Sachs in London, where he is responsible for sourcing, executing and managing corporate investments in Southern Europe and in financial institutions. He first joined Goldman Sachs in 1999 as an analyst in the Investment Banking Division in London and rejoined the firm in 2004 as an associate in MBD in London. He became an executive director in 2007 and worked in the New York office in 2010. He was named managing director in 2012. Mr. Titi-Cappelli represents GSCP on the boards of Hastings Insurance Group (Investments) plc, Hastings Insurance Services Limited, Ontex and Sigla SA (Grupo Vips). He earned a Laurea in Economics and Business Administration, summa cum laude, from Bocconi University in Milan in 1999 and an MBA from the Stanford Graduate School of Business in 2004. Mr Titi-Cappelli was appointed as Non-Executive Director of Ontex Group NV as of June 2, 2014.
Inge Boets, Independent Director. Ms. Boets was a partner with EY (Ernst & Young) from 1996 through 2011 where she was the Global Risk leader and held several other roles in audit and advisory. She holds a masters degree in applied economics from the university of Antwerp. Ms. Boets is also independent director at Euroclear, Econopolis Wealth Management and QRF. Inge Boets, as permanent representative of Inge Boets Bvba, was appointed as Independent Director of Ontex Group NV as of June 30, 2014 and as chairman of the Audit and Risk Committee.
Gunnar Johansson, Independent Director. Mr. Johansson works as a Senior Executive Advisor at his own company, Tegacon AS, in Norway. Mr. Johansson has vast experience in emerging markets, business-to-business and fast moving consumer goods (“FMCG”). Prior to starting Tegacon AS, he held a number of positions within SCA AB, a global company in the tissue, femcare, baby diaper and incontinence care industries. Mr. Johansson worked with SCA from 1981 to 2010, the last years as Global President of the Hygiene Category. He holds an MBA from Norges Handelshøyskole in Bergen, Norway. Mr. Johansson has vast experience in emerging markets and the business-to-business side of fast moving consumer goods (“FMCG”). He is Non-Executive Chairman of Laeringsverkstedet, Norway and a member of the board of Hilding Anders in Sweden, and Askona in Russia. He was previously a member of the board of Orkla Brands, the largest FMCG company in Norway. Gunnar Johansson was appointed as Independent Director of Ontex Group NV as of June 30, 2014.
Luc Missorten, Independent Director. Mr. Missorten has been the Chief Executive Officer and a board member of Corelio from 2007. As from September 2014, he resigned as Chief Executive Officer from Corelio but remains as member of the board. He is an Independent Director of Barco, chairs its audit committee and is a member of its remuneration committee. He is also an Independent Director of GIMV where he chairs the audit committee. From 1995 to 2007, he served as Executive Vice President and Chief Financial Officer for Labatt Brewing Company, Interbrew (now AB InBev) and most recently UCB. He also
served as the Corporate Finance Director for Interbrew from 1990 to 1995 and a Vice President of Citibank from 1981 to 1990. He holds a law degree from Catholic University of Leuven, a Certificate of Advanced European Studies from College of Europe, Brugge and an LL.M from the University of California, Berkeley. Luc Missorten, was appointed as Independent Director of Ontex Group NV as of June 30, 2014 and as chairman of the Remuneration and Nomination Committee.
3.2 Board: evolutions in composition during 2014On December 31, 2014, the Board of the Company was composed of 13 members. With the exception of the CEO, COO and CFO, all Board members are Non-Executive Directors.
There are currently three Independent Directors within the meaning of Article 526ter of the Belgian Companies Code: Luc Missorten, Tegacon AS (with permanent representative Gunnar Johansson) and Inge Boets BVBA (with as permanent representative Inge Boets).
On April 24, 2014, on the date of the incorporation of the Company, the shareholders appointed Charles Bouaziz, Artipa BVBA (with permanent representative Thierry Navarre) and Cepholli BVBA (with permanent representative Jacques Purnode) as Board members of the Company.
On June 2, 2014, the shareholders appointed Dominique Le Gal, Simon Henderson, Richard Butland, Michele Titi-Cappelli, Antonio Capo, Uwe Krüger and Paul Walsh as Board members of the Company. On the same day, the shareholders appointed Inge Boets BVBA (with permanent representative Inge Boets), Gunnar Johansson and Luc Missorten as Board member of the Company, subject to and with effect as from closing of the IPO.
On September 9, 2014, the Board acknowledged the resignation of Dominique Le Gal with effect as of August 28, 2014 and appointed Alexandre Mignotte with effect as of September 9, 2014, in accordance with Article 519 of the Belgian Companies Code and subject to the approval of the Shareholders’ Meeting.
With effect as of October 1, 2014, the Board approved the replacement of Gunnar Johansson by Tegacon AS, with permanent representative Gunnar Johansson, in accordance with Article 519 of the Belgian Companies Code and subject to the approval of the Shareholders’ Meeting.
With effect as of October 1, 2014, the Board approved the replacement of Richard Butland by Kite Consulting Ltd with permanent representative Richard Butland, in accordance with Article 519 of the Belgian Companies Code and subject to the approval of the Shareholders’ Meeting.
With effect as of October 1, 2014, the Board approved the replacement of Simon Henderson by Stockbridge Mgt Ltd, with permanent representative Simon Henderson, in accordance with Article 519 of the Belgian Companies Code and subject to the approval of the Shareholders’ Meeting.
Board: evolutions in composition during 2015Following the sale of all remaining shares by Whitehaven B SARL, the Board acknowledged the resignation of the six directors representing Whitehaven B SARL, being Alex Mignotte, Antonio Capo, Michele Titi-Cappelli with effect as from March 10 2015, and Paul Walsh, Richard Butland, as permanent representative of Kite Consulting Ltd, and Simon Henderson, as permanent representative of Stockbridge Mgt Ltd with effect as from April 10 2015.
42 Ontex Annual Review 2014
Corporate Governance

Subsequent to these changes, and with effect as from April 10 2015:
●● Luc Missorten has been appointed as Chairman of the Board; ●● Tegacon AS, with Gunnar Johansson as permanent representative, has been appointed as Chairman of the Remuneration and Nomination Committee, in replacement of Luc Missorten;●● The Board approved the replacement of Luc Missorten by Revalue Bvba, with permanent representative Luc Missorten, in accordance with Article 519 of the Belgian Companies Code and subject to the approval of the Shareholders’ Meeting.
3.3 Gender diversityOn December 31, 2014, Ontex had one female member on its Board, i.e. Inge Boets as permanent representative of Inge Boets BVBA, representing around 8% of the Board members. Since its incorporation on 24 April 2014, the Remuneration and Nomination Committee evaluates the composition of the Board on a yearly basis and formulates suggestions to the Board, among other things taking into account the gender composition, in order to obtain, according to article 96 § 2, 6de of the Belgian Companies’ Code, that by 2020 at least one third of the members of the Board is of the opposite gender.
3.4 Functioning of the Board The Board has met 12 times, of which 7 meetings were by conference call, since the incorporation of the Company on April 24, 2014, including 9 times after the closing of the IPO. The attendance rate of its members was as follows:
Name Boards Attendance
RatePaul Walsh 12/12 100%Charles Bouaziz1 11/12 92%Cepholli BVBA, represented by Jacques Purnode 12/12 100%Artipa BVBA, represented by Thierry Navarre 12/12 100%Kite Consulting Ltd, represented by Richard Butland
10/12 83%
Antonio Capo2 12/12 100%Stockbridge Investment Mgt Ltd, represented by Simon Henderson
12/12 100%
Uwe Krüger2 12/12 100%Dominique Le Gal 5/5 100%Alex Mignotte 7/7 100%Michele Titi-Cappelli 12/12 100%Inge Boets BVBA, represented by Inge Boets 9/9 100%Tegacon AS, Gunnar Johansson 9/9 100%Luc Missorten 9/9 100%
1 Unable to participate in 1 Board meeting due to unforeseen travel delay.2 Participated in 1 day of a 2 day Board meeting.
Major matters reviewed by the Board during 2014 included, amongst others:
●● the Initial Public Offering; ●● the Refinancing project, as described under note 7.15 of the Financial Statements;●● the approval of the half year and quarterly financial statement and financial report; ●● the financial and overall performance of the Ontex group; ●● investment and M&A projects;●● General strategic, financial and operational matters of the Company.
Under the lead of its Chairman, the Board will regularly (e.g. at least every two to three years) assess its size, composition, performance and those of its committees, as well as its interaction with the executive management.
3.5 Board Committees3.5.1 Audit and Risk CommitteeOn December 31, 2014, the Audit and Risk Committee was composed as follows:
Name Position Position
sinceMandate
expiresInge Boets BVBA, represented by Inge Boets
Independent, Chairman of the committee
2014 2018
Luc Missorten Independent 2014 2018
Tegacon AS, represented by Gunnar Johansson
Independent 2014 2018
Stockbridge Mgt Ltd, represented by Simon Henderson
Non-Executive 2014 2018
The Audit and Risk Committee of Ontex met three times during 2014. All members attended all meetings. These meetings were also always attended by Marc Gallet, Corporate Secretary. Charles Bouaziz, Jacques Purnode, and Thierry Navarre were invited and attended two meetings. The Audit and Risk Committee is entrusted with the tasks set out in Article 526bis, §4 of the Belgian Companies Code It decided on the agenda, frequency and topics of the meetings, and reviewed the external and internal audit plan, the half year financial statements, and the external audit on the half year financial statements, the key risks, and their role and responsibility.
As required by the Belgian Companies Code, Ontex Group NV confirms that Inge Boets, as permanent representative of Inge Boets Bvba, chairman of the Audit and Risk Committee, possesses the adequate expertise and experience in this field. Reference is made to her biography under chapter 3.1.
3.5.2 Remuneration and Nomination Committee On December 31, 2014, the Remuneration and Nomination Committee was composed as follows:
Name Position Position
sinceMandate
expiresLuc Missorten Independent,
Chairman of the committee
2014 2018
Inge Boets BVBA, represented by Inge Boets
Independent 2014 2018
Tegacon AS, represented by Gunnar Johansson
Independent 2014 2018
Stockbridge Mgt Ltd, represented by Simon Henderson
Non-Executive 2014 2018
Michele Titi-Cappelli Non-Executive 2014 2018
Following the IPO, the Remuneration and Nomination Committee met three times during 2014. All members attended all meetings. These meetings were always attended by Charles Bouaziz, while two out of the three meetings were also attended by Astrid De Lathauwer, Group HR Director.
The Remuneration and Nomination Committee is entrusted with the tasks set out in Article 526quater, §5 of the Belgian Companies Code decided on the agenda, frequency and topics of the meetings, and reviewed the context and history with respect to board composition, executive remuneration and terms and conditions of employment before and after the IPO. The Remuneration and Nomination Committee also reviewed the performance of the group against the KPI’s and targets determined for the 2014 performance year.
43Ontex Annual Review 2014
Corporate Governance

As required by the Belgian Companies Code, Ontex Group NV confirms that Luc Missorten and Gunnar Johansson, as permanent representative of the Tegacon AS, possess the adequate expertise and experience in this field. Reference is made to their biography under chapter 3.1.
3.5.3 Executive Committee The operational management of the Company is provided by the Executive Management Team under the leadership of the CEO and in accordance with the general policy orientations determined by the Board and under its supervision. The Executive Committee exercises the duties assigned to it by the Board and the CEO, under the ultimate supervision of the Board.
The Executive Committee is composed of the CEO, who chairs the Executive Committee, and the other members of the Executive Management Team. The Executive Committee does not constitute an executive committee within the meaning of Article 524bis of the Belgian Companies Code (“directiecomité”).
Per December 31, 2014, the Executive Management Team and, accordingly, the Executive Committee, consisted of the following members:
Name Position AppointedCharles Bouaziz Executive Director – Chief
Executive Officer2013
Jacques Purnode Executive Director – Chief Financial Officer
2013
Thierry Navarre Executive Director – Chief Operating Officer
2009
Philippe Agostini Group Chief Procurement and Supply Chain Officer
2013
Laurent Bonnard Group Sales Director 2013Oriane Perraux Group Marketing Director 2013Annick De Poorter Group R&D and Quality Director 2009Martin Gärtner Group Manufacturing Director 2009Astrid De Lathauwer Group HR Director 2014Özgür Akyıldız General Manager – Middle East
and Africa Division2008
Arnauld Demoulin General Manager – Mature Market Retail Division
2013
Xavier Lambrecht General Manager – Healthcare Division
2013
Thierry Viale General Manager – Growth Markets Division and Strategic Development
2013
The following paragraphs set out the biographical information of the current members of the Executive Management Team, including information on other director mandates held by these members.
Charles Bouaziz, Chief Executive Officer. See “3.1 Board Composition” above.
Jacques Purnode, Chief Financial Officer. See “3.1 Board Composition” above.
Thierry Navarre, Chief Operating Officer. See “3.1 Board Composition” above.
Philippe Agostini, Group Chief Procurement & Supply Chain Officer, was appointed as CPO in charge of Purchasing & Supply Chain functions of the Ontex group on September 1, 2013. Mr. Agostini
previously held various senior positions in Purchasing and Supply Chain for 25 years, at Mars, McDonald’s, Lactalis, Pechiney-Alcan, JohnsonDiversey, and most recently Famar, where he held the position of Group Purchasing VP. Mr. Agostini was appointed as a manager of Ontex BVBA as of September 1, 2013.
Laurent Bonnard, Group Sales Director, was appointed Group Sales Director of Ontex BVBA on September 9, 2013. Laurent has held various senior positions within Sales and Marketing in Mars and Quaker. Subsequently he joined Pepsico, as Sales Director France and last held the position of VP Business Development for Europe. Laurent Bonnard was appointed as a manager of Ontex BVBA as of September 9, 2013.
Oriane Perreaux, Group Marketing Director, joined Ontex BVBA on June 1, 2013. Prior to joining Ontex, Mrs. Perreaux held a number of marketing positions at Procter & Gamble France and International. Since 2011, she worked for Carrefour Group, where she held the position of International Brand Director for Carrefour Baby and Carrefour Kids. Mrs. Perreaux was appointed as a manager of Ontex BVBA as of June 1, 2013.
Annick De Poorter, Group R&D and Quality Director, joined the Ontex group in 2003 as the R&D Manager of Feminine Hygiene and was promoted to R&D and Quality Director in January 2009. Before joining the Ontex group, Ms. De Poorter was the R&D Engineer Technical Products at Libeltex BVBA in Belgium. Prior to that, she was a Scientific Researcher at University of Ghent, Faculty of Engineering, Department of Textiles, Ghent, Belgium. Ms. De Poorter holds a master’s degree in Civil Engineering in Textiles from the University of Ghent, Belgium. She also holds a certificate “Internal Auditor ISO 9000 : 2000” from Lloyd’s Register.
Martin Gärtner, Group Manufacturing Director, joined the Ontex group in 1997 as an Assistant Production Manager and was promoted to Group Manufacturing Director in 2009. Before becoming Group Manufacturing Director, Mr. Gartner held the positions of Production Manager, Plant Manager and General Manager of Ontex. Prior to joining Ontex, Mr. Gartner spent two years as a trainee at Wirths J. Hygiene GmbH in Germany. Mr. Gartner holds a Diploma–Kfm. in Production Technique and Industrial Controlling from the Technical University in Aachen, Germany.
Özgür Akyıldız, General Manager of the Middle East and Africa Division, joined the Ontex group in 2002 as an Assistant Sales and Marketing Manager and was appointed General Manager of the Turkey Regional Divisionin May 2008. Before joining the Ontex group, Mr. Akyıldız was Product Manager at Digiturk A.S in Istanbul, between May 2001 and August 2002, and Sales Supervisor, between October 1999 and May 2001. Mr. Akyıldız holds a degree in Business Administration from Bog azici University, Istanbul, Turkey.
Arnauld Demoulin, General Manager of the Mature Market Retail Division, joined the Ontex group in July 2002 as the Retail Brand Manager and was appointed General Manager of the Healthcare Division in January 2010, and subsequently appointed General Manager of the Mature Market Retail Division in September 2013. Mr. Demoulin was previously the Group’s General Manager of the FBSI Division and Category Director. Before joining the Ontex group, Mr. Demoulin was a Division Manager at Robert Half International in Belgium. Prior to that, Mr. Demoulin spent eight years, between 1993 and 2000, holding various positions in the commercial division at Procter & Gamble, Belgium. Mr. Demoulin holds a degree in Economical Sciences from Institut Catholique des Hautes Etudes Commerciales, Brussels, Belgium. Mr. Demoulin was appointed as a manager of Ontex BVBA as of March 29, 2011.
44 Ontex Annual Review 2014
Corporate Governance
Xavier Lambrecht, General Manager of the Healthcare Division, joined the Ontex group early 2009 as Sales & Marketing Director of the Health Care Division. Prior to that, he held different roles within Sales Development and Business Planning at Imperial Tobacco. Mr. Lambrecht was appointed as a manager of Ontex BVBA as of February 1, 2014.
Thierry Viale, General Manager of the Growth Markets Division and Strategic Development, was appointed as General Manager of the Growth Markets Division and Strategic Development on October 1, 2013. Prior to joining Ontex, Mr. Viale held a number of senior positions at Procter & Gamble in Western Europe, Russia, Nigeria/ West Africa, Greater China, the Balkans and in India. Mr. Viale was appointed as a manager of Ontex BVBA as of October 1, 2013.
Astrid De Lathauwer, Group Human Resources Director, joined Ontex after holding a number of leading human resources functions. Mrs. De Lathauwer held international HR leadership roles at AT&T in Europe and at their U.S. headquarters, and at Monsanto. For 10 years Mrs. De Lathauwer was the Chief HR officer of Belgacom. Before joining Ontex, she was Managing Director of Acerta Consult. Mrs. De Lathauwer holds degrees in Political & Social Science and History of Art. Mrs. De Lathauwer was appointed as a manager of Ontex BVBA as of October 1, 2014.
During 2014, the Executive Management Team met monthly and discussed general strategic topics.
4. Relevant information in the event of a takeover bid Article 34 of the Royal Decree of 14 November 2007 requires that listed companies disclose certain items that may have an impact in the event of a take-over bid.
4.1 Capital Structure A comprehensive overview of our capital structure as at December 31, 2014 can be found in chapters 2.1 and 2.3 of this Corporate Governance Statement.
4.2 Restrictions on transfers of securitiesOntex’ Articles of Association do not impose any restrictions on the transfer of the shares in the Company. Furthermore, the Company is not aware of any restrictions imposed by Belgian law except in the framework of market abuse rules.
4.3 Holders of securities with special control rightsThere are no such holders of securities.
4.4 Employee stock plans where the control rights are not exercised directly by the employees
The Ontex shares to be delivered to participants upon exercise of the stock options or vesting of the restricted stock units in the framework of the LTIP 2014 are existing ordinary shares of Ontex with all rights and benefits attached to such shares.
The Company has not set up employee share plans where control rights over the shares are not exercised directly by the employees.
4.5 Restriction on voting rightsOntex’ Articles of Association do not contain any restrictions on the exercise of voting rights by the shareholders, provided that the shareholders concerned comply with all formalities to be admitted to the Shareholders’ Meeting and their voting rights are not suspended in one of the events set out in the Articles of Association or the Belgian Companies Code.
4.6 Shareholders’ agreementsWhitehaven B S.à r.l. as well as certain members of the former and current management have entered into a shareholders’ agreement containing restrictions on the transfer of their securities. More detail on this matter can be found in chapter 2.4 of this Corporate Governance Statement.
4.7 Rules on appointment and replacement of members of the Board and amendments to the Articles of Association
The Articles of Association provide for nomination rights in favor of Whitehaven B S.à r.l. For as long as Whitehaven B S.à r.l. continues to hold at least 60% of the total number of shares it held immediately after the closing of the initial public offering of the shares of the Company, pursuant to the notification then made by such shareholder in accordance with the law of 2 May 2007 on the disclosure of significant shareholdings in issuers whose shares are admitted to trading on a regulated market and other provisions, six board members shall be elected by the Shareholders’ Meeting upon its proposal. If such percentage falls below 60% but remains equal to or greater than 40%, four board members shall be elected by the Shareholders’ Meeting upon proposal of Whitehaven B S.à r.l. If such percentage falls below 40% but remains equal to or greater than 10%, two board members shall be elected by the Shareholders’ Meeting upon proposal of Whitehaven B S.à r.l. If the share ownership of Whitehaven B S.à r.l. falls below one of the above specified thresholds, the nomination rights relating to such threshold will continue to apply until the next Shareholders’ Meeting.
In this respect, given Whitehaven B S.à r.l. has disposed of its shares in the Company, as described under chapter 2.2 of this Corporate Governance Statement, a proposal has been included for approval on the agenda of the upcoming Ordinary Shareholders’ Meeting of May 26, 2015, containing the amendment of the relevant provisions in the Articles of Association of the Company in order to remove the nomination rights and the references thereto.
Save for capital increases decided by the Board within the limits of the authorized capital, only an Extraordinary Shareholders’ Meeting is authorized to amend Ontex’ Articles of Association. A Shareholders’ Meeting may only deliberate on amendments to the Articles of Association if at least 50% of the capital is represented. If the above attendance quorum is not reached, a new Extraordinary Shareholders’ Meeting must be convened, which will validly deliberate regardless of the portion of the registered capital represented at the Shareholders’ Meeting. As a general rule, amendments to the Articles of Association are only adopted if approved by at least 75% of the votes cast. The Belgian Companies Code provides for more stringent majority requirements in specific instances, such as for modifications of the Company’s corporate purpose clause.
4.8 Authorized capital – Acquisition of own sharesAuthorized capitalOn June 10, 2014, the Extraordinary Shareholders’ Meeting authorized the Board, subject to and with effect as from the closing of the IPO, to increase the capital of the Company in one or several times by a (cumulated) amount of maximum 50% of the amount of the registered capital (€340,325,414) as such amount was recorded immediately after the closing of the IPO. Within the framework of the authorized capital, the Board is authorized to proceed with a capital increase in any form, including, but not limited to, a capital increase in cash or in kind and by issuance of shares, convertible bonds, warrants or other securities.
The Board is authorized to limit or cancel the preferential subscription rights of the shareholders within the limits and in accordance with the provisions set out in the Articles of Association and the Belgian Companies Code.
45Ontex Annual Review 2014
Corporate Governance

This authorization includes the limitation or cancellation of the preferential subscription rights for the benefit of one or more specific persons and in connection with capital increases in the event of a public takeover bid.
The authorization is valid for a term of five years as from the date of the publication of the authorization in the Annexes to the Belgian State Gazette (“Belgisch Staatsblad”), i.e. five years as from July 9, 2014. In connection with capital increases in the event of a public takeover bid, the authorization is only valid for a term of three years as from the date of the Extraordinary Shareholders’ Meeting of June 10, 2014.
Acquisition of own sharesOn June 10, 2014, the Extraordinary Shareholders’ Meeting authorized the Board to purchase up to 20% of its own shares, profit-sharing certificates or associated certificates, for a price not more than 10% below the lowest closing price in the last thirty trading days preceding the transaction and not more than 5% above the highest closing price during the last thirty trading days preceding the transaction. This authorization is valid for five years from June 10, 2014.
This authorization is also valid if the acquisition is made by one of the subsidiaries directly controlled by the Company, as set out in Article 627 of the Belgian Companies Code.
The Board is also authorized to acquire for the Company’s account the Company’s own shares, profit-sharing certificates or associated certificates if such acquisition is necessary to prevent a serious and imminent harm to the Company. This authorization is valid for three years as from the date of the publication of the authorization in the Annexes to the Belgian State Gazette (“Belgisch Staatsblad”).
4.9 Material agreements to which Ontex is a party containing change of control provisions
The €480,000,000 five-year multicurrency facilities agreement dated November 10, 2014 entered into by the Company as Original Borrower and Original Guarantor and, among others, the Original Lenders as set out therein and Wilmington Trust (London) Limited as Security Agent, as well as the offering memorandum relating to the €250,000,000 4.75% Senior Secured Notes due 2021, may be triggered in the event of a change of control over the Company. The relevant provisions have been included for approval on the agenda of the upcoming Ordinary Shareholders’ Meeting of May 26, 2015, in accordance with Article 556 of the Belgian Companies Code.
The relevant clauses in the five-year multicurrency facilities agreement, among other things, provide that, in case any person or group of persons acting in concert (other than the Initial Investors and Management defined therein) acquiring, directly or indirectly, beneficial ownership of the issued capital of the Company having the right to cast more than 50% of the votes capable of being cast in a Shareholders’ Meeting of the Company, this may lead to a mandatory prepayment and cancellation under the multicurrency facilities agreement. The relevant clauses in the offering memorandum relating to the €250,000,000 4.75% Senior Secured Notes due 2021, among other things, grant the holders of the notes the right to require the repurchase of all or any part of the notes at a purchase price in cash in an amount equal to 101% of the principal amount thereof, plus accrued and unpaid interest, in the event of a change of control of the Company as defined in the offering memorandum.
4.10 Severance pay pursuant to termination of contract of Board members or employees pursuant to a take-over bid
Ontex has not concluded any agreement with its Board members or employees which would result in the payment of a specific
severance pay if, pursuant to a takeover bid, the Board members resign, are dismissed or their employment agreements are terminated.
Please see chapter 8.6 on termination provisions in general.
5. Conflicts of interestEach Board member should arrange his/her personal and business affairs in such a way as to avoid any conflict of interest of a personal, professional or financial nature with the Company, directly or through relatives (including spouse or life companion, or other relatives by blood or marriage up to the second degree and foster children).
In accordance with Article 523 of the Belgian Companies Code, if a Board member has a direct or indirect patrimonial interest in a decision or transaction which is the responsibility of the Board of Directors, he/she must inform the other Board members before deliberation by the Board of Directors. For listed companies, the conflicted Board member cannot be present during the deliberations of the Board of Directors relating to these transactions or decisions, and cannot participate in the voting. A conflict of interests within the meaning of Article 523 of the Belgian Companies Code arose on five occasions in 2014, and the provisions of Article 523 Belgian Companies Code were complied with on such occasions.
Management agreements with Charles Bouaziz, Cepholli BVBA and Artipa BVBAOn June 3, 2014 the Board resolved on the entering into of the management agreements with Charles Bouaziz, Cepholli BVBA, represented by Jacques Purnode, and Artipa BVBA, represented by Thierry Navarre. Although Article 523 of the Belgian Companies’ Code did not prevent them from attending the meeting and voting as the Company was not yet a listed company, nevertheless Charles Bouaziz, Jacques Purnode and Thierry Navarre, as permanent representatives of their respective management companies Cepholli BVBA and Artipa BVBA decided to abstain from the deliberation and voting on this decision. The relevant section of the minutes can be found below in its entirety:
Conflicts of interestPrior to discussing this item on the agenda, Charles Bouaziz, director of the Company, and Jacques Purnode and Thierry Navarre, permanent representatives of their respective management companies Cepholli BVBA and Artipa BVBA, directors of the Company, declare to have an interest of a patrimonial nature which is conflicting with the decisions that fall within the scope of the powers of the board of directors, in respect of the entry into of their management agreements with the Company (the “Management Agreements”).
This conflict of interest results from the fact that Charles Bouaziz, Cepholli BVBA and Artipa BVBA are both directors of the Company and a party to the Management Agreements.
The Management Agreements will have financial consequences for the Company as they will require the Company to pay a management fee to Charles Bouaziz, Cepholli BVBA and Artipa BVBA as compensation for the provision of their services under the Management Agreements.
Under Article 523 of the Companies Code, a conflict of interest in a company not making or having made a public appeal on savings does not prevent the directors in question from taking part in the deliberations and from voting on the decision for which a potential conflict of interest exists. However, Charles Bouaziz, Cepholli BVBA (represented by its permanent representative Jacques Purnode) and Artipa BVBA (represented by its permanent representative Thierry Navarre) have decided that they will
46 Ontex Annual Review 2014
Corporate Governance
nevertheless refrain from taking part in the deliberations and from voting on the approval of the entry into of the Management Agreements.
In accordance with Article 523 of the Companies Code, the auditor of the Company, PricewaterhouseCoopers Bedrijfsrevisoren BV CVBA, permanently represented by Peter Opsomer BV BVBA, in turn represented by its permanent representative Peter Opsomer, has been informed of the existence of the conflicts of interest.
Furthermore, the relevant sections of these minutes will be entirely included in the annual report of the board of directors.
Approval of the Management AgreementsThe board of directors took note of the Management Agreements.
Informed of the existence of a conflict of interest with respect to these agreements, the board of directors decided nevertheless to approve the entry into thereof. The Company requires highly qualified specialists with extensive experience and expertise in its field of business. The board of directors is of the opinion that Charles Bouaziz, Cepholli BVBA (represented by its permanent representative Jacques Purnode) and Artipa BVBA (represented by its permanent representative Thierry Navarre) have these skills.
The board of directors has concluded that the Management Agreements are in the interest of the Company, given that, even though they involve the payment by the Company to Charles Bouaziz, Cepholli BVBA and Artipa BVBA of a management fee, those management fees are proportionate for the services to be provided by these managers to the Company.
RESOLVED that the Management Agreements be approved in the form presented to the board of directors.”
Underwriting AgreementOn June 3, 2014, the Board resolved on the entering into of the Underwriting Agreement. Although Article 523 of the Belgian Companies Code did not prevent them from attending the meeting and voting as the Company was not yet a listed company, nevertheless Paul Walsh and Charles Bouaziz, directors of the company, and Jacques Purnode and Thierry Navarre, permanent representatives of their respective management companies Cepholli BVBA and Artipa BVBA, directors of the company, decided to abstain from the deliberation and voting on this decision, based on their involvement in the IPO. The relevant section of the minutes can be found below in its entirety:
Conflicts of interestPrior to discussing this item on the agenda, Charles Bouaziz and Paul Walsh, directors of the Company, and Jacques Purnode and Thierry Navarre, permanent representatives of their respective management companies Cepholli BVBA and Artipa BVBA, directors of the Company, declare to have an interest of a patrimonial nature which is conflicting with the decisions that fall within the scope of the powers of the board of directors, in respect of certain provisions of the underwriting agreement to be entered into between the Company, Ontex I S.à r.l., the Selling Shareholders and the Underwriters with respect to the Offering (as defined below) (the “Underwriting Agreement”). All capitalised terms in sections 6.1 and 6.2 have the meaning defined in the draft Underwriting Agreement.
This conflict of interest results from the fact that Charles Bouaziz, Paul Walsh, Jacques Purnode and Thierry Navarre are, either in personal name or via their management company, both directors of the Company and also a party to the Underwriting Agreement in their capacity as a Selling Shareholder. The Underwriting Agreement (i) will require the Company to pay all expenses, fees and commissions, including those related to the initial public offering of the existing ordinary shares in the Company
to be sold by Charles Bouaziz, Paul Walsh, Jacques Purnode and Thierry Navarre, and (ii) contains an indemnity from the Company in respect of the Offering that is more extensive than any indemnity given by the Selling Shareholders.
The Company will:
on the Closing Date of the Offering, be required to pay a commission of 1.75% of the amount equal to the final offer price multiplied by the number of Firm Shares (i.e., the new shares issued by the Company and shares sold by the Selling Shareholders in the Offering) subscribed and/or purchased by the Underwriters;
if the Over-allotment Option is exercised, the Company will pay a commission of 1.75% of the amount equal to the final offer price multiplied by the aggregate number of Option Shares (i.e. the shares sold by Whitehaven B and the MIP I Selling Shareholders (i.e., certain individual management Selling Shareholders) for the purposes of covering sales of the Shares in excess of the Firm Shares and for facilitating stabilizing activities) sold and purchased by the Underwriters.
In addition, the Company may (in its sole discretion, and subject to the Underwriting Agreement not having been terminated) also pay the Underwriters an additional discretionary fee of up to 1.25% of the amount equal to the final offer price multiplied by the number of ordinary shares issued and/or sold by the Company and the Selling Shareholders and subscribed and/or purchased by the Underwriters. All of the commissions shall be paid together with any VAT or other similar tax chargeable thereon.
Under Article 523 of the Companies Code, a conflict of interest in a company not making or having made a public appeal on savings does not prevent the directors in question from taking part in the deliberations and from voting on the decision for which a potential conflict of interests exists. However, Charles Bouaziz, Paul Walsh, Cepholli BVBA (represented by its permanent representative Jacques Purnode) and Artipa BVBA (represented by its permanent representative Thierry Navarre) have decided that they will nevertheless refrain from taking part in the deliberations and from voting on those matters described above.
In accordance with Article 523 of the Companies Code, the auditor of the Company, PricewaterhouseCoopers Bedrijfsrevisoren BV CVBA, permanently represented by Peter Opsomer BV BVBA, in turn represented by its permanent representative Peter Opsomer, has been informed of the existence of the conflicts of interest.
Furthermore, the relevant sections of these minutes will be entirely included in the annual report of the board of directors.
Approval of the provisions in the draft Underwriting Agreement for which a conflict of interest existsThe board of directors took note of the draft Underwriting Agreement.
Informed of the existence of a conflict of interest with respect to this agreement as set out above, the board of directors decided nevertheless to approve the fact that (i) the Company will pay all expenses, fees and commissions, including those related to the initial public offering of the existing ordinary shares in the Company to be sold by Charles Bouaziz, Paul Walsh, Jacques Purnode and Thierry Navarre, and (ii) the Company will grant an indemnity in respect of the Offering that is more extensive than any indemnity given by the Selling Shareholders.
The board of directors acknowledges that the terms and conditions of the draft Underwriting Agreement are part of the commercial agreement between all parties involved and are necessary to enable a successful initial public offering of the Company which the board of directors deems to be in the interest of the Company as it entails, a.o., reduced borrowing costs
47Ontex Annual Review 2014
Corporate Governance
and future access to the capital markets. As a result, the board of directors has concluded that the entry into of the Underwriting Agreement is in the interest of the Company.
RESOLVED that the provisions in the draft Underwriting Agreement on those matters described above be approved.”
LTIP 2014On June 3, 2014, the Board resolved on the entering into of the Long Term Incentive Plan. Although Article 523 of the Belgian Companies Code did not prevent them from attending the meeting and voting, nevertheless Charles Bouaziz, Jacques Purnode and Thierry Navarre, as permanent representatives of their respective management companies Cepholli BVBA and Artipa BVBA decided to abstain from the deliberation and voting on this decision, based on the fact they are eligible participants in the Long Term Incentive Plan. The relevant section of the minutes can be found below in its entirety:
Conflicts of interestPrior to discussing this item on the agenda, Charles Bouaziz, director of the Company, and Jacques Purnode and Thierry Navarre, permanent representatives of their respective management companies Cepholli BVBA and Artipa BVBA, directors of the Company, declare to have an interest of a patrimonial nature which is conflicting with the decisions that fall within the scope of the powers of the board of directors in respect of the long term incentive plan to be adopted by the Company (the “Long Term Incentive Plan”), a term sheet of which shall remain attached to the minutes of this meeting as Annex 8.
This conflict of interest results from the fact that Charles Bouaziz, Jacques Purnode and Thierry Navarre are, either in personal name or via their management company, both directors of the Company and also potential beneficiaries of stock options and restricted stock units under the Long Term Incentive Plan.
The Long Term Incentive Plan will have financial consequences for the Company to the extent that, in respect of the stock options, it can result in a transfer of shares in the Company to the beneficiaries under the Long Term Incentive Plan at a price which is lower than the market price of those shares at the moment of the exercise of the stock options. In respect of the restricted stock units it will, upon vesting, result in a transfer of shares to the beneficiaries for no consideration.
Under Article 523 of the Companies Code, a conflict of interest in a company not making or having made a public appeal on savings does not prevent the directors in question from taking part in the deliberations and from voting on the decision for which a potential conflict of interests exists. However, Charles Bouaziz, Cepholli BVBA (represented by its permanent representative Jacques Purnode) and Artipa BVBA (represented by its permanent representative Thierry Navarre) have decided that they will nevertheless refrain from taking part in the deliberations and from voting on the approval of the Long Term Incentive Plan.
In accordance with Article 523 of the Companies Code, the auditor of the Company, PricewaterhouseCoopers Bedrijfsrevisoren BV CVBA, permanently represented by Peter Opsomer BV BVBA, in turn represented by its permanent representative Peter Opsomer, has been informed of the existence of the conflicts of interest.
Furthermore, the relevant sections of these minutes will be entirely included in the annual report of the board of directors.
Approval of Long Term Incentive PlanThe board of directors is of the opinion that the approval of the Long Term Incentive Plan is justified by the need to involve the members of the executive
management team, certain other senior managers of the Company and other persons assimilated to these categories even more in the Company’s strategy and long term development. For each participant in the plan, the grant will consist for 50% of stock options and 50% of restricted stock units. The first grant is scheduled to take place in the few months following the Offering. Grants are expected to be made every year during five years. Both the stock options and the restricted stock units will be granted for no consideration and will vest after three years, subject to the participant remaining in service at vesting. The exercise price of the stock options will be equal to the last closing price for the share of the Company immediately preceding the grant date and the stock options will expire after 8 years.
RESOLVED to approve, in the interest of the Company, the term sheet setting out the main elements of the Long Term Incentive Plan. This approval is subject to the condition precedent of the realisation of the capital increase in cash in the framework of the Offering, and will become effective as of the satisfaction of such condition precedent.”
Indemnification AgreementsOn June 10, 2014, the Board resolved on the entering into of certain indemnification agreements. In relation to this decision, all Board members declared a conflict of interest in accordance with Article 523 of the Companies Code. Since Article 523 Companies Code did not prevent the Board members from attending the meeting and from voting, the Board approved the indemnification Agreements, subject to the closing of the IPO. The relevant section of the minutes can be found below in its entirety:
Conflicts of interestPrior to discussing this item on the agenda, all directors of the Company declared that they have an interest of a patrimonial nature which conflicts with the decisions that fall within the scope of the powers of the board of directors in respect of entry into indemnification agreements by the Company (the “Indemnification Agreements”).
These conflicts of interest result from the fact that all directors will be parties to the Indemnification Agreements, which are made for their benefit, as well as the benefit of the Company.
The Indemnification Agreements will have financial consequences for the Company as they will require the Company to pay an indemnification to the directors. The Company will indemnify each director for all expenses, costs and liabilities incurred in connection with any proceeding against such director, but only to the extent not covered by the Company’s directors and officers insurance and to the extent permitted by law. The indemnification is capped and will not apply in case of fraud, gross negligence or in the case of criminal or regulatory sanctions. It will not apply to proceedings between the Company or any subsidiary and the directors.
Furthermore, to align the interest of each director with the Company’s interest, such indemnification is subject to an obligation to consult with the Company on the organisation of the defence. The Company’s duty of indemnification will apply to proceedings arising until five years after the director ceases to be a director of the Company.
Under Article 523 of the Companies Code, a conflict of interest in a Company not making or having made a public call on savings does not prevent the conflicted directors from taking part in the deliberations and from voting on the decision for which a conflict of interest exists.
In accordance with Article 523 of the Companies Code, the auditor of the Company, PricewaterhouseCoopers Bedrijfsrevisoren BV CVBA, permanently represented by Peter Opsomer BV BVBA, in turn represented by its permanent representative Peter Opsomer, has been informed of the existence of the conflicts of interest.
48 Ontex Annual Review 2014
Corporate Governance
Furthermore, the relevant sections of these minutes will be entirely included in the annual report of the board of directors.
Approval of the Indemnification AgreementsThe board of directors took note of the Indemnification Agreements.
Informed of the existence of conflicts of interest with respect to the Indemnification Agreements, the board of directors decided nevertheless to approve them on behalf of the Company, in respect of all existing directors of the Company (including the three independent directors elected subject to the closing of the initial public offering of the Company).
The board of directors concluded that the Indemnification Agreements are in the interest of the Company for the following reasons:
●● the Company desires to attract and retain the services of talented and experienced individuals to serve as directors, from an international background, who expect to receive this type of indemnification undertaking by the Company, as for example is customary in the United States, the United Kingdom and a number of other countries;●● the Company recognises the increase in corporate litigation internationally;●● the Company wishes that directors exercise their duties for the benefit of the Company free from undue concern for claims for damages arising out of their services to the Company, by undertaking to indemnify them to the extent not covered by the directors and officers insurance;●● the exclusions indicated above as well as the cap and mandatory consultation ensure the alignment of the interests of the Company and the directors.
RESOLVED that the Indemnification Agreements be approved in the form presented to the board of directors.”
Refinancing, selection Global CoordinatorsOn October 3, 2014, the Board ratified the decision on the selection of the Global Coordinators with respect to the Refinancing. In accordance with Article 523 of the Companies Code, Michele Titi-Cappelli, Alexandre Mignotte and Richard Butland abstained from the deliberation and voting on this decision, based on their relationship with Goldman Sachs and the involvement of Goldman Sachs International as Mandated Lead Arranger in the Refinancing. The relevant section of the minutes can be found below in its entirety:
Preceding to the discussion and evaluation of this agenda item the Board members representing Goldman Sachs declare to have patrimonional interests conflicting with the decision regarding the envisaged selection of the Global Coordination Banks. This conflicts of interest arises from the fact that these Board members are representing Goldman Sachs and Goldman Sachs is one of the envisaged Global Coordinators. According to article 523 of the Company Code, these directors have to refrain from the discussion and the voting with respect to this decision and the relevant part of these minutes will be recorded in the annual report of the Board of Directors.
We are pleased to propose you that we will appoint JP Morgan and Goldman Sachs as Global Coordinators for the refinancing.
The Board is fully aligned with the decisions taken, and is fully aware of the workload for the organization.”
RefinancingOn November 3, 2014, the Board resolved on the Refinancing, as described under chapter of the Annual Report. In accordance with Article 523 of the Companies Code, Michele Titi-Cappelli, Alexandre Mignotte and Richard Butland abstained from the deliberation and voting on this decision, based on their relationship with Goldman
Sachs and the involvement of Goldman Sachs International as Mandated Lead Arranger in the Refinancing. The relevant section of the minutes can be found below in its entirety:
Conflict of interestPrior to discussing the items on the agenda, each of the directors declared that he/she had no conflict of interest within the meaning of article 523 of the Belgian Companies Code, with respect to the matters at hand.
However, given the relationship of Mr Michele Titi-Cappelli, Mr Alexandre Mignotte and Mr Richard Butland, as permanent representative of Kite Consulting Ltd. with Goldman Sachs and given Goldman Sachs’ involvement in the Transactions, these three directors have decided to abstain from voting with respect to the Transactions.
Resolutions“The Board of Directors resolved to approve the Transactions and the terms and conditions of each of the Transaction Documents (including the issuance of the Notes) and the execution, delivery and performance of each of the Transaction Documents and any other documents that are necessary or useful for the execution and performance of the Transaction Documents and the Transactions , including, without limitation, any related utilization request, selection notice, additional facilities (or other) notice, power of attorney, confirmation, receipt, document, agreement, letter or certificate in relation herewith (including the issuance of a director’s certificate) as well as any other document or transaction related or ancillary thereto, with the exception of certain provisions of the Transaction Documents which must be approved by the Company’s shareholders in accordance with articles 556 of the Belgian Companies Code (change of control provisions).”
6. Related Party TransactionsAs part of our business, we have entered into several transactions with related parties, including our principal shareholders. The following is a summary of our most significant transactions with related parties for the year ended December 31, 2014 and as of the date hereof.
6.1 Revolving Credit Facility Goldman Sachs International and Merrill Lynch International, both of which were acting as Underwriters in the IPO, also acted as mandated lead arrangers under the revolving credit facility entered into with Ontex IV S.A. on March 25, 2011. The revolving credit facility agreement initially provided for borrowings up to an aggregate of €50.0 million. On August 15, 2012, its terms were amended to provide for borrowings up to an aggregate amount of €75.0 million. The revolving credit facility, initially maturing on March 31, 2017, has been terminated on December 3, 2014, pursuant to the closing of the Refinancing and the redemption of our senior secured and senior unsecured notes on December 3, 2014.
6.2 Term Loan Agreement and Senior Notes IndentureOn November 14, 2014, Ontex issued €250.0 million Senior Secured Notes and on December 3, 2014, the Company agreed upon a Senior Facility Agreement of €380.0 million and a Revolving Credit Facility of €100.0 million Goldman Sachs International Bank, was one of the Mandated Lead Arrangers.
6.3 ISDA Agreements On September 12, 2013, Goldman Sachs International entered into an ISDA foreign exchange hedging agreement with Ontex Coordination Center BVBA.
49Ontex Annual Review 2014
Corporate Governance
On June 30, 2011, Ontex Coordination Center BVBA entered into an interest rate cap arrangement with Goldman Sachs International to manage a portion of our interest rate risk in respect of the senior secured floating rate notes. The interest rate cap arrangement is at a rate of 4.50%, has a notional amount of €150.0 million, and terminates on January 15, 2017.
6.4 Monitoring Services Agreement On December 2, 2010, Goldman Sachs & Co. and TPG Capital, L.P. , entered into a monitoring services agreement with Ontex I S.à r.l., Ontex II S.à r.l., Ontex II-A S.à r.l., Ontex III S.A. and Ontex pursuant to which Goldman Sachs & Co. and TPG Capital, L.P. perform certain monitoring, advisory and consulting services in relation to the affairs of the Group. The monitoring services agreement provides that in consideration for such services the Group shall collectively pay an annual fee plus out-of-pocket expenses. In addition, incremental fees are payable in connection with services related to acquisitions.
On June 30, 2014, pursuant to the closing of the IPO, the Shareholders’ Agreement and consequently the monitoring services agreement have been terminated, involving an exit fee of €18.0 million, i.e. about 1% of the enterprise value on exit upon listing of the shares of Ontex on a securities exchange.
6.5 Other transactionsIn 2013 and 2014, the Ontex group, more specifically Ontex Russia LLC, sold goods at arm’s length to Lenta, a company in which TPG is a shareholder. The revenue from this arrangement was €4.7 million in 2013 and €8.8 million 2014 . The Ontex group continues to sell goods to Lenta.
7. Compliance with the 2009 Belgian Code on Corporate Governance
Ontex is committed to high standards of corporate governance and relies on the Corporate Governance Code as a reference code. The Corporate Governance Code is based on a “comply or explain” approach. Belgian listed companies must comply with the Corporate Governance Code but may deviate from those provisions which are not otherwise contained in the Belgian Companies Code, provided they disclose the justification for any such deviations in their corporate governance statement included in the annual report in accordance with Article 96 §2, 2° of the Belgian Companies Code.
Ontex complies with all provisions of the Corporate Governance Code, except in respect of the following:
A. the Articles of Association allow the Company to deviate from all provisions of Article 520ter of the Belgian Companies Code and hence to grant shares, stock options and other share-based incentives vesting earlier than three years after their grant. However, the LTIP 2014 described in the Remuneration Report however provides for a vesting period for the stock options and restricted stock units of three years;
B. the CEO and certain other members of the Executive Management Team are entitled, in certain circumstances, to severance pay which is higher than 12 or 18 months of remuneration if the Company decides to apply the non-competition clauses in their respective agreements to the fullest extent provided by such agreements (reference is made to the Remuneration Report). In accordance with Article 554 of the Belgian Company Code, with respect to the persons entitled, in certain circumstances, to a severance payment exceeding 18 months, approval will be requested at the next annual shareholders meeting;
C. on 31 December 2014, one of our Non-Executive Directors, Mr. Walsh, is a director in seven listed companies (including his Board membership in the Company), while the Corporate Governance Code recommends that Non-Executive Directors should not consider taking on more than five directorships in listed companies; the threshold of five directorships in listed companies may also be exceeded in the future in respect of a limited number of other Non-Executive Directors (reference is made to chapter 3.1) and
D. on December 31, 2014, the Board included six members elected upon proposal of Whitehaven B S.à r.l. out of 13 Board members in total, while the Corporate Governance Code recommends that no individual or group of directors should dominate the decision making of the Board (reference is made to chapter 3.1).
8. Remuneration Report8.1 Remuneration policy and procedure for the Board
of DirectorsThe remuneration of the non-executive members of the Board was decided by way of written shareholders’ resolutions dated June 2, 2014. It takes into account the responsibilities and the commitment of the Board members to develop the Ontex group and is intended to attract and retain individuals who have the necessary experience and competencies for this role.
Non-Executive Directors receive an annual fixed fee compensation of €150,000 for the Chairman and €75,000 for all other non-executive members. The Chairman of the Audit and Risk Committee and the Chairman of the Remuneration and Nomination Committee each receive an additional fee of €25,000. None of the Non-Executive Directors receives any variable remuneration.
The remuneration of the Executive Directors is described below under chapter 8.2. No director fee is paid to the Executive Directors.
The remuneration policy will be reviewed on a regular basis by the Remuneration and Nomination Committee in line with prevailing market conditions for listed companies in Belgium and companies of similar size in the European FMCG market.
50 Ontex Annual Review 2014
Corporate Governance
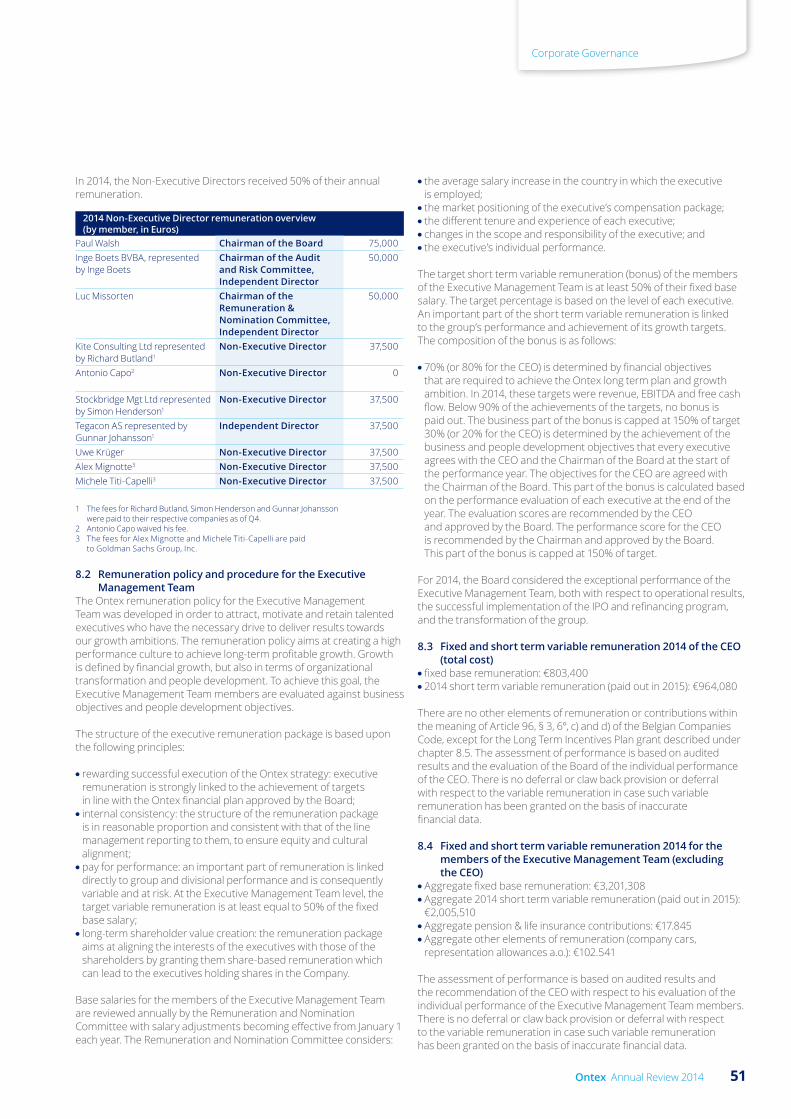
In 2014, the Non-Executive Directors received 50% of their annual remuneration.
2014 Non-Executive Director remuneration overview (by member, in Euros)
Paul Walsh Chairman of the Board 75,000Inge Boets BVBA, represented by Inge Boets
Chairman of the Audit and Risk Committee, Independent Director
50,000
Luc Missorten Chairman of the Remuneration & Nomination Committee, Independent Director
50,000
Kite Consulting Ltd represented by Richard Butland1
Non-Executive Director 37,500
Antonio Capo2 Non-Executive Director 0
Stockbridge Mgt Ltd represented by Simon Henderson1
Non-Executive Director 37,500
Tegacon AS represented by Gunnar Johansson1
Independent Director 37,500
Uwe Krüger Non-Executive Director 37,500Alex Mignotte3 Non-Executive Director 37,500Michele Titi-Capelli3 Non-Executive Director 37,500
1 The fees for Richard Butland, Simon Henderson and Gunnar Johansson were paid to their respective companies as of Q4.
2 Antonio Capo waived his fee.3 The fees for Alex Mignotte and Michele Titi-Capelli are paid
to Goldman Sachs Group, Inc.
8.2 Remuneration policy and procedure for the Executive Management Team
The Ontex remuneration policy for the Executive Management Team was developed in order to attract, motivate and retain talented executives who have the necessary drive to deliver results towards our growth ambitions. The remuneration policy aims at creating a high performance culture to achieve long-term profitable growth. Growth is defined by financial growth, but also in terms of organizational transformation and people development. To achieve this goal, the Executive Management Team members are evaluated against business objectives and people development objectives.
The structure of the executive remuneration package is based upon the following principles:
●● rewarding successful execution of the Ontex strategy: executive remuneration is strongly linked to the achievement of targets in line with the Ontex financial plan approved by the Board;●● internal consistency: the structure of the remuneration package is in reasonable proportion and consistent with that of the line management reporting to them, to ensure equity and cultural alignment; ●● pay for performance: an important part of remuneration is linked directly to group and divisional performance and is consequently variable and at risk. At the Executive Management Team level, the target variable remuneration is at least equal to 50% of the fixed base salary;●● long-term shareholder value creation: the remuneration package aims at aligning the interests of the executives with those of the shareholders by granting them share-based remuneration which can lead to the executives holding shares in the Company.
Base salaries for the members of the Executive Management Team are reviewed annually by the Remuneration and Nomination Committee with salary adjustments becoming effective from January 1 each year. The Remuneration and Nomination Committee considers:
●● the average salary increase in the country in which the executive is employed;●● the market positioning of the executive’s compensation package;●● the different tenure and experience of each executive; ●● changes in the scope and responsibility of the executive; and●● the executive’s individual performance.
The target short term variable remuneration (bonus) of the members of the Executive Management Team is at least 50% of their fixed base salary. The target percentage is based on the level of each executive. An important part of the short term variable remuneration is linked to the group’s performance and achievement of its growth targets. The composition of the bonus is as follows:
●● 70% (or 80% for the CEO) is determined by financial objectives that are required to achieve the Ontex long term plan and growth ambition. In 2014, these targets were revenue, EBITDA and free cash flow. Below 90% of the achievements of the targets, no bonus is paid out. The business part of the bonus is capped at 150% of target 30% (or 20% for the CEO) is determined by the achievement of the business and people development objectives that every executive agrees with the CEO and the Chairman of the Board at the start of the performance year. The objectives for the CEO are agreed with the Chairman of the Board. This part of the bonus is calculated based on the performance evaluation of each executive at the end of the year. The evaluation scores are recommended by the CEO and approved by the Board. The performance score for the CEO is recommended by the Chairman and approved by the Board. This part of the bonus is capped at 150% of target.
For 2014, the Board considered the exceptional performance of the Executive Management Team, both with respect to operational results, the successful implementation of the IPO and refinancing program, and the transformation of the group.
8.3 Fixed and short term variable remuneration 2014 of the CEO (total cost)
●● fixed base remuneration: €803,400●● 2014 short term variable remuneration (paid out in 2015): €964,080
There are no other elements of remuneration or contributions within the meaning of Article 96, § 3, 6°, c) and d) of the Belgian Companies Code, except for the Long Term Incentives Plan grant described under chapter 8.5. The assessment of performance is based on audited results and the evaluation of the Board of the individual performance of the CEO. There is no deferral or claw back provision or deferral with respect to the variable remuneration in case such variable remuneration has been granted on the basis of inaccurate financial data.
8.4 Fixed and short term variable remuneration 2014 for the members of the Executive Management Team (excluding the CEO)
●● Aggregate fixed base remuneration: €3,201,308●● Aggregate 2014 short term variable remuneration (paid out in 2015): €2,005,510●● Aggregate pension & life insurance contributions: €17.845●● Aggregate other elements of remuneration (company cars, representation allowances a.o.): €102.541
The assessment of performance is based on audited results and the recommendation of the CEO with respect to his evaluation of the individual performance of the Executive Management Team members. There is no deferral or claw back provision or deferral with respect to the variable remuneration in case such variable remuneration has been granted on the basis of inaccurate financial data.
51Ontex Annual Review 2014
Corporate Governance
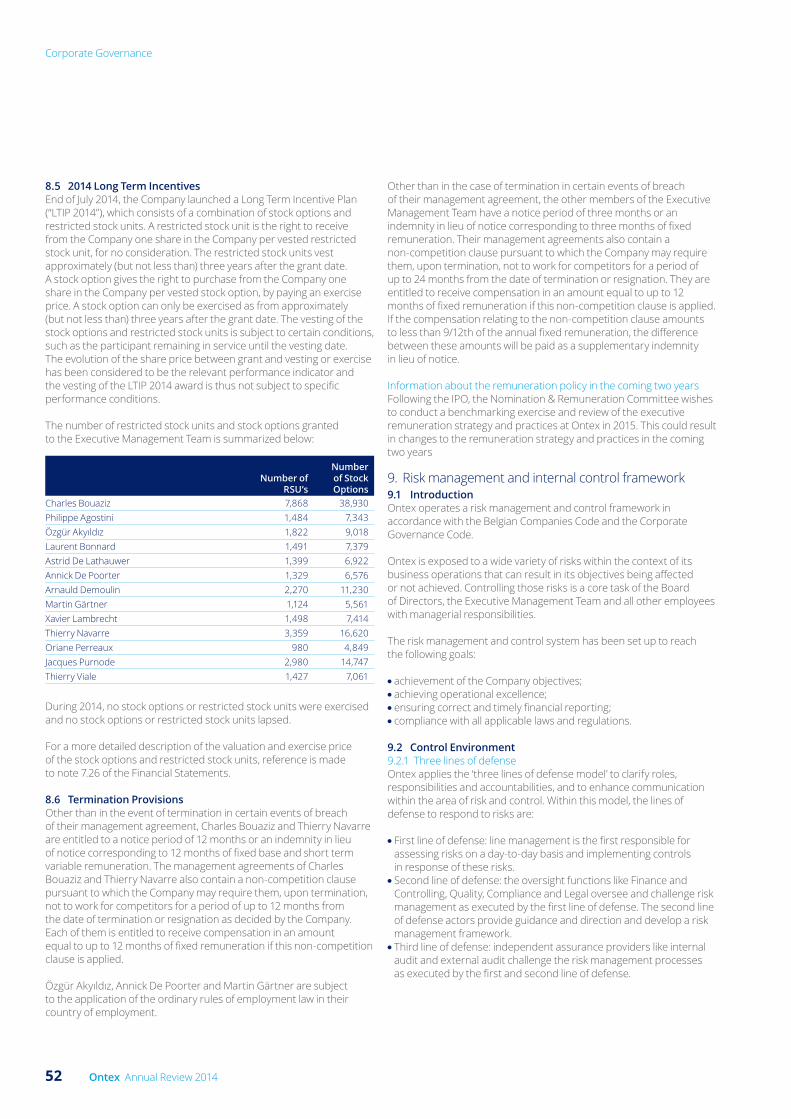
8.5 2014 Long Term IncentivesEnd of July 2014, the Company launched a Long Term Incentive Plan (“LTIP 2014”), which consists of a combination of stock options and restricted stock units. A restricted stock unit is the right to receive from the Company one share in the Company per vested restricted stock unit, for no consideration. The restricted stock units vest approximately (but not less than) three years after the grant date. A stock option gives the right to purchase from the Company one share in the Company per vested stock option, by paying an exercise price. A stock option can only be exercised as from approximately (but not less than) three years after the grant date. The vesting of the stock options and restricted stock units is subject to certain conditions, such as the participant remaining in service until the vesting date. The evolution of the share price between grant and vesting or exercise has been considered to be the relevant performance indicator and the vesting of the LTIP 2014 award is thus not subject to specific performance conditions.
The number of restricted stock units and stock options granted to the Executive Management Team is summarized below:
Number ofRSU’s
Numberof StockOptions
Charles Bouaziz 7,868 38,930Philippe Agostini 1,484 7,343Özgür Akyıldız 1,822 9,018Laurent Bonnard 1,491 7,379Astrid De Lathauwer 1,399 6,922Annick De Poorter 1,329 6,576Arnauld Demoulin 2,270 11,230Martin Gärtner 1,124 5,561Xavier Lambrecht 1,498 7,414Thierry Navarre 3,359 16,620Oriane Perreaux 980 4,849Jacques Purnode 2,980 14,747Thierry Viale 1,427 7,061
During 2014, no stock options or restricted stock units were exercised and no stock options or restricted stock units lapsed.
For a more detailed description of the valuation and exercise price of the stock options and restricted stock units, reference is made to note 7.26 of the Financial Statements.
8.6 Termination ProvisionsOther than in the event of termination in certain events of breach of their management agreement, Charles Bouaziz and Thierry Navarre are entitled to a notice period of 12 months or an indemnity in lieu of notice corresponding to 12 months of fixed base and short term variable remuneration. The management agreements of Charles Bouaziz and Thierry Navarre also contain a non-competition clause pursuant to which the Company may require them, upon termination, not to work for competitors for a period of up to 12 months from the date of termination or resignation as decided by the Company. Each of them is entitled to receive compensation in an amount equal to up to 12 months of fixed remuneration if this non-competition clause is applied.
Özgür Akyıldız, Annick De Poorter and Martin Gärtner are subject to the application of the ordinary rules of employment law in their country of employment.
Other than in the case of termination in certain events of breach of their management agreement, the other members of the Executive Management Team have a notice period of three months or an indemnity in lieu of notice corresponding to three months of fixed remuneration. Their management agreements also contain a non-competition clause pursuant to which the Company may require them, upon termination, not to work for competitors for a period of up to 24 months from the date of termination or resignation. They are entitled to receive compensation in an amount equal to up to 12 months of fixed remuneration if this non-competition clause is applied. If the compensation relating to the non-competition clause amounts to less than 9/12th of the annual fixed remuneration, the difference between these amounts will be paid as a supplementary indemnity in lieu of notice.
Information about the remuneration policy in the coming two yearsFollowing the IPO, the Nomination & Remuneration Committee wishes to conduct a benchmarking exercise and review of the executive remuneration strategy and practices at Ontex in 2015. This could result in changes to the remuneration strategy and practices in the coming two years
9. Risk management and internal control framework 9.1 IntroductionOntex operates a risk management and control framework in accordance with the Belgian Companies Code and the Corporate Governance Code.
Ontex is exposed to a wide variety of risks within the context of its business operations that can result in its objectives being affected or not achieved. Controlling those risks is a core task of the Board of Directors, the Executive Management Team and all other employees with managerial responsibilities.
The risk management and control system has been set up to reach the following goals:
●● achievement of the Company objectives;●● achieving operational excellence;●● ensuring correct and timely financial reporting;●● compliance with all applicable laws and regulations.
9.2 Control Environment9.2.1 Three lines of defenseOntex applies the ‘three lines of defense model’ to clarify roles, responsibilities and accountabilities, and to enhance communication within the area of risk and control. Within this model, the lines of defense to respond to risks are:
●● First line of defense: line management is the first responsible for assessing risks on a day-to-day basis and implementing controls in response of these risks.●● Second line of defense: the oversight functions like Finance and Controlling, Quality, Compliance and Legal oversee and challenge risk management as executed by the first line of defense. The second line of defense actors provide guidance and direction and develop a risk management framework.●● Third line of defense: independent assurance providers like internal audit and external audit challenge the risk management processes as executed by the first and second line of defense.
52 Ontex Annual Review 2014
Corporate Governance

9.2.2 Policies, procedures and processesOntex fosters an environment in which its business objectives and strategy are pursued in a controlled manner. This environment is created through the implementation of different companywide policies, procedures and processes such as the Ontex code of conduct, the anti-bribery policy, the anti-trust policy and the quality management system. The Executive Management Team fully endorses these initiatives. The employees are regularly informed and trained on these subjects in order to develop sufficient risk management and control at all levels and in all areas of the organization.
9.2.3. Group-wide ERP systemAll significant entities operate the same group-wide ERP system which is managed centrally. This system embeds the roles and responsibilities defined at Group level. Through this system, the main flows are standardized and key controls are enforced. The system also allows detailed monitoring of activities and direct central access to data.
9.3 Risk managementSound risk management starts with identifying and assessing the risks associated with the business in order to minimize such risks on the organization’s ability to achieve its objectives and to create value for its stakeholders.
All Ontex employees are accountable for the timely identification and qualitative assessment of the risks within their area of responsibility.
Ontex has identified and analyzed its key corporate risks as disclosed under the Strategic Report of this Annual Report. These corporate risks are communicated to the various levels of management.
9.4 Control activitiesControl measures are in place to minimize the effect of risk on Ontex’ ability to achieve its objectives. These control activities are embedded in the Company’s key processes and systems to assure that the risk responses and the Company’s overall objectives are carried out as designed. Control activities are conducted throughout the organization, at all levels and within all departments.
The Legal Compliance Manager supports the adoption of clear processes and procedures for a wide range of business operations related to compliance and export control. The Legal Compliance Manager reports on his activities to the Executive Management Team.
In addition to these control activities, an insurance program is being implemented for selected risk categories that cannot be absorbed without material effect on the Company’s balance sheet.
9.5 Information and communication Ontex recognizes the importance of timely, complete and accurate communication and information both top-down as well as bottom-up. The Company therefore put several measures in place to assure amongst others:
●● security of confidential information;●● clear communication about roles and responsibilities;●● timely communication to all stakeholders about external and internal changes impacting their areas of responsibility.
9.6 Monitoring of control mechanismsMonitoring helps to ensure that internal control systems operate effectively.
The quality of Ontex’ risk management and control framework is assessed by the following factors:
●● Internal Audit. The tasks and responsibilities assigned to Internal Audit are recorded in the Internal Audit Charter, which has been approved by the Audit and Risk Committee. The key mission of Internal Audit as defined in the Internal Audit Charter is “to add value to the organization by applying a systematic, disciplined approach to evaluating the internal control system and providing recommendations to improve it”.●● External auditor: in the context of its review of the annual accounts. The statutory auditor focusses on the design and effectiveness of internal controls and systems relevant for the preparation of the financial statements. The outcome of the audits, including work on internal controls, is reported to management and the Audit Committee and shared with Internal Audit. ●● Audit and Risk Committee: the Board of Directors and the Audit and Risk Committee have the ultimate responsibility with respect to internal control and risk management. For more detailed information on the composition and functioning of the Audit and Risk Committee, see chapter 3.6.1 of this Corporate Governance Statement.
9.7 Risk management and internal control with regard to the process of financial reporting
The accurate and consistent application of accounting rules throughout the Company is assured by means of a Finance and Accounting Manual.
On a quarterly basis, a bottom-up risk analysis is conducted to identify current risk factors. Action plans are defined for all key risks. Specific identification procedures for financial risks are in place to assure the completeness of financial accruals.
The accounting teams are responsible for producing the accounting figures, whereas the controlling teams check the validity of these figures. These checks include coherence tests by comparison with historical and budget figures, as well as sample checks of transactions according to their materiality.
Specific internal control activities with respect to financial reporting are in place, including the use of a periodic closing and reporting checklist. This checklist assures clear communication of timelines, completeness of tasks, and clear assignment of responsibilities.
Uniform reporting of financial information throughout the organization ensures a consistent flow of information, which allows the detection of potential anomalies. The group-wide ERP system and management information tools allow the central controlling team direct access to disaggregated financial and non-financial information.
An external financial calendar is planned in consultation with the Board and the Executive Management Team, and this calendar is announced to the external stakeholders. The objective of this external financial reporting is to provide Ontex stakeholders with the information necessary for making sound business decisions. The financial calendar can be consulted on http://www.ontexglobal.com/calendar
53Ontex Annual Review 2014
Corporate Governance
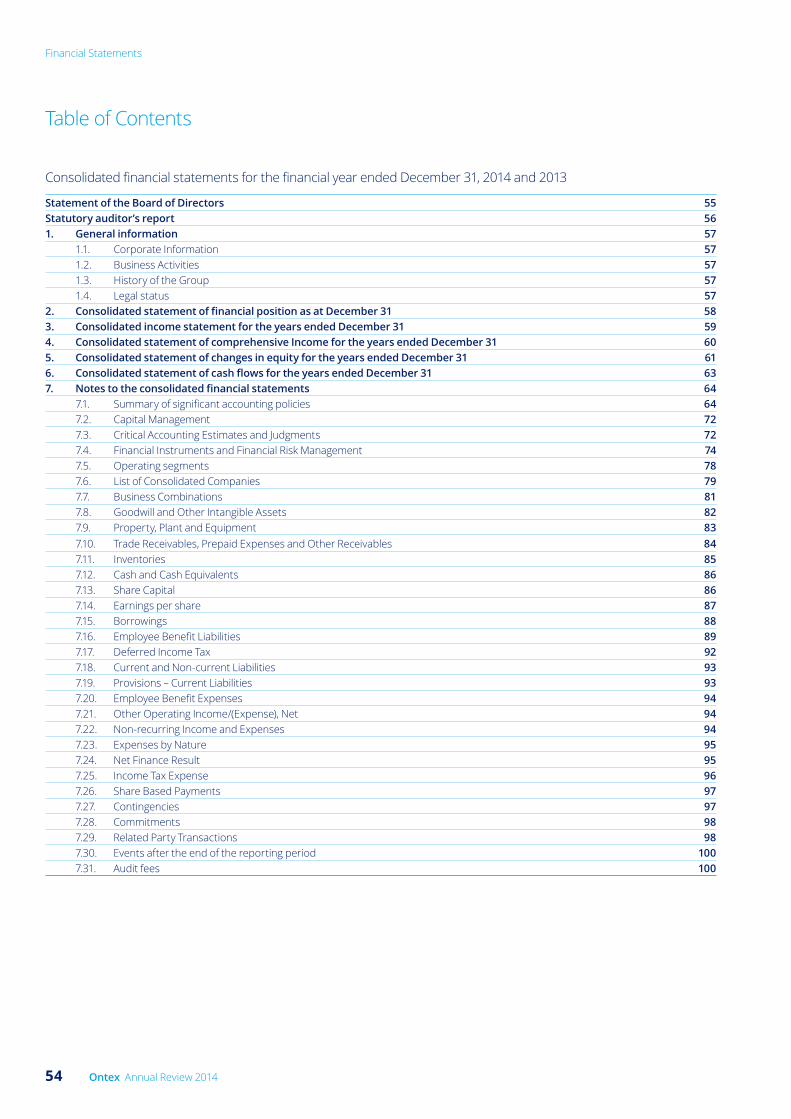
Table of Contents
Consolidated financial statements for the financial year ended December 31, 2014 and 2013
Statement of the Board of Directors 55Statutory auditor’s report 561. General information 57
1.1. Corporate Information 571.2. Business Activities 571.3. History of the Group 571.4. Legal status 57
2. Consolidated statement of financial position as at December 31 583. Consolidated income statement for the years ended December 31 594. Consolidated statement of comprehensive Income for the years ended December 31 605. Consolidated statement of changes in equity for the years ended December 31 616. Consolidated statement of cash flows for the years ended December 31 637. Notes to the consolidated financial statements 64
7.1. Summary of significant accounting policies 647.2. Capital Management 727.3. Critical Accounting Estimates and Judgments 727.4. Financial Instruments and Financial Risk Management 747.5. Operating segments 787.6. List of Consolidated Companies 797.7. Business Combinations 817.8. Goodwill and Other Intangible Assets 827.9. Property, Plant and Equipment 837.10. Trade Receivables, Prepaid Expenses and Other Receivables 847.11. Inventories 857.12. Cash and Cash Equivalents 867.13. Share Capital 867.14. Earnings per share 877.15. Borrowings 887.16. Employee Benefit Liabilities 897.17. Deferred Income Tax 927.18. Current and Non-current Liabilities 937.19. Provisions – Current Liabilities 937.20. Employee Benefit Expenses 947.21. Other Operating Income/(Expense), Net 947.22. Non-recurring Income and Expenses 947.23. Expenses by Nature 957.24. Net Finance Result 957.25. Income Tax Expense 967.26. Share Based Payments 977.27. Contingencies 977.28. Commitments 987.29. Related Party Transactions 987.30. Events after the end of the reporting period 1007.31. Audit fees 100
54 Ontex Annual Review 2014
Financial Statements

Statement of the Board of Directors
The Board of Directors of Ontex Group NV certifies in the name and on behalf of Ontex Group NV, that to the best of their knowledge, the consolidated financial statements, established in accordance with International Financial Reporting Standards (“IFRS”), give a true and fair view of the assets, financial position and results of Ontex Group NV and of the entities included in the consolidation.
The financial report gives an accurate overview of the information that needs to be disclosed pursuant to paragraphs 5 and 6 of article 13 of the Royal Decree of 14 November 2007.
The amounts in this document are represented in millions of euros (€ million), unless noted otherwise.
Due to rounding, numbers presented throughout these Consolidated Financial Statements may not add up precisely to the totals provided and percentages may not precisely reflect the absolute figures.
55Ontex Annual Review 2014
Financial Statements

In accordance with the legal requirements, we report to you on the performance of our mandate of statutory auditor. This report includes our opinion on the consolidated financial statements, as well as the required additional statements. The consolidated financial statements comprise the consolidated statement of financial position as of December 31, 2014, the consolidated income statement, consolidated statement of comprehensive income, consolidated statement of changes in equity and consolidated cash flow statement for the year then ended, as well as the summary of significant accounting policies and other explanatory notes.
Report on the consolidated financial statements – Unqualified opinionWe have audited the consolidated financial statements of Ontex Group NV (“the Company”) and its subsidiaries (jointly “the group”), prepared in accordance with International Financial Reporting Standards as adopted by the European Union, and with the legal and regulatory requirements applicable in Belgium. The total of the consolidated balance sheet amounts to €1,681.5 million and the consolidated income statement shows a profit for the year, group share, of €8.6 million.
Board of directors’ responsibility for the preparation of the consolidated financial statementsThe board of directors is responsible for the preparation and fair presentation of these consolidated financial statements in accordance with International Financial Reporting Standards as adopted by the European Union, and with the legal and regulatory requirements applicable in Belgium, and for such internal control as the board of directors determine, is necessary to enable the preparation of consolidated financial statements that are free from material misstatement, whether due to fraud or error.
Statutory auditor’s responsibility Our responsibility is to express an opinion on these consolidated financial statements based on our audit. We conducted our audit in accordance with International Standards on Auditing (ISAs). Those standards require that we comply with ethical requirements and plan and perform the audit to obtain reasonable assurance about whether the consolidated financial statements are free from material misstatement.
An audit involves performing procedures to obtain audit evidence about the amounts and disclosures in the consolidated financial statements. The procedures selected depend on the statutory auditor’s judgment, including the assessment of the risks of material misstatement of the consolidated financial statements, whether due to fraud or error. In making those risk assessments, the statutory auditor considers internal control relevant to the group’s preparation and fair presentation of the consolidated financial statements in order to design audit procedures that are appropriate in the circumstances, but not for the purpose of expressing an opinion on the effectiveness of the group’s internal control. An audit also includes evaluating the appropriateness of accounting policies used and the reasonableness of accounting estimates made by the board of directors, as well as evaluating the overall presentation of the consolidated financial statements.
We have obtained from the board of directors and the company’s officials the explanations and information necessary for performing our audit.
We believe that the audit evidence we have obtained is sufficient and appropriate to provide a basis for our opinion.
Unqualified Opinion In our opinion, the consolidated financial statements give a true and fair view of the group’s net equity and consolidated financial position as at December 31, 2014 and of its consolidated financial performance and its consolidated cash flows for the year then ended in accordance with International Financial Reporting Standards as adopted by the European Union, and with the legal and regulatory requirements applicable in Belgium.
Report on other legal and regulatory requirements The board of directors is responsible for the preparation and the content of the directors’ report on the consolidated financial statements.
In the context of our mandate and in accordance with the Belgian standard which is complementary to the International Standards on Auditing (ISAs) as applicable in Belgium, our responsibility is to verify, in all material respects, compliance with certain legal and regulatory requirements. On this basis, we provide the following additional statement which does not impact our opinion on the consolidated financial statements:
●● The directors’ report on the consolidated financial statements includes the information required by law, is consistent with the consolidated financial statements and does not present any material inconsistencies with the information that we became aware of during the performance of our mandate.
Ghent, April 10, 2015
The Statutory Auditor PwC Bedrijfsrevisoren bcvba Represented by
Peter Opsomer*Bedrijfsrevisor/Réviseur d’Entreprises
* Peter Opsomer BVBA Board Member, represented by its fixed representative, Peter Opsomer
Statutory auditor’s report to the general shareholders’ meeting on the consolidated accounts for the year ended December 31, 2014
56 Ontex Annual Review 2014
Financial Statements

1. General information
1.1 Corporate InformationThe consolidated financial statements of Ontex Group NV for the year ended December 31, 2014 were authorized for issue in accordance with a resolution of the Board of Directors on April 10, 2015.
1.2 Business ActivitiesOntex is a leading manufacturer of branded and retailer brand hygienic disposable products across Europe, the Middle East and Africa. The Company primarily sells its products to retailers, helping them to establish or enhance their own brands. While historically Western Europe has been the Company’s largest geographic market in terms of sales, the Company also has a growing presence in emerging markets where it offers both retailer brands and its own brands, with the mix varying by product category and geography. The Company believes that it operates a strong and diversified business across multiple geographies and serves a blue chip customer base with high quality products in core, resilient and non-discretionary categories.
1.3 History of the Group Ontex was founded in 1979 by Paul Van Malderen and initially produced mattress protectors for the Belgian institutional market. During the 1980s and the first half of the 1990s, the Company expanded its product range into its current core product categories and grew the business internationally both organically and through acquisitions.
After opening a production facility in the Czech Republic and acquiring businesses in Belgium, Germany and Spain, Ontex was listed on Euronext Brussels in 1998. Following the listing, Ontex experienced rapid growth over several years, primarily through bolt-on acquisitions in France, Germany and Turkey.
Ontex was acquired by funds advised by Candover in 2003 and subsequently de-listed from Euronext Brussels. We acquired a diaper production unit of Paul Hartmann in Germany in 2004 and opened a production facility in China in 2006. In 2008, we opened a production facility in Algeria. In 2010, we acquired iD Medica, which sells incontinence products in Germany.
In 2010, Ontex was acquired by funds managed by GSCP and TPG. In 2011, we opened two additional production facilities, one in Australia and one in Russia, and acquired Lille Healthcare, a company operating in the adult incontinence market in France. In 2013, we acquired Serenity, a company operating in the adult incontinence market in Italy, and opened a production facility in Pakistan.
In preparation of the Initial Public Offering (IPO) of the Group in 2014, Ontex Group NV (the “Parent”) was incorporated on April 24, 2014 for the purpose of acquiring Ontex I S.à r.l. and its subsidiaries, which occurred on June 10, 2014. Ontex Group NV was established by the same shareholders as those of Ontex I S.à r.l. Since the shareholders of Ontex I S.à r.l. before the reorganisation have the same absolute and relative interest in the net assets of the group and the new group immediately before and after the reorganisation, the transactions for preparing the IPO constitute an internal reorganisation or a transaction under common control. Consequently, these transactions are recognized in the financial statements using the predecessor value method. This means that the purchase price was not allocated to the assets and liabilities acquired. The values recognized in the current financial statements are the values determined when Ontex I S.à r.l. gained control and started to consolidate the subsidiaries.
In June 2014, Ontex Group NV successfully listed its shares on the Euronext Brussels exchange and trades under the ticker ‘ONTEX’.
1.4 Legal statusOntex Group NV is a limited-liability company incorporated as a “naamloze vennootschap“ (“NV”) under Belgian law. Ontex Group NV has its registered office at Korte Keppestraat 21/31, 9320 Erembodegem (Aalst), Belgium. The shares of Ontex Group NV are listed on the regulated market of Euronext Brussels.
57Ontex Annual Review 2014
Financial Statements

2. Consolidated statement of financial positionas at December 31
AssetsIn € million Note
2014Successor
2013Predecessor
Non-current assetsGoodwill and other intangible assets 8 864.6 864.8Property, plant & equipment 9 296.5 282.0Deferred tax assets 17 10.4 0.3Receivables 10 – 0.1
1,171.5 1,147.2
Current assetsInventories 11 200.9 182.2Trade receivables 10 204.3 199.0Prepaid expenses and other receivables 10 55.9 37.4Current income tax 6.1 3.8Derivative financial assets 4.1 7.3 1.1Cash and cash equivalents 12 35.5 61.4
510.0 484.9Total assets 1,681.5 1,632.1
Equity and LiabilitiesIn € million Note
2014Successor
2013Predecessor
Equity attributable to owners of the companyShare capital & Premium 13 799.7 420.0 Cumulative translation differences (18.3) (19.9)Retained earnings and other reserves (110.4) (64.4)Controlling interests 671.0 335.7 Non-controlling interests – 23.5 Total equity 671.0 359.2
Non-current liabilitiesEmployee benefit liabilities 16 19.6 15.8 Provisions 19 0.2 0.1 Interest-bearing debts 15 618.2 896.7 Other non-current financial liabilities 7 5.0 10.0 Deferred income tax liabilities 17 22.3 14.8 Other payables 18 – 2.3
665.3 939.7
Current liabilitiesInterest-bearing debts 15 2.4 13.9 Derivative financial liabilities 4.1 5.5 1.9 Other current financial liabilities 7 5.0 8.0 Trade payables 18 254.5 240.9 Accrued expenses and other payables 18 22.3 16.0 Social liabilities 18 28.8 25.9 Current income tax liabilities 20.9 19.0 Provisions 19 5.8 7.5
345.2 333.2 Total liabilities 1,010.5 1,272.9 Total equity and liabilities 1,681.5 1,632.1
The accompanying notes are an integral part of the Audited Consolidated Financial Statements.
58 Ontex Annual Review 2014
Financial Statements

3. Consolidated income statementfor the years ended December 31
In € million Note2014
Successor2013
Predecessor
Revenue 5 1,615.9 1,491.9 Cost of sales 23 (1,169.2) (1,094.8)Gross margin 446.7 397.1
Distribution expenses 23 (151.4) (136.3)Sales and marketing expenses 23 (84.0) (78.0)General administrative expenses 23 (44.9) (41.1)Other operating income/(expense), net 21 (2.5) 0.4 Non-recurring income and expenses1 22 (56.3) (19.6)Operating profit 107.6 122.5
Finance income 24 13.9 17.9 Finance costs 24 (104.2) (101.9)Net finance cost (90.3) (84.0)
(Loss)/Profit before income tax 17.3 38.5
Income tax expense 25 (8.7) (14.0)(Loss)/Profit for the period from continuing operations 8.6 24.5
(Loss)/Profit for the period 8.6 24.5
(Loss)/Profit attributable to:Owners of the parent 8.6 22.9 Non-controlling interests – 1.6 (Loss)/Profit for the period 8.6 24.5
Reconciliation of Non-IFRS Financial MeasuresIn € million
2014Successor
2013Predecessor
Reconciliation of operating profit to net income before interest, tax, depreciation and amortization (EBITDA) (Additional information)Operating Profit 107.6 122.5Depreciation and amortization2 32.5 33.8EBITDA3 140.1 156.3
1 Non-recurring income and expenses is a non-GAAP measure defined in note 7.22.2 Depreciation and amortization (D&A) include €32.2 million of recurring D&A and €0.3 million of non-recurring D&A in 2014 (€31.5 million of recurring D&A and €2.3 million
of non-recurring D&A in 2013) 3 EBITDA, earning before net finance cost, income taxes, depreciation and amortization is a non-GAAP measure defined in the summary of significant accounting policies
(note 7.1.26).
Earnings per share:
Earnings per share (Euro)2014
Successor2013
Predecessor
Basic Earnings per share 0.1269 0.3368 Diluted Earnings per share 0.1269 0.3368
Adjusted Basic Earnings per share 0.9543 0.6060 Diluted Adjusted Basic Earnings per share 0.9543 0.6060
Total numbers of shares as of December 311 68,055,555 68,055,555
1 See note 7.14
The accompanying notes are an integral part of the Audited Consolidated Financial Statements.
59Ontex Annual Review 2014
Financial Statements

4. Consolidated statement of comprehensive incomefor the years ended December 31
In € million Note2014
Successor2013
Predecessor
Income/(loss) for the period 8.6 24.5 Other comprehensive income/(loss) for the period, after tax: Items that will not be reclassified subsequently to income statement
Actuarial gains/(losses) on defined benefit pension plans 16 (2.7) – Items that will be reclassified subsequently to income statement
Exchange differences on translating foreign operations 1.6 (13.7)Cash flow hedge 0.6 (0.6)Other – 0.1
Other comprehensive income /(loss) for the period, net of tax (0.5) (14.2)Total comprehensive income/(loss) for the period 8.1 10.3
Total comprehensive income attributable to:Owners of the parent 8.1 9.6 Non-controlling interests – 0.7 Total comprehensive income/(loss) for the period 8.1 10.3
The accompanying notes are an integral part of the Audited Consolidated Financial Statements.
60 Ontex Annual Review 2014
Financial Statements

5. Consolidated statement of changes in equity for the years ended December 31
December 2013, Predecessor, Attributable to equity holders of the Company
In € million NoteNumber of
sharesNumber of
CPECShare
capital CPECs1
Cumulative translation
reserves
Retained earnings
and other reserves
Total Equity
Non-controlling
interestsTotal
Equity
Balance at December 31, 2012 13 421,250,000 41,580,000,000 4.2 415.8 ( 7.1) ( 86.8) 326.1 22.8 348.9 Contribution in kind CPECs 1,680,000,000 (1,680,000,000) 16.8 (16.8) – – – – – Comprehensive income:Profit for the year – – – – – 22.9 22.9 1.6 24.5 Other comprehensive income:Exchange differences on translating foreign operations – – – – (12.8) – (12.8) (0.9) (13.7)Cash flow hedges – – – – – (0.6) (0.6) – (0.6)Other movements – – – – – 0.1 0.1 – 0.1 Total other comprehensive income – – – – (12.8) (0.5) (13.3) (0.9) (14.2)Balance at December 31, 2013 13 2,101,250,000 39,900,000,000 21.0 399.0 (19.9) (64.4) 335.7 23.5 359.2
1 Convertible Preferred Equity Certificates
The accompanying notes are an integral part of the Audited Consolidated Financial Statements.
61Ontex Annual Review 2014
Financial Statements
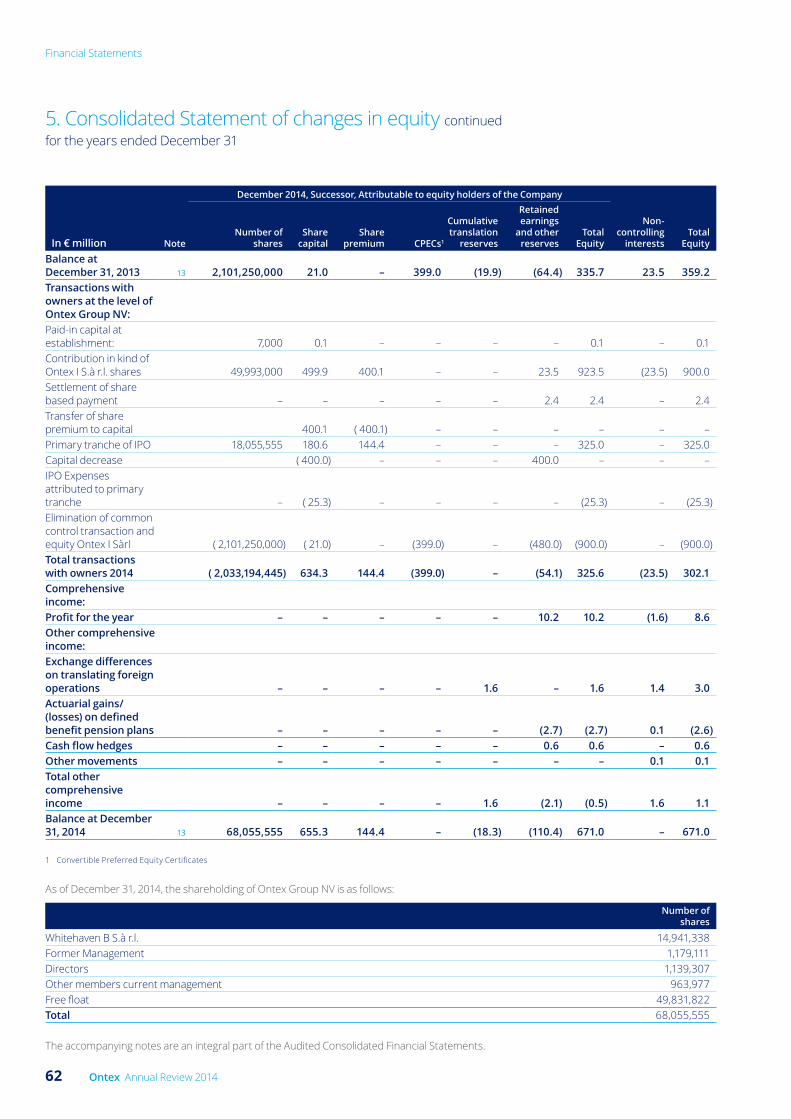
5. Consolidated Statement of changes in equity continued for the years ended December 31
December 2014, Successor, Attributable to equity holders of the Company
In € million NoteNumber of
sharesShare
capitalShare
premium CPECs1
Cumulative translation
reserves
Retained earnings
and other reserves
Total Equity
Non-controlling
interestsTotal
Equity
Balance at December 31, 2013 13 2,101,250,000 21.0 – 399.0 (19.9) (64.4) 335.7 23.5 359.2 Transactions with owners at the level of Ontex Group NV:Paid-in capital at establishment: 7,000 0.1 – – – – 0.1 – 0.1 Contribution in kind of Ontex I S.à r.l. shares 49,993,000 499.9 400.1 – – 23.5 923.5 (23.5) 900.0 Settlement of share based payment – – – – – 2.4 2.4 – 2.4 Transfer of share premium to capital 400.1 ( 400.1) – – – – – – Primary tranche of IPO 18,055,555 180.6 144.4 – – – 325.0 – 325.0 Capital decrease ( 400.0) – – – 400.0 – – – IPO Expenses attributed to primary tranche – ( 25.3) – – – – (25.3) – (25.3)Elimination of common control transaction and equity Ontex I Sàrl ( 2,101,250,000) ( 21.0) – (399.0) – (480.0) (900.0) – (900.0)Total transactions with owners 2014 ( 2,033,194,445) 634.3 144.4 (399.0) – (54.1) 325.6 (23.5) 302.1 Comprehensive income:Profit for the year – – – – – 10.2 10.2 (1.6) 8.6 Other comprehensive income:Exchange differences on translating foreign operations – – – – 1.6 – 1.6 1.4 3.0 Actuarial gains/(losses) on defined benefit pension plans – – – – – (2.7) (2.7) 0.1 (2.6)Cash flow hedges – – – – – 0.6 0.6 – 0.6 Other movements – – – – – – – 0.1 0.1 Total other comprehensive income – – – – 1.6 (2.1) (0.5) 1.6 1.1 Balance at December 31, 2014 13 68,055,555 655.3 144.4 – (18.3) (110.4) 671.0 – 671.0
1 Convertible Preferred Equity Certificates
As of December 31, 2014, the shareholding of Ontex Group NV is as follows:
Number of shares
Whitehaven B S.à r.l. 14,941,338Former Management 1,179,111Directors 1,139,307Other members current management 963,977Free float 49,831,822Total 68,055,555
The accompanying notes are an integral part of the Audited Consolidated Financial Statements.
62 Ontex Annual Review 2014
Financial Statements

6. Consolidated statement of cash flowsfor the years ended December 31
Cash flows from operating activitiesIn € million Note
2014Successor
2013Predecessor
Net profit/(loss) for the year 8.6 24.5 Adjustments for: Income tax expense 25 8.7 14.0 Depreciation and amortisation 32.5 33.8 (Profit)/loss on disposal of property, plant and equipment (3.1) 0.7 Provisions (including employee benefit liabilities) 0.2 (34.4)IPO expenses through income statement 21.1 – Refinancing expenses through income statement 32.7 – Unrealised F/x difference on operating activities 1.5 1.2 Finance costs – net (including unrealised F/x difference on financing) 90.3 84.1 Changes in working capital:
Inventories (20.6) 7.8 Trade and other receivables and prepaid expenses (23.0) 18.4 Trade and other payables and accrued expenses 13.7 (2.3)
Social liabilities 2.8 1.4 Cash from operating activities before taxes 165.4 149.2 Income tax paid (11.8) (14.7)Net cash generated from operating activities 153.6 134.5
Cash flows from investing activitiesIn € million Note
2014Successor
2013Predecessor
Purchases of property, plant and equipment and intangibles (including capital grants) (48.9) (42.8)Gain on disposal 4.6 – Acquistion price paid 7 (8.0) (73.2)Net cash used in investing activities (52.3) (116.0)
Cash flows from financing activitiesIn € million Note
2014Successor
2013Predecessor
Proceeds from acquisition (net cash) 7 – 2.1 Proceeds from borrowings 15 630.0 77.4 Borrowing expenses paid (13.0) – Repayment of borrowings 15 (911.3) (2.4)Interest paid 24 (69.2) (64.3)Interest received 24 0.2 0.5 Cost of refinancing & Other costs of financing (40.2) (11.0)Realised foreign exchange (losses)/gains on financing activities (0.2) (4.2)Derivative financial asset (2.8) 5.6 IPO expenses paid through equity (25.3) – IPO expenses paid through income statement (20.5) – Capital increase 325.1 – Net cash generated from/(used in) financing activities (127.2) 3.7
Net increase in cash,cash equivalents and bank overdrafts (25.9) 22.2
Cash, cash equivalents at the beginning of the year 61.4 39.2 Cash, cash equivalents at the end of the year 35.5 61.4
The accompanying notes are an integral part of the Audited Consolidated Financial Statements.
63Ontex Annual Review 2014
Financial Statements
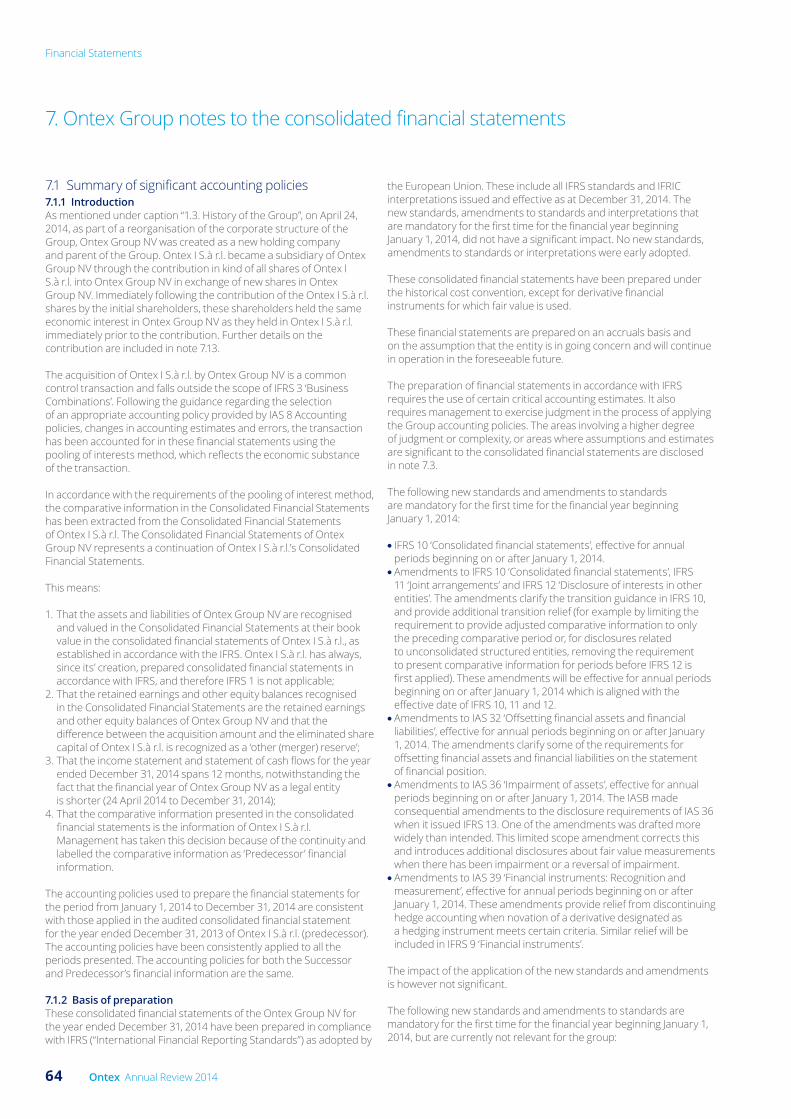
7.1 Summary of significant accounting policies7.1.1 Introduction As mentioned under caption “1.3. History of the Group”, on April 24, 2014, as part of a reorganisation of the corporate structure of the Group, Ontex Group NV was created as a new holding company and parent of the Group. Ontex I S.à r.l. became a subsidiary of Ontex Group NV through the contribution in kind of all shares of Ontex I S.à r.l. into Ontex Group NV in exchange of new shares in Ontex Group NV. Immediately following the contribution of the Ontex I S.à r.l. shares by the initial shareholders, these shareholders held the same economic interest in Ontex Group NV as they held in Ontex I S.à r.l. immediately prior to the contribution. Further details on the contribution are included in note 7.13.
The acquisition of Ontex I S.à r.l. by Ontex Group NV is a common control transaction and falls outside the scope of IFRS 3 ‘Business Combinations’. Following the guidance regarding the selection of an appropriate accounting policy provided by IAS 8 Accounting policies, changes in accounting estimates and errors, the transaction has been accounted for in these financial statements using the pooling of interests method, which reflects the economic substance of the transaction.
In accordance with the requirements of the pooling of interest method, the comparative information in the Consolidated Financial Statements has been extracted from the Consolidated Financial Statements of Ontex I S.à r.l. The Consolidated Financial Statements of Ontex Group NV represents a continuation of Ontex I S.à r.l.’s Consolidated Financial Statements.
This means:
1. That the assets and liabilities of Ontex Group NV are recognised and valued in the Consolidated Financial Statements at their book value in the consolidated financial statements of Ontex I S.à r.l., as established in accordance with the IFRS. Ontex I S.à r.l. has always, since its’ creation, prepared consolidated financial statements in accordance with IFRS, and therefore IFRS 1 is not applicable;
2. That the retained earnings and other equity balances recognised in the Consolidated Financial Statements are the retained earnings and other equity balances of Ontex Group NV and that the difference between the acquisition amount and the eliminated share capital of Ontex I S.à r.l. is recognized as a ‘other (merger) reserve’;
3. That the income statement and statement of cash flows for the year ended December 31, 2014 spans 12 months, notwithstanding the fact that the financial year of Ontex Group NV as a legal entity is shorter (24 April 2014 to December 31, 2014);
4. That the comparative information presented in the consolidated financial statements is the information of Ontex I S.à r.l. Management has taken this decision because of the continuity and labelled the comparative information as ‘Predecessor’ financial information.
The accounting policies used to prepare the financial statements for the period from January 1, 2014 to December 31, 2014 are consistent with those applied in the audited consolidated financial statement for the year ended December 31, 2013 of Ontex I S.à r.l. (predecessor). The accounting policies have been consistently applied to all the periods presented. The accounting policies for both the Successor and Predecessor’s financial information are the same.
7.1.2 Basis of preparation These consolidated financial statements of the Ontex Group NV for the year ended December 31, 2014 have been prepared in compliance with IFRS (“International Financial Reporting Standards”) as adopted by
the European Union. These include all IFRS standards and IFRIC interpretations issued and effective as at December 31, 2014. The new standards, amendments to standards and interpretations that are mandatory for the first time for the financial year beginning January 1, 2014, did not have a significant impact. No new standards, amendments to standards or interpretations were early adopted.
These consolidated financial statements have been prepared under the historical cost convention, except for derivative financial instruments for which fair value is used.
These financial statements are prepared on an accruals basis and on the assumption that the entity is in going concern and will continue in operation in the foreseeable future.
The preparation of financial statements in accordance with IFRS requires the use of certain critical accounting estimates. It also requires management to exercise judgment in the process of applying the Group accounting policies. The areas involving a higher degree of judgment or complexity, or areas where assumptions and estimates are significant to the consolidated financial statements are disclosed in note 7.3.
The following new standards and amendments to standards are mandatory for the first time for the financial year beginning January 1, 2014:
●● IFRS 10 ‘Consolidated financial statements’, effective for annual periods beginning on or after January 1, 2014.●● Amendments to IFRS 10 ‘Consolidated financial statements’, IFRS 11 ‘Joint arrangements’ and IFRS 12 ‘Disclosure of interests in other entities’. The amendments clarify the transition guidance in IFRS 10, and provide additional transition relief (for example by limiting the requirement to provide adjusted comparative information to only the preceding comparative period or, for disclosures related to unconsolidated structured entities, removing the requirement to present comparative information for periods before IFRS 12 is first applied). These amendments will be effective for annual periods beginning on or after January 1, 2014 which is aligned with the effective date of IFRS 10, 11 and 12.●● Amendments to IAS 32 ‘Offsetting financial assets and financial liabilities’, effective for annual periods beginning on or after January 1, 2014. The amendments clarify some of the requirements for offsetting financial assets and financial liabilities on the statement of financial position.●● Amendments to IAS 36 ‘Impairment of assets’, effective for annual periods beginning on or after January 1, 2014. The IASB made consequential amendments to the disclosure requirements of IAS 36 when it issued IFRS 13. One of the amendments was drafted more widely than intended. This limited scope amendment corrects this and introduces additional disclosures about fair value measurements when there has been impairment or a reversal of impairment.●● Amendments to IAS 39 ‘Financial instruments: Recognition and measurement’, effective for annual periods beginning on or after January 1, 2014. These amendments provide relief from discontinuing hedge accounting when novation of a derivative designated as a hedging instrument meets certain criteria. Similar relief will be included in IFRS 9 ‘Financial instruments’.
The impact of the application of the new standards and amendments is however not significant.
The following new standards and amendments to standards are mandatory for the first time for the financial year beginning January 1, 2014, but are currently not relevant for the group:
7. Ontex Group notes to the consolidated financial statements
64 Ontex Annual Review 2014
Financial Statements
●● IAS 27 Revised ‘Separate financial statements’, effective for annual periods beginning on or after January 1, 2014. ●● IAS 28 Revised ‘Investments in associates and joint ventures’, effective for annual periods beginning on or after January 1, 2014.●● IFRS 11 ‘Joint arrangements’, effective for annual periods beginning on or after January 1, 2014.●● IFRS 12 ‘Disclosure of interests in other entities’, effective for annual periods beginning on or after January 1, 2014.●● Amendments to IFRS 10 ‘Consolidated financial statements’, IFRS 12 ‘Disclosure of interests in other entities’ and IAS 27 ‘Separate financial statements’ for investment entities. Effective for annual periods beginning on or after January 1, 2014. The amendments give an exemption to entities that meet an ‘investment entity’ definition and which display certain characteristics to account for its subsidiaries at fair value.
The following new interpretation and amendments to standards have been issued and have been endorsed by the European Union, but are not mandatory for the first time for the financial year beginning January 1, 2014:
●● IFRIC 21 ‘Levies’, effective for annual periods beginning on or after 17 June 2014.●● ‘Annual improvements (2010-2012 cycle)’ with minor amendments to eight standards, effective for annual periods beginning on or after 1 February 2015. The amendments relate to IFRS 2 ‘Definition of vesting condition’, IFRS 3 ‘Accounting for contingent consideration in a business combination’, IFRS 8 ‘Aggregation of operating segments’, ‘IFRS 8 ‘Reconciliation of the total of the reportable segments’ assets to the entity’s assets’, IFRS 13 ‘Short-term receivables and payables’, IAS 7 ‘Interest paid that is capitalised’, IAS 16/IAS 38 ‘Revaluation method—proportionate restatement of accumulated depreciation’ and IAS 24 ‘Key management personnel’.●● ‘Annual improvements (2011-2013 cycle)’ in response to four issues addressed during the 2011-2013 cycle, effective for annual periods beginning on or after January 1, 2015. The amendments include IFRS 1 ‘Meaning of effective IFRSs’, IFRS 3 ‘Scope exceptions for joint ventures’, IFRS 13 ‘Scope of paragraph 52 (portfolio exception)’ and IAS 40 ‘Clarifying the interrelationship of IFRS 3 Business Combinations and IAS 40 Investment Property when classifying property as investment property or owner-occupied property’.●● Amendment to IAS 19 ‘Defined benefit plans’, effective for annual periods beginning on or after 1 February 2015.
The following new standards and amendments to standards have been issued, but are not mandatory for the first time for the financial year beginning January 1, 2014 and have not been endorsed by the European Union:
●● IFRS 14 ‘Regulatory deferral accounts’, effective for annual periods beginning on or after January 1, 2016.●● ‘Annual Improvements (2012–2014 cycle)’ with amendments to 4 standards, effective for annual periods beginning on or after January 1, 2016. The amendments include IFRS 5, ‘Non-current assets held for sale and discontinued operations’, IAS 19, ‘Employee benefits’, IFRS 7, ‘Financial instruments: disclosures’ and IAS 34, ‘Interim financial reporting’.●● Amendment to IAS 16 ‘Property, plant and equipment’ and IAS 38 ‘Intangible assets’ on depreciation and amortisation, effective for annual periods beginning on or after January 1, 2016.●● Amendment to IAS 16 ‘Property, plant and equipment’ and IAS 41 ‘Agriculture’ on bearer plants, effective for annual periods beginning on or after January 1, 2016.●● Amendment to IFRS 11 ‘Joint arrangements’ on acquisition of an interest in a joint operation, effective for annual periods beginning on or after January 1, 2016.
●● Amendments to IAS 27 ‘Separate financial statements’ on the equity method, effective for annual periods beginning on or after January 1, 2016.●● Amendments to IFRS 10, ‘Consolidated financial statements’ and IAS 28, ‘Investments in associates and joint ventures’, effective for annual periods beginning on or after January 1, 2016.●● IFRS 15 ‘Revenue from contracts with customers’.●● IFRS 9 ‘Financial instruments’, effective for annual periods beginning on or after January 1, 2018.●● Amendment to IFRS 9 ‘financial instruments’ on general hedge accounting, effective for annual periods beginning on or after January 1, 2018.●● Amendments to IFRS 10 ‘Consolidated financial statements’, IFRS 12 ‘Disclosure of interests in other entities’ and IAS 28, ‘Investments in associates and joint ventures’, effective for annual periods beginning on or after January 1, 2016.●● Amendments to IAS 1 ‘Presentation of financial statements’, effective for annual periods beginning on or after January 1, 2016.
Should the standards have been early adopted there would be no impact on the consolidated financial statements of the Group for the financial year ended December 31, 2014.
7.1.3 Consolidation Subsidiaries:Subsidiaries are all entities over which the Group has control. Control is established when the Group is exposed, or has the rights, to variable returns from its involvement with the subsidiary and has the ability to affect those returns through its power over the subsidiary. Subsidiaries are fully consolidated from the date on which control is transferred to the Group. They are de-consolidated from the date that control ceases.
The purchase method of accounting is used to account for the acquisition of subsidiaries by the Group. The consideration transferred for the acquisition of a subsidiary is the fair values of the assets transferred, the liabilities incurred and the equity interests issued by the Group. The consideration transferred includes the fair value of any asset or liability resulting from a contingent consideration agreement. Acquisition related costs are expensed as incurred. Identifiable assets acquired and liabilities and contingent liabilities assumed in a business combination are measured initially at their fair values at acquisition date. On an acquisition-by-acquisition basis, the Group recognises any non-controlling interest in the acquiree at fair value or at the non-controlling interest’s proportionate share of the acquiree’s net assets.
The excess of the consideration of any non-controlling interest in the acquiree and the acquisition date fair value of any previous equity interest in the acquiree over the fair value of the Group’s share of the identifiable net assets acquired is recorded as goodwill. If this is less than the fair value of the net assets of the subsidiary in the case of a bargain purchase, the difference is recognised directly in the income statement.
Inter-company transactions, balances and unrealised gains on transactions between group companies are eliminated. Unrealised losses are also eliminated but considered an impairment indicator of the asset transferred.
Transactions with non-controlling interests:The Group treats the transactions with non-controlling interests as transactions with equity owners of the Group. For purchases from non-controlling interests, the difference between any consideration paid and the relevant share acquired of the carrying value of the net assets of the subsidiary is recorded in equity. Gains and losses on disposal to non-controlling interests are also recorded in equity.
65Ontex Annual Review 2014
Financial Statements

When the Group ceases to have control or significant influence, any retained interest in the entity is re-measured to its fair value, with the change in carrying amount recognised in profit or loss. The fair value is the initial carrying amount for the purposes of subsequent accounting for the retained interest as an associate, joint venture or financial asset. In addition, any amounts previously recognised in other comprehensive income in respect of that entity are accounted for as if the Group had directly disposed of the related assets or liabilities. This may mean that amounts previously recognised in other comprehensive income are reclassified to profit or loss.
7.1.4 Goodwill Goodwill represents the excess of the cost of an acquisition over the fair value of the Group’s share of the net identifiable assets of the acquired subsidiary/associate at the date of acquisition. Goodwill on acquisitions of subsidiaries is included in “intangible assets”. Goodwill on acquisitions of associates is included in “investments in associates” and is tested for impairment as part of the overall balance. Separately recognised goodwill is tested annually for impairment and carried at cost less accumulated impairment losses. Impairment losses on goodwill are not reversed. Gains and losses on the disposal of an entity include the carrying amount of goodwill relating to the entity sold.
The goodwill recognised in the statement of financial position is allocated to four Cash Generating Units (CGUs). These CGUs are Mature Market Retail, Growth Markets, Healthcare and Middle East & Africa (MEA – former Turkey division). They represent the lowest level within the entity at which the goodwill is monitored for internal management purposes. This is in line with the centralised business model that was implemented during 2010.
7.1.5 Foreign currencies Items included in the financial statements of each of the Group’s entities are measured using the currency of the primary economic environment in which the entity operates (‘the functional currency’). The consolidated financial statements are presented in euro, which is the Group’s presentation currency.
Foreign currency transactions are translated into the functional currency using the exchange rates prevailing at the dates of the transactions. Foreign exchange gains and losses resulting from the settlement of such transactions and from the translation at year-end exchange rates of monetary assets and liabilities denominated in foreign currencies are recognised in the income statement.
Foreign exchange gains and losses that relate to interest-bearing debts and cash and cash equivalents are presented in the income statement within “Finance income” or “Finance cost”. All other foreign exchange gains and losses are presented in the income statement within “other operating income/(expense), net”.
For the purpose of presenting consolidated financial statements, assets and liabilities of the Group’s foreign operations are translated at the closing rate at the end of the reporting period. Items of income and expense are translated at the average exchange rates (unless this average is not a reasonable approximation of the cumulative effect of the rates prevailing on the transaction dates, in which case income and expenses are translated at the rate on the dates of the transactions), and equity items are translated at historical rates. The resulting exchange rate differences are recognised in other comprehensive income and accumulated in a separate component of equity.
The principal exchange rates that have been used are as follows:
2014 Successor 2013 PredecessorClosing Rate Av Rate Year Closing Rate Av Rate Year
AUD 1.4829 1.4724 1.5423 1.3770 GBP 0.7789 0.8064 0.8337 0.8493 PLN 4.2732 4.1853 4.1543 4.1971 RUB 72.3370 51.0062 45.3246 42.3248 TRY 2.8320 2.9071 2.9605 2.5329 USD 1.2141 1.3287 1.3791 1.3281
7.1.6 Other intangible assets An intangible asset is recognised on the statement of financial position when the following conditions are met: (1) the asset is identifiable, i.e. either separable (if it can be sold, transferred, licensed) or it results from contractual or legal rights; (2) it is probable that the expected future economic benefits that are attributable to the asset will flow to the Group; (3) the Group can control the resource; and (4) the cost of the asset can be measured reliably.
Intangible fixed assets are carried at acquisition cost (including the costs directly attributable to the transaction) less any accumulated amortisations and less any accumulated impairment losses.
Within the Group, internally generated intangibles represent IT projects. For internal IT projects, expenses that relate to the development phase are capitalised as internally generated intangibles assets. The Group’s systems allow a reliable measure of expenses directly attributable to the different IT projects.
Externally acquired software is carried at acquisition cost less any accumulated amortization and less any accumulated impairment loss.
Maintenance costs as well as the costs of minor upgrades whose objective is to maintain (rather than increase) the level of performance of the asset is expensed as incurred.
Borrowing costs that are directly attributable to the acquisition, construction and or production of a qualifying intangible asset are capitalised as part of the cost of the asset.
Intangible assets are amortised on a systematic basis over their useful life, using the straight-line method. The applicable useful lives are:
Intangible Assets Estimated useful life
Licenses 3 to 5 yearsAcquired concessions, patents, know-how, and other similar rights 5 years
Amortisation commences only when the asset is available for use.
7.1.7 Research & Development Notwithstanding the detailed follow up of the R&D programs for product development per project, the administrative system of the Group does not differentiate the incurred expenses between research and development phases. Therefore, the expenses in relation to the research and development phase are charged to the statement of comprehensive income within operating results.
7.1.8 Property, plant and equipment: Property, plant and equipment are carried at acquisition cost less any accumulated depreciation and less any accumulated impairment loss. Acquisition cost includes any directly attributable cost of bringing the asset to working condition for its intended use. Borrowing costs that
7. Ontex Group notes to the consolidated financial statements continued
66 Ontex Annual Review 2014
Financial Statements
are directly attributable to the acquisition, construction and/or production of a qualifying asset are capitalised as part of the cost of the asset.
Expenditure on repair and maintenance which serve only to maintain, but not increase, the value of fixed assets are charged to the income statement. However, expenditure on major repair and major maintenance, which increases the future economic benefits that will be generated by the fixed asset, is identified as a separate element of the acquisition cost. The cost of property, plant and equipment is broken down into major components. These major components, which are replaced at regular intervals and consequently have a useful life that is different from that of the fixed asset in which they are incorporated, are depreciated over their specific useful lives. In the event of replacement, the component is replaced and removed from the statement of financial position, and the new asset is depreciated up until the next major repair or maintenance.
The depreciable amount is allocated on a systematic basis over the useful life of the asset, using the straight-line method. The depreciable amount is the acquisition cost, less residual value, if any. The applicable useful lives are:
Tangible Assets Estimated useful life
Land N/ALand improvement and buildings 30 yearsPlants, machinery and equipment 10 to 15 yearsFurniture and vehicles 4 to 8 yearsOther tangible assets 5 yearsIT Equipment 3 to 5 years
The useful life of the machines is reviewed regularly. Each time a significant upgrade is performed, such upgrade extends the useful life of the machine. The cost of the upgrade is added to the carrying amount of the machine and the new carrying amount is depreciated prospectively over the remaining estimated useful life of the machine.
7.1.9 Leases Finance leases: The Group leases certain property, plant and equipment. Leases of property, plant and equipment for which the Group has substantially all the risks and rewards of ownership are classified as finance leases. Finance leases are capitalised at the lease’s commencement at the lower of the fair value of the leased property and the present value of the minimum lease payments. Each lease payment is allocated between the liability and finance charges so as to achieve a constant rate on the remaining balance of the liability. Finance expenses are recognised immediately in profit or loss, unless they are directly attributable to qualifying assets, in which case they are capitalised. Contingent rentals are recognised as expenses in the periods in which they are incurred.
If there is reasonable certainty that the Group will obtain ownership by the end of the lease term, the asset shall be depreciated over the useful life. In all other circumstances the asset is depreciated over the shorter of the useful life of the asset or the lease term.
Operating leases:A lease agreement is classified as an operating lease if all of the risks and rewards of ownership have not been transferred to the lessee. Payments under operating leases (net of any incentives received from the lessor) are charged to the income statement on a straight-line basis over the period of the lease.
7.1.10 Impairment of non-financial assets, other than goodwill Intangible assets with indefinite useful lives and intangible assets not yet available for use are not subject to amortisation, but are tested annually for impairment.
Other assets which are subject to amortisation are reviewed for impairment whenever events or changes in circumstances indicate that the carrying amount may not be recoverable. An impairment loss is recognised for the amount by which the asset’s carrying amount exceeds its recoverable amount. The recoverable amount is the higher of an asset’s fair value less costs to sell and value in use.
When an impairment loss subsequently reverses, the carrying amount of the asset (or a cash-generating unit) is increased to the revised estimate of its recoverable amount, but so that the increased carrying amount does not exceed the carrying amount that would have been determined had no impairment loss been recognised for the asset (or cash-generating unit) in prior years. A reversal of an impairment loss is recognised immediately in profit or loss.
7.1.11 Inventories Inventories are stated at the lower of cost and net realisable value. Cost is determined using the first-in, first-out (FIFO) method. The cost of finished goods and work in progress comprises the production costs, like raw materials, direct labour, and also the indirect production costs (production overheads based on normal operating capacity). Net realisable value is the estimated selling price in the ordinary course of business, less applicable variable selling expenses.
Spare parts held by the Group are classified as property, plant and equipment if they are expected to be used in more than one period and if they are specific to a single machine. If they are not expected to be used in more than one period or if they can be used on several machines, they are classified as inventory. For the spare parts classified as inventory, the Group uses write-down rules based on the economic use of these spare parts.
7.1.12 Revenue recognition Revenue comprises the fair value of the consideration received or receivable for the sale of goods or supply of services in the ordinary course of the Group’s activities. Revenue is shown net of value-added tax, returns, rebates and discounts and after eliminating sales within the Group.
The Group recognises revenue arising from the sale of goods when specific criteria have been met for each of the Group’s activities. When the Group transfers the significant risks and rewards of ownership, it retains neither continuing managerial involvement to the degree usually associated with ownership nor effective control over the goods sold, and the collectability of the related receivable is reasonably assured. Revenue is recognised upon delivery of the products to the customer and its acceptance thereof. Products are generally sold to customers on an ex-works basis, however at their request, additional services may be offered by us in expediting delivery to customer premises or warehouses. The price for our products generally reflects an amount of delivery expenses incurred by us. Consequently, the revenue reflects this component.
The recognition criteria are applied to the separately identifiable components of a single transaction when it is necessary to reflect the substance of the transaction.
Interest income is recognised using the effective interest method. Dividends are recognized when the shareholder’s right to receive payment is established.
67Ontex Annual Review 2014
Financial Statements

7.1.13 Financial assets The Group classifies its financial assets in the following categories: at fair value through profit or loss, and loans and receivables. The classification depends on the purpose for which the financial assets were acquired. Management determines the classification of its financial assets at initial recognition.
a) Financialassetsatfairvaluethroughprofitorloss(FVTPL)Financial assets are classified as at FVTPL, when the financial asset is either held for trading or is designated as at FVTPL.
A financial asset is classified as held for trading if:
●● It has been acquired principally for the purpose of selling in the near term; or●● On initial recognition it is part of a portfolio of identified financial instruments that the Group manages together and had a recent actual pattern of short-term profit-taking; or●● It is a derivative that is not designed effective as a hedging instrument.
A financial asset other than a financial asset held for trading may be designated as at FVTPL upon initial recognition if:
●● Such designation eliminates or significantly reduces a measurement or recognition inconsistency that would otherwise arise; or●● The financial asset forms part of a group of financial assets or financial liabilities or both, which is managed and its performance is evaluated on a fair value basis, in accordance with the Group’s documented risk management or investment strategy, and information about the grouping is provided internally on that basis: or●● It forms part of a contract containing one or more embedded derivatives, and IAS 39 permits the entire combined contract to be designed as at FVTPL.
Financial assets at FVTPL are stated at fair value, with any gains or losses arising on re-measurement recognized in profit or loss. The net gain or loss recognized in profit or loss incorporates any dividend or interest earned on the financial asset and is included in the ‘other gains and losses’ line item.
Financial assets at fair value through profit or loss are financial assets held for trading: they are classified as current assets. Derivatives are classified as held for trading, unless hedge accounting is applied (see note 7.1.23. below).
Assets in this category are recognised at fair value and subsequently adjusted to fair values, with any adjustments recognised immediately in the income statement.
b) Loans,payablesandreceivablesLoans, payables and receivables are non-derivative financial assets with fixed or determinable payments that are not quoted in an active market. Loans, payables (including other and trade payables) and receivables (including trade receivables and other receivables, cash and cash equivalents) are measured at amortised cost using the effective interest method, less any impairment.
The effective interest method is a method of calculating the amortised cost of a debt instrument and of allocating interest income over the relevant period. The effective interest rate is the rate that exactly discounts estimated future cash receipts (including all fees and points paid or received that form an integral part of the effective interest rate, transaction costs and other premiums or discounts) through the expected life of the debt instrument, or, where appropriate, a shorter period, to the net carrying amount on initial recognition.
7. Ontex Group notes to the consolidated financial statements continued
Trade and other receivables after and within one year are recognized initially at fair value and subsequently measured at amortised cost, i.e. at the net present value of the receivable amount, using the effective interest rate method, less allowances for impairment.
An allowance for impairment of trade receivables is accounted for when there is objective evidence that the Group will not be able to collect all amounts due according to the original terms of the receivables. The amount of the allowance is the difference between the carrying amount and the present value of estimated cash flows, including the proceeds of credit insurance contracts, discounted at the effective interest rate.
The amount of the allowance is deducted from the carrying amount of the asset and is recognised in the income statement within ‘sales and marketing expenses’.
Trade receivables are no longer recognised when (1) the rights to receive cash flows from the trade receivables have expired, (2) the Group has transferred substantially all risks and rewards related to the receivables.
c) De-recognitionoffinancialassetsThe Group derecognises a financial asset only when the contractual rights to the cash flows from the asset expire, or when it transfers the financial asset and substantially all the risks and rewards of ownership of the asset to another entity. If the Group neither transfers nor retains substantially all the risks and rewards of ownership and continues to control the transferred asset, the Group recognises its retained interest in the asset and an associated liability for amounts it may have to pay. If the Group retains substantially all the risks and rewards of ownership of a transferred financial asset, the Group continues to recognise the financial asset and also recognises a collateralised borrowing for the proceeds received.
On de-recognition of a financial asset in its entirety, the difference between the asset’s carrying amount and the sum of the consideration received and receivable and the cumulative gain or loss that had been recognised in other comprehensive income and accumulated in equity is recognised in profit or loss.
On de-recognition of a financial asset other than in its entirety (e.g. when the Group retains an option to repurchase part of a transferred asset), the Group allocates the previous carrying amount of the financial asset between the part it continues to recognise under continuing involvement, and the part it no longer recognises on the basis of the relative fair values of those parts on the date of the transfer. The difference between the carrying amount allocated to the part that is no longer recognised and the sum of the consideration received for the part no longer recognised and any cumulative gain or loss allocated to it that had been recognised in other comprehensive income is recognised in profit or loss. A cumulative gain or loss that had been recognised in other comprehensive income is allocated between the part that continues to be recognised and the part that is no longer recognised on the basis of the relative fair values of those parts.
7.1.14 Cash and cash equivalents Cash and cash equivalents include cash in hand, deposits held at call with banks, other short-term highly liquid investments with original maturities of three months or less. Bank overdrafts are shown within borrowings in current liabilities on the statement of financial position.
7.1.15 Share capital Ordinary shares are classified as equity. Where any Group company purchases the company’s equity share capital (treasury shares), the
68 Ontex Annual Review 2014
Financial Statements
consideration paid is deducted from equity attributable to owners of the company until the shares are cancelled or reissued. Incremental costs directly attributable to the issue of new shares are shown in equity as a deduction, net of tax, from the proceeds.
Financial instruments, such as the Convertible Preferred Equity Certificates (CPECs), are either classified as financial liabilities or equity. The financial instrument is included in equity if, and only if, the instrument does not include a contractual obligation to deliver cash or another financial asset or to exchange financial assets or liabilities under conditions that are potentially unfavourable to the Group, and if the instrument will or may be settled in a fixed number of the Group’s own equity instruments.
7.1.16 Government grants Grants from governments are recognised at their fair value where there is a reasonable assurance that the grant will be received and the Group will comply with all attached conditions.
Government grants relating to property, plant and equipment are deducted from the acquisition cost of the assets to which they relate and are credited to the income statement on a straight-line basis over the expected lives of the related assets.
7.1.17 Employee benefits Short-termemployeebenefits:Short-term employee benefits are recorded as an expense in the income statement in the period in which the services have been rendered. Any unpaid compensation is included in ‘social liabilities’ in the statement of financial position.
Post-employmentbenefits:Group companies operate various pension schemes. Most of the schemes are unfunded. Some schemes are funded through payments to insurance companies or pension funds, determined by periodic actuarial calculations. The Group has both defined benefit and defined contribution plans. A defined contribution plan is a pension plan under which the Group pays fixed contributions into a separate entity. The Group has no legal or constructive obligations to pay further contributions if the fund does not hold sufficient assets to pay all employees the benefits relating to employee service in the current and prior periods. A defined benefit plan is a pension plan that is not a defined contribution plan. Typically defined benefit plans define an amount of pension benefit that an employee will receive on retirement, usually dependent on one or more factors such as age, years of service and compensation.
The liability recognised in the balance sheet in respect of defined benefit pension plans is the present value of the defined benefit obligation at the end of the reporting period less the fair value of plan assets. The defined benefit obligation is calculated annually by independent actuaries using the projected unit credit method. The present value of the defined benefit obligation is determined by discounting the estimated future cash outflows using interest rates of high-quality corporate bonds that are denominated in the currency in which the benefits will be paid, and that have terms to maturity approximating to the terms of the related pension obligation. In countries where there is no deep market in such bonds, the market rates on government bonds are used.
Actuarial gains and losses arising from experience adjustments and changes in actuarial assumptions are charged or credited to other comprehensive income in the period in which they arise.
Past-service costs are recognised immediately in income. The net interest cost relating to the defined benefit plans is recognized within financial expenses.
For defined contribution plans, the Group pays contributions to publicly or privately administered pension insurance plans on a mandatory, contractual or voluntary basis. The Group has no further payment obligations once the contributions have been paid. The contributions are recognised as employee benefit expense when they are due. Prepaid contributions are recognised as an asset to the extent that a cash refund or a reduction in the future payments is available.
Long-termemployeebenefits:Unfunded obligations arising from long-term benefits are provided for using the projected unit credit method.
Terminationbenefits:Early termination obligations are recognised as a liability when the Group is ‘demonstrably committed’ to terminating the employment before the normal retirement date. The Group is ‘demonstrably committed’ when, and only when, it has a detailed formal plan for the early termination without realistic possibility of withdrawal. Where such benefits are long term, they are discounted using the same rate as above for defined benefit obligations.
7.1.18 Share-based paymentsThe Group operated a cash-settled incentive plan for which the amounts to be paid are based on the value of the shares of the Group, which terminated in June 2014 when Ontex Group NV successfully listed its shares on the Euronext Brussels Exchange.
The cost associated with the aforementioned plan was determined based on the fair value of the liability incurred. The liability was re-measured at the end of each reporting period and at the date of settlement, with changes in fair value recognised in profit and loss of the period. The fair value of the liability was recognised over the remaining vesting period of the rights at the moment of the re-measurement.
Since the IPO, the Group operates an equity settled share based compensation plan, consisting of stock options and restricted stock units (RSU). For grants of options and RSU after July 30, 2014, the fair value of the employee services received is measured by reference to the fair value of the shares or share options granted on the date of the grant. The Group recognizes fair value of the services received in exchange for the grant of the options as an expense and a corresponding increase in equity on a straight line basis over the vesting period. The fair value of the options granted is determined using option pricing models, which take into account the exercise price of the option, the share price at date of grant of the option, the risk free interest rate, the expected volatility of the share price over the life of the option and other relevant factors. Vesting conditions included in the terms of the grant are not taken into account in estimating fair value except where those terms relate to market conditions. Non-market vesting conditions are taken into account by adjusting the number of shares or share options included in the measurement of the cost of employee services so that ultimately the amount recognised in the income statement reflects the number of vested shares or share options.
At each balance sheet date, the entity revises its estimates of the number of options that are expected to become exercisable and recognizes the impact of revision of original estimates, if any, in the income statement and a corresponding adjustment to equity over the remaining vesting period.
When the options are exercised, the proceeds received net of any directly attributable transaction costs are credited to share capital (nominal value) and share premium.
69Ontex Annual Review 2014
Financial Statements

The social security contributions payable in connection with the grant of the share options is considered an integral part of the grant itself, and the charge will be treated as a cash-settled transaction.
7.1.19 Provisions Provisions are recognised when (I) the Group has a present legal or constructive obligation as a result of past events; (II) it is probable that an outflow of resources will be required to settle the obligation; (III) and the amount has been reliably estimated. Where there are a number of similar obligations, the likelihood that an outflow will be required in settlement is determined by considering the class of obligations as a whole.
Provisions are measured at the present value of the expenditures expected to be required to settle the obligation using a pre-tax rate that reflects current market assessments of the time value of money and the risks specific to the obligation. The increase in the provision due to passage of time is recognised as finance cost.
If the Group has an onerous contract, it will be recognised as a provision. Restructuring provisions comprise lease termination penalties and employee termination payments. Provisions are not recognised for future operating losses.
A provision for restructuring is only recorded if the Group demonstrates a constructive obligation to restructure at the balance sheet date. The constructive obligation should be demonstrated by: (a) a detailed formal plan identifying the main features of the restructuring; and (b) raising a valid expectation to those affected that it will carry out the restructuring by starting to implement the plan or by announcing its main features to those affected.
7.1.20 Income taxes Income tax expense represents the sum of the tax currently payable and deferred tax.
The current income tax charge is calculated on the basis of the tax laws enacted or substantively enacted at the end of the reporting period in the countries where the Group’s subsidiaries operate and generate taxable income. In line with paragraph 46 of IAS 12 ‘Income taxes’, management periodically evaluates positions taken in tax returns with respect to situations in which applicable tax regulations are subject to interpretation and establishes provisions where appropriate on the basis of amounts expected to be paid to the tax authorities. This evaluation is made for tax periods open for audit by the competent authorities.
Deferred tax assets and liabilities are measured at the tax rates that are expected to apply to the period when the asset is realised or the liability is settled, based on tax rates (and tax laws) that have been enacted or substantively enacted by the end of the reporting period.
Deferred tax is recognised on temporary differences arising between the tax bases of assets and liabilities and their carrying amounts in the consolidated financial statements.
However, the deferred tax is not recognised for:
●● The initial recognition of goodwill; ●● The initial recognition of an asset or liability in a transaction other than a business combination that at the time of the transaction affects neither accounting nor taxable profit or loss;
7. Ontex Group notes to the consolidated financial statements continued
●● Deferred tax is recognised on temporary differences arising on investments in subsidiaries and associates, except for deferred income tax liabilities where the timing of the reversal of the temporary difference is controlled by the Group and it is probable that the temporary difference will not reverse in the foreseeable future.
Deferred tax liabilities are generally recognised for all taxable temporary differences (including unused tax losses/tax credits carried forward). Deferred tax assets are generally recognised for all deductible temporary differences to the extent that it is probable that taxable profits will be available against which those deductible temporary differences can be utilized.
The carrying amount of deferred tax assets is reviewed at the end of each reporting period and reduced to the extent that it is no longer probable that sufficient taxable profits will be available to allow all or part of the asset to be recovered.
Deferred taxes are calculated at the level of each fiscal entity in the Group. The Group is able to offset deferred tax assets and liabilities only if the deferred tax balances relate to income taxes levied by the same taxation authority.
7.1.21 Financial liabilitiesFinancial liabilities are classified as either financial liabilities ‘at Fair Value Through Profit and Loss (FVTPL)’ or ‘other financial liabilities’.
A financial asset and a financial liability shall be offset and the net amount presented in the statement of financial position when, and only when, an entity:
a) currently has a legally enforceable right to set off the recognised amounts; and
b) intends either to settle on a net basis, or to realise the asset and settle the liability simultaneously.
FinancialliabilitiesatFVTPL:Financial liabilities are classified as at FVTPL when the financial liability is either held for trading or it is designated as at FVTPL.
A financial liability is classified as held for trading if:
●● it has been acquired principally for the purpose of repurchasing it in the near term; or●● on initial recognition it is part of a portfolio of identified financial instruments that the Group manages together and has a recent actual pattern of short-term profit-taking; or ●● it is a derivative that is not designated and effective as a hedging instrument.
A financial liability other than a financial liability held for trading may be designated as at FVTPL upon initial recognition if:
●● such designation eliminates or significantly reduces a measurement or recognition inconsistency that would otherwise arise; or ●● the financial liability forms part of a group of financial assets or financial liabilities or both, which is managed and its performance is evaluated on a fair value basis, in accordance with the Group’s documented risk management or investment strategy, and information about the grouping is provided internally on that basis; or●● it forms part of a contract containing one or more embedded derivatives, and IAS 39 permits the entire combined contract (asset or liability) to be designated as at FVTPL.
70 Ontex Annual Review 2014
Financial Statements

Financial liabilities at FVTPL are stated at fair value, with any gains or losses arising on – recognised in profit or loss. The net gain or loss recognised in profit or loss incorporates any interest paid on the financial liability in the consolidated income statement.
Otherfinancialliabilities:Other financial liabilities (including borrowings and trade and other payables) are subsequently measured at amortised cost using the effective interest method.
Borrowings are recognised initially at fair value, net of transaction costs incurred. Borrowings are subsequently stated at amortised cost; any difference between the proceeds (net of transaction costs) and the redemption value is recognised in the income statement over the period of the borrowings using the effective interest method. Borrowings are classified as current liabilities unless the Group has an unconditional right to defer settlement of the liability for at least 12 months after the end of the reporting period.
The effective interest method is a method of calculating the amortised cost of a financial liability and of allocating interest expense over the relevant period. The effective interest rate is the rate that exactly discounts estimated future cash payments (including all fees and points paid or received that form an integral part of the effective interest rate, transaction costs and other premiums or discounts) through the expected life of the financial liability, or (where appropriate) a shorter period, to the net carrying amount on initial recognition.
A limited part of trade payable is subject to reverse factoring. As the main risk and rewards of the trade payable remain with the Group, the financial liability is not de-recognised from trade payable.
7.1.22 Derivative financial instrumentsThe Group enters into a variety of derivative financial instruments to manage its exposure to interest rate-, foreign exchange rate- and commodity price risks, including foreign exchange forward contracts, commodity hedging contracts and interest rate CAP’s and SWAP’s.
Derivatives are accounted for in accordance with IAS 39. Derivatives are initially recognised at fair value at the date the derivative contracts are entered into and are subsequently re-measured to their fair value at the end of each reporting period. The resulting gain or loss is recognised in profit or loss immediately unless the derivative is designated and effective as a hedging instrument, in which event the timing of the recognition in profit or loss depends on the nature of the hedge relationship.
The fair values of various derivative instruments are disclosed in note 7.4 “Financial instruments & financial risk management”. The full fair value of a derivative is classified as a non-current asset or liability when the remaining maturity of the hedged item is more than 12 months and as a current asset or liability when the remaining maturity of the hedged item is less than 12 months.
If no hedge accounting is applied, the Group recognises all gains or losses resulting from changes in fair value of derivatives in the consolidated income statement within “Other operating income/expense” to the extent that they relate to operating activities and within “Finance income” of “Finance costs” to the extent that they relate to the financing activities of the Group (e.g. interest rate swaps relating to the floating rate borrowings).
Financial assets and liabilities are offset and the net amount is reported in the balance sheet when there is a legally enforceable right to offset the recognised amounts and there is an intention to settle on a net basis or realise the asset and settle the liability simultaneously.
7.1.23 Hedge accountingThe Group designates certain hedging instruments, which include derivatives in respect of foreign currency risk and commodities, as cash flow hedges. Hedges of foreign exchange risk on firm commitments are accounted for as cash flow hedges.
At the inception of the hedge relationship, the entity documents the relationship between the hedging instrument and the hedged item, along with its risk management objectives and its strategy for undertaking various hedge transactions. Furthermore, at the inception of the hedge and on an ongoing basis, the Group documents whether the hedging instrument is highly effective in offsetting changes in fair values or cash flows of the hedged item attributable to the hedged risk.
The effective portion of changes in the fair value of derivatives that are designated and qualify as cash flow hedges is recognised in other comprehensive income and accumulated under the heading of cash flow hedging reserve. The gain or loss relating to the ineffective portion is recognised immediately in profit or loss, and is included in the ‘other operating income/(expense)’ line item.
Amounts previously recognised in other comprehensive income and accumulated in equity are reclassified to profit or loss in the periods when the hedged item is recognised in profit or loss, in the same line of the consolidated income statement as the recognised hedged item. However, when the hedged forecast transaction results in the recognition of a non-financial asset or a non-financial liability, the gains and losses previously recognised in other comprehensive income and accumulated in equity are transferred from equity and included in the initial measurement of the cost of the non-financial asset or non-financial liability.
Hedge accounting is discontinued when the Group revokes the hedging relationship, when the hedging instrument expires or is sold, terminated, or exercised, or when it no longer qualifies for hedge accounting. Any gain or loss recognised in other comprehensive income and accumulated in equity at that time remains in equity and is recognised when the forecast transaction is ultimately recognised in profit or loss. When a forecast transaction is no longer expected to occur, the gain or loss accumulated in equity is recognised immediately in profit or loss.
7.1.24 Operating segmentsThe Group’s activities are in one segment. There are no other significant classes of business, either singularly or in aggregate. The chief operating decision maker, the Board of Directors, review the operating results (defined as EBITDA) and operating plans, and make resource allocation decisions on a company-wide basis; therefore the Group operates as one segment.
7.1.25 Statement of cash flows The cash flows of the Group are presented using the indirect method. This method reconciles the movement in cash for the reporting period by adjusting net profit of the year for any non-cash items and changes in working capital, and identifying investing and financing cash flows for the reporting period.
71Ontex Annual Review 2014
Financial Statements
7.1.26 Non-GAAP MeasuresEBITDA is defined as earnings before net finance cost, income taxes, depreciation and amortization have been deducted. This non-GAAP measure has been included in the financial statements since management believes that it is widely used by certain investors, securities analysts and other interested parties as supplemental measure of performance and liquidity.
Management also discloses non-recurring income and expenses. Non-recurring income and expenses are defined as those items that are considered by management to be non-recurring or unusual because of their nature. The non-recurring expenses relate to:
●● acquisition costs;●● business restructuring costs, including costs relate to the liquidation of subsidiaries and the closure, opening or relocations of factories;●● asset impairment costs;●● IPO and refinancing costs.
7.2 Capital Management The Group’s objectives when managing capital are to safeguard the Group’s ability to continue as a going concern in order to provide benefits for shareholders.
The Group monitors capital on the basis of the net debt position. The Group’s net debt position is calculated by adding all short and long-term interest bearing debts and by deducting the available short-term liquidity.
The net debt positions of the Group for the years ended December 31, are as follows:
In € million Note2014
Successor2013
Predecessor
Long-term interest bearing debt 15 618.2 896.7 Short-term interest bearing debt 15 2.4 13.9 Available short-term liquidity 12 (35.5) (61.4)Total net debt position 585.1 849.2
7.3 Critical Accounting Estimates and JudgmentsThe amounts presented in the consolidated financial statements involve the use of estimates and assumptions about the future. Estimates and judgments are continually evaluated and are based on historical experience and other factors, including expectations of future events that are believed to be reasonable under the circumstances. The actual amounts may differ from these estimates. The estimates and assumptions that could have an impact on the consolidated financial statements are discussed below:
7.3.1 Income taxesThe Group has tax losses and tax credits usable to offset future taxable profits, mainly in France and Belgium, amounting to €739.0 million at December 31, 2014 (€566.7 million at December 31, 2013). The Group has not fully recognised deferred tax assets in this respect. The valuation of this asset depends on a number of judgmental assumptions regarding the future probable taxable profits of different Group subsidiaries in different jurisdictions and on the outcome of tax planning strategies. These estimations are made prudently in the limit of the best current knowledge. Where circumstances should change and the final tax outcome would be different from the amounts that were initially recorded, such differences will impact the income tax and deferred tax provisions in the period in which such determination is made.
Overall, the rationale for not recognising deferred tax assets in respect of tax losses and tax credits is based on the fact that the losses are mainly generated as a consequence of the historic financing structure, the modification of which is depending on future events. Although the Group has planned some significant tax actions, these will only be taken into account for recognising deferred tax assets upon implementation.
7. Ontex Group notes to the consolidated financial statements continued
72 Ontex Annual Review 2014
Financial Statements

7.3.2 Impairment The Group tests annually whether goodwill has suffered any impairment in accordance with the accounting policy stated in note 7.1.4 “Goodwill”. The recoverable amounts of cash-generating units have been determined based on value-in-use calculations. These calculations require the use of estimates. These are summarised here below:
As at December 312014
Successor2013
Predecessor
Pre-tax discount rateMature Market Retail 7.4% 10.6%Growth Markets1 7.0% –Healthcare 8.0% 10.7%Middle East and Africa 9.1% 10.9%
1 No calculation available as for December 31, 2013.
Should the estimated EBITDA at December 31, 2014 and the following 2 years decrease by 15% than the discounted cash flows used in the calculation of the recoverable amount, or should the discount rate used in the calculation done at that date increase by 15%, no impairment would be recognised.
As indicated in note 7.8, Cash flows beyond the three year period are extrapolated using an estimated growth rate of 2% for Mature Market Retail and Growth Markets, 1% for Healthcare and 3% for MEA. These same percentages are used as perpetual growth rates. The growth rates have been determined by management but do not exceed the current market expectations in which the four CGUs are currently operating. Should the growth rate for any of the CGUs decrease by 50%, no impairment would need to be recognized.
Sufficient headroom is available to support the carrying amount of goodwill.
Future cash flows are estimates that are likely to be revised in future periods as underlying assumptions changes. Key assumptions in supporting the value of goodwill include long-term interest rates and other market data. Should the assumptions vary adversely in the future, the value in use of goodwill may reduce below their carrying amounts. Based on current valuations, headroom appears to be sufficient to absorb a normal variation in the underlying assumptions.
7.3.3 Expected useful lives The expected useful lives of the property, plant and equipment and intangible assets must be estimated. The determination of the useful lives of the assets is based on management’s judgment and it is reviewed at least at each financial year-end, pursuant to IAS 16.
7.3.4 Fair value of derivatives and other financial instruments The fair value of financial instruments that are not traded in an active market (for example, over-the-counter derivatives) is determined by using valuation techniques. The Group uses its judgment to select a variety of methods and make assumptions that are mainly based on market conditions existing at the end of each reporting period. All derivative financial instruments are, in accordance with IFRS 7, level 2. This means valuation methods are used for which all inputs that have a significant effect on the recorded fair value are observable in the market, either directly or indirectly.
7.3.5 Employee benefits The carrying amount of the Group’s employee benefit obligations is determined on an actuarial basis using certain assumptions. One particularly sensitive assumption used for determining the net cost of the benefits granted is the discount rate. Any change to this assumption will affect the carrying amount of those obligations.
The discount rate depends on the duration of the benefit, i.e. the average duration of the engagements, weighted with the present value of the costs linked to those engagements. According to IAS 19, the discount rate has to correspond to the rate of high-quality corporate bonds of similar term to the benefits valued and in the same currency.
Would the discount rate used be higher or lower than 1%, the impact on the financial statements would not be material.
73Ontex Annual Review 2014
Financial Statements

7. Ontex Group notes to the consolidated financial statements continued
7.4 Financial Instruments and Financial Risk Management7.4.1 Overview of financial instruments The table below summarises all financial instruments by category in accordance with IAS 39 and discloses the fair values of each instrument and the fair value hierarchy:
Financial instruments In € million
2013 Predecessor
Designated in hedge
relationship
At fair value through profit
or loss – Held for trading
Loans and receivables
at amortised cost Fair value
Fair value level
Non-current receivables 0.1 0.1 Level 2Trade receivables 199.0 199.0 Level 2Other receivables 28.7 28.7 Level 2Derivative financial assets 1.0 0.1 1.1
Interest rate caps 0.1 0.1 Level 2Forward foreign exchange contracts 1.0 1.0 Level 2
Cash and cash equivalents 61.4 61.4 Level 2Total Financial Assets 1.0 0.1 289.2 290.3
Interest-bearing debts – non-current 896.7 952.3 Senior Secured Notes 2011 > 1 Year 389.7 415.7 Level 1 Floating Rate Notes 2011 > 1 Year 274.8 280.2 Level 1 Senior Unsecured Notes 2011 > 1 Year 230.6 254.8 Level 1 Financial lease & other liabilities 1.6 1.6 Level 2
Derivative financial liabilities 1.9 1.9 Forward foreign exchange contracts 1.9 1.9 Level 2
Other non-current financial liabilities 10.0 10.0 Level 3Other payables – non-current 2.3 2.3 Level 3Interest-bearing debts – current 13.9 13.9
Bonds issued 31 March 2011 13.2 13.2 Level 1 Financial lease & other liabilities 0.7 0.7 Level 2
Other current financial liabilities 8.0 8.0 Level 3Trade payables 240.9 240.9 Level 2Other payables – current 11.0 11.0 Level 2Total Financial Liabilities 1.9 1,182.8 1,240.3
74 Ontex Annual Review 2014
Financial Statements

Financial instruments In € million
2014 Successor
Designated in hedge
relationship
At fair value through profit
or loss – Held for trading
Loans and receivables
at amortised cost Fair value
Fair value level
Trade receivables 204.3 204.3 Level 2Other receivables 44.8 44.8 Level 2Derivative financial assets 7.3 7.3
Commodity hedging contracts 0.2 0.2 Level 2Forward foreign exchange contracts 7.1 7.1 Level 2
Cash and cash equivalents 35.5 35.5 Level 2Total Financial Assets 7.3 284.6 292.0
Interest-bearing debts – non-current 618.2 643.6 Senior Secured Notes 2014 244.9 262.6 Level 1Facility A Loan 2014 > 1 year 372.3 380.0 Level 1Financial lease & other liabilities 1.0 1.0 Level 2
Derivative financial liabilities 5.5 5.5 Interest rate swap 0.7 0.7 Level 2Commodity hedging contracts 1.2 1.2 Level 2Forward foreign exchange contracts 3.6 3.6 Level 2
Other non-current financial liabilities 5.0 5.0 Level 3Interest-bearing debts – current 2.4 2.4
Accrued Interest on Bonds issued 2014: 1.5 1.5 Level 1Accrued Interest on Facility A Loan 2014 > 1 year 0.9 0.9 Level 1
Other current financial liabilities 5.0 5.0 Level 3Trade payables 254.5 254.5 Level 2Other payables – current 24.4 24.4 Level 2Total Financial Liabilities 5.5 909.6 940.5
Trading derivatives are classified as current assets or current liabilities. The full fair value of a hedging derivative is classified as a non-current asset or liability if the remaining maturity of the hedged item is more than 12 months and, as a current asset or liability, if the maturity of the hedged item is less than 12 months.
All trading derivatives fair value measurement is based on level 2 inputs as defined under IFRS 7§27, meaning inputs that are observable for the asset or liability, either directly (i.e. as prices) or indirectly (i.e. derived from prices).
The above table provides an analysis of financial instruments grouped into Levels 1 to 3 based on the degree to which the fair value (recognised on the statement of financial position or disclosed in the notes) is observable:
●● Level 1 fair value measurements are those derived from quoted prices (unadjusted) in active markets for identical assets or liabilities.●● Level 2 fair value measurements are those derived from inputs other than quoted prices included within Level 1 that are observable for the asset or liability, either directly (i.e. as prices) or indirectly (i.e. derived from prices).●● Level 3 fair value measurements are those derived from valuation techniques that include inputs for the asset or liability that are not based on observable market data (unobservable inputs).
The fair values of financial assets and financial liabilities are based on mathematical models that use market observable data and are determined as follows:
●● The fair values of financial assets and financial liabilities with standard terms and conditions and traded on active liquid markets are determined with reference to quoted market prices (includes listed redeemable notes). ●● The fair values of derivative instruments are calculated using quoted prices. Where such prices are not available, a discounted cash flow analysis is performed using the applicable yield curve for the duration of the instruments for non-optional derivatives, and option pricing models for optional derivatives. Foreign currency forward contracts are measured using quoted forward exchange rates and yield curves derived from quoted interest rates matching maturities of the contracts. Interest rate swaps are measured at the present value of future cash flows estimated and discounted based on the applicable yield curves derived from quoted interest rates.●● The fair values of other financial assets and financial liabilities (excluding those described above) are determined in accordance with generally accepted pricing models based on discounted cash flow analysis.●● Level 3 liabilities: the amount has been determined based on contractual agreements.
75Ontex Annual Review 2014
Financial Statements
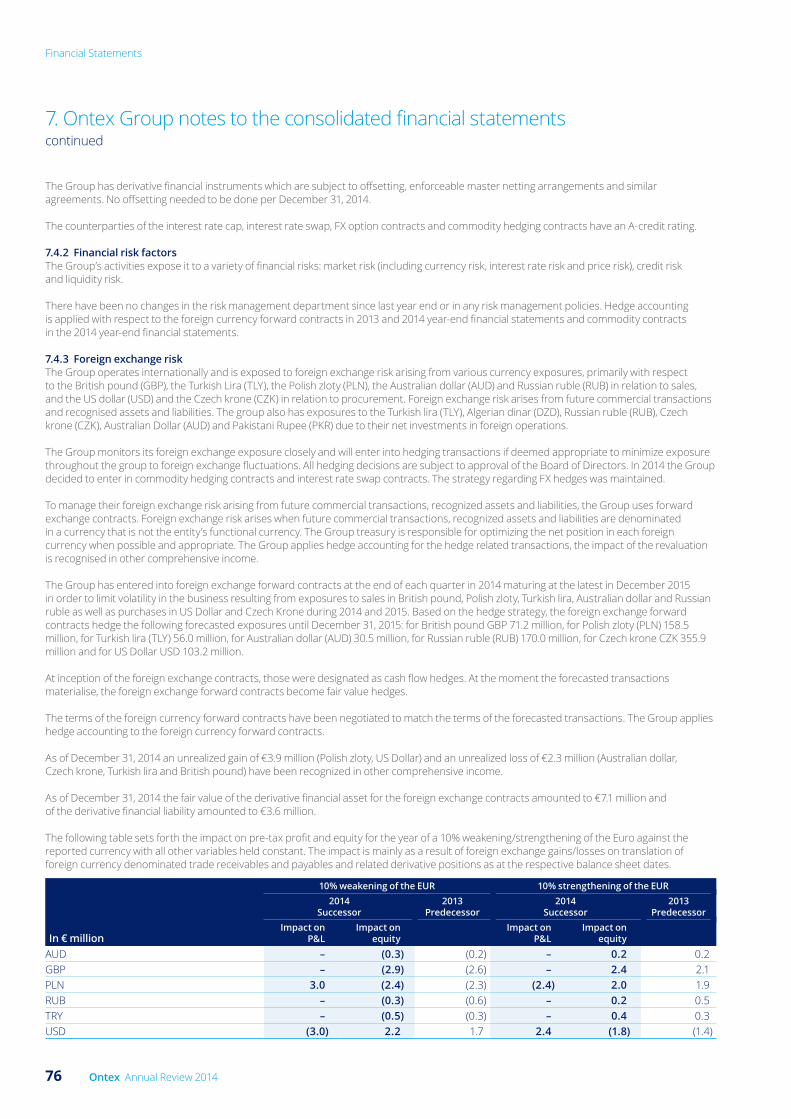
The Group has derivative financial instruments which are subject to offsetting, enforceable master netting arrangements and similar agreements. No offsetting needed to be done per December 31, 2014.
The counterparties of the interest rate cap, interest rate swap, FX option contracts and commodity hedging contracts have an A-credit rating.
7.4.2 Financial risk factors The Group’s activities expose it to a variety of financial risks: market risk (including currency risk, interest rate risk and price risk), credit risk and liquidity risk.
There have been no changes in the risk management department since last year end or in any risk management policies. Hedge accounting is applied with respect to the foreign currency forward contracts in 2013 and 2014 year-end financial statements and commodity contracts in the 2014 year-end financial statements.
7.4.3 Foreign exchange risk The Group operates internationally and is exposed to foreign exchange risk arising from various currency exposures, primarily with respect to the British pound (GBP), the Turkish Lira (TLY), the Polish zloty (PLN), the Australian dollar (AUD) and Russian ruble (RUB) in relation to sales, and the US dollar (USD) and the Czech krone (CZK) in relation to procurement. Foreign exchange risk arises from future commercial transactions and recognised assets and liabilities. The group also has exposures to the Turkish lira (TLY), Algerian dinar (DZD), Russian ruble (RUB), Czech krone (CZK), Australian Dollar (AUD) and Pakistani Rupee (PKR) due to their net investments in foreign operations.
The Group monitors its foreign exchange exposure closely and will enter into hedging transactions if deemed appropriate to minimize exposure throughout the group to foreign exchange fluctuations. All hedging decisions are subject to approval of the Board of Directors. In 2014 the Group decided to enter in commodity hedging contracts and interest rate swap contracts. The strategy regarding FX hedges was maintained.
To manage their foreign exchange risk arising from future commercial transactions, recognized assets and liabilities, the Group uses forward exchange contracts. Foreign exchange risk arises when future commercial transactions, recognized assets and liabilities are denominated in a currency that is not the entity’s functional currency. The Group treasury is responsible for optimizing the net position in each foreign currency when possible and appropriate. The Group applies hedge accounting for the hedge related transactions, the impact of the revaluation is recognised in other comprehensive income.
The Group has entered into foreign exchange forward contracts at the end of each quarter in 2014 maturing at the latest in December 2015 in order to limit volatility in the business resulting from exposures to sales in British pound, Polish zloty, Turkish lira, Australian dollar and Russian ruble as well as purchases in US Dollar and Czech Krone during 2014 and 2015. Based on the hedge strategy, the foreign exchange forward contracts hedge the following forecasted exposures until December 31, 2015: for British pound GBP 71.2 million, for Polish zloty (PLN) 158.5 million, for Turkish lira (TLY) 56.0 million, for Australian dollar (AUD) 30.5 million, for Russian ruble (RUB) 170.0 million, for Czech krone CZK 355.9 million and for US Dollar USD 103.2 million.
At inception of the foreign exchange contracts, those were designated as cash flow hedges. At the moment the forecasted transactions materialise, the foreign exchange forward contracts become fair value hedges.
The terms of the foreign currency forward contracts have been negotiated to match the terms of the forecasted transactions. The Group applies hedge accounting to the foreign currency forward contracts.
As of December 31, 2014 an unrealized gain of €3.9 million (Polish zloty, US Dollar) and an unrealized loss of €2.3 million (Australian dollar, Czech krone, Turkish lira and British pound) have been recognized in other comprehensive income.
As of December 31, 2014 the fair value of the derivative financial asset for the foreign exchange contracts amounted to €7.1 million and of the derivative financial liability amounted to €3.6 million.
The following table sets forth the impact on pre-tax profit and equity for the year of a 10% weakening/strengthening of the Euro against the reported currency with all other variables held constant. The impact is mainly as a result of foreign exchange gains/losses on translation of foreign currency denominated trade receivables and payables and related derivative positions as at the respective balance sheet dates.
In € million
10% weakening of the EUR 10% strengthening of the EUR2014
Successor2013
Predecessor2014
Successor2013
PredecessorImpact on
P&LImpact on
equityImpact on
P&LImpact on
equity
AUD – (0.3) (0.2) – 0.2 0.2 GBP – (2.9) (2.6) – 2.4 2.1 PLN 3.0 (2.4) (2.3) (2.4) 2.0 1.9 RUB – (0.3) (0.6) – 0.2 0.5 TRY – (0.5) (0.3) – 0.4 0.3 USD (3.0) 2.2 1.7 2.4 (1.8) (1.4)
7. Ontex Group notes to the consolidated financial statements continued
76 Ontex Annual Review 2014
Financial Statements
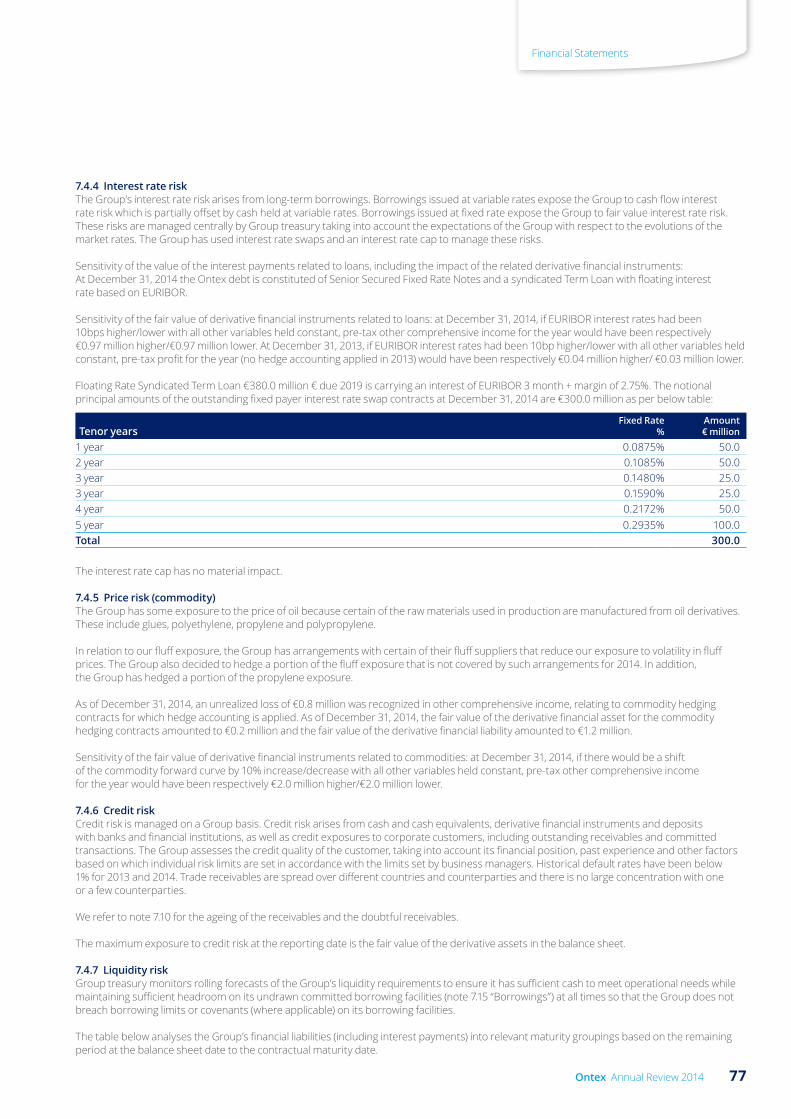
7.4.4 Interest rate risk The Group’s interest rate risk arises from long-term borrowings. Borrowings issued at variable rates expose the Group to cash flow interest rate risk which is partially offset by cash held at variable rates. Borrowings issued at fixed rate expose the Group to fair value interest rate risk. These risks are managed centrally by Group treasury taking into account the expectations of the Group with respect to the evolutions of the market rates. The Group has used interest rate swaps and an interest rate cap to manage these risks.
Sensitivity of the value of the interest payments related to loans, including the impact of the related derivative financial instruments: At December 31, 2014 the Ontex debt is constituted of Senior Secured Fixed Rate Notes and a syndicated Term Loan with floating interest rate based on EURIBOR.
Sensitivity of the fair value of derivative financial instruments related to loans: at December 31, 2014, if EURIBOR interest rates had been 10bps higher/lower with all other variables held constant, pre-tax other comprehensive income for the year would have been respectively €0.97 million higher/€0.97 million lower. At December 31, 2013, if EURIBOR interest rates had been 10bp higher/lower with all other variables held constant, pre-tax profit for the year (no hedge accounting applied in 2013) would have been respectively €0.04 million higher/ €0.03 million lower.
Floating Rate Syndicated Term Loan €380.0 million € due 2019 is carrying an interest of EURIBOR 3 month + margin of 2.75%. The notional principal amounts of the outstanding fixed payer interest rate swap contracts at December 31, 2014 are €300.0 million as per below table:
Tenor yearsFixed Rate
%Amount€ million
1 year 0.0875% 50.0 2 year 0.1085% 50.0 3 year 0.1480% 25.0 3 year 0.1590% 25.0 4 year 0.2172% 50.0 5 year 0.2935% 100.0 Total 300.0
The interest rate cap has no material impact.
7.4.5 Price risk (commodity) The Group has some exposure to the price of oil because certain of the raw materials used in production are manufactured from oil derivatives. These include glues, polyethylene, propylene and polypropylene.
In relation to our fluff exposure, the Group has arrangements with certain of their fluff suppliers that reduce our exposure to volatility in fluff prices. The Group also decided to hedge a portion of the fluff exposure that is not covered by such arrangements for 2014. In addition, the Group has hedged a portion of the propylene exposure.
As of December 31, 2014, an unrealized loss of €0.8 million was recognized in other comprehensive income, relating to commodity hedging contracts for which hedge accounting is applied. As of December 31, 2014, the fair value of the derivative financial asset for the commodity hedging contracts amounted to €0.2 million and the fair value of the derivative financial liability amounted to €1.2 million.
Sensitivity of the fair value of derivative financial instruments related to commodities: at December 31, 2014, if there would be a shift of the commodity forward curve by 10% increase/decrease with all other variables held constant, pre-tax other comprehensive income for the year would have been respectively €2.0 million higher/€2.0 million lower.
7.4.6 Credit risk Credit risk is managed on a Group basis. Credit risk arises from cash and cash equivalents, derivative financial instruments and deposits with banks and financial institutions, as well as credit exposures to corporate customers, including outstanding receivables and committed transactions. The Group assesses the credit quality of the customer, taking into account its financial position, past experience and other factors based on which individual risk limits are set in accordance with the limits set by business managers. Historical default rates have been below 1% for 2013 and 2014. Trade receivables are spread over different countries and counterparties and there is no large concentration with one or a few counterparties.
We refer to note 7.10 for the ageing of the receivables and the doubtful receivables.
The maximum exposure to credit risk at the reporting date is the fair value of the derivative assets in the balance sheet.
7.4.7 Liquidity risk Group treasury monitors rolling forecasts of the Group’s liquidity requirements to ensure it has sufficient cash to meet operational needs while maintaining sufficient headroom on its undrawn committed borrowing facilities (note 7.15 “Borrowings”) at all times so that the Group does not breach borrowing limits or covenants (where applicable) on its borrowing facilities.
The table below analyses the Group’s financial liabilities (including interest payments) into relevant maturity groupings based on the remaining period at the balance sheet date to the contractual maturity date.
77Ontex Annual Review 2014
Financial Statements
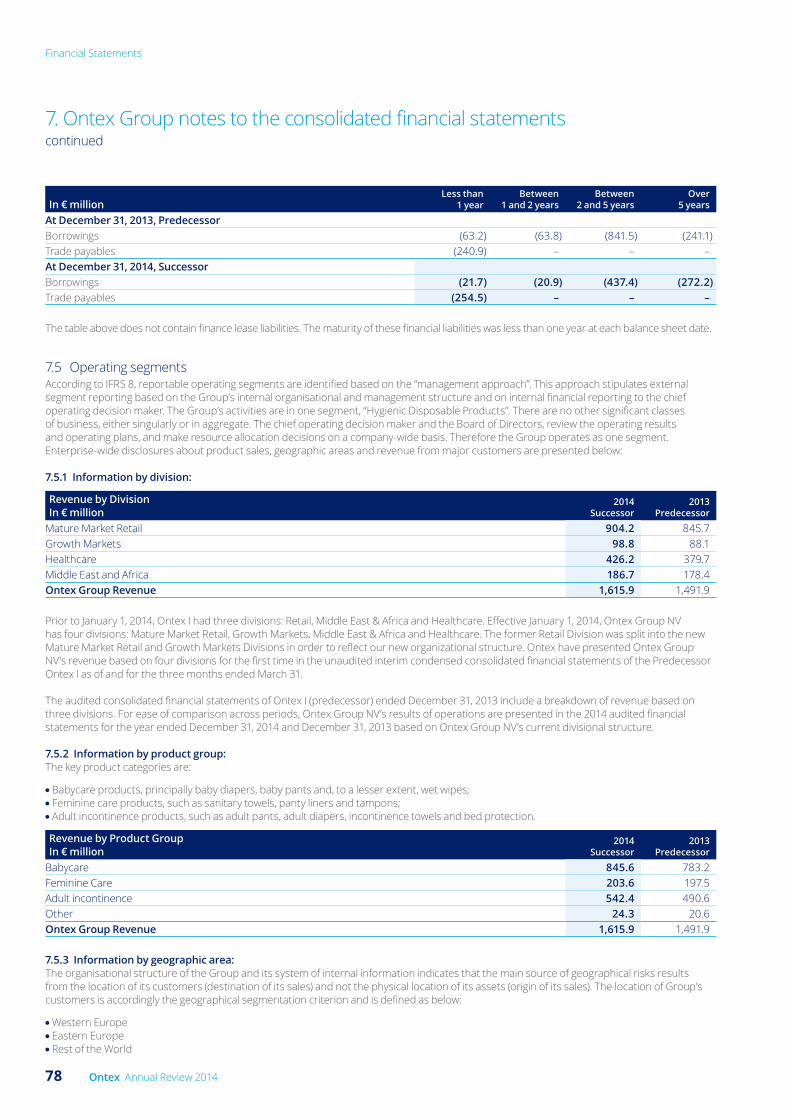
In € millionLess than
1 yearBetween
1 and 2 yearsBetween
2 and 5 yearsOver
5 years
At December 31, 2013, PredecessorBorrowings (63.2) (63.8) (841.5) (241.1)Trade payables (240.9) – – – At December 31, 2014, SuccessorBorrowings (21.7) (20.9) (437.4) (272.2)Trade payables (254.5) – – –
The table above does not contain finance lease liabilities. The maturity of these financial liabilities was less than one year at each balance sheet date.
7.5 Operating segmentsAccording to IFRS 8, reportable operating segments are identified based on the “management approach”. This approach stipulates external segment reporting based on the Group’s internal organisational and management structure and on internal financial reporting to the chief operating decision maker. The Group’s activities are in one segment, “Hygienic Disposable Products”. There are no other significant classes of business, either singularly or in aggregate. The chief operating decision maker and the Board of Directors, review the operating results and operating plans, and make resource allocation decisions on a company-wide basis. Therefore the Group operates as one segment. Enterprise-wide disclosures about product sales, geographic areas and revenue from major customers are presented below:
7.5.1 Information by division:
Revenue by DivisionIn € million
2014Successor
2013Predecessor
Mature Market Retail 904.2 845.7 Growth Markets 98.8 88.1 Healthcare 426.2 379.7 Middle East and Africa 186.7 178.4 Ontex Group Revenue 1,615.9 1,491.9
Prior to January 1, 2014, Ontex I had three divisions: Retail, Middle East & Africa and Healthcare. Effective January 1, 2014, Ontex Group NV has four divisions: Mature Market Retail, Growth Markets, Middle East & Africa and Healthcare. The former Retail Division was split into the new Mature Market Retail and Growth Markets Divisions in order to reflect our new organizational structure. Ontex have presented Ontex Group NV’s revenue based on four divisions for the first time in the unaudited interim condensed consolidated financial statements of the Predecessor Ontex I as of and for the three months ended March 31.
The audited consolidated financial statements of Ontex I (predecessor) ended December 31, 2013 include a breakdown of revenue based on three divisions. For ease of comparison across periods, Ontex Group NV’s results of operations are presented in the 2014 audited financial statements for the year ended December 31, 2014 and December 31, 2013 based on Ontex Group NV’s current divisional structure.
7.5.2 Information by product group: The key product categories are:
●● Babycare products, principally baby diapers, baby pants and, to a lesser extent, wet wipes;●● Feminine care products, such as sanitary towels, panty liners and tampons;●● Adult incontinence products, such as adult pants, adult diapers, incontinence towels and bed protection.
Revenue by Product GroupIn € million
2014Successor
2013Predecessor
Babycare 845.6 783.2 Feminine Care 203.6 197.5 Adult incontinence 542.4 490.6 Other 24.3 20.6 Ontex Group Revenue 1,615.9 1,491.9
7.5.3 Information by geographic area: The organisational structure of the Group and its system of internal information indicates that the main source of geographical risks results from the location of its customers (destination of its sales) and not the physical location of its assets (origin of its sales). The location of Group’s customers is accordingly the geographical segmentation criterion and is defined as below:
●● Western Europe ●● Eastern Europe ●● Rest of the World
7. Ontex Group notes to the consolidated financial statements continued
78 Ontex Annual Review 2014
Financial Statements

Revenue by GeographyIn € million
2014Successor
2013Predecessor
Western Europe 1,111.6 1,020.7 Eastern Europe 216.2 197.3 Rest of the World 288.1 273.9 Ontex Group Revenue 1,615.9 1,491.9
The sales in the country of domicile of Ontex Group NV (Belgium) successor and Ontex I (S.à r.l.) predecessor represent less than 5% of Ontex Group NV Revenue. Sales to countries in our top 3 markets are presented in the table below. The sales in all other individual countries represent less than 10% of Ontex Group NV Revenue.
Revenue by countryIn € million
2014Successor
2013Predecessor
United Kingdom 273.7 247.5 France 228.6 228.0 Italy 175.9 105.9 Other countries 937.7 910.5 Ontex Group Revenue 1,615.9 1,491.9
7.5.4 Revenue from major customers: The Group does not have a single significant customer. In 2014 the largest customer represents 6.6% of the revenue. The 10 largest customers represent 38.1% of 2014 revenue.
7.6 List of Consolidated Companies
Name Country
2014Successor%
2013Predecessor% Registered office
Company legal number
Can Hygiene SPA Algeria 100.00% 93.47% Haouch Sbaat Nord, Zone Industrielle de Rouiba, Voie H, lot 83B, 16012 Rouiba, Alger, Algeria
N/A
Ontex Manufacturing Pty Ltd (former Ontex Australia Pty Ltd)
Australia 100.00% 93.47% Wonderland Drive 5, Eastern Creek, NSW, 2766, Australia
N/A
Ontex Australia Pty Ltd Australia 100.00% 93.47% Suite 10, 27 Mayneview Street, Milton, QLD 4064, Australia
ABN 59 130 076 283
Ontex Coordination Center bvba Belgium 100.00% 93.47% Korte Keppestraat 21, 9320 Erembodegem, Belgium 0460.560.453Eutima bvba Belgium 100.00% 93.47% Korte Moeie 53, 9900 Eeklo, Belgium 0415.412.891Ontema bvba Belgium 100.00% 93.47% Genthof 12,9255 Buggenhout, Belgium 0453.081.852Ontex bvba Belgium 100.00% 93.47% Genthof 5, 9255 Buggenhout, Belgium 0419.457.296ONV Topco NV Belgium 100.00% 93.47% Korte Keppestraat 21, 9320 Erembodegem, Belgium 0479.340.742Ontex International bvba Belgium 100.00% 93.47% Korte Keppestraat 21, 9320 Erembodegem, Belgium 0478.866.432Ontex Hygienic Disponables (Yangzhou) Co.TD
China 100.00% 93.47% Hangji industrial park, Hanjiang Dictrict, 225111 Yangzhou, China
N/A
Ontex CZ Sro Czech 100.00% 93.47% Vesecko 491, 51101 Turnov, Czech Republic N/AHygiëne Medica SAS France 100.00% 93.47% 625 Avenue de la Saladelle, 34130 Saint-Aunes, France N/AOntex France SAS France 100.00% 93.47% 586 Boulevard Albert Camus, 694000 Villefranche-sur-
Saone FranceN/A
Ontex Health Care France SAS France 100.00% 93.47% 18 Rue de Croix, 59290 Wasquehal, France N/AOntex Santé France SAS France 100.00% 93.47% 18 Rue de Croix, 59290 Wasquehal, France N/AOntex Hygiënartikel Deutschland GmbH
Germany 100.00% 93.47% Fabrikstrasse 30, 02692 Grosspostwitz, Germany N/A
Ontex Mayen GmbH Germany 100.00% 93.47% Robert-Bosch-Straße 8, 56727 Mayen, Germany N/AOntex Logistics GmbH Germany 100.00% 93.47% Robert-Bosch-Straße 8, 56727 Mayen, Germany N/AOntex Vertrieb Gmbh & Co. KG Germany 100.00% 93.47% Robert-Bosch-Straße 8, 56727 Mayen, Germany N/AMoltex Baby-Hygiene Beteiligungs GmbH
Germany 100.00% 93.47% Robert-Bosch-Straße 8, 56727 Mayen, Germany N/A
WS Windel-Shop GmbH Germany 100.00% 93.47% Robert-Bosch-Straße 8, 56727 Mayen, Germany N/AOntex Healthcare Deutschland GmbH
Germany 100.00% 93.47% Hansaring 6, Lotte 49504, Germany N/A
79Ontex Annual Review 2014
Financial Statements
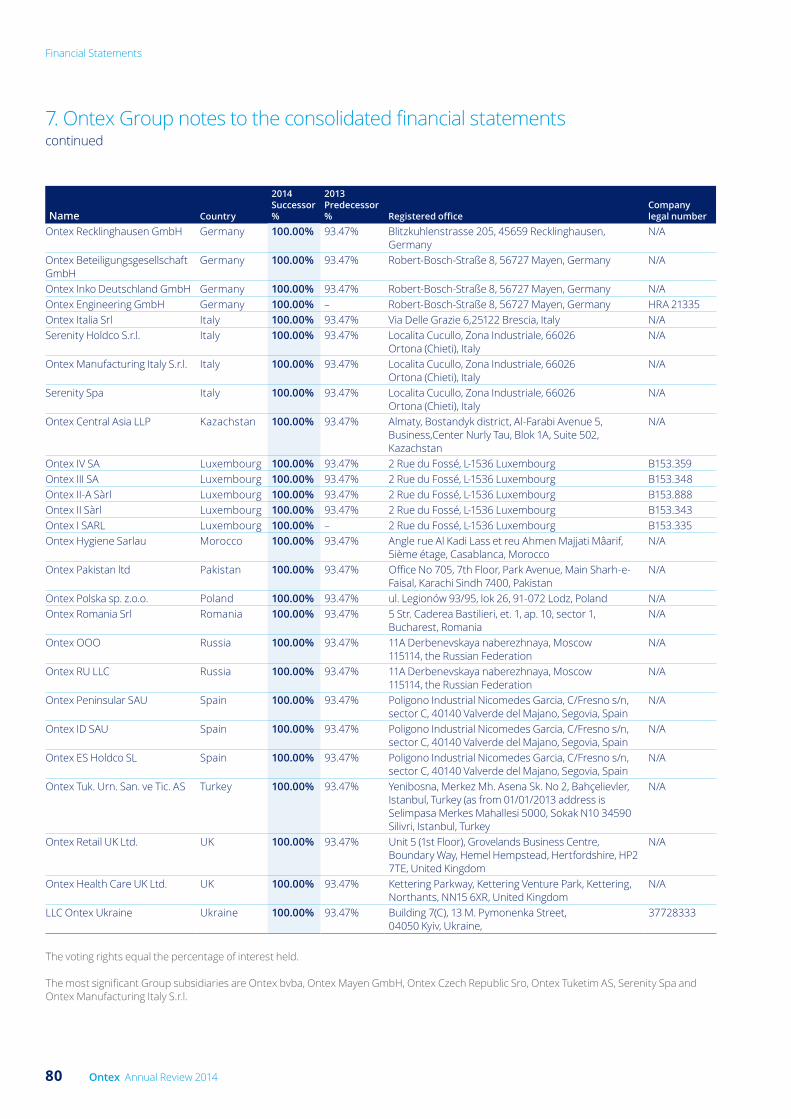
Name Country
2014Successor%
2013Predecessor% Registered office
Company legal number
Ontex Recklinghausen GmbH Germany 100.00% 93.47% Blitzkuhlenstrasse 205, 45659 Recklinghausen, Germany
N/A
Ontex Beteiligungsgesellschaft GmbH
Germany 100.00% 93.47% Robert-Bosch-Straße 8, 56727 Mayen, Germany N/A
Ontex Inko Deutschland GmbH Germany 100.00% 93.47% Robert-Bosch-Straße 8, 56727 Mayen, Germany N/AOntex Engineering GmbH Germany 100.00% – Robert-Bosch-Straße 8, 56727 Mayen, Germany HRA 21335Ontex Italia Srl Italy 100.00% 93.47% Via Delle Grazie 6,25122 Brescia, Italy N/ASerenity Holdco S.r.l. Italy 100.00% 93.47% Localita Cucullo, Zona Industriale, 66026
Ortona (Chieti), ItalyN/A
Ontex Manufacturing Italy S.r.l. Italy 100.00% 93.47% Localita Cucullo, Zona Industriale, 66026 Ortona (Chieti), Italy
N/A
Serenity Spa Italy 100.00% 93.47% Localita Cucullo, Zona Industriale, 66026 Ortona (Chieti), Italy
N/A
Ontex Central Asia LLP Kazachstan 100.00% 93.47% Almaty, Bostandyk district, Al-Farabi Avenue 5, Business,Center Nurly Tau, Blok 1A, Suite 502, Kazachstan
N/A
Ontex IV SA Luxembourg 100.00% 93.47% 2 Rue du Fossé, L-1536 Luxembourg B153.359Ontex III SA Luxembourg 100.00% 93.47% 2 Rue du Fossé, L-1536 Luxembourg B153.348Ontex II-A Sàrl Luxembourg 100.00% 93.47% 2 Rue du Fossé, L-1536 Luxembourg B153.888Ontex II Sàrl Luxembourg 100.00% 93.47% 2 Rue du Fossé, L-1536 Luxembourg B153.343Ontex I SARL Luxembourg 100.00% – 2 Rue du Fossé, L-1536 Luxembourg B153.335Ontex Hygiene Sarlau Morocco 100.00% 93.47% Angle rue Al Kadi Lass et reu Ahmen Majjati Mâarif,
5ième étage, Casablanca, MoroccoN/A
Ontex Pakistan ltd Pakistan 100.00% 93.47% Office No 705, 7th Floor, Park Avenue, Main Sharh-e-Faisal, Karachi Sindh 7400, Pakistan
N/A
Ontex Polska sp. z.o.o. Poland 100.00% 93.47% ul. Legionów 93/95, lok 26, 91-072 Lodz, Poland N/AOntex Romania Srl Romania 100.00% 93.47% 5 Str. Caderea Bastilieri, et. 1, ap. 10, sector 1,
Bucharest, RomaniaN/A
Ontex OOO Russia 100.00% 93.47% 11A Derbenevskaya naberezhnaya, Moscow 115114, the Russian Federation
N/A
Ontex RU LLC Russia 100.00% 93.47% 11A Derbenevskaya naberezhnaya, Moscow 115114, the Russian Federation
N/A
Ontex Peninsular SAU Spain 100.00% 93.47% Poligono Industrial Nicomedes Garcia, C/Fresno s/n, sector C, 40140 Valverde del Majano, Segovia, Spain
N/A
Ontex ID SAU Spain 100.00% 93.47% Poligono Industrial Nicomedes Garcia, C/Fresno s/n, sector C, 40140 Valverde del Majano, Segovia, Spain
N/A
Ontex ES Holdco SL Spain 100.00% 93.47% Poligono Industrial Nicomedes Garcia, C/Fresno s/n, sector C, 40140 Valverde del Majano, Segovia, Spain
N/A
Ontex Tuk. Urn. San. ve Tic. AS Turkey 100.00% 93.47% Yenibosna, Merkez Mh. Asena Sk. No 2, Bahçelievler, Istanbul, Turkey (as from 01/01/2013 address is Selimpasa Merkes Mahallesi 5000, Sokak N10 34590 Silivri, Istanbul, Turkey
N/A
Ontex Retail UK Ltd. UK 100.00% 93.47% Unit 5 (1st Floor), Grovelands Business Centre, Boundary Way, Hemel Hempstead, Hertfordshire, HP2 7TE, United Kingdom
N/A
Ontex Health Care UK Ltd. UK 100.00% 93.47% Kettering Parkway, Kettering Venture Park, Kettering, Northants, NN15 6XR, United Kingdom
N/A
LLC Ontex Ukraine Ukraine 100.00% 93.47% Building 7(C), 13 M. Pymonenka Street, 04050 Kyiv, Ukraine,
37728333
The voting rights equal the percentage of interest held.
The most significant Group subsidiaries are Ontex bvba, Ontex Mayen GmbH, Ontex Czech Republic Sro, Ontex Tuketim AS, Serenity Spa and Ontex Manufacturing Italy S.r.l.
7. Ontex Group notes to the consolidated financial statements continued
80 Ontex Annual Review 2014
Financial Statements
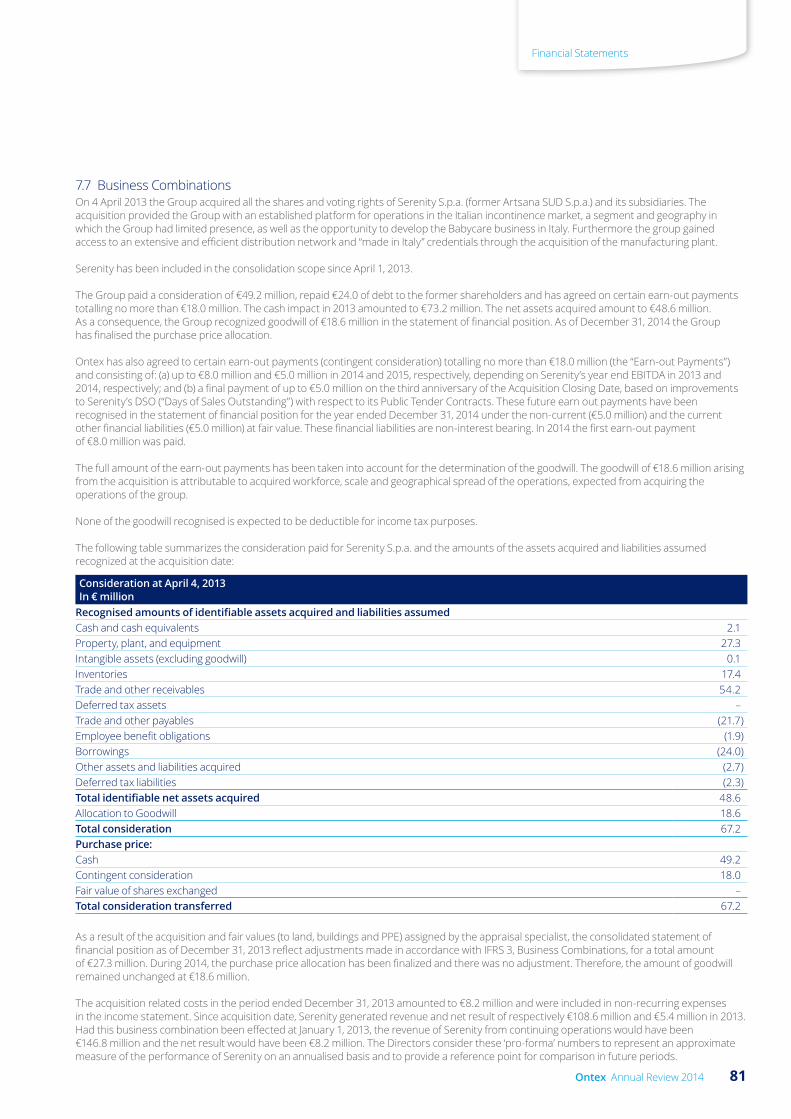
7.7 Business Combinations On 4 April 2013 the Group acquired all the shares and voting rights of Serenity S.p.a. (former Artsana SUD S.p.a.) and its subsidiaries. The acquisition provided the Group with an established platform for operations in the Italian incontinence market, a segment and geography in which the Group had limited presence, as well as the opportunity to develop the Babycare business in Italy. Furthermore the group gained access to an extensive and efficient distribution network and “made in Italy” credentials through the acquisition of the manufacturing plant.
Serenity has been included in the consolidation scope since April 1, 2013.
The Group paid a consideration of €49.2 million, repaid €24.0 of debt to the former shareholders and has agreed on certain earn-out payments totalling no more than €18.0 million. The cash impact in 2013 amounted to €73.2 million. The net assets acquired amount to €48.6 million. As a consequence, the Group recognized goodwill of €18.6 million in the statement of financial position. As of December 31, 2014 the Group has finalised the purchase price allocation.
Ontex has also agreed to certain earn-out payments (contingent consideration) totalling no more than €18.0 million (the “Earn-out Payments”) and consisting of: (a) up to €8.0 million and €5.0 million in 2014 and 2015, respectively, depending on Serenity’s year end EBITDA in 2013 and 2014, respectively; and (b) a final payment of up to €5.0 million on the third anniversary of the Acquisition Closing Date, based on improvements to Serenity’s DSO (“Days of Sales Outstanding”) with respect to its Public Tender Contracts. These future earn out payments have been recognised in the statement of financial position for the year ended December 31, 2014 under the non-current (€5.0 million) and the current other financial liabilities (€5.0 million) at fair value. These financial liabilities are non-interest bearing. In 2014 the first earn-out payment of €8.0 million was paid.
The full amount of the earn-out payments has been taken into account for the determination of the goodwill. The goodwill of €18.6 million arising from the acquisition is attributable to acquired workforce, scale and geographical spread of the operations, expected from acquiring the operations of the group.
None of the goodwill recognised is expected to be deductible for income tax purposes.
The following table summarizes the consideration paid for Serenity S.p.a. and the amounts of the assets acquired and liabilities assumed recognized at the acquisition date:
Consideration at April 4, 2013In € million
Recognised amounts of identifiable assets acquired and liabilities assumed Cash and cash equivalents 2.1 Property, plant, and equipment 27.3 Intangible assets (excluding goodwill) 0.1 Inventories 17.4 Trade and other receivables 54.2 Deferred tax assets – Trade and other payables (21.7)Employee benefit obligations (1.9)Borrowings (24.0)Other assets and liabilities acquired (2.7)Deferred tax liabilities (2.3)Total identifiable net assets acquired 48.6 Allocation to Goodwill 18.6 Total consideration 67.2 Purchase price:Cash 49.2 Contingent consideration 18.0 Fair value of shares exchanged – Total consideration transferred 67.2
As a result of the acquisition and fair values (to land, buildings and PPE) assigned by the appraisal specialist, the consolidated statement of financial position as of December 31, 2013 reflect adjustments made in accordance with IFRS 3, Business Combinations, for a total amount of €27.3 million. During 2014, the purchase price allocation has been finalized and there was no adjustment. Therefore, the amount of goodwill remained unchanged at €18.6 million.
The acquisition related costs in the period ended December 31, 2013 amounted to €8.2 million and were included in non-recurring expenses in the income statement. Since acquisition date, Serenity generated revenue and net result of respectively €108.6 million and €5.4 million in 2013. Had this business combination been effected at January 1, 2013, the revenue of Serenity from continuing operations would have been €146.8 million and the net result would have been €8.2 million. The Directors consider these ‘pro-forma’ numbers to represent an approximate measure of the performance of Serenity on an annualised basis and to provide a reference point for comparison in future periods.
81Ontex Annual Review 2014
Financial Statements
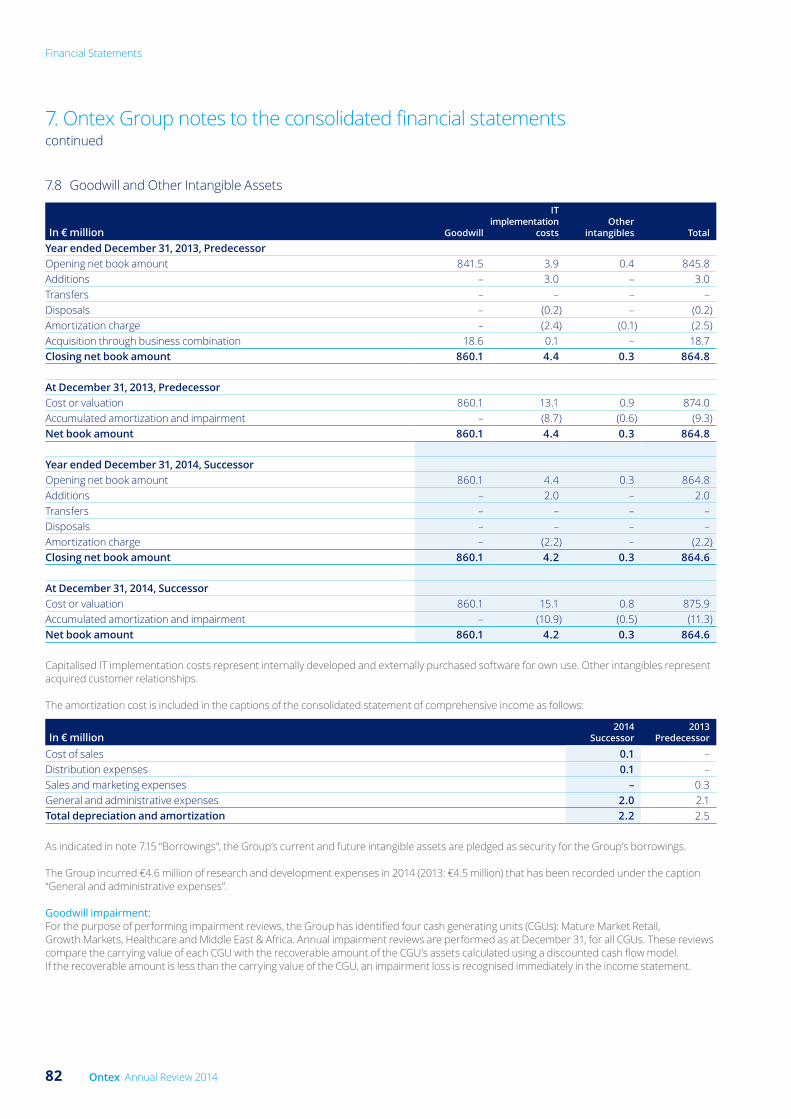
7.8 Goodwill and Other Intangible Assets
In € million Goodwill
IT implementation
costs Other
intangibles Total
Year ended December 31, 2013, PredecessorOpening net book amount 841.5 3.9 0.4 845.8 Additions – 3.0 – 3.0 Transfers – – – – Disposals – (0.2) – (0.2)Amortization charge – (2.4) (0.1) (2.5)Acquisition through business combination 18.6 0.1 – 18.7 Closing net book amount 860.1 4.4 0.3 864.8
At December 31, 2013, PredecessorCost or valuation 860.1 13.1 0.9 874.0 Accumulated amortization and impairment – (8.7) (0.6) (9.3)Net book amount 860.1 4.4 0.3 864.8
Year ended December 31, 2014, SuccessorOpening net book amount 860.1 4.4 0.3 864.8 Additions – 2.0 – 2.0 Transfers – – – – Disposals – – – – Amortization charge – (2.2) – (2.2)Closing net book amount 860.1 4.2 0.3 864.6
At December 31, 2014, SuccessorCost or valuation 860.1 15.1 0.8 875.9 Accumulated amortization and impairment – (10.9) (0.5) (11.3)Net book amount 860.1 4.2 0.3 864.6
Capitalised IT implementation costs represent internally developed and externally purchased software for own use. Other intangibles represent acquired customer relationships.
The amortization cost is included in the captions of the consolidated statement of comprehensive income as follows:
In € million2014
Successor2013
Predecessor
Cost of sales 0.1 – Distribution expenses 0.1 – Sales and marketing expenses – 0.3 General and administrative expenses 2.0 2.1 Total depreciation and amortization 2.2 2.5
As indicated in note 7.15 “Borrowings”, the Group’s current and future intangible assets are pledged as security for the Group’s borrowings.
The Group incurred €4.6 million of research and development expenses in 2014 (2013: €4.5 million) that has been recorded under the caption “General and administrative expenses”.
Goodwill impairment:For the purpose of performing impairment reviews, the Group has identified four cash generating units (CGUs): Mature Market Retail, Growth Markets, Healthcare and Middle East & Africa. Annual impairment reviews are performed as at December 31, for all CGUs. These reviews compare the carrying value of each CGU with the recoverable amount of the CGU’s assets calculated using a discounted cash flow model. If the recoverable amount is less than the carrying value of the CGU, an impairment loss is recognised immediately in the income statement.
7. Ontex Group notes to the consolidated financial statements continued
82 Ontex Annual Review 2014
Financial Statements

Goodwill allocated to the CGUs as at December 31, was as follows:
In € million2014
Successor2013
Predecessor
Mature Market Retail 732.5 757.7 Growth Markets 25.2 – Healthcare 60.4 60.4 Middle East and Africa 42.0 42.0 Goodwill allocated to the CGU's 860.1 860.1
The recoverable amount of a CGU is determined based on value-in-use calculations. These calculations use pre-tax cash flow projections based on financial budgets approved by Ontex’ Board of Directors covering a three-year period. Cash flows beyond the three-year period are extrapolated using an estimated growth rate of 2% for Mature Market Retail and Growth Markets, 1% for Healthcare and 3% for MEA. The growth rate does not exceed the current market expectations in which the four CGUs are currently operating.
The Group has performed a sensitivity analysis by reducing the risk-adjusted cash flow projections and by increasing the pre-tax discount rate as disclosed in note 7.3.2 “Impairment”.
7.9 Property, Plant and Equipment
In € million
Land, land improvements
and buildings
Plant, machinery and
equipmentFurniture
and vehicles
Other tangible
assets
Assets under construction and advance
payments Total
Year ended 31 December 2013, PredecessorOpening net book amount 89.4 134.2 0.6 11.4 31.8 267.4 Additions 1.3 21.0 0.2 0.8 9.7 33.0 Transfers 0.6 21.0 – – (22.4) (0.9)Disposals – (4.0) – – (0.8) (4.8)Depreciation charge (3.9) (25.9) (0.2) (1.3) – (31.3)Exchange differences (1.3) (5.8) (0.1) (0.8) (0.6) (8.8)Other movements – (0.1) – – 0.5 0.4 Addition through business combinations 12.5 14.6 – – 0.2 27.3 Closing net book amount 98.6 154.6 0.6 10.1 18.2 282.0
At December 31, 2013, PredecessorCost 116.0 239.0 1.2 16.5 18.2 390.8 Accumulated depreciation and impairment (17.5) (84.4) (0.6) (6.4) – (108.8)Net book amount 98.6 154.6 0.6 10.1 18.2 282.0
Year ended December 31, 2014, Successor Opening net book amount 98.6 154.6 0.6 10.1 18.2 282.0 Additions 2.0 19.1 0.6 1.1 23.2 46.0 Transfers 0.1 17.7 – – (17.8) – Disposals (1.4) – – 0.2 (0.3) (1.5)Depreciation charge (3.7) (25.1) (0.2) (1.3) – (30.3)Exchange differences (0.5) 0.7 (0.1) 0.2 (0.1) 0.2 Closing net book amount 95.1 167.0 0.9 10.3 23.2 296.5
At December 31, 2014, SuccessorCost 112.0 271.3 1.6 17.4 23.2 425.5 Accumulated depreciation and impairment (16.9) (104.3) (0.7) (7.1) – (129.0)Net book amount 95.1 167.0 0.9 10.3 23.2 296.5
The additions to property, plant and equipment represent mainly investments in capacity extension, investments in innovation, investments to improve the efficiency and IT investments.
83Ontex Annual Review 2014
Financial Statements

The following annual operating lease payments have been included in the income statement for the years ended December 31:
In € million2014
Successor2013
Predecessor
Land and buildings 13.9 18.1 Machinery and equipment 5.2 6.4 Rent of pallets 4.4 4.3 Furniture and vehicles 4.9 4.7 Other lease rentals 1.1 1.2 Total operating lease payments 29.5 34.8
The depreciation charge is included in the captions of the consolidated statement of comprehensive income as follows:
In € million2014
Successor2013
Predecessor
Cost of Sales 26.1 25.1 Distribution expenses 1.2 1.2 Sales and marketing expenses 2.1 2.2 General administrative expenses 0.8 0.5 Other operating income (0.1) – Total depreciation and amortization 30.1 29.0 Non-recurring costs 0.3 2.3 Total depreciation and impairment 30.4 31.3
The Group did not have material finance lease arrangements during the reporting period.
As indicated in note 7.15 “Borrowings”, the Group’s current and future items of property, plant and equipment are pledged as security for the Group’s borrowings.
7.10 Trade Receivables, Prepaid Expenses and Other Receivables
Year ended December 31In € million
2014Successor
2013Predecessor
Trade receivables 207.8 203.0 Less: allowance for impairment of trade receivables (3.5) (4.1)Trade receivables – net 204.3 199.0 Prepayments 11.2 8.7 Other amounts receivable 44.8 28.7 Prepaid expenses and other receivables 55.9 37.4 Trade and other receivables – Current 260.2 236.3
“Other amounts receivable” include recoverable VAT for an amount of €39.6 million for 2014 (2013: 25.2 million). The fair value of the current receivables approximates their carrying amounts.
The aging of the trade receivables (net) at December 31, is as follows:
Year ended December 31, (Net) In € million
2014Successor
2013Predecessor
Not due 168.9 160.1 0 to 30 days 17.9 18.7 31 to 60 days 6.7 8.5 61 to 90 days 3.2 5.4 Over 90 days 7.5 6.3 Total 204.3 199.0
The Group doesn’t apply systematically external credit rating. An impairment analysis of trade receivables is done on an individual level, but there are no individual significant impairments.
7. Ontex Group notes to the consolidated financial statements continued
84 Ontex Annual Review 2014
Financial Statements

The carrying amount of the Group’s trade receivables (gross) are denominated in the following currencies:
Year ended December 31, (Gross)In € million
2014Successor
2013Predecessor
EUR 98.0 98.3 GBP 33.6 40.3 PLN 27.3 24.4 TRY 13.7 12.7 AUD 6.7 6.6 RUB 10.3 8.5 Other 18.2 12.2 Total 207.8 203.0
During the course of the year, the payment terms for the receivables have neither deteriorated nor been renegotiated. The maximum credit risk exposure at the end of the reporting period is the carrying value of each caption of receivables mentioned above. The Group does not hold any collateral as security.
Movements on the Group allowance for impairment of trade receivables are as follows:
Year ended December 31In € million
2014Successor
2013Predecessor
Opening Balance 4.1 7.2 Assets Acquired – 0.1 Allowance for receivable impairment 0.7 0.8 Receivables written off during the year as uncollectible (1.1) (0.3)Unused amounts reversed (0.2) (3.6)Foreign exchange differences – (0.1)At December 31 3.5 4.1
The creation and the release of the allowance for impaired receivables have been included in ‘Sales and marketing expense’ in the income statement.
The Group has entered into a non-recourse factoring agreement in 2008 and this agreement is still in place. This factoring agreement is an off-balance sheet arrangement. The agreement provides a credit facility up to €125 million.
Linked to the acquisition of Serenity in April 2013, the Group also entered into a factoring agreement with Ifitalia and Mediofactoring. In 2014, the Group also entered into a factoring agreement with Banca IFIS. All these agreements are non-recourse agreements.
As indicated in note 7.15 “Borrowings”, the Group’s Trade Receivables are pledged as security for the Group’s borrowings.
7.11 InventoriesInventories can be split as follows:
Year ended December 31In € million
2014Successor
2013Predecessor
Raw materials 80.3 78.3 Work in progress 0.8 1.0 Finished goods 120.8 101.0 Other 9.7 9.9 Write-down on inventories (10.7) (8.0)Inventories 200.9 182.2
The Group mainly uses fluff, super-absorbers and non-woven fabrics. Other raw materials used by the Group for its production include polyethylene, adhesives and tapes as basic raw materials. The finished products are baby diapers, baby pants, towels, tampons, panty liners, wipes, incontinence products and trade goods.
The cost of inventories recognised as an expense and included under ‘Cost of sales’ amounted to €1,169.2 million in 2014 (€1.094.8 million in 2013).
As indicated in note 7.15 “Borrowings”, the Group’s Inventories are pledged as security for the Group’s borrowings.
85Ontex Annual Review 2014
Financial Statements

7.12 Cash and Cash EquivalentsThe net cash position as presented in the consolidated statement of cash flows is as follows:
Year ended December 31In € million
2014Successor
2013Predecessor
Short-term bank deposits (no longer than 3 months) 0.2 2.8 Cash at bank and on hand 35.3 58.6 Total 35.5 61.4
The carrying amount of the cash and cash equivalents is a reasonable approximation of their fair value.
The credit quality of the banks and financial institutions the Group is working with is mentioned in the following table:
Cash at bank and short term bank depositsIn € million
2014Successor
2013Predecessor
AA 12.8 8.6 A 19.4 51.3 BBB 2.5 1.2 BB 0.7 0.2 No credit rating 0.1 0.1 Total 35.5 61.4
As indicated in note 7.15 “Borrowings”, the Group’s Bank Accounts are pledged as security for the Group’s borrowings.
7.13 Share Capital
In € millionNumber
of sharesNumber of CPECs
Ordinary shares
Share Premium CPECs Total
Opening balance at 1 January 2013, Predecessor 421,250,000 41,580,000, 000 4.2 – 415.8 420.0 Capital increase/reduction 1,680,000,000 (1,680,000,000) 16.8 – (16.8) – Other movements – – – – – – Closing balance at 31 December 2013, Predecessor 2,101,250,000 39,900,000,000 21.0 – 399.0 420.0
Elimination of common control transaction (2,101,250,000) (39,900,000,000) (21.0) – (399.0) (420.0)Paid-in capital at establishment 7,000 – 0.1 – – 0.1 Contribution in kind of Ontex I S.à r.l. shares 49,993,000 – 499.9 400.1 – 900.0 Transfer of share premium to capital – – 400.1 (400.1) – – Primary tranche of IPO 18,055,555 – 180.6 144.4 – 325.0 Capital decrease – – (400.0) – – (400.0)Capital excluding IPO expenses 68,055,555 – 680.7 144.4 – 825.1 IPO expenses attributed to primary tranche – – (25.3) – – (25.3)Closing balance at December 31, 2014, Successor 68,055,555 – 655.3 144.4 – 799.7
Transaction costs that are incremental and direct attributable to the issue of new shares as a result of the IPO (€25.3 million) are recognised as a deduction of share capital. The costs allocated to the listing of existing shares are expensed in non-recurring expenses in the income statement (see note 7.22).
Ontex Group NV was incorporated in April 2014 to act as new holding company for the business of Ontex. The previous holding company for Ontex’s operations, Ontex I S.à r.l., was contributed to Ontex Group NV immediately prior to and subject to the close of the IPO of Ontex Group NV in June 2014. As explained in note 7.1.1., the transaction has been accounted for as a common control transaction outside the scope of IFRS 3 ‘Business Combinations’ and thus based on the pooling of interest method. The contribution was valued at the IPO price of €18.0 per share.
7. Ontex Group notes to the consolidated financial statements continued
86 Ontex Annual Review 2014
Financial Statements
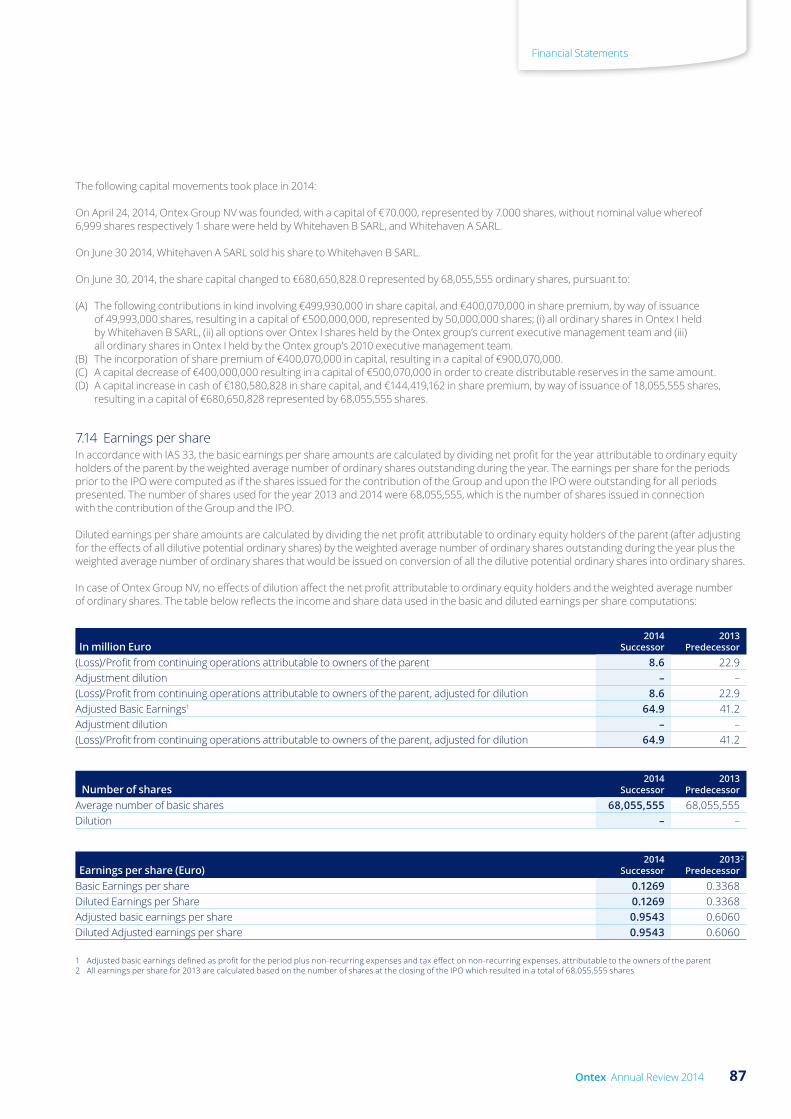
The following capital movements took place in 2014:
On April 24, 2014, Ontex Group NV was founded, with a capital of €70.000, represented by 7.000 shares, without nominal value whereof 6,999 shares respectively 1 share were held by Whitehaven B SARL, and Whitehaven A SARL.
On June 30 2014, Whitehaven A SARL sold his share to Whitehaven B SARL.
On June 30, 2014, the share capital changed to €680,650,828.0 represented by 68,055,555 ordinary shares, pursuant to:
(A) The following contributions in kind involving €499,930,000 in share capital, and €400,070,000 in share premium, by way of issuance of 49,993,000 shares, resulting in a capital of €500,000,000, represented by 50,000,000 shares; (i) all ordinary shares in Ontex I held by Whitehaven B SARL, (ii) all options over Ontex I shares held by the Ontex group’s current executive management team and (iii) all ordinary shares in Ontex I held by the Ontex group’s 2010 executive management team.
(B) The incorporation of share premium of €400,070,000 in capital, resulting in a capital of €900,070,000.(C) A capital decrease of €400,000,000 resulting in a capital of €500,070,000 in order to create distributable reserves in the same amount. (D) A capital increase in cash of €180,580,828 in share capital, and €144,419,162 in share premium, by way of issuance of 18,055,555 shares,
resulting in a capital of €680,650,828 represented by 68,055,555 shares.
7.14 Earnings per shareIn accordance with IAS 33, the basic earnings per share amounts are calculated by dividing net profit for the year attributable to ordinary equity holders of the parent by the weighted average number of ordinary shares outstanding during the year. The earnings per share for the periods prior to the IPO were computed as if the shares issued for the contribution of the Group and upon the IPO were outstanding for all periods presented. The number of shares used for the year 2013 and 2014 were 68,055,555, which is the number of shares issued in connection with the contribution of the Group and the IPO.
Diluted earnings per share amounts are calculated by dividing the net profit attributable to ordinary equity holders of the parent (after adjusting for the effects of all dilutive potential ordinary shares) by the weighted average number of ordinary shares outstanding during the year plus the weighted average number of ordinary shares that would be issued on conversion of all the dilutive potential ordinary shares into ordinary shares.
In case of Ontex Group NV, no effects of dilution affect the net profit attributable to ordinary equity holders and the weighted average number of ordinary shares. The table below reflects the income and share data used in the basic and diluted earnings per share computations:
In million Euro2014
Successor2013
Predecessor
(Loss)/Profit from continuing operations attributable to owners of the parent 8.6 22.9 Adjustment dilution – – (Loss)/Profit from continuing operations attributable to owners of the parent, adjusted for dilution 8.6 22.9 Adjusted Basic Earnings1 64.9 41.2 Adjustment dilution – – (Loss)/Profit from continuing operations attributable to owners of the parent, adjusted for dilution 64.9 41.2
Number of shares2014
Successor2013
Predecessor
Average number of basic shares 68,055,555 68,055,555 Dilution – –
Earnings per share (Euro)2014
Successor2013 2
Predecessor
Basic Earnings per share 0.1269 0.3368 Diluted Earnings per Share 0.1269 0.3368 Adjusted basic earnings per share 0.9543 0.6060 Diluted Adjusted earnings per share 0.9543 0.6060
1 Adjusted basic earnings defined as profit for the period plus non-recurring expenses and tax effect on non-recurring expenses, attributable to the owners of the parent 2 All earnings per share for 2013 are calculated based on the number of shares at the closing of the IPO which resulted in a total of 68,055,555 shares
87Ontex Annual Review 2014
Financial Statements

7.15 Borrowings
Year ended December 31In € million
2014Successor
2013Predecessor
Non-currentBorrowings:
– Senior Secured Notes 2011 > 1 Year – 389.7 – Floating Rate Notes 2011 > 1 Year – 274.8 – Senior Unsecured Notes 2011 > 1 Year – 230.6 – Senior Secured Notes 2014 244.9 – – Facility A Loan 2014 > 1 year 372.3 –
Financial lease & other liabilities 1.0 1.6 Borrowings non-current 618.2 896.7 CurrentInterests:
– Bonds 1.5 13.2 – Facility A Loan 2014 >1 year 0.9 –
Financial lease & other liabilities – 0.7 Borrowings current 2.4 13.9
Total financial liabilities 620.6 910.6
Reconciliation to statement of cash flows
In € million2014
Successor2013
Predecessor
Repaid borrowings (910.0) – Financial lease & other liabilities (1.3) (2.4)Newly contracted borrowings 630.0 77.4 Impact on statement of cash flows (281.3) 75.0
All borrowings are denominated in euro.
As of March 31, 2011 Ontex IV SA had issued high yield bonds replacing a €600.0 million Senior Loan and a €160.0 million Vendor Loan Notes.
After the offering, the high yield bonds consist of €235.0 million 9.00% Senior Notes due 2019, €395.0 million 7.50% Senior Secured Notes due 2018 and €280.0 million Senior Secured Floating Rate Notes due 2018.
On 14 February 14, 2013, Ontex IV SA closed the offering of €75.0 million 7.50% Senior Secured Notes due 2018 for an issue price of 103.25% plus an amount equal to the accrued interest on the Notes from 15 October 2012. The gross proceeds of this successful offering, together with cash on hand, were used to (i) purchase the issued and outstanding capital stock of Serenity and (ii) pay certain fees and expenses associated with the acquisition of Serenity and the offering of the Notes.
On July 16, 2014 Ontex IV S.A. has redeemed all of its outstanding €280.0 million Senior Secured Floating Rate Notes due 2018, plus accrued- and unpaid interest and additional amounts.
On November 14, 2014, Ontex Group NV closed the offering of €250.0 million 4.75% Senior Secured Notes due November 15, 2021 for an issue price of 100%.
On December 3, 2014 a senior facilities agreement, comprised of a euro-denominated Senior Term Loan Facility (Facility A Loan 2014) in an amount of €380.0 million and a euro-denominated Senior Revolving Facility (Facility B Loan 2014) in an amount of up to €100.0 million, and certain hedging obligations, has been closed.
The euro-denominated senior term loan facility in an amount of €380.0 million has an interest rate based on the 3 month EURIBOR plus a starting margin of 275 basis points, which is largely hedged.
Borrowings under the senior term loan facility and the proceeds from the issuance of the Notes were used to redeem in full Ontex’s existing 7.50% senior secured notes due 2018 in an aggregate principal amount of €395.0 million and 9.00% senior unsecured notes due 2019 in an aggregate principal amount of €235.0 million (the “Existing Notes”).
Borrowings under the senior term loan facility and the proceeds from the sale of the Notes are accounted for at amortized cost. Redemption cost of existing borrowings is accounted for in non-recurring expenses in P&L.
7. Ontex Group notes to the consolidated financial statements continued
88 Ontex Annual Review 2014
Financial Statements
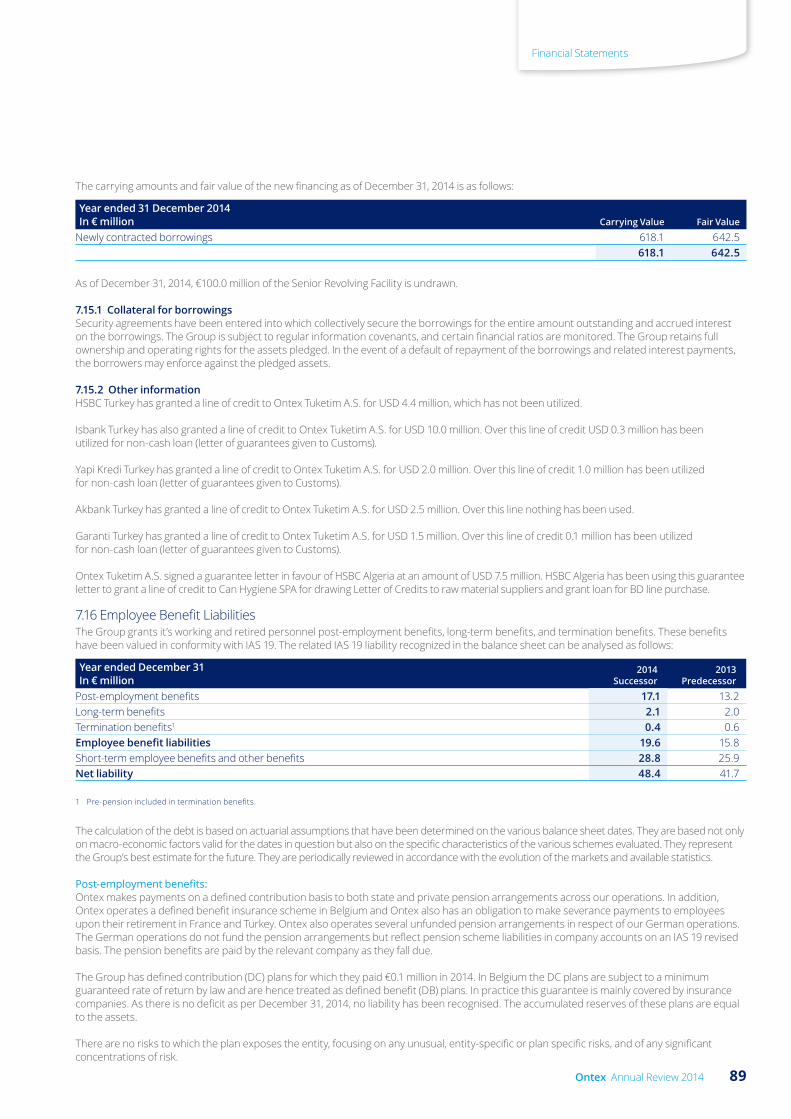
The carrying amounts and fair value of the new financing as of December 31, 2014 is as follows:
Year ended 31 December 2014In € million Carrying Value Fair Value
Newly contracted borrowings 618.1 642.5 618.1 642.5
As of December 31, 2014, €100.0 million of the Senior Revolving Facility is undrawn.
7.15.1 Collateral for borrowings Security agreements have been entered into which collectively secure the borrowings for the entire amount outstanding and accrued interest on the borrowings. The Group is subject to regular information covenants, and certain financial ratios are monitored. The Group retains full ownership and operating rights for the assets pledged. In the event of a default of repayment of the borrowings and related interest payments, the borrowers may enforce against the pledged assets.
7.15.2 Other information HSBC Turkey has granted a line of credit to Ontex Tuketim A.S. for USD 4.4 million, which has not been utilized.
Isbank Turkey has also granted a line of credit to Ontex Tuketim A.S. for USD 10.0 million. Over this line of credit USD 0.3 million has been utilized for non-cash loan (letter of guarantees given to Customs).
Yapi Kredi Turkey has granted a line of credit to Ontex Tuketim A.S. for USD 2.0 million. Over this line of credit 1.0 million has been utilized for non-cash loan (letter of guarantees given to Customs).
Akbank Turkey has granted a line of credit to Ontex Tuketim A.S. for USD 2.5 million. Over this line nothing has been used.
Garanti Turkey has granted a line of credit to Ontex Tuketim A.S. for USD 1.5 million. Over this line of credit 0.1 million has been utilized for non-cash loan (letter of guarantees given to Customs).
Ontex Tuketim A.S. signed a guarantee letter in favour of HSBC Algeria at an amount of USD 7.5 million. HSBC Algeria has been using this guarantee letter to grant a line of credit to Can Hygiene SPA for drawing Letter of Credits to raw material suppliers and grant loan for BD line purchase.
7.16 Employee Benefit Liabilities The Group grants it’s working and retired personnel post-employment benefits, long-term benefits, and termination benefits. These benefits have been valued in conformity with IAS 19. The related IAS 19 liability recognized in the balance sheet can be analysed as follows:
Year ended December 31In € million
2014Successor
2013Predecessor
Post-employment benefits 17.1 13.2 Long-term benefits 2.1 2.0 Termination benefits1 0.4 0.6 Employee benefit liabilities 19.6 15.8 Short-term employee benefits and other benefits 28.8 25.9 Net liability 48.4 41.7
1 Pre-pension included in termination benefits.
The calculation of the debt is based on actuarial assumptions that have been determined on the various balance sheet dates. They are based not only on macro-economic factors valid for the dates in question but also on the specific characteristics of the various schemes evaluated. They represent the Group’s best estimate for the future. They are periodically reviewed in accordance with the evolution of the markets and available statistics.
Post-employmentbenefits:Ontex makes payments on a defined contribution basis to both state and private pension arrangements across our operations. In addition, Ontex operates a defined benefit insurance scheme in Belgium and Ontex also has an obligation to make severance payments to employees upon their retirement in France and Turkey. Ontex also operates several unfunded pension arrangements in respect of our German operations. The German operations do not fund the pension arrangements but reflect pension scheme liabilities in company accounts on an IAS 19 revised basis. The pension benefits are paid by the relevant company as they fall due.
The Group has defined contribution (DC) plans for which they paid €0.1 million in 2014. In Belgium the DC plans are subject to a minimum guaranteed rate of return by law and are hence treated as defined benefit (DB) plans. In practice this guarantee is mainly covered by insurance companies. As there is no deficit as per December 31, 2014, no liability has been recognised. The accumulated reserves of these plans are equal to the assets.
There are no risks to which the plan exposes the entity, focusing on any unusual, entity-specific or plan specific risks, and of any significant concentrations of risk.
89Ontex Annual Review 2014
Financial Statements
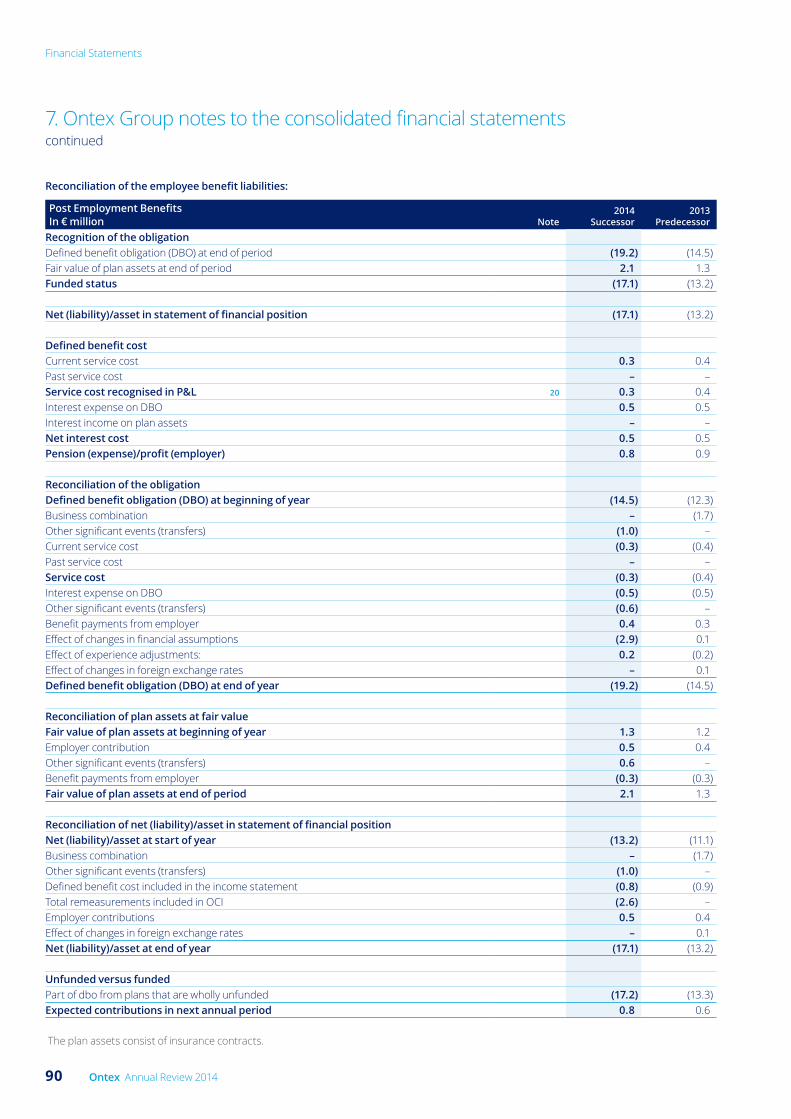
Reconciliation of the employee benefit liabilities:
Post Employment BenefitsIn € million Note
2014Successor
2013Predecessor
Recognition of the obligationDefined benefit obligation (DBO) at end of period (19.2) (14.5)Fair value of plan assets at end of period 2.1 1.3 Funded status (17.1) (13.2) Net (liability)/asset in statement of financial position (17.1) (13.2)
Defined benefit costCurrent service cost 0.3 0.4 Past service cost – – Service cost recognised in P&L 20 0.3 0.4 Interest expense on DBO 0.5 0.5 Interest income on plan assets – – Net interest cost 0.5 0.5 Pension (expense)/profit (employer) 0.8 0.9 Reconciliation of the obligationDefined benefit obligation (DBO) at beginning of year (14.5) (12.3)Business combination – (1.7)Other significant events (transfers) (1.0) – Current service cost (0.3) (0.4)Past service cost – – Service cost (0.3) (0.4)Interest expense on DBO (0.5) (0.5)Other significant events (transfers) (0.6) – Benefit payments from employer 0.4 0.3 Effect of changes in financial assumptions (2.9) 0.1 Effect of experience adjustments: 0.2 (0.2)Effect of changes in foreign exchange rates – 0.1 Defined benefit obligation (DBO) at end of year (19.2) (14.5)
Reconciliation of plan assets at fair valueFair value of plan assets at beginning of year 1.3 1.2 Employer contribution 0.5 0.4 Other significant events (transfers) 0.6 – Benefit payments from employer (0.3) (0.3)Fair value of plan assets at end of period 2.1 1.3
Reconciliation of net (liability)/asset in statement of financial positionNet (liability)/asset at start of year (13.2) (11.1)Business combination – (1.7)Other significant events (transfers) (1.0) – Defined benefit cost included in the income statement (0.8) (0.9)Total remeasurements included in OCI (2.6) – Employer contributions 0.5 0.4 Effect of changes in foreign exchange rates – 0.1 Net (liability)/asset at end of year (17.1) (13.2)
Unfunded versus fundedPart of dbo from plans that are wholly unfunded (17.2) (13.3)Expected contributions in next annual period 0.8 0.6
The plan assets consist of insurance contracts.
7. Ontex Group notes to the consolidated financial statements continued
90 Ontex Annual Review 2014
Financial Statements
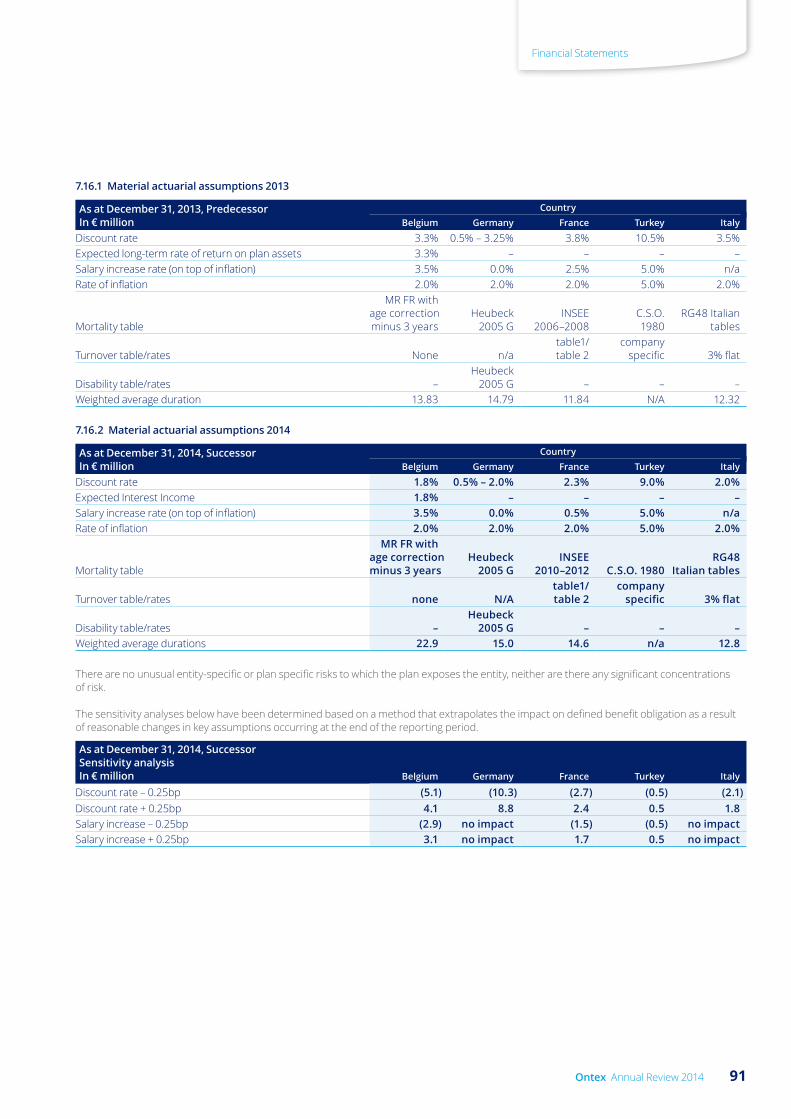
7.16.1 Material actuarial assumptions 2013
As at December 31, 2013, PredecessorIn € million
CountryBelgium Germany France Turkey Italy
Discount rate 3.3% 0.5% – 3.25% 3.8% 10.5% 3.5%Expected long-term rate of return on plan assets 3.3% – – – –Salary increase rate (on top of inflation) 3.5% 0.0% 2.5% 5.0% n/aRate of inflation 2.0% 2.0% 2.0% 5.0% 2.0%
Mortality table
MR FR with age correctionminus 3 years
Heubeck2005 G
INSEE2006–2008
C.S.O. 1980
RG48 Italiantables
Turnover table/rates None n/atable1/ table 2
company specific 3% flat
Disability table/rates –Heubeck
2005 G – – –Weighted average duration 13.83 14.79 11.84 N/A 12.32
7.16.2 Material actuarial assumptions 2014
As at December 31, 2014, SuccessorIn € million
CountryBelgium Germany France Turkey Italy
Discount rate 1.8% 0.5% – 2.0% 2.3% 9.0% 2.0%Expected Interest Income 1.8% – – – –Salary increase rate (on top of inflation) 3.5% 0.0% 0.5% 5.0% n/aRate of inflation 2.0% 2.0% 2.0% 5.0% 2.0%
Mortality table
MR FR with age correction minus 3 years
Heubeck 2005 G
INSEE 2010–2012 C.S.O. 1980
RG48 Italian tables
Turnover table/rates none N/Atable1/table 2
company specific 3% flat
Disability table/rates –Heubeck
2005 G – – –Weighted average durations 22.9 15.0 14.6 n/a 12.8
There are no unusual entity-specific or plan specific risks to which the plan exposes the entity, neither are there any significant concentrations of risk.
The sensitivity analyses below have been determined based on a method that extrapolates the impact on defined benefit obligation as a result of reasonable changes in key assumptions occurring at the end of the reporting period.
As at December 31, 2014, SuccessorSensitivity analysisIn € million Belgium Germany France Turkey Italy
Discount rate – 0.25bp (5.1) (10.3) (2.7) (0.5) (2.1)Discount rate + 0.25bp 4.1 8.8 2.4 0.5 1.8 Salary increase – 0.25bp (2.9) no impact (1.5) (0.5) no impactSalary increase + 0.25bp 3.1 no impact 1.7 0.5 no impact
91Ontex Annual Review 2014
Financial Statements
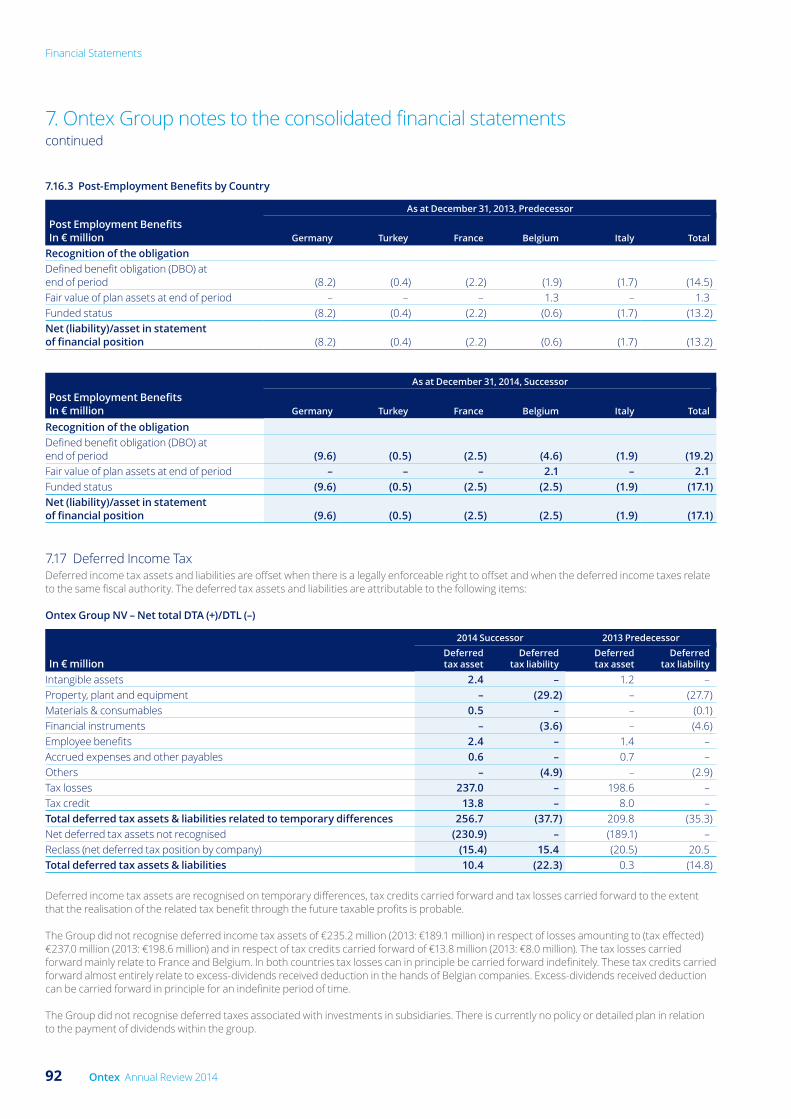
7.16.3 Post-Employment Benefits by Country
As at December 31, 2013, Predecessor
Post Employment BenefitsIn € million Germany Turkey France Belgium Italy Total
Recognition of the obligationDefined benefit obligation (DBO) at end of period (8.2) (0.4) (2.2) (1.9) (1.7) (14.5)Fair value of plan assets at end of period – – – 1.3 – 1.3 Funded status (8.2) (0.4) (2.2) (0.6) (1.7) (13.2)Net (liability)/asset in statement of financial position (8.2) (0.4) (2.2) (0.6) (1.7) (13.2)
As at December 31, 2014, Successor
Post Employment BenefitsIn € million Germany Turkey France Belgium Italy Total
Recognition of the obligationDefined benefit obligation (DBO) at end of period (9.6) (0.5) (2.5) (4.6) (1.9) (19.2)Fair value of plan assets at end of period – – – 2.1 – 2.1 Funded status (9.6) (0.5) (2.5) (2.5) (1.9) (17.1)Net (liability)/asset in statement of financial position (9.6) (0.5) (2.5) (2.5) (1.9) (17.1)
7.17 Deferred Income TaxDeferred income tax assets and liabilities are offset when there is a legally enforceable right to offset and when the deferred income taxes relate to the same fiscal authority. The deferred tax assets and liabilities are attributable to the following items:
Ontex Group NV – Net total DTA (+)/DTL (–)
2014 Successor 2013 Predecessor
In € millionDeferred tax asset
Deferred tax liability
Deferred tax asset
Deferred tax liability
Intangible assets 2.4 – 1.2 – Property, plant and equipment – (29.2) – (27.7)Materials & consumables 0.5 – – (0.1)Financial instruments – (3.6) – (4.6)Employee benefits 2.4 – 1.4 – Accrued expenses and other payables 0.6 – 0.7 – Others – (4.9) – (2.9)Tax losses 237.0 – 198.6 – Tax credit 13.8 – 8.0 – Total deferred tax assets & liabilities related to temporary differences 256.7 (37.7) 209.8 (35.3)Net deferred tax assets not recognised (230.9) – (189.1) – Reclass (net deferred tax position by company) (15.4) 15.4 (20.5) 20.5 Total deferred tax assets & liabilities 10.4 (22.3) 0.3 (14.8)
Deferred income tax assets are recognised on temporary differences, tax credits carried forward and tax losses carried forward to the extent that the realisation of the related tax benefit through the future taxable profits is probable.
The Group did not recognise deferred income tax assets of €235.2 million (2013: €189.1 million) in respect of losses amounting to (tax effected) €237.0 million (2013: €198.6 million) and in respect of tax credits carried forward of €13.8 million (2013: €8.0 million). The tax losses carried forward mainly relate to France and Belgium. In both countries tax losses can in principle be carried forward indefinitely. These tax credits carried forward almost entirely relate to excess-dividends received deduction in the hands of Belgian companies. Excess-dividends received deduction can be carried forward in principle for an indefinite period of time.
The Group did not recognise deferred taxes associated with investments in subsidiaries. There is currently no policy or detailed plan in relation to the payment of dividends within the group.
7. Ontex Group notes to the consolidated financial statements continued
92 Ontex Annual Review 2014
Financial Statements

7.18 Current and Non-current Liabilities Other current liabilities (excluding provisions, income tax liabilities, financial liabilities and liabilities directly associated with non-current assets intended for sale) can be presented as follows:
Year ended December 31In € million
2014Successor
2013Predecessor
Accrued expenses and other payables 22.3 18.2 Less: Non-current portion – (2.3)Current accrued expenses and other payables 22.3 15.9 Trade payables 254.5 240.9 Social liabilities 28.8 25.9 Total current liabilities 305.6 282.7
The aging of the trade payables is as follows:
Year ended December 31In € million
2014Successor
2013Predecessor
Not due 231.7 206.1 0 to 30 days 20.0 30.9 31 to 60 days 0.8 1.7 61 to 90 days 0.1 0.1 Over 90 days 1.9 2.1Total 254.5 240.9
7.19 Provisions – Current Liabilities
In € million Legal claims Restructuring Other Total
Opening Balance 4.2 37.9 0.2 42.3 Additional provisions 0.1 3.7 0.2 4.0 Unused amounts reversed (0.6) (0.1) (0.1) (0.9)Used during the year (1.7) (36.2) – (37.9)Other changes (0.1) – – (0.1)At December 31, 2013, Predecessor 1.9 5.3 0.2 7.4
Opening Balance 1.9 5.3 0.2 7.4 Additional provisions 0.7 2.1 0.8 3.6 Unused amounts reversed (0.5) (0.1) – (0.6)Used during the year (0.1) (3.8) – (3.9)Other changes 0.1 – (0.8) (0.7)At December 31, 2014, Successor 2.1 3.5 0.2 5.8
The Group recognises a provision for certain legal claims brought against the Group by customers, suppliers or former employees. There have been no significant developments in respect of claims compared to prior year end.
The Group had non-current other provisions for the year ended December 31, 2014 for €0.2 million.
93Ontex Annual Review 2014
Financial Statements
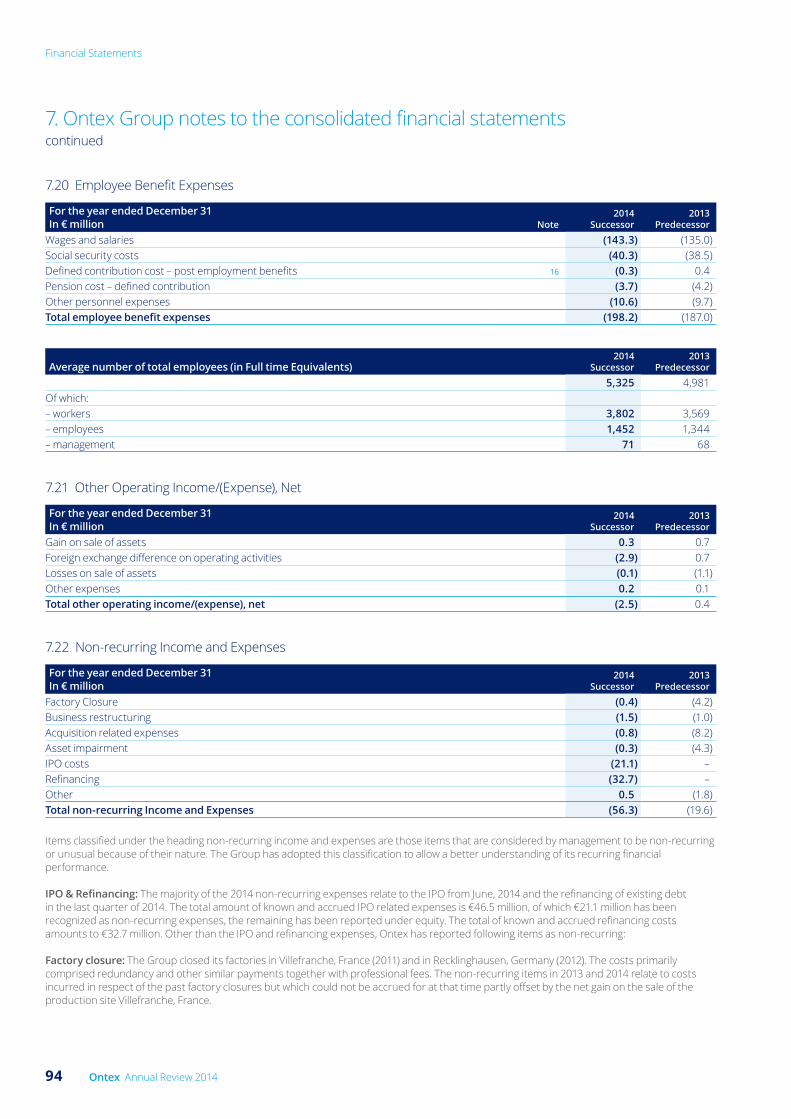
7.20 Employee Benefit Expenses
For the year ended December 31In € million Note
2014Successor
2013Predecessor
Wages and salaries (143.3) (135.0)Social security costs (40.3) (38.5)Defined contribution cost – post employment benefits 16 (0.3) 0.4 Pension cost – defined contribution (3.7) (4.2)Other personnel expenses (10.6) (9.7)Total employee benefit expenses (198.2) (187.0)
Average number of total employees (in Full time Equivalents)2014
Successor2013
Predecessor
5,325 4,981Of which:– workers 3,802 3,569 – employees 1,452 1,344 – management 71 68
7.21 Other Operating Income/(Expense), Net
For the year ended December 31In € million
2014Successor
2013Predecessor
Gain on sale of assets 0.3 0.7 Foreign exchange difference on operating activities (2.9) 0.7 Losses on sale of assets (0.1) (1.1)Other expenses 0.2 0.1 Total other operating income/(expense), net (2.5) 0.4
7.22 Non-recurring Income and Expenses
For the year ended December 31In € million
2014Successor
2013Predecessor
Factory Closure (0.4) (4.2)Business restructuring (1.5) (1.0)Acquisition related expenses (0.8) (8.2)Asset impairment (0.3) (4.3)IPO costs (21.1) – Refinancing (32.7) – Other 0.5 (1.8)Total non-recurring Income and Expenses (56.3) (19.6)
Items classified under the heading non-recurring income and expenses are those items that are considered by management to be non-recurring or unusual because of their nature. The Group has adopted this classification to allow a better understanding of its recurring financial performance.
IPO & Refinancing: The majority of the 2014 non-recurring expenses relate to the IPO from June, 2014 and the refinancing of existing debt in the last quarter of 2014. The total amount of known and accrued IPO related expenses is €46.5 million, of which €21.1 million has been recognized as non-recurring expenses, the remaining has been reported under equity. The total of known and accrued refinancing costs amounts to €32.7 million. Other than the IPO and refinancing expenses, Ontex has reported following items as non-recurring:
Factory closure: The Group closed its factories in Villefranche, France (2011) and in Recklinghausen, Germany (2012). The costs primarily comprised redundancy and other similar payments together with professional fees. The non-recurring items in 2013 and 2014 relate to costs incurred in respect of the past factory closures but which could not be accrued for at that time partly offset by the net gain on the sale of the production site Villefranche, France.
7. Ontex Group notes to the consolidated financial statements continued
94 Ontex Annual Review 2014
Financial Statements
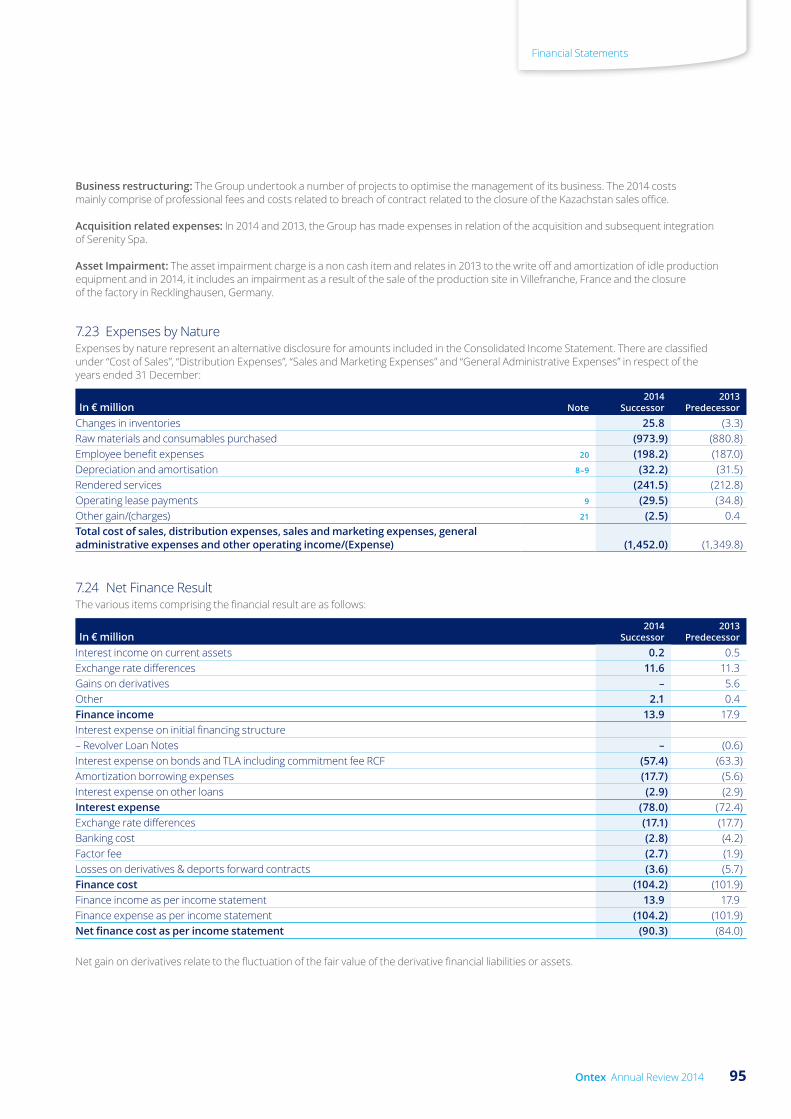
Business restructuring: The Group undertook a number of projects to optimise the management of its business. The 2014 costs mainly comprise of professional fees and costs related to breach of contract related to the closure of the Kazachstan sales office.
Acquisition related expenses: In 2014 and 2013, the Group has made expenses in relation of the acquisition and subsequent integration of Serenity Spa.
Asset Impairment: The asset impairment charge is a non cash item and relates in 2013 to the write off and amortization of idle production equipment and in 2014, it includes an impairment as a result of the sale of the production site in Villefranche, France and the closure of the factory in Recklinghausen, Germany.
7.23 Expenses by Nature Expenses by nature represent an alternative disclosure for amounts included in the Consolidated Income Statement. There are classified under “Cost of Sales”, “Distribution Expenses”, “Sales and Marketing Expenses” and “General Administrative Expenses” in respect of the years ended 31 December:
In € million Note2014
Successor2013
Predecessor
Changes in inventories 25.8 (3.3)Raw materials and consumables purchased (973.9) (880.8)Employee benefit expenses 20 (198.2) (187.0)Depreciation and amortisation 8–9 (32.2) (31.5)Rendered services (241.5) (212.8)Operating lease payments 9 (29.5) (34.8)Other gain/(charges) 21 (2.5) 0.4 Total cost of sales, distribution expenses, sales and marketing expenses, general administrative expenses and other operating income/(Expense) (1,452.0) (1,349.8)
7.24 Net Finance Result The various items comprising the financial result are as follows:
In € million2014
Successor2013
Predecessor
Interest income on current assets 0.2 0.5 Exchange rate differences 11.6 11.3 Gains on derivatives – 5.6 Other 2.1 0.4 Finance income 13.9 17.9 Interest expense on initial financing structure– Revolver Loan Notes – (0.6)Interest expense on bonds and TLA including commitment fee RCF (57.4) (63.3)Amortization borrowing expenses (17.7) (5.6)Interest expense on other loans (2.9) (2.9)Interest expense (78.0) (72.4)Exchange rate differences (17.1) (17.7)Banking cost (2.8) (4.2)Factor fee (2.7) (1.9)Losses on derivatives & deports forward contracts (3.6) (5.7)Finance cost (104.2) (101.9)Finance income as per income statement 13.9 17.9 Finance expense as per income statement (104.2) (101.9)Net finance cost as per income statement (90.3) (84.0)
Net gain on derivatives relate to the fluctuation of the fair value of the derivative financial liabilities or assets.
95Ontex Annual Review 2014
Financial Statements

Reconciliation to Statement of Cash Flows:
In € million2014
Successor2013
Predecessor
Total interest expense (58.4) (65.5)Movement in accrued interest and accreting interest (10.8) 1.2 Interest paid (69.2) (64.3)
In € million2014
Successor2013
Predecessor
Total interest income 0.2 0.5 Interest received 0.2 0.5
7.25 Income Tax Expense The income tax (charged)/credited to the income statement during the year is as follows:
In € million2014
Successor2013
Predecessor
Current tax – (charge)/credit (11.3) (15.0)Deferred tax – (charge)/credit 2.6 1.0 Total tax (charge)/credit (8.7) (14.0)
Ontex Group NV – Income tax (expense)/credit:
In € million2014
Successor2013
Predecessor
Profit before income taxes 17.3 39.9 Income tax (expense)/credit calculated at domestic tax rates (3.5) (12.5)Permanent items 7.6 0.7 Deferred tax movement in consolidation (14.1) (3.1)Other 1.3 0.9 Total income tax (expense)/credit (8.7) (14.0)
7. Ontex Group notes to the consolidated financial statements continued
96 Ontex Annual Review 2014
Financial Statements

7.26 Share Based PaymentsFollowing the IPO, the Company implemented a Long Term Incentive Plan (‘LTIP 2014’), which is based on a combination of stock options (further ‘Options’) and restricted stock units (further ‘RSU’s’). The Options and RSU’s are accounted for as equity settled share based payments. RSU’s can only vest and options giving the right to receive shares of the Company (further ‘Shares’) or any other rights to acquire Shares can only be exercisable as from three years after the grant. The LTIP 2014 award will vest subject to the condition that the participant remains in service. The share price has been considered to be the relevant performance indicator and the vesting of the LTIP 2014 award will not be subject to additional specific performance conditions. The Articles of Association authorize the Company to deviate from such rule, as allowed under the Belgian Companies Code.
The exercise price of the Options will be equal to the last closing rating of the Share immediately preceding the option grant date. For the Options, the exercise period will start on the vesting date.
The Shares underlying the RSU’s will be granted for free as soon as practicable after the vesting date of the RSU’s.
Upon vesting of RSU’s, the Shares underlying the RSU’s are transferred to the participants, while upon vesting, Options may be exercised until their expiry date (8 years from the date of grant).
On or about 26 September 2014 a total of 242,642 stock options and 49,040 RSU’s were granted, no share options or RSU’s have forfeited, expired or have been exercised as of December 31, 2014.
The following share-based payment arrangements were in existence during the current year:
LTIP 2014, Year ended December 31, 2014 (Successor) Expiry DateExercise Price
per share (€)Fair
value (€)# Options/
RSU’s:
Options 2022 17.87 3.57 242,642 RSU’s 2017 N/A 15.97 49,040
The fair market value of the stock options has been determined based on the Black and Sholes model. The expected volatility used in the model is based on the historical volatility of peer companies (as no volatility was available for the Company). Below is an overview of all the parameters used in this model.
Year endedDecember 31,
2014(Successor)
Exercise Price € € 17.87Expected volatility of the shares % 23.58%Expected dividends yield % 2.94%Risk free interest rate % 1.13%
The fair value of the RSU’s has been determined by deducting from the exercise price the expected and discounted dividend flow, based on the same parameters as above.
Social charges related to the LTIP are accrued for over the vesting period.
7.27 ContingenciesThe Group is involved in a number of environmental, contractual, product liability, patent (or intellectual property), employment and other claims and disputes incidental to our business.
The Group currently believes that the disposition of all claims and disputes, individually or in the aggregate, should not have a material adverse effect on our consolidated financial condition, results of operations or liquidity.
97Ontex Annual Review 2014
Financial Statements

7. Ontex Group notes to the consolidated financial statements continued
7.28 Commitments 7.28.1 Capital commitments The Group has contracted expenditures for the acquisition of property, plant and equipment at December 31, 2014 of €15.6 million, 2013: €2.2 million.
7.28.2 Capital commitments resulting from operating lease contracts in which the Group is the lessee The Group has also contracted a number of property leases that can be terminated by respecting the notice period which is different in each jurisdiction.
The Group leases machinery used in the production. The typical lease terms vary depending upon which country the lease agreement is entered into. The majority of lease agreements are renewable at the end of the lease period at market rate.
The lease expenditure charged to the income statement during the respective years is disclosed in note 7.9 “Property, Plant and Equipment”. Commitments in respect of future minimum lease payments that may be claimed under simple non-cancellable leases break down as follows:
In € million2014
Successor2013
Predecessor
Within one year 13.1 13.0 From 1 to 5 years 37.1 28.6 Beyond 5 years 16.3 11.8
66.5 53.4
7.28.3 Bank guarantees As indicated in note 7.15 “Borrowings”, the Group’s main current and future lease assets are pledged as security for these borrowings. The entire amount of the Group’s bank borrowings and accrued interest are secured according to collective pledge agreements.
The Group has given bank guarantees for an amount of €19.9 million in order to participate in public tenders as at December 31, 2014.
7.29 Related Party TransactionsAs part of our business, Ontex has entered into several transactions with related parties, including principal shareholders. The following is a summary of our most significant transactions with related parties for the year ended December 31, 2014.
RevolvingCreditFacility:Goldman Sachs International and Merrill Lynch International, both of which are acting as Underwriters in the Offering, also act as mandated lead arrangers under the Revolving Credit Facility entered into with Ontex IV on March 25, 2011. The Revolving Credit Facility Agreement initially provided for borrowings up to an aggregate of €50.0 million. On August 15, 2012, its terms were amended to provide for borrowings up to an aggregate amount of €75.0 million. The Revolving Credit Facility, initially maturing on March 31, 2017, has been terminated on December 3, 2014, pursuant to the Closing of the Refinancing and the redemption of our Senior Secured and Senior Unsecured Notes on December 3, 2014.
TermLoanAgreement,SeniorNotesIndentureandRevolvingCreditFacility:On November 14, 2014, Ontex issued €250.0 million Senior Secured Notes and agreed on December 3, 2014 upon a Senior Facility Agreement of €380.0 million and a €100.0 million Revolving Credit Facility. Goldman Sachs International Bank, was one of the Mandated Lead Arrangers.
ISDAAgreements:On September 12,2013, Goldman Sachs International entered into an ISDA foreign exchange hedging agreement with Ontex Coordination Center BVBA.
On June 30, 2011, Ontex Coordination Center BVBA entered into an interest rate cap arrangement with Goldman Sachs International to manage a portion of our interest rate risk in respect of the Senior Secured Floating Rate Notes. The interest rate cap arrangement is at a rate of 4.50%, has a notional amount of €150.0 million, and terminates on January 15, 2017.
MonitoringServicesAgreement:On December 2, 2010, Goldman, Sachs & Co. and TPG Capital, L.P. , entered into a monitoring services agreement with Ontex I S.à r.l., Ontex II S.à r.l., Ontex II-A S.à r.l., Ontex III S.A. and the Issuer pursuant to which Goldman, Sachs & Co. and TPG Capital, L.P. perform certain monitoring, advisory and consulting services in relation to the affairs of the Group. The monitoring services agreement provides that in consideration for such services the Group shall collectively pay an annual fee plus out-of-pocket expenses. In addition, incremental fees are payable in connection with services related to acquisitions.
On June 30, 2014, Pursuant to the Closing of the Offering, the Shareholders Agreement and consequently the Monitoring Services Agreement have been terminated, involving an exit fee of €18.0 million, i.e. about 1% of the enterprise value on exit upon listing of the Shares on a securities exchange.
98 Ontex Annual Review 2014
Financial Statements
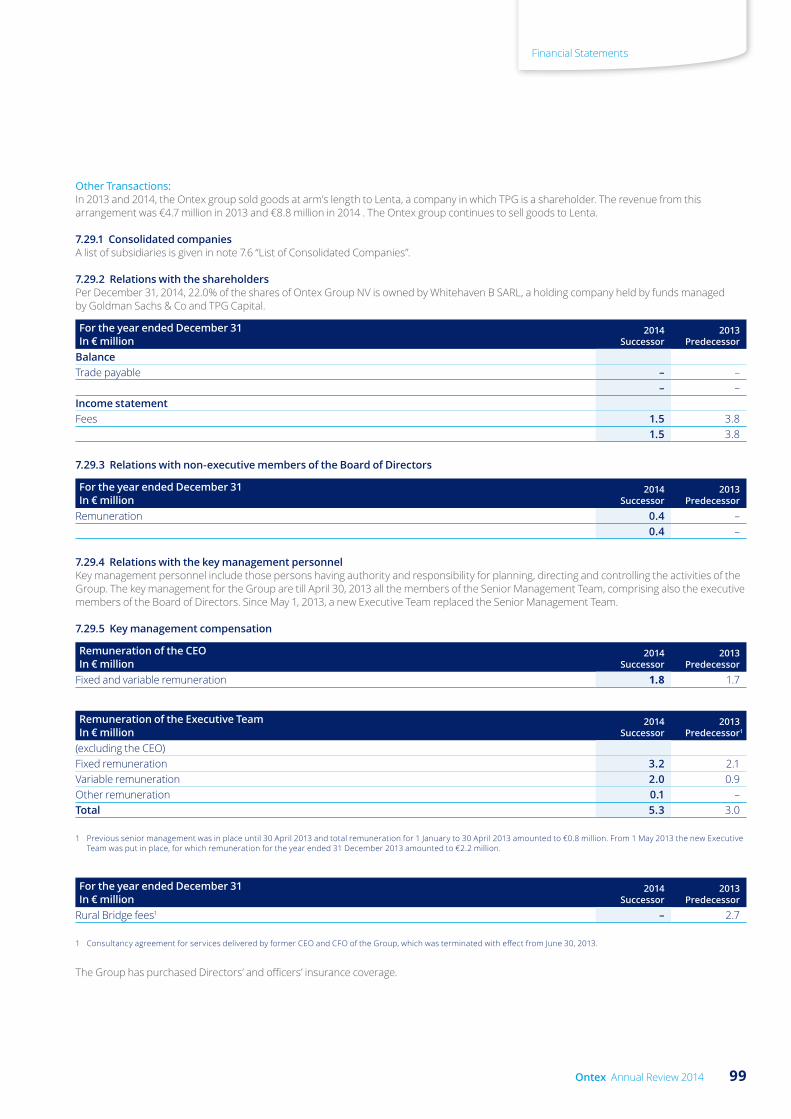
Other Transactions:In 2013 and 2014, the Ontex group sold goods at arm’s length to Lenta, a company in which TPG is a shareholder. The revenue from this arrangement was €4.7 million in 2013 and €8.8 million in 2014 . The Ontex group continues to sell goods to Lenta.
7.29.1 Consolidated companies A list of subsidiaries is given in note 7.6 “List of Consolidated Companies”.
7.29.2 Relations with the shareholders Per December 31, 2014, 22.0% of the shares of Ontex Group NV is owned by Whitehaven B SARL, a holding company held by funds managed by Goldman Sachs & Co and TPG Capital.
For the year ended December 31In € million
2014Successor
2013Predecessor
BalanceTrade payable – –
– – Income statementFees 1.5 3.8 1.5 3.8
7.29.3 Relations with non-executive members of the Board of Directors
For the year ended December 31In € million
2014Successor
2013Predecessor
Remuneration 0.4 – 0.4 –
7.29.4 Relations with the key management personnel Key management personnel include those persons having authority and responsibility for planning, directing and controlling the activities of the Group. The key management for the Group are till April 30, 2013 all the members of the Senior Management Team, comprising also the executive members of the Board of Directors. Since May 1, 2013, a new Executive Team replaced the Senior Management Team.
7.29.5 Key management compensation
Remuneration of the CEO In € million
2014Successor
2013Predecessor
Fixed and variable remuneration 1.8 1.7
Remuneration of the Executive Team In € million
2014Successor
2013Predecessor1
(excluding the CEO)Fixed remuneration 3.2 2.1Variable remuneration 2.0 0.9Other remuneration 0.1 –Total 5.3 3.0
1 Previous senior management was in place until 30 April 2013 and total remuneration for 1 January to 30 April 2013 amounted to €0.8 million. From 1 May 2013 the new Executive Team was put in place, for which remuneration for the year ended 31 December 2013 amounted to €2.2 million.
For the year ended December 31In € million
2014Successor
2013Predecessor
Rural Bridge fees1 – 2.7
1 Consultancy agreement for services delivered by former CEO and CFO of the Group, which was terminated with effect from June 30, 2013.
The Group has purchased Directors’ and officers’ insurance coverage.
99Ontex Annual Review 2014
Financial Statements

7. Ontex Group notes to the consolidated financial statements continued
Sharebasedpaymentplanpre-IPOstructureKey management also participates to a cash settled share-based payment plan. In 2013, at total cost in this respect was recognised for an amount of some €1.2 million, bringing the total liability for the year ended December 31, 2014 to €2.3 million. This liability takes into account the immediate recognition of the liability for persons that render no longer in service with the company. The main drivers behind the ultimate cash to be paid are the value of the Group upon exit and the timing upon such an exit. The plan terminated in June 2014 when Ontex Group NV successfully listed its shares on the Euronext Brussels Exchange.
SharebasedpaymentplansinceIPO(detailsontheplaninnote7.26)Following the IPO, the company implemented a Long Term Incentive Plan (‘LTIP 2014’), which is based on a combination of stock options and restricted stock units (see note 7.26).
The number of stock options and restricted stock units granted to the CEO and the Executive Management Team is summarized below:
For the year ended 31 December 2014In € million
Number of RSU’s
Number of Stock Options
CEO 7,868 38,930 Executive Team (excluding CEO) 21,163 104,720
Per December 2014, Whitehaven B SARL holds 22.0% or 14,941,338 shares of Ontex Group NV, former and current management hold 4.8% or 3,282,395 shares of Ontex Group NV, while 73,2% or 49,831,822 shares is held by the public.
7.30 Events after the end of the reporting period There are no events after the end of the reporting period.
7.31 Audit fees
Year ended December 31, 2014 – in thousands of Euro2014
Successor2013
Predecessor
Audit Fees 1,106 1,073 Additional Services rendered by the auditor's mandate:
Audit related fees1 1,201 284 Tax advisory & compliance services 2,355 1,446 Due diligence fees 34 – Other Services 58 31
Total 4,754 2,834
1 The audit related fees for 2013 mainly relate to work in respect of the re-financing activity, for 2014 they mainly relate to the IPO and re-financing.
A specific exemption on the one-to-one rule was approved by the Audit Committee.
100 Ontex Annual Review 2014
Financial Statements

Summary statutory financial statements
Balance Sheet after appropriation
Year ended December 31In € million 2014
Assets 1,816.2Fixed assets 1,810.0
Financial fixed assets 1,810.0Participating interests 1,180.0Amounts receivable 630.0
Current assets 6.2Amounts receivable within one year 4.4Cash at bank and in hand 0.0Deferred charges and accrued income 1.8Equity and liabilities 1,816.2Equity 1,162.5
Capital 680.7Share premium 144.4Reserves 387.1Accumulated losses (49.7)
Provisions and deferred taxes 2.8Amounts payable 650.9Amounts payable after more than one year 630.0
Financial debt 630.0Amounts payable within one year 18.4
Financial debt 0.9Trade debts 4.5Taxes, remunerations and social security payable 0.1Other amounts payable 12.9
Accruals and deferred income 2.5Income statementOperating income 16.3Operating charges (18.7)Operating loss (2.4)Financial result (0.7)Loss on ordinary activities before taxes (3.1)Extraordinary charges (46.6)Loss for the period (49.7)Transfer from equity (reserves) 12.9Loss to be carried forward (49.7)Profit to be distributed (dividends) 12.9
101Ontex Annual Review 2014
Financial Statements

Extract from Ontex Group NV separate (non-consolidated) financial statements prepared in accordance with Belgian GAAP
The preceding information is extracted from the separate Belgian GAAP financial statements of Ontex Group NV and is included as required by article 105 of the Belgian Company Code. The separate financial statements, together with the annual report of the Board of Directors to the general assembly of shareholders as well as the auditors’ report, will be filed with the National Bank of Belgium within the legally foreseen time limits. These documents are also available on request at Ontex Group NV, Korte Keppestraat 21, 9320 Aalst (Erembodgem).
Note that Ontex Group NV was founded in April 2014; consequently, there is no comparable information for the year 2013, and the financial year 2014 is a shortened financial year which started on April 24, 2014 and ended on December 31, 2014.
The statutory auditor’s report is unqualified and certifies that the non-consolidated financial statements of Ontex Group NV prepared in accordance with Belgian GAAP for the year ended December 31, 2014 give a true and fair view of the financial position and results of Ontex Group NV in accordance with the legal and regulatory dispositions applicable in Belgium.
102 Ontex Annual Review 2014
Financial Statements

Investor Relations and Financial Communications
OverviewIn September 2014, Ontex established a dedicated in-house Investor Relations and Financial Communications department, with responsibility for all communications with the financial community.
Our aim is to provide reliable, consistent information on a timely basis to all financial market participants such as investors and analysts. During 2014 we held investor meetings, including roadshows and conferences, in several locations in Europe. In addition to Europe, going forward we will organize investor meetings in North America and other locations depending on the level of interest.
Shareholder structureFollowing the IPO in June, Whitehaven B S.à r.l., an entity which represents The Goldman Sachs Group, Inc. and certain affiliates of TPG Global, LLC, notified Ontex that on December 8 2014, as a result of the sale of shares, their shareholding was 22.0%. The shareholder structure of the Company as at December 31 2014, based on all transparency declarations received by the Company as at that date, was as follows:
Shareholders (rounded)Number of
shares held Percentage
Whitehaven B S.à r.l. 14,941,338 22.0%Former Ontex management 1,179,111 1.7%Directors 1,139,307 1.7%Other members current management 963,977 1.4%Threadneedle Asset Management Holdings Ltd 2,620,726 3.9%GIC Private Ltd 2,600,783 3.8%Janus Capital Management LLC 2,293,433 3.4%Aviva Investors Global Services Ltd 2,080,783 3.1%AXA Investment Managers SA 2,053,236 3.0%Remaining publicly held 38,182,861 56.1%Total 68,055,555 100.0%
On March 13 2015, the Company received a transparency declaration from The Goldman Sachs Group, Inc. and TPG Group Holdings (SBS) Advisors, Inc., their affiliated entity Whitehaven B S.à r.l., and former/current members of the Executive Management Team of Ontex, acting in concert, stating that on March 10 2015, they crossed the threshold of 3% of the total number of voting rights in the Company downwards as a result of sales of shares.
An actual overview of the shareholdings of Ontex reflecting the most recent transparency declarations received can be consulted on our website http://www.ontexglobal.com/shares.
Share performanceOntex announced the final pricing of its shares on June 24 2014 at a price of €18 per share, with trading of the shares under the symbol “Ontex” on the Euronext Brussels stock exchange commencing on June 25 2014. The closing price on December 31 2014 was €23.72 per share, an increase of 31.8%.
Title: Performance of the Ontex share compared with market indices and hygienic disposable manufacturers:
15
17
19
21
23
25
P&GKimberly ClarkSCABel20Euro Stoxx HPCEuro Stoxx 600Ontex
Dec2014
Nov2014
Oct2014
Sept2014
Aug2014
Juy2014
Jun2014
Analyst coverageOntex was covered by 8 analysts at December 31 2014. 6 of these analysts had a positive1 rating on the Ontex share, while the recommendations of 2 analysts on the Ontex share were neutral.
1 positive indicates buy, accumulate, or overweight depending on the terminology of the broker institution
Financial calendarQuarter 1 2015 May 11, 2015Annual General Meeting of Shareholders May 26, 2015Quarter 2 2015 July 29, 2015Quarter 3 2015 November 5, 2015
Investor contactsPhilip LudwigHead of Investor Relations and Financial Communications+32 53 333 [email protected]
Press contactsGaëlle Vilatte Head of Corporate Communications +32 53 333 708 [email protected]
103Ontex Annual Review 2014
Additional Information

Glossary
Adjusted basic earnings per share: profit for the period plus non-recurring expenses and tax effect on non-recurring expenses, attributable to the owners of the parent, divided by the number of ordinary shares.
Adjusted EBITDA: EBITDA plus non-recurring income and expenses excluding non-recurring depreciation and amortization.
Adjusted Free Cash Flow: Adjusted EBITDA less capital expenditure, change in working capital and cash taxes paid.
Adjusted Net Profit: Net profit excluding non-recurring expenses and non-recurring tax expenses.
Diluted adjusted basic earnings per share: In accordance with IAS 33, diluted adjusted basic earnings per share amounts have to be calculated by dividing adjusted basic earnings (after adjusting for the effects of all dilutive potential ordinary shares) by the weighted average number of ordinary shares outstanding during the year, plus the weighted average number of ordinary shares that would be issued on conversion of all the dilutive potential ordinary shares into ordinary shares.
Leverage: Net financial debt divided by last twelve months Adjusted EBITDA.
Like for like (LFL) revenue: revenue at constant currency excluding change in perimeter or M&A.
Net debt: sum of all short and long-term interest bearing debts and by deducting cash and cash equivalents.
Working capital: the components of our working capital are Inventories plus Trade and other receivables and pre-paid expenses plus Trade and other payables and accrued expenses.
104 Ontex Annual Review 2014
Additional Information

Designed and produced by
Printed by CPI Colour
This Report is printed on material derived from sustainable sources, and printed using vegetable based inks. Both the manufacturing paper mill and printer are registered to the Environmental Management System ISO 14001 and are Forest Stewardship Council® (FSC) chain-of-custody certified. CPI Colour is also a Carbon Neutral Printing Company and reduces its CO2 omissions to net zero in accordance with The CarbonNeutral Protocol. This carbon offsetting supports the Uchindile Mapanda reforestation programme in Tanzania, an environmental project to establish commercial forests at two locations in Africa.
This Report is recyclable and Bio-degradable. If you have finished with this document and no longer wish to retain it, please pass it on to other interested readers or dispose of it in your recycled paper waste.

Korte Keppestraat 21B-9320 AalstErembodegemBelgium
www.ontexglobal.com
Ontex Annual Review
2014