We are Target Corporation. - AnnualReports.com are Target Corporation. Annual Report 1999 ® 4542|...
44
We are Target Corporation. Annual Report 1999 ® |
Transcript of We are Target Corporation. - AnnualReports.com are Target Corporation. Annual Report 1999 ® 4542|...

We are Target Corporat ion.Annual Repor t 1999
®
4542 | Target Corp. — 1999 Annual ReportThis document produced in QuarkXpress® v4.1. Page a Version a
Dayton Dry Goods Companychanges its name to The Dayton Company.
1953
The Dayton Company enters discount merchandising with theopening of its first Target stores.
1967
Dayton Corporation hasits first public offering of common stock.
The Dayton HudsonCorporation
is formed through a merger
of the DaytonCorporation
and theJ.L. Hudson
Company.
1969 1978
DaytonHudsonCorporationacquiresMervyn’s.
J.L. Hudson opensNorthland Centerin Detroit, theworld's largestshopping center at that time.
19541946
1910
Target becomes thecorporation’s top
revenue producer.
The DaytonCompany begins the tradition thatkeeps us strongtoday: 5% of profits go back to the communitieswe serve.
The Dayton Companyadopts a new logo.
George Dayton opens Goodfellows in down-town Minneapolis, the same location as today’sdowntown store. In 1903, the corporate name is changed to the Dayton Dry Goods Company.
1979
1902
1962
4542 | Target Corp. — 1999 Annual ReportThis document produced in QuarkXpress® v4.1. Page b Version a
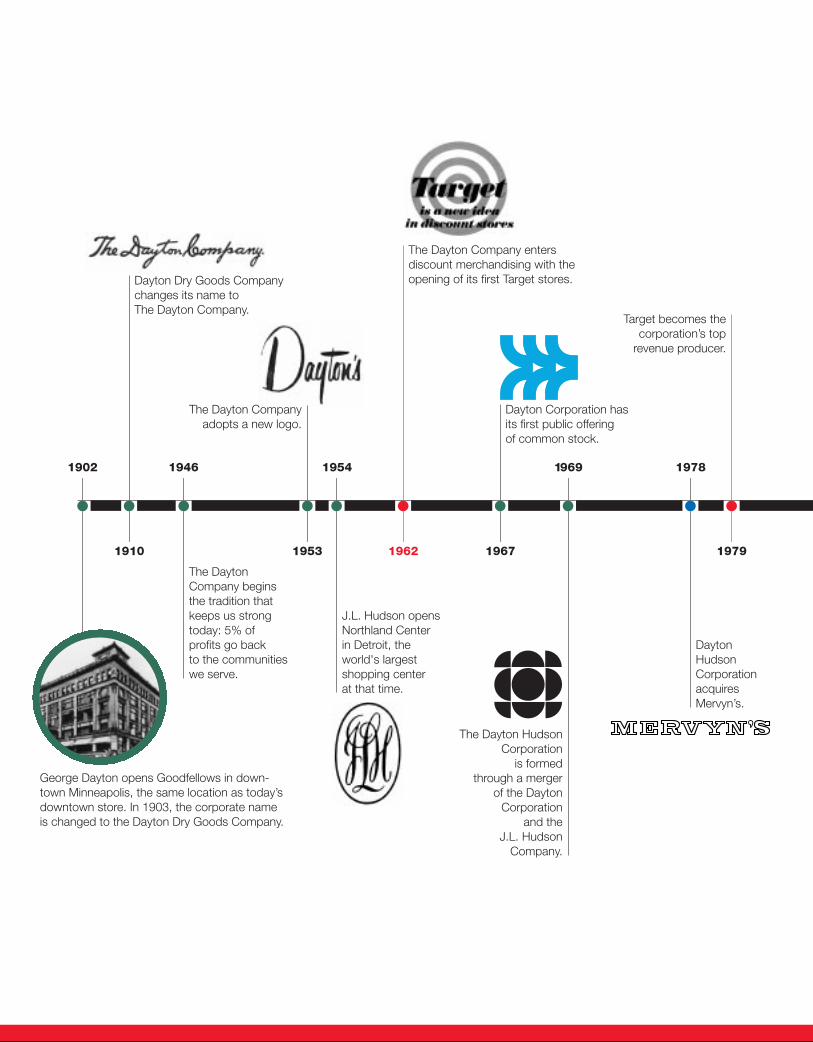
1990
Dayton HudsonCorporation acquiresMarshall Field’s.
Dayton HudsonCorporation celebrates its name change toTarget Corporation.
1995
1999
Dayton’s andHudson’s combineto form DaytonHudson DepartmentStore Company.
Dayton HudsonCorporation acquiresRivertown TradingCompany and The AssociatedMerchandisingCorporation.
Dayton HudsonCorporation launches its
e-commerce capabilitywith new store brand
web sites.
1998 2000
1984
Mervyn’s changesits name to Mervyn’s California.
Target launches the industry’s firstdiscount store creditcard, the TargetGuest Card.
First SuperTargetstores open.
a4542 | Target Corp. — 1999 Annual ReportThis document produced in QuarkXpress® v4.1. Page 1 Version c
TARGETnCORPORATION
Our mission is to be the retailer of choice in
the discount, middle market and department store
retail segments. By focusing on trend leadership, excellent
guest service, exciting team member opportunities, and
community outreach, we create long-term
shareholder value.
4542 | Target Corp. — 1999 Annual ReportThis document produced in QuarkXpress® v4.1. Page 2 Version a
3 Target Corporation
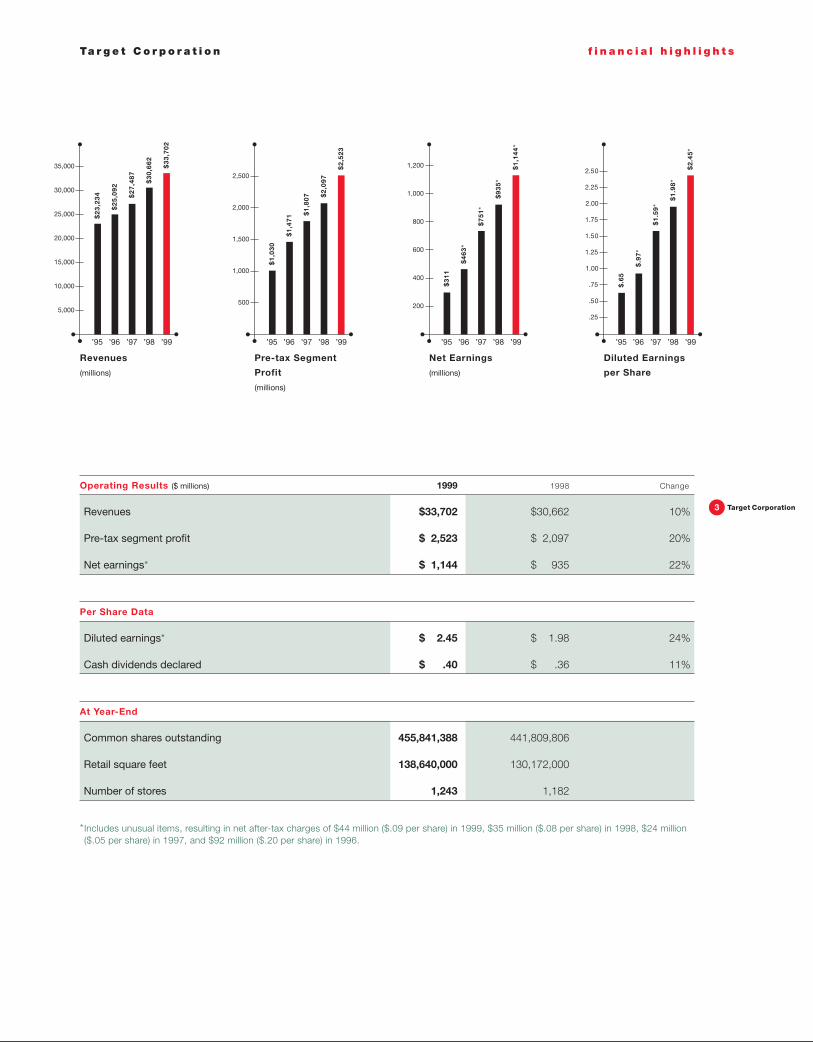
*Includes unusual items, resulting in net after-tax charges of $44 million ($.09 per share) in 1999, $35 million ($.08 per share) in 1998, $24 million($.05 per share) in 1997, and $92 million ($.20 per share) in 1996.
Ta r g e t C o r p o r a t i o n f i n a n c i a l h i g h l i g h t s
Operating Results ($ millions) 1999 1998 Change
Revenues $33,702 $30,662 10%
Pre-tax segment profit $ 2,523 $ 2,097 20%
Net earnings* $ 1,144 $ 935 22%
Per Share Data
Diluted earnings* $ 2.45 $ 1.98 24%
Cash dividends declared $ .40 $ .36 11%
At Year-End
Common shares outstanding 455,841,388 441,809,806
Retail square feet 138,640,000 130,172,000
Number of stores 1,243 1,182
$.6
5
$.9
7*
Diluted Earnings
per Share
’95 ’96 ’97 ’98 ’99
$1
.59
*
$1
.98
*
$2
.45
*
2.50
2.25
2.00
1.75
1.50
1.25
1.00
.75
.50
.25
$2
3,2
34
$2
5,0
92
Revenues
(millions)
’95 ’96 ’97 ’98 ’99
$2
7,4
87
$3
0,6
62
$3
3,7
02
35,000
30,000
25,000
20,000
15,000
10,000
5,000
$3
11
$4
63
*
Net Earnings
(millions)
’95 ’96 ’97 ’98 ’99
$7
51
*
$9
35
*
$1
,14
4*
1,200
1,000
800
600
400
200
$1
,03
0
$1
,47
1
Pre-tax Segment
Profit
(millions)
’95 ’96 ’97 ’98 ’99
$1
,80
7 $2
,09
7
$2
,52
3
2,500
2,000
1,500
1,000
500
4542 | Target Corp. — 1999 Annual ReportThis document produced in QuarkXpress® v4.1. Page 3 Version ea

Acknowledging the strength of the Target brand and the future growth opportunities of our largest retail division, we
recently changed our name to Target Corporation. Our
new name recognizes that the Target division, today,
comprises more than 75 percent of the company’s sales and
profits, and that this contribution will continue to increase over time as
we further expand our store base. Our new name also reflects our continuing
commitment to leverage our resources for the benefit of the total corporation, and as a
result, to improve our overall financial results and create substantial value for our shareholders.
Our performance in 1999 was driven by superior results at our Target division. Revenues for the segment
increased 13 percent to $26 billion and pre-tax profit grew 28 percent to over $2 billion, establishing
a new milestone in Target’s history. In addition, Target’s pre-tax profit as a percent of revenues equaled
the reported profit margin at Wal*Mart’s domestic discount/supercenter division for the year, eliminating
a significant differential that existed in prior years. These outstanding results at Target in 1999, combined
with record sales and profits at our Department Stores, produced our fourth consecutive year of earnings
per share growth in excess of 20 percent.
We are very pleased with our performance in the past year and we are excited about the opportunities
for profitable growth in 2000 and beyond. As we look forward, we remain confident that Target Corporation
can continue to deliver average annual earnings per share growth of 15 percent or more over time.
New Store Growth With less than 1,000 stores in the U.S. today, Target’s opportunities for domes-
tic new store growth remain plentiful. During 1999, Target added a total of 74 new stores, increasing
square footage by 9 percent. We continued to focus our efforts on markets in the Northeast and
Mid-Atlantic, devoting nearly 40 percent of our new store openings to this region.
4Target Corporation
t o o u r s h a r e h o l d e r s
4542 | Target Corp. — 1999 Annual ReportThis document produced in QuarkXpress® v4.1. Page 4 Version c

5 Target Corporation
Importantly, by becoming more flexible in our site selection and store design
without compromising the Target brand, we continue to have success in
penetrating these markets despite difficult real estate challenges. In 1999,
we entered two new markets, Boston and Pittsburgh, and in 2000, we will
enter two new states, Connecticut and West Virginia, bringing the
number of states in which we operate to 46.
Our store expansion in 2000 will also include a significant acceleration of SuperTarget store openings,
reflecting our increased confidence in the sales and profit potential of this concept. We will essentially
double our number of SuperTarget stores during the year, adding 15 new locations, primarily in the Midwest
and South. About half of these stores will be relocations of existing discount stores, giving us the ability to
capture greater market share in key metropolitan areas. With plans for at least 200 SuperTarget locations
within the next ten years, we believe this strategy will generate profitable growth for many years to come.
Other Growth Opportunities At the core of Target’s future growth and financial success is our
differentiated merchandise strategy—with an emphasis on quality and original design, unique product,
impactful presentation and value pricing. During the past year, we strengthened our merchandise assort-
ment with the addition of new brands such as Calphalon, Stiffel, Discovery Channel toys and designs by
Michael Graves and Robert Abbey. In 2000, we will continue to create excitement for our guests with
new initiatives. Examples include an expanded offering of Michael Graves housewares and a new assort-
ment of electronics; the introduction of Martex bed and bath collections; exclusive new lines of sporting
goods equipment and accessories; and the expansion of our Archer Farms brand of premier food.
Each of these efforts reinforces and enhances Target’s brand image in the marketplace and contributes
to our financial strength.
Credit is also an important contributor to our overall earnings growth. During the past five years,
contribution from credit has increased at a compound annual rate of 17 percent, and both return on
investment and EVA have risen sharply. While we continue to invest in credit programs at all three of our
segments, the Target Guest Card is the primary driver of growth for this business. In 2000, we will continue
to increase our card penetration, enhance our guest loyalty programs and leverage our credit operation
to sustain our profitable growth.
4542 | Target Corp. — 1999 Annual ReportThis document produced in QuarkXpress® v4.1. Page 5 Version cc
Bob Ulrich,
Chairman and
Chief Executive Officer

In 1999, Target Corporation devoted greater resources to developing web-based strategies, reflecting
our belief that the Internet and e-commerce are vital to our future. In our view, the Internet provides an
important tool for communicating with our guests as well as a new distribution channel for our
merchandise. Through our new business unit called target.direct, we are focused on leveraging our
strengths as a well-known and trusted retailer to increase guest service and generate profitable sales.
We believe our powerful marketing, our differentiated merchandise and more than 1,200 convenient store
locations give us a competitive advantage in the on-line world. In 2000, we will continue to make the
necessary investments in this business to attract experienced and talented team members, to improve
our technology and fulfillment capability, and to provide our guests with appropriate services and
merchandise selection.
Though our name has changed to reflect the growth and importance of Target, we remain committed to
Dayton’s, Marshall Field’s, Hudson’s and Mervyn’s. During the past five years, Target Corporation has
averaged a total return to shareholders on an annualized basis of 43 percent. During this same period,
both Mervyn’s and our Department Stores were key contributors to our overall strategy and financial per-
formance. In 1999 alone, their combined net pre-tax cash flow again exceeded a half billion dollars. We
believe that these two segments will continue to create value for Target Corporation in the years ahead.
We are excited about the future for Target Corporation and believe that we are well-positioned to build
on our past performance. As we look forward, we remain confident that we will continue to deliver strong
growth in sales and earnings and achieve our objective of generating at least 15 percent average annual
earnings per share growth over time.
March 24, 2000
6Target Corporation
Bob Ulrich, Chairman and Chief Executive Officer
4542 | Target Corp. — 1999 Annual ReportThis document produced in QuarkXpress® v4.1. Page 6 Version c

We are now
Target Corporation, a name that reflects
the powerful recognition of our largest retail brand.
Today, Target Stores makes up more than 75 percent of our
sales and profits, a percentage that will continue to grow as we
open new Target stores across the country. The Target name best
reflects our business and our company, today and in the future.
We remain a company that is committed to growth
and delivering superior returns to our
shareholders.
4542 | Target Corp. — 1999 Annual ReportThis document produced in QuarkXpress® v4.1. Page 7 Version ac

8Target Corporation
Target Corporation’s goal is to deliver average annual earnings per share growth of 15 percent or more over
time. To deliver on that pledge to shareholders
we will continue to grow the Target store base; innovate
to grow sales at existing stores; pursue new retail strategies; and
enhance our credit programs. Our continued success depends on clearly
defined brand strategies at each of our stores, great execution every day for our
guests, a commitment to constant innovation and reinvention, and support of our communities.
New Store Growth Our primary growth comes from new store expansion. Target continues to open stores
in new U.S. markets and increase store density in existing markets, growing retail square footage
by 8 to 10 percent annually. In 2000, Target will open approximately 80 total new stores, includ-
ing 15 new SuperTarget stores, essentially doubling the number of SuperTarget locations
we operated at year end. Target will add locations in two new states—West Virginia and
Connecticut — and expand our presence in key markets like Pittsburgh, Boston and
Dallas/Fort Worth. As Target’s brand becomes stronger, it allows us to add more stores
in existing metropolitan markets. To provide guests with added value and
convenience, all new Target stores and remodels will feature pharmacies,
optical shops, one-hour photo labs and portrait studios. Our newest
stores will feature an updated look with an arched entrance
with more glass for a brighter, more inviting feel. We will also
continue to invest in store remodels to ensure that all
Target stores continue to represent the Target brand.
4542 | Target Corp. — 1999 Annual ReportThis document produced in QuarkXpress® v4.1. Page 8 Version c
Target entered the Boston market in July 1999 with five
stores, under the advertising theme, “the store you’ve
been waiting for.” Northeast and Mid-Atlantic markets are
key areas for Target’s expansion.
Our goal at SuperTarget is
to bring “fashion
to food.”
4542 | Target Corp. — 1999 Annual ReportThis document produced in QuarkXpress® v4.1. Page 9 Version cc
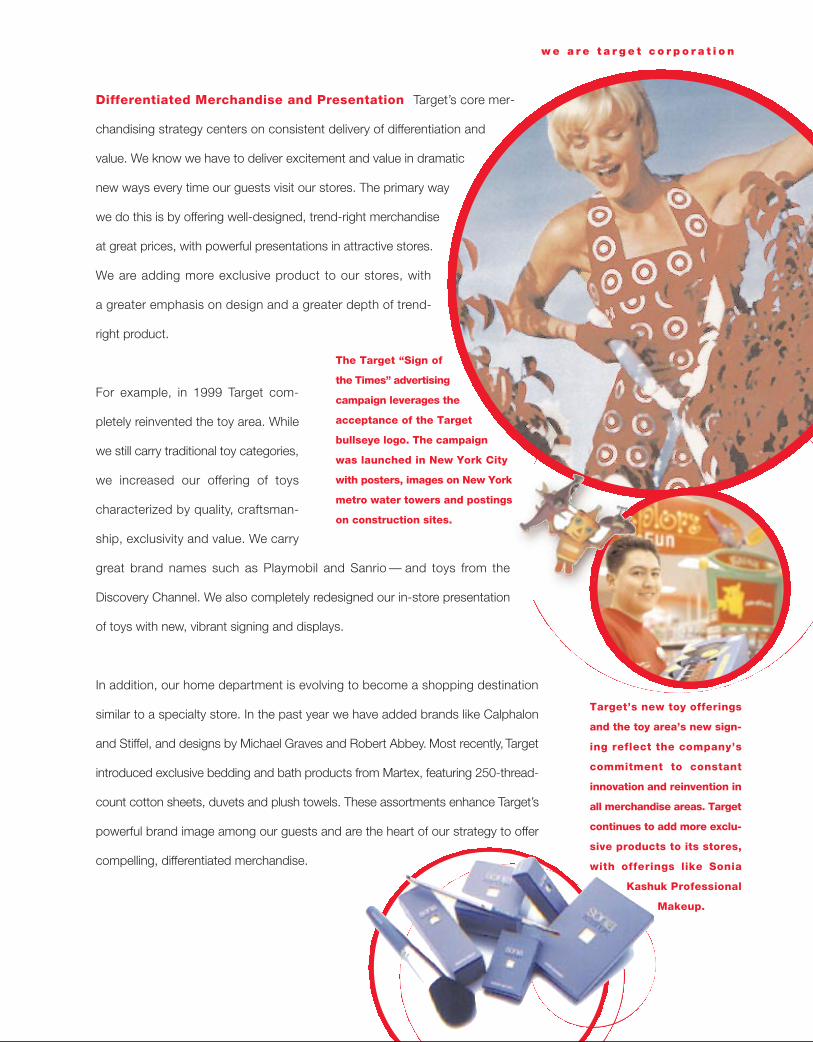
Differentiated Merchandise and Presentation Target’s core mer-
chandising strategy centers on consistent delivery of differentiation and
value. We know we have to deliver excitement and value in dramatic
new ways every time our guests visit our stores. The primary way
we do this is by offering well-designed, trend-right merchandise
at great prices, with powerful presentations in attractive stores.
We are adding more exclusive product to our stores, with
a greater emphasis on design and a greater depth of trend-
right product.
For example, in 1999 Target com-
pletely reinvented the toy area. While
we still carry traditional toy categories,
we increased our offering of toys
characterized by quality, craftsman-
ship, exclusivity and value. We carry
great brand names such as Playmobil and Sanrio — and toys from the
Discovery Channel. We also completely redesigned our in-store presentation
of toys with new, vibrant signing and displays.
In addition, our home department is evolving to become a shopping destination
similar to a specialty store. In the past year we have added brands like Calphalon
and Stiffel, and designs by Michael Graves and Robert Abbey. Most recently, Target
introduced exclusive bedding and bath products from Martex, featuring 250-thread-
count cotton sheets, duvets and plush towels. These assortments enhance Target’s
powerful brand image among our guests and are the heart of our strategy to offer
compelling, differentiated merchandise.
Target’s new toy offerings
and the toy area’s new sign-
ing reflect the company’s
commitment to constant
innovation and reinvention in
all merchandise areas. Target
continues to add more exclu-
sive products to its stores,
with offerings like Sonia
Kashuk Professional
Makeup.
The Target “Sign of
the Times” advertising
campaign leverages the
acceptance of the Target
bullseye logo. The campaign
was launched in New York City
with posters, images on New York
metro water towers and postings
on construction sites.
w e a r e t a r g e t c o r p o r a t i o n
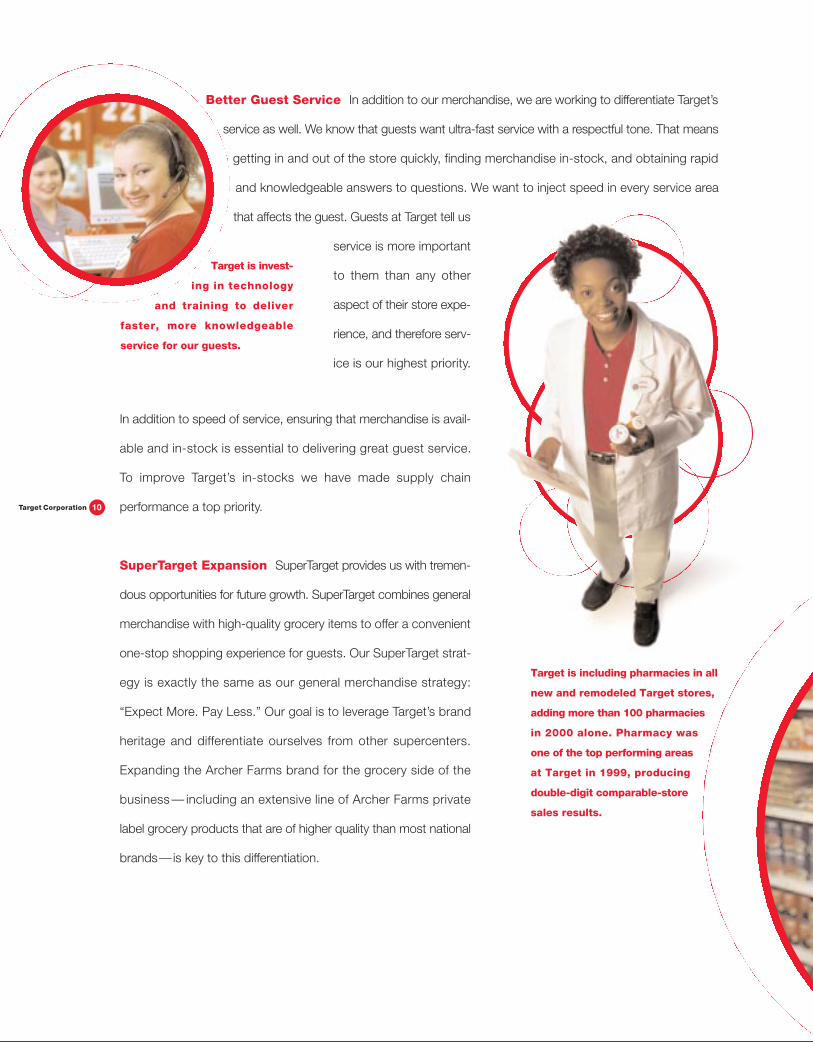
Better Guest Service In addition to our merchandise, we are working to differentiate Target’s
service as well. We know that guests want ultra-fast service with a respectful tone. That means
getting in and out of the store quickly, finding merchandise in-stock, and obtaining rapid
and knowledgeable answers to questions. We want to inject speed in every service area
that affects the guest. Guests at Target tell us
service is more important
to them than any other
aspect of their store expe-
rience, and therefore serv-
ice is our highest priority.
In addition to speed of service, ensuring that merchandise is avail-
able and in-stock is essential to delivering great guest service.
To improve Target’s in-stocks we have made supply chain
performance a top priority.
SuperTarget Expansion SuperTarget provides us with tremen-
dous opportunities for future growth. SuperTarget combines general
merchandise with high-quality grocery items to offer a convenient
one-stop shopping experience for guests. Our SuperTarget strat-
egy is exactly the same as our general merchandise strategy:
“Expect More. Pay Less.” Our goal is to leverage Target’s brand
heritage and differentiate ourselves from other supercenters.
Expanding the Archer Farms brand for the grocery side of the
business — including an extensive line of Archer Farms private
label grocery products that are of higher quality than most national
brands—is key to this differentiation.
10Target Corporation
Target is invest-
ing in technology
and training to deliver
faster, more knowledgeable
service for our guests.
4542 | Target Corp. — 1999 Annual ReportThis document produced in QuarkXpress® v4.1. Page 10 Version c
Target is including pharmacies in all
new and remodeled Target stores,
adding more than 100 pharmacies
in 2000 alone. Pharmacy was
one of the top performing areas
at Target in 1999, producing
double-digit comparable-store
sales results.

SuperTarget offers the best in high-
quality groceries and general
merchandise. We plan to open more
than 200 SuperTarget locations in
the next ten years.
11 Target Corporation
w e a r e t a r g e t c o r p o r a t i o n
is consistent with the Target brand, offering thousands of unique and highly
differentiated items that are also available in Target Stores. In
addition to buying merchandise, guests can apply for a
Target Guest Card, access information on programs
like Take Charge of Education, find out what’s
new in our stores, get a map to a specific
store location, or even apply for a job.
4542 | Target Corp. — 1999 Annual ReportThis document produced in QuarkXpress® v4.1. Page 11 Version cc
In 1999, SuperTarget improved its gross margin performance, the quality of its perishable foods offering and its
expense structure. As a result of these merchandising and operational improvements, we are accelerating the
growth of SuperTarget, adding 15 stores in 2000. In the next ten years, we expect to open at least 200 SuperTarget
stores that will generate $15 billion or more in sales. Relocations of existing Target stores provide significant
opportunity for SuperTarget growth, allowing us to update our store base as it ages, and replace older stores
with our newest and biggest stores. This will help fuel many years of growth for Target.
E-Commerce In early 2000, Target formed a new business unit called target.direct, which is responsible for
the company’s electronic retailing and direct marketing efforts. The Internet and e-commerce are a vital part of
Target Corporation; target.direct will help us leverage the power of all our store brands and catalogs.
We see the Internet not only as a channel for selling merchandise, but as an important communications tool to
reach guests and drive increased guest service. In 1999, we devoted more resources to building the merchan-
dising, marketing, fulfillment and technology processes required to support this new channel. Today we operate
ten websites — eight of which are full-service selling sites. The largest is target.com, an exciting site that
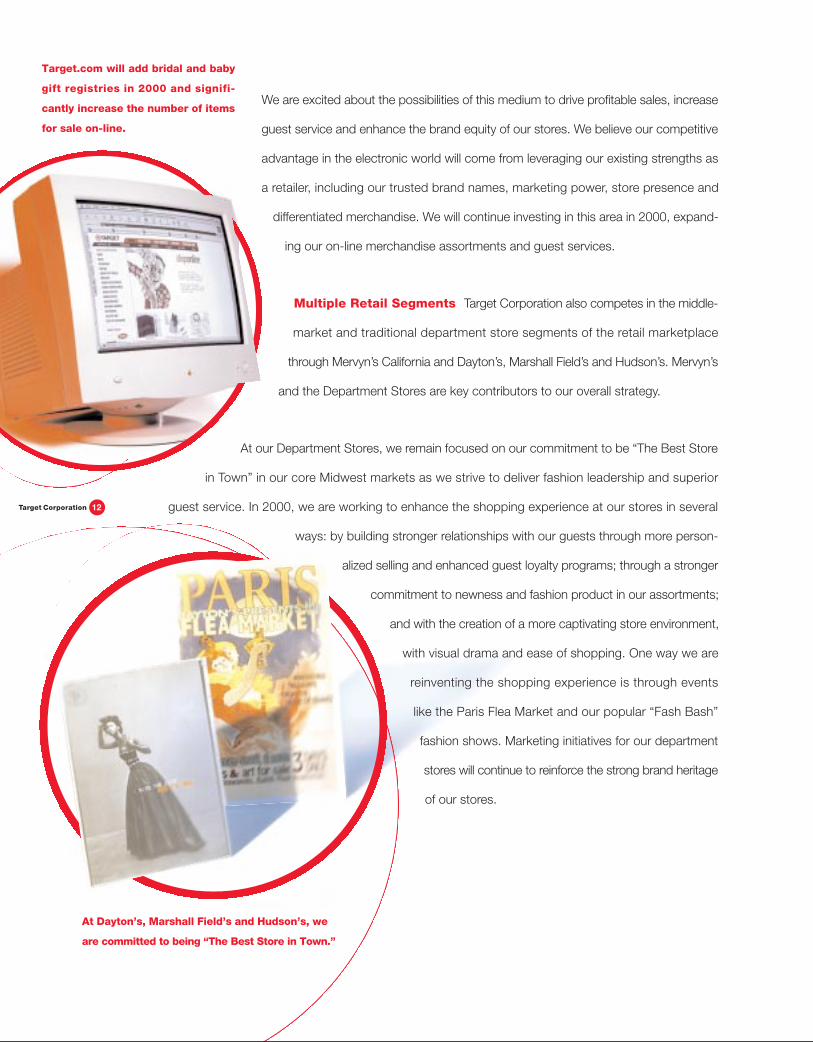
We are excited about the possibilities of this medium to drive profitable sales, increase
guest service and enhance the brand equity of our stores. We believe our competitive
advantage in the electronic world will come from leveraging our existing strengths as
a retailer, including our trusted brand names, marketing power, store presence and
differentiated merchandise. We will continue investing in this area in 2000, expand-
ing our on-line merchandise assortments and guest services.
Multiple Retail Segments Target Corporation also competes in the middle-
market and traditional department store segments of the retail marketplace
through Mervyn’s California and Dayton’s, Marshall Field’s and Hudson’s. Mervyn’s
and the Department Stores are key contributors to our overall strategy.
At our Department Stores, we remain focused on our commitment to be “The Best Store
in Town” in our core Midwest markets as we strive to deliver fashion leadership and superior
guest service. In 2000, we are working to enhance the shopping experience at our stores in several
ways: by building stronger relationships with our guests through more person-
alized selling and enhanced guest loyalty programs; through a stronger
commitment to newness and fashion product in our assortments;
and with the creation of a more captivating store environment,
with visual drama and ease of shopping. One way we are
reinventing the shopping experience is through events
like the Paris Flea Market and our popular “Fash Bash”
fashion shows. Marketing initiatives for our department
stores will continue to reinforce the strong brand heritage
of our stores.
At Dayton’s, Marshall Field’s and Hudson’s, we
are committed to being “The Best Store in Town.”
4542 | Target Corp. — 1999 Annual ReportThis document produced in QuarkXpress® v4.1. Page 12 Version d
12Target Corporation
Target.com will add bridal and baby
gift registries in 2000 and signifi-
cantly increase the number of items
for sale on-line.

13 Target Corporation
At Mervyn’s, we are working to differentiate ourselves in the middle-
market with our national and owned brands. Over the last three
years, Mervyn’s has added more than 125 national and market
brands to the sales floor. In 1999, we made a more concerted
effort to let our guests know about our brands by reinforcing our
“Big Brands. Small Prices.” promise in all of our
marketing vehicles. We also updated our in-store
presentations with more national brand shops
and stronger in-store brand identification. We have
introduced into our assortment more exclusive
merchandise designed by individuals with national
or international reputations, like craft artist Debbie Mumm and Australian painter and designer Ken Done.
We also continue to upgrade and improve the quality and fashion content of our core owned brands, like
Hillard & Hanson. In addition to better merchandise content, in 2000 Mervyn’s will focus on improving in-stocks,
guest service and merchandise presentation.
Credit Programs We offer proprietary credit in each of our business segments. Our credit portfolio is the sec-
ond largest among retailers that issue their own cards and currently includes more than 30 million cards held by
our guests. The growth of the Target Guest Card continues to drive increases in profit contribution from credit.
Guest loyalty programs at each of our stores help us build stronger relationships with our guests and increase
patronage of our stores. At Target, more than 4 million guests are enrolled in our Take Charge of Education
program, where 1 percent of purchases made on the Target Guest Card are donated
to a K-12 school of the guest’s choice. We plan to grow credit’s contribu-
tion to our results in the future by opening new accounts, enhancing
guest loyalty programs and managing the business with financial
discipline.
Mervyn’s
California
offers a strong
assortment of national
brands and high-quality owned
brands for the middle market.
Credit programs contribute to earnings
growth by driving sales at our stores
and through credit’s contribution to
profits. The Target Guest Card is now
carried by more than 15 million Americans.
4542 | Target Corp. — 1999 Annual ReportThis document produced in QuarkXpress® v4.1. Page 13 Version cd

A Community Partner Our commitment to be an active member of the communities where we operate is
also essential to our success. In 1999, we gave more than $67 million to nonprofit organizations across the
country. We support the United Way with a $3 million corporate contribution—and our team members donated
another $9 million to their local United Ways. In 2000, our grantmaking will exceed $80 million.
One of our greatest and most heartfelt contributions is called Target House. Dedicated in May 1999, Target House
is a home-away-from-home for patients and their families undergoing treatment at St. Jude Children’s Research
Hospital in Memphis. Our guests help support Target House and the families it serves whenever they make
pharmacy, and health and beauty product purchases at Target. In March, Target announced its intention to build
a Target House annex, with an additional 44 suites, to serve even more families.
Education is important to our guests and to our com-
pany. Target has donated more than $18 million to
schools across the country since our Take Charge of
Education program began in 1997. More than
100,000 schools across the country participate in the
program.
The Target Foundation was created in early
2000, with a continued emphasis on funding
arts and social action initiatives in
Minnesota. A key focus area for giving is
to support immediate community needs
for food, clothing and shelter. To that end,
the Foundation awarded a $1 million grant
to Sharing & Caring Hands, the Minneapolis
nonprofit organization that serves the needs
of inner city residents.
At Target House, which opened in May 1999, children who are under-
going long-term treatment at St. Jude Children’s Research Hospital
have a home-away-from-home for themselves and their families.
4542 | Target Corp. — 1999 Annual ReportThis document produced in QuarkXpress® v4.1. Page 14 Version c

15 Target Corporation
Mervyn’s award-winning Community Closet pro-
gram toured 15 cities in 10 states in 1999. In
partnership with 82 nonprofit agencies, the
Community Closet clothed 1,000 women
making the transition from welfare to work.
In addition, Mervyn’s helped send
more than 15,000 economically
disadvantaged kids back to
school in new clothes in 1999
through our ChildSpree program.
Peter Max launched a new line of gift
bags, greeting cards and wrapping
paper featuring the artist’s vibrant
designs from the ‘60s to the ‘90s, an
example of our exclusive, trend-right
products.
4542 | Target Corp. — 1999 Annual ReportThis document produced in QuarkXpress® v4.1. Page 15 Version dc
Dayton’s, Marshall Field’s and Hudson’s have always placed a special emphasis on supporting arts and cultural
institutions. The Department Stores’ “Project Imagine” showcases the arts in our communities, putting the pro-
motional power of our stores behind arts organizations to help them achieve new levels of public awareness.
Project Imagine has made possible events ranging from “Free Tuesdays” at Chicago’s Museum of Contemporary
Art to Macbeth at the Minnesota Opera. In recognition of the positive influence of the arts in young people’s lives,
the Project Imagine Scholarship was launched, awarding two scholarships per store to high school seniors.
We continue to look for innovative ways to partner with nonprofit agencies to build stronger communities across
the country.
Target now offers 12 new high-style chairs from a number of designers, including Philippe Starck.
Fresh design and differentiated merchandise are key to Target’s merchandising strategy.
Target and artist
w e a r e t a r g e t c o r p o r a t i o n
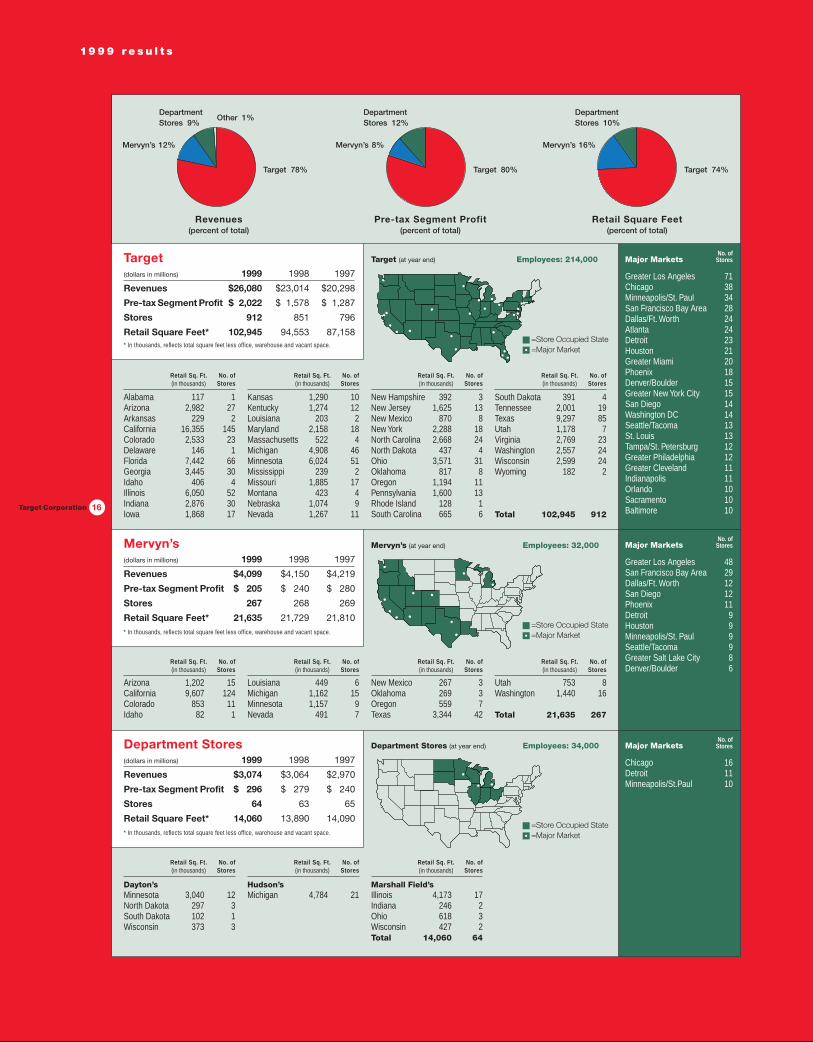
Target(dollars in millions) 1999 1998 1997
Revenues $26,080 $23,014 $20,298
Pre-tax Segment Profit $ 2,022 $ 1,578 $ 1,287
Stores 912 851 796
Retail Square Feet* 102,945 94,553 87,158* In thousands, reflects total square feet less office, warehouse and vacant space.
Target (at year end) Employees: 214,000No. of
Major Markets Stores
Greater Los Angeles 71Chicago 38Minneapolis/St. Paul 34San Francisco Bay Area 28Dallas/Ft. Worth 24Atlanta 24Detroit 23Houston 21Greater Miami 20Phoenix 18Denver/Boulder 15Greater New York City 15San Diego 14Washington DC 14Seattle/Tacoma 13St. Louis 13Tampa/St. Petersburg 12Greater Philadelphia 12Greater Cleveland 11Indianapolis 11Orlando 10Sacramento 10Baltimore 10
No. ofMajor Markets Stores
Greater Los Angeles 48San Francisco Bay Area 29Dallas/Ft. Worth 12San Diego 12Phoenix 11Detroit 9Houston 9Minneapolis/St. Paul 9Seattle/Tacoma 9Greater Salt Lake City 8Denver/Boulder 6
No. ofMajor Markets Stores
Chicago 16Detroit 11Minneapolis/St.Paul 10
=Store Occupied State=Major Market
Retail Sq. Ft. No. of(in thousands) Stores
Retail Sq. Ft. No. of(in thousands) Stores
Retail Sq. Ft. No. of(in thousands) Stores
Retail Sq. Ft. No. of(in thousands) Stores
Mervyn’s(dollars in millions) 1999 1998 1997
Revenues $4,099 $4,150 $4,219
Pre-tax Segment Profit $ 205 $ 240 $ 280
Stores 267 268 269
Retail Square Feet* 21,635 21,729 21,810* In thousands, reflects total square feet less office, warehouse and vacant space.
Department Stores(dollars in millions) 1999 1998 1997
Revenues $3,074 $3,064 $2,970
Pre-tax Segment Profit $ 296 $ 279 $ 240
Stores 64 63 65
Retail Square Feet* 14,060 13,890 14,090* In thousands, reflects total square feet less office, warehouse and vacant space.
Mervyn’s (at year end) Employees: 32,000
=Store Occupied State=Major Market
Department Stores (at year end) Employees: 34,000
=Store Occupied State=Major Market
Retail Sq. Ft. No. of(in thousands) Stores
Retail Sq. Ft. No. of(in thousands) Stores
Retail Sq. Ft. No. of(in thousands) Stores
Alabama 117 1Arizona 2,982 27Arkansas 229 2California 16,355 145Colorado 2,533 23Delaware 146 1Florida 7,442 66Georgia 3,445 30Idaho 406 4Illinois 6,050 52Indiana 2,876 30Iowa 1,868 17
Kansas 1,290 10Kentucky 1,274 12Louisiana 203 2Maryland 2,158 18Massachusetts 522 4Michigan 4,908 46Minnesota 6,024 51Mississippi 239 2Missouri 1,885 17Montana 423 4Nebraska 1,074 9Nevada 1,267 11
New Hampshire 392 3New Jersey 1,625 13New Mexico 870 8New York 2,288 18North Carolina 2,668 24North Dakota 437 4Ohio 3,571 31Oklahoma 817 8Oregon 1,194 11Pennsylvania 1,600 13Rhode Island 128 1South Carolina 665 6
South Dakota 391 4Tennessee 2,001 19Texas 9,297 85Utah 1,178 7Virginia 2,769 23Washington 2,557 24Wisconsin 2,599 24Wyoming 182 2
Total 102,945 912
Arizona 1,202 15California 9,607 124Colorado 853 11Idaho 82 1
Louisiana 449 6Michigan 1,162 15Minnesota 1,157 9Nevada 491 7
New Mexico 267 3Oklahoma 269 3Oregon 559 7Texas 3,344 42
Utah 753 8Washington 1,440 16
Total 21,635 267
Dayton’sMinnesota 3,040 12North Dakota 297 3South Dakota 102 1Wisconsin 373 3
Hudson’sMichigan 4,784 21
Marshall Field’sIllinois 4,173 17Indiana 246 2Ohio 618 3Wisconsin 427 2Total 14,060 64
19 9 9 r e s u l t s
Retail Sq. Ft. No. of(in thousands) Stores
Retail Sq. Ft. No. of(in thousands) Stores
Retail Sq. Ft. No. of(in thousands) Stores
Retail Sq. Ft. No. of(in thousands) Stores
16Target Corporation
Revenues(percent of total)
Pre-tax Segment Profit(percent of total)
Retail Square Feet(percent of total)
Target 78%
Mervyn’s 12%
DepartmentStores 9%
Other 1%
Target 80%
Mervyn’s 8%
DepartmentStores 12%
Target 74%
Mervyn’s 16%
DepartmentStores 10%
4542 | Target Corp. — 1999 Annual ReportThis document produced in QuarkXpress® v4.1. Page 16 Version a
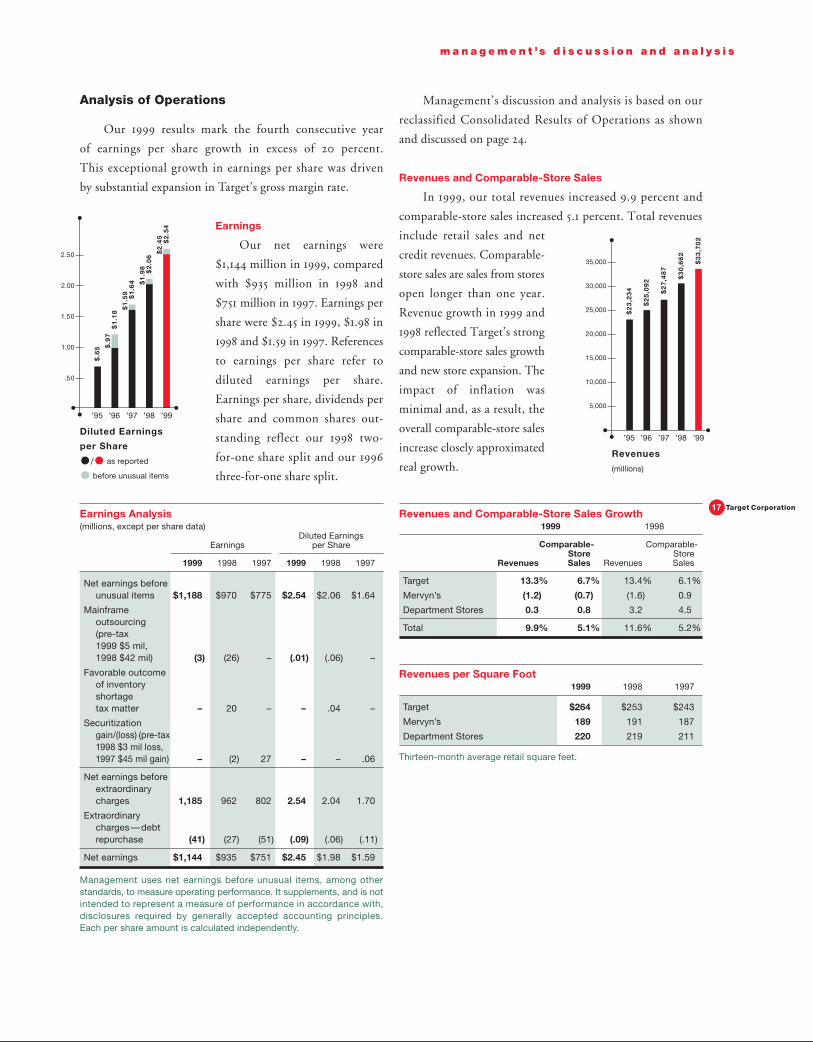
Analysis of Operations
Our 1999 results mark the fourth consecutive year
of earnings per share growth in excess of 20 percent.
This exceptional growth in earnings per share was driven
by substantial expansion in Target’s gross margin rate.
Earnings
Our net earnings were
$1,144 million in 1999, compared
with $935 million in 1998 and
$751 million in 1997. Earnings per
share were $2.45 in 1999, $1.98 in
1998 and $1.59 in 1997. References
to earnings per share refer to
diluted earnings per share.
Earnings per share, dividends per
share and common shares out-
standing reflect our 1998 two-
for-one share split and our 1996
three-for-one share split.
Earnings Analysis(millions, except per share data)
Diluted EarningsEarnings per Share
1999 1998 1997 1999 1998 1997
Net earnings beforeunusual items $1,188 $970 $775 $2.54 $2.06 $1.64
Mainframeoutsourcing(pre-tax 1999 $5 mil,1998 $42 mil) (3) (26) – (.01) (.06) –
Favorable outcomeof inventoryshortagetax matter – 20 – – .04 –
Securitizationgain/(loss) (pre-tax1998 $3 mil loss,1997 $45 mil gain) – (2) 27 – – .06
Net earnings beforeextraordinarycharges 1,185 962 802 2.54 2.04 1.70
Extraordinarycharges—debtrepurchase (41) (27) (51) (.09) (.06) (.11)
Net earnings $1,144 $935 $751 $2.45 $1.98 $1.59
Management uses net earnings before unusual items, among otherstandards, to measure operating performance. It supplements, and is notintended to represent a measure of performance in accordance with,disclosures required by generally accepted accounting principles. Each per share amount is calculated independently.
Management’s discussion and analysis is based on our
reclassified Consolidated Results of Operations as shown
and discussed on page 24.
Revenues and Comparable-Store Sales
In 1999, our total revenues increased 9.9 percent and
comparable-store sales increased 5.1 percent. Total revenues
include retail sales and net
credit revenues. Comparable-
store sales are sales from stores
open longer than one year.
Revenue growth in 1999 and
1998 reflected Target’s strong
comparable-store sales growth
and new store expansion. The
impact of inflation was
minimal and, as a result, the
overall comparable-store sales
increase closely approximated
real growth.
Revenues and Comparable-Store Sales Growth1999 1998
Comparable- Comparable-Store Store
Revenues Sales Revenues Sales
Target 13.3% 6.7% 13.4% 6.1%
Mervyn’s (1.2) (0.7) (1.6) 0.9
Department Stores 0.3 0.8 3.2 4.5
Total 9.9% 5.1% 11.6% 5.2%
Revenues per Square Foot1999 1998 1997
Target $264 $253 $243
Mervyn’s 189 191 187
Department Stores 220 219 211
Thirteen-month average retail square feet.
m a n a g e m e n t ’s d i s c u s s i o n a n d a n a l y s i s
$.6
5
$1
.18
$.9
7
Diluted Earnings
per Share
/ as reported
before unusual items
’95 ’96 ’97 ’98 ’99
$1
.64
$1
.59
$2
.06
$1
.98
$2
.54
$2
.45
2.50
2.00
1.50
1.00
.50
$2
3,2
34
$2
5,0
92
Revenues
(millions)
’95 ’96 ’97 ’98 ’99
$2
7,4
87
$3
0,6
62
$3
3,7
02
35,000
30,000
25,000
20,000
15,000
10,000
5,000
17 Target Corporation

Gross Margin Rate
The gross margin rate represents gross margin as a percent
of sales. In 1999, our gross margin rate increased primarily due
to rate expansion at Target and the Department Stores,
resulting from improved markup and markdowns at Target
and improved markup at the Department Stores. This increase
was partially offset by the mix impact of strong growth at
Target, our lowest gross margin rate division. In 1998, our
overall gross margin rate increased modestly from the prior
year, primarily due to lower markdowns at Target.
The LIFO provision, included in cost of sales, is
calculated based on inventory levels, markup rates and
internally generated retail price indices. In 1999, the LIFO
provision was a $7 million credit ($.01 per share), compared
with an $18 million credit ($.02 per share) in 1998 and a
$6 million charge ($.01 per share) in 1997. The 1999 LIFO
credit resulted primarily from higher markup. The 1998 LIFO
credit resulted primarily from higher markup and higher
inventory levels.
Operating Expense Rate
Operating expense rate represents selling, general and
administrative expense (including buying and occupancy,
advertising, start-up and other expense) as a percent of
revenues. Our operating expense rate was essentially even with
the prior year, benefiting from the overall growth of Target,
our lowest expense rate division, and lower bad debt expense.
These factors were offset by the lack of sales leverage in 1999
at Mervyn’s and the Department Stores. The operating expense
rate in 1998 was essentially even with 1997.
Pre-tax Segment Profit
Pre-tax segment profit increased
20 percent in 1999 to $2,523 million,
compared with $2,097 million in
1998 and $1,807 million in 1997. Pre-
tax segment profit is earnings before
LIFO, securitization effects, interest,
other expense and unusual items.
Target provided substantially all of
our pre-tax profit growth in 1999
with a 28 percent pre-tax profit
increase. Target’s full-year profit
margin rate increased to 7.8 percent
of revenues in 1999 from 6.9 percent
in 1998.
Pre-tax Segment Profit and Percent Change from Prior Year(millions) 1999 1998
Target $2,022 28% $1,578 23%
Mervyn’s 205 (14) 240 (14)
Department Stores 296 6 279 16
Total $2,523 20% $2,097 16%
Pre-tax Segment Profit as a Percent of Revenues1999 1998
Target 7.8% 6.9%
Mervyn’s 5.0% 5.8%
Department Stores 9.6% 9.1%
EBITDA
EBITDA is pre-tax segment profit before depreciation and
amortization.
EBITDA and Percent Change from Prior Year(millions) 1999 1998
Target $2,589 25% $2,074 20%
Mervyn’s 343 (9) 378 (7)
Department Stores 429 4 414 12
Total $3,361 17% $2,866 15%
EBITDA as a Percent of Revenues1999 1998
Target 9.9% 9.0%
Mervyn’s 8.4% 9.1%
Department Stores 14.0% 13.5%
Management uses pre-tax segment profit and EBITDA, among otherstandards, to measure operating performance. Pre-tax segment profitand EBITDA supplement, and are not intended to represent measures ofperformance in accordance with, disclosures required by generallyaccepted accounting principles.
Interest Expense
We consider payments to holders of our sold securitized
receivables as “interest equivalent.” In 1999, the total of interest
expense and interest equivalent was $442 million, $4 million
lower than 1998. The average portfolio interest rate in
1999 was 7.5 percent. In 1998, the total of interest expense
and interest equivalent was $3 million lower than 1997. The
average portfolio interest rate in 1998 was 7.8 percent. In both
years, the reduction in interest expense and interest equivalent
was due to a lower average portfolio interest rate, partially
offset by higher average funded balances.
m a n a g e m e n t ’s d i s c u s s i o n a n d a n a l y s i s
$1
,03
0
$1
,47
1
Pre-tax Segment
Profit
(millions)
’95 ’96 ’97 ’98 ’99
$1
,80
7 $2
,09
7
$2
,52
3
2,500
2,000
1,500
1,000
500
18Target Corporation

During 1999, we repurchased $381 million of debt for
$444 million, resulting in an after-tax extraordinary charge
of $41 million ($.09 per share). The debt repurchased had a
weighted-average interest rate of 9.3 percent and an average
remaining life of 18 years. The replacement of this debt with
lower interest rate financing will have a favorable impact
on interest expense going forward. In 1998 and 1997, we
repurchased $127 million and $503 million of long-term debt,
resulting in after-tax extraordinary charges of $27 million
($.06 per share) and $51 million ($.11 per share), respectively.
Income Tax Rate
The effective income tax rate was 38.8 percent in 1999,
and 38.2 percent and 39.5 percent in 1998 and 1997,
respectively. The 1998 effective tax rate reflected the beneficial
effect of $20 million ($.04 per share), resulting from the
favorable outcome of our inventory shortage tax matter.
Securitized Receivables
In 1998, Target Receivables Corporation (TRC), a special-
purpose subsidiary, sold to the public $400 million of
securitized receivables. This issue of asset-backed securities had
an expected maturity of five years and a stated rate of
5.90 percent. Proceeds from the sale were used for general
corporate purposes, including funding the growth of
receivables. The 1998 sale transaction and the maturity of our
1995 securitization resulted in a net pre-tax loss of $3 million
(less than $.01 per share), which reduced 1998 finance charge
revenues and pre-tax earnings.
In 1997, TRC sold to the public $400 million of
securitized receivables, with an expected maturity of five years
and a stated rate of 6.25 percent. This transaction, combined
with the impact of the application of SFAS No. 125 to our 1995
securitization, resulted in a $45 million ($.06 per share) increase
in finance charge revenues and pre-tax earnings.
Our Consolidated Results of Operations also include
reductions of finance charge revenues and bad debt expense
related to sold securitized receivables. The amounts that
represent payments to holders of our sold securitized receiv-
ables are included in our pre-tax earnings reconciliation on
page 37 as interest equivalent. Interest equivalent was $49 mil-
lion in 1999, $48 million in 1998 and $33 million in 1997.
Mainframe Outsourcing
In 1998, we announced our plan to outsource our
mainframe computer data center functions and expensed
$42 million ($.06 per share) of related charges. During 1999,
we completed the transition and expensed an additional
$5 million ($.01 per share) related to the outsourcing.
These expenses are included in selling, general and adminis-
trative expense.
Year 2000 Readiness Disclosure
We began mitigating the risks associated with the year
2000 date conversion in 1993. In 1997, we established a
corporate-wide, comprehensive plan of action designed to
achieve an uninterrupted transition into the year 2000.
This project included three major elements: 1) information
technology (IT) systems, 2) non-IT, or embedded technology,
systems and 3) relationships with our key business partners.
The project was divided into five phases: awareness, assess-
ment, renovation, validation and implementation. During
1999, we completed all phases for the three elements, using
both internal and external resources to implement our plan.
For our IT systems, we assessed both existing and newly
implemented hardware, application software and operating
systems. We also assessed non-IT systems, or embedded
technology/infrastructure, risks at our stores, distribution
centers and headquarters facilities. We identified our key
business partners and worked closely with them to assess their
readiness and mitigate the risk to us if they were not prepared
for the year 2000. We installed the year 2000 ready version
of Electronic Data Interchange (EDI) software and tested the
software with our key vendors.
To date, we have not experienced any significant issues
associated with the date rollover. We have experienced no
systems failures, no unusually high levels of returned mer-
chandise, no interruptions of data transmission using EDI
software and no major disruptions in the supply of product
from our vendors. We continue to test and monitor our
systems and applications for such issues in order to address
them promptly, should any arise.
In 1999, we expensed $16 million related to year 2000
readiness. Prior to 1999, we expensed $32 million related to
year 2000 readiness. In addition, this program accelerated the
timing of $15 million of planned capital expenditures. All
expenditures related to our year 2000 readiness initiative were
within our estimates, were funded by cash flow from operations
and did not materially impact our other operating or
investment plans.
19 Target Corporation
m a n a g e m e n t ’s d i s c u s s i o n a n d a n a l y s i s

Fourth Quarter Results
Due to the seasonal nature of the retail industry, fourth
quarter operating results typically represent a substantially
larger share of total year revenues and earnings due to the
inclusion of the holiday shopping season.
Fourth quarter 1999 net earnings were $494 million,
compared with $423 million in 1998. Earnings per share were
$1.06 for the quarter, compared with $.90 in 1998. Total
revenues increased 8.7 percent and comparable-store sales
increased 3.5 percent. Our pre-tax profit increased 16 percent
to $1,000 million, driven by Target’s strong results.
Fourth Quarter Pre-tax Segment Profit andPercent Change from Prior Year(millions) 1999 1998
Target $ 811 26% $646 26%
Mervyn’s 69 (34) 104 –
Department Stores 120 5 115 12
Total $1,000 16% $865 20%
Analysis of Financial Condition
Our financial condition remains strong. Cash flow from
operations was $2,252 million, driven by earnings growth,
strong inventory control and accounts payable leveraging.
Internally generated funds continue to be the most important
component of our capital resources and, along with our ability
to access a variety of financial markets, provide funding for
our expansion plans. We continue to fund the growth in our
business through a combination of internally generated funds,
debt and sold securitized receivables.
During 1999, our average total receivables serviced (which
includes both retained and sold securitized receivables)
increased 5 percent, or $124 million,
due to growth of the Target Guest
Card. Year-end total receivables
serviced increased 7 percent from
last year. In 1999, the number of
Target Guest Card holders grew to
over 15 million accounts at year end,
compared with 12 million in 1998.
Inventory levels increased
$323 million in 1999. This growth
was more than fully funded by the
$364 million increase in accounts
payable over the same period.
Capital expenditures
were $1,918 million in 1999,
compared with $1,657 million
in 1998. Investment in Target
accounted for 87 percent of
1999 capital expenditures and
included the purchase of real
estate assets of a membership-
based, general merchandise
retailer for approximately
$125 million. Net property
and equipment increased
$930 million. During 1999,
Target opened 61 net
new stores.
Approximately 69 percent of total expenditures was
for new stores, expansions and remodels. Other capital
investments were for information systems, distribution and
other infrastructure to support store growth, primarily at
Target. Over the past five years, Target’s retail square footage
has grown at a compound annual rate of approximately
10 percent.
Our financing strategy is to ensure liquidity and access
to capital markets, to manage the amount of floating-rate debt
and to maintain a balanced spectrum of debt maturities.
Within these parameters, we seek to minimize our cost
of borrowing.
In January 1999, our Board of Directors authorized
the repurchase of $1 billion of our common stock. We
repurchased 9.4 million shares of stock during 1999 at a total
cost of $588 million ($62.58 per share), net of the premium
from exercised and expired put options. In March 2000, our
Board of Directors authorized the repurchase of an additional
$1 billion of our common stock.
Repurchases are made primarily in open market
transactions, subject to market conditions. Our program also
includes the sale of put options that entitle the holder to sell
shares of our common stock to us, at a specified price, if the
holder exercises the option. During 2000, we expect to
continue to repurchase shares at a pace similar to that of 1999.
m a n a g e m e n t ’s d i s c u s s i o n a n d a n a l y s i s
$1
,16
1 $1
,45
8
Cash Flow from
Operations
(millions)
’95 ’96 ’97 ’98 ’99
$1
,79
5
$1
,86
2
$2
,25
2
2,500
2,000
1,500
1,000
500
$1
,52
2
$1
,30
1
Capital
Expenditures
(millions)
’95 ’96 ’97 ’98 ’99
$1
,35
4
$1
,65
7 $1
,91
8
2,000
1,500
1,000
500
20Target Corporation
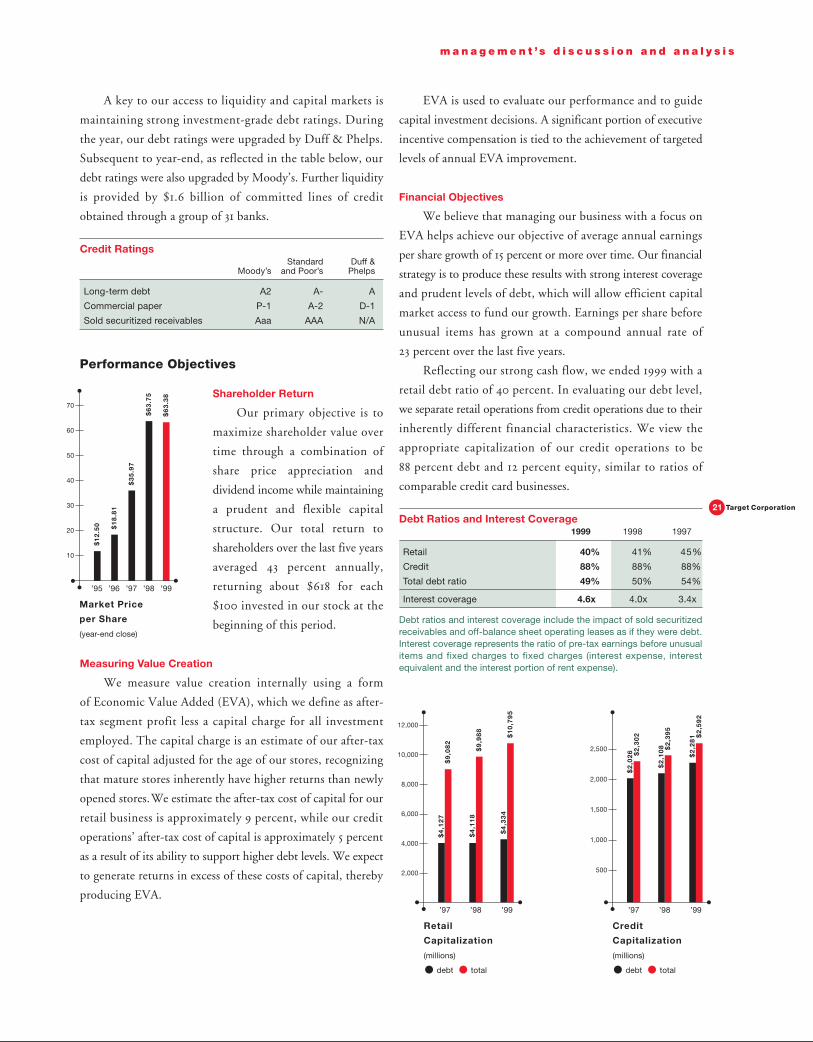
A key to our access to liquidity and capital markets is
maintaining strong investment-grade debt ratings. During
the year, our debt ratings were upgraded by Duff & Phelps.
Subsequent to year-end, as reflected in the table below, our
debt ratings were also upgraded by Moody’s. Further liquidity
is provided by $1.6 billion of committed lines of credit
obtained through a group of 31 banks.
Credit RatingsStandard Duff &
Moody’s and Poor’s Phelps
Long-term debt A2 A- A
Commercial paper P-1 A-2 D-1
Sold securitized receivables Aaa AAA N/A
Performance Objectives
Shareholder Return
Our primary objective is to
maximize shareholder value over
time through a combination of
share price appreciation and
dividend income while maintaining
a prudent and flexible capital
structure. Our total return to
shareholders over the last five years
averaged 43 percent annually,
returning about $618 for each
$100 invested in our stock at the
beginning of this period.
Measuring Value Creation
We measure value creation internally using a form
of Economic Value Added (EVA), which we define as after-
tax segment profit less a capital charge for all investment
employed. The capital charge is an estimate of our after-tax
cost of capital adjusted for the age of our stores, recognizing
that mature stores inherently have higher returns than newly
opened stores.We estimate the after-tax cost of capital for our
retail business is approximately 9 percent, while our credit
operations’ after-tax cost of capital is approximately 5 percent
as a result of its ability to support higher debt levels. We expect
to generate returns in excess of these costs of capital, thereby
producing EVA.
m a n a g e m e n t ’s d i s c u s s i o n a n d a n a l y s i s
$9
,08
2
Retail
Capitalization
(millions)
debt total
’97 ’98 ’99
$4
,12
7
$9
,98
8$
4,1
18
$1
0,7
95
$4
,33
4
12,000
10,000
8,000
6,000
4,000
2,000
$2
,30
2
Credit
Capitalization
(millions)
debt total
’97 ’98 ’99
$2
,02
6
$2
,39
5$
2,1
08
$2
,59
2$
2,2
81
2,500
2,000
1,500
1,000
500
EVA is used to evaluate our performance and to guide
capital investment decisions. A significant portion of executive
incentive compensation is tied to the achievement of targeted
levels of annual EVA improvement.
Financial Objectives
We believe that managing our business with a focus on
EVA helps achieve our objective of average annual earnings
per share growth of 15 percent or more over time. Our financial
strategy is to produce these results with strong interest coverage
and prudent levels of debt, which will allow efficient capital
market access to fund our growth. Earnings per share before
unusual items has grown at a compound annual rate of
23 percent over the last five years.
Reflecting our strong cash flow, we ended 1999 with a
retail debt ratio of 40 percent. In evaluating our debt level,
we separate retail operations from credit operations due to their
inherently different financial characteristics. We view the
appropriate capitalization of our credit operations to be
88 percent debt and 12 percent equity, similar to ratios of
comparable credit card businesses.
Debt Ratios and Interest Coverage1999 1998 1997
Retail 40% 41% 45%
Credit 88% 88% 88%
Total debt ratio 49% 50% 54%
Interest coverage 4.6x 4.0x 3.4x
Debt ratios and interest coverage include the impact of sold securitizedreceivables and off-balance sheet operating leases as if they were debt.Interest coverage represents the ratio of pre-tax earnings before unusualitems and fixed charges to fixed charges (interest expense, interestequivalent and the interest portion of rent expense).
21 Target Corporation
$1
2.5
0 $1
8.8
1
Market Price
per Share
(year-end close)
’95 ’96 ’97 ’98 ’99
$3
5.9
7
$6
3.7
5
$6
3.3
8
70
60
50
40
30
20
10
22Target Corporation
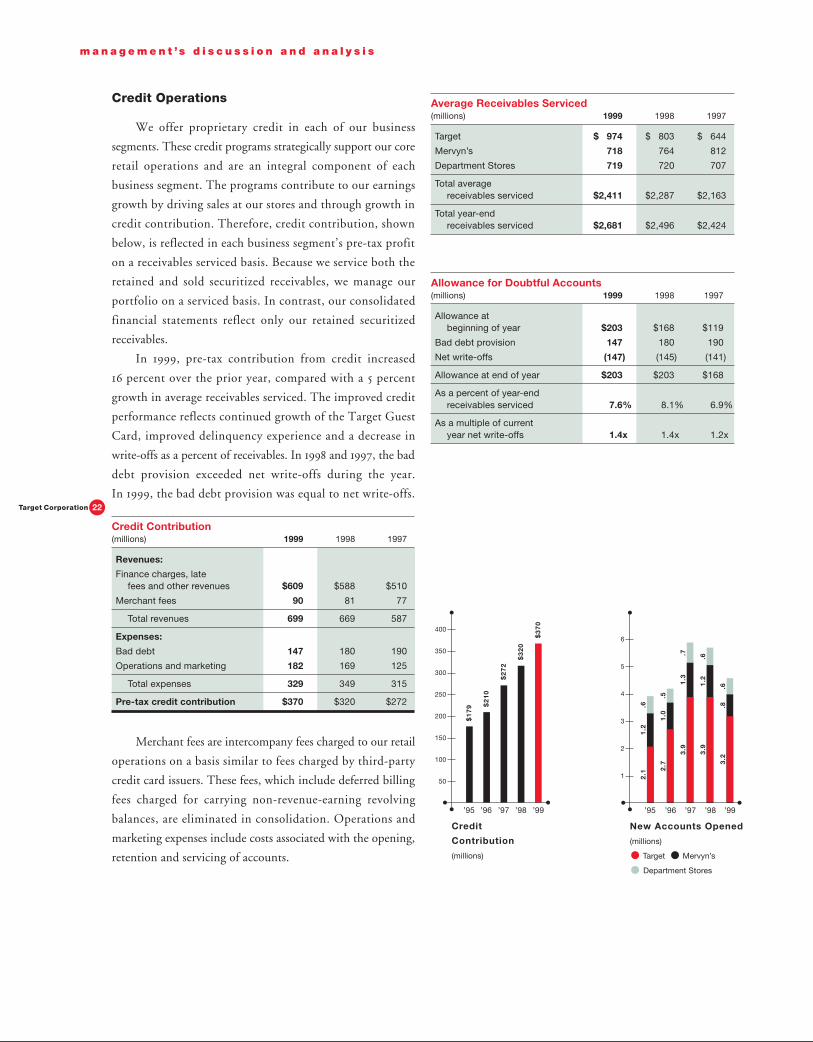
Credit Operations
We offer proprietary credit in each of our business
segments. These credit programs strategically support our core
retail operations and are an integral component of each
business segment. The programs contribute to our earnings
growth by driving sales at our stores and through growth in
credit contribution. Therefore, credit contribution, shown
below, is reflected in each business segment’s pre-tax profit
on a receivables serviced basis. Because we service both the
retained and sold securitized receivables, we manage our
portfolio on a serviced basis. In contrast, our consolidated
financial statements reflect only our retained securitized
receivables.
In 1999, pre-tax contribution from credit increased
16 percent over the prior year, compared with a 5 percent
growth in average receivables serviced. The improved credit
performance reflects continued growth of the Target Guest
Card, improved delinquency experience and a decrease in
write-offs as a percent of receivables. In 1998 and 1997, the bad
debt provision exceeded net write-offs during the year.
In 1999, the bad debt provision was equal to net write-offs.
Credit Contribution(millions) 1999 1998 1997
Revenues:
Finance charges, latefees and other revenues $609 $588 $510
Merchant fees 90 81 77
Total revenues 699 669 587
Expenses:
Bad debt 147 180 190
Operations and marketing 182 169 125
Total expenses 329 349 315
Pre-tax credit contribution $370 $320 $272
Merchant fees are intercompany fees charged to our retail
operations on a basis similar to fees charged by third-party
credit card issuers. These fees, which include deferred billing
fees charged for carrying non-revenue-earning revolving
balances, are eliminated in consolidation. Operations and
marketing expenses include costs associated with the opening,
retention and servicing of accounts.
Average Receivables Serviced(millions) 1999 1998 1997
Target $ 974 $ 803 $ 644
Mervyn’s 718 764 812
Department Stores 719 720 707
Total averagereceivables serviced $2,411 $2,287 $2,163
Total year-endreceivables serviced $2,681 $2,496 $2,424
Allowance for Doubtful Accounts(millions) 1999 1998 1997
Allowance atbeginning of year $203 $168 $119
Bad debt provision 147 180 190
Net write-offs (147) (145) (141)
Allowance at end of year $203 $203 $168
As a percent of year-endreceivables serviced 7.6% 8.1% 6.9%
As a multiple of currentyear net write-offs 1.4x 1.4x 1.2x
m a n a g e m e n t ’s d i s c u s s i o n a n d a n a l y s i s
$1
79 $
21
0
Credit
Contribution
(millions)
’95 ’96 ’97 ’98 ’99
$2
72
$3
20
$3
70
400
350
300
250
200
150
100
50
1.2
2.1
.6
.51
.02
.7
New Accounts Opened
(millions)
Target Mervyn’s
Department Stores
’95 ’96 ’97 ’98 ’99
.71
.33
.9
.61
.23
.9
.6.8
3.2
6
5
4
3
2
1
23 Target Corporation
Fiscal Year 2000
As we look forward into 2000, we believe that we will
deliver another year of strong growth in revenues and earnings,
driven primarily by increases in comparable-store sales and
new store growth at Target. Our gross margin rate is expected
to be essentially even with 1999. Our operating expense rate is
expected to benefit modestly from the leveraging of fixed costs.
Our credit operations are also expected to contribute to our
growth in earnings as we continue to open new accounts,
especially at Target, and leverage operating expenses.
In 2000, we expect to reinvest $2.5 to $3 billion in our
business, through a combination of capital investment and
repurchase of our shares. In the upcoming year, Target plans
to open approximately 80 total new stores, including locations
in two new states, West Virginia and Connecticut. Once again,
our opening plans will focus on markets in the Mid-Atlantic
and Northeast, and we will essentially double our number of
SuperTarget locations from the 16 we operated at year-end. We
expect Target’s retail square footage to expand in the range of
8 to 10 percent annually for the foreseeable future. Our planned
capital expenditures also include ongoing remodeling programs
at all three operating segments and other capital support.
Funding sources for the growth of our business include intern-
ally generated funds, debt and sold securitized receivables.
The total of interest expense and interest equivalent is
expected to be moderately higher than 1999 due to higher
average funded balances, partially offset by a lower average
portfolio interest rate. Our $800 million of sold securitized
receivables will result in approximately $50 million of interest
equivalent for the year.
The effective income tax rate is expected to approximate
38.5 percent.
Forward-Looking Statements
This Annual Report, including the preceding manage-
ment’s discussion and analysis, contains forward-looking
statements regarding our performance, liquidity and the
adequacy of our capital resources. Those statements are based
on our current assumptions and expectations and are subject
to certain risks and uncertainties that could cause actual results
to differ materially from those projected. We caution that the
forward-looking statements are qualified by the risks and
challenges posed by increased competition, shifting consumer
demand, changing consumer credit markets, changing capital
markets and general economic conditions, hiring and retaining
effective team members, sourcing merchandise from domestic
and international vendors, investing in new business strategies,
achieving our growth objectives, and other risks and uncer-
tainties. As a result, while we believe that there is a reasonable
basis for the forward-looking statements, you should not place
undue reliance on those statements. You are encouraged to
review Exhibit (99)C attached to our Form 10-K Report for
the year ended January 29, 2000, which contains additional
important factors that may cause actual results to differ mate-
rially from those predicted in the forward-looking statements.
m a n a g e m e n t ’s d i s c u s s i o n a n d a n a l y s i s
As we look
forward into 2000, we believe
that we will deliver another year
of strong growth in revenues
and earnings.
24Target Corporation
Summary of Accounting Policies
Organization Effective beginning of fiscal year 2000,
Dayton Hudson Corporation changed its name to Target
Corporation. We are a general merchandise retailer, comprised
of three operating segments: Target; Mervyn’s; and Dayton’s,
Marshall Field’s, Hudson’s (the Department Stores). Target,
an upscale discount chain located in 44 states at year-end,
contributed 78 percent of our 1999 total revenues. Mervyn’s,
a middle-market promotional department store located in 14
states in the West, South and Midwest, contributed 12 percent
of total revenues. The Department Stores, traditional depart-
ment stores located in eight states in the upper Midwest,
contributed 9 percent of total revenues.
Consolidation The financial statements include the
balances of the Corporation and its subsidiaries after elim-
ination of material intercompany balances and transactions.
All material subsidiaries are wholly owned.
Use of Estimates The preparation of our financial
statements, in conformity with generally accepted accounting
principles, requires management to make estimates and
assumptions that affect the reported amounts in the financial
statements and accompanying notes. Actual results may differ
from those estimates.
Fiscal Year Our fiscal year ends on the Saturday nearest
January 31. Unless otherwise stated, references to years in this
report relate to fiscal years rather than to calendar years. Fiscal
years 1999, 1998 and 1997 consisted of 52 weeks.
Reclassifications Within the Consolidated Results
of Operations, certain reclassifications have been made to prior
years’ income and expense amounts to conform to the 1999
presentation. None of the reclassifications impacted our net
earnings or earnings per share in any period. The reclas-
sifications include the separate presentation of sales
and net credit revenues; the application of the provisions
of Staff Accounting Bulletin No. 101, “Revenue Recognition
in Financial Statements”; the classification of buying and
occupancy expenses in selling, general and administrative
expense rather than cost of sales; and the classification
of taxes other than income taxes in selling, general and
administrative expense.
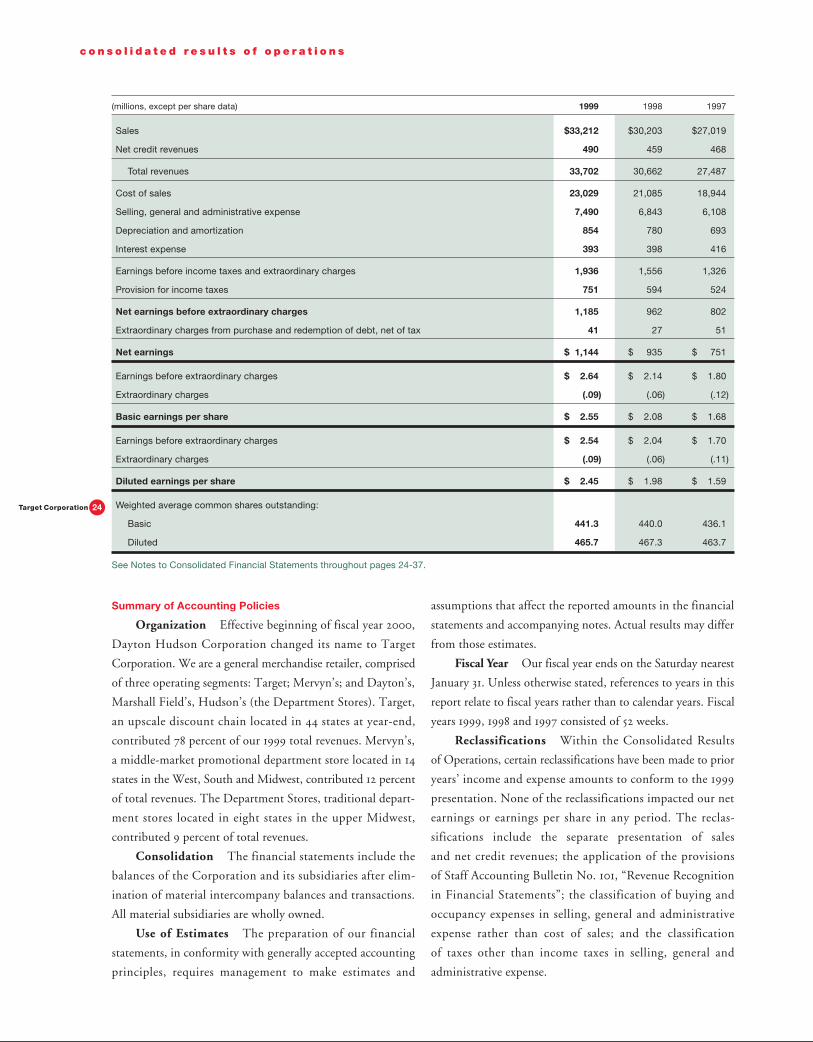
c o n s o l i d a t e d r e s u l t s o f o p e r a t i o n s
(millions, except per share data) 1999 1998 1997
Sales $33,212 $30,203 $27,019
Net credit revenues 490 459 468
Total revenues 33,702 30,662 27,487
Cost of sales 23,029 21,085 18,944
Selling, general and administrative expense 7,490 6,843 6,108
Depreciation and amortization 854 780 693
Interest expense 393 398 416
Earnings before income taxes and extraordinary charges 1,936 1,556 1,326
Provision for income taxes 751 594 524
Net earnings before extraordinary charges 1,185 962 802
Extraordinary charges from purchase and redemption of debt, net of tax 41 27 51
Net earnings $ 1,144 $ 935 $ 751
Earnings before extraordinary charges $ 2.64 $ 2.14 $ 1.80
Extraordinary charges (.09) (.06) (.12)
Basic earnings per share $ 2.55 $ 2.08 $ 1.68
Earnings before extraordinary charges $ 2.54 $ 2.04 $ 1.70
Extraordinary charges (.09) (.06) (.11)
Diluted earnings per share $ 2.45 $ 1.98 $ 1.59
Weighted average common shares outstanding:
Basic 441.3 440.0 436.1
Diluted 465.7 467.3 463.7
See Notes to Consolidated Financial Statements throughout pages 24-37.

25 Target Corporation
n o t e s t o c o n s o l i d a t e d f i n a n c i a l s t a t e m e n t s
Revenues
Revenue from retail sales is recognized at the time of sale.
Leased department sales, net of related cost of sales, are
included within sales and were $31 million in 1999, $29 million
in 1998, and $25 million in 1997. Net credit revenues include
finance charges and late fees on internal credit sales, net of the
effect of sold securitized receivables. Internal credit sales were
$5.0 billion, $4.5 billion and $4.2 billion in 1999, 1998 and
1997, respectively.
Advertising Costs
Advertising costs, included in selling, general and
administrative expense, are expensed as incurred and were
$791 million, $745 million and $679 million for 1999, 1998
and 1997, respectively.
Impact of Year 2000
Year 2000 related costs, included in selling, general and
administrative expense, were expensed as incurred. In 1999,
we expensed $16 million related to year 2000 readiness. Prior
to 1999, we expensed $32 million. In addition, we accelerated
the timing of $15 million of planned capital expenditures,
which are recorded in property and equipment at cost less
accumulated depreciation.
Mainframe Outsourcing
In 1998, we announced our plan to outsource our
mainframe computer data center functions and expensed
$42 million ($.06 per share) of related charges. During 1999,
we completed the transition and expensed an additional $5 mil-
lion ($.01 per share) related to the outsourcing. These expenses
are included in selling, general and administrative expense.
Start-up Expense
In first quarter 1999, we adopted SOP 98-5, “Reporting
on the Costs of Start-Up Activities.” The adoption did not
impact total year start-up expense, which is included in selling,
general and administrative expense.
Earnings per Share
Basic EPS is net earnings, less dividend requirements
on the Employee Stock Ownership Plan (ESOP) preferred
shares prior to their conversion to common shares, divided by
the average number of common shares outstanding during the
period. In January 2000, each outstanding ESOP preferred
share was converted into 60 shares of our common stock.
These shares are now included within weighted average
common shares outstanding.
Diluted EPS assumed conversion of the ESOP preferred
shares into common shares and replacement of the ESOP
preferred dividends with common stock dividends, prior
to the conversion of all preferred shares in January 2000.
In addition, net earnings were adjusted for expense required
to fund the ESOP debt service, prior to repayment of the loan
in 1998. References herein to earnings per share refer to
Diluted EPS.
All earnings per share, dividends per share and common
shares outstanding reflect our 1998 two-for-one share split.
Basic EPS Diluted EPS(millions, except pershare data) 1999 1998 1997 1999 1998 1997
Net earnings* $1,185 $ 962 $ 802 $1,185 $ 962 $ 802
Less: ESOP netearningsadjustment (18) (20) (20) (4) (8) (13)
Adjusted netearnings* $1,167 $ 942 $ 782 $1,181 $ 954 $ 789
Weighted averagecommon sharesoutstanding 441.3 440.0 436.1 441.3 440.0 436.1
Performanceshares – – – .1 .8 1.3
Stock options – – – 5.8 5.5 3.9
Assumed conver-sion of ESOPpreferred shares – – – 18.5 21.0 22.4
Total commonequivalent sharesoutstanding 441.3 440.0 436.1 465.7 467.3 463.7
Earningsper share* $ 2.64 $2.14 $1.80 $ 2.54 $2.04 $1.70
*Before extraordinary charges
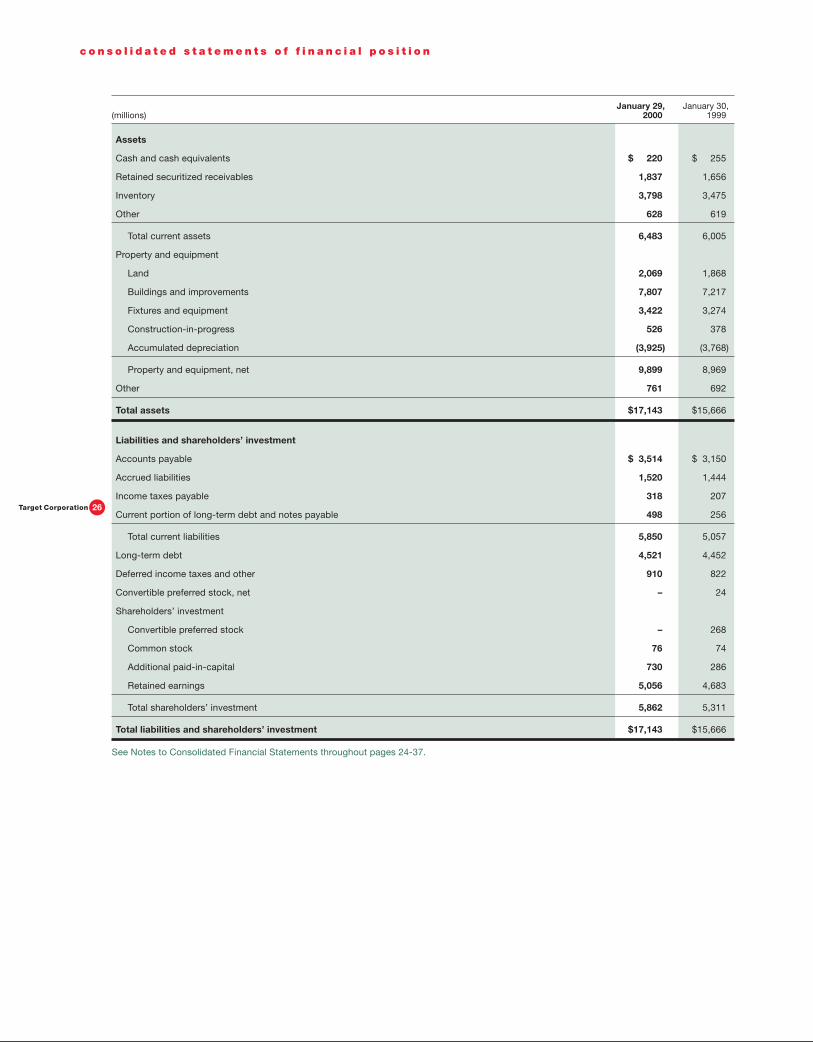
January 29, January 30,(millions) 2000 1999
Assets
Cash and cash equivalents $ 220 $ 255
Retained securitized receivables 1,837 1,656
Inventory 3,798 3,475
Other 628 619
Total current assets 6,483 6,005
Property and equipment
Land 2,069 1,868
Buildings and improvements 7,807 7,217
Fixtures and equipment 3,422 3,274
Construction-in-progress 526 378
Accumulated depreciation (3,925) (3,768)
Property and equipment, net 9,899 8,969
Other 761 692
Total assets $17,143 $15,666
Liabilities and shareholders’ investment
Accounts payable $ 3,514 $ 3,150
Accrued liabilities 1,520 1,444
Income taxes payable 318 207
Current portion of long-term debt and notes payable 498 256
Total current liabilities 5,850 5,057
Long-term debt 4,521 4,452
Deferred income taxes and other 910 822
Convertible preferred stock, net – 24
Shareholders’ investment
Convertible preferred stock – 268
Common stock 76 74
Additional paid-in-capital 730 286
Retained earnings 5,056 4,683
Total shareholders’ investment 5,862 5,311
Total liabilities and shareholders’ investment $17,143 $15,666
See Notes to Consolidated Financial Statements throughout pages 24-37.
26Target Corporation
c o n s o l i d a t e d s t a t e m e n t s o f f i n a n c i a l p o s i t i o n
Cash Equivalents
Cash equivalents represent short-term investments with
a maturity of three months or less from the time of purchase.
Retained Securitized Receivables
Through our special purpose subsidiary, Target
Receivables Corporation (TRC), we transfer, on an ongoing
basis, substantially all of our receivables to a trust in return for
certificates representing undivided interests in the trust’s assets.
TRC owns the undivided interest in the trust’s assets, other
than the sold securitized receivables and the 2 percent of trust
assets held by Retailers National Bank (RNB), a wholly owned
subsidiary of the Corporation that also services the receivables.
Prior to June 1998, RNB held 5 percent of trust assets. The
undivided interests held by TRC and RNB, as well as related
income and expenses, are reflected in each operating segment’s
assets and operating results based on the origin of the credit
sale giving rise to the receivable.
In 1998, TRC sold to the public $400 million of
securitized receivables. This issue of asset-backed securities had
an expected maturity of five years and a stated rate of
5.90 percent. Proceeds from the sale were used for general
corporate purposes, including funding the growth of
receivables. The 1998 sale transaction and the maturity of our
1995 securitization resulted in a net loss of $3 million (less than
$.01 per share), which reduced 1998 finance charge revenues
and pre-tax earnings.
In 1997, TRC sold to the public $400 million of
securitized receivables, with an expected maturity of five years
and a stated rate of 6.25 percent. This transaction, combined
with the impact of the application of SFAS No. 125 to our 1995
securitization, resulted in a $45 million ($.06 per share) increase
in finance charge revenues and pre-tax earnings.
At year-end 1999, $800 million of securitized receivables
had been sold to investors and TRC had borrowed
$100 million through the issuance of notes payable secured
by receivables.
The fair value of the retained securitized receivables,
classified as available for sale, was $1,837 million and
$1,656 million at year-end 1999 and 1998, respectively. The fair
value of the retained securitized receivables was lower than the
aggregate receivables value by $157 million and $156 million
at year-end 1999 and 1998, respectively, due to our estimates
of ultimate collectibility. Write-downs have been included in
selling, general and administrative expense.
Inventory
Inventory and the related cost of sales are accounted for
by the retail inventory accounting method using the last-in,
first-out (LIFO) basis and are stated at the lower of LIFO cost
or market. The cumulative LIFO provision was $53 million
and $60 million at year-end 1999 and 1998, respectively.
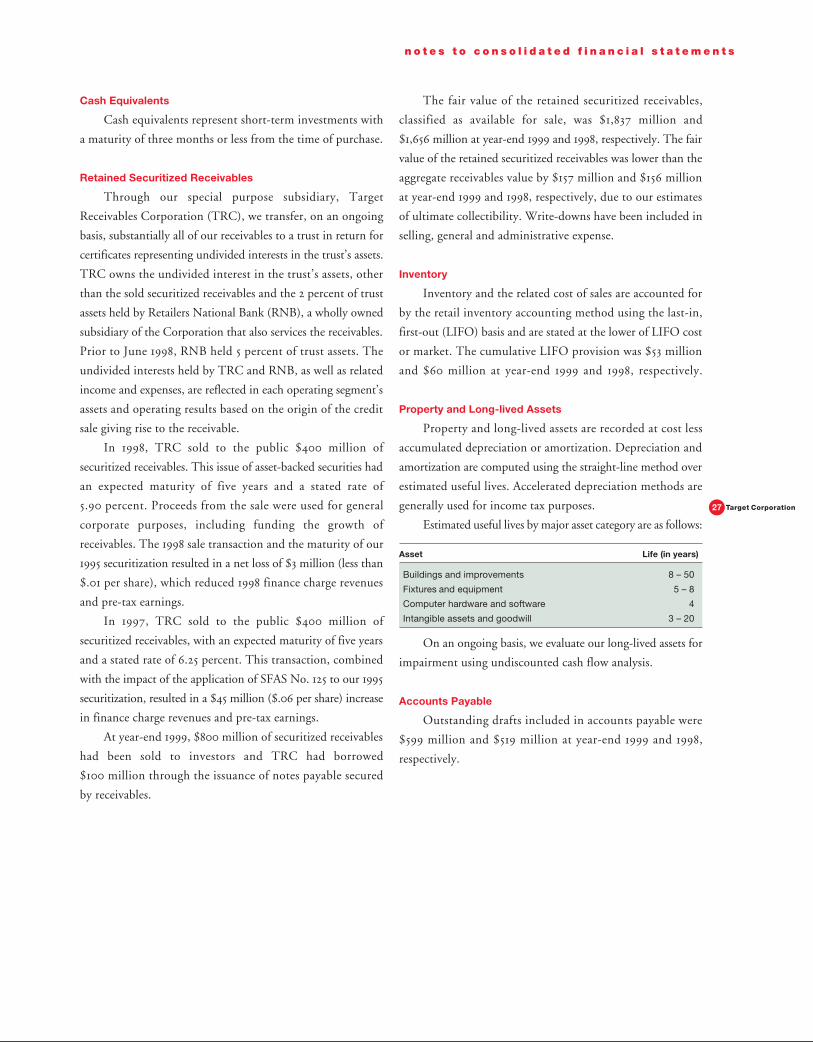
Property and Long-lived Assets
Property and long-lived assets are recorded at cost less
accumulated depreciation or amortization. Depreciation and
amortization are computed using the straight-line method over
estimated useful lives. Accelerated depreciation methods are
generally used for income tax purposes.
Estimated useful lives by major asset category are as follows:
Asset Life (in years)
Buildings and improvements 8 – 50
Fixtures and equipment 5 – 8
Computer hardware and software 4
Intangible assets and goodwill 3 – 20
On an ongoing basis, we evaluate our long-lived assets for
impairment using undiscounted cash flow analysis.
Accounts Payable
Outstanding drafts included in accounts payable were
$599 million and $519 million at year-end 1999 and 1998,
respectively.
27 Target Corporation
n o t e s t o c o n s o l i d a t e d f i n a n c i a l s t a t e m e n t s

(millions) 1999 1998 1997
Operating activities
Net earnings before extraordinary charges $ 1,185 $ 962 $ 802
Reconciliation to cash flow:
Depreciation and amortization 854 780 693
Deferred tax provision 75 (11) (63)
Other noncash items affecting earnings 163 70 43
Changes in operating accounts providing/(requiring) cash:
Retained securitized receivables (181) (56) (235)
Sold securitized receivables – 400 400
Maturity of sold securitized receivables – (400) –
Inventory (323) (198) (220)
Other current assets (57) (46) (35)
Other assets (65) (65) (33)
Accounts payable 364 336 199
Accrued liabilities 100 75 182
Income taxes payable 137 15 62
Cash flow provided by operations 2,252 1,862 1,795
Investing activities
Expenditures for property and equipment (1,918) (1,657) (1,354)
Proceeds from disposals of property and equipment 126 107 123
Acquisition of subsidiaries, net of cash received – (100) –
Other (15) (5) –
Cash flow required for investing activities (1,807) (1,655) (1,231)
Net financing sources 445 207 564
Financing activities
Increase/(decrease) in notes payable, net 564 (305) (127)
Additions to long-term debt 285 600 375
Reductions of long-term debt (600) (343) (690)
Principal payments received on loan to ESOP – 8 22
Dividends paid (195) (178) (165)
Repurchase of stock (581) – –
Other 47 55 31
Cash flow used for financing activities (480) (163) (554)
Net (decrease)/increase in cash and cash equivalents (35) 44 10
Cash and cash equivalents at beginning of year 255 211 201
Cash and cash equivalents at end of year $ 220 $ 255 $ 211
Amounts presented herein are on a cash basis and therefore may differ from those shown in other sections of this Annual Report. Cash paid forincome taxes was $575 million, $564 million and $454 million during 1999, 1998 and 1997, respectively. Cash paid for interest (including interestcapitalized) was $405 million, $393 million and $485 million during 1999, 1998 and 1997, respectively.
See Notes to Consolidated Financial Statements throughout pages 24-37.
28Target Corporation
c o n s o l i d a t e d s t a t e m e n t s o f c a s h f l o w s
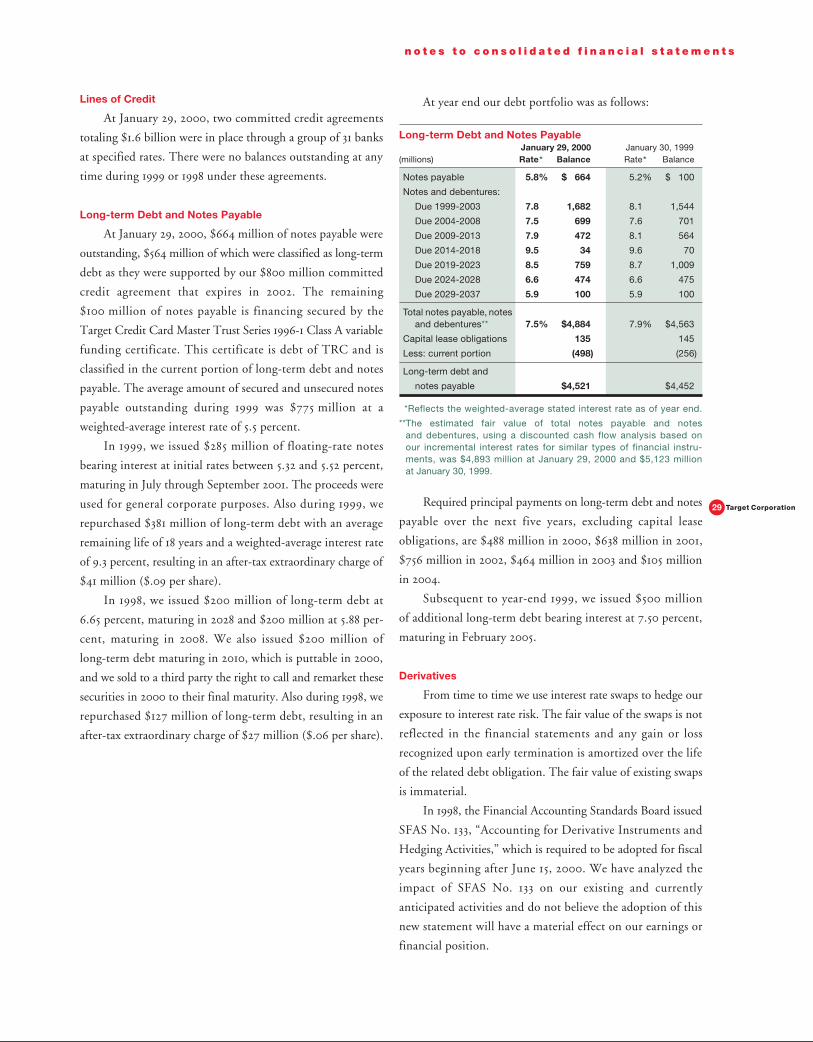
29 Target Corporation
Lines of Credit
At January 29, 2000, two committed credit agreements
totaling $1.6 billion were in place through a group of 31 banks
at specified rates. There were no balances outstanding at any
time during 1999 or 1998 under these agreements.
Long-term Debt and Notes Payable
At January 29, 2000, $664 million of notes payable were
outstanding, $564 million of which were classified as long-term
debt as they were supported by our $800 million committed
credit agreement that expires in 2002. The remaining
$100 million of notes payable is financing secured by the
Target Credit Card Master Trust Series 1996-1 Class A variable
funding certificate. This certificate is debt of TRC and is
classified in the current portion of long-term debt and notes
payable. The average amount of secured and unsecured notes
payable outstanding during 1999 was $775 million at a
weighted-average interest rate of 5.5 percent.
In 1999, we issued $285 million of floating-rate notes
bearing interest at initial rates between 5.32 and 5.52 percent,
maturing in July through September 2001. The proceeds were
used for general corporate purposes. Also during 1999, we
repurchased $381 million of long-term debt with an average
remaining life of 18 years and a weighted-average interest rate
of 9.3 percent, resulting in an after-tax extraordinary charge of
$41 million ($.09 per share).
In 1998, we issued $200 million of long-term debt at
6.65 percent, maturing in 2028 and $200 million at 5.88 per-
cent, maturing in 2008. We also issued $200 million of
long-term debt maturing in 2010, which is puttable in 2000,
and we sold to a third party the right to call and remarket these
securities in 2000 to their final maturity. Also during 1998, we
repurchased $127 million of long-term debt, resulting in an
after-tax extraordinary charge of $27 million ($.06 per share).
At year end our debt portfolio was as follows:
Long-term Debt and Notes PayableJanuary 29, 2000 January 30, 1999
(millions) Rate* Balance Rate* Balance
Notes payable 5.8% $ 664 5.2% $ 100
Notes and debentures:
Due 1999-2003 7.8 1,682 8.1 1,544
Due 2004-2008 7.5 699 7.6 701
Due 2009-2013 7.9 472 8.1 564
Due 2014-2018 9.5 34 9.6 70
Due 2019-2023 8.5 759 8.7 1,009
Due 2024-2028 6.6 474 6.6 475
Due 2029-2037 5.9 100 5.9 100
Total notes payable, notesand debentures** 7.5% $4,884 7.9% $4,563
Capital lease obligations 135 145
Less: current portion (498) (256)
Long-term debt and
notes payable $4,521 $4,452
*Reflects the weighted-average stated interest rate as of year end.
**The estimated fair value of total notes payable and notes and debentures, using a discounted cash flow analysis based on our incremental interest rates for similar types of financial instru-ments, was $4,893 million at January 29, 2000 and $5,123 million at January 30, 1999.
Required principal payments on long-term debt and notes
payable over the next five years, excluding capital lease
obligations, are $488 million in 2000, $638 million in 2001,
$756 million in 2002, $464 million in 2003 and $105 million
in 2004.
Subsequent to year-end 1999, we issued $500 million
of additional long-term debt bearing interest at 7.50 percent,
maturing in February 2005.
Derivatives
From time to time we use interest rate swaps to hedge our
exposure to interest rate risk. The fair value of the swaps is not
reflected in the financial statements and any gain or loss
recognized upon early termination is amortized over the life
of the related debt obligation. The fair value of existing swaps
is immaterial.
In 1998, the Financial Accounting Standards Board issued
SFAS No. 133, “Accounting for Derivative Instruments and
Hedging Activities,” which is required to be adopted for fiscal
years beginning after June 15, 2000. We have analyzed the
impact of SFAS No. 133 on our existing and currently
anticipated activities and do not believe the adoption of this
new statement will have a material effect on our earnings or
financial position.
n o t e s t o c o n s o l i d a t e d f i n a n c i a l s t a t e m e n t s
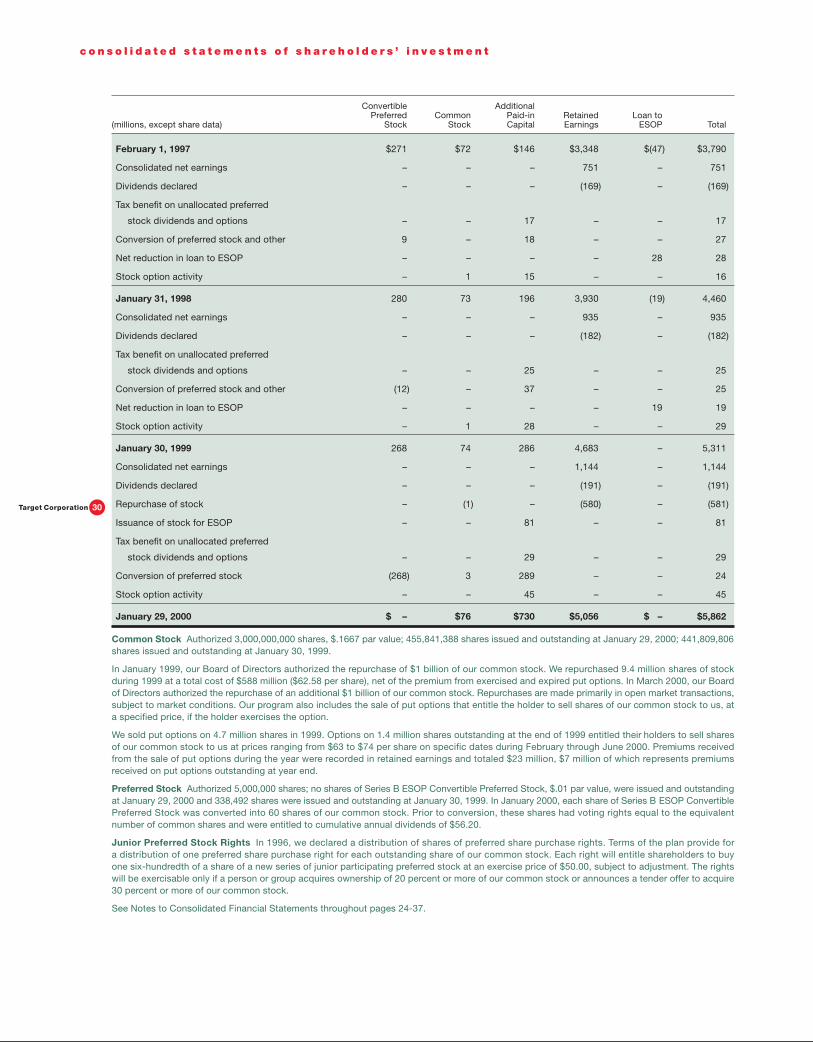
Convertible AdditionalPreferred Common Paid-in Retained Loan to
(millions, except share data) Stock Stock Capital Earnings ESOP Total
February 1, 1997 $271 $72 $146 $3,348 $(47) $3,790
Consolidated net earnings – – – 751 – 751
Dividends declared – – – (169) – (169)
Tax benefit on unallocated preferred
stock dividends and options – – 17 – – 17
Conversion of preferred stock and other 9 – 18 – – 27
Net reduction in loan to ESOP – – – – 28 28
Stock option activity – 1 15 – – 16
January 31, 1998 280 73 196 3,930 (19) 4,460
Consolidated net earnings – – – 935 – 935
Dividends declared – – – (182) – (182)
Tax benefit on unallocated preferred
stock dividends and options – – 25 – – 25
Conversion of preferred stock and other (12) – 37 – – 25
Net reduction in loan to ESOP – – – – 19 19
Stock option activity – 1 28 – – 29
January 30, 1999 268 74 286 4,683 – 5,311
Consolidated net earnings – – – 1,144 – 1,144
Dividends declared – – – (191) – (191)
Repurchase of stock – (1) – (580) – (581)
Issuance of stock for ESOP – – 81 – – 81
Tax benefit on unallocated preferred
stock dividends and options – – 29 – – 29
Conversion of preferred stock (268) 3 289 – – 24
Stock option activity – – 45 – – 45
January 29, 2000 $ – $76 $730 $5,056 $ – $5,862
Common Stock Authorized 3,000,000,000 shares, $.1667 par value; 455,841,388 shares issued and outstanding at January 29, 2000; 441,809,806shares issued and outstanding at January 30, 1999.
In January 1999, our Board of Directors authorized the repurchase of $1 billion of our common stock. We repurchased 9.4 million shares of stockduring 1999 at a total cost of $588 million ($62.58 per share), net of the premium from exercised and expired put options. In March 2000, our Board of Directors authorized the repurchase of an additional $1 billion of our common stock. Repurchases are made primarily in open market transactions,subject to market conditions. Our program also includes the sale of put options that entitle the holder to sell shares of our common stock to us, ata specified price, if the holder exercises the option.
We sold put options on 4.7 million shares in 1999. Options on 1.4 million shares outstanding at the end of 1999 entitled their holders to sell sharesof our common stock to us at prices ranging from $63 to $74 per share on specific dates during February through June 2000. Premiums receivedfrom the sale of put options during the year were recorded in retained earnings and totaled $23 million, $7 million of which represents premiumsreceived on put options outstanding at year end.
Preferred Stock Authorized 5,000,000 shares; no shares of Series B ESOP Convertible Preferred Stock, $.01 par value, were issued and outstandingat January 29, 2000 and 338,492 shares were issued and outstanding at January 30, 1999. In January 2000, each share of Series B ESOP ConvertiblePreferred Stock was converted into 60 shares of our common stock. Prior to conversion, these shares had voting rights equal to the equivalentnumber of common shares and were entitled to cumulative annual dividends of $56.20.
Junior Preferred Stock Rights In 1996, we declared a distribution of shares of preferred share purchase rights. Terms of the plan provide for a distribution of one preferred share purchase right for each outstanding share of our common stock. Each right will entitle shareholders to buy one six-hundredth of a share of a new series of junior participating preferred stock at an exercise price of $50.00, subject to adjustment. The rightswill be exercisable only if a person or group acquires ownership of 20 percent or more of our common stock or announces a tender offer to acquire30 percent or more of our common stock.
See Notes to Consolidated Financial Statements throughout pages 24-37.
30Target Corporation
c o n s o l i d a t e d s t a t e m e n t s o f s h a r e h o l d e r s ’ i n v e s t m e n t
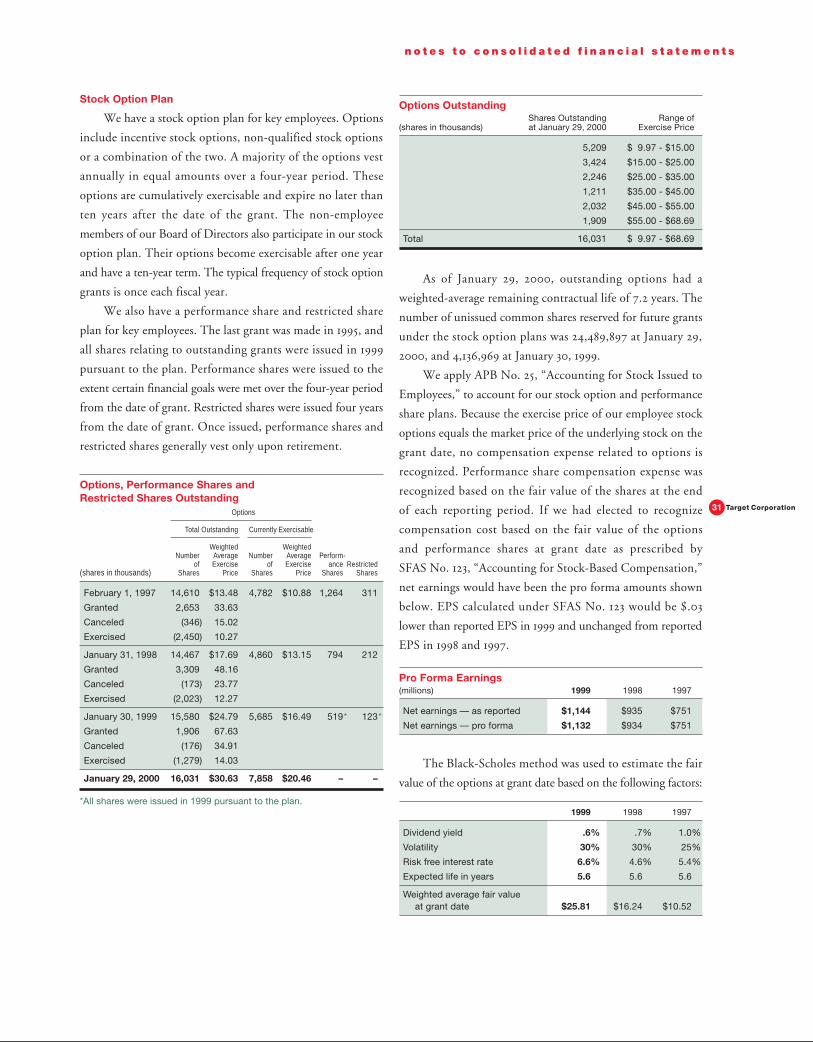
31 Target Corporation
Stock Option Plan
We have a stock option plan for key employees. Options
include incentive stock options, non-qualified stock options
or a combination of the two. A majority of the options vest
annually in equal amounts over a four-year period. These
options are cumulatively exercisable and expire no later than
ten years after the date of the grant. The non-employee
members of our Board of Directors also participate in our stock
option plan. Their options become exercisable after one year
and have a ten-year term. The typical frequency of stock option
grants is once each fiscal year.
We also have a performance share and restricted share
plan for key employees. The last grant was made in 1995, and
all shares relating to outstanding grants were issued in 1999
pursuant to the plan. Performance shares were issued to the
extent certain financial goals were met over the four-year period
from the date of grant. Restricted shares were issued four years
from the date of grant. Once issued, performance shares and
restricted shares generally vest only upon retirement.
Options, Performance Shares and Restricted Shares Outstanding
Options
Total Outstanding Currently Exercisable
Weighted WeightedNumber Average Number Average Perform-
of Exercise of Exercise ance Restricted(shares in thousands) Shares Price Shares Price Shares Shares
February 1, 1997 14,610 $13.48 4,782 $10.88 1,264 311
Granted 2,653 33.63
Canceled (346) 15.02
Exercised (2,450) 10.27
January 31, 1998 14,467 $17.69 4,860 $13.15 794 212
Granted 3,309 48.16
Canceled (173) 23.77
Exercised (2,023) 12.27
January 30, 1999 15,580 $24.79 5,685 $16.49 519* 123*
Granted 1,906 67.63
Canceled (176) 34.91
Exercised (1,279) 14.03
January 29, 2000 16,031 $30.63 7,858 $20.46 – –
*All shares were issued in 1999 pursuant to the plan.
n o t e s t o c o n s o l i d a t e d f i n a n c i a l s t a t e m e n t s
Options OutstandingShares Outstanding Range of
(shares in thousands) at January 29, 2000 Exercise Price
5,209 $ 9.97 - $15.00
3,424 $15.00 - $25.00
2,246 $25.00 - $35.00
1,211 $35.00 - $45.00
2,032 $45.00 - $55.00
1,909 $55.00 - $68.69
Total 16,031 $ 9.97 - $68.69
As of January 29, 2000, outstanding options had a
weighted-average remaining contractual life of 7.2 years. The
number of unissued common shares reserved for future grants
under the stock option plans was 24,489,897 at January 29,
2000, and 4,136,969 at January 30, 1999.
We apply APB No. 25, “Accounting for Stock Issued to
Employees,” to account for our stock option and performance
share plans. Because the exercise price of our employee stock
options equals the market price of the underlying stock on the
grant date, no compensation expense related to options is
recognized. Performance share compensation expense was
recognized based on the fair value of the shares at the end
of each reporting period. If we had elected to recognize
compensation cost based on the fair value of the options
and performance shares at grant date as prescribed by
SFAS No. 123, “Accounting for Stock-Based Compensation,”
net earnings would have been the pro forma amounts shown
below. EPS calculated under SFAS No. 123 would be $.03
lower than reported EPS in 1999 and unchanged from reported
EPS in 1998 and 1997.
Pro Forma Earnings(millions) 1999 1998 1997
Net earnings — as reported $1,144 $935 $751
Net earnings — pro forma $1,132 $934 $751
The Black-Scholes method was used to estimate the fair
value of the options at grant date based on the following factors:
1999 1998 1997
Dividend yield .6% .7% 1.0%
Volatility 30% 30% 25%
Risk free interest rate 6.6% 4.6% 5.4%
Expected life in years 5.6 5.6 5.6
Weighted average fair valueat grant date $25.81 $16.24 $10.52

32Target Corporation
Pension and Postretirement Health Care Benefits
We have defined benefit pension plans that cover all
employees who meet certain age, length of service and hours
worked per year requirements. Benefits are provided based
upon years of service and the employee’s compensation.
Retired employees also become eligible for certain health care
benefits if they meet minimum age and service requirements
and agree to contribute a portion of the cost.
In 1999, we adopted a change in the measurement date
of our pension and postretirement health care benefits plans
from December 31 to October 31. Prior periods have not been
restated, as the impact of the change is not material.
Change in Benefit ObligationPostretirement
Health CarePension Benefits Benefits
(millions) 1999 1998 1999 1998
Benefit obligation at beginning of measurement period $729 $610 $ 85 $ 81
Service cost 44 35 2 1
Interest cost 53 45 6 6
Actuarial loss 76 65 9 5
Acquisitions – 26 – –
Benefits paid (40) (52) (8) (8)
Benefit obligation at end of measurement period $862 $729 $ 94 $ 85
Change in Plan Assets
Fair value of plan assets at beginning of measurement period $859 $718 $ – $ –
Actual return on plan assets 62 106 – –
Employer contribution 100 59 8 8
Acquisitions – 25 – –
Benefits paid (39) (49) (8) (8)
Fair value of plan assets at end of measurement period $982 $859 $ – $ –
Reconciliation of Prepaid/(Accrued) Cost
Funded status $120 $130 $(94) $ (85)
Unrecognized actuarial loss/(gain) 51 (16) (7) (18)
Unrecognized priorservice cost 8 2 2 3
Net prepaid/(accrued) cost $179 $116 $(99) $(100)
The benefit obligation and fair value of plan assets, for the pension planswith benefit obligations in excess of plan assets, were $49 and $0 as ofOctober 31, 1999, and $34 and $0 as of December 31, 1998.
Net Pension and Postretirement Health CareBenefits Expense
PostretirementPension Benefits Health Care Benefits
(millions) 1999 1998 1997 1999 1998 1997
Service cost benefitsearned during theperiod $44 $35 $27 $2 $1 $1
Interest cost onprojected benefitobligation 53 45 39 6 6 6
Expected returnon assets (72) (58) (48) – – –
Recognized gainsand losses 9 3 – – (1) (2)
Recognized priorservice cost 1 – 1 – – 1
Total $35 $25 $19 $8 $6 $6
The amortization of any prior service cost is determined
using a straight-line amortization of the cost over the average
remaining service period of employees expected to receive
benefits under the plan.
Actuarial AssumptionsPostretirement
Pension Benefits Health Care Benefits
1999 1998 1997 1999 1998 1997
Discount rate 71⁄2% 7% 71⁄4% 71⁄2% 7% 71⁄4%
Expected long-termrate of return onplans’ assets 9 9 9 n/a n/a n/a
Average assumedrate of compensa-tion increase 41⁄2 4 41⁄4 n/a n/a n/a
An increase in the cost of covered health care benefits of
6 percent is assumed for 2000. The rate is assumed to remain
at 6 percent in the future. The health care cost trend rate
assumption has a significant effect on the amounts reported.
A 1 percent change in assumed health care cost trend rates
would have the following effects:
1% Increase 1% Decrease
Effect on total of service and interest cost components of net periodic postretirementhealth care benefit cost $– $ –
Effect on the health care component of the postretirement benefitobligation $5 $(4)
n o t e s t o c o n s o l i d a t e d f i n a n c i a l s t a t e m e n t s

Leases
Assets held under capital leases are included in property
and equipment and are charged to depreciation and interest
over the life of the lease. Operating leases are not capitalized
and lease rentals are expensed. Rent expense on buildings,
classified in selling, general and administrative expense,
includes percentage rents that are based on a percentage of
retail sales over stated levels. Total rent expense was
$168 million, $150 million and $143 million in 1999, 1998 and
1997, respectively. Most of the long-term leases include options
to renew, with terms varying from five to 30 years. Certain
leases also include options to purchase the property.
Future minimum lease payments required under non-
cancelable lease agreements existing at January 29, 2000, were:
Future Minimum Lease PaymentsOperating Capital
(millions) Leases Leases
2000 $ 113 $ 22
2001 105 21
2002 96 21
2003 80 19
2004 70 18
After 2004 634 124
Total future minimum lease payments $1,098 $225
Less: interest* (302) (90)
Present value of minimum lease payments $ 796 $135**
*Calculated using the interest rate at inception for each lease (theweighted average interest rate was 8.8 percent).
**Includes current portion of $10 million.
Owned and Leased Store Locations
At year end, owned, leased and “combined” (combina-
tion owned/leased) store locations by operating segment were
as follows:
Owned Leased Combined Total
Target 705 92 115 912
Mervyn’s 160 68 39 267
Department Stores 51 12 1 64
Total 916 172 155 1,243
Employee Stock Ownership Plan
We sponsor a defined contribution employee benefit plan.
Employees who meet certain eligibility requirements can
participate by investing up to 20 percent of their compensation.
We match 100 percent of each employee’s contribution up to
5 percent of respective total compensation. Our contribution
to the plan is invested in the ESOP. Through December 1998,
ESOP preferred shares (401(k) preferred shares) were allocated
to participants. In January 1999, we began providing new
common shares to the ESOP to fund the employer match.
In 1989, we loaned $379 million to the ESOP at a
9 percent interest rate. Proceeds from the loan were then used
by the ESOP to purchase 438,353 shares of 401(k) preferred
shares. The original issue value of the 401(k) preferred shares
of $864.60 per share was guaranteed by the Corporation. The
loan was paid off during 1998 using dividends paid on all
401(k) preferred shares held by the ESOP. In January 2000,
each 401(k) preferred share was converted into 60 shares of
common stock.
Prior to the conversion of all 401(k) preferred shares to
common stock, we were required to exchange at fair value each
401(k) preferred share for 60 shares of common stock and cash,
if any, upon a participant’s termination. The 401(k) preferred
shares were classified as shareholders’ investment to the extent
the preferred shares were permanent equity.
Dividends earned on 401(k) preferred shares held by the
ESOP were $19 million in both 1999 and 1998 and $21 million
in 1997. The dividends on allocated 401(k) preferred shares
were paid to participants’ accounts in additional 401(k)
preferred shares until June 1998. Dividends are now paid to
participants in cash. Benefits expense was $78 million in 1999,
$29 million in 1998 and $17 million in 1997.
33 Target Corporation
n o t e s t o c o n s o l i d a t e d f i n a n c i a l s t a t e m e n t s
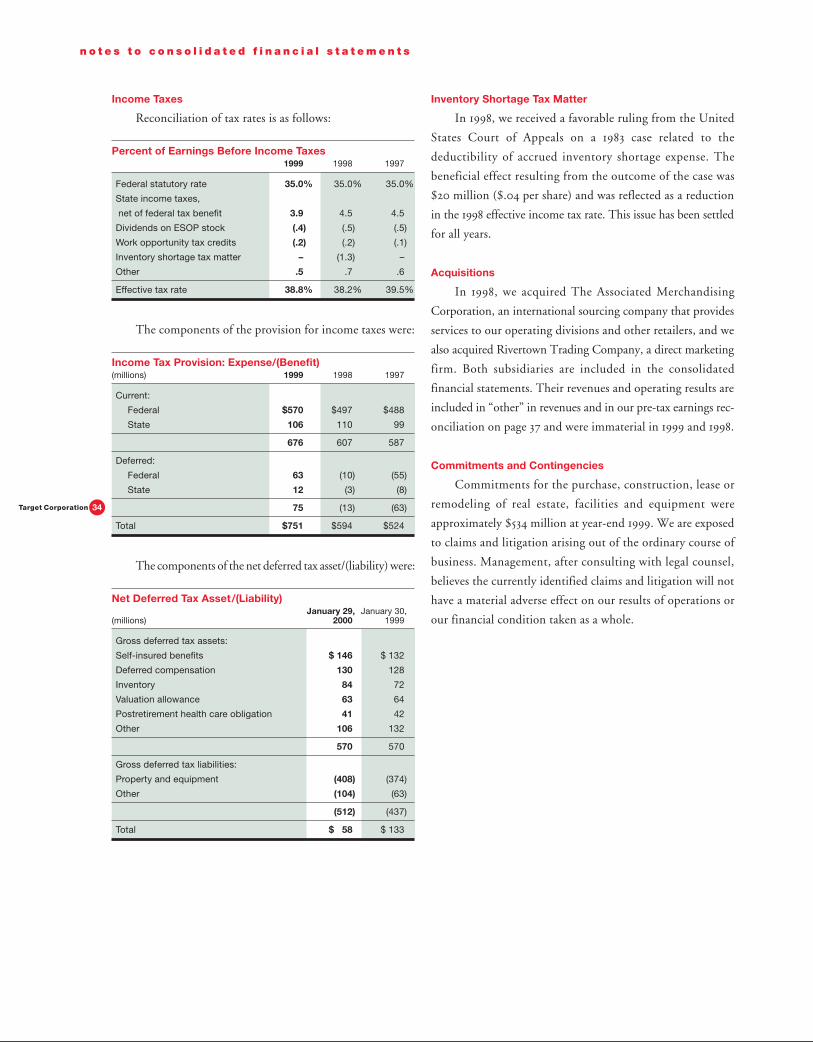
34Target Corporation
Income Taxes
Reconciliation of tax rates is as follows:
Percent of Earnings Before Income Taxes1999 1998 1997
Federal statutory rate 35.0% 35.0% 35.0%
State income taxes,
net of federal tax benefit 3.9 4.5 4.5
Dividends on ESOP stock (.4) (.5) (.5)
Work opportunity tax credits (.2) (.2) (.1)
Inventory shortage tax matter – (1.3) –
Other .5 .7 .6
Effective tax rate 38.8% 38.2% 39.5%
The components of the provision for income taxes were:
Income Tax Provision: Expense/(Benefit)(millions) 1999 1998 1997
Current:
Federal $570 $497 $488
State 106 110 99
676 607 587
Deferred:
Federal 63 (10) (55)
State 12 (3) (8)
75 (13) (63)
Total $751 $594 $524
The components of the net deferred tax asset/(liability) were:
Net Deferred Tax Asset/(Liability)January 29, January 30,
(millions) 2000 1999
Gross deferred tax assets:
Self-insured benefits $ 146 $ 132
Deferred compensation 130 128
Inventory 84 72
Valuation allowance 63 64
Postretirement health care obligation 41 42
Other 106 132
570 570
Gross deferred tax liabilities:
Property and equipment (408) (374)
Other (104) (63)
(512) (437)
Total $ 58 $ 133
Inventory Shortage Tax Matter
In 1998, we received a favorable ruling from the United
States Court of Appeals on a 1983 case related to the
deductibility of accrued inventory shortage expense. The
beneficial effect resulting from the outcome of the case was
$20 million ($.04 per share) and was reflected as a reduction
in the 1998 effective income tax rate. This issue has been settled
for all years.
Acquisitions
In 1998, we acquired The Associated Merchandising
Corporation, an international sourcing company that provides
services to our operating divisions and other retailers, and we
also acquired Rivertown Trading Company, a direct marketing
firm. Both subsidiaries are included in the consolidated
financial statements. Their revenues and operating results are
included in “other” in revenues and in our pre-tax earnings rec-
onciliation on page 37 and were immaterial in 1999 and 1998.
Commitments and Contingencies
Commitments for the purchase, construction, lease or
remodeling of real estate, facilities and equipment were
approximately $534 million at year-end 1999. We are exposed
to claims and litigation arising out of the ordinary course of
business. Management, after consulting with legal counsel,
believes the currently identified claims and litigation will not
have a material adverse effect on our results of operations or
our financial condition taken as a whole.
n o t e s t o c o n s o l i d a t e d f i n a n c i a l s t a t e m e n t s

35 Target Corporation
Quarterly Results (Unaudited)
The same accounting policies are followed in preparing quarterly financial data as are followed in preparing annual data.
The table below summarizes results by quarter for 1999 and 1998:
(millions, except per share data) First Quarter Second Quarter Third Quarter Fourth Quarter Total Year
1999 1998 1999 1998 1999 1998 1999 1998 1999 1998
Total revenues $7,158 6,402 $7,687 6,987 $7,927 7,218 $10,930 10,055 $33,702 30,662
Gross margin (a) $2,182 1,924 $2,376 2,097 $2,441 2,172 $ 3,184 2,925 $10,183 9,118
Net earnings before
extraordinary
charges (c) (d) $ 194 160 $ 228 172 $ 241 183 $ 522 447 $ 1,185 962
Net earnings (b) (c) (d) $ 194 158 $ 224 172 $ 232 182 $ 494 423 $ 1,144 935
Basic earnings
per share (b) (c) (d) (e) $ .43 .35 $ .50 .38 $ .52 .40 $ 1.11 .95 $ 2.55 2.08
Diluted earnings
per share (b) (c) (d) (e) $ .41 .33 $ .48 .36 $ .50 .39 $ 1.06 .90 $ 2.45 1.98
Dividends declared
per share (e) $ .10 .09 $ .10 .09 $ .10 .09 $ .10 .09 $ .40 .36
Common stock price (f)
High $75.75 44.81 $72.44 52.63 $69.50 48.25 $ 75.00 63.75 $ 75.75 63.75
Low $58.75 36.25 $57.94 42.50 $55.25 33.75 $ 60.75 42.69 $ 55.25 33.75
(a) Gross margin is sales less cost of sales. The LIFO provision, included in gross margin, is analyzed each quarter for estimated changes in
year-end inventory levels, markup rates and internally generated retail price indices. A final adjustment is recorded in the fourth quarter for
the difference between the prior quarters’ estimates and the actual total year LIFO provision.
(b) In 1999, second, third and fourth quarter net earnings include extraordinary charges, net of tax, related to the purchase and redemption
of debt of $4 million, $9 million and $28 million ($.01, $.02 and $.06 per basic and diluted share), respectively. In 1998, first, third and fourth
quarter net earnings include extraordinary charges, net of tax of $2 million, $1 million and $24 million ($.01, $.00 and $.05 per basic and
diluted share), respectively.
(c) Third quarter and total year 1999 net earnings before extraordinary charges, net earnings and earnings per share include a mainframe outsourcing
pre-tax charge of $5 million ($.01 per share). Fourth quarter and total year 1998 net earnings before extraordinary charges, net earnings and
earnings per share include a mainframe outsourcing pre-tax charge of $42 million ($.06 per basic and diluted share) and the beneficial effect
of $20 million ($.04 per basic and diluted share) of the favorable outcome of our inventory shortage tax matter.
(d)Third quarter 1998 net earnings include a $3 million securitization pre-tax net loss (less than $.01 per basic and diluted share).
(e) Per share amounts are computed independently for each of the quarters presented. The sum of the quarters may not equal the total year
amount due to the impact of changes in average quarterly shares outstanding and/or rounding caused by the 1998 two-for-one common
share split.
(f) Our common stock is listed on the New York Stock Exchange and Pacific Exchange. At March 17, 2000, there were 13,883 shareholders
of record and the common stock price was $69.50 per share.
n o t e s t o c o n s o l i d a t e d f i n a n c i a l s t a t e m e n t s

36Target Corporation
(dollars in millions, except per share data) 1999 1998 1997 1996 1995(a) 1994
Results of operations
Total revenues $33,702 30,662 27,487 25,092 23,234 21,093
Net earnings (c) (d) (e) $ 1,144 935 751 463 311 434
Financial position data
Total assets $17,143 15,666 14,191 13,389 12,570 11,697
Long-term debt $ 4,521 4,452 4,425 4,808 4,959 4,488
Per common share data (b)
Diluted earnings per share (c) (d) (e) $ 2.45 1.98 1.59 .97 .65 .92
Cash dividend declared $ .40 .36 .33 .32 .30 .28
Other data
Weighted average common shares outstanding (b) 441.3 440.0 436.1 433.3 431.0 429.6
Diluted average common shares outstanding (b) 465.7 467.3 463.7 460.9 458.3 457.4
Capital expenditures $ 1,918 1,657 1,354 1,301 1,522 1,095
Number of stores: Target 912 851 796 736 670 611
Mervyn’s 267 268 269 300 295 286
Department Stores 64 63 65 65 64 63
Total stores 1,243 1,182 1,130 1,101 1,029 960
Total retail square footage (thousands) 138,640 130,172 123,058 117,989 109,091 101,163
Number of employees 281,000 256,000 230,000 218,000 214,000 194,000
(a) Consisted of 53 weeks.
(b)Earnings per share, dividends per share and common shares outstanding reflect our 1998 two-for-one common share split and our 1996 three-
for-one common share split.
(c) Extraordinary charges, net of tax, related to the purchase and redemption of debt were $41 million ($.09 per share) in 1999, $27 million ($.06
per share) in 1998, $51 million ($.11 per share) in 1997 and $11 million ($.02 per share) in 1996.
(d) 1999 includes a mainframe outsourcing pre-tax charge of $5 million ($.01 per share). 1998 included a mainframe outsourcing pre-tax charge
of $42 million ($.06 per share) and the beneficial effect of $20 million ($.04 per share) of the favorable outcome of our inventory shortage tax
matter. 1996 included a real estate repositioning pre-tax charge of $134 million ($.18 per share).
(e) 1998 included a $3 million pre-tax net loss (less than $.01 per share) related to securitization maturity and sale transactions. 1997 included
a $45 million pre-tax gain ($.06 per share) related to securitization sale transactions.
The Summary Financial and Operating Data should be read in conjunction with the Notes to Consolidated Financial Statements throughout
pages 24-37.
s u m m a r y f i n a n c i a l a n d o p e r a t i n g d a t a ( u n a u d i t e d )

37 Target Corporation
Business Segment Comparisons(millions) 1999 1998 1997 1996 1995* 1994
Revenues
Target $26,080 $23,014 $20,298 $17,810 $15,752 $13,574
Mervyn’s 4,099 4,150 4,219 4,350 4,491 4,565
Department Stores 3,074 3,064 2,970 2,932 2,991 2,954
Other 449 434 – – – –
Total revenues $33,702 $30,662 $27,487 $25,092 $23,234 $21,093
Pre-tax segment profit and earnings reconciliation
Target $ 2,022 $ 1,578 $ 1,287 $ 1,048 $ 721 $ 732
Mervyn’s 205 240 280 272 117 198
Department Stores 296 279 240 151 192 259
Total pre-tax segment profit $ 2,523 $ 2,097 $ 1,807 $ 1,471 $ 1,030 $ 1,189
LIFO provision credit/(expense) 7 18 (6) (9) (17) 19
Securitization adjustments:
Gain/(loss) – (3) 45 – – –
Interest equivalent (49) (48) (33) (25) (10) –
Interest expense (393) (398) (416) (442) (442) (426)
Mainframe outsourcing (5) (42) – – – –
Real estate repositioning – – – (134) – –
Other (147) (68) (71) (78) (60) (68)
Earnings before income taxes and extraordinary charges $ 1,936 $ 1,556 $ 1,326 $ 783 $ 501 $ 714
Assets
Target $12,048 $10,475 $ 9,487 $ 8,257 $ 7,330 $ 6,247
Mervyn’s 2,248 2,339 2,281 2,658 2,776 2,917
Department Stores 2,149 2,123 2,188 2,296 2,309 2,392
Other 698 729 235 178 155 141
Total assets $17,143 $15,666 $14,191 $13,389 $12,570 $11,697
Depreciation and amortization
Target $ 567 $ 496 $ 437 $ 377 $ 328 $ 294
Mervyn’s 138 138 126 151 150 145
Department Stores 133 135 128 119 113 108
Other 16 11 2 3 3 1
Total depreciation and amortization $ 854 $ 780 $ 693 $ 650 $ 594 $ 548
Capital expenditures
Target $ 1,665 $ 1,352 $ 1,155 $ 1,048 $ 1,067 $ 842
Mervyn’s 108 169 72 79 273 146
Department Stores 124 127 124 173 161 96
Other 21 9 3 1 21 11
Total capital expenditures $ 1,918 $ 1,657 $ 1,354 $ 1,301 $ 1,522 $ 1,095
Segment EBITDA
Target $ 2,589 $ 2,074 $ 1,724 $ 1,425 $ 1,049 $ 1,026
Mervyn’s 343 378 406 423 267 343
Department Stores 429 414 368 270 305 367
Total segment EBITDA $ 3,361 $ 2,866 $ 2,498 $ 2,118 $ 1,621 $ 1,736
Net assets**
Target $ 8,413 $ 7,302 $ 6,602 $ 5,711 $ 5,109 $ 4,269
Mervyn’s 1,908 2,017 2,019 2,268 2,484 2,363
Department Stores 1,795 1,785 1,896 1,879 1,940 1,812
Other 428 514 169 53 96 72
Total net assets $12,544 $11,618 $10,686 $ 9,911 $ 9,629 $ 8,516
Each operating segment’s assets and operating results include the retained securitized receivables held by Target Receivables Corporation and
Retailers National Bank, as well as related income and expense.
*Consisted of 53 weeks
** Net assets represent total assets (including sold securitized receivables) less non-interest bearing current liabilities.
n o t e s t o c o n s o l i d a t e d f i n a n c i a l s t a t e m e n t s

38Target Corporation
Report of Independent Auditors
Board of Directors and Shareholders
Target Corporation
We have audited the accompanying consolidated statements
of financial position of Target Corporation and subsidiaries as of
January 29, 2000 and January 30, 1999 and the related consoli-
dated results of operations, cash flows and shareholders’
investment for each of the three years in the period ended January
29, 2000. These financial statements are the responsibility of the
Corporation’s management. Our responsibility is to express an
opinion on these financial statements based on our audits.
We conducted our audits in accordance with auditing stan-
dards generally accepted in the United States. Those standards
require that we plan and perform the audit to obtain reasonable
assurance about whether the financial statements are free of
material misstatement. An audit includes examining, on a
test basis, evidence supporting the amounts and disclosures in
the financial statements. An audit also includes assessing the
accounting principles used and significant estimates made by
management, as well as evaluating the overall financial statement
presentation. We believe that our audits provide a reasonable basis
for our opinion.
In our opinion, the financial statements referred to above
present fairly, in all material respects, the consolidated financial
position of Target Corporation and subsidiaries at January 29,
2000 and January 30, 1999 and the consolidated results of their
operations and their cash flows for each of the three years in the
period ended January 29, 2000 in conformity with accounting
principles generally accepted in the United States.
Minneapolis, Minnesota
February 28, 2000
Report of Management
Management is responsible for the consistency, integrity and
presentation of the information in the Annual Report. The con-
solidated financial statements and other information presented in
this Annual Report have been prepared in accordance with
accounting principles generally accepted in the United States and
include necessary judgments and estimates by management.
To fulfill our responsibility, we maintain comprehensive sys-
tems of internal control designed to provide reasonable assurance
that assets are safeguarded and transactions are executed in accor-
dance with established procedures. The concept of reasonable
assurance is based upon a recognition that the cost of the controls
should not exceed the benefit derived. We believe our systems of
internal control provide this reasonable assurance.
The Board of Directors exercises its oversight role with
respect to the Corporation’s systems of internal control primarily
through its Audit Committee, which is comprised of five inde-
pendent directors. The Committee oversees the Corporation’s
systems of internal control, accounting practices, financial
reporting and audits to assess whether their quality, integrity
and objectivity are sufficient to protect shareholders’ investments.
The Committee’s report appears on this page.
In addition, our consolidated financial statements have
been audited by Ernst & Young LLP, independent auditors,
whose report also appears on this page. As a part of its audit,
Ernst & Young LLP develops and maintains an understanding
of the Corporation’s internal accounting controls and conducts
such tests and employs such procedures as it considers necessary
to render its opinion on the consolidated financial statements.
Their report expresses an opinion as to the fair presentation, in
all material respects, of the consolidated financial statements
and is based on independent audits made in accordance with
auditing standards generally accepted in the United States.
Robert J. Ulrich Douglas A. Scovanner
Chairman of the Board and Executive Vice President and
Chief Executive Officer Chief Financial Officer
February 28, 2000
Report of Audit Committee
The Audit Committee met two times during fiscal 1999 to
review the overall audit scope, plans for internal and independ-
ent audits, the Corporation’s systems of internal control, emerging
accounting issues, officer and director expenses, audit fees and
retirement plans. The Committee also met individually with the
independent auditors, without management present, to discuss
the results of their audits. The Committee encourages the inter-
nal and independent auditors to communicate closely with the
Committee.
Audit Committee results were reported to the full Board of
Directors and the Corporation’s annual financial statements were
reviewed and approved by the Board of Directors before issuance.
The Audit Committee also recommended to the Board of
Directors that the independent auditors be reappointed for fiscal
2000, subject to the approval of the shareholders at the annual
meeting.
February 28, 2000

39 Target Corporation
d i r e c t o r s a n d m a n a g e m e n t
Directors
Livio D. DeSimoneChairman and Chief Executive Officer, 3M(diversified manufacturer) (1) (5) (6)
Roger A. EnricoChairman and Chief Executive Officer,PepsiCo, Inc.(domestic and internationalbeverage and food company)(1) (2) (3)
William W. GeorgeChairman and Chief Executive Officer,Medtronic, Inc.(therapeutic medical devicecompany) (1) (2) (4)
Michele J. HooperPresident and Chief Executive Officer, Voyager Expanded Learning(educational developmentcompany) (1) (2) (6)
James A. JohnsonChairman and Chief Executive Officer,Johnson Capital Partners(private investmentcompany) (1) (3) (4) (5)
Richard M. KovacevichPresident and Chief Executive Officer,Wells Fargo & Company(banking and financialservices company) (1) (2) (6)
Susan A. McLaughlinPresident, ConsumerServices, BellSouthTelecommunications, Inc. (communications servicescompany) (1) (2) (4)
Anne M. MulcahyExecutive Vice President andPresident, General Markets Operations,Xerox Corporation(document managementcompany) (1) (4) (5)
Stephen W. SangerChairman and Chief Executive Officer,General Mills, Inc.(consumer food productscompany) (1) (3) (5) (6)
George W. TamkeFormer Vice Chairman andCo-Chief Executive Officer,Emerson Electric Co.(industrial manufacturer) (1)
Solomon D. TrujilloChairman, President andChief Executive Officer,US WEST, Inc. (telecommunicationscompany) (1) (3) (4) (5)
Robert J. UlrichChairman and Chief Executive Officer,Target Corporation andTarget Stores (1)
(1) Executive Committee(2) Audit Committee(3) Compensation Committee(4) Corporate Responsibility
Committee(5) Finance Committee(6) Nominating Committee
Officers
Robert J. Ulrich*Chairman and Chief Executive Officer,Target Corporation andTarget Stores
Kenneth B. Woodrow*Vice Chairman, Target Corporation
Linda L. Ahlers*President, Dayton’s Marshall Field’s and Hudson’s
Bart Butzer*President, Mervyn’s
Gregg W. Steinhafel*President, Target Stores
Gerald L. Storch*President, Financial Servicesand New Businesses, Target Corporation
Larry V. Gilpin*Executive Vice President,Team, Guest andCommunity Relations, Target Corporation andTarget Stores
James T. Hale*Executive Vice President,General Counsel andCorporate Secretary, Target Corporation
John E. Pellegrene*Executive Vice President,Marketing, Target Corporation andTarget Stores
Douglas A. Scovanner*Executive Vice President,Finance and Chief Financial Officer, Target Corporation andTarget Stores
Ertugrul Tuzcu*Executive Vice President,Store Operations, Dayton’s Marshall Field’s andHudson’s
Todd V. Blackwell*Senior Vice President, Stores,Mervyn’s
John D. Griffith*Senior Vice President,Property Development,Target Corporation
Maureen W. Kyer*Senior Vice President,Merchandising, Mervyn’s
Paul L. Singer*Senior Vice President,Technology Services andChief Information Officer,Target Corporation
Gail J. DornVice President,Communications andCommunity Relations,Target Corporation
Nate K. GarvisVice President, Government Affairs, Target Corporation
Susan D. KahnVice President, Investor Relations, Target Corporation
Stephen C. KowalkeVice President and Treasurer,Target Corporation
Jane P. WindmeierVice President, Finance,Target Corporation andTarget Stores
Richard J. KuzmichPresident and Chief Executive Officer, Associated Merchandising Corp.
Dale NitschkePresident, target.direct
Erica C. StreetPresident, Target Brands, Inc.
Jack N. ReifAssistant Treasurer, Target Corporation
Sara J. RossAssistant Treasurer, Target Corporation
*Executive Officer and CorporateOperating Committee Member

40Target Corporation
s h a r e h o l d e r i n f o r m a t i o n
Annual Meeting
The Annual Meeting of Shareholders is scheduled for
May 17, 2000, at 9:30 a.m. CDT at The Children’s Theatre,
2400 Third Avenue South, Minneapolis, Minnesota.
Shareholder Information
Quarterly and annual shareholder information, including
the Form 10-Q and Form 10-K Annual Report, which are
filed with the Securities and Exchange Commission, is
available at no charge to shareholders. To obtain copies of
these materials, you may call 612-370-6736, send an email to
[email protected], or write to:
Vice President, Investor Relations
Target Corporation
777 Nicollet Mall
Minneapolis, MN 55402
Our quarterly earnings release conference calls are webcast
on the Internet through our website www.targetcorp.com. For
additional information call investor relations at 612-370-6736.
Other information about Target Corporation is available
at the same website.
Sales Information
Comments regarding the company’s sales results are
provided periodically throughout the year on a recorded
telephone message. You may access this message by calling
612-370-6500.
Direct Stock Purchase/Dividend Reinvestment Plan
First Chicago Trust Company of New York administers
a direct service investment plan that allows interested investors
to purchase Target Corporation stock directly, rather than
through a broker, and become a registered shareholder of
the Company. The program offers many features including
dividend reinvestment. For detailed information regarding
this program, call First Chicago Trust toll free at 888-268-0203,
or write to:
The DirectSERVICE Investment Program
c/o First Chicago Trust Company
P.O. Box 2598
Jersey City, NJ 07303-2598
Transfer Agent, Registrar and Dividend Disbursing Agent
First Chicago Trust Company of New York, a division
of Equiserve
Trustee, Employee Savings 401(k) and Pension Plans
State Street Bank and Trust Company
Stock Exchange Listings
Trading symbol TGT
New York Stock Exchange and Pacific Exchange
Shareholder Assistance
For assistance regarding individual stock records, lost
certificates, name or address changes, dividend or tax ques-
tions, call First Chicago Trust at 800-317-4445, or write to:
First Chicago Trust Company of New York
P.O. Box 2500
Jersey City, NJ 07303-2500.
Co
nc
ep
t a
nd
de
sig
n:
Lit
tle
& C
om
pa
ny,
Min
ne
ap
oli
s
Target, The Bullseye Design, SuperTarget, Target Greatland, Dayton’s, Marshall Field’s, Hudson’s, target.com, target.direct, Target House, Archer Farms,
Expect More. Pay Less., Sign of the Times, Take Charge of Education, Target Guest Card and Project Imagine are trademarks of Target Brands, Inc. Mervyn’s,
Hillard & Hanson, Big Brands. Small Prices. and ChildSpree are trademarks of Mervyn’s Brands, Inc. Calphalon is a trademark of Calphalon Corporation.
Discovery Channel is a trademark of Discovery Communications, Inc. Fash Bash is a trademark of The Founders Society Detroit Institute of Arts.
Martex is a trademark of Westpoint-Pepperell Enterprises, Inc. Playmobil is a trademark of Geobra-Brandstatter GMBH & Co. Sanrio is a trademark of
Sanrio Company, Ltd. Stiffel is a trademark of The Stiffel Company.

Taking big steps, growing in size, moving forward.

777 Nicollet Mall, Minneapolis, Minnesota 55402, 612.370.6948, www.targetcorp.comTarget Stores • Dayton’s • Marshall Field’s • Hudson’s • Mervyn’s California • AMC • target.direct • DCI • Target Financial Services
© 2
00
0 Ta
rge
t Co
rpo
ratio
n. T
he
Bu
llseye
is a re
giste
red
trad
em
ark
of Ta
rge
t Bra
nd
s,Inc
. All rig
hts re
serve
d.


![A Review of Milestones in the History of GUI Prototyping Tools€¦ · [Renear et al. 1999] –Textual –Symbols –Dessin –Sessions –Modification Target Context Body Target](https://static.fdocuments.us/doc/165x107/5f46ad03554e1163b371e900/a-review-of-milestones-in-the-history-of-gui-prototyping-tools-renear-et-al-1999.jpg)