WDRC Annual Report 2010-2011
114
ANNUAL REPORT 1 JULY 2010 TO 30 JUNE 2011
-
Upload
western-downs-regional-council -
Category
Documents
-
view
215 -
download
2
description
WDRC Annual Report 2010-2011
Transcript of WDRC Annual Report 2010-2011
AnnuAl RepoRt1 July 2010 to 30 June 2011
AnnuAl RepoRt 1 JULY 2010 TO 30 JUNE 2011 PA G E 2
tAble of Contents
Mayor’s Foreword 3
CEO’s Report 4
Distribution 5
Feedback 5
Local Communities - Local Service 5
About Our Region 6
Vision 6
Guiding Principles 7
Positioning Statement 7
Your Councillors 8
Executive Team 9
Council Meetings 10
Councillors Expenses Reimbursement Policy 11
Councillor Conduct Complaints 12
Administration Action Complaints 13
Internal Audit 14
Registers 15
Summary of Strategic Activities Registers 16
SA 1 People and Communities 17
SA 2 Growth and Opportunity 23
SA 3 Planning for Liveability 26
SA 4 Our Environment 32
SA 5 Utility Services 34
SA 6 Infrastructure 39
SA 7 Empowering Our Team 45
SA 8 Business Systems and Technology 49
Appendices 57
1. Councillor Expenses Reimbursement Policy
2. Debt Policy
3. Audited Financial Statements For Period 1 July 2010 to 30 June 2011
AnnuAl RepoRt 1 JULY 2010 TO 30 JUNE 2011 PA G E 3
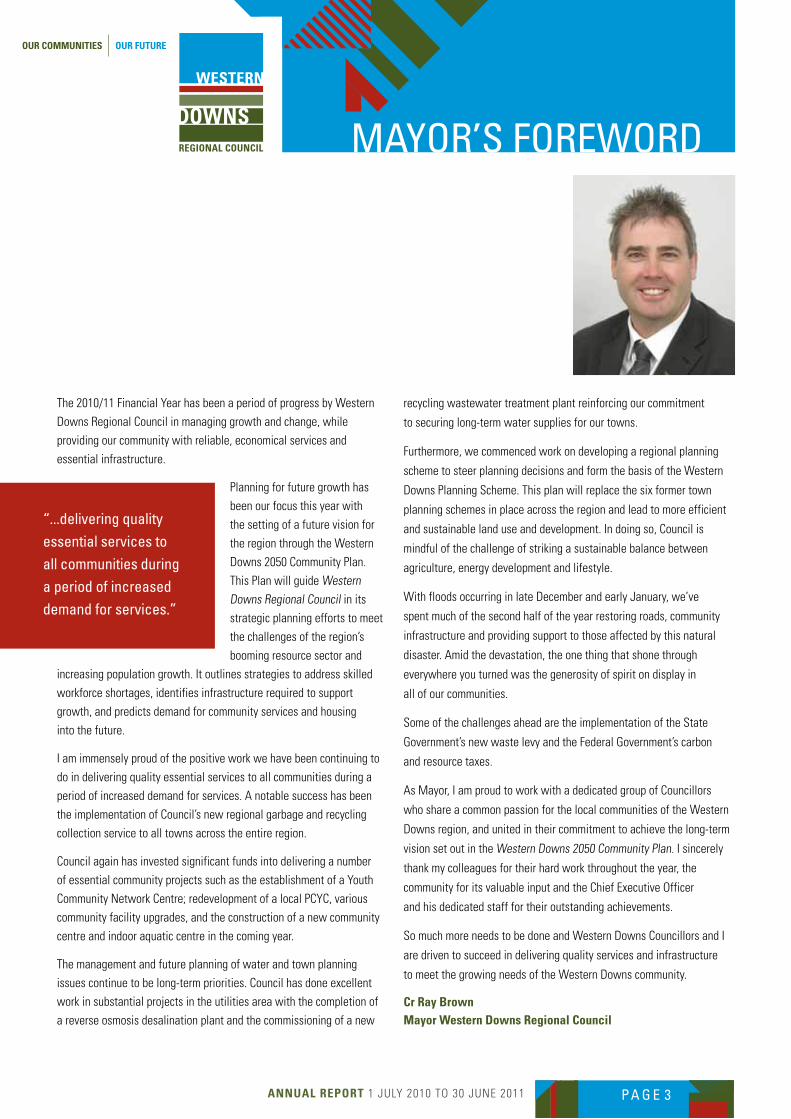
MAyoR’s foRewoRd
The 2010/11 Financial Year has been a period of progress by Western
Downs Regional Council in managing growth and change, while
providing our community with reliable, economical services and
essential infrastructure.
Planning for future growth has
been our focus this year with
the setting of a future vision for
the region through the Western
Downs 2050 Community Plan.
This Plan will guide Western
Downs Regional Council in its
strategic planning efforts to meet
the challenges of the region’s
booming resource sector and
increasing population growth. It outlines strategies to address skilled
workforce shortages, identifies infrastructure required to support
growth, and predicts demand for community services and housing
into the future.
I am immensely proud of the positive work we have been continuing to
do in delivering quality essential services to all communities during a
period of increased demand for services. A notable success has been
the implementation of Council’s new regional garbage and recycling
collection service to all towns across the entire region.
Council again has invested significant funds into delivering a number
of essential community projects such as the establishment of a Youth
Community Network Centre; redevelopment of a local PCYC, various
community facility upgrades, and the construction of a new community
centre and indoor aquatic centre in the coming year.
The management and future planning of water and town planning
issues continue to be long-term priorities. Council has done excellent
work in substantial projects in the utilities area with the completion of
a reverse osmosis desalination plant and the commissioning of a new
recycling wastewater treatment plant reinforcing our commitment
to securing long-term water supplies for our towns.
Furthermore, we commenced work on developing a regional planning
scheme to steer planning decisions and form the basis of the Western
Downs Planning Scheme. This plan will replace the six former town
planning schemes in place across the region and lead to more efficient
and sustainable land use and development. In doing so, Council is
mindful of the challenge of striking a sustainable balance between
agriculture, energy development and lifestyle.
With floods occurring in late December and early January, we’ve
spent much of the second half of the year restoring roads, community
infrastructure and providing support to those affected by this natural
disaster. Amid the devastation, the one thing that shone through
everywhere you turned was the generosity of spirit on display in
all of our communities.
Some of the challenges ahead are the implementation of the State
Government’s new waste levy and the Federal Government’s carbon
and resource taxes.
As Mayor, I am proud to work with a dedicated group of Councillors
who share a common passion for the local communities of the Western
Downs region, and united in their commitment to achieve the long-term
vision set out in the Western Downs 2050 Community Plan. I sincerely
thank my colleagues for their hard work throughout the year, the
community for its valuable input and the Chief Executive Officer
and his dedicated staff for their outstanding achievements.
So much more needs to be done and Western Downs Councillors and I
are driven to succeed in delivering quality services and infrastructure
to meet the growing needs of the Western Downs community.
Cr Ray Brown Mayor Western Downs Regional Council
“...delivering quality essential services to all communities during a period of increased demand for services.”
AnnuAl RepoRt 1 JULY 2010 TO 30 JUNE 2011 PA G E 4
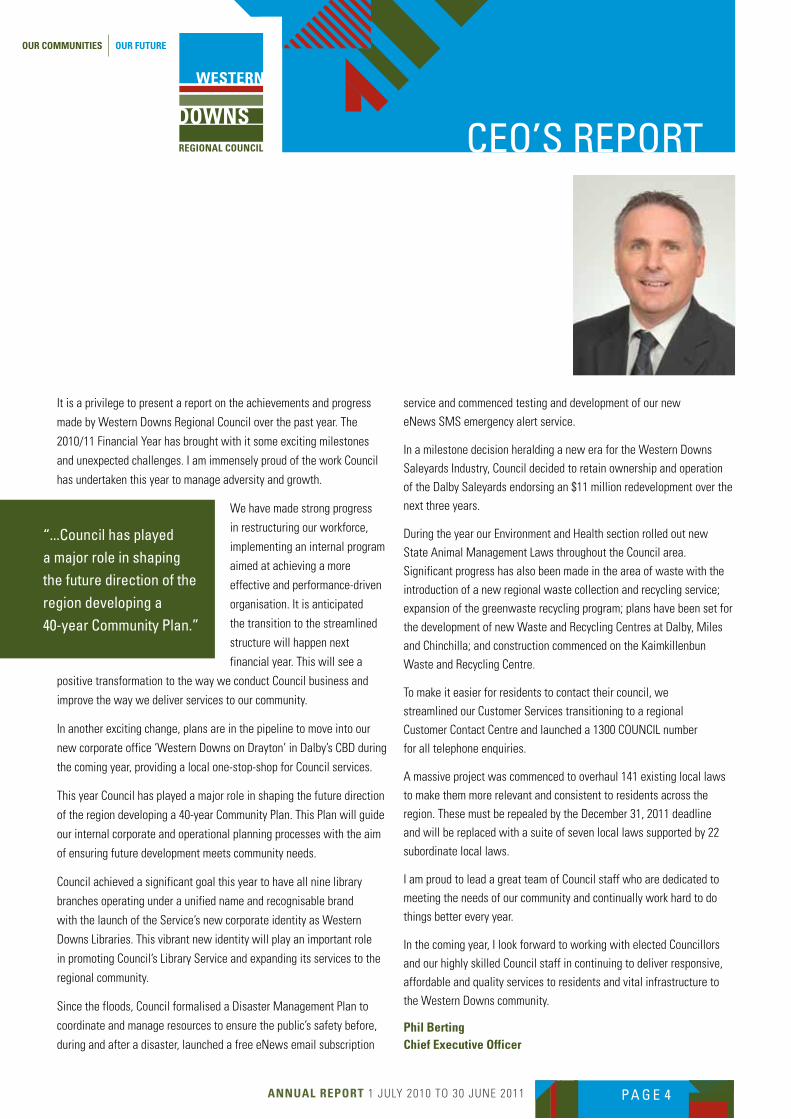
Ceo’s RepoRt
It is a privilege to present a report on the achievements and progress
made by Western Downs Regional Council over the past year. The
2010/11 Financial Year has brought with it some exciting milestones
and unexpected challenges. I am immensely proud of the work Council
has undertaken this year to manage adversity and growth.
We have made strong progress
in restructuring our workforce,
implementing an internal program
aimed at achieving a more
effective and performance-driven
organisation. It is anticipated
the transition to the streamlined
structure will happen next
financial year. This will see a
positive transformation to the way we conduct Council business and
improve the way we deliver services to our community.
In another exciting change, plans are in the pipeline to move into our
new corporate office ‘Western Downs on Drayton’ in Dalby’s CBD during
the coming year, providing a local one-stop-shop for Council services.
This year Council has played a major role in shaping the future direction
of the region developing a 40-year Community Plan. This Plan will guide
our internal corporate and operational planning processes with the aim
of ensuring future development meets community needs.
Council achieved a significant goal this year to have all nine library
branches operating under a unified name and recognisable brand
with the launch of the Service’s new corporate identity as Western
Downs Libraries. This vibrant new identity will play an important role
in promoting Council’s Library Service and expanding its services to the
regional community.
Since the floods, Council formalised a Disaster Management Plan to
coordinate and manage resources to ensure the public’s safety before,
during and after a disaster, launched a free eNews email subscription
service and commenced testing and development of our new
eNews SMS emergency alert service.
In a milestone decision heralding a new era for the Western Downs
Saleyards Industry, Council decided to retain ownership and operation
of the Dalby Saleyards endorsing an $11 million redevelopment over the
next three years.
During the year our Environment and Health section rolled out new
State Animal Management Laws throughout the Council area.
Significant progress has also been made in the area of waste with the
introduction of a new regional waste collection and recycling service;
expansion of the greenwaste recycling program; plans have been set for
the development of new Waste and Recycling Centres at Dalby, Miles
and Chinchilla; and construction commenced on the Kaimkillenbun
Waste and Recycling Centre.
To make it easier for residents to contact their council, we
streamlined our Customer Services transitioning to a regional
Customer Contact Centre and launched a 1300 COUNCIL number
for all telephone enquiries.
A massive project was commenced to overhaul 141 existing local laws
to make them more relevant and consistent to residents across the
region. These must be repealed by the December 31, 2011 deadline
and will be replaced with a suite of seven local laws supported by 22
subordinate local laws.
I am proud to lead a great team of Council staff who are dedicated to
meeting the needs of our community and continually work hard to do
things better every year.
In the coming year, I look forward to working with elected Councillors
and our highly skilled Council staff in continuing to deliver responsive,
affordable and quality services to residents and vital infrastructure to
the Western Downs community.
Phil Berting Chief executive officer
“...Council has played a major role in shaping the future direction of the region developing a 40-year Community plan.”
AnnuAl RepoRt 1 JULY 2010 TO 30 JUNE 2011 PA G E 5
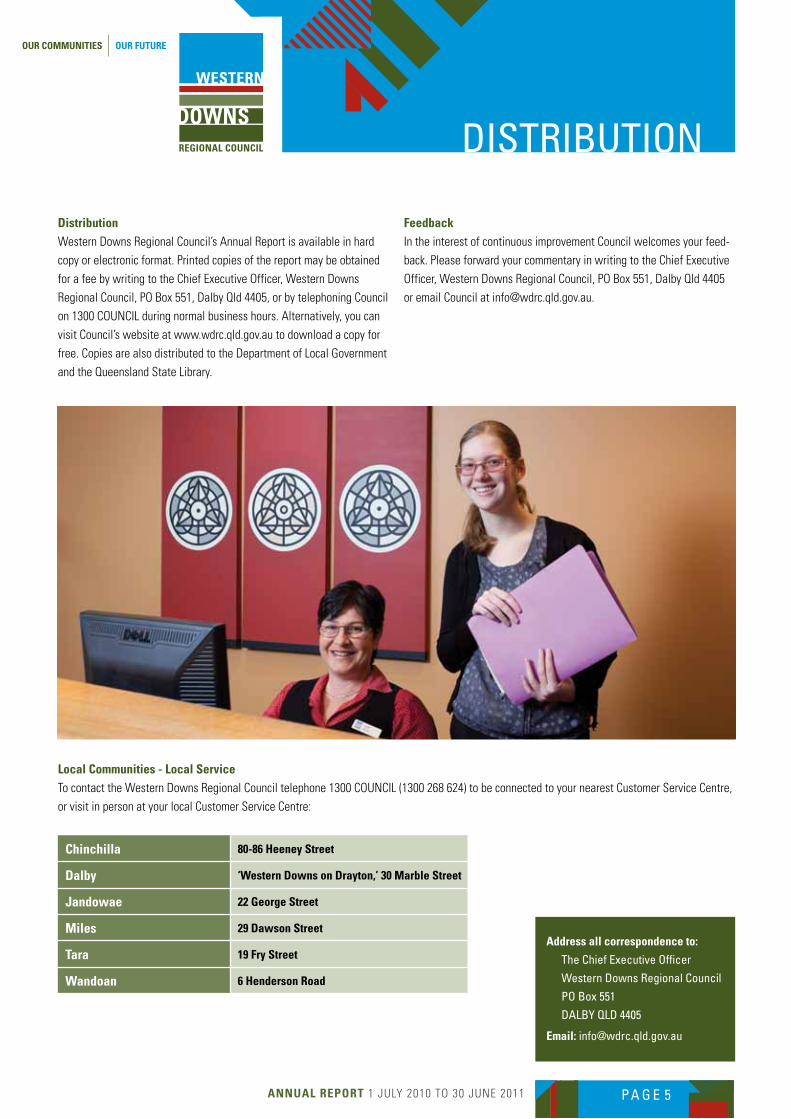
dIstRIbutIon
DistributionWestern Downs Regional Council’s Annual Report is available in hard
copy or electronic format. Printed copies of the report may be obtained
for a fee by writing to the Chief Executive Officer, Western Downs
Regional Council, PO Box 551, Dalby Qld 4405, or by telephoning Council
on 1300 COUNCIL during normal business hours. Alternatively, you can
visit Council’s website at www.wdrc.qld.gov.au to download a copy for
free. Copies are also distributed to the Department of Local Government
and the Queensland State Library.
local Communities - local Service To contact the Western Downs Regional Council telephone 1300 COUNCIL (1300 268 624) to be connected to your nearest Customer Service Centre,
or visit in person at your local Customer Service Centre:
FeedbackIn the interest of continuous improvement Council welcomes your feed-
back. Please forward your commentary in writing to the Chief Executive
Officer, Western Downs Regional Council, PO Box 551, Dalby Qld 4405
or email Council at [email protected].
Chinchilla 80-86 Heeney Street
Dalby ‘Western Downs on Drayton,’ 30 Marble Street
Jandowae 22 George Street
Miles 29 Dawson Street
tara 19 Fry Street
Wandoan 6 Henderson Road
Address all correspondence to:
the Chief executive officer
western downs Regional Council
po box 551
dAlby Qld 4405
email: [email protected]
AnnuAl RepoRt 1 JULY 2010 TO 30 JUNE 2011 PA G E 6
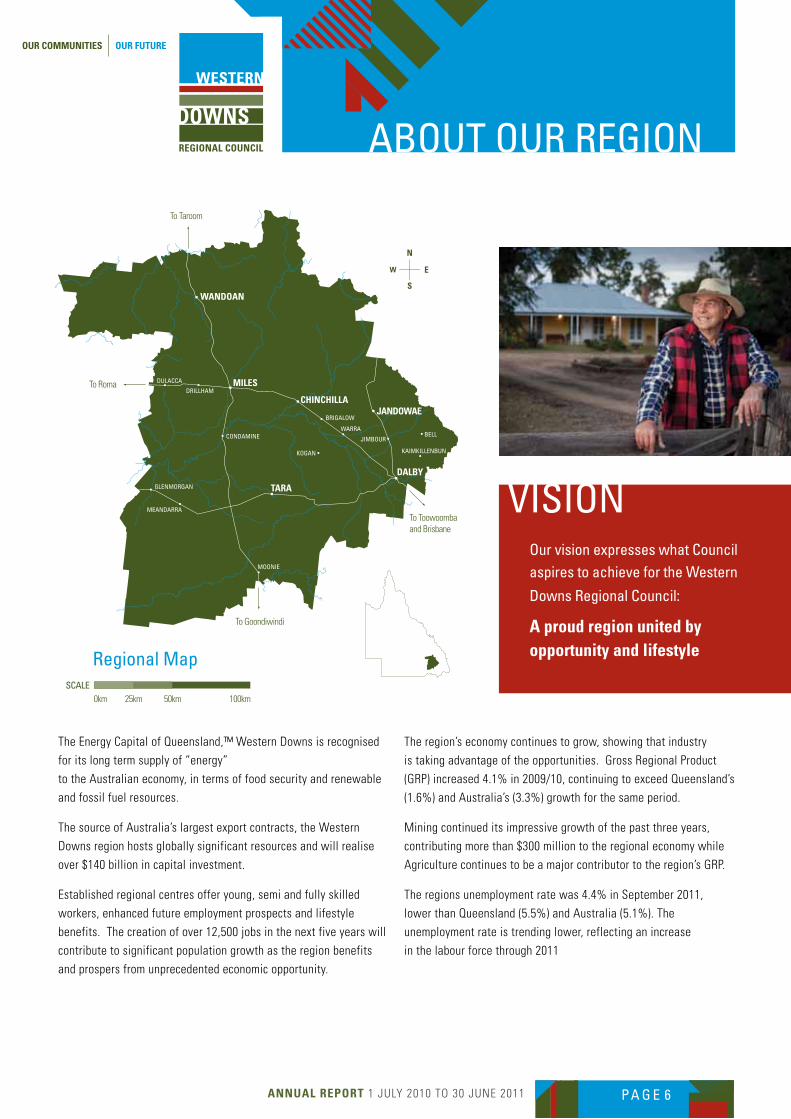
About ouR RegIon
The Energy Capital of Queensland,™ Western Downs is recognised
for its long term supply of “energy”
to the Australian economy, in terms of food security and renewable
and fossil fuel resources.
The source of Australia’s largest export contracts, the Western
Downs region hosts globally significant resources and will realise
over $140 billion in capital investment.
Established regional centres offer young, semi and fully skilled
workers, enhanced future employment prospects and lifestyle
benefits. The creation of over 12,500 jobs in the next five years will
contribute to significant population growth as the region benefits
and prospers from unprecedented economic opportunity.
The region’s economy continues to grow, showing that industry
is taking advantage of the opportunities. Gross Regional Product
(GRP) increased 4.1% in 2009/10, continuing to exceed Queensland’s
(1.6%) and Australia’s (3.3%) growth for the same period.
Mining continued its impressive growth of the past three years,
contributing more than $300 million to the regional economy while
Agriculture continues to be a major contributor to the region’s GRP.
The regions unemployment rate was 4.4% in September 2011,
lower than Queensland (5.5%) and Australia (5.1%). The
unemployment rate is trending lower, reflecting an increase
in the labour force through 2011
VIsIonour vision expresses what Councilaspires to achieve for the western
downs Regional Council:
A proud region united byopportunity and lifestyle
ANNUAL REPORT 1 JULY 2009 TO 30 JUNE 2010
ABOUT OUR REGION
PA G E 6
Western Downs Regional Council is benefitting from the emerging resources industry of the Surat Basin, currently dominated by Coal Seam Gas production in the lead up to LNG export.
Western Downs is a region at the cutting edge of environmental, economic and social change, a rural economy punching above its weight. People are being attracted to the region for the mix of employment opportunity, clean environment and country lifestyle. The region’s population continues to defy history, increasing to 31,897 in June 2010, a 1.3 % increase on 2009.
The region’s economy also continues to grow, despite the negative global environment. Gross Regional Product was 1.875 billion up 17.4% in 2008/09; almost double the growth of Queensland. Mining led this extraordinary growth, increasing its GRP by over 400% to overtake Agriculture, Fishing & Forestry as the largest regional
contributor to GRP. Western Downs Regional LGA contributed approximately 0.8% of the Gross State product for Queensland in 2008/09.
Unemployment also defied the State and National averages. The regions unemployment rate was 3.3% in June 2010, still well below Queensland (5.4%) and Australia (5.2%). In the same period of time, the labour force has continued to grow at approximately 5% per annum, a result expected given the investment activity through the region.
Dwelling approvals for the Western Downs increased by over 170% in the year ending December 2009. The majority of activity was for separate houses and came in the second half of the year, building towards record approvals for 2009/10 financial year.
MOONIE
MEANDARRA
GLENMORGAN
DRILLHAM
DULACCA
KAIMKILLENBUN
JIMBOURBELLCONDAMINE
KOGAN
WARRA
BRIGALOW
Our vision expresses what Council
aspires to achieve for the Western
Downs Regional Council:
A proud region united by opportunity and lifestyle
VISION
AnnuAl RepoRt 1 JULY 2010 TO 30 JUNE 2011 PA G E 7
guIdIng pRInCIples
As Councillors and staff of Western Downs Regional Council we
are committed to the following principles as a guide to our actions
as representatives of our region:
• Investinourpeople
• Thinkregionally-deliverlocally
• Facilitategrowth-manageimpact
• Excellenceinaffordableservicedelivery
• Consistentandinformeddecisions
As a team we will work together to achieve:
• Qualityoutcomesforourcommunities
• Aninclusiveteamculture
• Prideinourorganisation
• Continuousimprovement
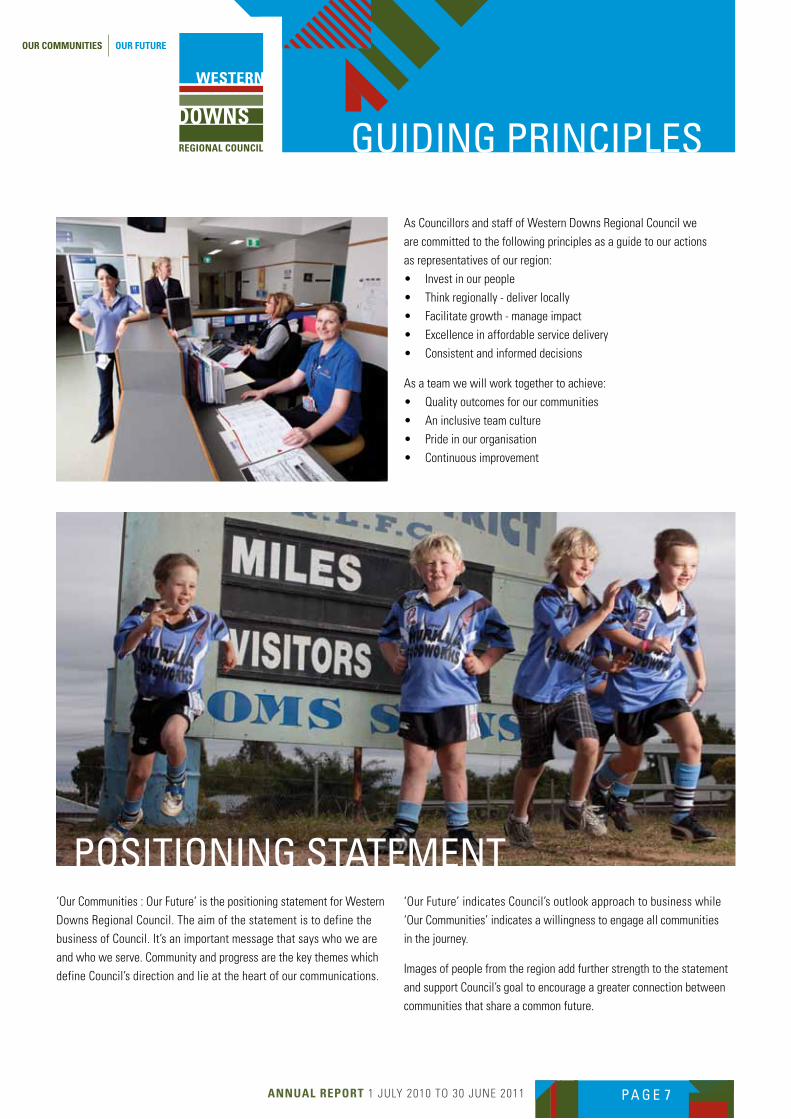
posItIonIng stAteMent‘Our Communities : Our Future’ is the positioning statement for Western
Downs Regional Council. The aim of the statement is to define the
business of Council. It’s an important message that says who we are
and who we serve. Community and progress are the key themes which
define Council’s direction and lie at the heart of our communications.
‘Our Future’ indicates Council’s outlook approach to business while
‘Our Communities’ indicates a willingness to engage all communities
in the journey.
Images of people from the region add further strength to the statement
and support Council’s goal to encourage a greater connection between
communities that share a common future.
AnnuAl RepoRt 1 JULY 2010 TO 30 JUNE 2011 PA G E 8
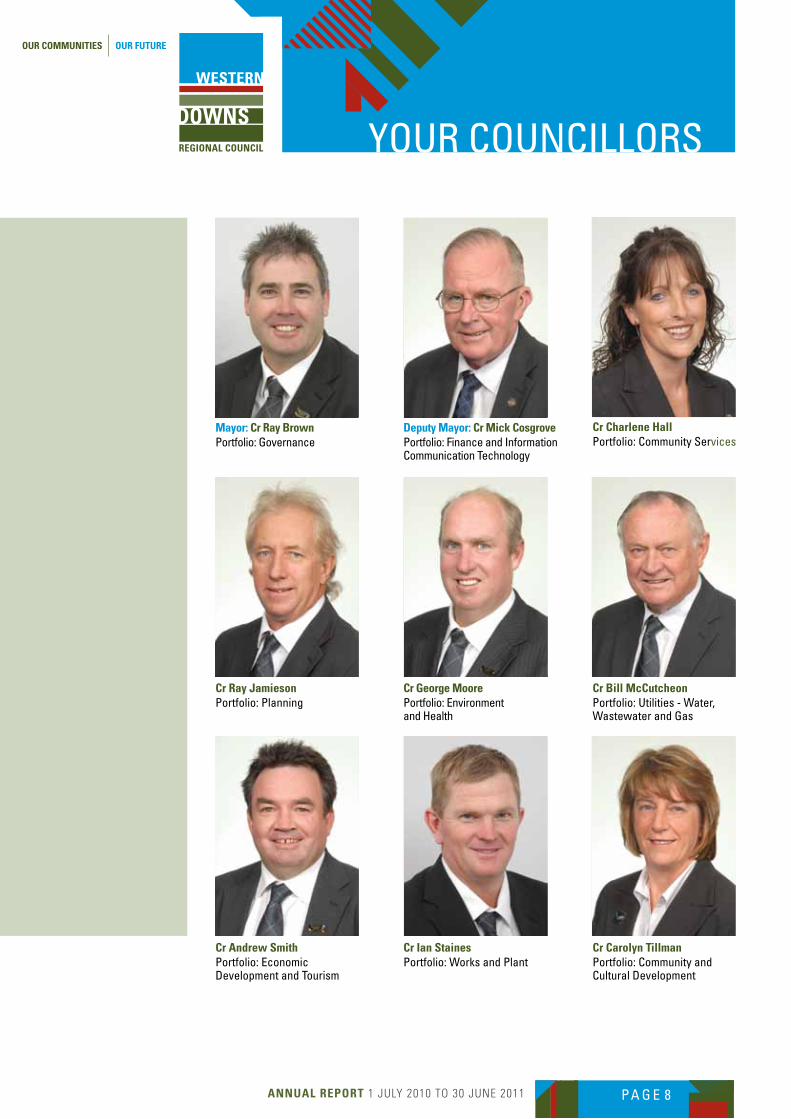
youR CounCIlloRs
Mayor: Cr Ray Brownportfolio: governance
Cr Andrew Smithportfolio: economic development and tourism
Deputy Mayor: Cr Mick Cosgroveportfolio: finance and InformationCommunication technology
Cr Ray Jamiesonportfolio: planning
Cr Ian Stainesportfolio: works and plant
Cr Bill McCutcheonportfolio: utilities - water,wastewater and gas
Cr Carolyn tillmanportfolio: Community and Cultural development
Cr Charlene Hall portfolio: Community services
Cr George Mooreportfolio: environment and Health
AnnuAl RepoRt 1 JULY 2010 TO 30 JUNE 2011 PA G E 9
exeCutIVe teAM
Phil BertingChief executive officer
lee Vohland director finance and Information and Communication technology
ed Hoffmanndirector Community services
Stephen Hegedusdirector organisational services
Graham Cookdirector engineering services
Ian o’Donnelldirector planning and environment
AnnuAl RepoRt 1 JULY 2010 TO 30 JUNE 2011 PA G E 1 0
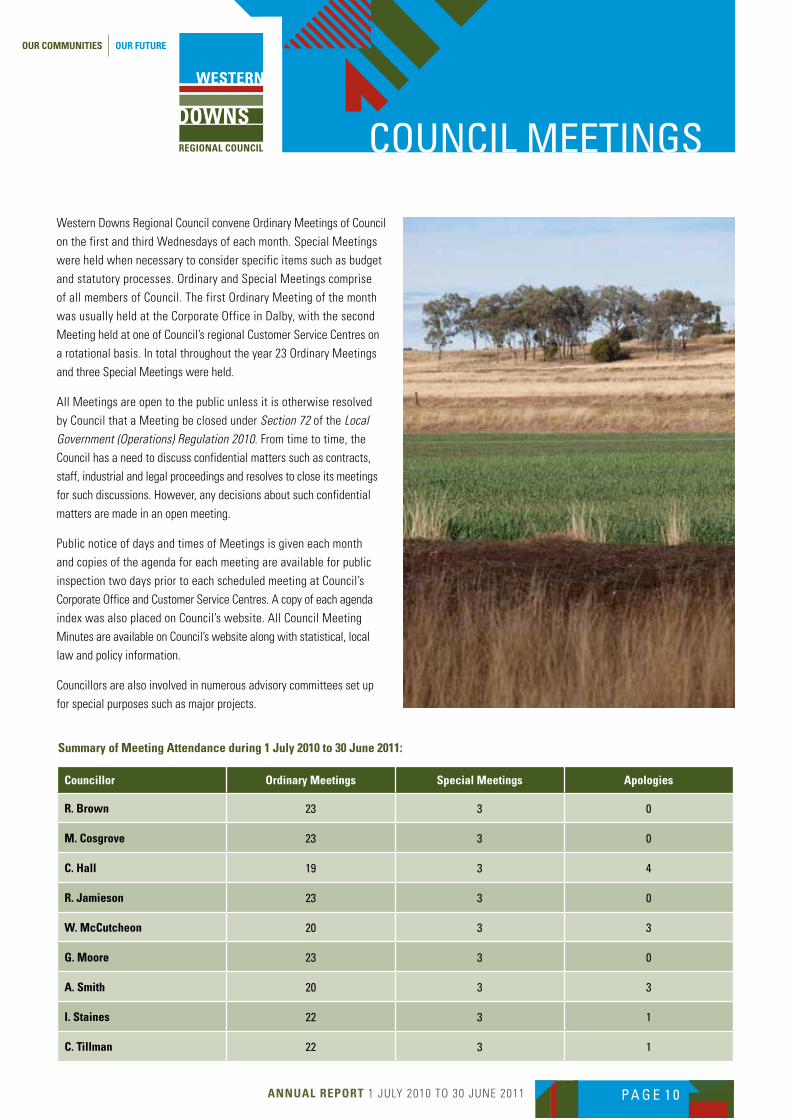
CounCIl MeetIngs
Western Downs Regional Council convene Ordinary Meetings of Council
on the first and third Wednesdays of each month. Special Meetings
were held when necessary to consider specific items such as budget
and statutory processes. Ordinary and Special Meetings comprise
of all members of Council. The first Ordinary Meeting of the month
was usually held at the Corporate Office in Dalby, with the second
Meeting held at one of Council’s regional Customer Service Centres on
a rotational basis. In total throughout the year 23 Ordinary Meetings
and three Special Meetings were held.
All Meetings are open to the public unless it is otherwise resolved
by Council that a Meeting be closed under Section 72 of the Local Government (Operations) Regulation 2010. From time to time, the
Council has a need to discuss confidential matters such as contracts,
staff, industrial and legal proceedings and resolves to close its meetings
for such discussions. However, any decisions about such confidential
matters are made in an open meeting.
Public notice of days and times of Meetings is given each month
and copies of the agenda for each meeting are available for public
inspection two days prior to each scheduled meeting at Council’s
Corporate Office and Customer Service Centres. A copy of each agenda
index was also placed on Council’s website. All Council Meeting
Minutes are available on Council’s website along with statistical, local
law and policy information.
Councillors are also involved in numerous advisory committees set up
for special purposes such as major projects.
Summary of Meeting Attendance during 1 July 2010 to 30 June 2011:
Councillor ordinary Meetings Special Meetings Apologies
R. Brown 23 3 0
M. Cosgrove 23 3 0
C. Hall 19 3 4
R. Jamieson 23 3 0
W. McCutcheon 20 3 3
G. Moore 23 3 0
A. Smith 20 3 3
I. Staines 22 3 1
C. tillman 22 3 1
AnnuAl RepoRt 1 JULY 2010 TO 30 JUNE 2011 PA G E 1 1
CounCIlloR expenses ReIMbuRseMent polICy
The Western Downs Regional Council Councillor Expenses
Reimbursement Policy is attached as an appendix to this Report.
expenditure from Councillor Discretionary FundsCouncillors do not have any formal legislated discretionary funds.
Councillors overseas travelDuring this reporting period no Councillors travelled overseas for
Council business.
Councillors Remuneration, Superannuation, expenses Incurred and Facilities Provided
Councillor RemunerationSuperannuation
Council 12%expenses Incurred
Facilities Provided (Motor Vehicle)
R. Brown $127,444.98 $15,293.40 $46,366 $20,352
M. Cosgrove $84,545.11 $10,145.41 $7,030 $20,352
C. Hall $74,150.05 $8,898.01 $4,880 $20,352
R. Jamieson $74,150.05 $8,898.01 $6,941 $20,352
W. McCutcheon $74,150.05 $8,898.01 $13,528 $20,352
G. Moore $74,150.05 $8,898.01 $7,969 $20,352
A. Smith $74,150.05 $8,898.01 $6,529 $20,352
I. Staines $74,150.05 $8,898.01 $11,100 $20,352
C. tillman $74,150.05 $8,898.01 $4,678 $20,352
totAl $731.040.44 $87,724.85 $109,019 $183,168
AnnuAl RepoRt 1 JULY 2010 TO 30 JUNE 2011 PA G E 1 2
CounCIlloR ConduCt CoMplAInts
The annual report for each financial year must contain the particulars of each of the below:
the total number of orders and recommendations made under section 180(2) or (4) of the Act 0
the total number of orders made under section 181 of the Act 0
the name of each Councillor in relation for who an order or recommendation was made under section 180 of the Act or an order was made under 181 of the Act
0
A description of the misconduct or inappropriate conduct engaged in by each of the Councillors n/a
A summary of the order or recommendation made for each Councillor n/a
the number of complaints about the conduct or performance of Councillors assessed as frivolous or vexatious under section 177(4) of the Act
0
Complaints referred to the department’s chief executive under section 177(5)(a) of the Act 0
Complaints referred to the Mayor under section 177(5)(b) of the Act 0
Complaints referred to the department’s chief executive under section 177(6) of the Act 1
Complaints assessed by the Chief executive officer as being about official misconduct 0
Complaints heard by a conduct review panel 0
Complaints heard by the tribunal 0
Complaints dealt with by the Chief executive officer under section 177(8) of the Act 0
AnnuAl RepoRt 1 JULY 2010 TO 30 JUNE 2011 PA G E 1 3
AdMInIstRAtIVe ACtIon CoMplAInts
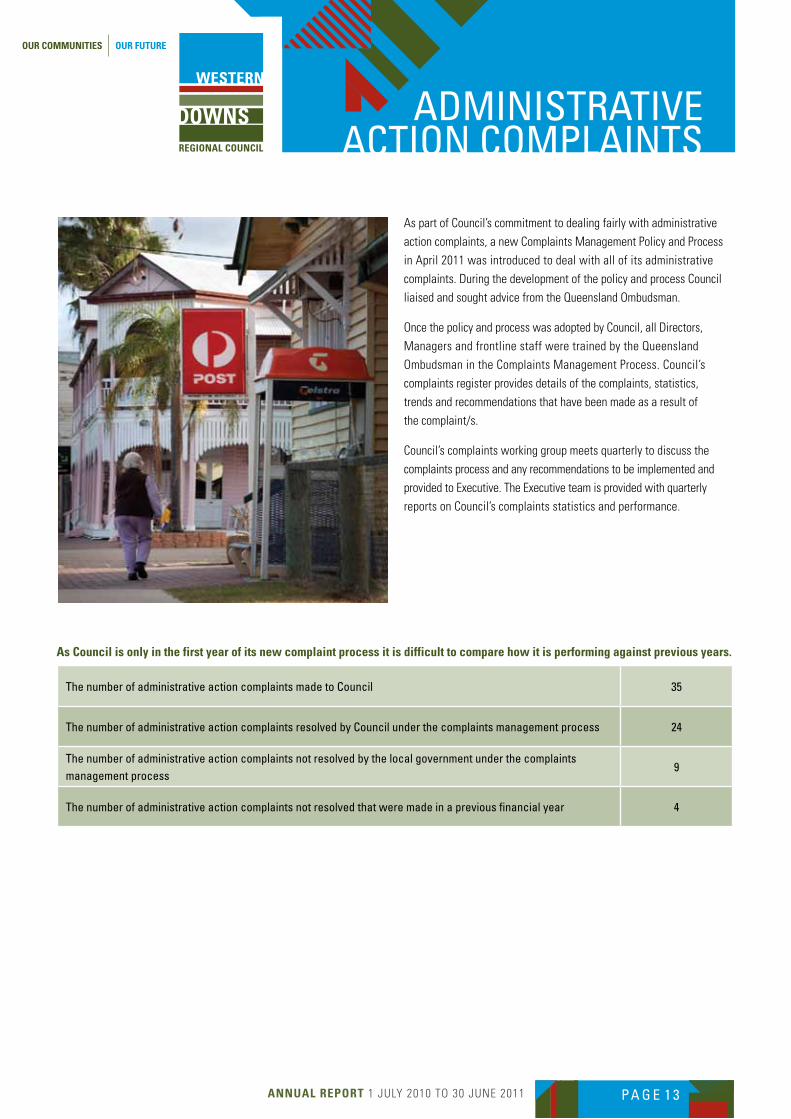
As part of Council’s commitment to dealing fairly with administrative
action complaints, a new Complaints Management Policy and Process
in April 2011 was introduced to deal with all of its administrative
complaints. During the development of the policy and process Council
liaised and sought advice from the Queensland Ombudsman.
Once the policy and process was adopted by Council, all Directors,
Managers and frontline staff were trained by the Queensland
Ombudsman in the Complaints Management Process. Council’s
complaints register provides details of the complaints, statistics,
trends and recommendations that have been made as a result of
the complaint/s.
Council’s complaints working group meets quarterly to discuss the
complaints process and any recommendations to be implemented and
provided to Executive. The Executive team is provided with quarterly
reports on Council’s complaints statistics and performance.
As Council is only in the first year of its new complaint process it is difficult to compare how it is performing against previous years.
the number of administrative action complaints made to Council 35
the number of administrative action complaints resolved by Council under the complaints management process 24
the number of administrative action complaints not resolved by the local government under the complaints management process
9
the number of administrative action complaints not resolved that were made in a previous financial year 4
AnnuAl RepoRt 1 JULY 2010 TO 30 JUNE 2011 PA G E 1 4
InteRnAl AudIt
• Attendance at Audit Committee meeting
• safety Audit construction inspection (dalby and tara)
• Research internal control, code of conducts, ethics and fraud
• Research Asset Management planning standard practices
• Review Council’s Corporate plan, mission statement and strategies
• Review financial Accountability Act 2009
• Review statutory bodies financial Arrangement Act 1982
• Review Crime and Misconduct Act 2001
• Review disaster Management Act 2003
• Review of public sector ethics Act 1994
• Review of Judicial Review Act 1991
• Review Anti-discrimination Act 1991
• Review lgAQ website and contents
• Review dIp website and contents
• Review Queensland Audit office website and contents
• lg Asset Advance meeting re asset management plans
• Internal audit of “Compliance with laws and Regulations” commenced and completed
• Internal audit of “Internal Control” commenced and completed, draft report issued
• Internal Control policy prepared and submitted in draft format
• Internal audit of “Community Assistance programs” commenced and in process
A total of three Audit Committee Meetings were held throughout 2010/11.
AnnuAl RepoRt 1 JULY 2010 TO 30 JUNE 2011 PA G E 1 5
RegIsteRs
the following registers are kept by Council for the inspection by members of the public (except where indicated by*):-
• Roads and Map Register (s74 of LGA 2009)
• Land Records (s87 of LG (FPR) Reg
• Register of Cost Recovery Fees and Commercial Charges (s98 of lgA 2009)
• Register of Interests for Councillors (s105 of lg operations Reg)
• Delegations Register (s260 of LGA 2009)
• Local Laws Register (not compliant - awaiting enactment of new regional local laws) (s16 of lg operations Reg)
• Record of Written Complaints About Councillor Conduct or performance (s177 of lgA 2009)
• Cemetery Register
• Register of Pre-Qualified Suppliers (s87 LG (FPR) Reg)
• Business Activities Register (s175 BE and BA Reg)
• * Register of Interest for Chief Executive Officer and senior Contract employees (s105 of lg operations Reg)
• * Register of Interests for Related Persons (s105 of LG operations Reg)
• * Asset Register
AnnuAl RepoRt 1 JULY 2010 TO 30 JUNE 2011 PA G E 1 6
suMMARy of stRAtegIC ACtIVItIes
To address priority issues identified during the corporate planning process, the Western Downs Regional Council team is committed to delivering
services and initiatives within each of the following strategic activity areas:
SA 1 People and Communities
SA 2 Growth and opportunity
SA 3 Planning for liveability
SA 4 our environment
SA 5 utility Services
SA 6 Infrastructure
SA 7 empowering our team
SA 8 Business Systems and technology
AnnuAl RepoRt 1 JULY 2010 TO 30 JUNE 2011 PA G E 1 7
SA 1 people And CoMMunItIes
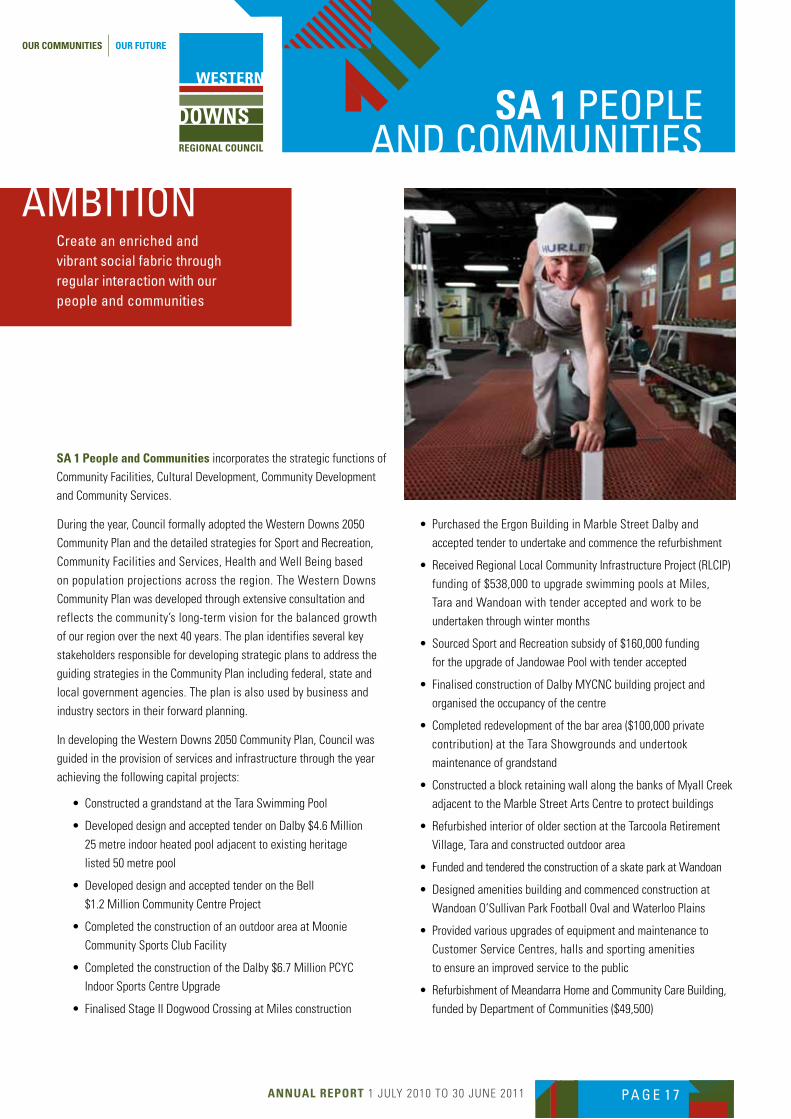
SA 1 People and Communities incorporates the strategic functions of
Community Facilities, Cultural Development, Community Development
and Community Services.
• PurchasedtheErgonBuildinginMarbleStreetDalbyand
accepted tender to undertake and commence the refurbishment
• ReceivedRegionalLocalCommunityInfrastructureProject(RLCIP)
funding of $538,000 to upgrade swimming pools at Miles,
Tara and Wandoan with tender accepted and work to be
undertaken through winter months
• SourcedSportandRecreationsubsidyof$160,000funding
for the upgrade of Jandowae Pool with tender accepted
• FinalisedconstructionofDalbyMYCNCbuildingprojectand
organised the occupancy of the centre
• Completedredevelopmentofthebararea($100,000private
contribution) at the Tara Showgrounds and undertook
maintenance of grandstand
• ConstructedablockretainingwallalongthebanksofMyallCreek
adjacent to the Marble Street Arts Centre to protect buildings
• RefurbishedinteriorofoldersectionattheTarcoolaRetirement
Village, Tara and constructed outdoor area
• FundedandtenderedtheconstructionofaskateparkatWandoan
• Designedamenitiesbuildingandcommencedconstructionat
Wandoan O’Sullivan Park Football Oval and Waterloo Plains
• Providedvariousupgradesofequipmentandmaintenanceto
Customer Service Centres, halls and sporting amenities
to ensure an improved service to the public
• RefurbishmentofMeandarraHomeandCommunityCareBuilding,
funded by Department of Communities ($49,500)
During the year, Council formally adopted the Western Downs 2050
Community Plan and the detailed strategies for Sport and Recreation,
Community Facilities and Services, Health and Well Being based
on population projections across the region. The Western Downs
Community Plan was developed through extensive consultation and
reflects the community’s long-term vision for the balanced growth
of our region over the next 40 years. The plan identifies several key
stakeholders responsible for developing strategic plans to address the
guiding strategies in the Community Plan including federal, state and
local government agencies. The plan is also used by business and
industry sectors in their forward planning.
In developing the Western Downs 2050 Community Plan, Council was
guided in the provision of services and infrastructure through the year
achieving the following capital projects:
• ConstructedagrandstandattheTaraSwimmingPool
• DevelopeddesignandacceptedtenderonDalby$4.6Million
25 metre indoor heated pool adjacent to existing heritage
listed 50 metre pool
• DevelopeddesignandacceptedtenderontheBell
$1.2 Million Community Centre Project
• CompletedtheconstructionofanoutdoorareaatMoonie
Community Sports Club Facility
• CompletedtheconstructionoftheDalby$6.7MillionPCYC
Indoor Sports Centre Upgrade
• FinalisedStageIIDogwoodCrossingatMilesconstruction
AMbItIonCreate an enriched and vibrant social fabric through regular interaction with our people and communities
AnnuAl RepoRt 1 JULY 2010 TO 30 JUNE 2011 PA G E 1 8
sA1 people And CoMMunItIes Cont’d 2010/11
ACHIeVeMents
Civic CentresCouncil operates a number of civic centres across the region and two
at Dalby and Chinchilla where cinemas are operated. Management
contracts for the Chinchilla and Dalby centres were renegotiated for
a three year period, confirming Council’s commitment to provide a high
level of regional services.
Across the region there were 622 indicated events conducted within
these facilities at an average cost of $757.33.
2010/11 ACHIeVeMents
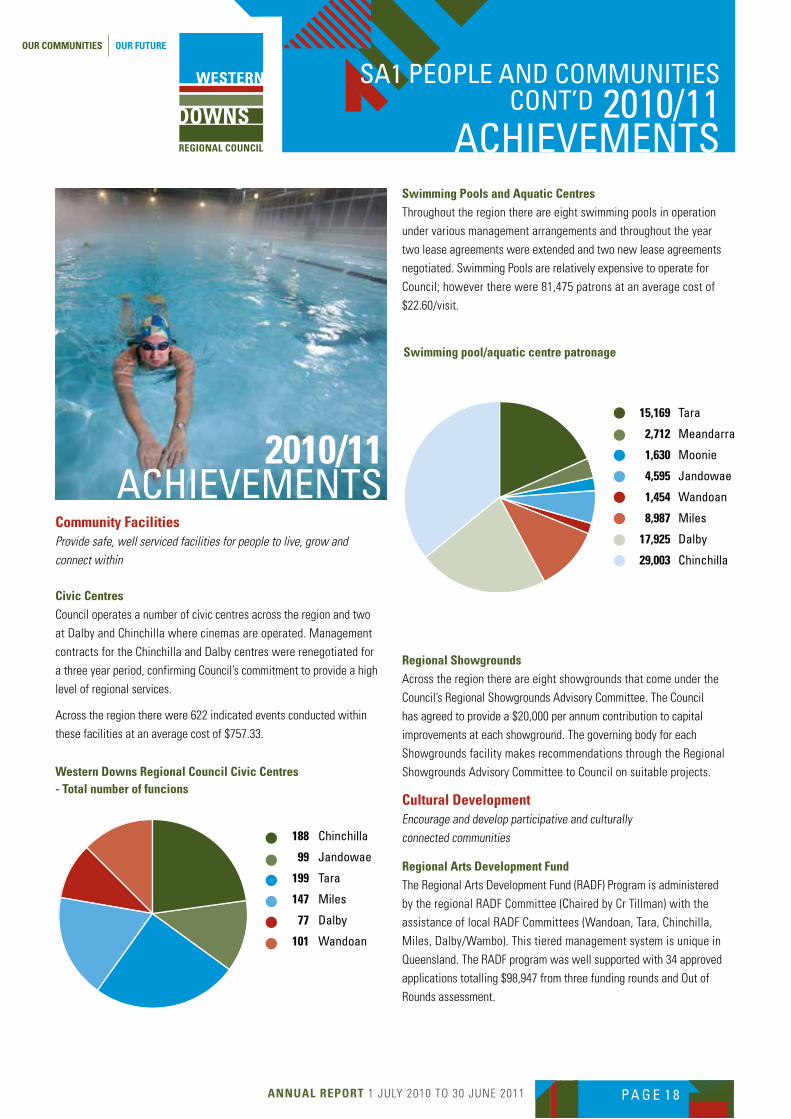
Swimming Pools and Aquatic CentresThroughout the region there are eight swimming pools in operation
under various management arrangements and throughout the year
two lease agreements were extended and two new lease agreements
negotiated. Swimming Pools are relatively expensive to operate for
Council; however there were 81,475 patrons at an average cost of
$22.60/visit.
Regional ShowgroundsAcross the region there are eight showgrounds that come under the
Council’s Regional Showgrounds Advisory Committee. The Council
has agreed to provide a $20,000 per annum contribution to capital
improvements at each showground. The governing body for each
Showgrounds facility makes recommendations through the Regional
Showgrounds Advisory Committee to Council on suitable projects.
Cultural DevelopmentEncourage and develop participative and culturally connected communities
Regional Arts Development FundThe Regional Arts Development Fund (RADF) Program is administered
by the regional RADF Committee (Chaired by Cr Tillman) with the
assistance of local RADF Committees (Wandoan, Tara, Chinchilla,
Miles, Dalby/Wambo). This tiered management system is unique in
Queensland. The RADF program was well supported with 34 approved
applications totalling $98,947 from three funding rounds and Out of
Rounds assessment.
Community FacilitiesProvide safe, well serviced facilities for people to live, grow and connect within
Western Downs Regional Council Civic Centres - total number of funcions
188 Chinchilla
99 Jandowae
199 tara
147 Miles
77 dalby
101 wandoan
Swimming pool/aquatic centre patronage
15,169 tara
2,712 Meandarra
1,630 Moonie
4,595 Jandowae
1,454 wandoan
8,987 Miles
17,925 dalby
29,003 Chinchilla
AnnuAl RepoRt 1 JULY 2010 TO 30 JUNE 2011 PA G E 1 9
sA1 people And CoMMunItIes Cont’d 2010/11
ACHIeVeMents
Art GalleriesThe three Regional Art Galleries display work from local artists,
larger travelling exhibitions and in some cases National and State
touring exhibitions. Visitor numbers through the galleries have been
exceptionally high totalling 44,395 this year.
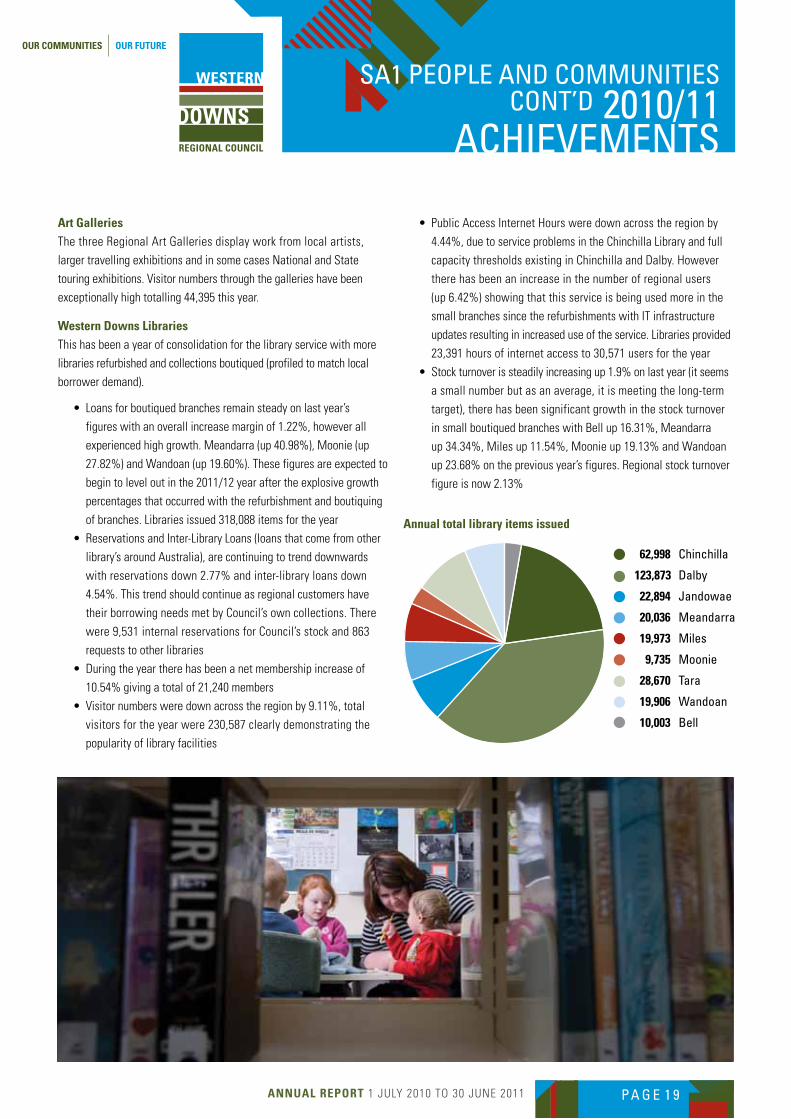
Western Downs librariesThis has been a year of consolidation for the library service with more
libraries refurbished and collections boutiqued (profiled to match local
borrower demand).
• Loansforboutiquedbranchesremainsteadyonlastyear’s
figures with an overall increase margin of 1.22%, however all
experienced high growth. Meandarra (up 40.98%), Moonie (up
27.82%) and Wandoan (up 19.60%). These figures are expected to
begin to level out in the 2011/12 year after the explosive growth
percentages that occurred with the refurbishment and boutiquing
of branches. Libraries issued 318,088 items for the year
• ReservationsandInter-LibraryLoans(loansthatcomefromother
library’s around Australia), are continuing to trend downwards
with reservations down 2.77% and inter-library loans down
4.54%. This trend should continue as regional customers have
their borrowing needs met by Council’s own collections. There
were 9,531 internal reservations for Council’s stock and 863
requests to other libraries
• Duringtheyeartherehasbeenanetmembershipincreaseof
10.54% giving a total of 21,240 members
• Visitornumbersweredownacrosstheregionby9.11%,total
visitors for the year were 230,587 clearly demonstrating the
popularity of library facilities
• PublicAccessInternetHoursweredownacrosstheregionby
4.44%, due to service problems in the Chinchilla Library and full
capacity thresholds existing in Chinchilla and Dalby. However
there has been an increase in the number of regional users
(up 6.42%) showing that this service is being used more in the
small branches since the refurbishments with IT infrastructure
updates resulting in increased use of the service. Libraries provided
23,391 hours of internet access to 30,571 users for the year
• Stockturnoverissteadilyincreasingup1.9%onlastyear(itseems
a small number but as an average, it is meeting the long-term
target), there has been significant growth in the stock turnover
in small boutiqued branches with Bell up 16.31%, Meandarra
up 34.34%, Miles up 11.54%, Moonie up 19.13% and Wandoan
up 23.68% on the previous year’s figures. Regional stock turnover
figure is now 2.13%
Annual total library items issued
62,998 Chinchilla
123,873 dalby
22,894 Jandowae
20,036 Meandarra
19,973 Miles
9,735 Moonie
28,670 tara
19,906 wandoan
10,003 bell
AnnuAl RepoRt 1 JULY 2010 TO 30 JUNE 2011 PA G E 2 0
sA1 people And CoMMunItIes Cont’d 2010/11
ACHIeVeMents
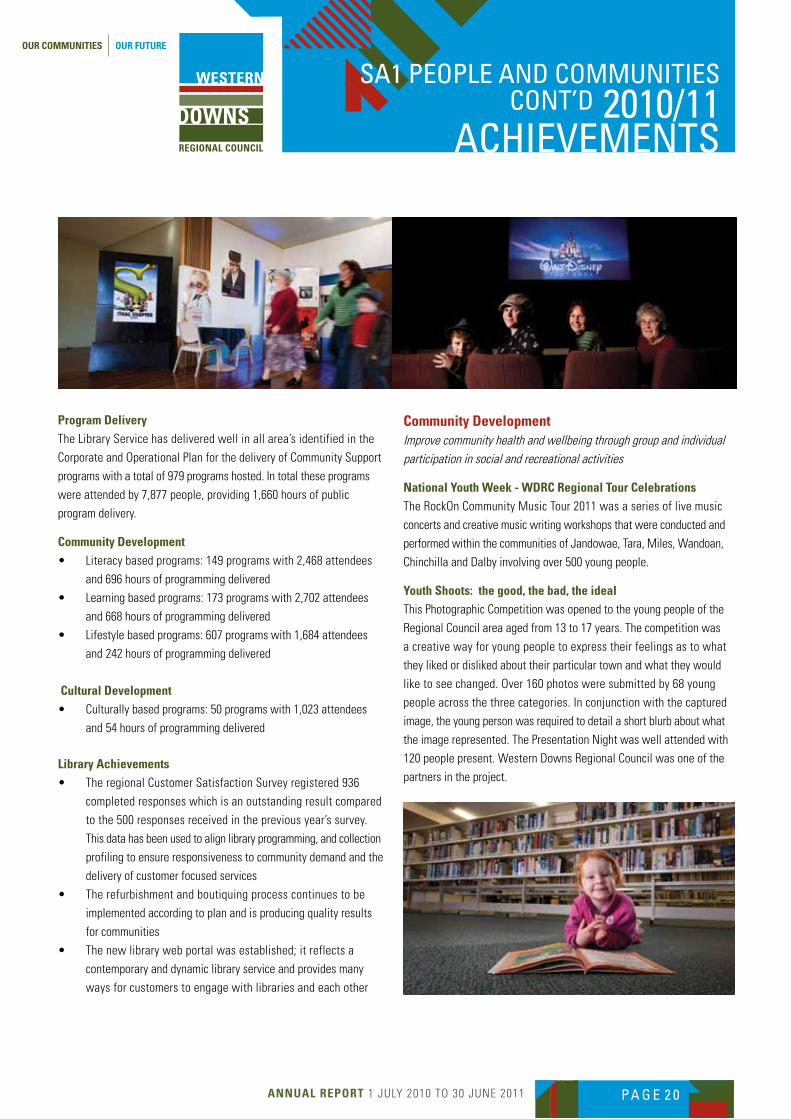
Program DeliveryThe Library Service has delivered well in all area’s identified in the
Corporate and Operational Plan for the delivery of Community Support
programs with a total of 979 programs hosted. In total these programs
were attended by 7,877 people, providing 1,660 hours of public
program delivery.
Community Development• Literacybasedprograms:149programswith2,468attendees
and 696 hours of programming delivered
• Learningbasedprograms:173programswith2,702attendees
and 668 hours of programming delivered
• Lifestylebasedprograms:607programswith1,684attendees
and 242 hours of programming delivered
Cultural Development• Culturallybasedprograms:50programswith1,023attendees
and 54 hours of programming delivered
library Achievements• TheregionalCustomerSatisfactionSurveyregistered936
completed responses which is an outstanding result compared
to the 500 responses received in the previous year’s survey.
This data has been used to align library programming, and collection
profiling to ensure responsiveness to community demand and the
delivery of customer focused services
• Therefurbishmentandboutiquingprocesscontinuestobe
implemented according to plan and is producing quality results
for communities
• Thenewlibrarywebportalwasestablished;itreflectsa
contemporary and dynamic library service and provides many
ways for customers to engage with libraries and each other
Community DevelopmentImprove community health and wellbeing through group and individual participation in social and recreational activities
national youth Week - WDRC Regional tour CelebrationsThe RockOn Community Music Tour 2011 was a series of live music
concerts and creative music writing workshops that were conducted and
performed within the communities of Jandowae, Tara, Miles, Wandoan,
Chinchilla and Dalby involving over 500 young people.
youth Shoots: the good, the bad, the idealThis Photographic Competition was opened to the young people of the
Regional Council area aged from 13 to 17 years. The competition was
a creative way for young people to express their feelings as to what
they liked or disliked about their particular town and what they would
like to see changed. Over 160 photos were submitted by 68 young
people across the three categories. In conjunction with the captured
image, the young person was required to detail a short blurb about what
the image represented. The Presentation Night was well attended with
120 people present. Western Downs Regional Council was one of the
partners in the project.

AnnuAl RepoRt 1 JULY 2010 TO 30 JUNE 2011 PA G E 2 1
sA1 people And CoMMunItIes Cont’d 2010/11
ACHIeVeMents
AnZAC DayCouncil representatives attended the Western Downs Regional Council
hosted 17 ANZAC services and ceremonies on 25 April 2011, held
across the region in remembrance of those men and women who fought
and died to make Australia and our region what it is today.
Funding ProgramsFinancial assistance is available to individuals and not-for-profit
organisations through a number of funding programs that are
implemented throughout the year including Minor Grants, In Kind
Assistance, Community Loan Program and Sporting Assistance Program.
• TheMinorGrantsProgramhasbeenwellsupportedwith49
successful applications in the two funding rounds with projects
totalling $114,162 approved
Flood VouchersFollowing the dramatic natural disaster events of December 2010 and
January 2011 there were many generous contributions to the Western
Downs Flood appeal and $250,000.00 external contributions were
distributed through a unique flood voucher system across the region
to residents of flood affected properties.
Community ServicesProvide safe and well serviced communities
Aged CareWithin the communities of Tara and Miles, Council operates two
Nursing Home Services with 32 bed and 19 bed facilities that have an
occupancy rate of 98% through the year. In Jandowae, Tara, Meandarra,
Chinchilla and Miles, Council provided Home and Community Care
Services that achieved 98% of approved hours utilised supporting the
aged. Aged Services have become financially secure services under the
negotiated management contract.
Community HousingThroughout communities across the Western Downs, Council provides
housing to the aged, disabled and youth achieving a 95% occupancy
rate, while providing housing to staff in certain centres.
QGAP ServicesCouncil provides State Government services in Jandowae, Tara and
Moonie, which is subsidised by Council to the value of $14,000.
Australian Citizenship CeremoniesCouncil was pleased to officiate in four Australian Citizenship
ceremonies from 1 July 2010 to 30 June 2011, at which 18 residents
became Australian Citizens.
AnnuAl RepoRt 1 JULY 2010 TO 30 JUNE 2011 PA G E 2 2
sA1 people And CoMMunItIes Cont’d 2010/11
ACHIeVeMents
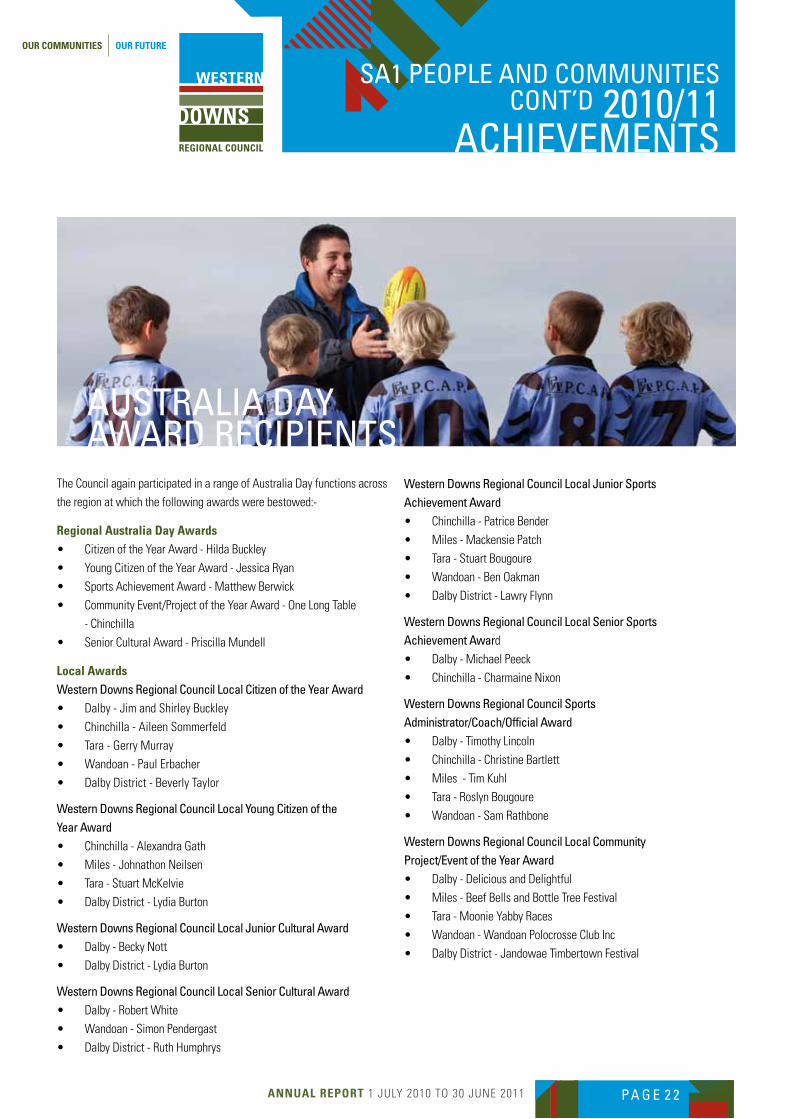
AustRAlIA dAy AwARd ReCIpIents
The Council again participated in a range of Australia Day functions across
the region at which the following awards were bestowed:-
Regional Australia Day Awards• CitizenoftheYearAward-HildaBuckley
• YoungCitizenoftheYearAward-JessicaRyan
• SportsAchievementAward-MatthewBerwick
• CommunityEvent/ProjectoftheYearAward-OneLongTable
- Chinchilla
• SeniorCulturalAward-PriscillaMundell
local Awardswestern downs Regional Council local Citizen of the year Award• Dalby-JimandShirleyBuckley
• Chinchilla-AileenSommerfeld
• Tara-GerryMurray
• Wandoan-PaulErbacher
• DalbyDistrict-BeverlyTaylor
western downs Regional Council local young Citizen of the year Award• Chinchilla-AlexandraGath
• Miles-JohnathonNeilsen
• Tara-StuartMcKelvie
• DalbyDistrict-LydiaBurton
western downs Regional Council local Junior Cultural Award• Dalby-BeckyNott
• DalbyDistrict-LydiaBurton
western downs Regional Council local senior Cultural Award• Dalby-RobertWhite
• Wandoan-SimonPendergast
• DalbyDistrict-RuthHumphrys
western downs Regional Council local Junior sports Achievement Award• Chinchilla-PatriceBender
• Miles-MackensiePatch
• Tara-StuartBougoure
• Wandoan-BenOakman
• DalbyDistrict-LawryFlynn
western downs Regional Council local senior sports Achievement Award• Dalby-MichaelPeeck
• Chinchilla-CharmaineNixon
western downs Regional Council sports Administrator/Coach/official Award• Dalby-TimothyLincoln
• Chinchilla-ChristineBartlett
• Miles-TimKuhl
• Tara-RoslynBougoure
• Wandoan-SamRathbone
western downs Regional Council local Community project/event of the year Award• Dalby-DeliciousandDelightful
• Miles-BeefBellsandBottleTreeFestival
• Tara-MoonieYabbyRaces
• Wandoan-WandoanPolocrosseClubInc
• DalbyDistrict-JandowaeTimbertownFestival
AnnuAl RepoRt 1 JULY 2010 TO 30 JUNE 2011 PA G E 2 3
SA 2 gRowtH And oppoRtunIty
SA 2 Growth and opportunity incorporates the strategic functions
of Tourism and Promotion, and Business and Industry.
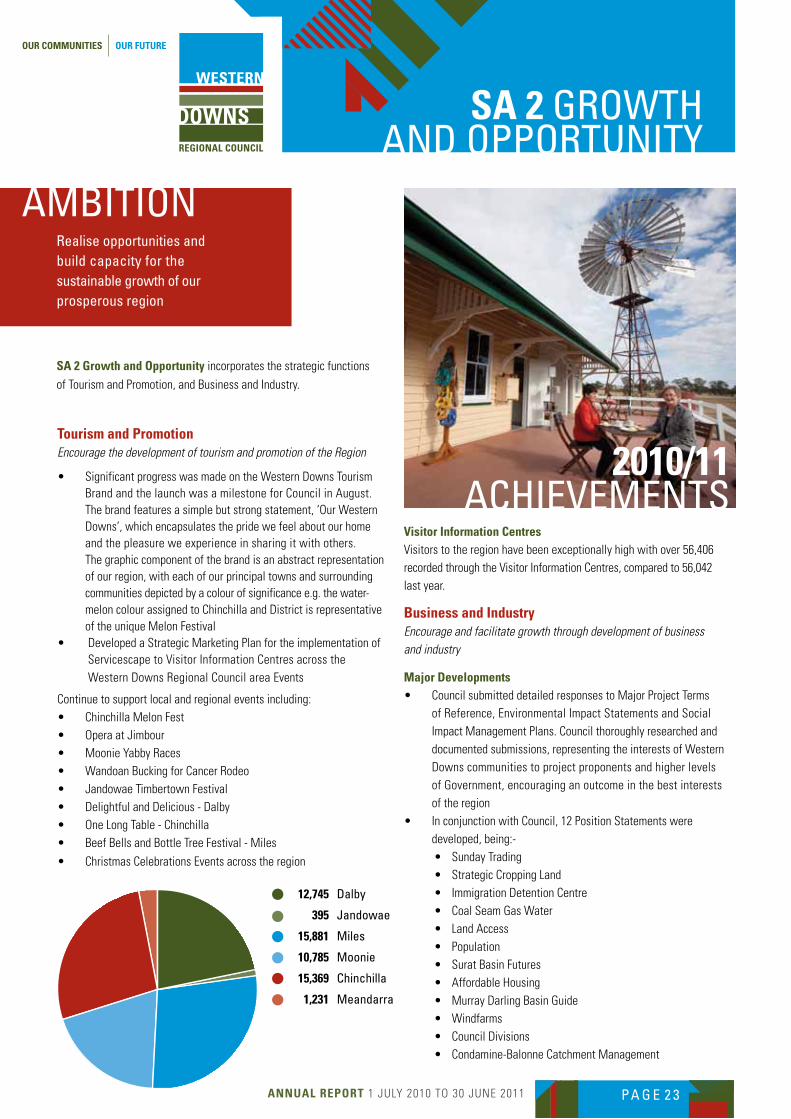
tourism and PromotionEncourage the development of tourism and promotion of the Region
• SignificantprogresswasmadeontheWesternDownsTourismBrand and the launch was a milestone for Council in August. The brand features a simple but strong statement, ‘Our Western Downs’, which encapsulates the pride we feel about our home and the pleasure we experience in sharing it with others. The graphic component of the brand is an abstract representation of our region, with each of our principal towns and surrounding communities depicted by a colour of significance e.g. the water-melon colour assigned to Chinchilla and District is representative of the unique Melon Festival
• DevelopedaStrategicMarketingPlanfortheimplementationofServicescape to Visitor Information Centres across the Western Downs Regional Council area Events
Continue to support local and regional events including:• ChinchillaMelonFest• OperaatJimbour• MoonieYabbyRaces• WandoanBuckingforCancerRodeo• JandowaeTimbertownFestival• DelightfulandDelicious-Dalby• OneLongTable-Chinchilla• BeefBellsandBottleTreeFestival-Miles
• ChristmasCelebrationsEventsacrosstheregion
AMbItIon
2010/11 ACHIeVeMents
Visitor Information CentresVisitors to the region have been exceptionally high with over 56,406 recorded through the Visitor Information Centres, compared to 56,042 last year.
Business and IndustryEncourage and facilitate growth through development of business and industry
Major Developments• CouncilsubmitteddetailedresponsestoMajorProjectTerms
of Reference, Environmental Impact Statements and Social Impact Management Plans. Council thoroughly researched and documented submissions, representing the interests of Western Downs communities to project proponents and higher levels of Government, encouraging an outcome in the best interests of the region
• InconjunctionwithCouncil,12PositionStatementswere developed, being:-• SundayTrading• StrategicCroppingLand• ImmigrationDetentionCentre• CoalSeamGasWater• LandAccess• Population• SuratBasinFutures• AffordableHousing• MurrayDarlingBasinGuide• Windfarms• CouncilDivisions• Condamine-BalonneCatchmentManagement
Realise opportunities and build capacity for the sustainable growth of our prosperous region
Jandowae, 395
Miles Historical VillageMiles, 15,881
Moonie Rural Transaction Centre,
10,785
Chinchilla, 15,369
Meandarra Museum, 1,231
Dalby , 12,745
12,745 dalby
395 Jandowae
15,881 Miles
10,785 Moonie
15,369 Chinchilla
1,231 Meandarra
AnnuAl RepoRt 1 JULY 2010 TO 30 JUNE 2011 PA G E 2 4
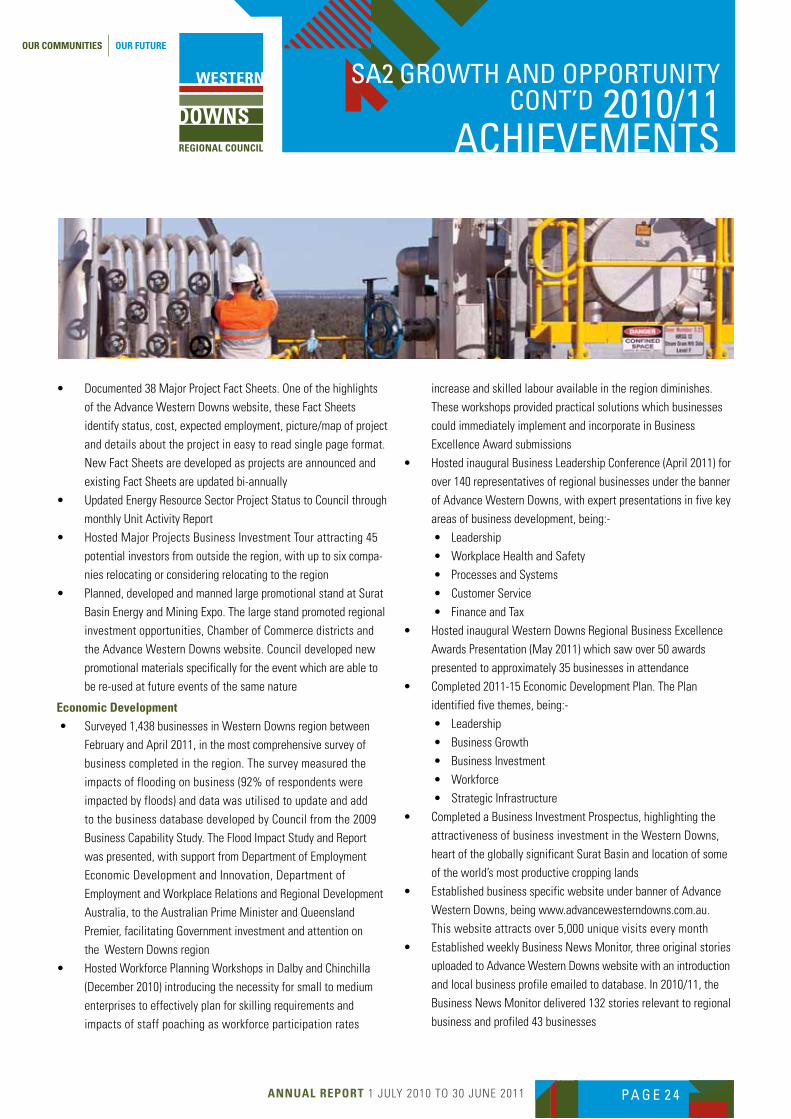
• Documented38MajorProjectFactSheets.Oneofthehighlights
of the Advance Western Downs website, these Fact Sheets
identify status, cost, expected employment, picture/map of project
and details about the project in easy to read single page format.
New Fact Sheets are developed as projects are announced and
existing Fact Sheets are updated bi-annually
• UpdatedEnergyResourceSectorProjectStatustoCouncilthrough
monthly Unit Activity Report
• HostedMajorProjectsBusinessInvestmentTourattracting45
potential investors from outside the region, with up to six compa-
nies relocating or considering relocating to the region
• Planned,developedandmannedlargepromotionalstandatSurat
Basin Energy and Mining Expo. The large stand promoted regional
investment opportunities, Chamber of Commerce districts and
the Advance Western Downs website. Council developed new
promotional materials specifically for the event which are able to
be re-used at future events of the same nature
economic Development• Surveyed1,438businessesinWesternDownsregionbetween
February and April 2011, in the most comprehensive survey of
business completed in the region. The survey measured the
impacts of flooding on business (92% of respondents were
impacted by floods) and data was utilised to update and add
to the business database developed by Council from the 2009
Business Capability Study. The Flood Impact Study and Report
was presented, with support from Department of Employment
Economic Development and Innovation, Department of
Employment and Workplace Relations and Regional Development
Australia, to the Australian Prime Minister and Queensland
Premier, facilitating Government investment and attention on
the Western Downs region
• HostedWorkforcePlanningWorkshopsinDalbyandChinchilla
(December 2010) introducing the necessity for small to medium
enterprises to effectively plan for skilling requirements and
impacts of staff poaching as workforce participation rates
sA2 gRowtH And oppoRtunIty Cont’d 2010/11
ACHIeVeMents
increase and skilled labour available in the region diminishes.
These workshops provided practical solutions which businesses
could immediately implement and incorporate in Business
Excellence Award submissions
• HostedinauguralBusinessLeadershipConference(April2011)for
over 140 representatives of regional businesses under the banner
of Advance Western Downs, with expert presentations in five key
areas of business development, being:-
• Leadership
• WorkplaceHealthandSafety
• ProcessesandSystems
• CustomerService
• FinanceandTax
• HostedinauguralWesternDownsRegionalBusinessExcellence
Awards Presentation (May 2011) which saw over 50 awards
presented to approximately 35 businesses in attendance
• Completed2011-15EconomicDevelopmentPlan.ThePlan
identified five themes, being:-
• Leadership
• BusinessGrowth
• BusinessInvestment
• Workforce
• StrategicInfrastructure
• CompletedaBusinessInvestmentProspectus,highlightingthe
attractiveness of business investment in the Western Downs,
heart of the globally significant Surat Basin and location of some
of the world’s most productive cropping lands
• EstablishedbusinessspecificwebsiteunderbannerofAdvance
Western Downs, being www.advancewesterndowns.com.au.
This website attracts over 5,000 unique visits every month
• EstablishedweeklyBusinessNewsMonitor,threeoriginalstories
uploaded to Advance Western Downs website with an introduction
and local business profile emailed to database. In 2010/11, the
Business News Monitor delivered 132 stories relevant to regional
business and profiled 43 businesses
AnnuAl RepoRt 1 JULY 2010 TO 30 JUNE 2011 PA G E 2 5
• Developed2011EconomicProfiles.TheEconomicProfileshave
been uploaded to the Advance Western Downs website
• PromotedAdvancedWesternDownsBusinessOpportunities.
10 business opportunities generated from the Advance Western
Downs program in 2010/11. Positive comments about the process
conducted have been received from proponents, suppliers and
State Government (Department of Employment Economic
Development and Innovation)
• FacilitatedWesternDownsEconomicDevelopmentTaskGroup
and sub groups of IT, Education and Training Task Group and
Business Growth Task Group. Western Downs Economic Development
Task Group continues to be the major two-way communication
tool between Chambers of Commerce and Council, strengthening
the activity of both entities
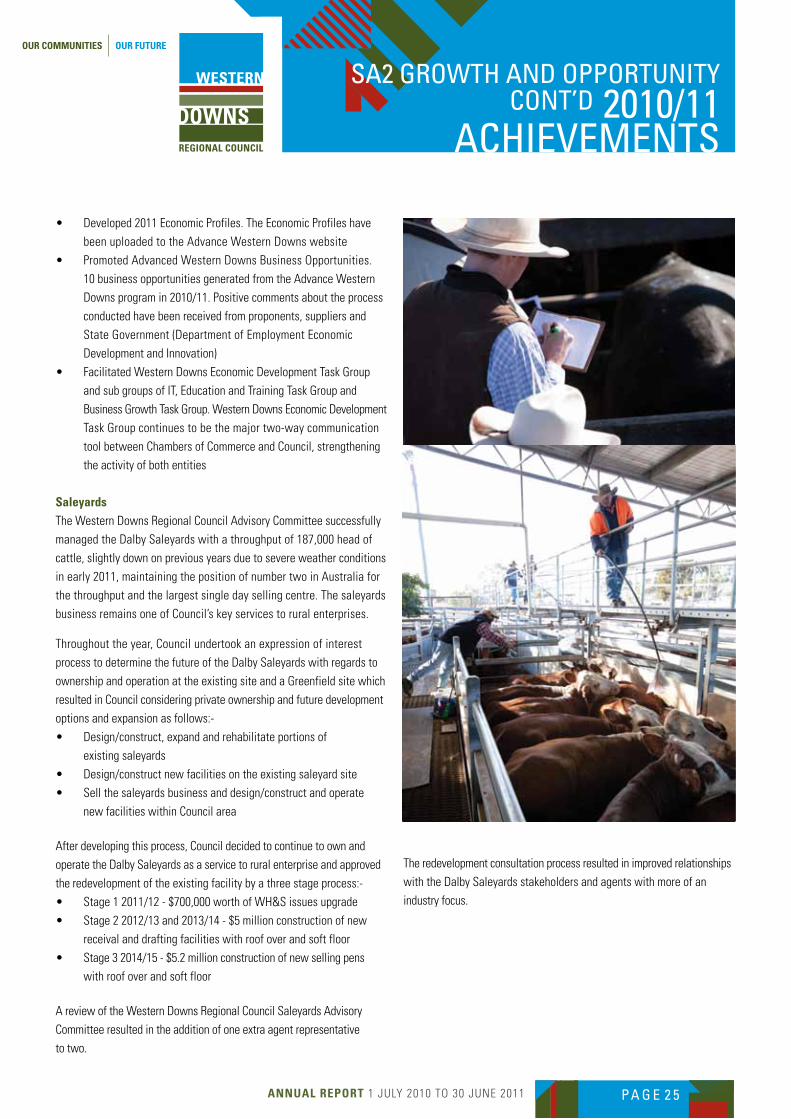
SaleyardsThe Western Downs Regional Council Advisory Committee successfully
managed the Dalby Saleyards with a throughput of 187,000 head of
cattle, slightly down on previous years due to severe weather conditions
in early 2011, maintaining the position of number two in Australia for
the throughput and the largest single day selling centre. The saleyards
business remains one of Council’s key services to rural enterprises.
Throughout the year, Council undertook an expression of interest
process to determine the future of the Dalby Saleyards with regards to
ownership and operation at the existing site and a Greenfield site which
resulted in Council considering private ownership and future development
options and expansion as follows:-
• Design/construct,expandandrehabilitateportionsof
existing saleyards
• Design/constructnewfacilitiesontheexistingsaleyardsite
• Sellthesaleyardsbusinessanddesign/constructandoperate
new facilities within Council area
After developing this process, Council decided to continue to own and
operate the Dalby Saleyards as a service to rural enterprise and approved
the redevelopment of the existing facility by a three stage process:-
• Stage12011/12-$700,000worthofWH&Sissuesupgrade
• Stage22012/13and2013/14-$5millionconstructionofnew
receival and drafting facilities with roof over and soft floor
• Stage32014/15-$5.2millionconstructionofnewsellingpens
with roof over and soft floor
A review of the Western Downs Regional Council Saleyards Advisory
Committee resulted in the addition of one extra agent representative
to two.
sA2 gRowtH And oppoRtunIty Cont’d 2010/11
ACHIeVeMents
The redevelopment consultation process resulted in improved relationships
with the Dalby Saleyards stakeholders and agents with more of an
industry focus.
AnnuAl RepoRt 1 JULY 2010 TO 30 JUNE 2011 PA G E 2 6
SA 3 plAnnIng foR lIVeAbIlIty
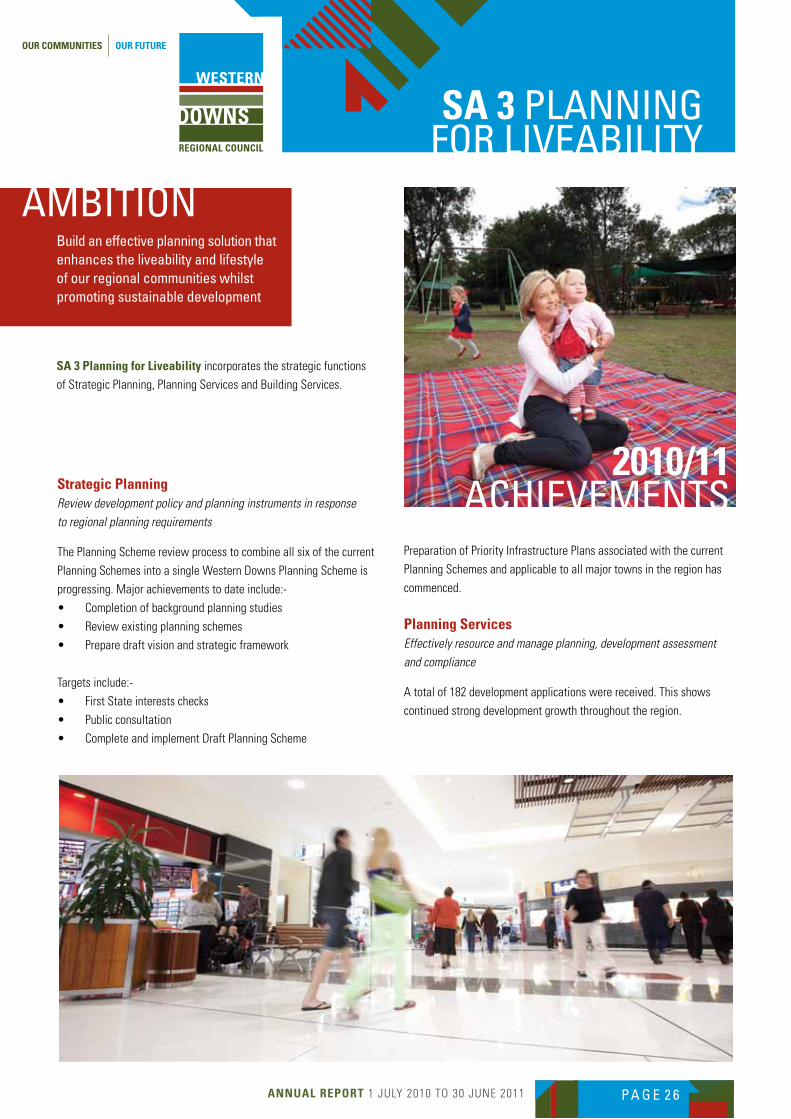
SA 3 Planning for liveability incorporates the strategic functions
of Strategic Planning, Planning Services and Building Services.
Strategic Planning Review development policy and planning instruments in response to regional planning requirements
The Planning Scheme review process to combine all six of the current
Planning Schemes into a single Western Downs Planning Scheme is
progressing. Major achievements to date include:-
• Completionofbackgroundplanningstudies
• Reviewexistingplanningschemes
• Preparedraftvisionandstrategicframework
Targets include:-
• FirstStateinterestschecks
• Publicconsultation
• CompleteandimplementDraftPlanningScheme
AMbItIon
2010/11 ACHIeVeMents
Preparation of Priority Infrastructure Plans associated with the current
Planning Schemes and applicable to all major towns in the region has
commenced.
Planning ServicesEffectively resource and manage planning, development assessment and compliance
A total of 182 development applications were received. This shows
continued strong development growth throughout the region.
build an effective planning solution that enhances the liveability and lifestyle of our regional communities whilst promoting sustainable development
AnnuAl RepoRt 1 JULY 2010 TO 30 JUNE 2011 PA G E 2 7
sA3 plAnnIng foR lIVeAbIlIty Cont’d 2010/11
ACHIeVeMents
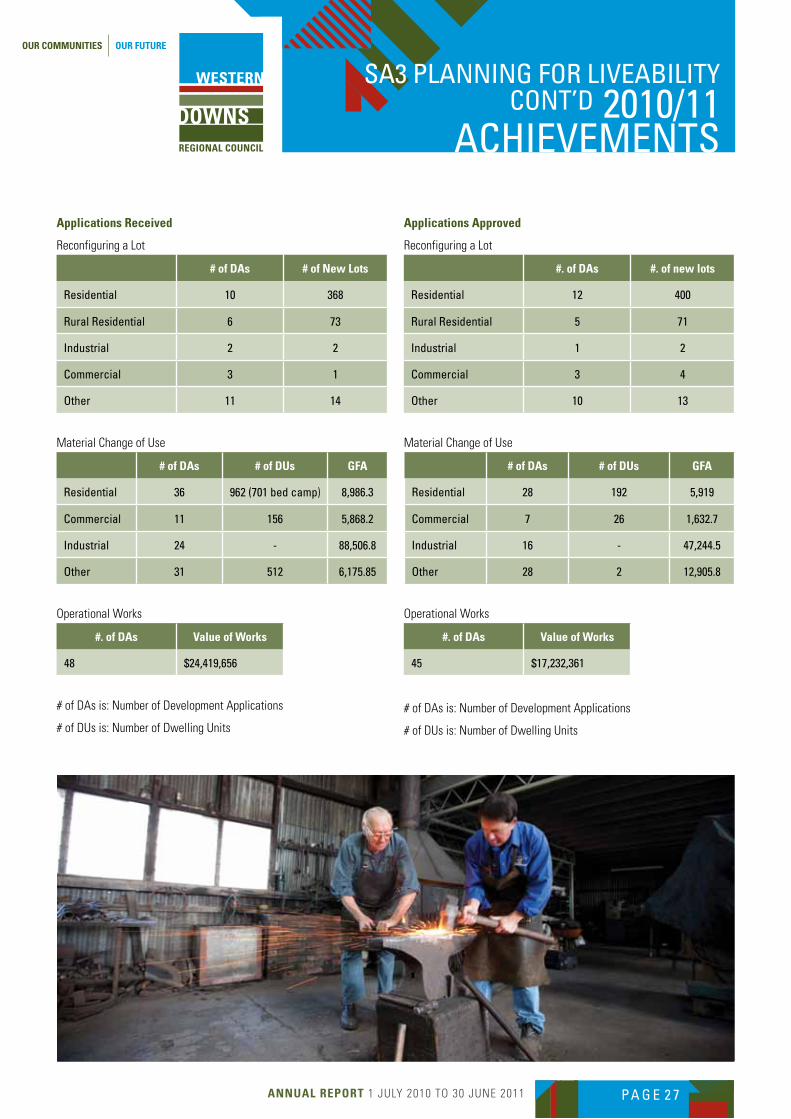
Applications Received
Reconfiguring a Lot
# of DAs # of new lots
Residential 10 368
Rural Residential 6 73
Industrial 2 2
Commercial 3 1
other 11 14
Material Change of Use
# of DAs # of Dus GFA
Residential 36 962 (701 bed camp) 8,986.3
Commercial 11 156 5,868.2
Industrial 24 - 88,506.8
other 31 512 6,175.85
Operational Works
#. of DAs Value of Works
48 $24,419,656
# of DAs is: Number of Development Applications
# of DUs is: Number of Dwelling Units
Applications Approved
Reconfiguring a Lot
#. of DAs #. of new lots
Residential 12 400
Rural Residential 5 71
Industrial 1 2
Commercial 3 4
other 10 13
Material Change of Use
# of DAs # of Dus GFA
Residential 28 192 5,919
Commercial 7 26 1,632.7
Industrial 16 - 47,244.5
other 28 2 12,905.8
Operational Works
#. of DAs Value of Works
45 $17,232,361
# of DAs is: Number of Development Applications
# of DUs is: Number of Dwelling Units
AnnuAl RepoRt 1 JULY 2010 TO 30 JUNE 2011 PA G E 2 8
sA3 plAnnIng foR lIVeAbIlIty Cont’d 2010/11
ACHIeVeMents
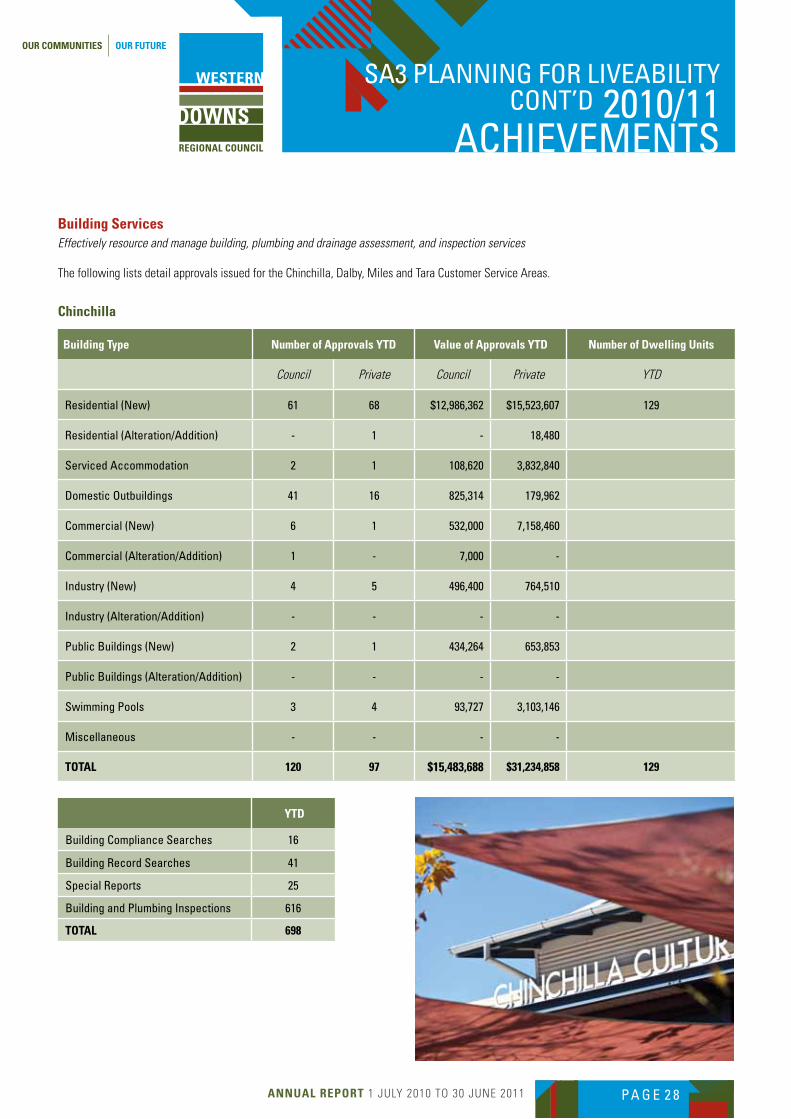
Building ServicesEffectively resource and manage building, plumbing and drainage assessment, and inspection services
The following lists detail approvals issued for the Chinchilla, Dalby, Miles and Tara Customer Service Areas.
Chinchilla
Building type number of Approvals ytD Value of Approvals ytD number of Dwelling units
Council Private Council Private YTD
Residential (new) 61 68 $12,986,362 $15,523,607 129
Residential (Alteration/Addition) - 1 - 18,480
serviced Accommodation 2 1 108,620 3,832,840
domestic outbuildings 41 16 825,314 179,962
Commercial (new) 6 1 532,000 7,158,460
Commercial (Alteration/Addition) 1 - 7,000 -
Industry (new) 4 5 496,400 764,510
Industry (Alteration/Addition) - - - -
public buildings (new) 2 1 434,264 653,853
public buildings (Alteration/Addition) - - - -
swimming pools 3 4 93,727 3,103,146
Miscellaneous - - - -
totAl 120 97 $15,483,688 $31,234,858 129
ytD
building Compliance searches 16
building Record searches 41
special Reports 25
building and plumbing Inspections 616
totAl 698
AnnuAl RepoRt 1 JULY 2010 TO 30 JUNE 2011 PA G E 2 9
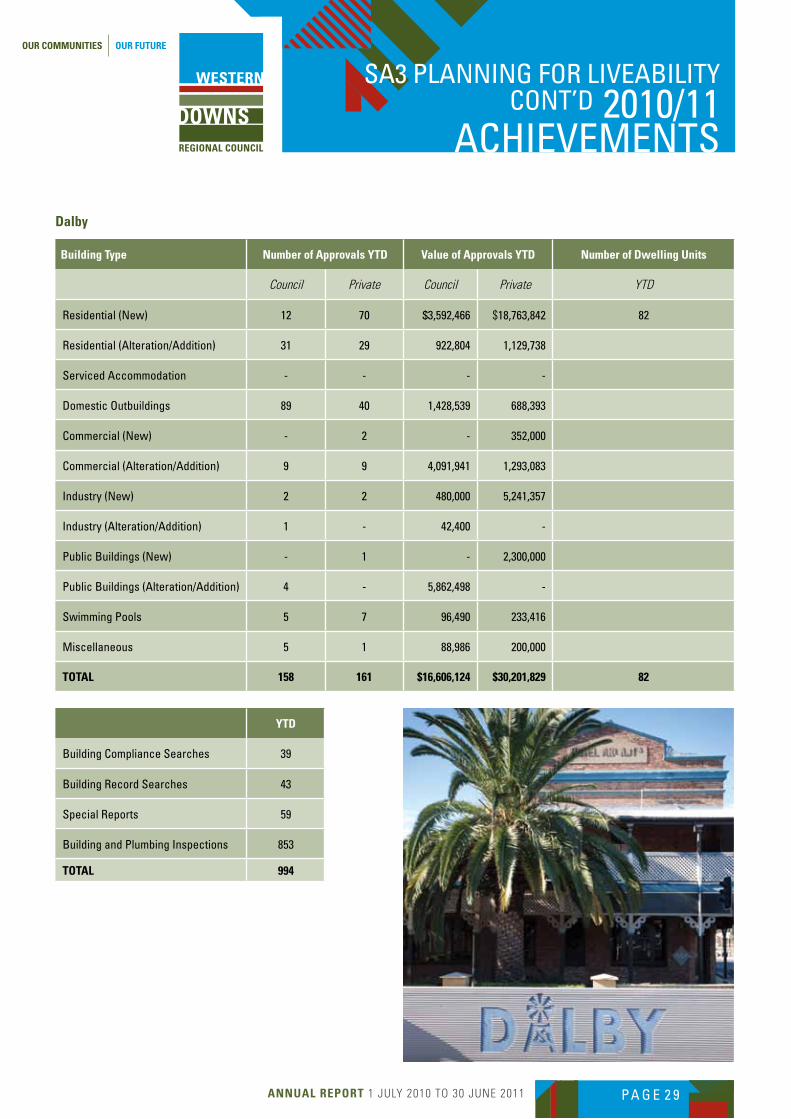
Dalby
Building type number of Approvals ytD Value of Approvals ytD number of Dwelling units
Council Private Council Private YTD
Residential (new) 12 70 $3,592,466 $18,763,842 82
Residential (Alteration/Addition) 31 29 922,804 1,129,738
serviced Accommodation - - - -
domestic outbuildings 89 40 1,428,539 688,393
Commercial (new) - 2 - 352,000
Commercial (Alteration/Addition) 9 9 4,091,941 1,293,083
Industry (new) 2 2 480,000 5,241,357
Industry (Alteration/Addition) 1 - 42,400 -
public buildings (new) - 1 - 2,300,000
public buildings (Alteration/Addition) 4 - 5,862,498 -
swimming pools 5 7 96,490 233,416
Miscellaneous 5 1 88,986 200,000
totAl 158 161 $16,606,124 $30,201,829 82
ytD
building Compliance searches 39
building Record searches 43
special Reports 59
building and plumbing Inspections 853
totAl 994
sA3 plAnnIng foR lIVeAbIlIty Cont’d 2010/11
ACHIeVeMents
AnnuAl RepoRt 1 JULY 2010 TO 30 JUNE 2011 PA G E 3 0
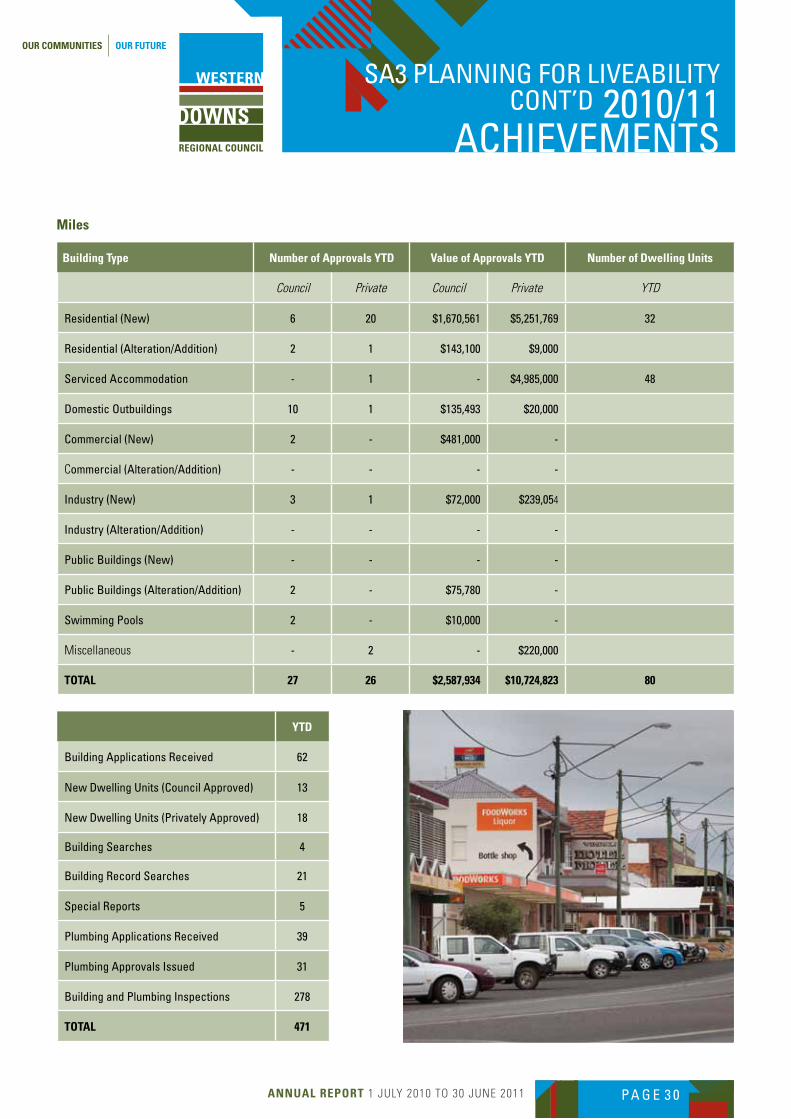
Miles
Building type number of Approvals ytD Value of Approvals ytD number of Dwelling units
Council Private Council Private YTD
Residential (new) 6 20 $1,670,561 $5,251,769 32
Residential (Alteration/Addition) 2 1 $143,100 $9,000
serviced Accommodation - 1 - $4,985,000 48
domestic outbuildings 10 1 $135,493 $20,000
Commercial (new) 2 - $481,000 -
Commercial (Alteration/Addition) - - - -
Industry (new) 3 1 $72,000 $239,054
Industry (Alteration/Addition) - - - -
public buildings (new) - - - -
public buildings (Alteration/Addition) 2 - $75,780 -
swimming pools 2 - $10,000 -
Miscellaneous - 2 - $220,000
totAl 27 26 $2,587,934 $10,724,823 80
ytD
building Applications Received 62
new dwelling units (Council Approved) 13
new dwelling units (privately Approved) 18
building searches 4
building Record searches 21
special Reports 5
plumbing Applications Received 39
plumbing Approvals Issued 31
building and plumbing Inspections 278
totAl 471
sA3 plAnnIng foR lIVeAbIlIty Cont’d 2010/11
ACHIeVeMents
AnnuAl RepoRt 1 JULY 2010 TO 30 JUNE 2011 PA G E 3 1
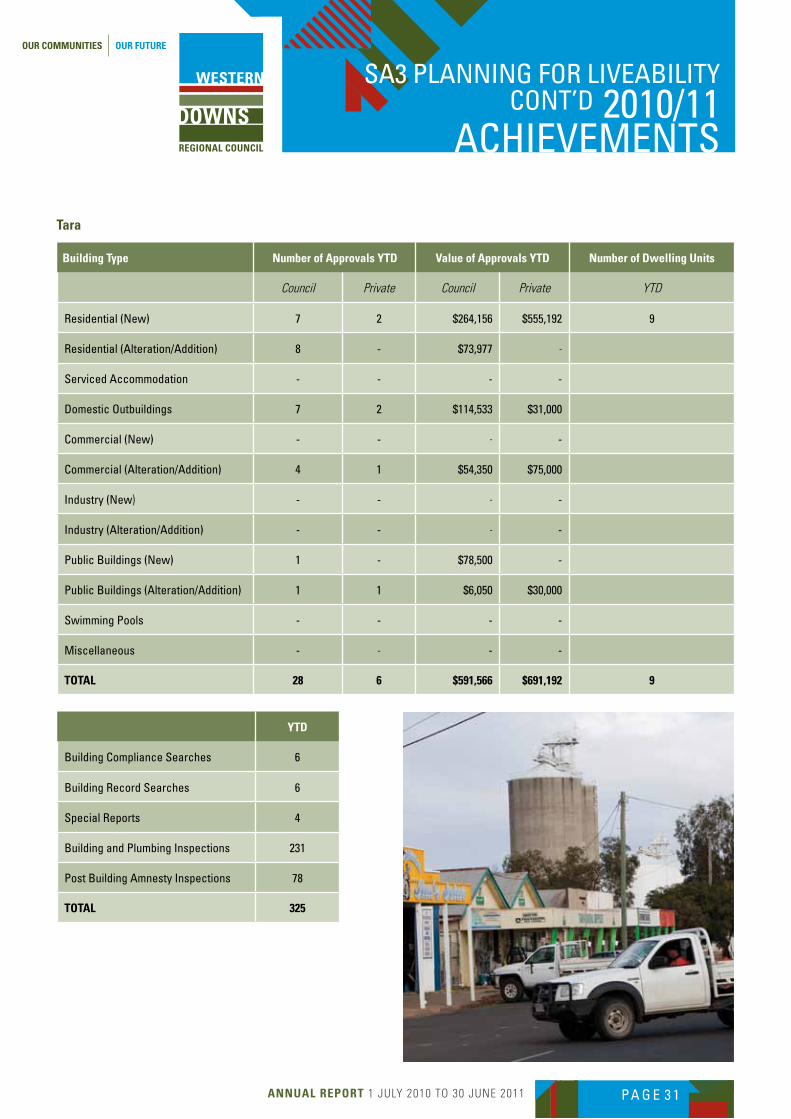
tara
Building type number of Approvals ytD Value of Approvals ytD number of Dwelling units
Council Private Council Private YTD
Residential (new) 7 2 $264,156 $555,192 9
Residential (Alteration/Addition) 8 - $73,977 -
serviced Accommodation - - - -
domestic outbuildings 7 2 $114,533 $31,000
Commercial (new) - - - -
Commercial (Alteration/Addition) 4 1 $54,350 $75,000
Industry (new) - - - -
Industry (Alteration/Addition) - - - -
public buildings (new) 1 - $78,500 -
public buildings (Alteration/Addition) 1 1 $6,050 $30,000
swimming pools - - - -
Miscellaneous - - - -
totAl 28 6 $591,566 $691,192 9
ytD
building Compliance searches 6
building Record searches 6
special Reports 4
building and plumbing Inspections 231
post building Amnesty Inspections 78
totAl 325
sA3 plAnnIng foR lIVeAbIlIty Cont’d 2010/11
ACHIeVeMents
AnnuAl RepoRt 1 JULY 2010 TO 30 JUNE 2011 PA G E 3 2
SA 4 ouR enVIRonMent
SA 4 our environment incorporates the strategic functions of
Environmental Health, Rural Services and Waste Management.
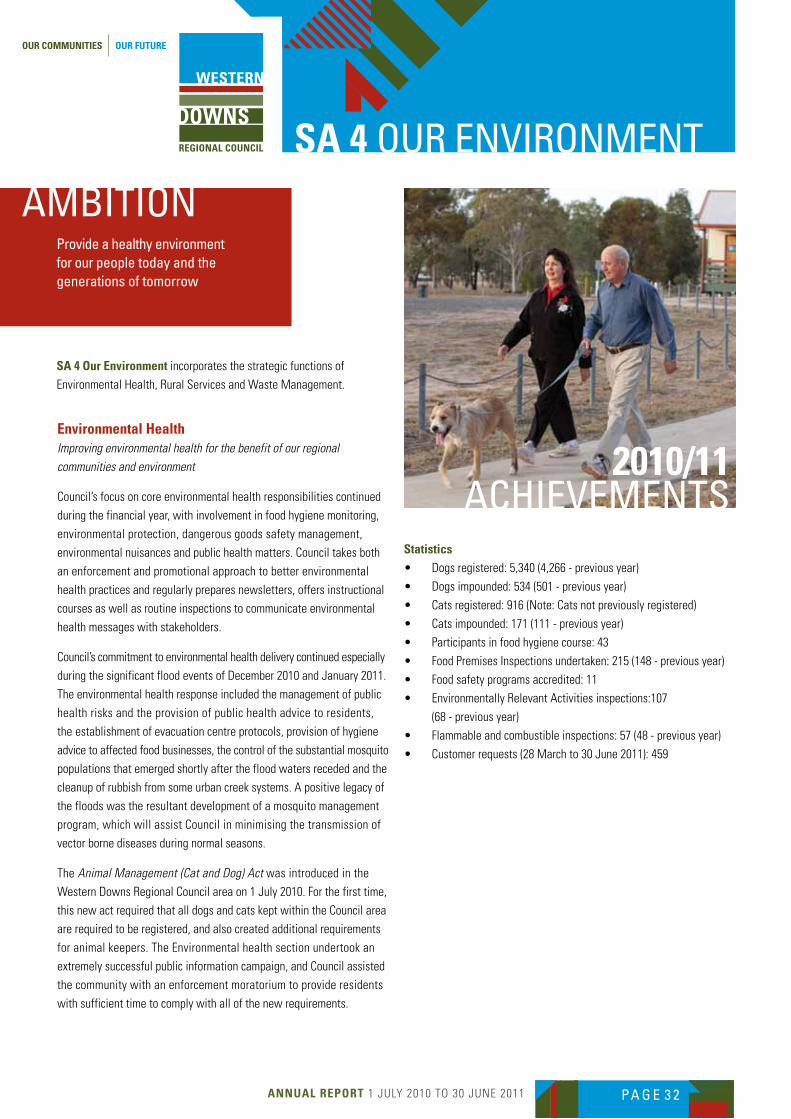
environmental HealthImproving environmental health for the benefit of our regional communities and environment
Council’s focus on core environmental health responsibilities continued
during the financial year, with involvement in food hygiene monitoring,
environmental protection, dangerous goods safety management,
environmental nuisances and public health matters. Council takes both
an enforcement and promotional approach to better environmental
health practices and regularly prepares newsletters, offers instructional
courses as well as routine inspections to communicate environmental
health messages with stakeholders.
Council’s commitment to environmental health delivery continued especially
during the significant flood events of December 2010 and January 2011.
The environmental health response included the management of public
health risks and the provision of public health advice to residents,
the establishment of evacuation centre protocols, provision of hygiene
advice to affected food businesses, the control of the substantial mosquito
populations that emerged shortly after the flood waters receded and the
cleanup of rubbish from some urban creek systems. A positive legacy of
the floods was the resultant development of a mosquito management
program, which will assist Council in minimising the transmission of
vector borne diseases during normal seasons.
The Animal Management (Cat and Dog) Act was introduced in the
Western Downs Regional Council area on 1 July 2010. For the first time,
this new act required that all dogs and cats kept within the Council area
are required to be registered, and also created additional requirements
for animal keepers. The Environmental health section undertook an
extremely successful public information campaign, and Council assisted
the community with an enforcement moratorium to provide residents
with sufficient time to comply with all of the new requirements.
AMbItIon
2010/11 ACHIeVeMents
Statistics• Dogsregistered:5,340(4,266-previousyear)
• Dogsimpounded:534(501-previousyear)
• Catsregistered:916(Note:Catsnotpreviouslyregistered)
• Catsimpounded:171(111-previousyear)
• Participantsinfoodhygienecourse:43
• FoodPremisesInspectionsundertaken:215(148-previousyear)
• Foodsafetyprogramsaccredited:11
• EnvironmentallyRelevantActivitiesinspections:107
(68 - previous year)
• Flammableandcombustibleinspections:57(48-previousyear)
• Customerrequests(28Marchto30June2011):459
provide a healthy environment for our people today and the generations of tomorrow
AnnuAl RepoRt 1 JULY 2010 TO 30 JUNE 2011 PA G E 3 3
Rural Services/natural Resource Management Create a natural environment that is valued and sustainable by managing the region’s natural character, heritage and values
This year saw the continuing on ground fight against the emerging
animal and plant pests and work also continued on a region wide
pest management plan. The group also maintained stock routes under
Council’s control and offered rural services such as Drummuster.
Projects for the construction of washdown bays commenced, with the
project in Wandoan commenced but completion was delayed due to
flooding. Council assisted a number of natural resource management
(NRM) groups with the delivery of on ground environmental projects in
sensitive areas such as creeks and reserves and this included work with
the Bunya Mountains Murri Ranger program for the on ground projects
in Russell Park, Bunya Mountains.
Many sections of Council’s wild dog check fences were damaged and as
much as 5.3 km of fencing completely destroyed during the summer flood
events. Furthermore, many stock route facilities operated by Council
were either damaged or destroyed by flood waters. Repairs to the prior-
ity sections of the check fences have generally been completed and appli-
cations for funding have been made for repairs to the stock route facilities.
Statistics•WildDogscalpbountiespaid:998(885-previousyear)
•Wilddogbaitingparticipants:314(approximate)
•Wilddogstrapped:53(77-previousyear)
•Drummusterdrumscollected:51,958(94,622-previousyear)
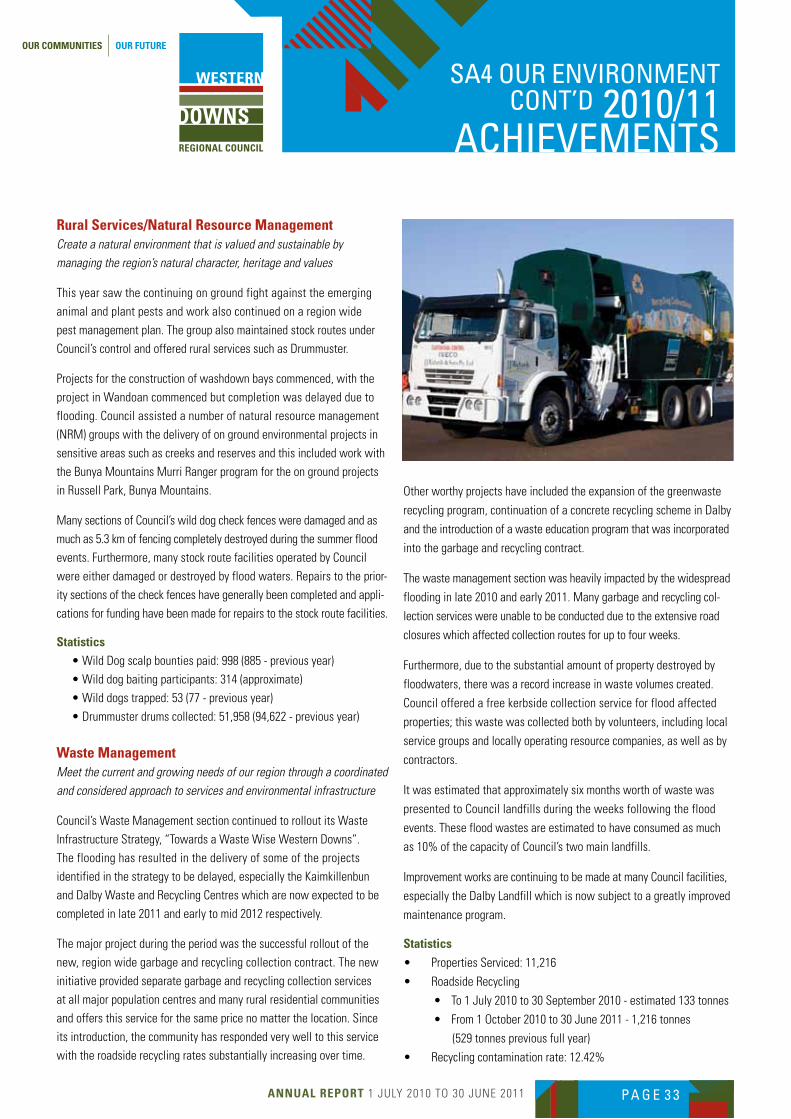
Waste ManagementMeet the current and growing needs of our region through a coordinated and considered approach to services and environmental infrastructure
Council’s Waste Management section continued to rollout its Waste
Infrastructure Strategy, “Towards a Waste Wise Western Downs”.
The flooding has resulted in the delivery of some of the projects
identified in the strategy to be delayed, especially the Kaimkillenbun
and Dalby Waste and Recycling Centres which are now expected to be
completed in late 2011 and early to mid 2012 respectively.
The major project during the period was the successful rollout of the
new, region wide garbage and recycling collection contract. The new
initiative provided separate garbage and recycling collection services
at all major population centres and many rural residential communities
and offers this service for the same price no matter the location. Since
its introduction, the community has responded very well to this service
with the roadside recycling rates substantially increasing over time.
sA4 ouR enVIRonMent Cont’d 2010/11
ACHIeVeMents
Other worthy projects have included the expansion of the greenwaste
recycling program, continuation of a concrete recycling scheme in Dalby
and the introduction of a waste education program that was incorporated
into the garbage and recycling contract.
The waste management section was heavily impacted by the widespread
flooding in late 2010 and early 2011. Many garbage and recycling col-
lection services were unable to be conducted due to the extensive road
closures which affected collection routes for up to four weeks.
Furthermore, due to the substantial amount of property destroyed by
floodwaters, there was a record increase in waste volumes created.
Council offered a free kerbside collection service for flood affected
properties; this waste was collected both by volunteers, including local
service groups and locally operating resource companies, as well as by
contractors.
It was estimated that approximately six months worth of waste was
presented to Council landfills during the weeks following the flood
events. These flood wastes are estimated to have consumed as much
as 10% of the capacity of Council’s two main landfills.
Improvement works are continuing to be made at many Council facilities,
especially the Dalby Landfill which is now subject to a greatly improved
maintenance program.
Statistics
• PropertiesServiced:11,216
• RoadsideRecycling
• To1July2010to30September2010-estimated133tonnes
• From1October2010to30June2011-1,216tonnes
(529 tonnes previous full year)
• Recyclingcontaminationrate:12.42%
AnnuAl RepoRt 1 JULY 2010 TO 30 JUNE 2011 PA G E 3 4
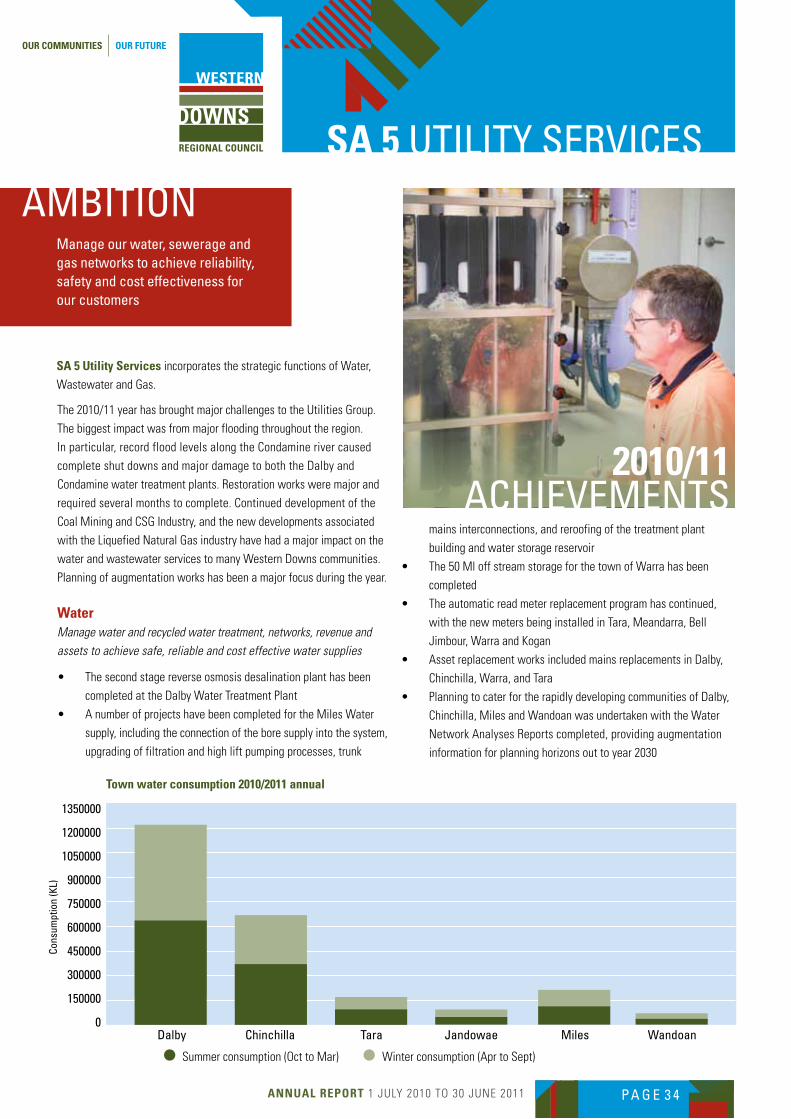
SA 5 utIlIty seRVICes
SA 5 utility Services incorporates the strategic functions of Water,
Wastewater and Gas.
AMbItIon
2010/11 ACHIeVeMents
Manage our water, sewerage and gas networks to achieve reliability, safety and cost effectiveness for our customers
The 2010/11 year has brought major challenges to the Utilities Group.
The biggest impact was from major flooding throughout the region.
In particular, record flood levels along the Condamine river caused
complete shut downs and major damage to both the Dalby and
Condamine water treatment plants. Restoration works were major and
required several months to complete. Continued development of the
Coal Mining and CSG Industry, and the new developments associated
with the Liquefied Natural Gas industry have had a major impact on the
water and wastewater services to many Western Downs communities.
Planning of augmentation works has been a major focus during the year.
WaterManage water and recycled water treatment, networks, revenue and assets to achieve safe, reliable and cost effective water supplies
• Thesecondstagereverseosmosisdesalinationplanthasbeen
completed at the Dalby Water Treatment Plant
• AnumberofprojectshavebeencompletedfortheMilesWater
supply, including the connection of the bore supply into the system,
upgrading of filtration and high lift pumping processes, trunk
mains interconnections, and reroofing of the treatment plant
building and water storage reservoir
• The50MloffstreamstorageforthetownofWarrahasbeen
completed
• Theautomaticreadmeterreplacementprogramhascontinued,
with the new meters being installed in Tara, Meandarra, Bell
Jimbour, Warra and Kogan
• AssetreplacementworksincludedmainsreplacementsinDalby,
Chinchilla, Warra, and Tara
• PlanningtocaterfortherapidlydevelopingcommunitiesofDalby,
Chinchilla, Miles and Wandoan was undertaken with the Water
Network Analyses Reports completed, providing augmentation
information for planning horizons out to year 2030
dalby Chinchilla tara Jandowae Miles wandoan
Cons
umpt
ion
(Kl)
Summer consumption (Oct to Mar) Winter consumption (Apr to Sept)
town water consumption 2010/2011 annual
1350000
1200000
1050000
900000
750000
600000
450000
300000
150000
0
AnnuAl RepoRt 1 JULY 2010 TO 30 JUNE 2011 PA G E 3 5
sA5 utIlIty seRVICes Cont’d 2010/11
ACHIeVeMents
dalby Chinchilla tara Jandowae Miles wandoan
Cons
umpt
ion
(l/C
onn/
day
)
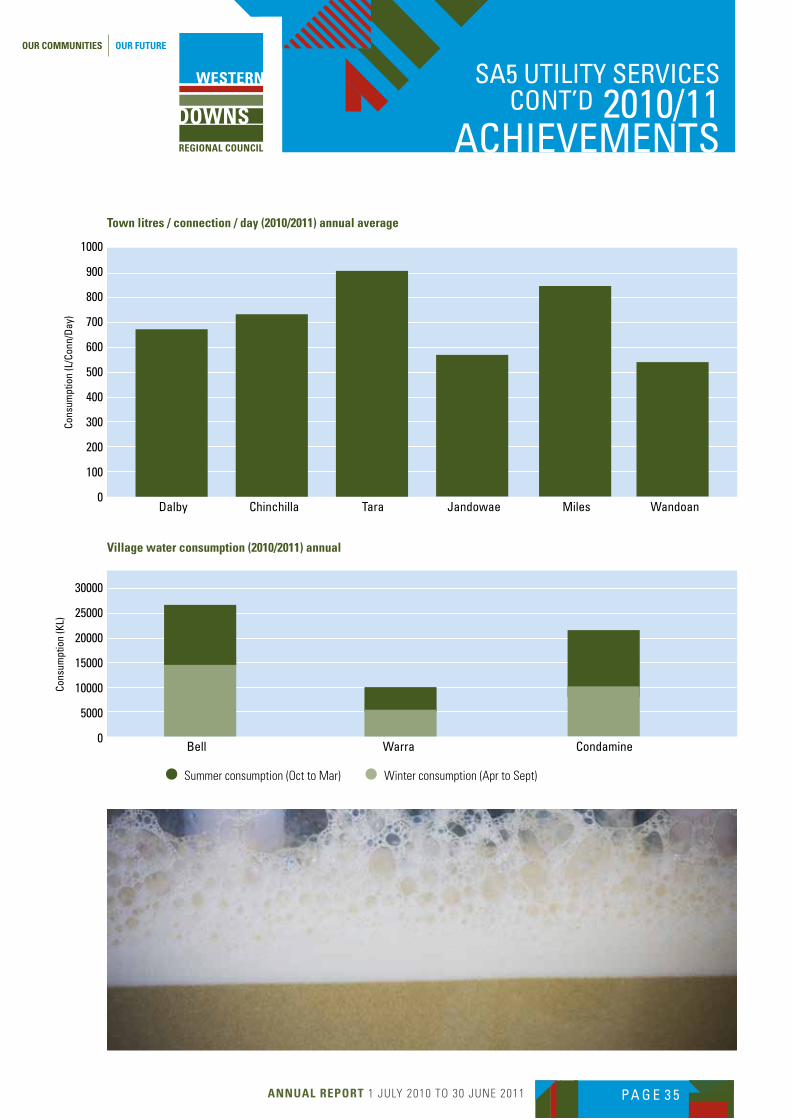
town litres / connection / day (2010/2011) annual average
1000
900
800
700
600
500
400
300
200
100
0
bell warra Condamine
Cons
umpt
ion
(Kl)
Village water consumption (2010/2011) annual
30000
25000
20000
15000
10000
5000
0
Summer consumption (Oct to Mar) Winter consumption (Apr to Sept)
AnnuAl RepoRt 1 JULY 2010 TO 30 JUNE 2011 PA G E 3 6
Cons
umpt
ion
(l/C
onn/
day
)Co
nsum
ptio
n (K
l)Co
nsum
ptio
n (l
/Con
n/d
ay)
800
700
600
500
400
300
200
100
0
12000
10000
8000
6000
4000
2000
0
1200
1000
800
600
400
200
0
sA5 utIlIty seRVICes Cont’d 2010/11
ACHIeVeMents
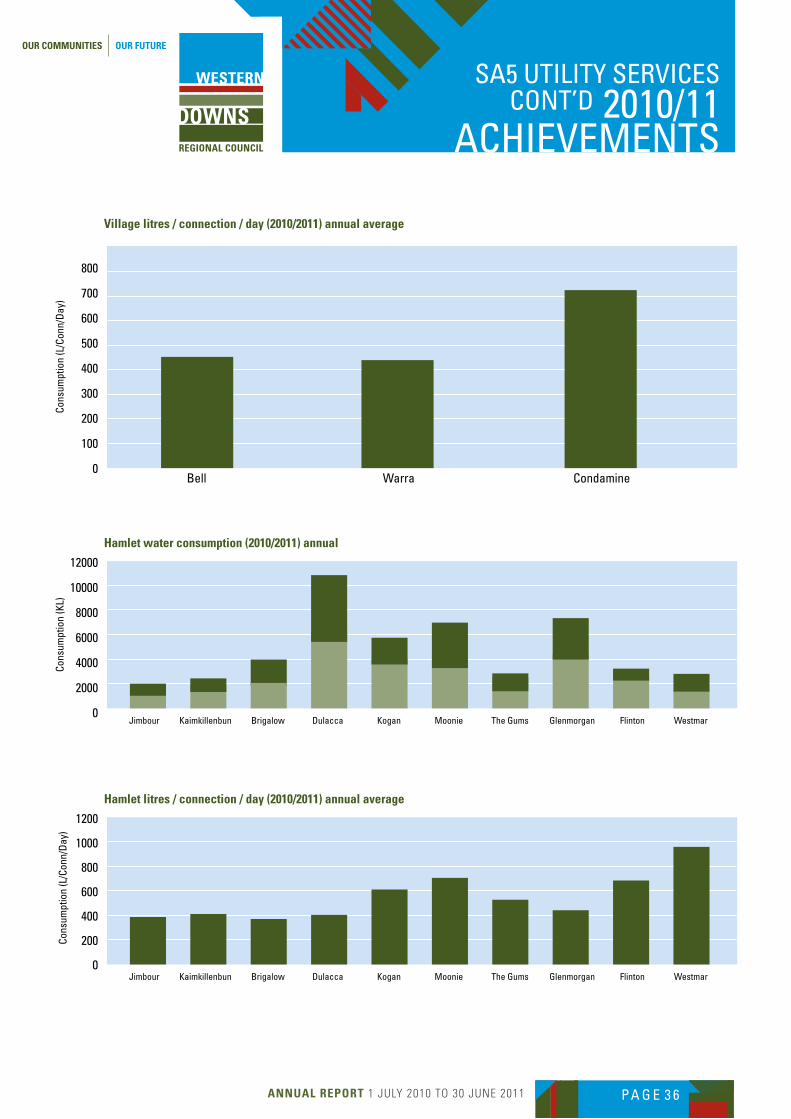
Village litres / connection / day (2010/2011) annual average
Hamlet water consumption (2010/2011) annual
Hamlet litres / connection / day (2010/2011) annual average
bell warra Condamine
Jimbour Kaimkillenbun brigalow dulacca Kogan Moonie the gums glenmorgan flinton westmar
Jimbour Kaimkillenbun brigalow dulacca Kogan Moonie the gums glenmorgan flinton westmar
AnnuAl RepoRt 1 JULY 2010 TO 30 JUNE 2011 PA G E 3 7
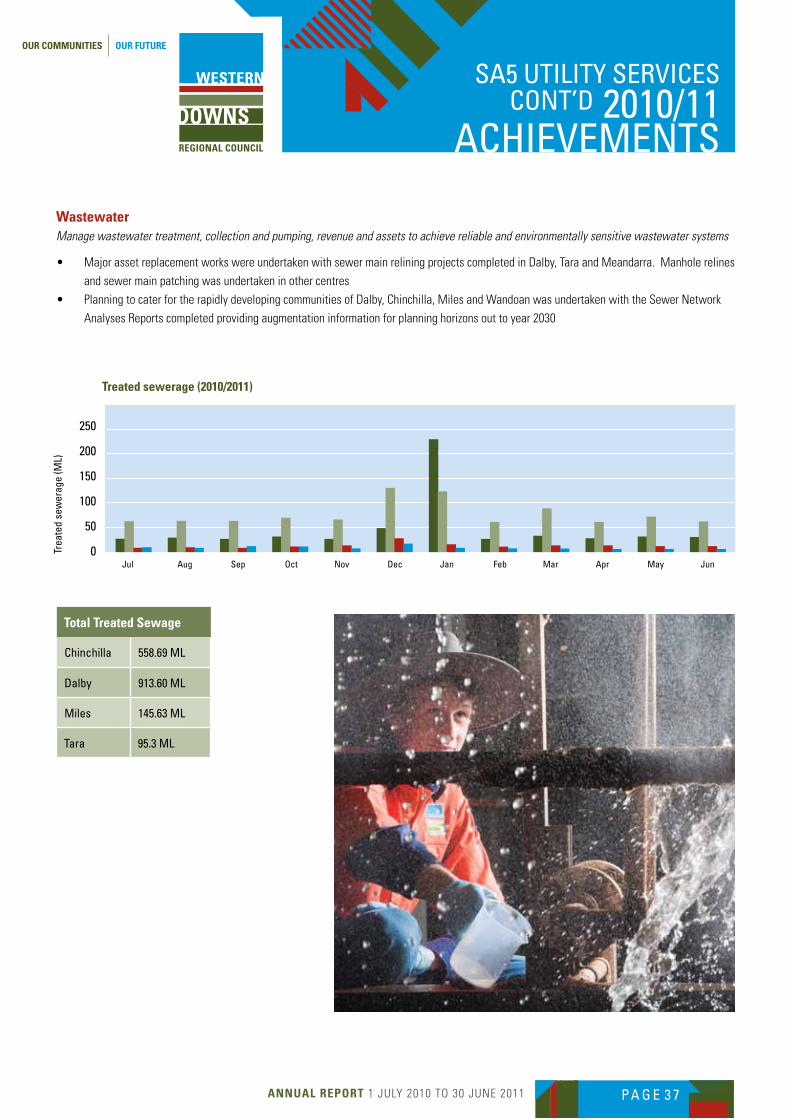
WastewaterManage wastewater treatment, collection and pumping, revenue and assets to achieve reliable and environmentally sensitive wastewater systems
• MajorassetreplacementworkswereundertakenwithsewermainreliningprojectscompletedinDalby,TaraandMeandarra.Manholerelines
and sewer main patching was undertaken in other centres
• PlanningtocaterfortherapidlydevelopingcommunitiesofDalby,Chinchilla,MilesandWandoanwasundertakenwiththeSewerNetwork
Analyses Reports completed providing augmentation information for planning horizons out to year 2030
total treated Sewage
Chinchilla 558.69 Ml
dalby 913.60 Ml
Miles 145.63 Ml
tara 95.3 Ml
sA5 utIlIty seRVICes Cont’d 2010/11
ACHIeVeMents
trea
ted
sew
erag
e (M
l)
250
200
150
100
50
0
treated sewerage (2010/2011)
Jul Aug sep oct nov dec Jan feb Mar Apr May Jun
AnnuAl RepoRt 1 JULY 2010 TO 30 JUNE 2011 PA G E 3 8
sA5 utIlIty seRVICes Cont’d 2010/11
ACHIeVeMents
Cons
umpt
ion
(m3 )
600000
500000
400000
300000
200000
100000
0
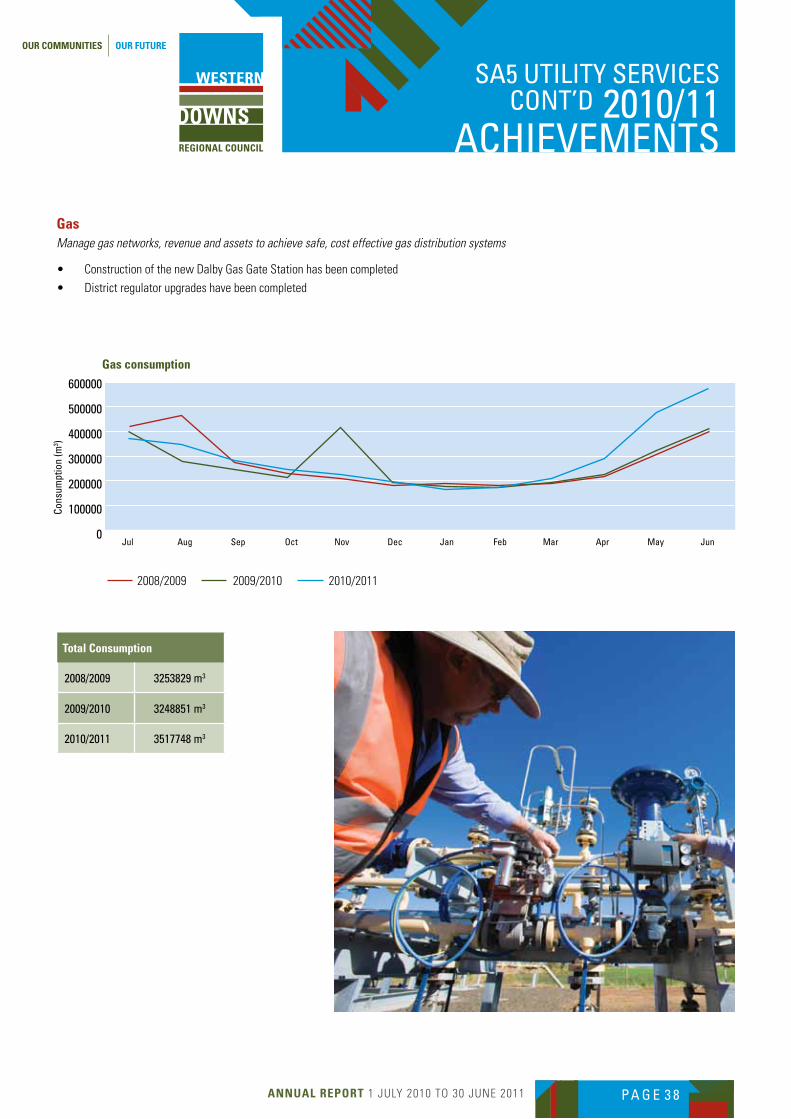
Gas consumption
Jul Aug sep oct nov dec Jan feb Mar Apr May Jun
2008/2009 2009/2010 2010/2011
GasManage gas networks, revenue and assets to achieve safe, cost effective gas distribution systems
• ConstructionofthenewDalbyGasGateStationhasbeencompleted
• Districtregulatorupgradeshavebeencompleted
total Consumption
2008/2009 3253829 m3
2009/2010 3248851 m3
2010/2011 3517748 m3
AnnuAl RepoRt 1 JULY 2010 TO 30 JUNE 2011 PA G E 3 9
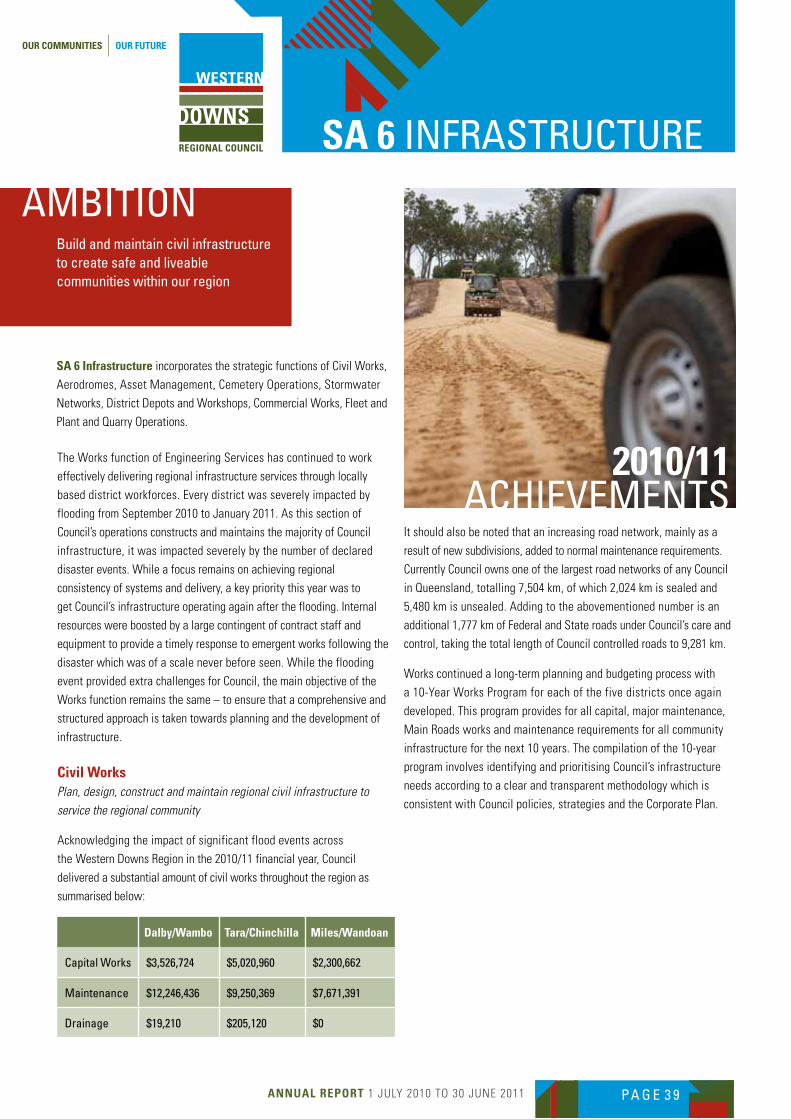
SA 6 InfRAstRuCtuRe
SA 6 Infrastructure incorporates the strategic functions of Civil Works,
Aerodromes, Asset Management, Cemetery Operations, Stormwater
Networks, District Depots and Workshops, Commercial Works, Fleet and
Plant and Quarry Operations.
AMbItIon
2010/11 ACHIeVeMents
build and maintain civil infrastructure to create safe and liveable communities within our region
The Works function of Engineering Services has continued to work
effectively delivering regional infrastructure services through locally
based district workforces. Every district was severely impacted by
flooding from September 2010 to January 2011. As this section of
Council’s operations constructs and maintains the majority of Council
infrastructure, it was impacted severely by the number of declared
disaster events. While a focus remains on achieving regional
consistency of systems and delivery, a key priority this year was to
get Council’s infrastructure operating again after the flooding. Internal
resources were boosted by a large contingent of contract staff and
equipment to provide a timely response to emergent works following the
disaster which was of a scale never before seen. While the flooding
event provided extra challenges for Council, the main objective of the
Works function remains the same – to ensure that a comprehensive and
structured approach is taken towards planning and the development of
infrastructure.
Civil WorksPlan, design, construct and maintain regional civil infrastructure to service the regional community
Acknowledging the impact of significant flood events across
the Western Downs Region in the 2010/11 financial year, Council
delivered a substantial amount of civil works throughout the region as
summarised below:
Dalby/Wambo tara/Chinchilla Miles/Wandoan
Capital works $3,526,724 $5,020,960 $2,300,662
Maintenance $12,246,436 $9,250,369 $7,671,391
drainage $19,210 $205,120 $0
It should also be noted that an increasing road network, mainly as a
result of new subdivisions, added to normal maintenance requirements.
Currently Council owns one of the largest road networks of any Council
in Queensland, totalling 7,504 km, of which 2,024 km is sealed and
5,480 km is unsealed. Adding to the abovementioned number is an
additional 1,777 km of Federal and State roads under Council’s care and
control, taking the total length of Council controlled roads to 9,281 km.
Works continued a long-term planning and budgeting process with
a 10-Year Works Program for each of the five districts once again
developed. This program provides for all capital, major maintenance,
Main Roads works and maintenance requirements for all community
infrastructure for the next 10 years. The compilation of the 10-year
program involves identifying and prioritising Council’s infrastructure
needs according to a clear and transparent methodology which is
consistent with Council policies, strategies and the Corporate Plan.
AnnuAl RepoRt 1 JULY 2010 TO 30 JUNE 2011 PA G E 4 0
sA6 InfRAstRuCtuRe Cont’d 2010/11
ACHIeVeMents
Parks and GardensMaintain regional Parks and Gardens assets to service the needs of the Western Downs Communities
The Parks and Gardens function is resourced through the Works Section
of Council and this year resources were aligned closer to other Works
functions to provide a better delivery service to the community in this
area. The strategy remains to enhance the existing parks and gardens
throughout the region. Flooding and high rainfall caused a large drain on
resources in this section but parks and gardens throughout the region
have responded well after many years of drought.
Aerodromes Maintain and enhance aerodromes relevant to CASA and community requirements
Aerodromes are the responsibility of Council’s local workforce for
operations and maintenance. Procedures and policies are developed
through the Director of Engineering Services. Council has developed
a Western Downs Regional Council Airport Strategy which identifies
the Chinchilla Aerodrome to be designated as the Regional Airport.
Council continues to work with the resource sector on proposals to
upgrade a number of Aerodromes throughout the region. All aerodromes
have continued to be maintained and a longer term view of infrastructure
at each strip has been taken. This has resulted in an increased effort in
maintaining the assets at these important facilities in order to provide
improved services to users.
Asset ManagementDevelop a whole of organisation approach to implement best practice asset management
Substantial changes to the Local Government Act have highlighted the
importance of asset management in local government. Council has
continued with the development of a whole of organisation approach
to Asset Management with associated financial modelling and service
level standards. The development of Core Asset Management Plans for
key assets of Council has commenced and will be adopted by Council
prior to the timeframe of 30 September 2011 set by the State Government.
The asset management team has been reviewing the asset inventory
register, which has involved a desktop audit of the road, water and
sewer networks. A field audit of the road network was conducted
that included the collection of GPS data of the entire Council road and
footpath network, collecting details such as the length, width and
construction standard of roads, bridges and floodways. Work is continuing
on the collection of inventory data for Council’s building assets.
The asset management team has now combined and standardised
the asset inventory registers from the nine former entities (including
Boards). In addition, Aerial Surveys of 18 town and key Council project
areas was completed and available for use by the whole organisation.
CemeteriesMaintain cemetery operations to a level acceptable to the community
The cemeteries function continued to be delivered locally throughout
the region. The extension of the Dalby Cemetery was undertaken in
the 2010/11 financial year to provide for future expansion. Council is
currently developing an online database system for cemetery records.
When completed, information will be available to the public, via Council’s
website, of burial location and other information.
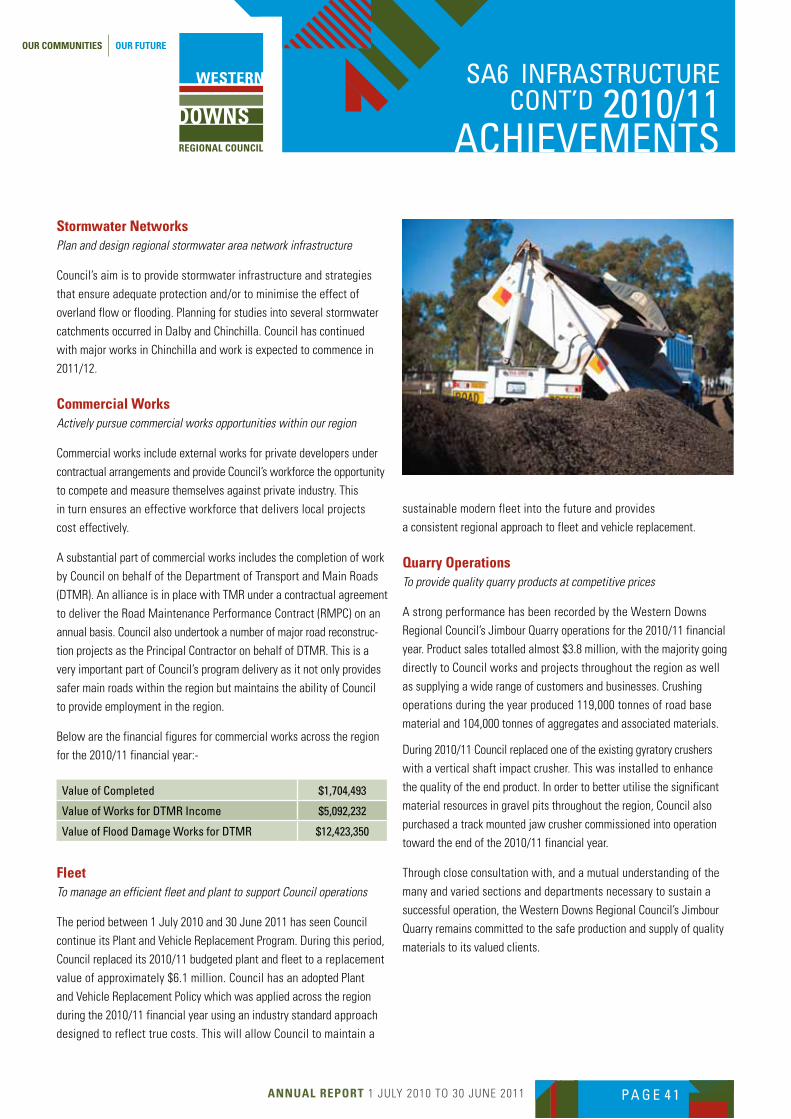
AnnuAl RepoRt 1 JULY 2010 TO 30 JUNE 2011 PA G E 4 1
Stormwater networksPlan and design regional stormwater area network infrastructure
Council’s aim is to provide stormwater infrastructure and strategies
that ensure adequate protection and/or to minimise the effect of
overland flow or flooding. Planning for studies into several stormwater
catchments occurred in Dalby and Chinchilla. Council has continued
with major works in Chinchilla and work is expected to commence in
2011/12.
Commercial WorksActively pursue commercial works opportunities within our region
Commercial works include external works for private developers under
contractual arrangements and provide Council’s workforce the opportunity
to compete and measure themselves against private industry. This
in turn ensures an effective workforce that delivers local projects
cost effectively.
A substantial part of commercial works includes the completion of work
by Council on behalf of the Department of Transport and Main Roads
(DTMR). An alliance is in place with TMR under a contractual agreement
to deliver the Road Maintenance Performance Contract (RMPC) on an
annual basis. Council also undertook a number of major road reconstruc-
tion projects as the Principal Contractor on behalf of DTMR. This is a
very important part of Council’s program delivery as it not only provides
safer main roads within the region but maintains the ability of Council
to provide employment in the region.
Below are the financial figures for commercial works across the region
for the 2010/11 financial year:-
Value of Completed $1,704,493
Value of works for dtMR Income $5,092,232
Value of flood damage works for dtMR $12,423,350
FleetTo manage an efficient fleet and plant to support Council operations
The period between 1 July 2010 and 30 June 2011 has seen Council
continue its Plant and Vehicle Replacement Program. During this period,
Council replaced its 2010/11 budgeted plant and fleet to a replacement
value of approximately $6.1 million. Council has an adopted Plant
and Vehicle Replacement Policy which was applied across the region
during the 2010/11 financial year using an industry standard approach
designed to reflect true costs. This will allow Council to maintain a
sA6 InfRAstRuCtuRe Cont’d 2010/11
ACHIeVeMents
sustainable modern fleet into the future and provides
a consistent regional approach to fleet and vehicle replacement.
Quarry operations To provide quality quarry products at competitive prices
A strong performance has been recorded by the Western Downs
Regional Council’s Jimbour Quarry operations for the 2010/11 financial
year. Product sales totalled almost $3.8 million, with the majority going
directly to Council works and projects throughout the region as well
as supplying a wide range of customers and businesses. Crushing
operations during the year produced 119,000 tonnes of road base
material and 104,000 tonnes of aggregates and associated materials.
During 2010/11 Council replaced one of the existing gyratory crushers
with a vertical shaft impact crusher. This was installed to enhance
the quality of the end product. In order to better utilise the significant
material resources in gravel pits throughout the region, Council also
purchased a track mounted jaw crusher commissioned into operation
toward the end of the 2010/11 financial year.
Through close consultation with, and a mutual understanding of the
many and varied sections and departments necessary to sustain a
successful operation, the Western Downs Regional Council’s Jimbour
Quarry remains committed to the safe production and supply of quality
materials to its valued clients.
AnnuAl RepoRt 1 JULY 2010 TO 30 JUNE 2011 PA G E 4 2
Significant Projects
A large number of important projects have been completed during the past 12
months, refer to the tables below:
Chinchilla Road Projects
Road name Work Description
Vanrenan’s Road Resheet and seal
Chinchilla tara Road shoulder sealing
nudley school Road Concrete slab through floodway
Chinchilla street new footpath at Visitor Information Centre
Various bitumen Roads bitumen Reseal program 2010/11
Various gravel Roads gravel Resheeting program 2010/11
flood damage emergency repairs on Council and tMR networks
Dalby Road Projects
Road name Work Description
Hedge Road Reconstruction
springvale Road Reconstruction
branch Creek Road Reconstruction
pirrinuan-Apunyal Road Rehabilitation
black street Road Construction
Hustons place Road Construction
bidstrups Road Rehabilitation
branch Creek Road footpath
edward street footpath
Myall Creek pathway extension
nicholson street Rehabilitation
Various gravel Roads gravel Resheeting program 2010/11
sA6 InfRAstRuCtuRe Cont’d 2010/11
ACHIeVeMents
sIgnIfICAnt pRoJeCts
AnnuAl RepoRt 1 JULY 2010 TO 30 JUNE 2011 PA G E 4 3
Miles Road Projects
Road name Work Description
dulacca south Road widen and seal
daisy street pine street to dawson street, bitumen Reseal
eleanor street Condamine street to lee street, bitumen Reseal
edith street Centenary Avenue to Racecourse Road, bitumen Reseal
pollard street bitumen Reseal
McAuliffe street bitumen Reseal
bishop drive bitumen Reseal
lawton place bitumen Reseal
dawson street Mary street to Mcnulty street, bitumen Reseal
wallen street Marian street to daisy street, bitumen Reseal
Colamba street Murilla street to Hookswood Road, bitumen Reseal
Murilla street Morgan street to dawson street, bitumen Reseal
slessar lane bitumen Reseal
Mcnulty street Creek to bourne street, bitumen Reseal
Hawkins street bitumen Reseal
bourne street bitumen Reseal
lynagh street Mary street to Mcnulty street, bitumen Reseal
short street taralgon Avenue to glynn Avenue, bitumen Reseal
Killarney street taralgon Avenue to glynn Avenue, bitumen Reseal
Anzac street taralgon Avenue to glynn Avenue, bitumen Reseal
temple street taralgon Avenue to glynn Avenue, bitumen Reseal
bell street taralgon Avenue to glynn Avenue, bitumen Reseal
Jardine street drillham south Road to drillham
school Road bitumen Reseal
luckies lane gravel Resheet
drillham south Road gravel Resheet
Coates Road gravel Resheet
Matthews Road gravel Resheet
Corbetts Road gravel Resheet
eys Road gravel Resheet
freemans Road gravel Resheet
willets Road gravel Resheet
sherwood Road gravel Resheet
sA6 InfRAstRuCtuRe Cont’d 2010/11
ACHIeVeMents
sIgnIfICAnt pRoJeCts
AnnuAl RepoRt 1 JULY 2010 TO 30 JUNE 2011 PA G E 4 4
tara Road Projects
Road name Work Description
leichhardt Highway widen and overlay
goranba lane Resheet and seal
Cambridge Crossing Road Resheet and seal
bennetts school Road Resheet and seal
smallacombe street Intersection improvements
sara street Meandarra Replace footpath
Various bitumen Roads bitumen Reseal program 2010/11
Various gravel Roads gravel Resheeting program 2010/11
flood damage emergency repairs on Council and tMR networks
Wandoan Road Projects
Road name Work Description
Roche Creek Road widen and seal
nathan Road widen and seal
bungaban Road bitumen Reseal
Ryals Road bitumen Reseal
Cecils Road bitumen Reseal
grosmont bitumen Reseal
Royds street bitumen Reseal
o’sullivan park Car park bitumen Reseal
giligulgul Road gravel Resheet
Miscellaneous Projects
Miscellaneous Project name Work DescriptionDAlBy ReGIon dalby Cemetery extensionCharles drew bridge banner polesthomas Jack park bbQ Replacementlake broadwater softfall InstallationRussell park Carpark overlaysubdivision Construction Various subdivisions constructed throughout regionCHInCHIllA ReGIonChinchilla Cbd Heeney street street beautification (RlCIp)Chinchilla weir Improvements to picnic facilitiesgaske lane stormwater drainage, planning for stormwater drainage, ConstructiontARA ReGIon Meandarra Cbd street beautificationMIleS ReGIonMurilla street Colamba street to Condamine street - footpath upgrade
sA6 InfRAstRuCtuRe Cont’d 2010/11
ACHIeVeMents
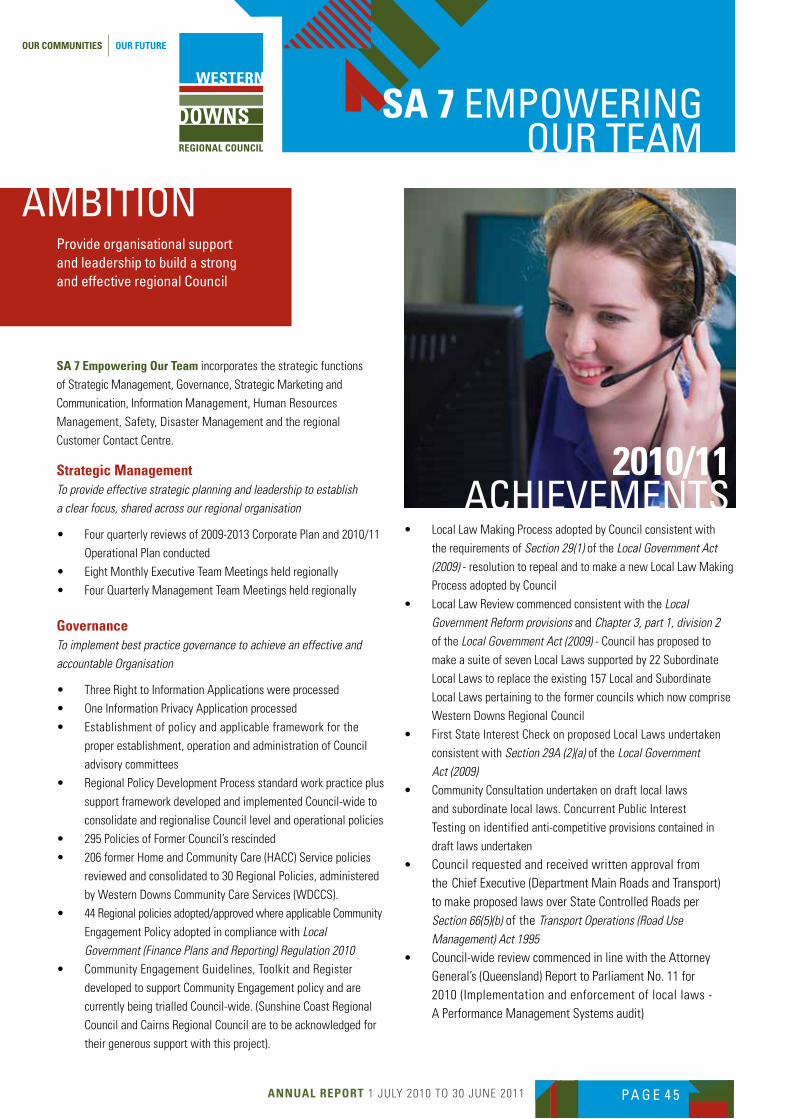
AnnuAl RepoRt 1 JULY 2010 TO 30 JUNE 2011 PA G E 4 5
SA 7 eMpoweRIng ouR teAM
SA 7 empowering our team incorporates the strategic functions
of Strategic Management, Governance, Strategic Marketing and
Communication, Information Management, Human Resources
Management, Safety, Disaster Management and the regional
Customer Contact Centre.
AMbItIon
2010/11 ACHIeVeMents
provide organisational support and leadership to build a strong and effective regional Council
Strategic Management To provide effective strategic planning and leadership to establish a clear focus, shared across our regional organisation
• Fourquarterlyreviewsof2009-2013CorporatePlanand2010/11
Operational Plan conducted
• EightMonthlyExecutiveTeamMeetingsheldregionally
• FourQuarterlyManagementTeamMeetingsheldregionally
GovernanceTo implement best practice governance to achieve an effective and accountable Organisation
• ThreeRighttoInformationApplicationswereprocessed
• OneInformationPrivacyApplicationprocessed
• Establishmentofpolicyandapplicableframeworkforthe
proper establishment, operation and administration of Council
advisory committees
• RegionalPolicyDevelopmentProcessstandardworkpracticeplus
support framework developed and implemented Council-wide to
consolidate and regionalise Council level and operational policies
• 295PoliciesofFormerCouncil’srescinded
• 206formerHomeandCommunityCare(HACC)Servicepolicies
reviewed and consolidated to 30 Regional Policies, administered
by Western Downs Community Care Services (WDCCS).
• 44Regionalpoliciesadopted/approvedwhereapplicableCommunity
Engagement Policy adopted in compliance with Local Government (Finance Plans and Reporting) Regulation 2010
• CommunityEngagementGuidelines,ToolkitandRegister
developed to support Community Engagement policy and are
currently being trialled Council-wide. (Sunshine Coast Regional
Council and Cairns Regional Council are to be acknowledged for
their generous support with this project).
• LocalLawMakingProcessadoptedbyCouncilconsistentwith
the requirements of Section 29(1) of the Local Government Act (2009) - resolution to repeal and to make a new Local Law Making
Process adopted by Council
• LocalLawReviewcommencedconsistentwiththeLocal Government Reform provisions and Chapter 3, part 1, division 2 of the Local Government Act (2009) - Council has proposed to
make a suite of seven Local Laws supported by 22 Subordinate
Local Laws to replace the existing 157 Local and Subordinate
Local Laws pertaining to the former councils which now comprise
Western Downs Regional Council
• FirstStateInterestCheckonproposedLocalLawsundertaken
consistent with Section 29A (2)(a) of the Local Government Act (2009)
• CommunityConsultationundertakenondraftlocallaws
and subordinate local laws. Concurrent Public Interest
Testing on identified anti-competitive provisions contained in
draft laws undertaken
• Council requested and received written approval from the Chief Executive (Department Main Roads and Transport) to make proposed laws over State Controlled Roads per Section 66(5)(b) of the Transport Operations (Road Use Management) Act 1995 • Council-wide review commenced in line with the Attorney General’s (Queensland) Report to Parliament No. 11 for 2010 (Implementation and enforcement of local laws - A Performance Management Systems audit)
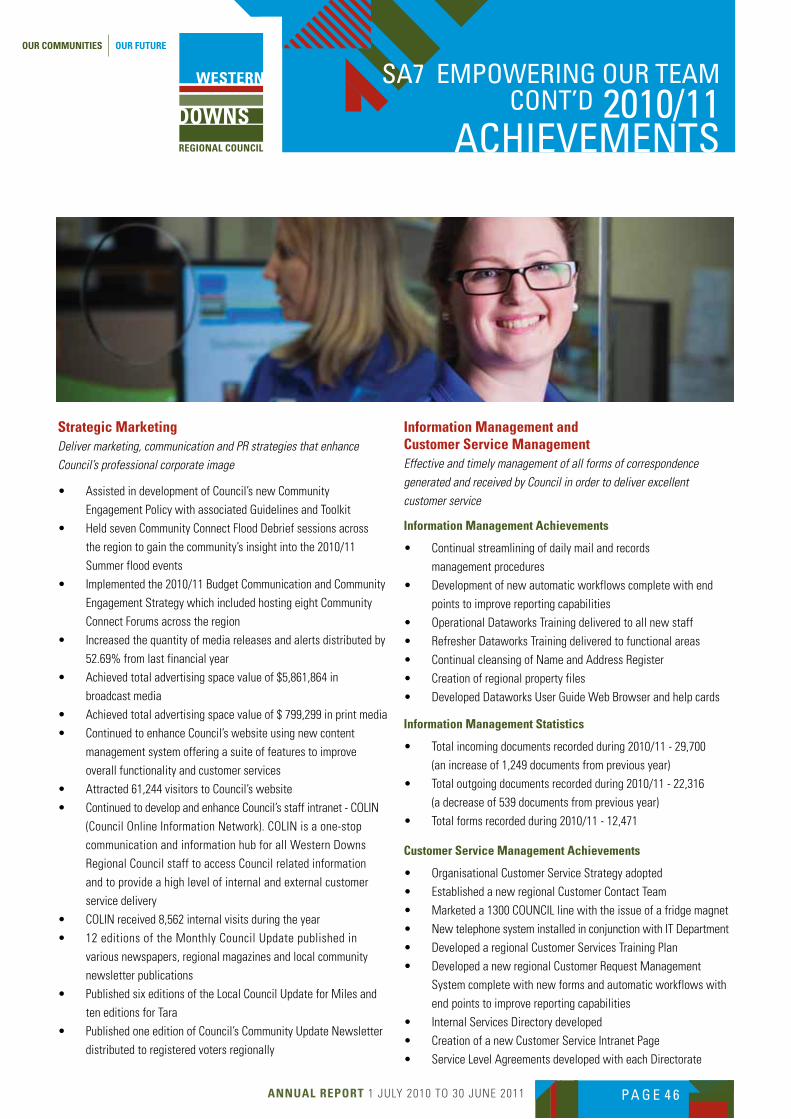
AnnuAl RepoRt 1 JULY 2010 TO 30 JUNE 2011 PA G E 4 6
sA7 eMpoweRIng ouR teAM Cont’d 2010/11
ACHIeVeMents
Strategic MarketingDeliver marketing, communication and PR strategies that enhance Council’s professional corporate image
• AssistedindevelopmentofCouncil’snewCommunity
Engagement Policy with associated Guidelines and Toolkit
• HeldsevenCommunityConnectFloodDebriefsessionsacross
the region to gain the community’s insight into the 2010/11
Summer flood events
• Implementedthe2010/11BudgetCommunicationandCommunity
Engagement Strategy which included hosting eight Community
Connect Forums across the region
• Increasedthequantityofmediareleasesandalertsdistributedby
52.69% from last financial year
• Achievedtotaladvertisingspacevalueof$5,861,864in
broadcast media
• Achievedtotaladvertisingspacevalueof$799,299inprintmedia
• ContinuedtoenhanceCouncil’swebsiteusingnewcontent
management system offering a suite of features to improve
overall functionality and customer services
• Attracted61,244visitorstoCouncil’swebsite
• ContinuedtodevelopandenhanceCouncil’sstaffintranet-COLIN
(Council Online Information Network). COLIN is a one-stop
communication and information hub for all Western Downs
Regional Council staff to access Council related information
and to provide a high level of internal and external customer
service delivery
• COLINreceived8,562internalvisitsduringtheyear
• 12editionsoftheMonthlyCouncilUpdatepublishedin
various newspapers, regional magazines and local community
newsletter publications
• PublishedsixeditionsoftheLocalCouncilUpdateforMilesand
ten editions for Tara
• PublishedoneeditionofCouncil’sCommunityUpdateNewsletter
distributed to registered voters regionally
Information Management and Customer Service ManagementEffective and timely management of all forms of correspondence generated and received by Council in order to deliver excellent customer service
Information Management Achievements
• Continualstreamliningofdailymailandrecords
management procedures
• Developmentofnewautomaticworkflowscompletewithend
points to improve reporting capabilities
• OperationalDataworksTrainingdeliveredtoallnewstaff
• RefresherDataworksTrainingdeliveredtofunctionalareas
• ContinualcleansingofNameandAddressRegister
• Creationofregionalpropertyfiles
• DevelopedDataworksUserGuideWebBrowserandhelpcards
Information Management Statistics
• Totalincomingdocumentsrecordedduring2010/11-29,700
(an increase of 1,249 documents from previous year)
• Totaloutgoingdocumentsrecordedduring2010/11-22,316
(a decrease of 539 documents from previous year)
• Totalformsrecordedduring2010/11-12,471
Customer Service Management Achievements
• OrganisationalCustomerServiceStrategyadopted
• EstablishedanewregionalCustomerContactTeam
• Marketeda1300COUNCILlinewiththeissueofafridgemagnet
• NewtelephonesysteminstalledinconjunctionwithITDepartment
• DevelopedaregionalCustomerServicesTrainingPlan
• DevelopedanewregionalCustomerRequestManagement
System complete with new forms and automatic workflows with
end points to improve reporting capabilities
• InternalServicesDirectorydeveloped
• CreationofanewCustomerServiceIntranetPage
• ServiceLevelAgreementsdevelopedwitheachDirectorate
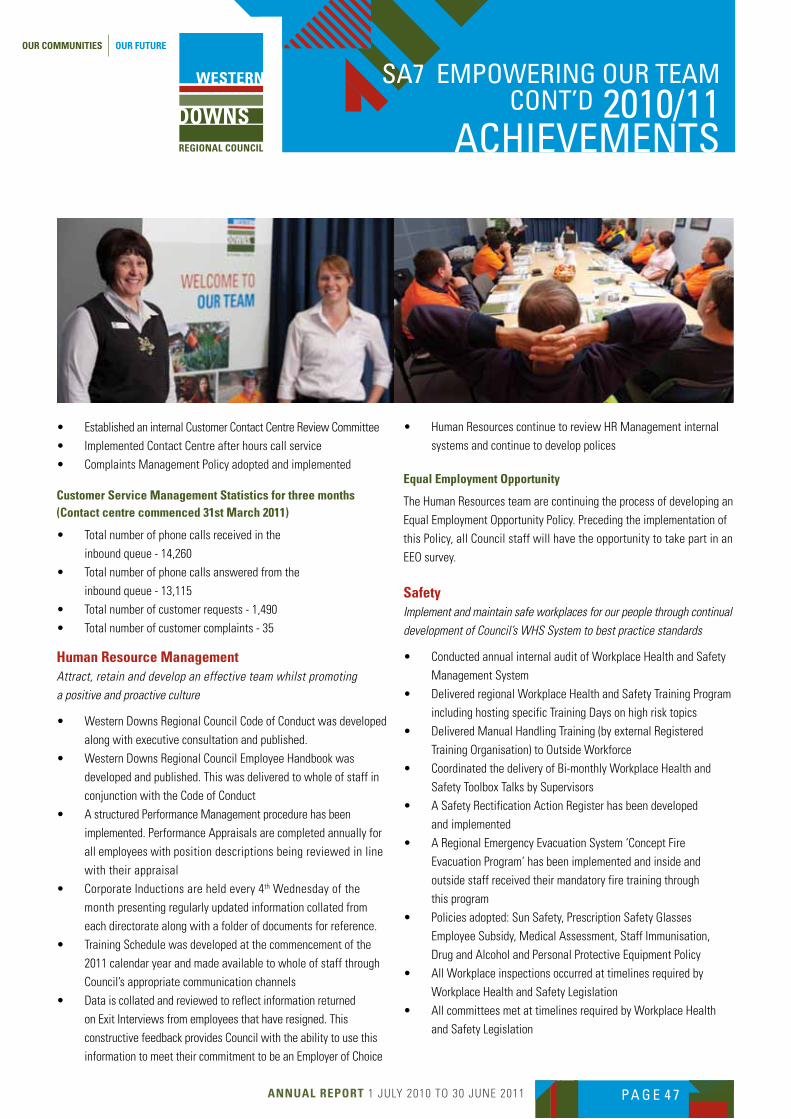
AnnuAl RepoRt 1 JULY 2010 TO 30 JUNE 2011 PA G E 4 7
sA7 eMpoweRIng ouR teAM Cont’d 2010/11
ACHIeVeMents
• EstablishedaninternalCustomerContactCentreReviewCommittee
• ImplementedContactCentreafterhourscallservice
• ComplaintsManagementPolicyadoptedandimplemented
Customer Service Management Statistics for three months (Contact centre commenced 31st March 2011)
• Totalnumberofphonecallsreceivedinthe
inbound queue - 14,260
• Totalnumberofphonecallsansweredfromthe
inbound queue - 13,115
• Totalnumberofcustomerrequests-1,490
• Totalnumberofcustomercomplaints-35
Human Resource Management Attract, retain and develop an effective team whilst promoting a positive and proactive culture
• WesternDownsRegionalCouncilCodeofConductwasdeveloped
along with executive consultation and published.
• WesternDownsRegionalCouncilEmployeeHandbookwas
developed and published. This was delivered to whole of staff in
conjunction with the Code of Conduct
• AstructuredPerformanceManagementprocedurehasbeen
implemented. Performance Appraisals are completed annually for
all employees with position descriptions being reviewed in line
with their appraisal
• CorporateInductionsareheldevery4th Wednesday of the
month presenting regularly updated information collated from
each directorate along with a folder of documents for reference.
• TrainingSchedulewasdevelopedatthecommencementofthe
2011 calendar year and made available to whole of staff through
Council’s appropriate communication channels
• Dataiscollatedandreviewedtoreflectinformationreturned
on Exit Interviews from employees that have resigned. This
constructive feedback provides Council with the ability to use this
information to meet their commitment to be an Employer of Choice
• HumanResourcescontinuetoreviewHRManagementinternal
systems and continue to develop polices
equal employment opportunity
The Human Resources team are continuing the process of developing an
Equal Employment Opportunity Policy. Preceding the implementation of
this Policy, all Council staff will have the opportunity to take part in an
EEO survey.
SafetyImplement and maintain safe workplaces for our people through continual development of Council’s WHS System to best practice standards
• ConductedannualinternalauditofWorkplaceHealthandSafety
Management System
• DeliveredregionalWorkplaceHealthandSafetyTrainingProgram
including hosting specific Training Days on high risk topics
• DeliveredManualHandlingTraining(byexternalRegistered
Training Organisation) to Outside Workforce
• CoordinatedthedeliveryofBi-monthlyWorkplaceHealthand
Safety Toolbox Talks by Supervisors
• ASafetyRectificationActionRegisterhasbeendeveloped
and implemented
• ARegionalEmergencyEvacuationSystem‘ConceptFire
Evacuation Program’ has been implemented and inside and
outside staff received their mandatory fire training through
this program
• Policiesadopted:SunSafety,PrescriptionSafetyGlasses
Employee Subsidy, Medical Assessment, Staff Immunisation,
Drug and Alcohol and Personal Protective Equipment Policy
• AllWorkplaceinspectionsoccurredattimelinesrequiredby
Workplace Health and Safety Legislation
• AllcommitteesmetattimelinesrequiredbyWorkplaceHealth
and Safety Legislation
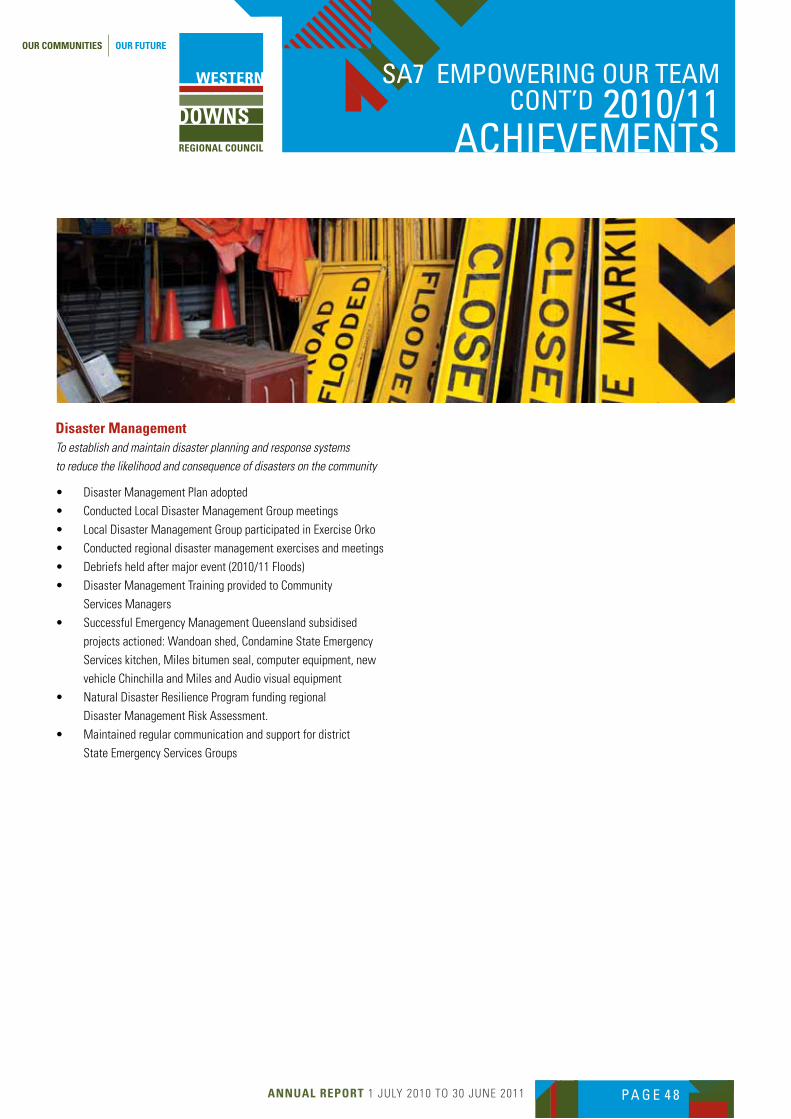
AnnuAl RepoRt 1 JULY 2010 TO 30 JUNE 2011 PA G E 4 8
sA7 eMpoweRIng ouR teAM Cont’d 2010/11
ACHIeVeMents
Disaster ManagementTo establish and maintain disaster planning and response systems to reduce the likelihood and consequence of disasters on the community
• DisasterManagementPlanadopted
• ConductedLocalDisasterManagementGroupmeetings
• LocalDisasterManagementGroupparticipatedinExerciseOrko
• Conductedregionaldisastermanagementexercisesandmeetings
• Debriefsheldaftermajorevent(2010/11Floods)
• DisasterManagementTrainingprovidedtoCommunity
Services Managers
• SuccessfulEmergencyManagementQueenslandsubsidised
projects actioned: Wandoan shed, Condamine State Emergency
Services kitchen, Miles bitumen seal, computer equipment, new
vehicle Chinchilla and Miles and Audio visual equipment
• NaturalDisasterResilienceProgramfundingregional
Disaster Management Risk Assessment.
• Maintainedregularcommunicationandsupportfordistrict
State Emergency Services Groups
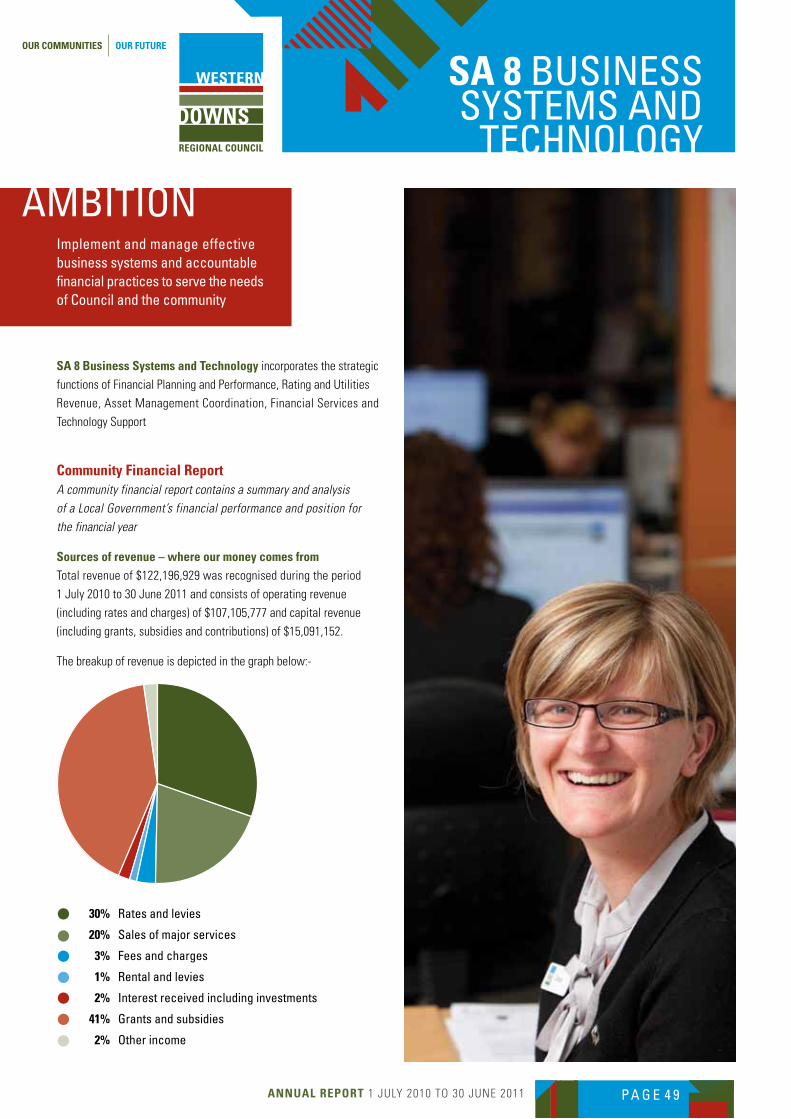
AnnuAl RepoRt 1 JULY 2010 TO 30 JUNE 2011 PA G E 4 9
SA 8 busIness systeMs And
teCHnology
SA 8 Business Systems and technology incorporates the strategic
functions of Financial Planning and Performance, Rating and Utilities
Revenue, Asset Management Coordination, Financial Services and
Technology Support
AMbItIonImplement and manage effective business systems and accountable financial practices to serve the needs of Council and the community
Community Financial Report A community financial report contains a summary and analysis of a Local Government’s financial performance and position for the financial year
Sources of revenue – where our money comes fromTotal revenue of $122,196,929 was recognised during the period
1 July 2010 to 30 June 2011 and consists of operating revenue
(including rates and charges) of $107,105,777 and capital revenue
(including grants, subsidies and contributions) of $15,091,152.
The breakup of revenue is depicted in the graph below:-
30% Rates and levies
20% sales of major services
3% fees and charges
1% Rental and levies
2% Interest received including investments
41% grants and subsidies
2% other income
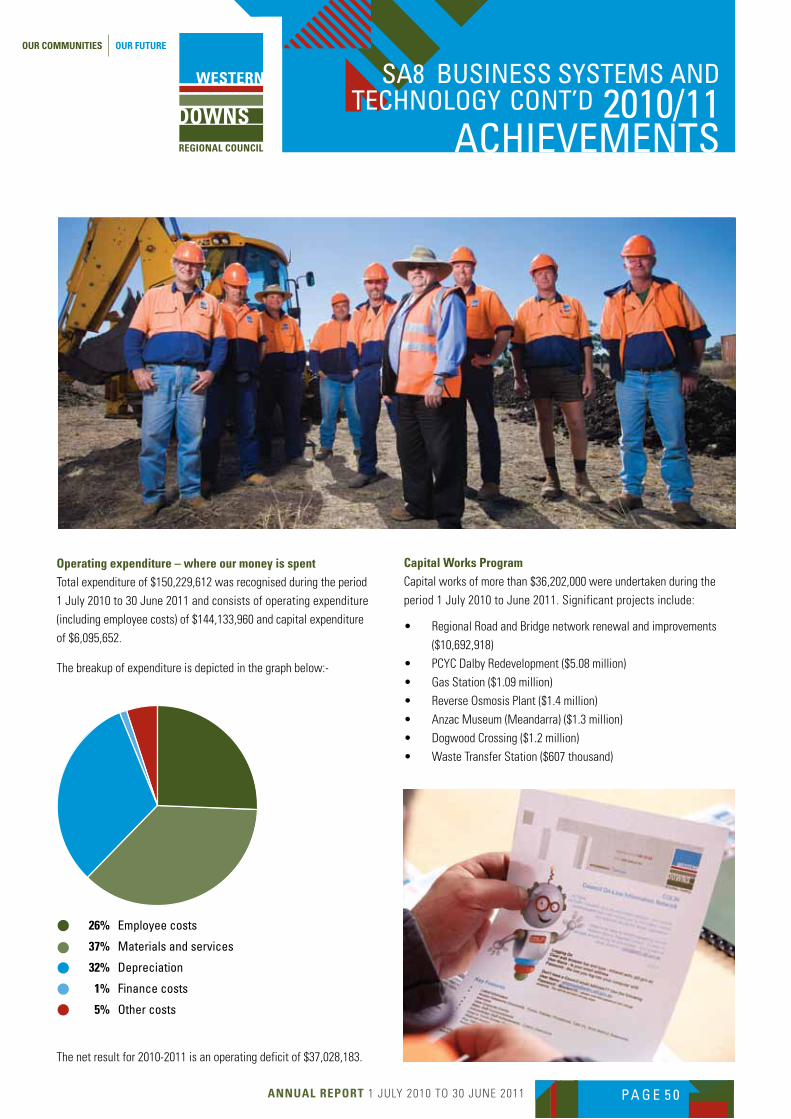
AnnuAl RepoRt 1 JULY 2010 TO 30 JUNE 2011 PA G E 5 0
Capital Works ProgramCapital works of more than $36,202,000 were undertaken during the
period 1 July 2010 to June 2011. Significant projects include:
• RegionalRoadandBridgenetworkrenewalandimprovements
($10,692,918)
• PCYCDalbyRedevelopment($5.08million)
• GasStation($1.09million)
• ReverseOsmosisPlant($1.4million)
• AnzacMuseum(Meandarra)($1.3million)
• DogwoodCrossing($1.2million)
• WasteTransferStation($607thousand)
operating expenditure – where our money is spentTotal expenditure of $150,229,612 was recognised during the period
1 July 2010 to 30 June 2011 and consists of operating expenditure
(including employee costs) of $144,133,960 and capital expenditure
of $6,095,652.
The breakup of expenditure is depicted in the graph below:-
The net result for 2010-2011 is an operating deficit of $37,028,183.
26% employee costs
37% Materials and services
32% depreciation
1% finance costs
5% other costs
sA8 busIness systeMs And teCHnology Cont’d 2010/11
ACHIeVeMents
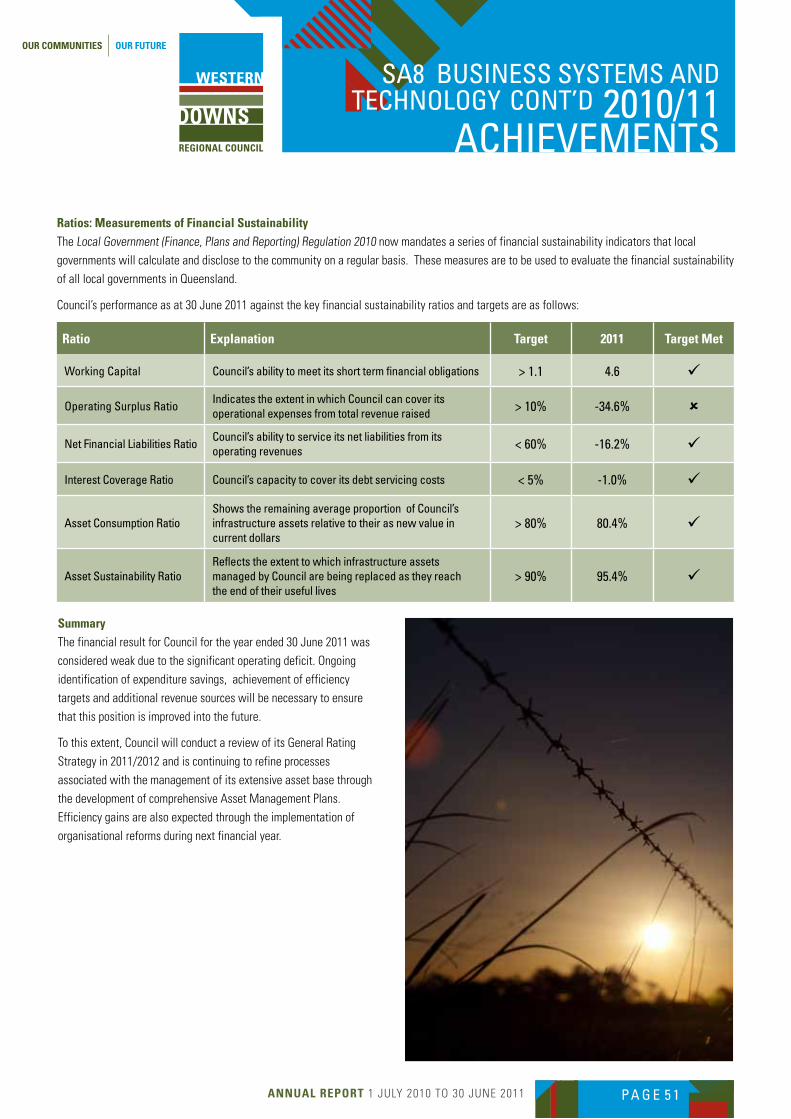
AnnuAl RepoRt 1 JULY 2010 TO 30 JUNE 2011 PA G E 5 1
sA8 busIness systeMs And teCHnology Cont’d 2010/11
ACHIeVeMents
Ratios: Measurements of Financial SustainabilityThe Local Government (Finance, Plans and Reporting) Regulation 2010 now mandates a series of financial sustainability indicators that local
governments will calculate and disclose to the community on a regular basis. These measures are to be used to evaluate the financial sustainability
of all local governments in Queensland.
Council’s performance as at 30 June 2011 against the key financial sustainability ratios and targets are as follows:
Ratio explanation target 2011 target Met
working Capital Council’s ability to meet its short term financial obligations > 1.1 4.6 ü
operating surplus RatioIndicates the extent in which Council can cover its operational expenses from total revenue raised > 10% -34.6% û
net financial liabilities RatioCouncil’s ability to service its net liabilities from its operating revenues < 60% -16.2% ü
Interest Coverage Ratio Council’s capacity to cover its debt servicing costs < 5% -1.0% ü
Asset Consumption Ratioshows the remaining average proportion of Council’s infrastructure assets relative to their as new value in current dollars
> 80% 80.4% ü
Asset sustainability RatioReflects the extent to which infrastructure assets managed by Council are being replaced as they reach the end of their useful lives
> 90% 95.4% ü
SummaryThe financial result for Council for the year ended 30 June 2011 was
considered weak due to the significant operating deficit. Ongoing
identification of expenditure savings, achievement of efficiency
targets and additional revenue sources will be necessary to ensure
that this position is improved into the future.
To this extent, Council will conduct a review of its General Rating
Strategy in 2011/2012 and is continuing to refine processes
associated with the management of its extensive asset base through
the development of comprehensive Asset Management Plans.
Efficiency gains are also expected through the implementation of
organisational reforms during next financial year.
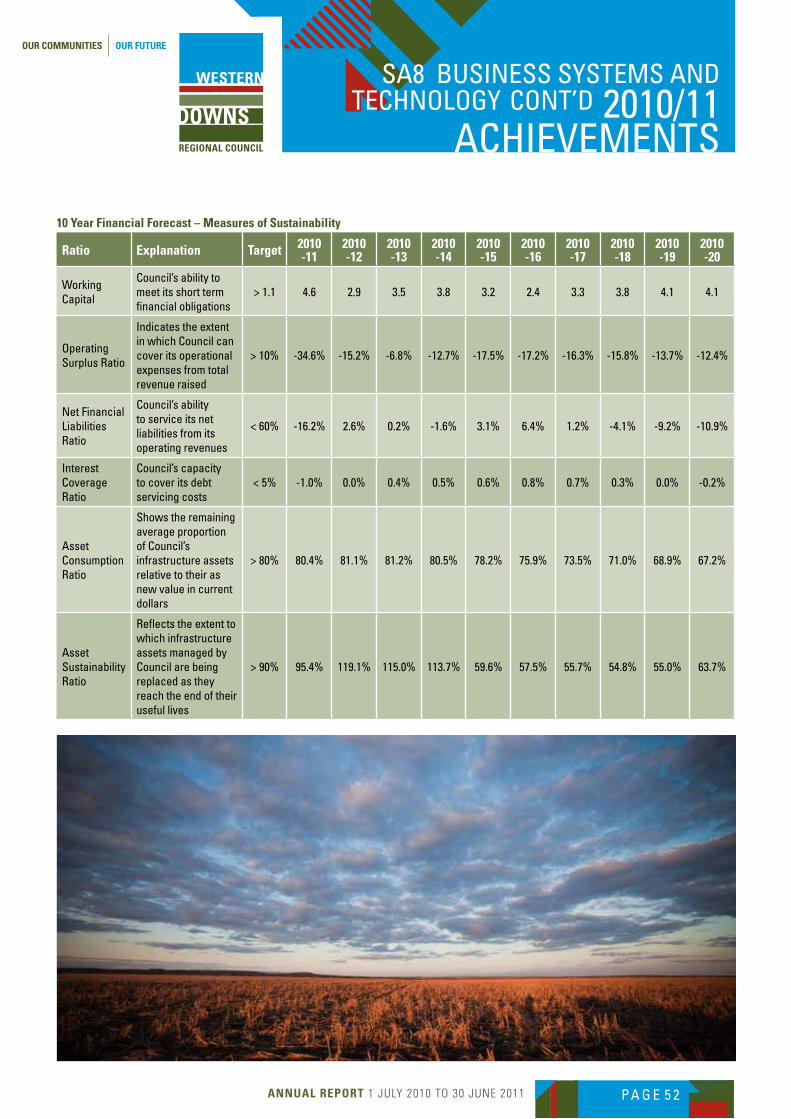
AnnuAl RepoRt 1 JULY 2010 TO 30 JUNE 2011 PA G E 5 2
10 year Financial Forecast – Measures of Sustainability
Ratio explanation target 2010 -11
2010 -12
2010 -13
2010 -14
2010 -15
2010 -16
2010 -17
2010 -18
2010 -19
2010 -20
working Capital
Council’s ability to meet its short term financial obligations
> 1.1 4.6 2.9 3.5 3.8 3.2 2.4 3.3 3.8 4.1 4.1
operating surplus Ratio
Indicates the extent in which Council can cover its operational expenses from total revenue raised
> 10% -34.6% -15.2% -6.8% -12.7% -17.5% -17.2% -16.3% -15.8% -13.7% -12.4%
net financial liabilities Ratio
Council’s ability to service its net liabilities from its operating revenues
< 60% -16.2% 2.6% 0.2% -1.6% 3.1% 6.4% 1.2% -4.1% -9.2% -10.9%
Interest Coverage Ratio
Council’s capacity to cover its debt servicing costs
< 5% -1.0% 0.0% 0.4% 0.5% 0.6% 0.8% 0.7% 0.3% 0.0% -0.2%
Asset Consumption Ratio
shows the remaining average proportion of Council’s infrastructure assets relative to their as new value in current dollars
> 80% 80.4% 81.1% 81.2% 80.5% 78.2% 75.9% 73.5% 71.0% 68.9% 67.2%
Asset sustainability Ratio
Reflects the extent to which infrastructure assets managed by Council are being replaced as they reach the end of their useful lives
> 90% 95.4% 119.1% 115.0% 113.7% 59.6% 57.5% 55.7% 54.8% 55.0% 63.7%
sA8 busIness systeMs And teCHnology Cont’d 2010/11
ACHIeVeMents
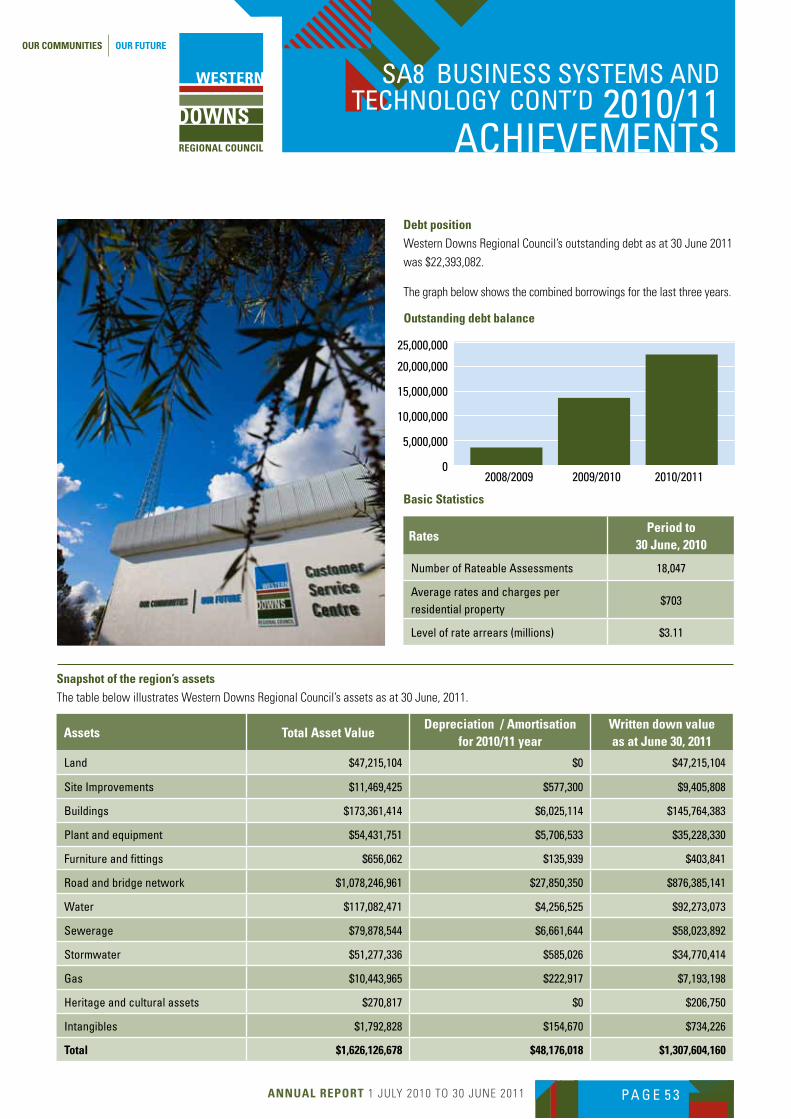
AnnuAl RepoRt 1 JULY 2010 TO 30 JUNE 2011 PA G E 5 3
sA8 busIness systeMs And teCHnology Cont’d 2010/11
ACHIeVeMents
Debt positionWestern Downs Regional Council’s outstanding debt as at 30 June 2011
was $22,393,082.
The graph below shows the combined borrowings for the last three years.
Snapshot of the region’s assetsThe table below illustrates Western Downs Regional Council’s assets as at 30 June, 2011.
Assets total Asset ValueDepreciation / Amortisation
for 2010/11 yearWritten down value as at June 30, 2011
land $47,215,104 $0 $47,215,104
site Improvements $11,469,425 $577,300 $9,405,808
buildings $173,361,414 $6,025,114 $145,764,383
plant and equipment $54,431,751 $5,706,533 $35,228,330
furniture and fittings $656,062 $135,939 $403,841
Road and bridge network $1,078,246,961 $27,850,350 $876,385,141
water $117,082,471 $4,256,525 $92,273,073
sewerage $79,878,544 $6,661,644 $58,023,892
stormwater $51,277,336 $585,026 $34,770,414
gas $10,443,965 $222,917 $7,193,198
Heritage and cultural assets $270,817 $0 $206,750
Intangibles $1,792,828 $154,670 $734,226
total $1,626,126,678 $48,176,018 $1,307,604,160
25,000,000
20,000,000
15,000,000
10,000,000
5,000,000
0
outstanding debt balance
2008/2009 2009/2010 2010/2011
Basic Statistics
RatesPeriod to
30 June, 2010
number of Rateable Assessments 18,047
Average rates and charges per residential property
$703
level of rate arrears (millions) $3.11
sA8 busIness systeMs And teCHnology Cont’d 2010/11
ACHIeVeMents
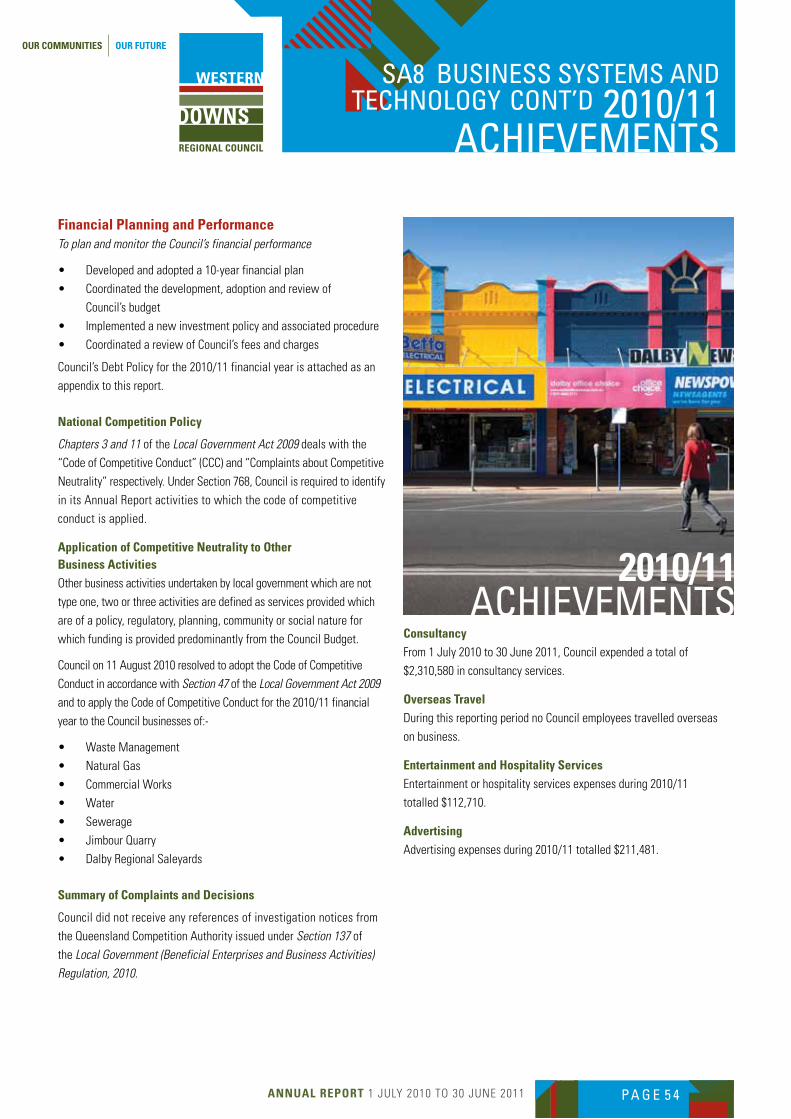
AnnuAl RepoRt 1 JULY 2010 TO 30 JUNE 2011 PA G E 5 4
Financial Planning and Performance To plan and monitor the Council’s financial performance
• Developedandadopteda10-yearfinancialplan
• Coordinatedthedevelopment,adoptionandreviewof
Council’s budget
• Implementedanewinvestmentpolicyandassociatedprocedure
• CoordinatedareviewofCouncil’sfeesandcharges
Council’s Debt Policy for the 2010/11 financial year is attached as an
appendix to this report.
national Competition Policy
Chapters 3 and 11 of the Local Government Act 2009 deals with the
“Code of Competitive Conduct” (CCC) and “Complaints about Competitive
Neutrality” respectively. Under Section 768, Council is required to identify
in its Annual Report activities to which the code of competitive
conduct is applied.
Application of Competitive neutrality to other Business ActivitiesOther business activities undertaken by local government which are not
type one, two or three activities are defined as services provided which
are of a policy, regulatory, planning, community or social nature for
which funding is provided predominantly from the Council Budget.
Council on 11 August 2010 resolved to adopt the Code of Competitive
Conduct in accordance with Section 47 of the Local Government Act 2009
and to apply the Code of Competitive Conduct for the 2010/11 financial
year to the Council businesses of:-
• WasteManagement
• NaturalGas
• CommercialWorks
• Water
• Sewerage
• JimbourQuarry
• DalbyRegionalSaleyards
Summary of Complaints and Decisions
Council did not receive any references of investigation notices from
the Queensland Competition Authority issued under Section 137 of
the Local Government (Beneficial Enterprises and Business Activities) Regulation, 2010.
ConsultancyFrom 1 July 2010 to 30 June 2011, Council expended a total of
$2,310,580 in consultancy services.
overseas travelDuring this reporting period no Council employees travelled overseas
on business.
entertainment and Hospitality ServicesEntertainment or hospitality services expenses during 2010/11
totalled $112,710.
AdvertisingAdvertising expenses during 2010/11 totalled $211,481.
2010/11 ACHIeVeMents
sA8 busIness systeMs And teCHnology Cont’d 2010/11
ACHIeVeMents
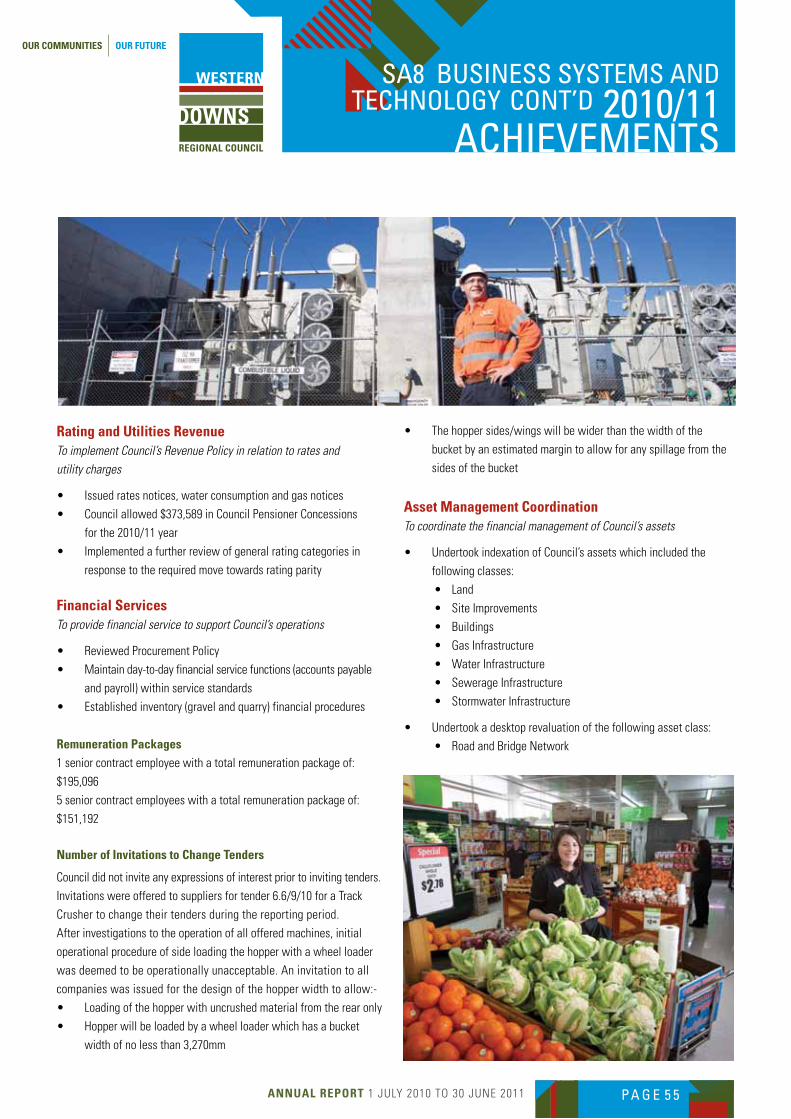
AnnuAl RepoRt 1 JULY 2010 TO 30 JUNE 2011 PA G E 5 5
Rating and utilities Revenue To implement Council’s Revenue Policy in relation to rates and utility charges
• Issuedratesnotices,waterconsumptionandgasnotices
• Councilallowed$373,589inCouncilPensionerConcessions
for the 2010/11 year
• Implementedafurtherreviewofgeneralratingcategoriesin
response to the required move towards rating parity
Financial ServicesTo provide financial service to support Council’s operations
• ReviewedProcurementPolicy
• Maintainday-to-dayfinancialservicefunctions(accountspayable
and payroll) within service standards
• Establishedinventory(gravelandquarry)financialprocedures
Remuneration Packages1 senior contract employee with a total remuneration package of:
$195,096
5 senior contract employees with a total remuneration package of:
$151,192
number of Invitations to Change tenders
Council did not invite any expressions of interest prior to inviting tenders.
Invitations were offered to suppliers for tender 6.6/9/10 for a Track
Crusher to change their tenders during the reporting period.
After investigations to the operation of all offered machines, initial
operational procedure of side loading the hopper with a wheel loader
was deemed to be operationally unacceptable. An invitation to all
companies was issued for the design of the hopper width to allow:-
• Loadingofthehopperwithuncrushedmaterialfromtherearonly
• Hopperwillbeloadedbyawheelloaderwhichhasabucket
width of no less than 3,270mm
• Thehoppersides/wingswillbewiderthanthewidthofthe
bucket by an estimated margin to allow for any spillage from the
sides of the bucket
Asset Management CoordinationTo coordinate the financial management of Council’s assets
• UndertookindexationofCouncil’sassetswhichincludedthe
following classes:
• Land
• SiteImprovements
• Buildings
• GasInfrastructure
• WaterInfrastructure
• SewerageInfrastructure
• StormwaterInfrastructure
• Undertookadesktoprevaluationofthefollowingassetclass:
• RoadandBridgeNetwork
sA8 busIness systeMs And teCHnology Cont’d 2010/11
ACHIeVeMents
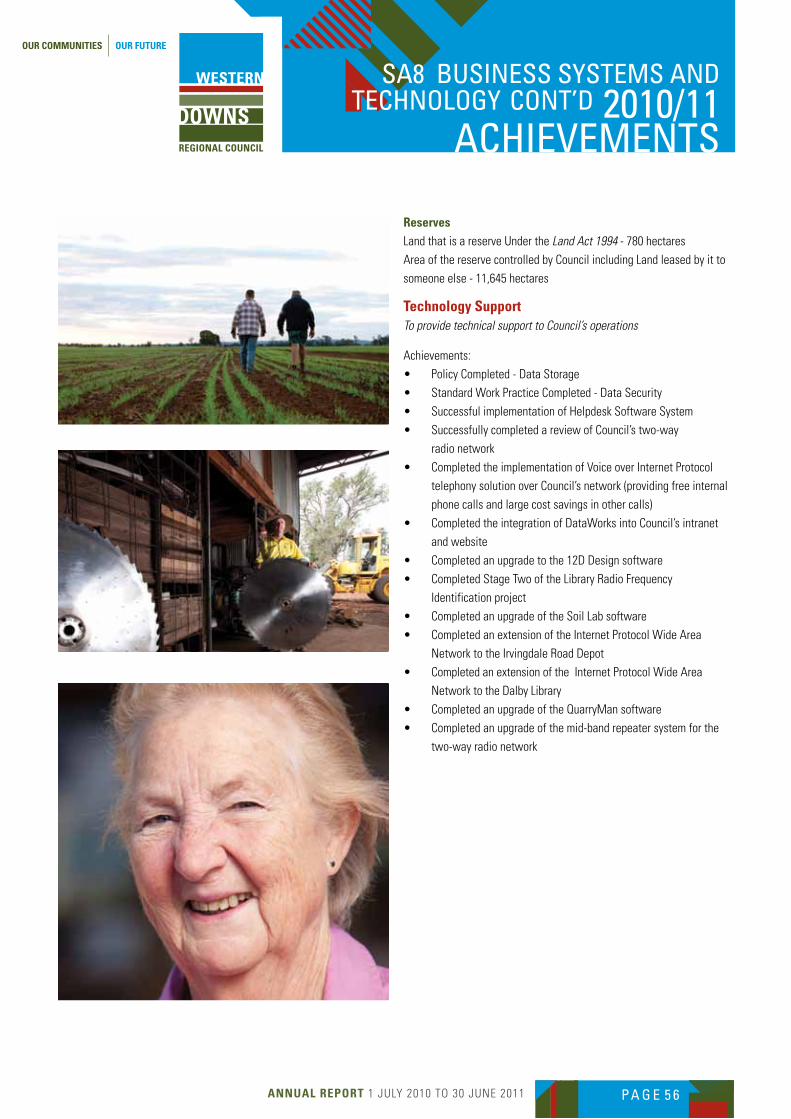
AnnuAl RepoRt 1 JULY 2010 TO 30 JUNE 2011 PA G E 5 6
sA8 busIness systeMs And teCHnology Cont’d 2010/11
ACHIeVeMents
ReservesLand that is a reserve Under the Land Act 1994 - 780 hectares
Area of the reserve controlled by Council including Land leased by it to
someone else - 11,645 hectares
technology Support To provide technical support to Council’s operations
Achievements:
• PolicyCompleted-DataStorage
• StandardWorkPracticeCompleted-DataSecurity
• SuccessfulimplementationofHelpdeskSoftwareSystem
• SuccessfullycompletedareviewofCouncil’stwo-way
radio network
• CompletedtheimplementationofVoiceoverInternetProtocol
telephony solution over Council’s network (providing free internal
phone calls and large cost savings in other calls)
• CompletedtheintegrationofDataWorksintoCouncil’sintranet
and website
• Completedanupgradetothe12DDesignsoftware
• CompletedStageTwooftheLibraryRadioFrequency
Identification project
• CompletedanupgradeoftheSoilLabsoftware
• CompletedanextensionoftheInternetProtocolWideArea
Network to the Irvingdale Road Depot
• CompletedanextensionoftheInternetProtocolWideArea
Network to the Dalby Library
• CompletedanupgradeoftheQuarryMansoftware
• Completedanupgradeofthemid-bandrepeatersystemforthe
two-way radio network
AnnuAl RepoRt 1 JULY 2010 TO 30 JUNE 2011 PA G E 5 7
• CouncillorExpensesReimbursementPolicy
• DebtPolicy
• AuditedFinancialStatementsforPeriod1
July 2010 to 30 June 2011
AppendICes
AppendICes
Customer Service 1300 728 [email protected]
Council Policy
POLICY TITLE: COUNCILLOR EXPENSES REIMBURSEMENT POLICY -COUNCIL POLICY
RESPONSIBLE DIVISION: Corporate Services
RESPONSIBLE SECTION: GOVERNANCE
LINK TO CORPORATE PLAN: SA 7 - EMPOWERING OUR TEAM
RESPONSIBLE OFFICER: Chief Executive Officer
AUTHORISED BY: Ordinary Meeting of Council - 3 June 2008
ISSUE DATE: 3 June 2008
AMENDMENT DATE/S: 15 October 20081 April 200914 December 2011
DATE REVIEW DUE: May 2013
POLICY OBJECTIVES/PURPOSE:
The purpose of this policy is to provide for the proper control of the reimbursement of reasonable expenses incurred, or to be incurred by Councillors in discharging their duties and responsibilities.
The policy covers:- the reimbursement to Councillors of legitimate expenses incurred; and the facilities to be provided to Councillors.
ORGANISATIONAL SCOPE:
This policy applies to all Councillors of Western Downs Regional Council.
This policy does not provide for Councillor remuneration. Councillor remuneration is determined annually by the Local Government Remuneration Tribunal.
POLICY:
STATEMENT OF PRINCIPLES
This policy ensures that Council’s reimbursement of expenses incurred by Councillors and facilities provided to Councillors is consistent with the local government principles and financial sustainability criteria as defined in the Local Government Act 2009.
Councillors should not be financially disadvantaged when carrying out their roles and should be fairly and reasonably compensated in accordance with statutory requirements and community expectations.
Customer Service 1300 728 [email protected]
Councillors should not receive a private benefit through their role as a Councillor and as such this policy provides for actual reimbursement of legitimate expenses and full disclosure through appropriate accountability requirements.
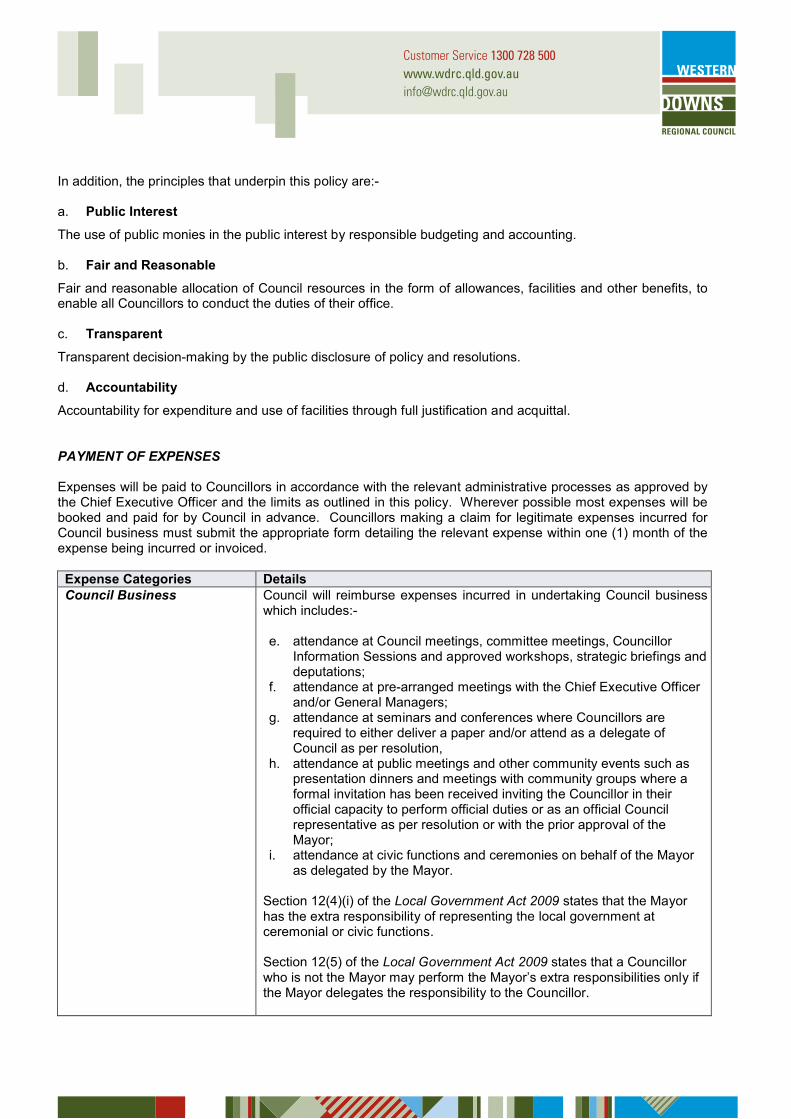
Customer Service 1300 728 [email protected]
In addition, the principles that underpin this policy are:-
a. Public Interest
The use of public monies in the public interest by responsible budgeting and accounting.
b. Fair and Reasonable
Fair and reasonable allocation of Council resources in the form of allowances, facilities and other benefits, to enable all Councillors to conduct the duties of their office.
c. Transparent
Transparent decision-making by the public disclosure of policy and resolutions.
d. Accountability
Accountability for expenditure and use of facilities through full justification and acquittal.
PAYMENT OF EXPENSES
Expenses will be paid to Councillors in accordance with the relevant administrative processes as approved by the Chief Executive Officer and the limits as outlined in this policy. Wherever possible most expenses will be booked and paid for by Council in advance. Councillors making a claim for legitimate expenses incurred for Council business must submit the appropriate form detailing the relevant expense within one (1) month of the expense being incurred or invoiced.
Expense Categories DetailsCouncil Business Council will reimburse expenses incurred in undertaking Council business
which includes:-
e. attendance at Council meetings, committee meetings, Councillor Information Sessions and approved workshops, strategic briefings and deputations;
f. attendance at pre-arranged meetings with the Chief Executive Officer and/or General Managers;
g. attendance at seminars and conferences where Councillors are required to either deliver a paper and/or attend as a delegate of Council as per resolution,
h. attendance at public meetings and other community events such as presentation dinners and meetings with community groups where a formal invitation has been received inviting the Councillor in their official capacity to perform official duties or as an official Council representative as per resolution or with the prior approval of the Mayor;
i. attendance at civic functions and ceremonies on behalf of the Mayor as delegated by the Mayor.
Section 12(4)(i) of the Local Government Act 2009 states that the Mayor has the extra responsibility of representing the local government at ceremonial or civic functions.
Section 12(5) of the Local Government Act 2009 states that a Councillor who is not the Mayor may perform the Mayor’s extra responsibilities only if the Mayor delegates the responsibility to the Councillor.
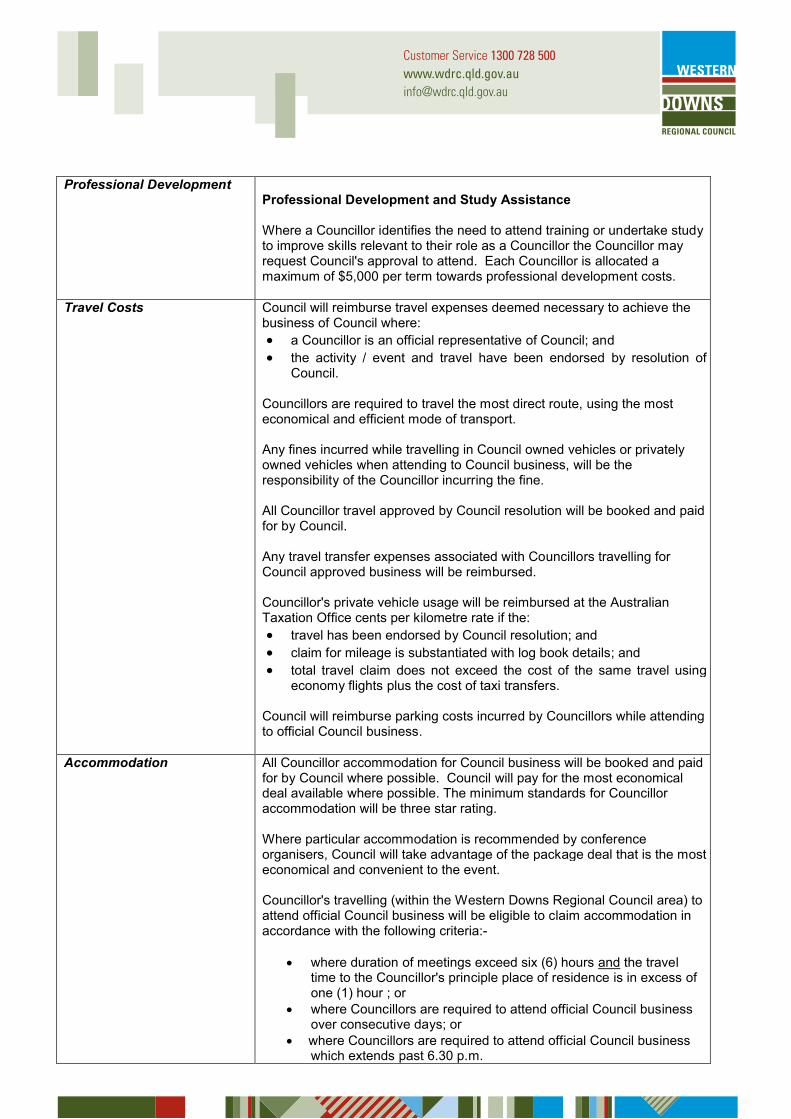
Customer Service 1300 728 [email protected]
Professional DevelopmentProfessional Development and Study Assistance
Where a Councillor identifies the need to attend training or undertake studyto improve skills relevant to their role as a Councillor the Councillor may request Council's approval to attend. Each Councillor is allocated a maximum of $5,000 per term towards professional development costs.
Travel Costs Council will reimburse travel expenses deemed necessary to achieve the business of Council where: a Councillor is an official representative of Council; and the activity / event and travel have been endorsed by resolution of
Council.
Councillors are required to travel the most direct route, using the most economical and efficient mode of transport.
Any fines incurred while travelling in Council owned vehicles or privately owned vehicles when attending to Council business, will be the responsibility of the Councillor incurring the fine.
All Councillor travel approved by Council resolution will be booked and paid for by Council.
Any travel transfer expenses associated with Councillors travelling for Council approved business will be reimbursed.
Councillor's private vehicle usage will be reimbursed at the Australian Taxation Office cents per kilometre rate if the: travel has been endorsed by Council resolution; and claim for mileage is substantiated with log book details; and total travel claim does not exceed the cost of the same travel using
economy flights plus the cost of taxi transfers.
Council will reimburse parking costs incurred by Councillors while attending to official Council business.
Accommodation All Councillor accommodation for Council business will be booked and paid for by Council where possible. Council will pay for the most economical deal available where possible. The minimum standards for Councillor accommodation will be three star rating.
Where particular accommodation is recommended by conference organisers, Council will take advantage of the package deal that is the most economical and convenient to the event.
Councillor's travelling (within the Western Downs Regional Council area) toattend official Council business will be eligible to claim accommodation in accordance with the following criteria:-
where duration of meetings exceed six (6) hours and the travel time to the Councillor's principle place of residence is in excess of one (1) hour ; or
where Councillors are required to attend official Council business over consecutive days; or
where Councillors are required to attend official Council business which extends past 6.30 p.m.
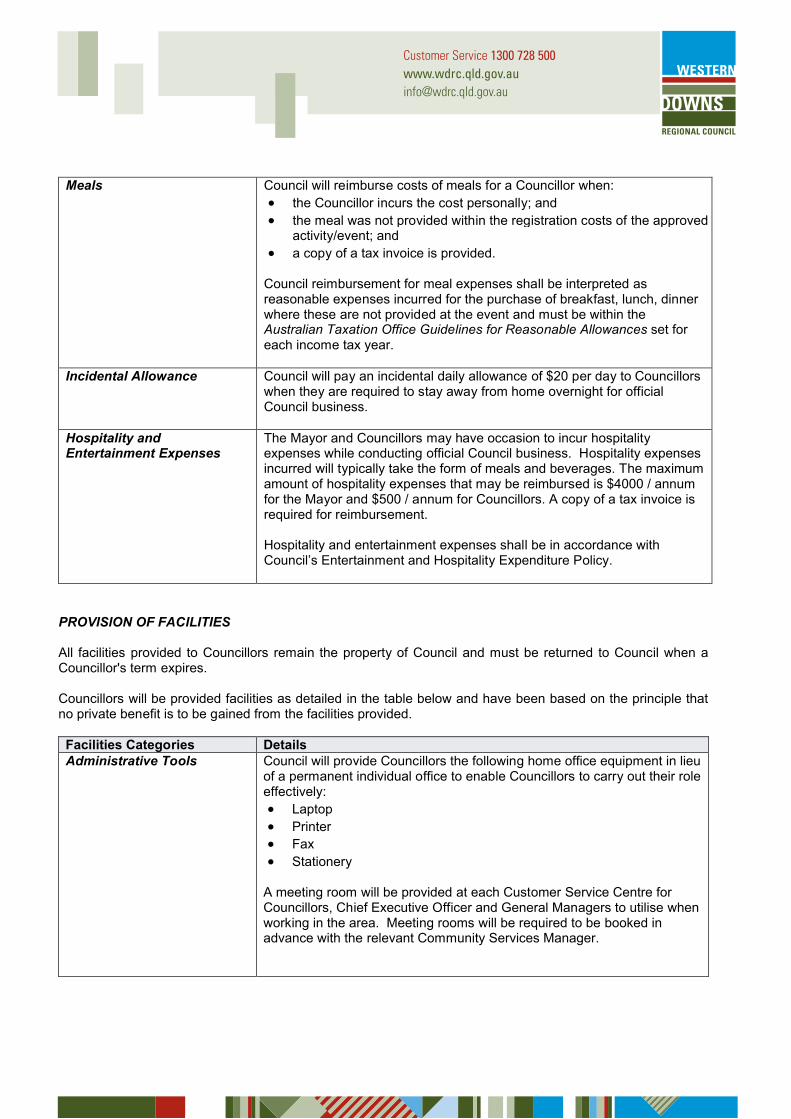
Customer Service 1300 728 [email protected]
Meals Council will reimburse costs of meals for a Councillor when: the Councillor incurs the cost personally; and the meal was not provided within the registration costs of the approved
activity/event; and a copy of a tax invoice is provided.
Council reimbursement for meal expenses shall be interpreted as reasonable expenses incurred for the purchase of breakfast, lunch, dinner where these are not provided at the event and must be within the Australian Taxation Office Guidelines for Reasonable Allowances set for each income tax year.
Incidental Allowance Council will pay an incidental daily allowance of $20 per day to Councillors when they are required to stay away from home overnight for official Council business.
Hospitality and Entertainment Expenses
The Mayor and Councillors may have occasion to incur hospitality expenses while conducting official Council business. Hospitality expenses incurred will typically take the form of meals and beverages. The maximum amount of hospitality expenses that may be reimbursed is $4000 / annum for the Mayor and $500 / annum for Councillors. A copy of a tax invoice is required for reimbursement.
Hospitality and entertainment expenses shall be in accordance with Council’s Entertainment and Hospitality Expenditure Policy.
PROVISION OF FACILITIES
All facilities provided to Councillors remain the property of Council and must be returned to Council when a Councillor's term expires.
Councillors will be provided facilities as detailed in the table below and have been based on the principle that no private benefit is to be gained from the facilities provided.
Facilities Categories DetailsAdministrative Tools Council will provide Councillors the following home office equipment in lieu
of a permanent individual office to enable Councillors to carry out their role effectively: Laptop Printer Fax Stationery
A meeting room will be provided at each Customer Service Centre for Councillors, Chief Executive Officer and General Managers to utilise when working in the area. Meeting rooms will be required to be booked in advance with the relevant Community Services Manager.
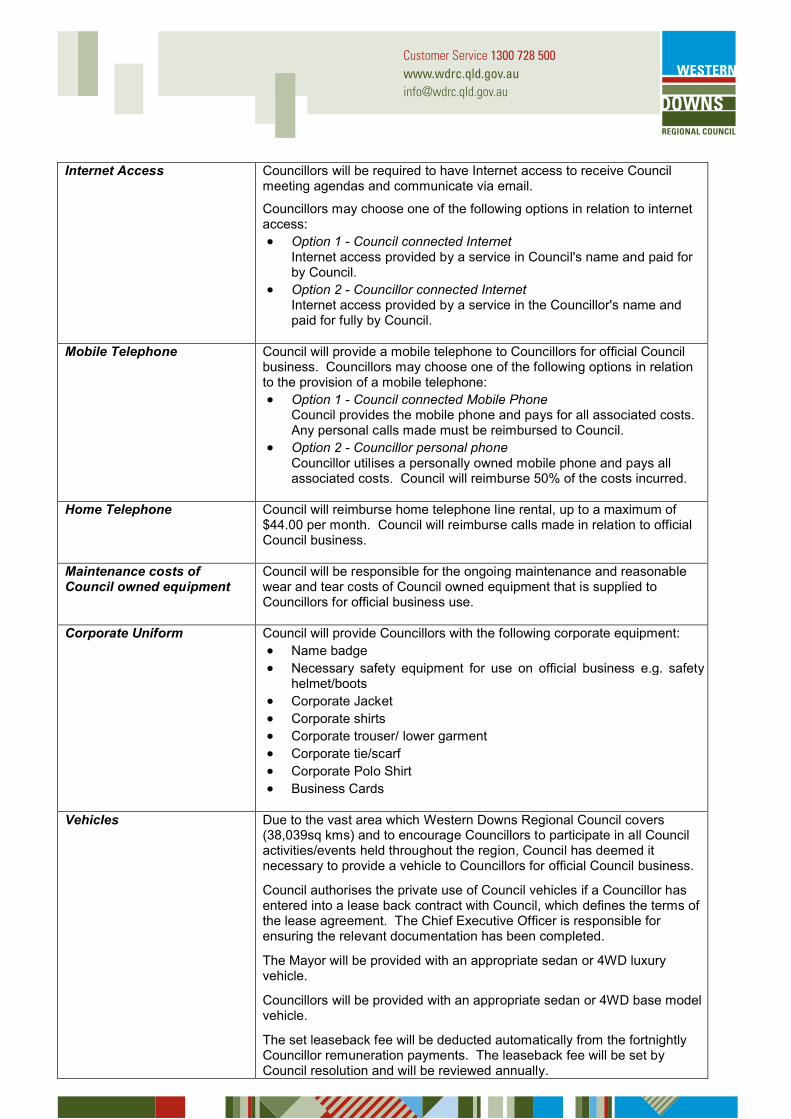
Customer Service 1300 728 [email protected]
Internet Access Councillors will be required to have Internet access to receive Council meeting agendas and communicate via email.
Councillors may choose one of the following options in relation to internet access: Option 1 - Council connected Internet
Internet access provided by a service in Council's name and paid for by Council.
Option 2 - Councillor connected InternetInternet access provided by a service in the Councillor's name and paid for fully by Council.
Mobile Telephone Council will provide a mobile telephone to Councillors for official Council business. Councillors may choose one of the following options in relation to the provision of a mobile telephone: Option 1 - Council connected Mobile Phone
Council provides the mobile phone and pays for all associated costs. Any personal calls made must be reimbursed to Council.
Option 2 - Councillor personal phoneCouncillor utilises a personally owned mobile phone and pays all associated costs. Council will reimburse 50% of the costs incurred.
Home Telephone Council will reimburse home telephone line rental, up to a maximum of $44.00 per month. Council will reimburse calls made in relation to official Council business.
Maintenance costs of Council owned equipment
Council will be responsible for the ongoing maintenance and reasonable wear and tear costs of Council owned equipment that is supplied to Councillors for official business use.
Corporate Uniform Council will provide Councillors with the following corporate equipment: Name badge Necessary safety equipment for use on official business e.g. safety
helmet/boots Corporate Jacket Corporate shirts Corporate trouser/ lower garment Corporate tie/scarf Corporate Polo Shirt Business Cards
Vehicles Due to the vast area which Western Downs Regional Council covers (38,039sq kms) and to encourage Councillors to participate in all Council activities/events held throughout the region, Council has deemed it necessary to provide a vehicle to Councillors for official Council business.
Council authorises the private use of Council vehicles if a Councillor has entered into a lease back contract with Council, which defines the terms of the lease agreement. The Chief Executive Officer is responsible for ensuring the relevant documentation has been completed.
The Mayor will be provided with an appropriate sedan or 4WD luxury vehicle.
Councillors will be provided with an appropriate sedan or 4WD base model vehicle.
The set leaseback fee will be deducted automatically from the fortnightly Councillor remuneration payments. The leaseback fee will be set by Council resolution and will be reviewed annually.
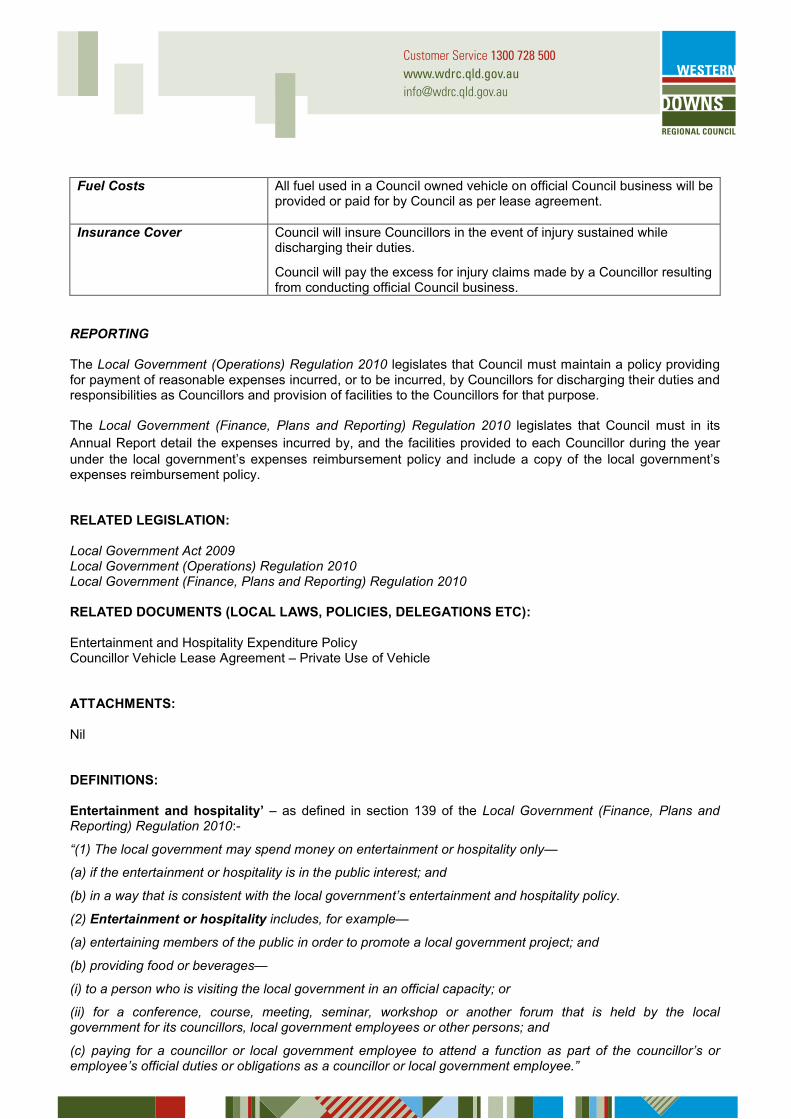
Customer Service 1300 728 [email protected]
Fuel Costs All fuel used in a Council owned vehicle on official Council business will be provided or paid for by Council as per lease agreement.
Insurance Cover Council will insure Councillors in the event of injury sustained while discharging their duties.
Council will pay the excess for injury claims made by a Councillor resulting from conducting official Council business.
REPORTING
The Local Government (Operations) Regulation 2010 legislates that Council must maintain a policy providing for payment of reasonable expenses incurred, or to be incurred, by Councillors for discharging their duties and responsibilities as Councillors and provision of facilities to the Councillors for that purpose.
The Local Government (Finance, Plans and Reporting) Regulation 2010 legislates that Council must in its Annual Report detail the expenses incurred by, and the facilities provided to each Councillor during the year under the local government’s expenses reimbursement policy and include a copy of the local government’s expenses reimbursement policy.
RELATED LEGISLATION:
Local Government Act 2009Local Government (Operations) Regulation 2010Local Government (Finance, Plans and Reporting) Regulation 2010
RELATED DOCUMENTS (LOCAL LAWS, POLICIES, DELEGATIONS ETC):
Entertainment and Hospitality Expenditure PolicyCouncillor Vehicle Lease Agreement – Private Use of Vehicle
ATTACHMENTS:
Nil
DEFINITIONS:
Entertainment and hospitality’ – as defined in section 139 of the Local Government (Finance, Plans and Reporting) Regulation 2010:-
“(1) The local government may spend money on entertainment or hospitality only—
(a) if the entertainment or hospitality is in the public interest; and
(b) in a way that is consistent with the local government’s entertainment and hospitality policy.
(2) Entertainment or hospitality includes, for example—
(a) entertaining members of the public in order to promote a local government project; and
(b) providing food or beverages—
(i) to a person who is visiting the local government in an official capacity; or
(ii) for a conference, course, meeting, seminar, workshop or another forum that is held by the local government for its councillors, local government employees or other persons; and
(c) paying for a councillor or local government employee to attend a function as part of the councillor’s oremployee’s official duties or obligations as a councillor or local government employee.”
Customer Service 1300 728 [email protected]
REVIEW TRIGGER:
List of factors which require the policy to be reviewed eg:- Periodic review – annually in line with budget or post-election Change in legislation affecting this policy Change in community priorities or circumstances relating to this policy
Customer Service 1300 728 [email protected]
Council Policy
POLICY TITLE: COUNCILLOR EXPENSES REIMBURSEMENT POLICY -COUNCIL POLICY
RESPONSIBLE DIVISION: Corporate Services
RESPONSIBLE SECTION: GOVERNANCE
LINK TO CORPORATE PLAN: SA 7 - EMPOWERING OUR TEAM
RESPONSIBLE OFFICER: Chief Executive Officer
AUTHORISED BY: Ordinary Meeting of Council - 3 June 2008
ISSUE DATE: 3 June 2008
AMENDMENT DATE/S: 15 October 20081 April 200914 December 2011
DATE REVIEW DUE: May 2013
POLICY OBJECTIVES/PURPOSE:
The purpose of this policy is to provide for the proper control of the reimbursement of reasonable expenses incurred, or to be incurred by Councillors in discharging their duties and responsibilities.
The policy covers:- the reimbursement to Councillors of legitimate expenses incurred; and the facilities to be provided to Councillors.
ORGANISATIONAL SCOPE:
This policy applies to all Councillors of Western Downs Regional Council.
This policy does not provide for Councillor remuneration. Councillor remuneration is determined annually by the Local Government Remuneration Tribunal.
POLICY:
STATEMENT OF PRINCIPLES
This policy ensures that Council’s reimbursement of expenses incurred by Councillors and facilities provided to Councillors is consistent with the local government principles and financial sustainability criteria as defined in the Local Government Act 2009.
Councillors should not be financially disadvantaged when carrying out their roles and should be fairly and reasonably compensated in accordance with statutory requirements and community expectations.
POLICY TITLE: DEBT POLICY
POLICY NO: FICT C/2.1.1
DIRECTORATE: Finance and ICT
LINK TO CORPORATE PLAN: SA 8 - BUSINESS SYSTEMS AND TECHNOLOGY
RESPONSIBLE OFFICER: Chief Executive Officer
AUTHORISED BY: Special Meeting of Council – 8 July 2011
ISSUE DATE: 8 July 2011
AMENDMENT DATE/S: 8 July 2011
DATE REVIEW DUE: June 2012
POLICY OBJECTIVES/PURPOSE:
The purpose of this policy is to ensure the sound management of Council’s existing and future debt.
ORGANISATIONAL SCOPE:
Section 133 of the Local Government (Finance, Plans and Reporting) Regulation 2010 states that a local government must develop a policy about its Debts. Furthermore, Council’s borrowing activities are governed by the Statutory Bodies Financial Arrangements Act 1982 and Section 104 of the Local Government Act 2009.
POLICY:
This borrowing policy applies for the 2011/2012 financial year and the next nine financial years. This policy will be prepared annually and amended as and when required to meet the prevailing circumstances of Council.
Borrowing PurposesBorrowing will only be used to finance capital works that will provide services now and into the future. No borrowings will be used to finance recurrent expenditure and the operational activities of the Council.
When seeking funding for capital works, Council will, wherever possible, use its existing cash reserves. The use of any existing cash reserves will be subject to maintaining all relevant financial ratios and measures within adopted targets. A debt service ratio of 5% for infrastructure will be maintained within Council's budgets.
Repayments and Repayment AbilityBorrowings will be undertaken for capital works only where the interest and debt principal repayments can be serviced and relevant financial ratios and measures are maintained within approved targets.
Council will discharge debts in the shortest possible time subject to overall budgetary constraints.
New loans will be taken up only if the subsequent increase in debt servicing payments allows the total debt-servicing ratio to remain within corporate targets.
Debt TermThe debt term shall not exceed the finite life of the related asset.
Council Policy
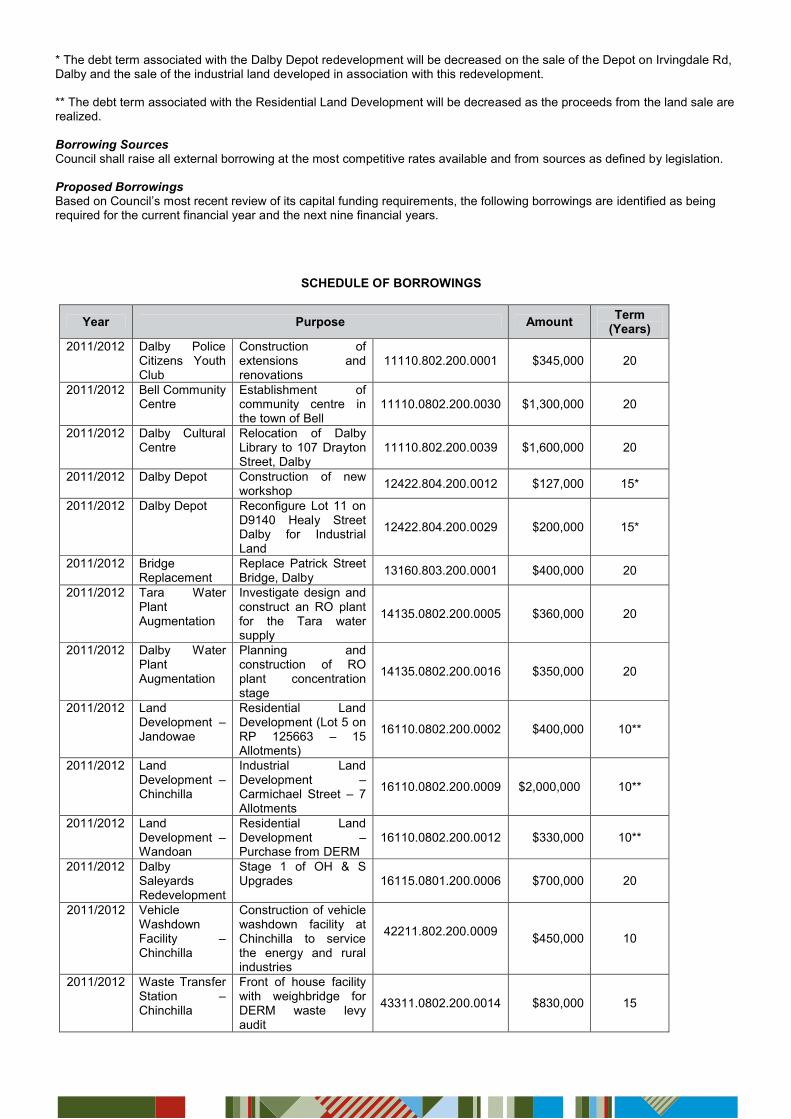
Customer Service 1300 728 [email protected]
* The debt term associated with the Dalby Depot redevelopment will be decreased on the sale of the Depot on Irvingdale Rd, Dalby and the sale of the industrial land developed in association with this redevelopment.
** The debt term associated with the Residential Land Development will be decreased as the proceeds from the land sale are realized.
Borrowing SourcesCouncil shall raise all external borrowing at the most competitive rates available and from sources as defined by legislation.
Proposed BorrowingsBased on Council’s most recent review of its capital funding requirements, the following borrowings are identified as being required for the current financial year and the next nine financial years.
SCHEDULE OF BORROWINGS
Year Purpose Amount Term(Years)
2011/2012 Dalby Police Citizens Youth Club
Construction of extensions and renovations
11110.802.200.0001 $345,000 20
2011/2012 Bell Community Centre
Establishment of community centre in the town of Bell
11110.0802.200.0030 $1,300,000 20
2011/2012 Dalby Cultural Centre
Relocation of Dalby Library to 107 Drayton Street, Dalby
11110.802.200.0039 $1,600,000 20
2011/2012 Dalby Depot Construction of new workshop 12422.804.200.0012 $127,000 15*
2011/2012 Dalby Depot Reconfigure Lot 11 on D9140 Healy Street Dalby for Industrial Land
12422.804.200.0029 $200,000 15*
2011/2012 Bridge Replacement
Replace Patrick Street Bridge, Dalby 13160.803.200.0001 $400,000 20
2011/2012 Tara Water Plant Augmentation
Investigate design and construct an RO plant for the Tara water supply
14135.0802.200.0005 $360,000 20
2011/2012 Dalby Water Plant Augmentation
Planning and construction of RO plant concentration stage
14135.0802.200.0016 $350,000 20
2011/2012 Land Development –Jandowae
Residential Land Development (Lot 5 on RP 125663 – 15 Allotments)
16110.0802.200.0002 $400,000 10**
2011/2012 Land Development –Chinchilla
Industrial Land Development –Carmichael Street – 7 Allotments
16110.0802.200.0009 $2,000,000 10**
2011/2012 Land Development –Wandoan
Residential Land Development –Purchase from DERM
16110.0802.200.0012 $330,000 10**
2011/2012 Dalby Saleyards Redevelopment
Stage 1 of OH & S Upgrades 16115.0801.200.0006 $700,000 20
2011/2012 Vehicle Washdown Facility –Chinchilla
Construction of vehicle washdown facility at Chinchilla to service the energy and rural industries
42211.802.200.0009 $450,000 10
2011/2012 Waste Transfer Station –Chinchilla
Front of house facility with weighbridge for DERM waste levy audit
43311.0802.200.0014 $830,000 15
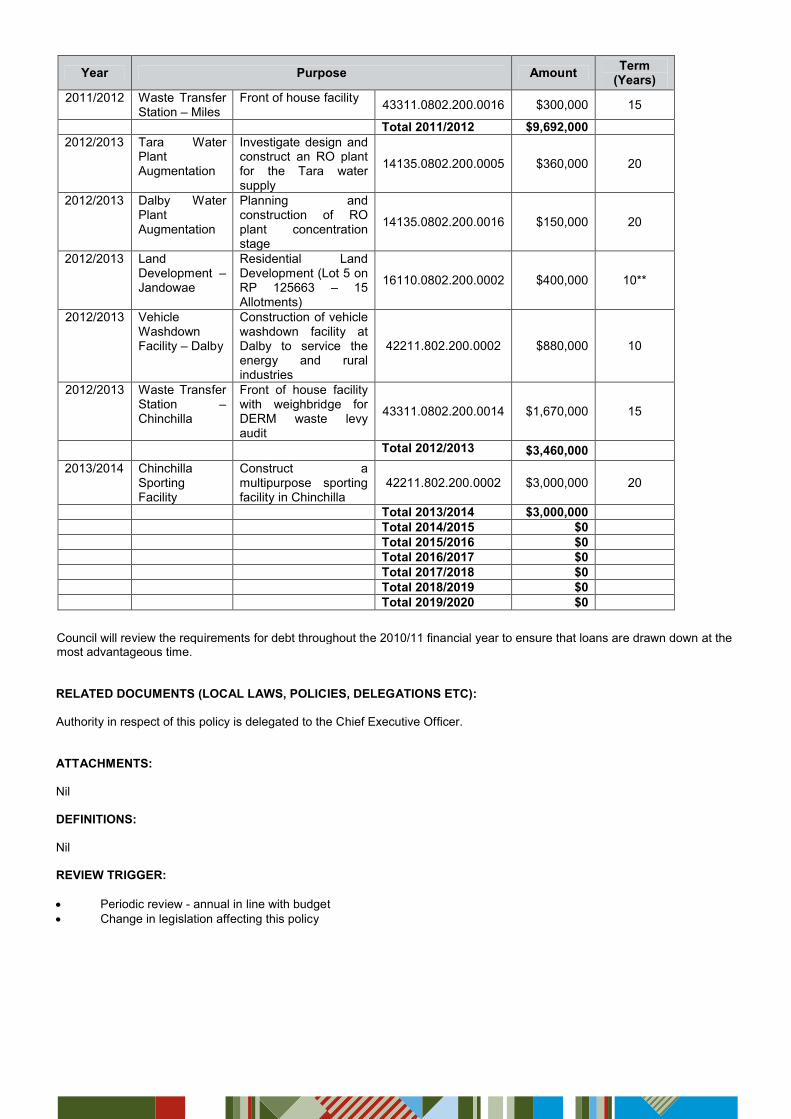
Year Purpose Amount Term(Years)
2011/2012 Waste Transfer Station – Miles
Front of house facility 43311.0802.200.0016 $300,000 15
Total 2011/2012 $9,692,0002012/2013 Tara Water
Plant Augmentation
Investigate design and construct an RO plant for the Tara water supply
14135.0802.200.0005 $360,000 20
2012/2013 Dalby Water Plant Augmentation
Planning and construction of RO plant concentrationstage
14135.0802.200.0016 $150,000 20
2012/2013 Land Development –Jandowae
Residential Land Development (Lot 5 on RP 125663 – 15 Allotments)
16110.0802.200.0002 $400,000 10**
2012/2013 Vehicle Washdown Facility – Dalby
Construction of vehicle washdown facility at Dalby to service the energy and rural industries
42211.802.200.0002 $880,000 10
2012/2013 Waste Transfer Station –Chinchilla
Front of house facility with weighbridge for DERM waste levy audit
43311.0802.200.0014 $1,670,000 15
Total 2012/2013 $3,460,0002013/2014 Chinchilla
Sporting Facility
Construct a multipurpose sporting facility in Chinchilla
42211.802.200.0002 $3,000,000 20
Total 2013/2014 $3,000,000Total 2014/2015 $0Total 2015/2016 $0Total 2016/2017 $0Total 2017/2018 $0Total 2018/2019 $0Total 2019/2020 $0
Council will review the requirements for debt throughout the 2010/11 financial year to ensure that loans are drawn down at the most advantageous time.
RELATED DOCUMENTS (LOCAL LAWS, POLICIES, DELEGATIONS ETC):
Authority in respect of this policy is delegated to the Chief Executive Officer.
ATTACHMENTS:
Nil
DEFINITIONS:
Nil
REVIEW TRIGGER:
Periodic review - annual in line with budget Change in legislation affecting this policy
Customer Service 1300 728 [email protected]
Financial StatementsFor period 1 July 2010 to 30 June 2011
WESTERN DOWNS REGIONAL COUNCIL
Financial ReportFor the year ended 30 June 2011
Table of ContentsNote Page No
Statement of Comprehensive Income 3
Statement of Financial Position 4
Statement of Changes in Equity 5
Statement of Cash Flows 6
Notes to the Financial Statements 7
1 Summary of Significant Accounting Policies 7
2 Analysis of results by function 18
3 Revenue analysis 20
4 Grants, subsidies, contributions and donations 20
5 Gain / (loss) on the disposal of inventory land developed for resale 21
6 Capital income 21
7 Gain / (loss) on the disposal of property, plant and equipment assets 21
8 Employee benefits 21
9 Materials and services 22
10 Finance costs 22
11 Depreciation and amortisation 22
12 Capital expenses 23
13 Loss on write-off of capital assets: 23
14 Loss on impairments 24
15 Cash assets and cash equivalents 24
16 Trade and other receivables 24
17 Inventories 25
18 Land purchased for development and sale 25
19 Property, plant and equipment 26
20 Intangible assets 29
21 Trade and other payables 30
22 Provisions 30
23 Borrowings 31
24 Council capital 31
25 Asset revaluation surplus 32
26 Retained surplus 33
27 General reserves 33
28 Commitments for expenditure 35
29 Events after balance date 35
30 Contingent liabilities 35
31 Superannuation 35
32 Trust funds 36
33 Reconciliation of net result attributable to Council to net cash flow from operating activities 36

WESTERN DOWNS REGIONAL COUNCIL
Financial ReportFor the year ended 30 June 2011
Table of Contents - continuedNote Page No
34 Financial Instruments 38
35 National competition policy comprising: 41
Management Certificate 43
Independent Audit Report 44
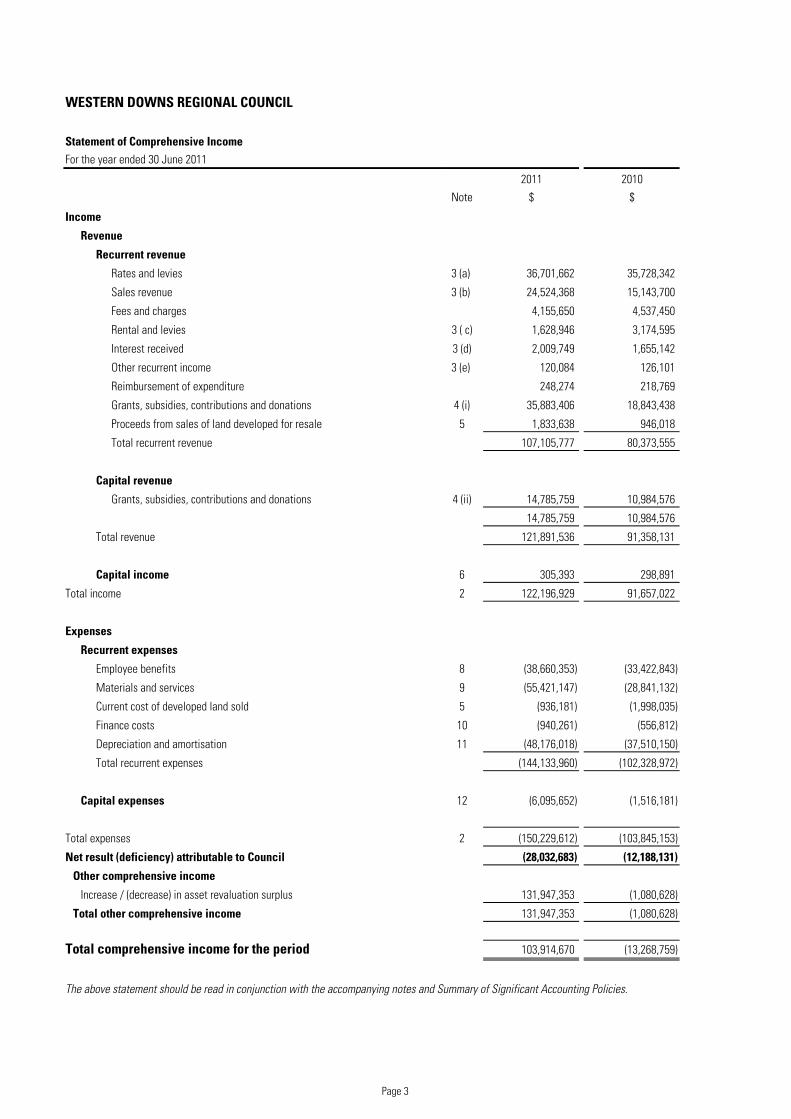
WESTERN DOWNS REGIONAL COUNCIL
Statement of Comprehensive IncomeFor the year ended 30 June 2011
2011 2010
Note $ $
Income
Revenue
Recurrent revenue
Rates and levies 3 (a) 36,701,662 35,728,342
Sales revenue 3 (b) 24,524,368 15,143,700
Fees and charges 4,155,650 4,537,450
Rental and levies 3 ( c) 1,628,946 3,174,595
Interest received 3 (d) 2,009,749 1,655,142
Other recurrent income 3 (e) 120,084 126,101
Reimbursement of expenditure 248,274 218,769
Grants, subsidies, contributions and donations 4 (i) 35,883,406 18,843,438
Proceeds from sales of land developed for resale 5 1,833,638 946,018
Total recurrent revenue 107,105,777 80,373,555
Capital revenue
Grants, subsidies, contributions and donations 4 (ii) 14,785,759 10,984,576
14,785,759 10,984,576
Total revenue 121,891,536 91,358,131
Capital income 6 305,393 298,891
Total income 2 122,196,929 91,657,022
Expenses
Recurrent expenses
Employee benefits 8 (38,660,353) (33,422,843)
Materials and services 9 (55,421,147) (28,841,132)
Current cost of developed land sold 5 (936,181) (1,998,035)
Finance costs 10 (940,261) (556,812)
Depreciation and amortisation 11 (48,176,018) (37,510,150)
Total recurrent expenses (144,133,960) (102,328,972)
Capital expenses 12 (6,095,652) (1,516,181)
Total expenses 2 (150,229,612) (103,845,153)
Net result (deficiency) attributable to Council (28,032,683) (12,188,131)
Other comprehensive income
Increase / (decrease) in asset revaluation surplus 131,947,353 (1,080,628)
Total other comprehensive income 131,947,353 (1,080,628)
Total comprehensive income for the period 103,914,670 (13,268,759)
The above statement should be read in conjunction with the accompanying notes and Summary of Significant Accounting Policies.
Page 3
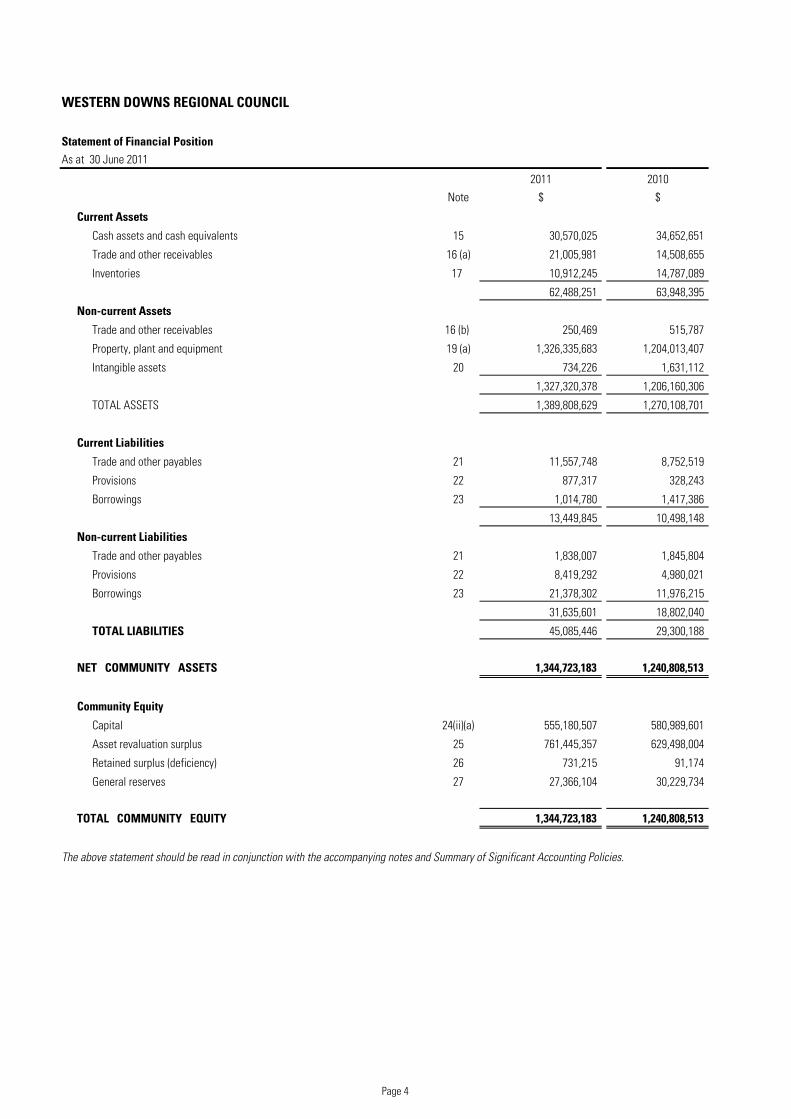
WESTERN DOWNS REGIONAL COUNCIL
Statement of Financial PositionAs at 30 June 2011
2011 2010
Note $ $
Current Assets
Cash assets and cash equivalents 15 30,570,025 34,652,651
Trade and other receivables 16 (a) 21,005,981 14,508,655
Inventories 17 10,912,245 14,787,089
62,488,251 63,948,395
Non-current Assets
Trade and other receivables 16 (b) 250,469 515,787
Property, plant and equipment 19 (a) 1,326,335,683 1,204,013,407
Intangible assets 20 734,226 1,631,112
1,327,320,378 1,206,160,306
TOTAL ASSETS 1,389,808,629 1,270,108,701
Current Liabilities
Trade and other payables 21 11,557,748 8,752,519
Provisions 22 877,317 328,243
Borrowings 23 1,014,780 1,417,386
13,449,845 10,498,148
Non-current Liabilities
Trade and other payables 21 1,838,007 1,845,804
Provisions 22 8,419,292 4,980,021
Borrowings 23 21,378,302 11,976,215
31,635,601 18,802,040
TOTAL LIABILITIES 45,085,446 29,300,188
NET COMMUNITY ASSETS 1,344,723,183 1,240,808,513
Community Equity
Capital 24(ii)(a) 555,180,507 580,989,601
Asset revaluation surplus 25 761,445,357 629,498,004
Retained surplus (deficiency) 26 731,215 91,174
General reserves 27 27,366,104 30,229,734
TOTAL COMMUNITY EQUITY 1,344,723,183 1,240,808,513
The above statement should be read in conjunction with the accompanying notes and Summary of Significant Accounting Policies.
Page 4
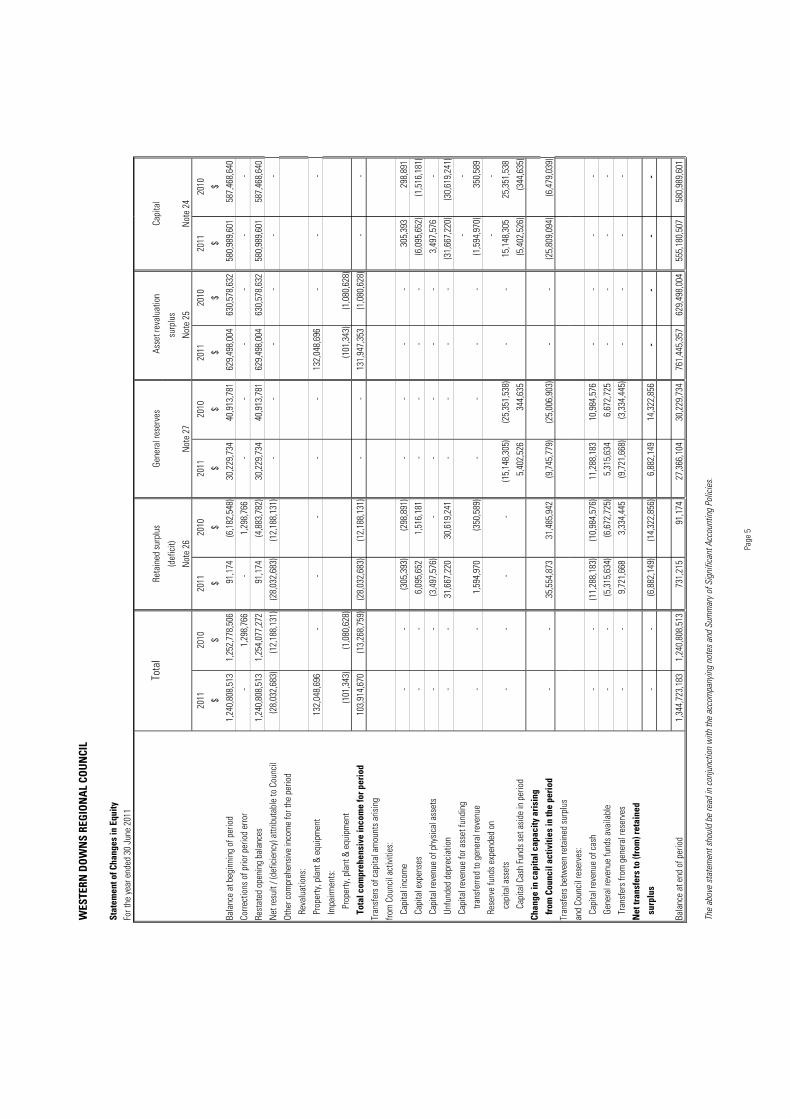
WES
TERN
DO
WN
S RE
GIO
NA
L CO
UN
CIL
Stat
emen
t of C
hang
es in
Equ
ityFo
r the
yea
r end
ed 3
0 Ju
ne 2
011
Tota
lRe
tain
ed s
urpl
usGe
nera
l res
erve
s A
sset
reva
luat
ion
Capi
tal
(def
icit)
surp
lus
Not
e 26
Not
e 27
Not
e 25
Not
e 24
2011
2010
2011
2010
2011
2010
2011
2010
2011
2010
$$
$$
$$
$$
$$
Bala
nce
at b
egin
ning
of p
erio
d1,
240,
808,
513
1,
252,
778,
506
91
,174
(6,1
82,5
48)
30
,229
,734
40
,913
,781
62
9,49
8,00
4
63
0,57
8,63
2
58
0,98
9,60
1
587,
468,
640
Corre
ctio
ns o
f prio
r per
iod
erro
r-
1,29
8,76
6
-
1,
298,
766
-
-
-
-
-
-
Rest
ated
ope
ning
bal
ance
s1,
240,
808,
513
1,
254,
077,
272
91
,174
(4,8
83,7
82)
30
,229
,734
40
,913
,781
62
9,49
8,00
4
63
0,57
8,63
2
58
0,98
9,60
1
587,
468,
640
Net
resu
lt / (
defic
ienc
y) a
ttrib
utab
le to
Cou
ncil
(28,
032,
683)
(1
2,18
8,13
1)
(28,
032,
683)
(12,
188,
131)
-
-
-
-
-
-
Othe
r com
preh
ensi
ve in
com
e fo
r the
per
iod
Reva
luat
ions
:
Prop
erty
, pla
nt &
equ
ipm
ent
132,
048,
696
-
-
-
-
-
132,
048,
696
-
-
-
Impa
irmen
ts:
Prop
erty
, pla
nt &
equ
ipm
ent
(101
,343
)
(1
,080
,628
)
(101
,343
)
(1
,080
,628
)
Tota
l com
preh
ensi
ve in
com
e fo
r per
iod
103,
914,
670
(13,
268,
759)
(2
8,03
2,68
3)
(1
2,18
8,13
1)
-
-
131,
947,
353
(1,0
80,6
28)
-
-
Tran
sfer
s of
cap
ital a
mou
nts
aris
ing
from
Cou
ncil
activ
ities
:
Capi
tal i
ncom
e -
-
(3
05,3
93)
(2
98,8
91)
-
-
-
-
305,
393
298,
891
Capi
tal e
xpen
ses
-
-
6,09
5,65
2
1,51
6,18
1
-
-
-
-
(6
,095
,652
)
(1
,516
,181
)
Capi
tal r
even
ue o
f phy
sica
l ass
ets
-
-
(3,4
97,5
76)
-
-
-
-
-
3,
497,
576
-
Unfu
nded
dep
reci
atio
n-
-
31
,667
,220
30,6
19,2
41
-
-
-
-
(31,
667,
220)
(30,
619,
241)
Capi
tal r
even
ue fo
r ass
et fu
ndin
g-
-
trans
ferre
d to
gen
eral
reve
nue
-
-
1,59
4,97
0
(350
,589
)
-
-
-
-
(1
,594
,970
)
35
0,58
9
Rese
rve
fund
s ex
pend
ed o
n -
-
capi
tal a
sset
s-
-
-
-
(15,
148,
305)
(2
5,35
1,53
8)
-
-
15,1
48,3
05
25
,351
,538
Capi
tal C
ash
Fund
s se
t asi
de in
per
iod
5,40
2,52
6
34
4,63
5
(5,4
02,5
26)
(344
,635
)
Chan
ge in
cap
ital c
apac
ity a
risi
ng
from
Cou
ncil
activ
ities
in th
e pe
riod
-
-
35,5
54,8
73
31
,485
,942
(9
,745
,779
)
(25,
006,
903)
-
-
(2
5,80
9,09
4)
(6
,479
,039
)
Tran
sfer
s be
twee
n re
tain
ed s
urpl
us
and
Coun
cil r
eser
ves:
Capi
tal r
even
ue o
f cas
h -
-
(1
1,28
8,18
3)
(1
0,98
4,57
6)
11,2
88,1
83
10,9
84,5
76
-
-
-
-
Gene
ral r
even
ue fu
nds
avai
labl
e-
-
(5
,315
,634
)
(6
,672
,725
)
5,31
5,63
4
6,
672,
725
-
-
-
-
Tran
sfer
s fro
m g
ener
al re
serv
es-
-
9,
721,
668
3,
334,
445
(9,7
21,6
68)
(3
,334
,445
)
-
-
-
-
Net
tran
sfer
s to
(fro
m) r
etai
ned
surp
lus
-
-
(6,8
82,1
49)
(14,
322,
856)
6,
882,
149
14,3
22,8
56
-
-
-
-
Bala
nce
at e
nd o
f per
iod
1,34
4,72
3,18
3
1,24
0,80
8,51
3
731,
215
91,1
74
27,3
66,1
04
30,2
29,7
34
761,
445,
357
629,
498,
004
555,
180,
507
58
0,98
9,60
1
The
abov
e st
atem
ent s
houl
d be
read
in co
njun
ctio
n w
ith th
e ac
com
pany
ing
note
s and
Sum
mar
y of S
igni
fican
t Acc
ount
ing
Polic
ies.
Page
5
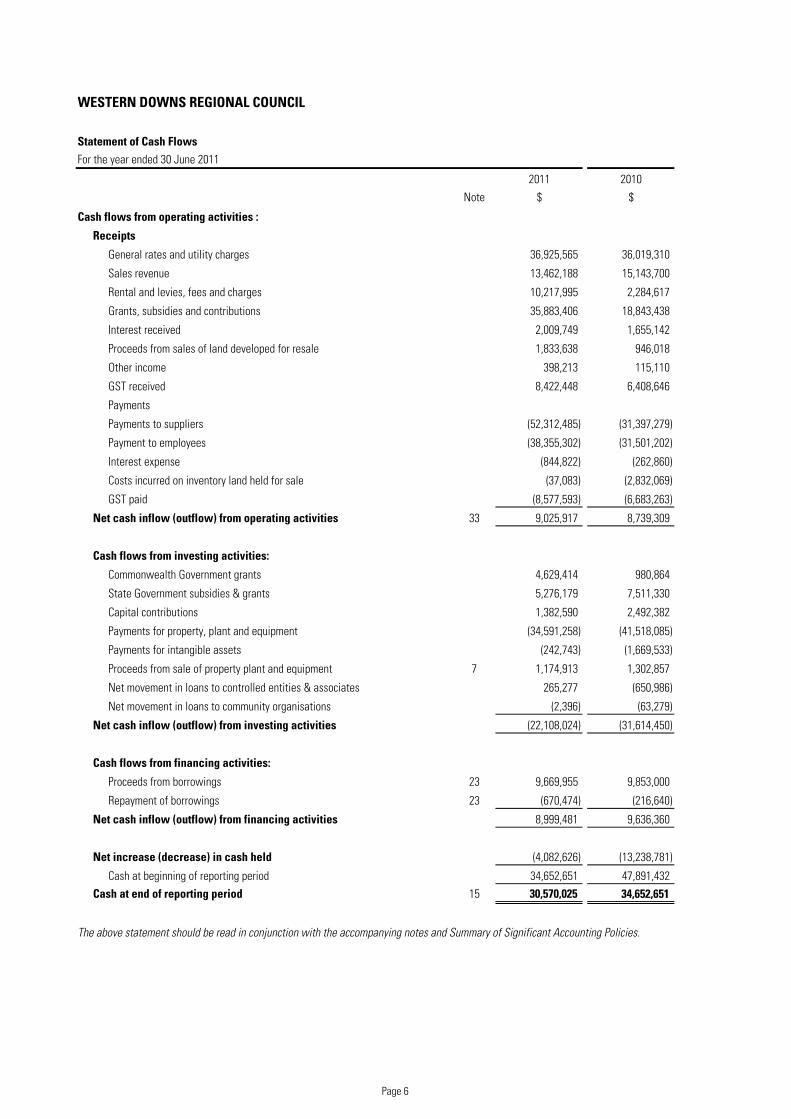
WESTERN DOWNS REGIONAL COUNCIL
Statement of Cash FlowsFor the year ended 30 June 2011
2011 2010
Note $ $
Cash flows from operating activities :
Receipts
General rates and utility charges 36,925,565 36,019,310
Sales revenue 13,462,188 15,143,700
Rental and levies, fees and charges 10,217,995 2,284,617
Grants, subsidies and contributions 35,883,406 18,843,438
Interest received 2,009,749 1,655,142
Proceeds from sales of land developed for resale 1,833,638 946,018
Other income 398,213 115,110
GST received 8,422,448 6,408,646
Payments
Payments to suppliers (52,312,485) (31,397,279)
Payment to employees (38,355,302) (31,501,202)
Interest expense (844,822) (262,860)
Costs incurred on inventory land held for sale (37,083) (2,832,069)
GST paid (8,577,593) (6,683,263)
Net cash inflow (outflow) from operating activities 33 9,025,917 8,739,309
Cash flows from investing activities:
Commonwealth Government grants 4,629,414 980,864
State Government subsidies & grants 5,276,179 7,511,330
Capital contributions 1,382,590 2,492,382
Payments for property, plant and equipment (34,591,258) (41,518,085)
Payments for intangible assets (242,743) (1,669,533)
Proceeds from sale of property plant and equipment 7 1,174,913 1,302,857
Net movement in loans to controlled entities & associates 265,277 (650,986)
Net movement in loans to community organisations (2,396) (63,279)
Net cash inflow (outflow) from investing activities (22,108,024) (31,614,450)
Cash flows from financing activities:
Proceeds from borrowings 23 9,669,955 9,853,000
Repayment of borrowings 23 (670,474) (216,640)
Net cash inflow (outflow) from financing activities 8,999,481 9,636,360
Net increase (decrease) in cash held (4,082,626) (13,238,781)
Cash at beginning of reporting period 34,652,651 47,891,432 Cash at end of reporting period 15 30,570,025 34,652,651
The above statement should be read in conjunction with the accompanying notes and Summary of Significant Accounting Policies.
Page 6
WESTERN DOWNS REGIONAL COUNCIL
Notes to and forming part of the Financial StatementsFor the year ended 30 June 2011
1 Summary of Significant Accounting Policies
1. 1 Basis of Preparation
1. 2 Statement of Compliance
1. 3 Constitution
1. 4 Date of Authorisation
1. 5 Currency
1. 6 Adoption of new and revised Accounting Standards
At the date of authorisation of the financial statements, the Standards and Interpretations listed below were in issue but not yet effective.
Effective for annual report periods beginning on are after:
AASB 9 Financial Instruments (December 2009) 1 January 2013AASB 124 Related Party Disclosures (December 2009) 1 January 2011AASB 1053 Application of Tiers of Australian Accounting Standards 1 July 20132009-11 Amendments to Australian Accounting Standards arising from AASB 9 (December 2009)
1 January 2013
2009-12 Amendments to Australian Accounting Standards in relation to AASB 8 Operating Segments (December 2009)
1 January 2011
2009-14 Amendments to Australian Interpretation – Prepayments of a Minimum Funding Requirement (Interpretation 14) (December 2009)
1 January 2011
AASB 2010-2 Amendments to Australian Accounting Standards arising from Reduced Disclosure Requirements
1 July 2013
AASB 2010-4 Further Amendments to Australian Accounting Standards arising from the Annual Improvements Project
1 January 2011
AASB 2010-5 Amendments to Australian Accounting Standards 1 January 2011AASB 2010-6 Amendments to Australian Accounting Standards – Disclosures on Transfers of Financial Assets
1 July 2011
These general purpose financial statements for the period 1 July 2010 to 30 June 2011 have been prepared in accordance with the Australian Accounting Standards, Australian Accounting Interpretations and other pronouncements issued by the Australian Accounting Standards Board. They also comply with the requirements of the Local Government Act 2009 and the Local Government (Finance, Plans and Reporting) Regulation 2010 .
These financial statements have been prepared under the historical cost convention except for the revaluation of certain non-current assets.
These general purpose financial statements comply with all accounting standards and interpretations issued by the Australian Accounting Standards Board (AASB) that are relevant to Council's operations and effective for the current reporting period. Because the Council is a not-for-profit entity and the Australian Accounting Standards include requirements for not-for-profit entities which are inconsistent with International Financial Reporting Standards (IFRS), to the extent these inconsistencies are applied, these financial statements do not comply with IFRS. The main impacts are the offsetting of revaluation and impairment gains and losses within a class of assets, and the timing of the recognition of non-reciprocal grant revenue.
The Western Downs Regional Council is constituted under the Queensland Local Government Act 2009 and is domiciled in Australia.
The financial report was authorised for issue on the date it was submitted to the Auditor's for certification. This is the date the management certificate is signed.
The Council uses the Australian dollar as its functional currency and its presentation currency.
In the current year, Council adopted all of the new and revised Standards and Interpretations issued by the Australian Accounting Standards Board (AASB) that are relevant to its operations and effective for the current reporting period. The adoption of the new and revised Standards and Interpretations has not resulted in any material changes to Council's accounting policies.
Page 7
WESTERN DOWNS REGIONAL COUNCIL
Notes to and forming part of the Financial StatementsFor the year ended 30 June 2011
AASB 2010-7 Amendments to Australian Accounting Standards arising from AASB 9 (December 2010)
1 January 2013
AASB 2010-8 Amendments to Australian Accounting Standards – Deferred Tax: Recovery of Underlying Assets
1 January 2012
AASB 2010-9 Amendments to Australian Accounting Standards – Severe Hyperinflation and Removal of Fixed Dates for First-time Adopters
1 July 2011
AASB 2010-10 Further Amendments to Australian Accounting Standards – Removal of Fixed Dates for First-time Adopter
1 January 2013
Management have yet to assess the impact that AASB 9 Financial Instruments and 2009-11 Amendments to Australian Accounting Standards is likely to have on the financial statements of Council as it is anticipated that further amendments will occur. Council does not expect to implement the amendments prior to the adoption date of 1 January 2013.
The reported results and position of the Council will not change on adoption of the other pronouncements as they do not result in any changes to the Council’s existing accounting policies. Adoption will, however, result in changes to information currently disclosed in the financial statements. The Council does not intend to adopt any of these pronouncements before their effective dates.
1. 7 Critical accounting judgements and key sources of estimation uncertainty
Valuation and depreciation of property, plant and equipment - note 1.15(c) and note 19 (b)Impairment of property, plant and equipment - note 1.17, note 14 and note 19 (a)Provisions - note 1.22 and note 22Contingencies - note 30
1. 8 Revenue
1. 8 (a) Rates and levies
The Council has made no judgements or assessments which may cause a material adjustment to the carrying amount of assets and liabilities within the next reporting period.
In the application of Council's accounting policies, management is required to make judgements, estimates and assumptions about carrying values of assets and liabilities that are not readily apparent from other sources. The estimates and associated assumptions are based on historical experience and other factors that are considered to be relevant. Actual results may differ from these estimates. The estimates and ongoing assumptions are reviewed on an ongoing basis. Revisions to accounting estimates are recognised in the period in which the estimate is revised and in future periods as relevant.
Judgements, estimates and assumptions that have a potential significant effect are outlined in the following financial statement notes:
Rates, levies, rental income, grants and other revenue are recognised as revenue on receipt of funds or earlier upon unconditional entitlement to the funds.
Where rate monies are received prior to the commencement of the rating/levying period, the amount is recognised as revenue in the period in which they are received, otherwise rates are recognised at the commencement of rating period.
Page 8
WESTERN DOWNS REGIONAL COUNCIL
Notes to and forming part of the Financial StatementsFor the year ended 30 June 2011
1. 8 (b) Sales revenue
1. 8 (c) Grants and subsidies
1. 8 (d) Non-Cash Contributions
1. 8 (e) Cash Contributions
1. 8 (f) Rental income
1. 8 (g) Interest
Where grants are received that are reciprocal in nature, revenue is recognised over the term of the funding arrangements. Council does not currently have any reciprocal grants.
Non-cash contributions with a value in excess of the asset recognition thresholds, are recognised as revenue and as non-current assets. Non-cash contributions below the thresholds are recorded as revenue and expenses.
Physical assets contributed to Council by developers in the form of road works, stormwater, water and wastewater infrastructure and park equipment are recognised as revenue when the development becomes "on maintenance" (i.e. the Council obtains control of the assets and becomes liable for any ongoing maintenance) and there is sufficient data in the form of drawings and plans to determine the approximate specifications and values of such assets. All non-cash contributions are recognised at the fair value of the contribution received on the date of acquisition.
Revenue from the sale of natural gas and quarry items is recognised upon transfer of ownership to the customer. Revenue is measured at the fair value of the consideration received or receivable
Revenue for saleyard services and contract work is recognised in the accounting peirod in which the services are rendered.
Council receives cash contributions from property developers to construct assets such as roads and footpaths and to connect new property developments to water and sewerage networks in the local government area. Where agreements between Council and the developers relating to these contributions are determined to fall within the scope of AASB Interpretation 18 Transfers of Assets from Customers these contributions are recognised as revenue when the related service obligations are fulfilled.
Developers may also make cash contributions towards the cost of constructing existing and proposed water supply and sewerage headworks in accordance with Council's planning scheme policies. (Headworks include pumping stations, treatment works, mains, sewers and water pollution control works). Cash contributions in relation to water supply and sewerage headworks are not within the scope of AASB Interpretation 18 becase there is no performance obligation associated with these contributions. Consequently, these cash contributions are recognised as income when received.
AASB Intrepretation 18 has been applied prospectively from 1 July 2009. All cash contributions were recognised as revenue on receipt prior to 1 July 2009.
Grants, subsidies and contributions that are non-reciprocal in nature are recognised as revenue in the year in which Council obtains control over them. An equivalent amount is transferred from retained earnings to the relevant reserve until the funds are expended. Unspent non-reciprocal capital grant funds are placed in the unspent capital grants reserve.
Rental revenue from property is recognised as income on a periodic straight line basis over the lease term.
Interest received from term deposits is accrued over the term of the investment.
Page 9
WESTERN DOWNS REGIONAL COUNCIL
Notes to and forming part of the Financial StatementsFor the year ended 30 June 2011
1. 9 Financial assets and liabilities
Financial assets
Financial liabilities
The fair value of trade receivables approximates the amortised cost less any impairment. The fair value of payables approximates the amortised cost.
1. 10 Cash and Cash Equivalents
1. 11 Receivables
All other disclosures relating to the measurement and financial risk management of financial instruments are included in note 34.
Cash and cash equivalents includes cash on hand, all cash and cheques receipted but not banked at the year end, deposits held at call with financial institutions, other short-term, highly liquid investments with original maturities of three months or less that are readily convertible to known amounts of cash and which are subject to an insignificant risk of changes in value, and bank overdrafts.
Trade receivables are recognised at the amounts due at the time of sale or service delivery i.e. the agreed purchase price / contract price. Settlement of these amounts is required within 30 days from invoice date.
The collectability of receivables is assessed periodically and if there is objective evidence that Council will not be able to collect all amounts due, the carrying amount is reduced for impairment. The loss is recognised in finance costs. The amount of the impairment is the difference between the asset’s carrying amount and the present value of the estimated cash flows discounted at the effective interest rate.
All known bad debts were written-off at 30 June 2011. If an amount is recovered in a subsequent period it is recognised as revenue.
Council can enact the power under the Local Government (Finance and Reporting) Regulations 2010 to sell an owner's property to recover outstanding rate debts, due to this authority Council does not impair any rate receivables.
Council recognises a financial asset or a financial liability in its Statement of Financial Position when, and only when, Council becomes a party to the contractual provisions of the instrument.
Western Downs Regional Council has categorised and measured the financial assets and financial liabilities held at balance date as follows:
Financial assets and financial liabilities are presented separately from each other and offsetting has not been applied.
Western Downs Regional Council does not recognise financial assets or financial liabilities at fair value in the Statement of Financial Position.
The fair value of cash and cash equivalents and non-interest bearing monetary financial assets and financial liabilities approximate their carrying amounts and are not disclosed separately.
The fair value of borrowings, as disclosed in note 23 to the accounts, is determined by reference to published price quotations in an active market and/or by reference to pricing models and valuation techniques. It reflects the value of the debt if the Council repaid it in full at balance date. As it is the intention of the Council to hold its borrowings for their full term, no adjustment provision is made in these accounts.
Cash and cash equivalents (note 1.10)Receivables - measured at amortised cost less any impairment (note 1.11)
Payables - measured at amortised cost (note 1.19)Borrowings - measured at amortised cost (note 1.21)
The fair value of financial instruments is determined as follows:
Page 10
WESTERN DOWNS REGIONAL COUNCIL
Notes to and forming part of the Financial StatementsFor the year ended 30 June 2011
1. 12 Inventories
1. 13 Land Held for Resale
1. 14 Investments
1. 15 Property, Plant and Equipment
(a) Acquisition of assets
Each class of property, plant and equipment is stated at cost or fair value less, where applicable, any accumulated depreciation and accumulated impairment loss. Items of plant and equipment with a total value of less than $10,000 (2010: $5,000), and infrastructure assets and buildings with a total value of less than $10,000 are treated as an expense in the year of acquisition. All other items of property, plant and equipment are capitalised.
The classes of property plant and equipment recognised by the Council are reported in note 19 (a).
Acquisitions of assets are initially recorded at cost. Cost is determined as the fair value of the assets given as consideration plus costs incidental to the acquisition, including freight in, architect's fees and engineering design fees and all other establishment costs.
Property, plant and equipment received in the form of physical contributions, are recognised as assets and revenues at fair value by Council valuation where that value exceeds the recognition thresholds for the respective asset class. Fair value means the amount for which an asset could be exchanged, or a liability settled, between knowledgeable, willing parties in an arm's length transaction.
Loans and advances are recognised in the same way as other receivables. Terms are usually a maximum of five years with interest charged at negotiated rates. Security is not normally obtained.
Stores and raw materials held for resale are valued at the lower of cost and net realisable value and include, where applicable, direct material, direct labour and an appropriate portion of variable and fixed overheads. Costs are assigned on the basis of weighted average cost.
Inventory for distribution is valued at cost, adjusted when applicable for any loss of service protential.
Land acquired with the intention of reselling it (with or without further development) is classified as inventory. As inventory, this land is valued at the lower of cost or net realisable value. Inventory land is treated as a current asset except where it is anticipated that a material portion of land value will not be sold within 12 months. Land held beyond 12 months is reported as non-current inventory.
Profit arising upon sale of land is recognised in the Statement of Comprehensive Income on the signing of a valid unconditional contract of sale.
Term deposits in excess of three months are reported as investments, with deposits of less than three months being reported as cash equivalents.
Inventories held for distribution (internal consumption) are: - goods to be supplied at no, or nominal charge, and - goods to be used for the provision of services at no, or nominal charge.
At 30 June 2011, Council did not have any term deposits in excess of three months.
Page 11
WESTERN DOWNS REGIONAL COUNCIL
Notes to and forming part of the Financial StatementsFor the year ended 30 June 2011
(b) Capital and operating expenditure
(c) Valuation
(d) Depreciation
Wage and materials expenditure incurred for the acquisition or construction of assets are treated as capital expenditure.
Land and site improvements, buildings and all infrastructure assets are measured on the revaluation basis, at fair value, in accordance with AASB116 Property, Plant and Equipment and the Local Government (Finance, Plans & Reporting) Regulation 2010. Other plant and equipment, furniture and fittings, heritage assets and work in progress are measured at cost.
Where assets have separately identifiable components that are subject to regular replacement, these components are assigned useful lives distinct from the asset to which they relate. Any expenditure that increases the originally assessed capacity or service potential of an asset is capitalised and the new depreciable amount is depreciated over the remaining useful life of the asset to the Council.
The estimated useful lives and residual values of property, plant and equipment are reviewed annually. Details of the range of useful lives for each class of asset are shown in note 19 (a).
Council ensures at each reporting date that the carrying amount of each asset class held at valuation does not materially differ from its' fair value by performing:-
Any revaluation increment arising on the revaluation of an asset is credited to the appropriate class of the asset revaluation surplus, except to the extent it reverses a revaluation decrement for the class previously recognised as an expense. A decrease in the carrying amount on revaluation is charged as an expense to the extent it exceeds the balance, if any, in the revaluation surplus to that asset class.
On revaluation, accumulated depreciation is restated proportionately with the change in the carrying amount of the asset and any change in the estimate of remaining useful life.
Separately identified components of assets are measured on the same basis as the assets to which they relate.
Land is not depreciated as it has an unlimited useful life.
For all other assets classes Council depreciates each assets' carrying amount, net of its residual value, over its useful life. Assets are depreciated from the date of acquisition or, in respect of internally constructed assets, from the time an asset is completed and commissioned ready for use.
It is Council's policy to perform a comprehensive revaluation at least once every five years.
- a comprehensive revaluation where Council assesses that there has been a material change in the fair value of assets; or
- an interim valuation using suitable indicies, where there has been a material variation in the index.
There has been a change in the methodology used to estimate depreciation expense for 2010/2011 compared to 2009/2010. This is disclosed in Note 11 of the financial statements.
Details of valuers and methods of valuations are disclosed in Note 19 (b).
Page 12
WESTERN DOWNS REGIONAL COUNCIL
Notes to and forming part of the Financial StatementsFor the year ended 30 June 2011
(e) Land under roads
(f) Capital Work in Progress
1. 16 Intangible Assets
1. 17 Impairment of Non Current Assets
1. 18 Operating Leases
1. 19 Payables
Land under roads acquired before 30 June 2008 is recognised as a non-current asset where the Council holds title or a financial lease over the asset. The Western Downs Regional Council currently does not have any such land holdings.
Land under the road network within the Council area that has been dedicated and opened for public use under the Land Act 1994 or the Land Title Act 1994 is not controlled by Council but is controlled by the state pursuant to the relevant legislation. Therefore this land is not recognised in these financial statements.
The cost of property, plant and equipment being constructed by the Council includes the cost of purchased services, materials, direct labour and an appropriate proportion of labour overheads.
Where an impairment loss subsequently reverses, the carrying amount of the asset is increased to the revised estimate of its recoverable amount, but so that the increased carrying amount does not exceed the carrying amount that would have been determined had no impairment loss been recognised for the asset in prior years. A reversal of an impairment loss is recognised as income unless the asset is carried at a revalued amount, in which case the reversal of the impairment loss is treated as a revaluation surplus increase.
Payments made under operating leases are expensed in equal instalments over the accounting periods covered by the lease term, except where an alternative basis is more representative of the pattern of benefits to be derived from the leased property.
Trade creditors are recognised upon receipt of the goods or services ordered and are measured at the agreed purchase/contract price net of applicable discounts other than contingent discounts. Amounts owing are unsecured and are generally settled on 30 day terms.
Only intangible assets which have a cost exceeding $10,000 (2010: $5,000) are recognised as intangible assets.
Expenditure on internally generated intangible assets is recognised from the date of the approval by the Council of a capital expenditure authorisation for the acquisition or development of the asset.
Expenditure on internally generated assets, up to the decision to generate the asset in a particular form, is research expenditure and is not capitalised.
It has been determined that there is not an active market for any of the Council's intangible assets. Therefore, the assets are recognised and carried at cost less accumulated amortisation and accumulated impairment losses.
Each non-current physical and intangible asset and group of assets is assessed for indicators of impairment annually. If an indicator of possible impairment exists, the Council determines the asset's recoverable amount. Any amount by which the asset's carrying amount exceeds the recoverable amount is recorded as an impairment loss. The recoverable amount of an asset is the higher of its fair value less costs to sell and its value in use.
An impairment loss is recognised immediately in the Statement of Comprehensive Income, unless the asset is carried at a revalued amount. When the asset is measured at a revalued amount, the impairment loss is offset against the asset revaluation surplus of the relevant class to the extent available.
Page 13
WESTERN DOWNS REGIONAL COUNCIL
Notes to and forming part of the Financial StatementsFor the year ended 30 June 2011
1. 20 Liabilities - Employee Benefits
(a) Salaries and wages
(b) Annual leave
(c) Sick leave
(d) Superannuation
Details of those arrangements are set out in note 31.
(e) Long service leave
This liability is reported in note 22 as a provision.
1. 21 Borrowings
Liabilities are recognised for employee benefits such as wages and salaries, annual leave and long service leave in respect of services provided by the employees up to the reporting date. Liabilities for employee benefits are assessed at each reporting date. Where it is expected that the leave will be paid in the next twelve months the liability is treated as a current liability. Otherwise the liability is treated as non-current.
A liability for salaries and wages is recognised and measured as the amount unpaid at the reporting date at current pay rates in respect of employees' services up to that date. This liability represents an accrued expense and is included in note 21 as a payable.
A liability for annual leave is recognised. The current portion (based on the expected payment date) is calculated on current wage and salary levels and includes related employee on-costs. The non current portion is calculated on projected future wage and salary levels and related employee on-costs, discounted to present values. This liability represents an accrued expense and is reported in note 21 as a payable.
Borrowings are classified as non current liabilities except for the principle amount that is due and payable, under the contractual terms of the loan agreement, 12 months after the end of the reporting period. This amount is classified as a current amount. Further details are provided in note 23.
Sick leave taken in the future will be met by future entitlements and hence no recognition of accrued sick leave entitlements have been made in these financial statements. No entitlement vests with the employee on termination.
The superannuation expense for the reporting period is the amount of the contribution the local government makes to the superannuation plan which provides benefits to its employees.
A liability for long service leave is measured as the present value of the estimated future cash outflows to be made in respect of services provided by employees up to the reporting date. The value of the liability is calculated using current pay rates and projected future increases in those rates and includes related employee on-costs. The estimates are adjusted for the probability of the employee remaining in the Council's employment or other associated employment which would result in the Council being required to meet the liability. Adjustments are then made to allow for the proportion of the benefit earned to date, and the result is discounted to present value. The interest rates attaching to Commonwealth Government guaranteed securities at the reporting date are used to discount the estimated future cash outflows to their present value.
Borrowings are initially recognised at fair value plus any directly attributable transaction costs. Subsequent to initial recognition these liabilities are measured at amortised cost.
Borrowing costs, which includes interest and administration fees, are expensed in the period in which they arise. Costs that are not settled in the period in which they arise are included in payables.
All borrowing costs are expensed in the period in which they are incurred. No borrowing costs are capitalised on qualifying assets.
Page 14
WESTERN DOWNS REGIONAL COUNCIL
Notes to and forming part of the Financial StatementsFor the year ended 30 June 2011
1. 22 Restoration Provision
(a) Restoration on land not controlled by Council
(b) Restoration on land controlled by Council
1. 23 Council Capital Value
1. 24 Asset Revaluation Surplus
Increases and decreases on revaluation are offset within a class of assets.
1. 25 (a) Constrained Grants, Subsidies and Contributions Reserve
A provision is made for the cost of restoration of assets and other future restoration costs where it is probable the Council will be liable, or required, to incur such a cost on the cessation of use of the facility. Further details can be found in note 22.
The provision is measured at the expected cost of the work required discounted to current day values using an appropriate rate. The current Queensland Treasury Corporation (QTC) lending rate is considered an appropriate rate.
Where the restoration site is on State capital reserves which the Council does not control, the cost of the provisions for restoration of these sites has to be treated as an expense in the year the provision is first recognised. Changes in the provision due to either time, discount rate or expected future cost are treated as an expense or income in the reporting in which they arise.
Where the restoration site is on Council controlled land, the cost of the restoration provision is added to the cost of the land as an improvement and amortised over the expected useful life. Changes in the provision not arising from the passing of time are added to or deducted from the asset revaluation surplus for land. If there is no available revaluation surplus, increases in the provision are treated as an expense and recovered out of future decreases if any.
Changes to the provision resulting from the passing of time (the unwinding of the discount) are treated as a finance cost.
All grants, subsidies and contributions of monetary revenue received during the reported period for the purpose of funding specific capital expenditure are recognised as revenue in the the year of receipt. At the end of each reporting period grant funds that have not been expended during the period are transferred from retained surplus to a constrained works reserve. As the expenditure is incurred on specific capital assets in the following reporting periods the equivalent funds are transferred to the capital account. The balance of the reserve at 30 June each year represents funds to be expended in future period in the manner specified by the contributor.
The Council's capital value represents the net carrying value of the capital assets less the amount of capital debt at the reporting date and includes the initial value of operating assets and liabilities recognised at its inception.
At the reporting date the Council had unspent QTC loan funds. This unspent cash is a restricted capital asset and is reported in note 24(ii)(b) .
The maintenance of the Council's capital capacity is fundamental to its long term sustainability to continue to deliver essential services to the community, it has therefore been separately identified and the change in value is reported in the Statement of Changes in Equity and note 24.
The asset revaluation surplus comprises adjustments relating to changes in value of property, plant and equipment that do not result from the use of those assets. Net incremental changes in the carrying value of classes of non-current assets since their initial recognition are accumulated in the asset revaluation surplus.
Where a class of assets is decreased on revaluation, that decrease is offset first against the amount remaining in the asset revaluation surplus in respect of that class. Any excess is treated as an expense.
When an asset is disposed of, the amount in this surplus account in respect of that asset is retained in the surplus.
Page 15
WESTERN DOWNS REGIONAL COUNCIL
Notes to and forming part of the Financial StatementsFor the year ended 30 June 2011
(b) Grants, Subsidies and Contributions Reimbursed Reserve
(c) Water Reserve
(d) Sewerage Reserve
(e) Waste ReserveThis reserve was created to contribute to the future funding for refuse disposal.
(f) Plant Replacement Reserve
(g) Roads Special Charges Reserve
(h) Roads Network Reserve
(i) Gas Infrastructure Reserve
(j) Asset Replacement Reserve
(k) Unspent Loans ReserveThis reserve was created and holds unspent loan funds.
(l) Saleyards Reserve
1. 26 Retained Surplus
1. 27 National Competition Policy
1. 28 Rounding and Comparatives
This reserve is credited with all grants, subsidies and contributions of monetary revenue received during the reported period which the Council has identified as being a reimbursement of capital funds expended in a prior period.
This reserve was created and holds funds to contribute to the future renewal of Council water infrastructure.
This reserve was created and holds funds to contribute to the future renewal of Council waste water infrastructure.
This reserve was created and hold funds to be contributed to the future replacement of the Council's plant.
This reserve holds unexpended funds raised from the Huston's Road and Macalister-Wilkie Creek Road Special as defined in Council's 2010/2011 Revenue Statement.
Amounts included in the financial statements have been rounded to the nearest $1 or, where that amount is $0.50 or less, to zero.
Comparative information has been restated where necessary to be consistent with disclosures in the current reporting period.
This reserve was created and hold funds to be contributed to the future replacement of the Council's road network.
This reserve was created to contribute to the future renewal of Council's gas infrastructure.
This reserve was created to contribute to the future renewal of Council's assets.
This reserve was created to contribute to the future renewal of Council's saleyard assets.
This represents the amount of Council net funds not set aside in reserves to meet identified future needs.
The Council has reviewed its activities and has identified 7 activities that are business activities. Details of these activities can be found in note 35.
Page 16
WESTERN DOWNS REGIONAL COUNCIL
Notes to and forming part of the Financial StatementsFor the year ended 30 June 2011
1. 29 Trust Funds Held for Outside Parties
For details see note 32.
1. 30 Taxation
Funds held in the trust account on behalf of outside parties include those funds from the sale of land for arrears in rates recovery, deposits for the contracted sale of land, security deposits lodged to guarantee performance and unclaimed monies (e.g. wages) paid into the trust account by the Council. The Council performs only a custodian role in respect of these monies and because the monies cannot be used for Council purposes, they are not considered revenue nor brought to account in the financial statements.
Income of local authorities and public authorities is exempt from Commonwealth taxation except for Fringe Benefits Tax and Goods and Services Tax (‘GST’). The net amount of GST recoverable from the ATO or payable to the ATO is shown as an asset or liability respectively.
The Council pays payroll tax to the Queensland State Government on certain activities.
Page 17
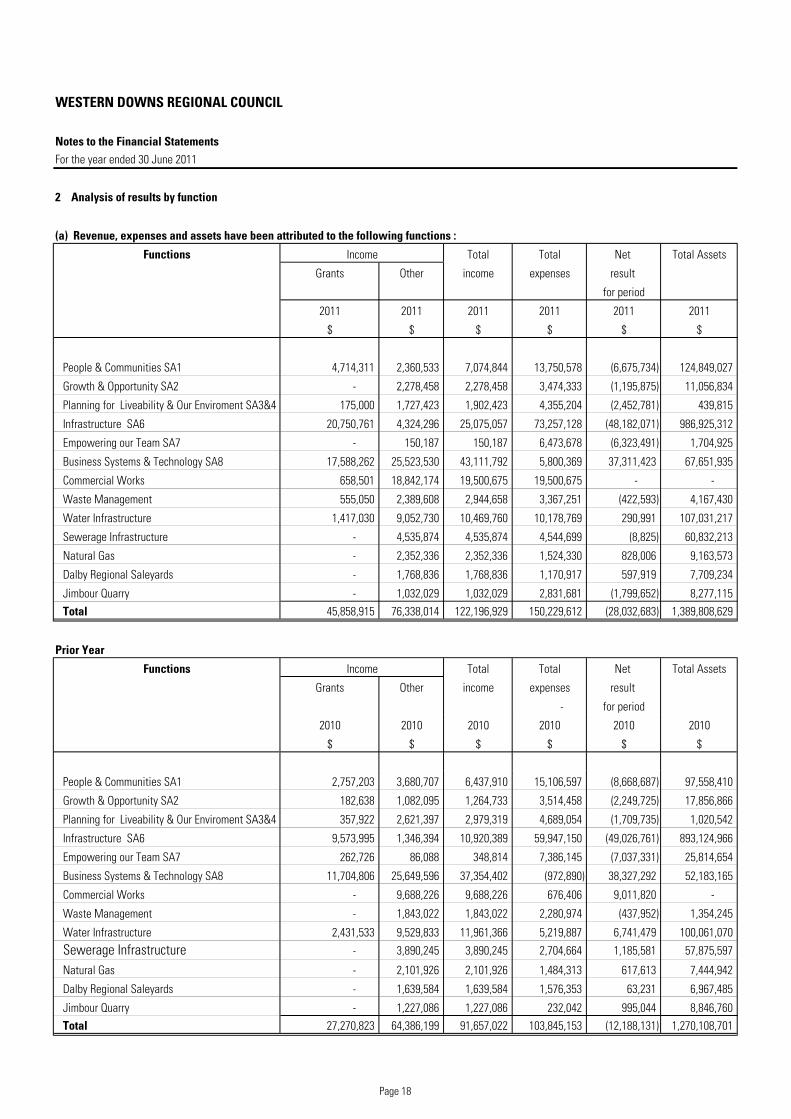
WESTERN DOWNS REGIONAL COUNCIL
Notes to the Financial StatementsFor the year ended 30 June 2011
2 Analysis of results by function
(a) Revenue, expenses and assets have been attributed to the following functions :
Functions Income Total Total Net Total Assets
Grants Other income expenses result
for period
2011 2011 2011 2011 2011 2011
$ $ $ $ $ $
People & Communities SA1 4,714,311 2,360,533 7,074,844 13,750,578 (6,675,734) 124,849,027
Growth & Opportunity SA2 - 2,278,458 2,278,458 3,474,333 (1,195,875) 11,056,834
Planning for Liveability & Our Enviroment SA3&4 175,000 1,727,423 1,902,423 4,355,204 (2,452,781) 439,815
Infrastructure SA6 20,750,761 4,324,296 25,075,057 73,257,128 (48,182,071) 986,925,312
Empowering our Team SA7 - 150,187 150,187 6,473,678 (6,323,491) 1,704,925
Business Systems & Technology SA8 17,588,262 25,523,530 43,111,792 5,800,369 37,311,423 67,651,935
Commercial Works 658,501 18,842,174 19,500,675 19,500,675 - -
Waste Management 555,050 2,389,608 2,944,658 3,367,251 (422,593) 4,167,430
Water Infrastructure 1,417,030 9,052,730 10,469,760 10,178,769 290,991 107,031,217
Sewerage Infrastructure - 4,535,874 4,535,874 4,544,699 (8,825) 60,832,213
Natural Gas - 2,352,336 2,352,336 1,524,330 828,006 9,163,573
Dalby Regional Saleyards - 1,768,836 1,768,836 1,170,917 597,919 7,709,234
Jimbour Quarry - 1,032,029 1,032,029 2,831,681 (1,799,652) 8,277,115 Total 45,858,915 76,338,014 122,196,929 150,229,612 (28,032,683) 1,389,808,629
Prior Year
Functions Income Total Total Net Total Assets
Grants Other income expenses result
- for period
2010 2010 2010 2010 2010 2010
$ $ $ $ $ $
People & Communities SA1 2,757,203 3,680,707 6,437,910 15,106,597 (8,668,687) 97,558,410
Growth & Opportunity SA2 182,638 1,082,095 1,264,733 3,514,458 (2,249,725) 17,856,866
Planning for Liveability & Our Enviroment SA3&4 357,922 2,621,397 2,979,319 4,689,054 (1,709,735) 1,020,542
Infrastructure SA6 9,573,995 1,346,394 10,920,389 59,947,150 (49,026,761) 893,124,966
Empowering our Team SA7 262,726 86,088 348,814 7,386,145 (7,037,331) 25,814,654
Business Systems & Technology SA8 11,704,806 25,649,596 37,354,402 (972,890) 38,327,292 52,183,165
Commercial Works - 9,688,226 9,688,226 676,406 9,011,820 -
Waste Management - 1,843,022 1,843,022 2,280,974 (437,952) 1,354,245
Water Infrastructure 2,431,533 9,529,833 11,961,366 5,219,887 6,741,479 100,061,070
Sewerage Infrastructure - 3,890,245 3,890,245 2,704,664 1,185,581 57,875,597
Natural Gas - 2,101,926 2,101,926 1,484,313 617,613 7,444,942
Dalby Regional Saleyards - 1,639,584 1,639,584 1,576,353 63,231 6,967,485
Jimbour Quarry - 1,227,086 1,227,086 232,042 995,044 8,846,760 Total 27,270,823 64,386,199 91,657,022 103,845,153 (12,188,131) 1,270,108,701
Page 18
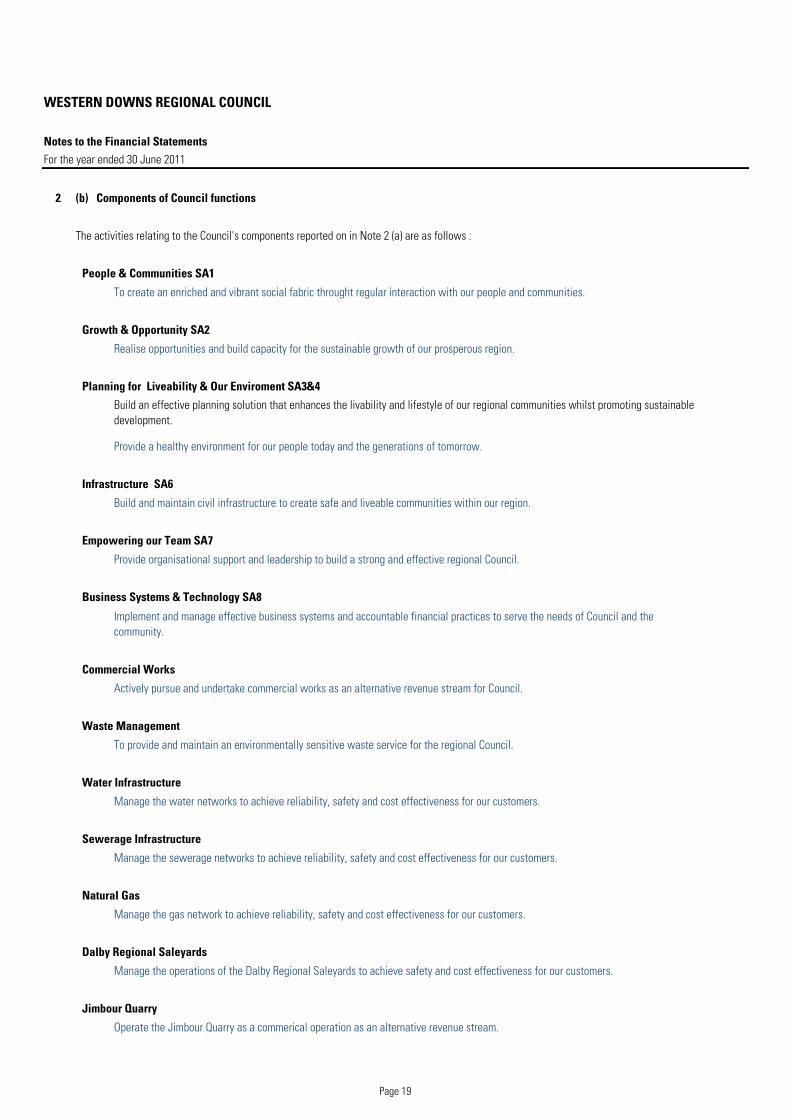
WESTERN DOWNS REGIONAL COUNCIL
Notes to the Financial StatementsFor the year ended 30 June 2011
2 (b) Components of Council functions
The activities relating to the Council's components reported on in Note 2 (a) are as follows :
People & Communities SA1
To create an enriched and vibrant social fabric throught regular interaction with our people and communities.
Growth & Opportunity SA2
Realise opportunities and build capacity for the sustainable growth of our prosperous region.
Planning for Liveability & Our Enviroment SA3&4
Build an effective planning solution that enhances the livability and lifestyle of our regional communities whilst promoting sustainable development.
Provide a healthy environment for our people today and the generations of tomorrow.
Infrastructure SA6
Build and maintain civil infrastructure to create safe and liveable communities within our region.
Empowering our Team SA7
Provide organisational support and leadership to build a strong and effective regional Council.
Business Systems & Technology SA8
Implement and manage effective business systems and accountable financial practices to serve the needs of Council and the community.
Commercial Works
Actively pursue and undertake commercial works as an alternative revenue stream for Council.
Waste Management
To provide and maintain an environmentally sensitive waste service for the regional Council.
Water Infrastructure
Manage the water networks to achieve reliability, safety and cost effectiveness for our customers.
Sewerage Infrastructure
Manage the sewerage networks to achieve reliability, safety and cost effectiveness for our customers.
Natural Gas
Manage the gas network to achieve reliability, safety and cost effectiveness for our customers.
Dalby Regional Saleyards
Manage the operations of the Dalby Regional Saleyards to achieve safety and cost effectiveness for our customers.
Jimbour Quarry
Operate the Jimbour Quarry as a commerical operation as an alternative revenue stream.
Page 19
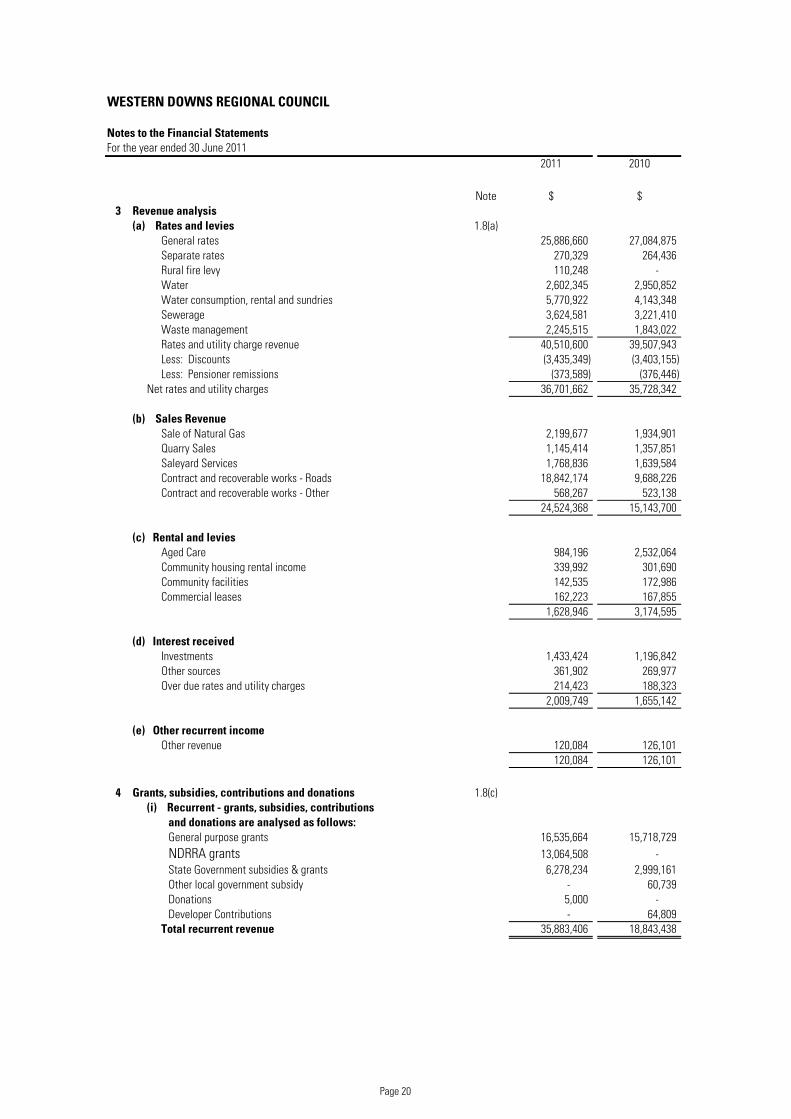
WESTERN DOWNS REGIONAL COUNCIL
Notes to the Financial StatementsFor the year ended 30 June 2011
2011 2010
Note $ $3 Revenue analysis
(a) Rates and levies 1.8(a)General rates 25,886,660 27,084,875 Separate rates 270,329 264,436 Rural fire levy 110,248 - Water 2,602,345 2,950,852 Water consumption, rental and sundries 5,770,922 4,143,348 Sewerage 3,624,581 3,221,410 Waste management 2,245,515 1,843,022 Rates and utility charge revenue 40,510,600 39,507,943 Less: Discounts (3,435,349) (3,403,155) Less: Pensioner remissions (373,589) (376,446)
Net rates and utility charges 36,701,662 35,728,342
(b) Sales RevenueSale of Natural Gas 2,199,677 1,934,901 Quarry Sales 1,145,414 1,357,851 Saleyard Services 1,768,836 1,639,584 Contract and recoverable works - Roads 18,842,174 9,688,226 Contract and recoverable works - Other 568,267 523,138
24,524,368 15,143,700
(c) Rental and leviesAged Care 984,196 2,532,064 Community housing rental income 339,992 301,690 Community facilities 142,535 172,986 Commercial leases 162 223 167 855Commercial leases 162,223 167,855
1,628,946 3,174,595
(d) Interest receivedInvestments 1,433,424 1,196,842 Other sources 361,902 269,977 Over due rates and utility charges 214,423 188,323
2,009,749 1,655,142
(e) Other recurrent incomeOther revenue 120,084 126,101
120,084 126,101
4 Grants, subsidies, contributions and donations 1.8(c)(i) Recurrent - grants, subsidies, contributions
and donations are analysed as follows:General purpose grants 16,535,664 15,718,729 NDRRA grants 13,064,508 - State Government subsidies & grants 6,278,234 2,999,161 Other local government subsidy - 60,739 Donations 5,000 - Developer Contributions - 64,809
Total recurrent revenue 35,883,406 18,843,438
Page 20
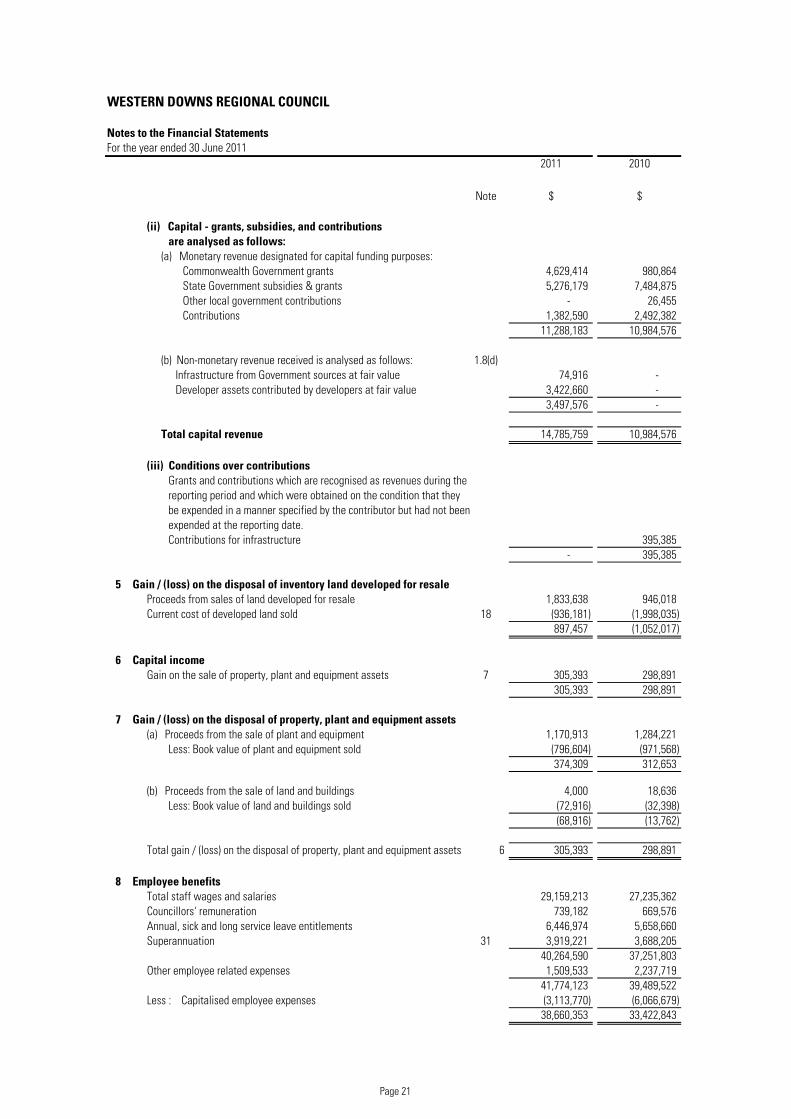
WESTERN DOWNS REGIONAL COUNCIL
Notes to the Financial StatementsFor the year ended 30 June 2011
2011 2010
Note $ $
(ii) Capital - grants, subsidies, and contributionsare analysed as follows:
(a) Monetary revenue designated for capital funding purposes:Commonwealth Government grants 4,629,414 980,864 State Government subsidies & grants 5,276,179 7,484,875 Other local government contributions - 26,455 Contributions 1,382,590 2,492,382
11,288,183 10,984,576
(b) Non-monetary revenue received is analysed as follows: 1.8(d)Infrastructure from Government sources at fair value 74,916 - Developer assets contributed by developers at fair value 3,422,660 -
3,497,576 -
Total capital revenue 14,785,759 10,984,576
(iii) Conditions over contributionsGrants and contributions which are recognised as revenues during thereporting period and which were obtained on the condition that theybe expended in a manner specified by the contributor but had not beenexpended at the reporting date.Contributions for infrastructure 395,385
- 395,385
5 Gain / (loss) on the disposal of inventory land developed for resaleProceeds from sales of land developed for resale 1 833 638 946 018Proceeds from sales of land developed for resale 1,833,638 946,018 Current cost of developed land sold 18 (936,181) (1,998,035)
897,457 (1,052,017)
6 Capital incomeGain on the sale of property, plant and equipment assets 7 305,393 298,891
305,393 298,891
7 Gain / (loss) on the disposal of property, plant and equipment assets(a) Proceeds from the sale of plant and equipment 1,170,913 1,284,221
Less: Book value of plant and equipment sold (796,604) (971,568) 374,309 312,653
(b) Proceeds from the sale of land and buildings 4,000 18,636 Less: Book value of land and buildings sold (72,916) (32,398)
(68,916) (13,762)
Total gain / (loss) on the disposal of property, plant and equipment assets 6 305,393 298,891
8 Employee benefits Total staff wages and salaries 29,159,213 27,235,362 Councillors' remuneration 739,182 669,576 Annual, sick and long service leave entitlements 6,446,974 5,658,660 Superannuation 31 3,919,221 3,688,205
40,264,590 37,251,803 Other employee related expenses 1,509,533 2,237,719
41,774,123 39,489,522 Less : Capitalised employee expenses (3,113,770) (6,066,679)
38,660,353 33,422,843
Page 21
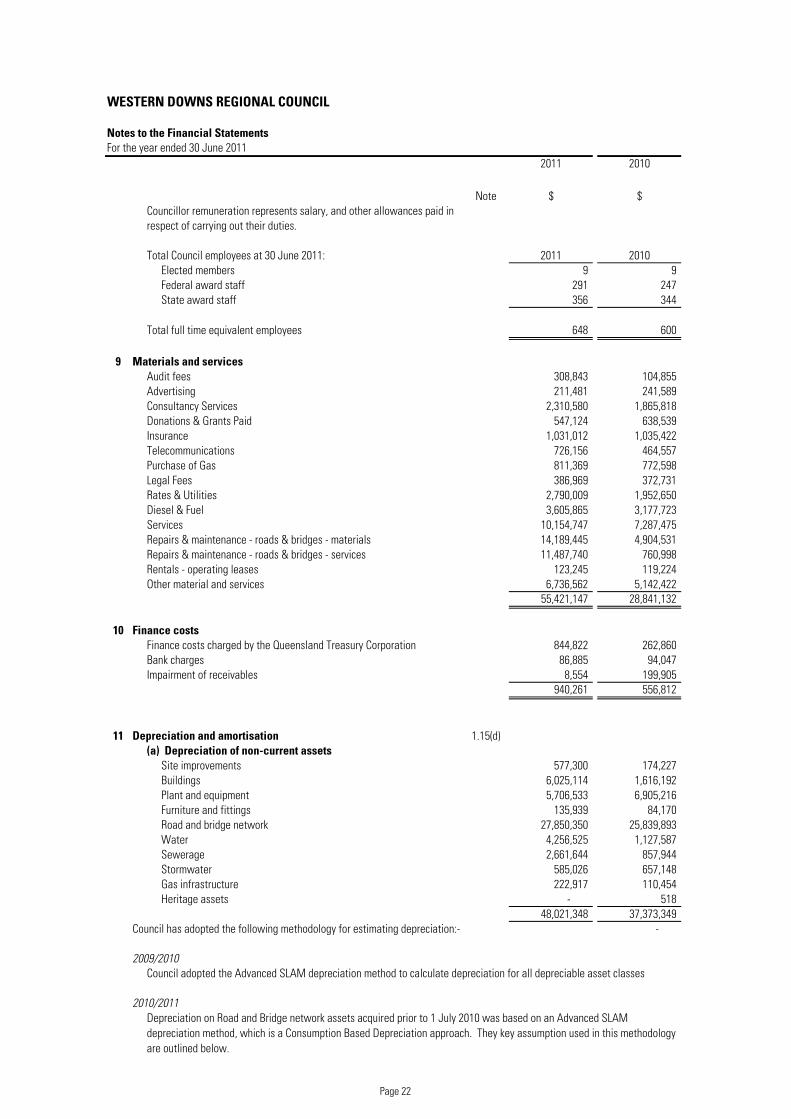
WESTERN DOWNS REGIONAL COUNCIL
Notes to the Financial StatementsFor the year ended 30 June 2011
2011 2010
Note $ $Councillor remuneration represents salary, and other allowances paid inrespect of carrying out their duties.
Total Council employees at 30 June 2011: 2011 2010Elected members 9 9 Federal award staff 291 247 State award staff 356 344
Total full time equivalent employees 648 600
9 Materials and servicesAudit fees 308,843 104,855 Advertising 211,481 241,589 Consultancy Services 2,310,580 1,865,818 Donations & Grants Paid 547,124 638,539 Insurance 1,031,012 1,035,422 Telecommunications 726,156 464,557 Purchase of Gas 811,369 772,598 Legal Fees 386,969 372,731 Rates & Utilities 2,790,009 1,952,650 Diesel & Fuel 3,605,865 3,177,723 Services 10,154,747 7,287,475 Repairs & maintenance - roads & bridges - materials 14,189,445 4,904,531 Repairs & maintenance - roads & bridges - services 11,487,740 760,998 Rentals - operating leases 123,245 119,224 Other material and services 6,736,562 5,142,422
55 421 147 28 841 13255,421,147 28,841,132
10 Finance costsFinance costs charged by the Queensland Treasury Corporation 844,822 262,860 Bank charges 86,885 94,047 Impairment of receivables 8,554 199,905
940,261 556,812
11 Depreciation and amortisation 1.15(d)(a) Depreciation of non-current assets
Site improvements 577,300 174,227 Buildings 6,025,114 1,616,192 Plant and equipment 5,706,533 6,905,216 Furniture and fittings 135,939 84,170 Road and bridge network 27,850,350 25,839,893 Water 4,256,525 1,127,587 Sewerage 2,661,644 857,944 Stormwater 585,026 657,148 Gas infrastructure 222,917 110,454 Heritage assets - 518
48,021,348 37,373,349 Council has adopted the following methodology for estimating depreciation:- -
2009/2010Council adopted the Advanced SLAM depreciation method to calculate depreciation for all depreciable asset classes
2010/2011Depreciation on Road and Bridge network assets acquired prior to 1 July 2010 was based on an Advanced SLAM depreciation method, which is a Consumption Based Depreciation approach. They key assumption used in this methodology are outlined below.
Page 22
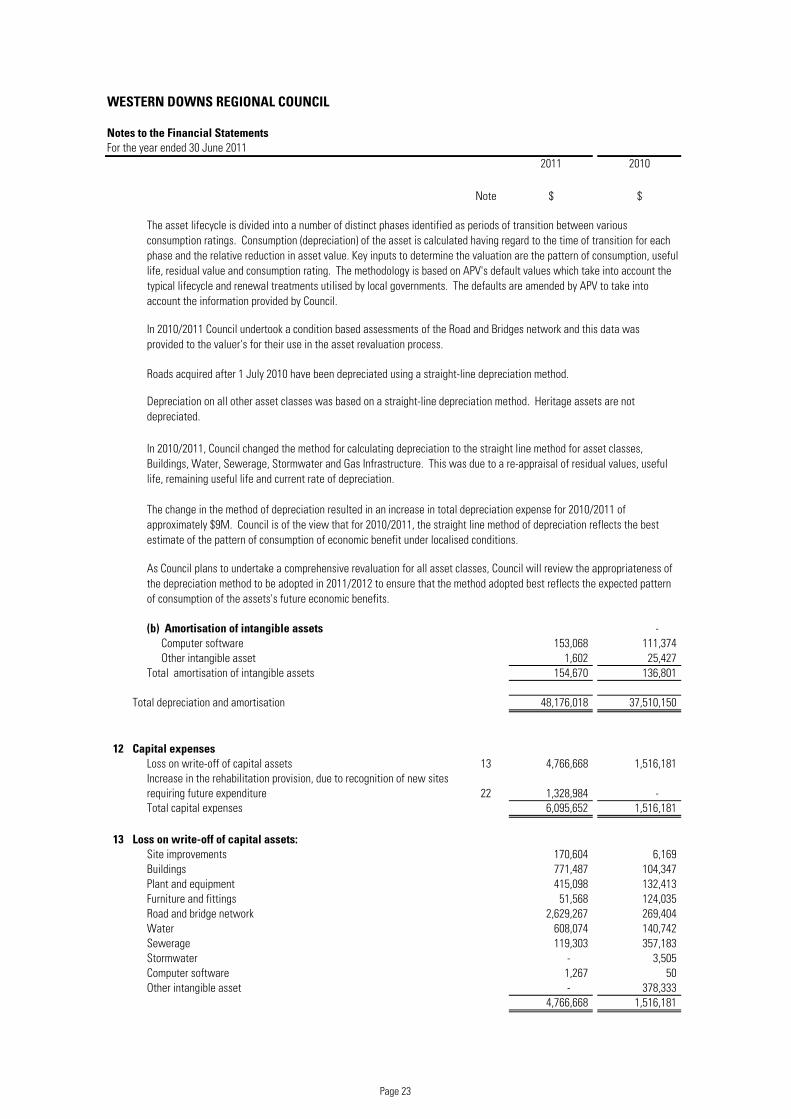
WESTERN DOWNS REGIONAL COUNCIL
Notes to the Financial StatementsFor the year ended 30 June 2011
2011 2010
Note $ $
Roads acquired after 1 July 2010 have been depreciated using a straight-line depreciation method.
The change in the method of depreciation resulted in an increase in total depreciation expense for 2010/2011 of approximately $9M. Council is of the view that for 2010/2011, the straight line method of depreciation reflects the best estimate of the pattern of consumption of economic benefit under localised conditions.
As Council plans to undertake a comprehensive revaluation for all asset classes, Council will review the appropriateness of the depreciation method to be adopted in 2011/2012 to ensure that the method adopted best reflects the expected pattern of consumption of the assets's future economic benefits
The asset lifecycle is divided into a number of distinct phases identified as periods of transition between various consumption ratings. Consumption (depreciation) of the asset is calculated having regard to the time of transition for each phase and the relative reduction in asset value. Key inputs to determine the valuation are the pattern of consumption, useful life, residual value and consumption rating. The methodology is based on APV's default values which take into account the typical lifecycle and renewal treatments utilised by local governments. The defaults are amended by APV to take into account the information provided by Council.
In 2010/2011 Council undertook a condition based assessments of the Road and Bridges network and this data was provided to the valuer's for their use in the asset revaluation process.
Depreciation on all other asset classes was based on a straight-line depreciation method. Heritage assets are not depreciated.
In 2010/2011, Council changed the method for calculating depreciation to the straight line method for asset classes, Buildings, Water, Sewerage, Stormwater and Gas Infrastructure. This was due to a re-appraisal of residual values, useful life, remaining useful life and current rate of depreciation.
(b) Amortisation of intangible assets - Computer software 153,068 111,374 Other intangible asset 1,602 25,427
Total amortisation of intangible assets 154,670 136,801
Total depreciation and amortisation 48,176,018 37,510,150
12 Capital expensesLoss on write-off of capital assets 13 4,766,668 1,516,181 Increase in the rehabilitation provision, due to recognition of new sitesrequiring future expenditure 22 1,328,984 - Total capital expenses 6,095,652 1,516,181
13 Loss on write-off of capital assets:Site improvements 170,604 6,169 Buildings 771,487 104,347 Plant and equipment 415,098 132,413 Furniture and fittings 51,568 124,035 Road and bridge network 2,629,267 269,404 Water 608,074 140,742 Sewerage 119,303 357,183 Stormwater - 3,505 Computer software 1,267 50 Other intangible asset - 378,333
4,766,668 1,516,181
of consumption of the assets s future economic benefits.
Page 23
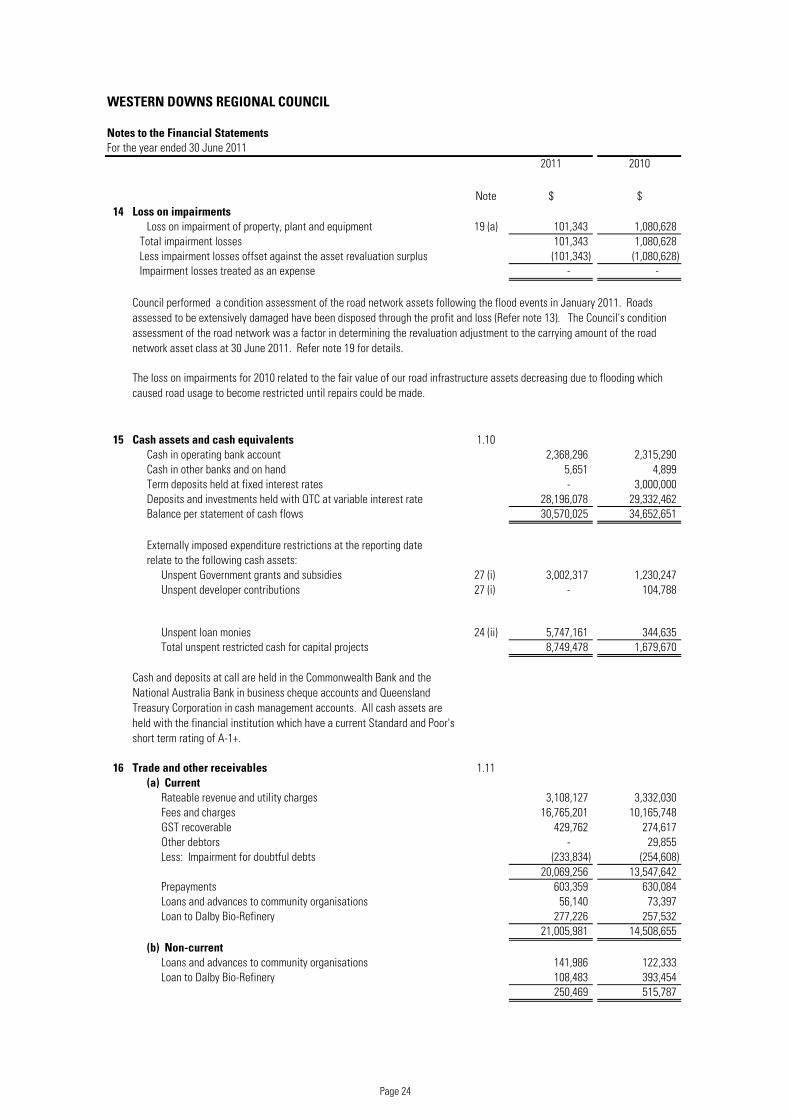
WESTERN DOWNS REGIONAL COUNCIL
Notes to the Financial StatementsFor the year ended 30 June 2011
2011 2010
Note $ $14 Loss on impairments
Loss on impairment of property, plant and equipment 19 (a) 101,343 1,080,628 Total impairment losses 101,343 1,080,628 Less impairment losses offset against the asset revaluation surplus (101,343) (1,080,628) Impairment losses treated as an expense - -
15 Cash assets and cash equivalents 1.10Cash in operating bank account 2,368,296 2,315,290 Cash in other banks and on hand 5,651 4,899 Term deposits held at fixed interest rates - 3,000,000 Deposits and investments held with QTC at variable interest rate 28,196,078 29,332,462 Balance per statement of cash flows 30,570,025 34,652,651
Externally imposed expenditure restrictions at the reporting daterelate to the following cash assets:
Unspent Government grants and subsidies 27 (i) 3,002,317 1,230,247 Unspent developer contributions 27 (i) - 104,788
Council performed a condition assessment of the road network assets following the flood events in January 2011. Roads assessed to be extensively damaged have been disposed through the profit and loss (Refer note 13). The Council's condition assessment of the road network was a factor in determining the revaluation adjustment to the carrying amount of the road network asset class at 30 June 2011. Refer note 19 for details.
The loss on impairments for 2010 related to the fair value of our road infrastructure assets decreasing due to flooding which caused road usage to become restricted until repairs could be made.
Unspent loan monies 24 (ii) 5,747,161 344,635 Total unspent restricted cash for capital projects 8,749,478 1,679,670
Cash and deposits at call are held in the Commonwealth Bank and the National Australia Bank in business cheque accounts and Queensland Treasury Corporation in cash management accounts. All cash assets are held with the financial institution which have a current Standard and Poor's short term rating of A-1+.
16 Trade and other receivables 1.11(a) Current
Rateable revenue and utility charges 3,108,127 3,332,030 Fees and charges 16,765,201 10,165,748 GST recoverable 429,762 274,617 Other debtors - 29,855 Less: Impairment for doubtful debts (233,834) (254,608)
20,069,256 13,547,642 Prepayments 603,359 630,084 Loans and advances to community organisations 56,140 73,397 Loan to Dalby Bio-Refinery 277,226 257,532
21,005,981 14,508,655 (b) Non-current
Loans and advances to community organisations 141,986 122,333 Loan to Dalby Bio-Refinery 108,483 393,454
250,469 515,787
Page 24
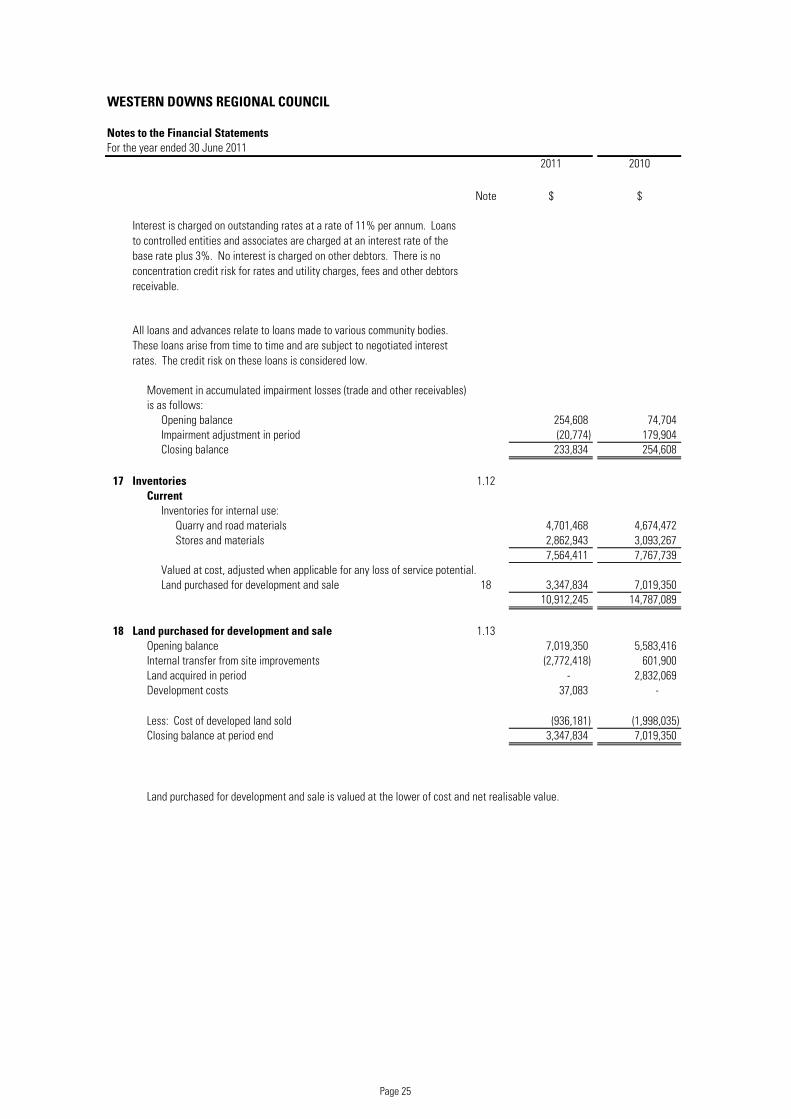
WESTERN DOWNS REGIONAL COUNCIL
Notes to the Financial StatementsFor the year ended 30 June 2011
2011 2010
Note $ $
Interest is charged on outstanding rates at a rate of 11% per annum. Loans to controlled entities and associates are charged at an interest rate of the base rate plus 3%. No interest is charged on other debtors. There is no concentration credit risk for rates and utility charges, fees and other debtors receivable.
All loans and advances relate to loans made to various community bodies. These loans arise from time to time and are subject to negotiated interest rates. The credit risk on these loans is considered low.
Movement in accumulated impairment losses (trade and other receivables) is as follows:
Opening balance 254,608 74,704 Impairment adjustment in period (20,774) 179,904 Closing balance 233,834 254,608
17 Inventories 1.12
CurrentInventories for internal use:
Quarry and road materials 4,701,468 4,674,472 Stores and materials 2,862,943 3,093,267
7,564,411 7,767,739 Valued at cost, adjusted when applicable for any loss of service potential.Land purchased for development and sale 18 3,347,834 7,019,350
10 912 245 14 787 08910,912,245 14,787,089
18 Land purchased for development and sale 1.13Opening balance 7,019,350 5,583,416 Internal transfer from site improvements (2,772,418) 601,900 Land acquired in period - 2,832,069 Development costs 37,083 -
Less: Cost of developed land sold (936,181) (1,998,035) Closing balance at period end 3,347,834 7,019,350
Land purchased for development and sale is valued at the lower of cost and net realisable value.
Page 25
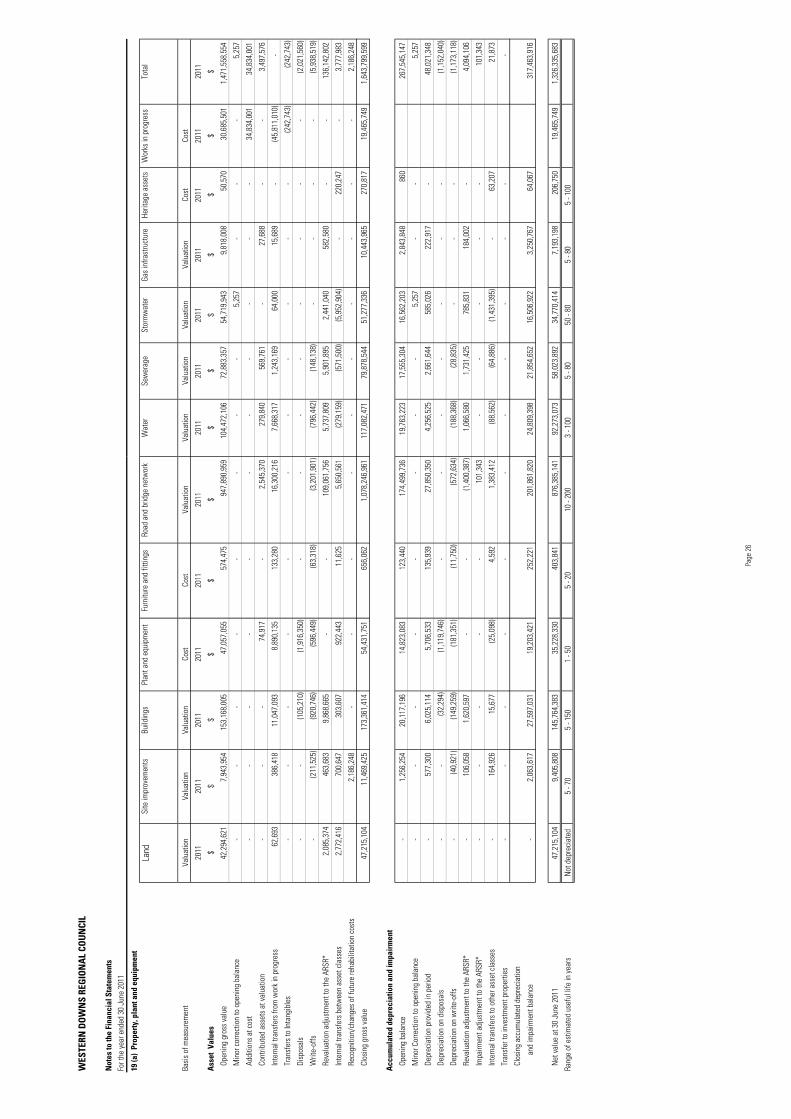
WES
TERN
DO
WN
S RE
GIO
NA
L CO
UN
CIL
Not
es to
the
Fina
ncia
l Sta
tem
ents
For t
he y
ear e
nded
30
June
201
1
19 (a
) Pr
oper
ty, p
lant
and
equ
ipm
ent
Basi
s of
mea
sure
men
tVa
luat
ion
Valu
atio
nVa
luat
ion
Cost
Cost
Valu
atio
nVa
luat
ion
Valu
atio
nVa
luat
ion
Valu
atio
nCo
stCo
st
2011
2011
2011
2011
2011
2011
2011
2011
2011
2011
2011
2011
2011
Ass
et V
alue
s$
$$
$$
$$
$$
$$
$$
Open
ing
gros
s va
lue
42,2
94,6
21
7,
943,
954
153,
168,
005
47,0
57,0
55
574,
475
94
7,89
0,95
9
104,
472,
106
72
,883
,357
54,7
19,9
43
9,
818,
008
50,5
70
30
,685
,501
1,
471,
558,
554
Min
or c
orre
ctio
n to
ope
ning
bal
ance
-
-
-
-
-
-
-
-
5,
257
-
-
-
5,
257
Addi
tions
at c
ost
-
-
-
-
-
-
-
-
-
-
-
34
,834
,001
34
,834
,001
Cont
ribut
ed a
sset
s at
val
uatio
n-
-
-
74
,917
-
2,
545,
370
279,
840
56
9,76
1
-
27,6
88
-
-
3,49
7,57
6
Inte
rnal
tran
sfer
s fro
m w
ork
in p
rogr
ess
62,6
93
38
6,41
8
11,0
47,0
93
8,
890,
135
13
3,28
0
16,3
00,2
16
7,66
8,31
7
1,
243,
169
64,0
00
15
,689
-
(45,
811,
010)
-
Tran
sfer
s to
Inta
ngib
les
-
-
-
-
-
-
-
-
-
-
-
(2
42,7
43)
(242
,743
)
Disp
osal
s -
-
(1
05,2
10)
(1
,916
,350
)
-
-
-
-
-
-
-
-
(2
,021
,560
)
Writ
e-of
fs
-
(2
11,5
25)
(920
,746
)
(596
,449
)
(6
3,31
8)
(3,2
01,9
01)
(796
,442
)
(148
,138
)
-
-
-
-
(5
,938
,519
)
Reva
luat
ion
adju
stm
ent t
o th
e AR
SR*
2,08
5,37
4
463,
683
9,
868,
665
-
-
109,
061,
756
5,
737,
809
5,90
1,89
5
2,
441,
040
582,
580
-
-
136,
142,
802
Inte
rnal
tran
sfer
s be
twee
n as
set c
lass
es2,
772,
416
70
0,64
7
303,
607
922,
443
11,6
25
5,65
0,56
1
(2
79,1
59)
(5
71,5
00)
(5
,952
,904
)
-
22
0,24
7
-
3,
777,
983
Reco
gniti
on/c
hang
es o
f fut
ure
reha
bilit
atio
n co
sts
2,18
6,24
8
-
-
-
-
-
-
-
-
-
-
2,
186,
248
Clos
ing
gros
s va
lue
47,2
15,1
04
11
,469
,425
17
3,36
1,41
4
54
,431
,751
65
6,06
2
1,07
8,24
6,96
1
11
7,08
2,47
1
79,8
78,5
44
51
,277
,336
10,4
43,9
65
270,
817
19
,465
,749
1,
643,
799,
599
Acc
umul
ated
dep
reci
atio
n an
d im
pair
men
t
Open
ing
bala
nce
-
1,
256,
254
20,1
17,1
96
14
,823
,083
12
3,44
0
174,
499,
736
19
,763
,223
17,5
55,3
04
16
,562
,203
2,84
3,84
8
86
0
267,
545,
147
Min
or C
orre
ctio
n to
ope
ning
bal
ance
-
-
-
-
-
-
-
-
5,25
7
-
-
5,
257
Depr
ecia
tion
prov
ided
in p
erio
d-
577,
300
6,
025,
114
5,
706,
533
13
5,93
9
27,8
50,3
50
4,25
6,52
5
2,
661,
644
585,
026
22
2,91
7
-
48,0
21,3
48
Depr
ecia
tion
on d
ispo
sals
-
-
(32,
294)
(1,1
19,7
46)
-
-
-
-
-
-
-
(1
,152
,040
)
Depr
ecia
tion
on w
rite-
offs
-
(4
0,92
1)
(149
,259
)
(181
,351
)
(1
1,75
0)
(572
,634
)
(188
,368
)
(28,
835)
-
-
-
(1,1
73,1
18)
Reva
luat
ion
adju
stm
ent t
o th
e AR
SR*
-
10
6,05
8
1,62
0,59
7
-
-
(1
,400
,387
)
1,
066,
580
1,73
1,42
5
78
5,83
1
184,
002
-
4,
094,
106
Impa
irmen
t adj
ustm
ent t
o th
e AR
SR*
-
-
-
-
-
10
1,34
3
-
-
-
-
-
101,
343
Inte
rnal
tran
sfer
s to
oth
er a
sset
cla
sses
-
16
4,92
6
15,6
77
(2
5,09
8)
4,59
2
1,
383,
412
(88,
562)
(64,
886)
(1,4
31,3
95)
-
63,2
07
21
,873
Tran
sfer
to in
vest
men
t pro
perti
es-
-
-
-
-
-
-
-
-
-
-
-
Clos
ing
accu
mul
ated
dep
reci
atio
n
and
impa
irmen
t bal
ance
-
2,
063,
617
27,5
97,0
31
19
,203
,421
25
2,22
1
201,
861,
820
24
,809
,398
21,8
54,6
52
16
,506
,922
3,25
0,76
7
64
,067
317,
463,
916
Net
val
ue a
t 30
June
201
147
,215
,104
9,40
5,80
8
14
5,76
4,38
3
35
,228
,330
40
3,84
1
876,
385,
141
92
,273
,073
58,0
23,8
92
34
,770
,414
7,19
3,19
8
20
6,75
0
19,4
65,7
49
1,32
6,33
5,68
3
Rang
e of
est
imat
ed u
sefu
l life
in y
ears
Not
dep
reci
ated
5 - 7
05
- 150
1 - 5
05
- 20
10 -
200
3 - 1
005
- 80
50 -
805
- 80
5 - 1
00
Road
and
brid
ge n
etw
ork
Land
Site
impr
ovem
ents
Build
ings
Plan
t and
equ
ipm
ent
Furn
iture
and
fitti
ngs
Wor
ks in
pro
gres
sTo
tal
Wat
erSe
wer
age
Stor
mw
ater
Gas
infra
stru
ctur
eHe
ritag
e as
sets
Page
26
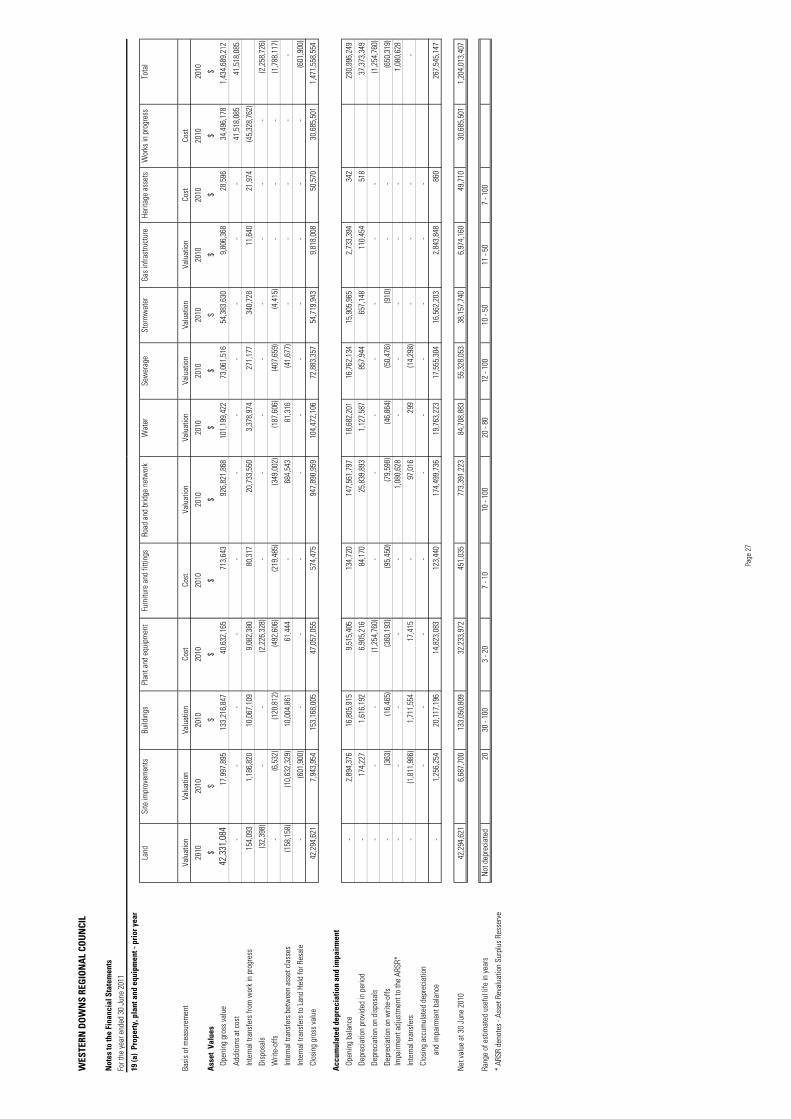
WES
TERN
DO
WN
S RE
GIO
NA
L CO
UN
CIL
Not
es to
the
Fina
ncia
l Sta
tem
ents
For t
he y
ear e
nded
30
June
201
1
19 (a
) Pr
oper
ty, p
lant
and
equ
ipm
ent -
pri
or y
ear
Basi
s of
mea
sure
men
tVa
luat
ion
Valu
atio
nVa
luat
ion
Cost
Cost
Valu
atio
nVa
luat
ion
Valu
atio
nVa
luat
ion
Valu
atio
nCo
stCo
st
2010
2010
2010
2010
2010
2010
2010
2010
2010
2010
2010
2010
2010
Ass
et V
alue
s$
$$
$$
$$
$$
$$
$$
Open
ing
gros
s va
lue
42,3
31,0
84
17,9
97,8
95
133,
216,
847
40,6
32,1
65
713,
643
92
6,82
1,86
8
101,
199,
422
73
,061
,516
54,3
83,6
30
9,
806,
368
28,5
96
34
,496
,178
1,
434,
689,
212
Addi
tions
at c
ost
-
-
-
-
-
-
-
-
-
-
-
41
,518
,085
41
,518
,085
Inte
rnal
tran
sfer
s fro
m w
ork
in p
rogr
ess
154,
093
1,18
6,82
0
10
,067
,109
9,08
2,38
0
80,3
17
20,7
33,5
50
3,37
8,97
4
27
1,17
7
340,
728
11
,640
21,9
74
(4
5,32
8,76
2)
Disp
osal
s (3
2,39
8)
-
-
(2,2
26,3
28)
-
-
-
-
-
-
-
-
(2,2
58,7
26)
Writ
e-of
fs
-
(6
,532
)
(1
20,8
12)
(4
92,6
06)
(219
,485
)
(3
49,0
02)
(1
87,6
06)
(4
07,6
59)
(4
,415
)
-
-
-
(1,7
88,1
17)
Inte
rnal
tran
sfer
s be
twee
n as
set c
lass
es(1
58,1
58)
(1
0,63
2,32
9)
10,0
04,8
61
61
,444
-
68
4,54
3
81,3
16
(4
1,67
7)
-
-
-
-
-
Inte
rnal
tran
sfer
s to
Lan
d He
ld fo
r Res
ale
-
(6
01,9
00)
-
-
-
-
-
-
-
-
-
-
(601
,900
)
Clos
ing
gros
s va
lue
42,2
94,6
21
7,
943,
954
153,
168,
005
47,0
57,0
55
574,
475
94
7,89
0,95
9
104,
472,
106
72
,883
,357
54,7
19,9
43
9,
818,
008
50,5
70
30
,685
,501
1,
471,
558,
554
Acc
umul
ated
dep
reci
atio
n an
d im
pair
men
t
Open
ing
bala
nce
-
2,
894,
376
16,8
05,9
15
9,
515,
405
13
4,72
0
147,
561,
797
18
,682
,201
16,7
62,1
34
15
,905
,965
2,73
3,39
4
34
2
230,
996,
249
Depr
ecia
tion
prov
ided
in p
erio
d-
174,
227
1,
616,
192
6,
905,
216
84
,170
25
,839
,893
1,
127,
587
857,
944
65
7,14
8
110,
454
51
8
37,3
73,3
49
Depr
ecia
tion
on d
ispo
sals
-
-
-
(1,2
54,7
60)
-
-
-
-
-
-
-
(1
,254
,760
)
Depr
ecia
tion
on w
rite-
offs
-
(3
63)
(1
6,46
5)
(3
60,1
93)
(95,
450)
(7
9,59
8)
(46,
864)
(50,
476)
(910
)
-
-
(650
,319
)
Impa
irmen
t adj
ustm
ent t
o th
e AR
SR*
-
-
-
-
-
1,08
0,62
8
-
-
-
-
-
1,
080,
628
Inte
rnal
tran
sfer
s-
(1,8
11,9
86)
1,
711,
554
17
,415
-
97
,016
299
(14,
298)
-
-
-
-
Clos
ing
accu
mul
ated
dep
reci
atio
n-
-
-
-
-
-
-
-
-
-
and
impa
irmen
t bal
ance
-
1,
256,
254
20,1
17,1
96
14
,823
,083
12
3,44
0
174,
499,
736
19
,763
,223
17,5
55,3
04
16
,562
,203
2,84
3,84
8
86
0
267,
545,
147
Net
val
ue a
t 30
June
201
042
,294
,621
6,68
7,70
0
13
3,05
0,80
9
32
,233
,972
45
1,03
5
773,
391,
223
84
,708
,883
55,3
28,0
53
38
,157
,740
6,97
4,16
0
49
,710
30,6
85,5
01
1,20
4,01
3,40
7
Rang
e of
est
imat
ed u
sefu
l life
in y
ears
Not
dep
reci
ated
20
30
- 10
03
- 20
7 - 1
010
- 10
020
- 80
12 -
100
10 -
5011
- 50
7 - 1
00
* AR
SR d
enot
es -
Asse
t Rev
alua
tion
Surp
lus
Ress
erve
Land
Site
impr
ovem
ents
Build
ings
Plan
t and
equ
ipm
ent
Furn
iture
and
fitti
ngs
Road
and
brid
ge n
etw
ork
Wat
erW
orks
in p
rogr
ess
Tota
lSe
wer
age
Stor
mw
ater
Gas
infra
stru
ctur
eHe
ritag
e as
sets
Page
27
WESTERN DOWNS REGIONAL COUNCIL
Notes to the Financial StatementsFor the year ended 30 June 2011
2011 2010
Note $ $19 (b) Property, plant and equipment valuations were determined by reference
to the following:
Assets held at valuation
Road and Bridge Network
Due to the large amount of damage to road infrastructure from the extensive flood events in January 2011-
- a desktop revaluation was carried out by Australian Pacific Valuations Pty Ltd as at 30 June, 2011.
The desktop revaluation adjusted the results of the comprehensive revaluation performed as at 30 June 2009, by -
- adjusting for changes in the assets condition due to flood and other events.- taking into account any major expenditure, disposals and additions.
(b) Allowance has been made for the movement in the asset gross replacement cost.(c) Remaining useful life not be altered if the condition assessment of the asset has not been altered.
Land, Site Improvements, Buildings, Water, Sewerage, Stormwater, Gas Infrastructure
A comprehensive revaluation was performed by Alfio Pomticello, B.Bus(r.p.val admin) registered valuer 1816 and by Lochlan Black, B.Bus(r.e & dev) registered valuer 2913 of Australian Pacific Valuers Pty Ltd as at 30 June, 2009.
The indices were applied to each assets' gross and accumulated deprecation amount to ensure that the assets' carrying amount following revaluation equalled its revalued amount.
Revaluation adjustments to the carrying amount of assets as 30 June 2011 performed as follows:-
Valuation of roads network, being the current fair value, was provided by John Deal, B.Eng, Plant & Machinery valuer and Janaka Weerasinghe, B.Eng, Plant & Machinery valuer of Australia Pacific Valuers Pty Ltd at 30 June, 2009.
- road assets have been written off as identified in reference to Bulletin 16/11 Accounting for infrastructure damaged by natural disasters published by the Department of Local Government and Planning. Refer Note 13.
The indices applied were derived from reference to costing guides issued by the Australian Institute of Quantity Surveyors, Rawlinson's (Australian Construction Handbook), Construction data from the Australian Bureau of Statistics & APV's own internal market research and these costings are applied to reflect the movement in market value since the comprehensive revaluation.
The following key assumptions were made in performing the valuations -
- applying indices to recognise changes in the market values for the period 1 July 2009 through to 30 June 2011.
A desktop revaluation is not a comprehensive revaluation and has the limitation that Australian Pacific Valuers Pty Ltd (APV) have based their valuation on Council's asset condition assessments, APV have not carried out any independent structural or operational survey of the infrastructure nor have they assessed the structural integrity or operational efficiency of the Road & Bridge network assets.
(a) The previous year's asset condition ratings have been retained with the assumption that Council has maintained the asset and all components are delivering the same level of service as assessed in the comprehensive revaluation.
The desktop valuation resulted in a significant revaluation increment to the Road and Bridge Network asset class. Council assesses that this increment is due primarily to the availability of more accurate information as to asset dimensions, such as road length and width
Council considers that the carrying values of the Road and Bridge asset class at 30 June 2010 and 30 June 2011 do not materially differ from their fair value.
Indicies provided by Australian Pacific Valuers Pty Ltd have been applied to these asset class as at 30 June 2011 to adjust for movements in the fair value of assets subsequent to the date of the comprehensive revaluation.
The indices were based on quantitative indices and significant assumptions as per the following:
Page 28
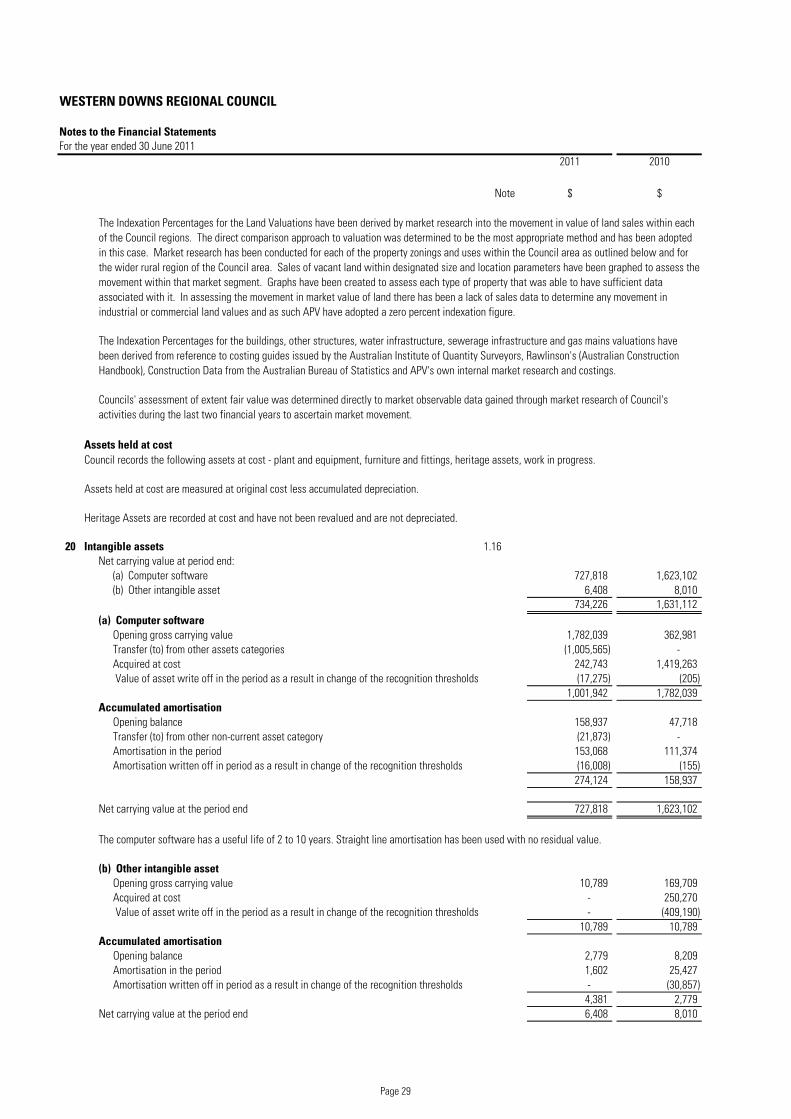
WESTERN DOWNS REGIONAL COUNCIL
Notes to the Financial StatementsFor the year ended 30 June 2011
2011 2010
Note $ $
Assets held at cost
20 Intangible assets 1.16Net carrying value at period end:
(a) Computer software 727,818 1,623,102 (b) Other intangible asset 6,408 8,010
734,226 1,631,112 (a) Computer software
Opening gross carrying value 1,782,039 362,981 Transfer (to) from other assets categories (1,005,565) - Acquired at cost 242,743 1,419,263 Value of asset write off in the period as a result in change of the recognition thresholds (17,275) (205)
1,001,942 1,782,039 Accumulated amortisation
Opening balance 158,937 47,718 Transfer (to) from other non-current asset category (21,873) - Amortisation in the period 153,068 111,374 Amortisation written off in period as a result in change of the recognition thresholds (16,008) (155)
274,124 158,937
Net carrying value at the period end 727,818 1,623,102
The computer software has a useful life of 2 to 10 years. Straight line amortisation has been used with no residual value.
Opening gross carrying value 10,789 169,709 Acquired at cost - 250,270 Value of asset write off in the period as a result in change of the recognition thresholds - (409,190)
10,789 10,789 Accumulated amortisation
Opening balance 2,779 8,209 Amortisation in the period 1,602 25,427 Amortisation written off in period as a result in change of the recognition thresholds - (30,857)
4,381 2,779 Net carrying value at the period end 6,408 8,010
(b) Other intangible asset
Council records the following assets at cost - plant and equipment, furniture and fittings, heritage assets, work in progress.
The Indexation Percentages for the Land Valuations have been derived by market research into the movement in value of land sales within each of the Council regions. The direct comparison approach to valuation was determined to be the most appropriate method and has been adopted in this case. Market research has been conducted for each of the property zonings and uses within the Council area as outlined below and for the wider rural region of the Council area. Sales of vacant land within designated size and location parameters have been graphed to assess the movement within that market segment. Graphs have been created to assess each type of property that was able to have sufficient data associated with it. In assessing the movement in market value of land there has been a lack of sales data to determine any movement in industrial or commercial land values and as such APV have adopted a zero percent indexation figure.
The Indexation Percentages for the buildings, other structures, water infrastructure, sewerage infrastructure and gas mains valuations have been derived from reference to costing guides issued by the Australian Institute of Quantity Surveyors, Rawlinson's (Australian Construction Handbook), Construction Data from the Australian Bureau of Statistics and APV's own internal market research and costings.
Heritage Assets are recorded at cost and have not been revalued and are not depreciated.
Councils' assessment of extent fair value was determined directly to market observable data gained through market research of Council's activities during the last two financial years to ascertain market movement.
Assets held at cost are measured at original cost less accumulated depreciation.
Page 29
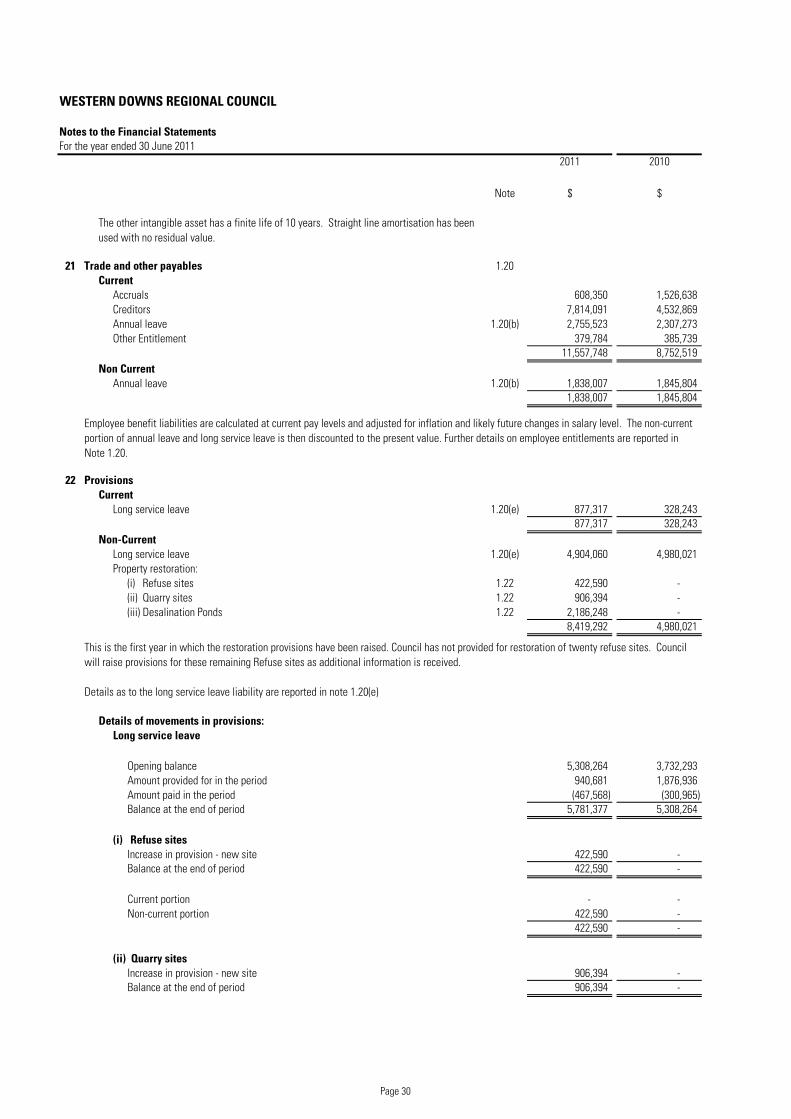
WESTERN DOWNS REGIONAL COUNCIL
Notes to the Financial StatementsFor the year ended 30 June 2011
2011 2010
Note $ $
The other intangible asset has a finite life of 10 years. Straight line amortisation has been used with no residual value.
21 Trade and other payables 1.20Current
Accruals 608,350 1,526,638 Creditors 7,814,091 4,532,869 Annual leave 1.20(b) 2,755,523 2,307,273 Other Entitlement 379,784 385,739
11,557,748 8,752,519 Non Current
Annual leave 1.20(b) 1,838,007 1,845,804 1,838,007 1,845,804
22 ProvisionsCurrent
Long service leave 1.20(e) 877,317 328,243 877,317 328,243
Non-CurrentLong service leave 1.20(e) 4,904,060 4,980,021 Property restoration:
(i) Refuse sites 1.22 422,590 - (ii) Quarry sites 1.22 906,394 - (iii) Desalination Ponds 1.22 2,186,248 -
8,419,292 4,980,021
Details of movements in provisions:Long service leave
Opening balance 5,308,264 3,732,293 Amount provided for in the period 940,681 1,876,936 Amount paid in the period (467,568) (300,965) Balance at the end of period 5,781,377 5,308,264
(i) Refuse sitesIncrease in provision - new site 422,590 - Balance at the end of period 422,590 -
Current portion - - Non-current portion 422,590 -
422,590 -
(ii) Quarry sitesIncrease in provision - new site 906,394 - Balance at the end of period 906,394 -
This is the first year in which the restoration provisions have been raised. Council has not provided for restoration of twenty refuse sites. Council will raise provisions for these remaining Refuse sites as additional information is received.
Details as to the long service leave liability are reported in note 1.20(e)
Employee benefit liabilities are calculated at current pay levels and adjusted for inflation and likely future changes in salary level. The non-current portion of annual leave and long service leave is then discounted to the present value. Further details on employee entitlements are reported in Note 1.20.
Page 30
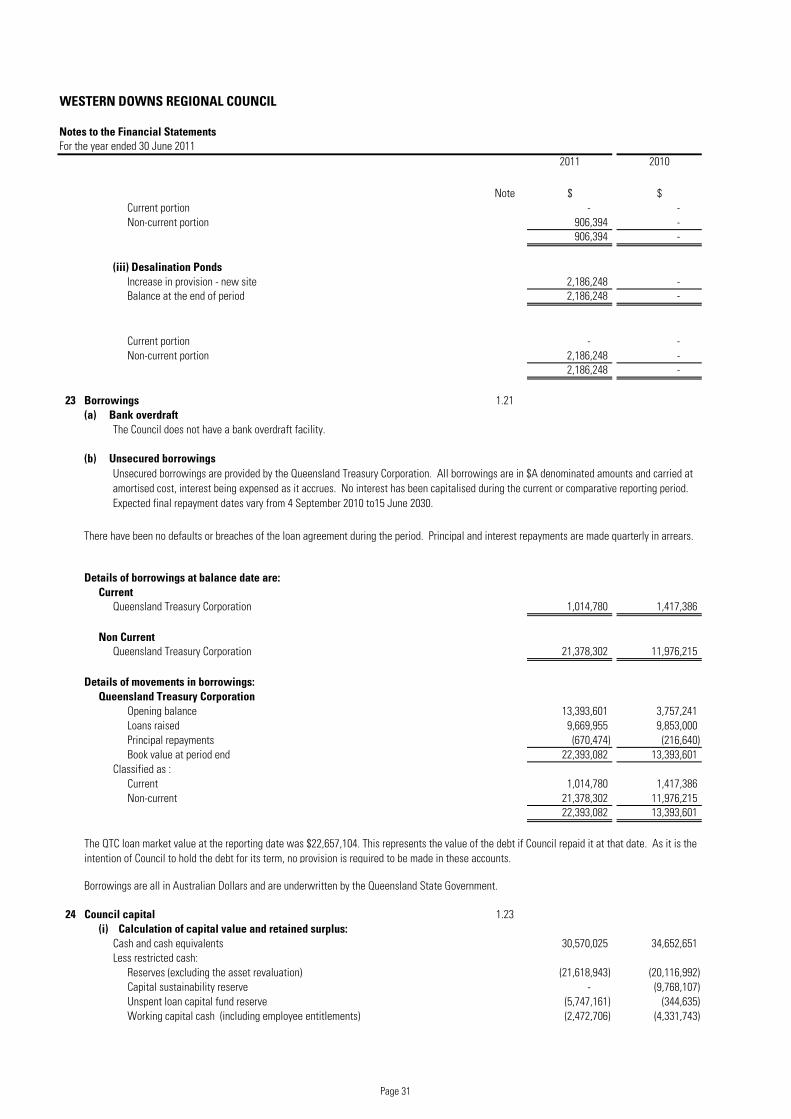
WESTERN DOWNS REGIONAL COUNCIL
Notes to the Financial StatementsFor the year ended 30 June 2011
2011 2010
Note $ $Current portion - - Non-current portion 906,394 -
906,394 -
(iii) Desalination PondsIncrease in provision - new site 2,186,248 - Balance at the end of period 2,186,248 -
Current portion - - Non-current portion 2,186,248 -
2,186,248 -
23 Borrowings 1.21(a) Bank overdraft
The Council does not have a bank overdraft facility.
(b) Unsecured borrowings
Details of borrowings at balance date are:Current
Queensland Treasury Corporation 1,014,780 1,417,386
Non CurrentQueensland Treasury Corporation 21,378,302 11,976,215
Details of movements in borrowings:Queensland Treasury Corporation
Opening balance 13,393,601 3,757,241 Loans raised 9,669,955 9,853,000 Principal repayments (670,474) (216,640) Book value at period end 22,393,082 13,393,601
Classified as :Current 1,014,780 1,417,386 Non-current 21,378,302 11,976,215
22,393,082 13,393,601
24 Council capital 1.23(i) Calculation of capital value and retained surplus:
Cash and cash equivalents 30,570,025 34,652,651 Less restricted cash:
Reserves (excluding the asset revaluation) (21,618,943) (20,116,992) Capital sustainability reserve - (9,768,107) Unspent loan capital fund reserve (5,747,161) (344,635) Working capital cash (including employee entitlements) (2,472,706) (4,331,743)
The QTC loan market value at the reporting date was $22,657,104. This represents the value of the debt if Council repaid it at that date. As it is the intention of Council to hold the debt for its term, no provision is required to be made in these accounts.
There have been no defaults or breaches of the loan agreement during the period. Principal and interest repayments are made quarterly in arrears.
Unsecured borrowings are provided by the Queensland Treasury Corporation. All borrowings are in $A denominated amounts and carried at amortised cost, interest being expensed as it accrues. No interest has been capitalised during the current or comparative reporting period. Expected final repayment dates vary from 4 September 2010 to15 June 2030.
Borrowings are all in Australian Dollars and are underwritten by the Queensland State Government.
Page 31
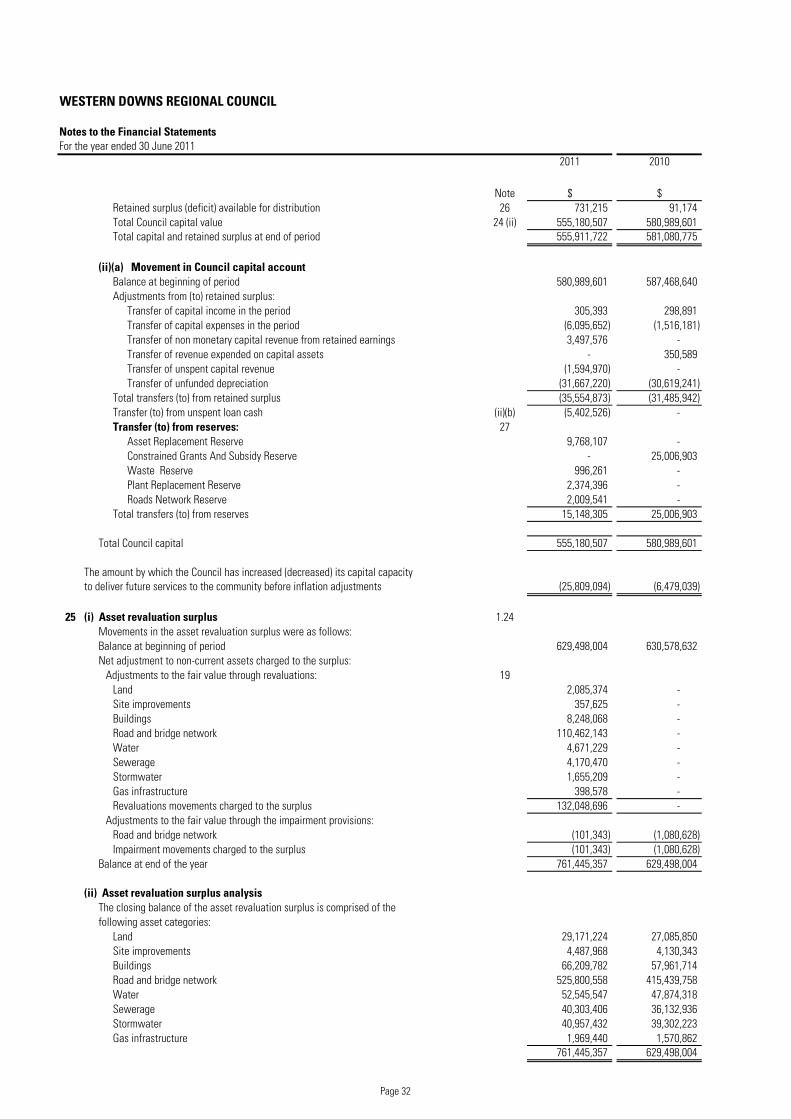
WESTERN DOWNS REGIONAL COUNCIL
Notes to the Financial StatementsFor the year ended 30 June 2011
2011 2010
Note $ $Retained surplus (deficit) available for distribution 26 731,215 91,174 Total Council capital value 24 (ii) 555,180,507 580,989,601 Total capital and retained surplus at end of period 555,911,722 581,080,775
(ii)(a) Movement in Council capital accountBalance at beginning of period 580,989,601 587,468,640 Adjustments from (to) retained surplus:
Transfer of capital income in the period 305,393 298,891 Transfer of capital expenses in the period (6,095,652) (1,516,181) Transfer of non monetary capital revenue from retained earnings 3,497,576 - Transfer of revenue expended on capital assets - 350,589 Transfer of unspent capital revenue (1,594,970) - Transfer of unfunded depreciation (31,667,220) (30,619,241)
Total transfers (to) from retained surplus (35,554,873) (31,485,942) Transfer (to) from unspent loan cash (ii)(b) (5,402,526) - Transfer (to) from reserves: 27
Asset Replacement Reserve 9,768,107 - Constrained Grants And Subsidy Reserve - 25,006,903 Waste Reserve 996,261 - Plant Replacement Reserve 2,374,396 - Roads Network Reserve 2,009,541 -
Total transfers (to) from reserves 15,148,305 25,006,903
Total Council capital 555,180,507 580,989,601
The amount by which the Council has increased (decreased) its capital capacity to deliver future services to the community before inflation adjustments (25,809,094) (6,479,039)
25 (i) Asset revaluation surplus 1.24Movements in the asset revaluation surplus were as follows:Balance at beginning of period 629,498,004 630,578,632 Net adjustment to non-current assets charged to the surplus:
Adjustments to the fair value through revaluations: 19Land 2,085,374 - Site improvements 357,625 - Buildings 8,248,068 - Road and bridge network 110,462,143 - Water 4,671,229 - Sewerage 4,170,470 - Stormwater 1,655,209 - Gas infrastructure 398,578 - Revaluations movements charged to the surplus 132,048,696 -
Adjustments to the fair value through the impairment provisions:Road and bridge network (101,343) (1,080,628) Impairment movements charged to the surplus (101,343) (1,080,628)
Balance at end of the year 761,445,357 629,498,004
(ii) Asset revaluation surplus analysisThe closing balance of the asset revaluation surplus is comprised of thefollowing asset categories:
Land 29,171,224 27,085,850 Site improvements 4,487,968 4,130,343 Buildings 66,209,782 57,961,714 Road and bridge network 525,800,558 415,439,758 Water 52,545,547 47,874,318 Sewerage 40,303,406 36,132,936 Stormwater 40,957,432 39,302,223 Gas infrastructure 1,969,440 1,570,862
761,445,357 629,498,004
Page 32
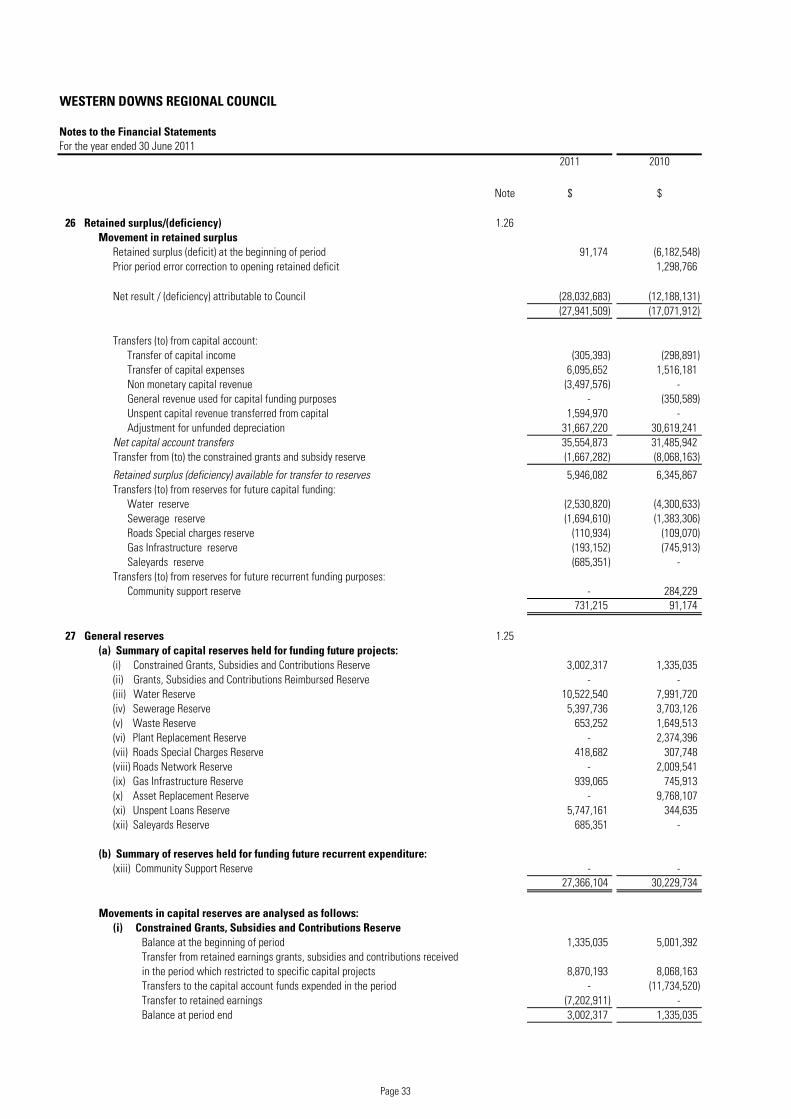
WESTERN DOWNS REGIONAL COUNCIL
Notes to the Financial StatementsFor the year ended 30 June 2011
2011 2010
Note $ $
26 Retained surplus/(deficiency) 1.26Movement in retained surplus
Retained surplus (deficit) at the beginning of period 91,174 (6,182,548) Prior period error correction to opening retained deficit 1,298,766
Net result / (deficiency) attributable to Council (28,032,683) (12,188,131) (27,941,509) (17,071,912)
Transfers (to) from capital account: Transfer of capital income (305,393) (298,891) Transfer of capital expenses 6,095,652 1,516,181 Non monetary capital revenue (3,497,576) - General revenue used for capital funding purposes - (350,589) Unspent capital revenue transferred from capital 1,594,970 - Adjustment for unfunded depreciation 31,667,220 30,619,241
Net capital account transfers 35,554,873 31,485,942 Transfer from (to) the constrained grants and subsidy reserve (1,667,282) (8,068,163)
Retained surplus (deficiency) available for transfer to reserves 5,946,082 6,345,867 Transfers (to) from reserves for future capital funding:
Water reserve (2,530,820) (4,300,633) Sewerage reserve (1,694,610) (1,383,306) Roads Special charges reserve (110,934) (109,070) Gas Infrastructure reserve (193,152) (745,913) Saleyards reserve (685,351) -
Transfers (to) from reserves for future recurrent funding purposes:Community support reserve - 284,229
731,215 91,174
27 General reserves 1.25(a) Summary of capital reserves held for funding future projects:
(i) Constrained Grants, Subsidies and Contributions Reserve 3,002,317 1,335,035 (ii) Grants, Subsidies and Contributions Reimbursed Reserve - - (iii) Water Reserve 10,522,540 7,991,720 (iv) Sewerage Reserve 5,397,736 3,703,126 (v) Waste Reserve 653,252 1,649,513 (vi) Plant Replacement Reserve - 2,374,396 (vii) Roads Special Charges Reserve 418,682 307,748 (viii) Roads Network Reserve - 2,009,541 (ix) Gas Infrastructure Reserve 939,065 745,913 (x) Asset Replacement Reserve - 9,768,107 (xi) Unspent Loans Reserve 5,747,161 344,635 (xii) Saleyards Reserve 685,351 -
(b) Summary of reserves held for funding future recurrent expenditure:(xiii) Community Support Reserve - -
27,366,104 30,229,734
Movements in capital reserves are analysed as follows:(i) Constrained Grants, Subsidies and Contributions Reserve
Balance at the beginning of period 1,335,035 5,001,392 Transfer from retained earnings grants, subsidies and contributions received in the period which restricted to specific capital projects 8,870,193 8,068,163 Transfers to the capital account funds expended in the period - (11,734,520) Transfer to retained earnings (7,202,911) - Balance at period end 3,002,317 1,335,035
Page 33
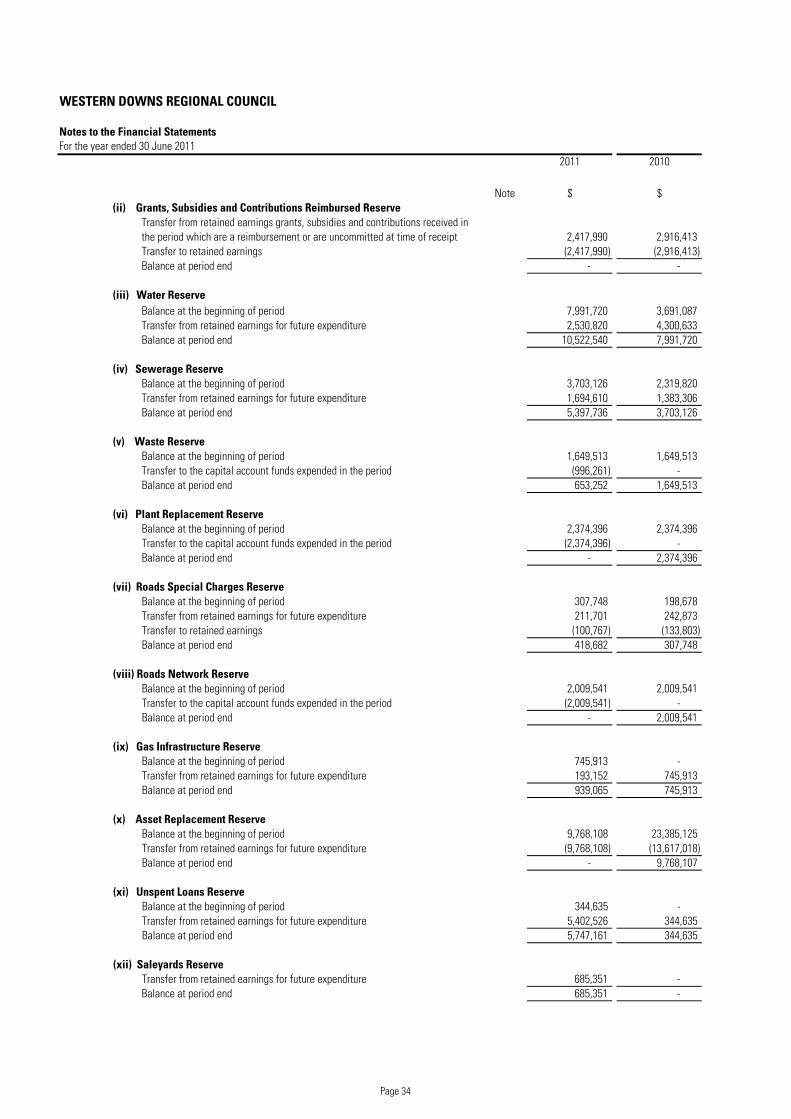
WESTERN DOWNS REGIONAL COUNCIL
Notes to the Financial StatementsFor the year ended 30 June 2011
2011 2010
Note $ $(ii) Grants, Subsidies and Contributions Reimbursed Reserve
Transfer from retained earnings grants, subsidies and contributions received in the period which are a reimbursement or are uncommitted at time of receipt 2,417,990 2,916,413 Transfer to retained earnings (2,417,990) (2,916,413) Balance at period end - -
(iii) Water ReserveBalance at the beginning of period 7,991,720 3,691,087 Transfer from retained earnings for future expenditure 2,530,820 4,300,633 Balance at period end 10,522,540 7,991,720
(iv) Sewerage ReserveBalance at the beginning of period 3,703,126 2,319,820 Transfer from retained earnings for future expenditure 1,694,610 1,383,306 Balance at period end 5,397,736 3,703,126
(v) Waste ReserveBalance at the beginning of period 1,649,513 1,649,513 Transfer to the capital account funds expended in the period (996,261) - Balance at period end 653,252 1,649,513
(vi) Plant Replacement ReserveBalance at the beginning of period 2,374,396 2,374,396 Transfer to the capital account funds expended in the period (2,374,396) - Balance at period end - 2,374,396
(vii) Roads Special Charges ReserveBalance at the beginning of period 307,748 198,678 Transfer from retained earnings for future expenditure 211,701 242,873 Transfer to retained earnings (100,767) (133,803) Balance at period end 418,682 307,748
(viii) Roads Network ReserveBalance at the beginning of period 2,009,541 2,009,541 Transfer to the capital account funds expended in the period (2,009,541) - Balance at period end - 2,009,541
(ix) Gas Infrastructure ReserveBalance at the beginning of period 745,913 - Transfer from retained earnings for future expenditure 193,152 745,913 Balance at period end 939,065 745,913
(x) Asset Replacement ReserveBalance at the beginning of period 9,768,108 23,385,125 Transfer from retained earnings for future expenditure (9,768,108) (13,617,018) Balance at period end - 9,768,107
(xi) Unspent Loans ReserveBalance at the beginning of period 344,635 - Transfer from retained earnings for future expenditure 5,402,526 344,635 Balance at period end 5,747,161 344,635
(xii) Saleyards ReserveTransfer from retained earnings for future expenditure 685,351 - Balance at period end 685,351 -
Page 34
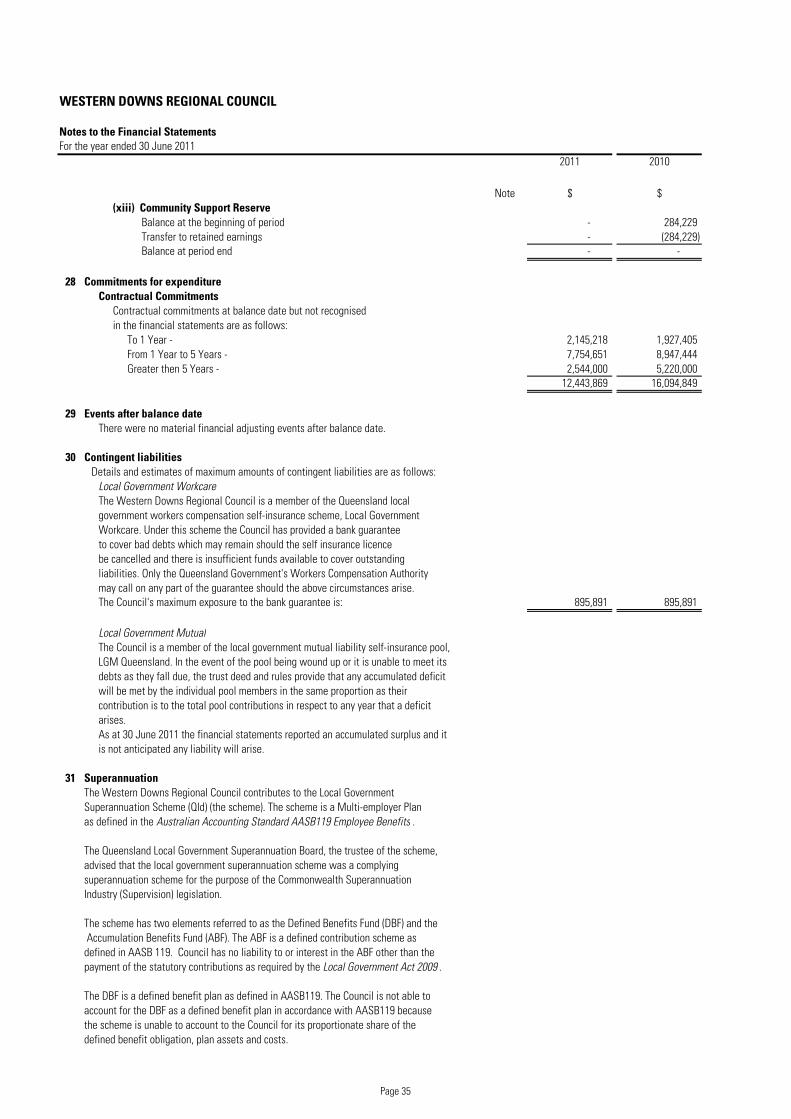
WESTERN DOWNS REGIONAL COUNCIL
Notes to the Financial StatementsFor the year ended 30 June 2011
2011 2010
Note $ $(xiii) Community Support Reserve
Balance at the beginning of period - 284,229 Transfer to retained earnings - (284,229) Balance at period end - -
28 Commitments for expenditureContractual Commitments
Contractual commitments at balance date but not recognised in the financial statements are as follows:
To 1 Year - 2,145,218 1,927,405 From 1 Year to 5 Years - 7,754,651 8,947,444 Greater then 5 Years - 2,544,000 5,220,000
12,443,869 16,094,849
29 Events after balance dateThere were no material financial adjusting events after balance date.
30 Contingent liabilitiesDetails and estimates of maximum amounts of contingent liabilities are as follows:
Local Government WorkcareThe Western Downs Regional Council is a member of the Queensland local government workers compensation self-insurance scheme, Local GovernmentWorkcare. Under this scheme the Council has provided a bank guarantee to cover bad debts which may remain should the self insurance licence be cancelled and there is insufficient funds available to cover outstanding liabilities. Only the Queensland Government's Workers Compensation Authority may call on any part of the guarantee should the above circumstances arise. The Council's maximum exposure to the bank guarantee is: 895,891 895,891
Local Government MutualThe Council is a member of the local government mutual liability self-insurance pool, LGM Queensland. In the event of the pool being wound up or it is unable to meet its debts as they fall due, the trust deed and rules provide that any accumulated deficit will be met by the individual pool members in the same proportion as their contribution is to the total pool contributions in respect to any year that a deficit arises. As at 30 June 2011 the financial statements reported an accumulated surplus and it is not anticipated any liability will arise.
31 SuperannuationThe Western Downs Regional Council contributes to the Local Government Superannuation Scheme (Qld) (the scheme). The scheme is a Multi-employer Plan as defined in the Australian Accounting Standard AASB119 Employee Benefits .
The Queensland Local Government Superannuation Board, the trustee of the scheme, advised that the local government superannuation scheme was a complying superannuation scheme for the purpose of the Commonwealth Superannuation Industry (Supervision) legislation.
The scheme has two elements referred to as the Defined Benefits Fund (DBF) and the Accumulation Benefits Fund (ABF). The ABF is a defined contribution scheme as defined in AASB 119. Council has no liability to or interest in the ABF other than the payment of the statutory contributions as required by the Local Government Act 2009 .
The DBF is a defined benefit plan as defined in AASB119. The Council is not able to account for the DBF as a defined benefit plan in accordance with AASB119 because the scheme is unable to account to the Council for its proportionate share of the defined benefit obligation, plan assets and costs.
Page 35
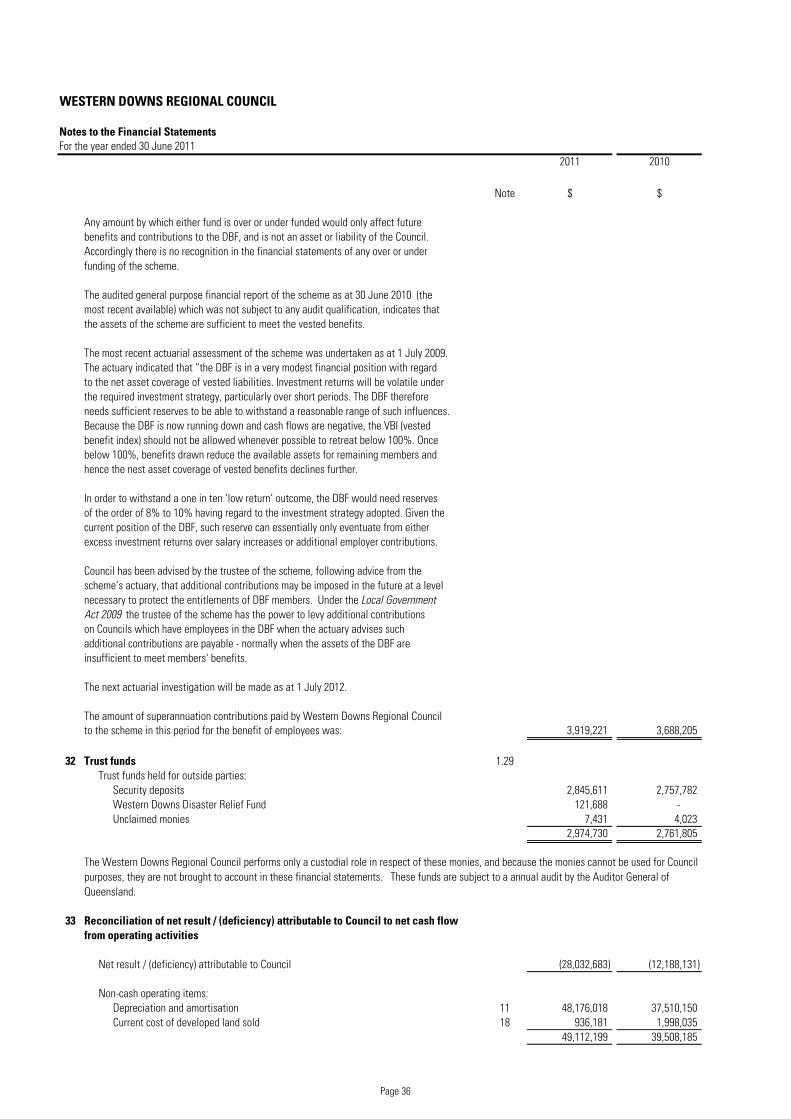
WESTERN DOWNS REGIONAL COUNCIL
Notes to the Financial StatementsFor the year ended 30 June 2011
2011 2010
Note $ $
Any amount by which either fund is over or under funded would only affect future benefits and contributions to the DBF, and is not an asset or liability of the Council. Accordingly there is no recognition in the financial statements of any over or under funding of the scheme.
The audited general purpose financial report of the scheme as at 30 June 2010 (themost recent available) which was not subject to any audit qualification, indicates that the assets of the scheme are sufficient to meet the vested benefits.
The most recent actuarial assessment of the scheme was undertaken as at 1 July 2009. The actuary indicated that “the DBF is in a very modest financial position with regard to the net asset coverage of vested liabilities. Investment returns will be volatile under the required investment strategy, particularly over short periods. The DBF therefore needs sufficient reserves to be able to withstand a reasonable range of such influences. Because the DBF is now running down and cash flows are negative, the VBI (vested benefit index) should not be allowed whenever possible to retreat below 100%. Once below 100%, benefits drawn reduce the available assets for remaining members and hence the nest asset coverage of vested benefits declines further.
In order to withstand a one in ten ‘low return’ outcome, the DBF would need reserves of the order of 8% to 10% having regard to the investment strategy adopted. Given the current position of the DBF, such reserve can essentially only eventuate from either excess investment returns over salary increases or additional employer contributions.
Council has been advised by the trustee of the scheme, following advice from the scheme’s actuary, that additional contributions may be imposed in the future at a level necessary to protect the entitlements of DBF members. Under the Local Government Act 2009 the trustee of the scheme has the power to levy additional contributions on Councils which have employees in the DBF when the actuary advises such additional contributions are payable - normally when the assets of the DBF are insufficient to meet members' benefits.
The next actuarial investigation will be made as at 1 July 2012.
The amount of superannuation contributions paid by Western Downs Regional Councilto the scheme in this period for the benefit of employees was: 3,919,221 3,688,205
32 Trust funds 1.29Trust funds held for outside parties:
Security deposits 2,845,611 2,757,782 Western Downs Disaster Relief Fund 121,688 - Unclaimed monies 7,431 4,023
2,974,730 2,761,805
33 Reconciliation of net result / (deficiency) attributable to Council to net cash flowfrom operating activities
Net result / (deficiency) attributable to Council (28,032,683) (12,188,131)
Non-cash operating items:Depreciation and amortisation 11 48,176,018 37,510,150 Current cost of developed land sold 18 936,181 1,998,035
49,112,199 39,508,185
The Western Downs Regional Council performs only a custodial role in respect of these monies, and because the monies cannot be used for Council purposes, they are not brought to account in these financial statements. These funds are subject to a annual audit by the Auditor General of Queensland.
Page 36
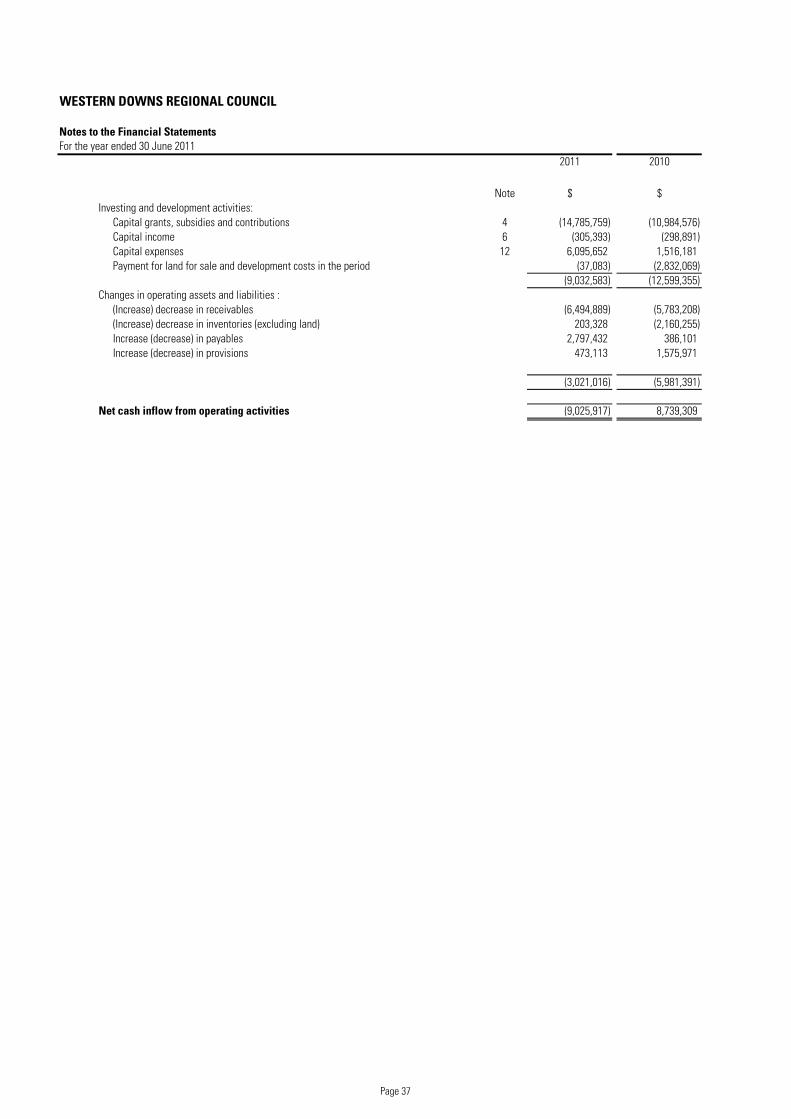
WESTERN DOWNS REGIONAL COUNCIL
Notes to the Financial StatementsFor the year ended 30 June 2011
2011 2010
Note $ $Investing and development activities:
Capital grants, subsidies and contributions 4 (14,785,759) (10,984,576) Capital income 6 (305,393) (298,891) Capital expenses 12 6,095,652 1,516,181 Payment for land for sale and development costs in the period (37,083) (2,832,069)
(9,032,583) (12,599,355) Changes in operating assets and liabilities :
(Increase) decrease in receivables (6,494,889) (5,783,208) (Increase) decrease in inventories (excluding land) 203,328 (2,160,255) Increase (decrease) in payables 2,797,432 386,101 Increase (decrease) in provisions 473,113 1,575,971
(3,021,016) (5,981,391)
Net cash inflow from operating activities (9,025,917) 8,739,309
Page 37
WESTERN DOWNS REGIONAL COUNCIL
Notes to the Financial StatementsFor the year ended 30 June 2011
34 Financial InstrumentsWestern Downs Regional Council's activities expose it to a variety of financial risks including interest rate risk, credit risk,
and liquidity risk.
Exposure to financial risks is managed in accordance with Council approved policies on financial risk management. These policies focus
on managing the volatility of financial markets and seek to minimise potential adverse effects on the financial performance of the Council.
The Council minimises its exposure to financial risk in the following ways:
- Investments in financial assets are only made where those assets are with a bank or other financial institution in Australia. The
Council does not invest in derivatives or other high risk investments.
- When the Council borrows, it borrows from the Queensland Treasury Corporation unless another financial institution can offer a
more beneficial rate, taking into account any risk. Borrowing by the Council is constrained by the provisions of the Statutory
Bodies Financial Arrangements Act 1982.
Western Downs Regional Council measures risk exposure using a variety of methods as follows:
Risk exposure Measurement method
Interest rate risk Sensitivity analysis
Liquidity risk Maturity analysis
Credit risk Ageing analysis
(i) Credit Risk
Credit risk exposure refers to the situation where the Council may incur financial loss as a result of another party to a financial
instrument failing to discharge their obligations.
The Council is exposed to credit risk through its investments with the Queensland Treasury Corporation (QTC) and deposits
held with banks or other financial institutions (if applicable). The QTC Cash Fund is an asset management portfolio that invests
with a wide variety of high credit rating counterparties. Deposits are capital guaranteed. Other investments are held with highly
rated/regulated banks/financial institutions and whilst not capital guaranteed, the likelihood of a credit failure is remote.
By the nature of the Councils operations, there is a geographical concentration of risk in the Council's area. Because the area is
largely agricultural, mining and tourism, there is also a concentration in the agricultural, mining and tourism sector.
The maximum exposure to credit risk at balance date in relation to each class of recognized financial asset is the gross carrying amount of those assets inclusive of any impairment.
No collateral is held as security relating to the financial assets held by the Council.
In the case of rate receivables, the Council has the power to sell the property to recover any defaulted amounts. In effect this power protects the Council againstcredit risk in the case of these debts. In other cases, the Council assesses the credit risk before providing goods or services and applies normal business credit protection procedures to minimise the risk.
Page 38
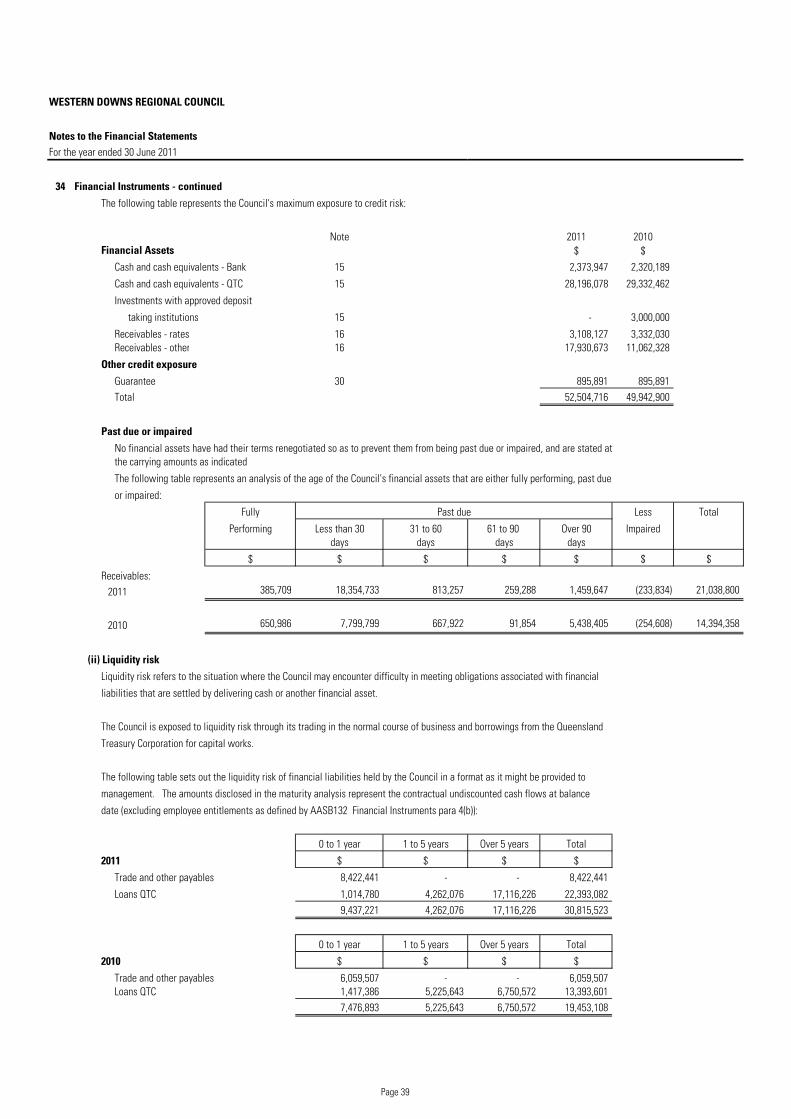
WESTERN DOWNS REGIONAL COUNCIL
Notes to the Financial StatementsFor the year ended 30 June 2011
34 Financial Instruments - continued
The following table represents the Council's maximum exposure to credit risk:
Note 2011 2010Financial Assets $ $
Cash and cash equivalents - Bank 15 2,373,947 2,320,189
Cash and cash equivalents - QTC 15 28,196,078 29,332,462
Investments with approved deposit
taking institutions 15 - 3,000,000
Receivables - rates 16 3,108,127 3,332,030 Receivables - other 16 17,930,673 11,062,328
Other credit exposure
Guarantee 30 895,891 895,891 Total 52,504,716 49,942,900
Past due or impaired
No financial assets have had their terms renegotiated so as to prevent them from being past due or impaired, and are stated at the carrying amounts as indicated.
The following table represents an analysis of the age of the Council's financial assets that are either fully performing, past due
or impaired:
Fully Past due Less Total
Performing Less than 30 31 to 60 61 to 90 Over 90 Impaireddays days days days
$ $ $ $ $ $ $
Receivables:2011 385,709 18,354,733 813,257 259,288 1,459,647 (233,834) 21,038,800
2010 650,986 7,799,799 667,922 91,854 5,438,405 (254,608) 14,394,358
(ii) Liquidity risk
Liquidity risk refers to the situation where the Council may encounter difficulty in meeting obligations associated with financial
liabilities that are settled by delivering cash or another financial asset.
The Council is exposed to liquidity risk through its trading in the normal course of business and borrowings from the Queensland
Treasury Corporation for capital works.
The following table sets out the liquidity risk of financial liabilities held by the Council in a format as it might be provided to
management. The amounts disclosed in the maturity analysis represent the contractual undiscounted cash flows at balance
date (excluding employee entitlements as defined by AASB132 Financial Instruments para 4(b)):
0 to 1 year 1 to 5 years Over 5 years Total
2011 $ $ $ $
Trade and other payables 8,422,441 - - 8,422,441
Loans QTC 1,014,780 4,262,076 17,116,226 22,393,082 9,437,221 4,262,076 17,116,226 30,815,523
0 to 1 year 1 to 5 years Over 5 years Total
2010 $ $ $ $
Trade and other payables 6,059,507 - - 6,059,507 Loans QTC 1,417,386 5,225,643 6,750,572 13,393,601
7,476,893 5,225,643 6,750,572 19,453,108
Page 39
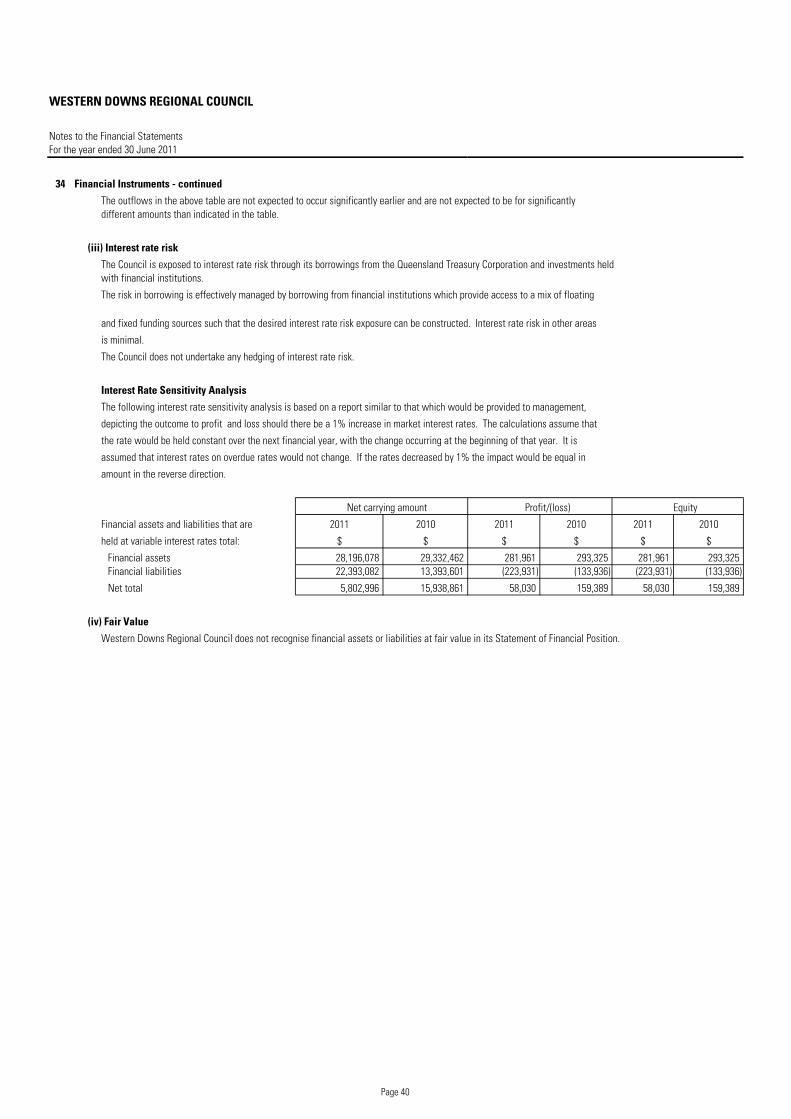
WESTERN DOWNS REGIONAL COUNCIL
Notes to the Financial StatementsFor the year ended 30 June 2011
34 Financial Instruments - continued
The outflows in the above table are not expected to occur significantly earlier and are not expected to be for significantly different amounts than indicated in the table.
(iii) Interest rate risk
The Council is exposed to interest rate risk through its borrowings from the Queensland Treasury Corporation and investments held with financial institutions.
The risk in borrowing is effectively managed by borrowing from financial institutions which provide access to a mix of floating
and fixed funding sources such that the desired interest rate risk exposure can be constructed. Interest rate risk in other areas
is minimal.
The Council does not undertake any hedging of interest rate risk.
Interest Rate Sensitivity Analysis
The following interest rate sensitivity analysis is based on a report similar to that which would be provided to management,
depicting the outcome to profit and loss should there be a 1% increase in market interest rates. The calculations assume that
the rate would be held constant over the next financial year, with the change occurring at the beginning of that year. It is
assumed that interest rates on overdue rates would not change. If the rates decreased by 1% the impact would be equal in
amount in the reverse direction.
Net carrying amount Profit/(loss) Equity
Financial assets and liabilities that are 2011 2010 2011 2010 2011 2010
held at variable interest rates total: $ $ $ $ $ $
Financial assets 28,196,078 29,332,462 281,961 293,325 281,961 293,325 Financial liabilities 22,393,082 13,393,601 (223,931) (133,936) (223,931) (133,936)
Net total 5,802,996 15,938,861 58,030 159,389 58,030 159,389
(iv) Fair Value
Western Downs Regional Council does not recognise financial assets or liabilities at fair value in its Statement of Financial Position.
Page 40
WESTERN DOWNS REGIONAL COUNCIL
Notes to the Financial Statements
For the year ended 30 June 2011
35 National Competition Policy
(a) Activities to which the code of competitive conduct is applied
A "business activity" of a local government is divided into two categories :
(a) Roads business activity:
(i) the construction or maintenance of State controlled roads for which the local government submits an offer to
carry out work in response to a tender invitation, other than through a sole supplier arrangement.
(ii) submission of a competitive tender for construction or road maintenance on the local government's roads which
the local government has put out to tender, or called for by another local government.
(b) Other business activity, referred to as type three activities, means the following:
(i) trading in goods and services to clients in competition with the private sector, or
(ii) the submission of a competitive tender in the local government's own tendering process in competition with others
for the provision of goods and services to its self. Excluded activities are (a) library services, and (b) an activity or
part thereof prescribed by legislation.
Local government may elect to apply a Code of Competitive Conduct (CCC) to their identified business activities. This requires
the application of full cost pricing, identifying the cost of community service obligations (CSO) and eliminating the advantages and
disadvantages of public ownership within that activity. The application of the CCC to the roads business activity is compulsory.
The CSO value is determined by Council, and represents an activities cost(s) which would not be incurred if the activities primary
objective was to make a profit. The Council provides funding from general revenue to the business activity to cover the cost of
providing non-commercial community services or costs deemed to be CSO's by the Council. Notwithstanding CSO's, the Council
is committed to operating these activities as business activities in accordance with the CCC.
Commercial Works
Waste Management
Water
Sewerage
Natural Gas
Dalby Regional Saleyards
Jimbour Quarry
The following table summarises the financial results for these, including competitive neutrality adjustments if applicable.
Full information is available for inspection at the Council offices.
Page 41
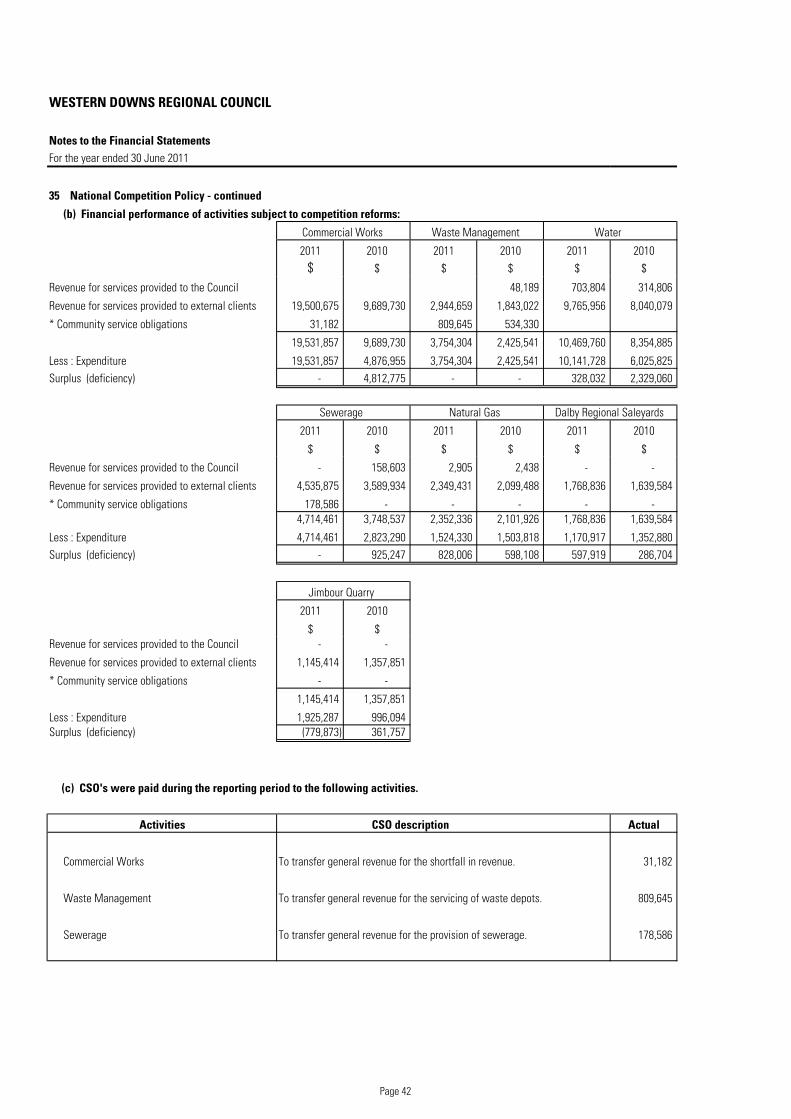
WESTERN DOWNS REGIONAL COUNCIL
Notes to the Financial StatementsFor the year ended 30 June 2011
35 National Competition Policy - continued
(b) Financial performance of activities subject to competition reforms:
Commercial Works Waste Management Water
2011 2010 2011 2010 2011 2010$ $ $ $ $ $
Revenue for services provided to the Council 48,189 703,804 314,806
Revenue for services provided to external clients 19,500,675 9,689,730 2,944,659 1,843,022 9,765,956 8,040,079
* Community service obligations 31,182 809,645 534,330
19,531,857 9,689,730 3,754,304 2,425,541 10,469,760 8,354,885
Less : Expenditure 19,531,857 4,876,955 3,754,304 2,425,541 10,141,728 6,025,825 Surplus (deficiency) - 4,812,775 - - 328,032 2,329,060
Sewerage Natural Gas Dalby Regional Saleyards
2011 2010 2011 2010 2011 2010
$ $ $ $ $ $
Revenue for services provided to the Council - 158,603 2,905 2,438 - -
Revenue for services provided to external clients 4,535,875 3,589,934 2,349,431 2,099,488 1,768,836 1,639,584
* Community service obligations 178,586 - - - - - 4,714,461 3,748,537 2,352,336 2,101,926 1,768,836 1,639,584
Less : Expenditure 4,714,461 2,823,290 1,524,330 1,503,818 1,170,917 1,352,880 Surplus (deficiency) - 925,247 828,006 598,108 597,919 286,704
Jimbour Quarry
2011 2010
$ $Revenue for services provided to the Council - -
Revenue for services provided to external clients 1,145,414 1,357,851
* Community service obligations - -
1,145,414 1,357,851
Less : Expenditure 1,925,287 996,094 Surplus (deficiency) (779,873) 361,757
(c) CSO's were paid during the reporting period to the following activities.
Activities CSO description Actual
Commercial Works To transfer general revenue for the shortfall in revenue. 31,182
Waste Management To transfer general revenue for the servicing of waste depots. 809,645
Sewerage To transfer general revenue for the provision of sewerage. 178,586
Page 42