WC/95/030 Project summary report: rapid methods of ......Fiji, Papua New Guinea, aerial photography,...
16
Transcript of WC/95/030 Project summary report: rapid methods of ......Fiji, Papua New Guinea, aerial photography,...


e e e e e e e e e 0 0 e 0 e 0
e e 0 e 0 0
e e a e e e 0
e e 0 0
0
British Geological Survey
TECHNICAL REPORT WC/95/30 Overseas Geology Series
PROJECT SUMMARY REPORT: RAPID METHODS OF LANDSLIDE HAZARD MAPPING
D GEENBAUM
A report prepared for the Overseas Development Administration under the ODNBGS Technology Development and Research Programme, Project 9217
ODA classificnrion : Subsector: Geoscience Theme: G3 - Improve geotechnical hazard avoidance strategies in national planning Project title: Rapid assessment of landslip hazards Reference number: R5554
Bibliographic reference : Greenbnum D 1995. Project summary report : rapid methods of landslide hazard mapping BGS Technical Report WC/95/30
Kpywonls : Fiji, Papua New Guinea, aerial photography, GIS, landslide hazard, remote sensing, training
Fmnr cover iuurtratia : Landslide hazard zonation map for part of the KaiapitBaidor study area, Papua New Guinea showing levels of hazard probabilities from high (red) to low (black)
0 NERC 1995
Keyworth, Nottingham, British Geological Survey, 1995
BRITISH GEOLOGICAL SURVEY

0 0
0 e a 0 a e a a a e a a e e 0 a a a a a a e e 0 a a a a a a a 0
CONTENTS
Summary
1 . Background
1 . 1 Landslides and hazard zonation maps
1.2 Aims and objectives of the study
2. Methodology
2.1 Remote sensing inputs and GIS analysis: underlying rationale
2.2 Landslide modelling using a raster GIS 3. Test cases
3.1 Study areas
3.2 Results
4. Dissemination and training
5. Conclusions and recommendations
Acknowledgements
Appendix 1 : Report outputs and dissemination
1
1
1
2
2
3 4
4
6
8
10
11
11

a 0
0 a 0 0 a a a e a 0
a e 0
a a a 0
a e e e e a a 0 a e a 0 e 0
Summary
A map showing the distribution of landslide hazards can help planners (1) prepare for, and/or mitigate against, the effects of landsliding on communities and infrastructure, and (2) avoid or minimise the risks associated with new developments. The provision of such basic hazard information is an underpinning theme of the UN’s International Decade for Natural Disaster Reduction (IDNDR). This report is an executive summary of BGS project 92/7 (R5554) ‘Rapid assessment of landslip hazards’ carried out under the ODA/BGS Technology Development and Research Programme as part of the British Government’s provision of aid to developing countries. The aims of the project were to develop rapid methods applicable to developing countries for producing such maps quickly and cheaply.
The approach combines the use of remote sensing and a geographic information system (GIS). The underlying principle is that relationships between past landsliding events, interpreted from remote sensing, the geology, relief, soils etc provide the basis for modelling where future landslides are most likely to occur. This is achieved using a GIS by ‘weighting’ each class of each variable (e.g. each lithology ‘class’ of the variable ‘geology’) according to the proportion of landslides occurring within it compared to the regional average. Combinations of variables, produced by summing the weights in individual classes, provide ‘models’ of landslide probability. The approach is empirical but has the advantage of potentially being able to provide regional scale hazard maps over large areas quickly and cheaply.
This summary report provides an overview of the basic principles, the work carried out, the results achieved, and training provided to overseas collaborators. Detailed technical accounts of the work undertaken in Fiji and Papua New Guinea are contained in separate reports. It is concluded that the methods are capable of providing provisional hazard maps at the regional scale, cost-effectively and in a realizable time frame; it is recommended that further consideration is given to implementing such techniques.

1. Background
1.1 Landslides & hazard zonation maps
Landslides are one of the commonest natural hazards which, together with earthquakes, volcanic eruptions and floods, have a major impact on life and property. Although most landslides are small and individually account for few fatalities, the cumulative losses worldwide account for around 25 per cent of annual deaths from natural hazards.
Landslide is a general term used to describe the mass movement of soil and rock downslope under gravitational influence. Landslides result from natural slope instabilities. They possibly represent the single most important mechanism of erosion, especially in tropical environments. The term hazard refers to the probability of occurrence of an event in an area within a specified period of time, although it is commonly used in a relative, rather than an absolute sense. The distribution of landslide hazards is usually presented on a map as simple zones (e.g. high, intermediate, low) indicating the relative likelihood of landsliding.
A knowledge of the causes and incidence of landsliding can help planners (1) make contingency plans to prepare for, and mitigate against, the effects of landslide events on infrastructure, housing and people, and (2) avoid or minimise the risks associated with new developments. Although many parts of the world experience landsliding, for few areas are hazard maps available. The reason is that conventional geotechnical investigations, involving materials testing and extensive fieldwork, are slow, specialised and costly. Whereas they are appropriate for detailed studies in urban areas, they cannot in general be justified, nor are they economically feasible, at the regional scale in many developing countries which do not have the resources to carry out such work. Given the magnitude of the task worldwide, it is important that alternative methods are developed that can provide provisional hazard information cheaply and quickly.
A rapid approach to hazard zonation (and risk assessment) is discussed here. It involves the analysis of various spatially co-registered data sets in relation to past landslides, and the generation of thematic maps easily understandable by users (many of whom will be non- geologists). A geographical information system (GIS) may be defined as a computer-based system (both hardware and software) for the capture, storage, integration, analysis and display of such spatially distributed data. Its use can facilitate all stages of data analysis and hazard map production.
1.2 Aims & objectives of the study
This report summarises the results of Project 92/7 (R 5554) ‘Rapid assessment of landslip hazards’ carried out under the ODA/BGS Technology Development and Research Programme as part of the British Government’s provision of aid to developing countries.
The immediate aims of the project were: (1) to establish, by means of pilot studies in a few test areas, methods by which remote sensing, combined with GIS analysis, could be used to produce a preliminary hazard zonation map; and (2) to provide advice and training on these techniques to geologists in the countries where the pilot studies were conducted.
1
a e e a e a a e e
a a
e
e 0 a a a a e a e
a
e a m a
e 0 e a 0
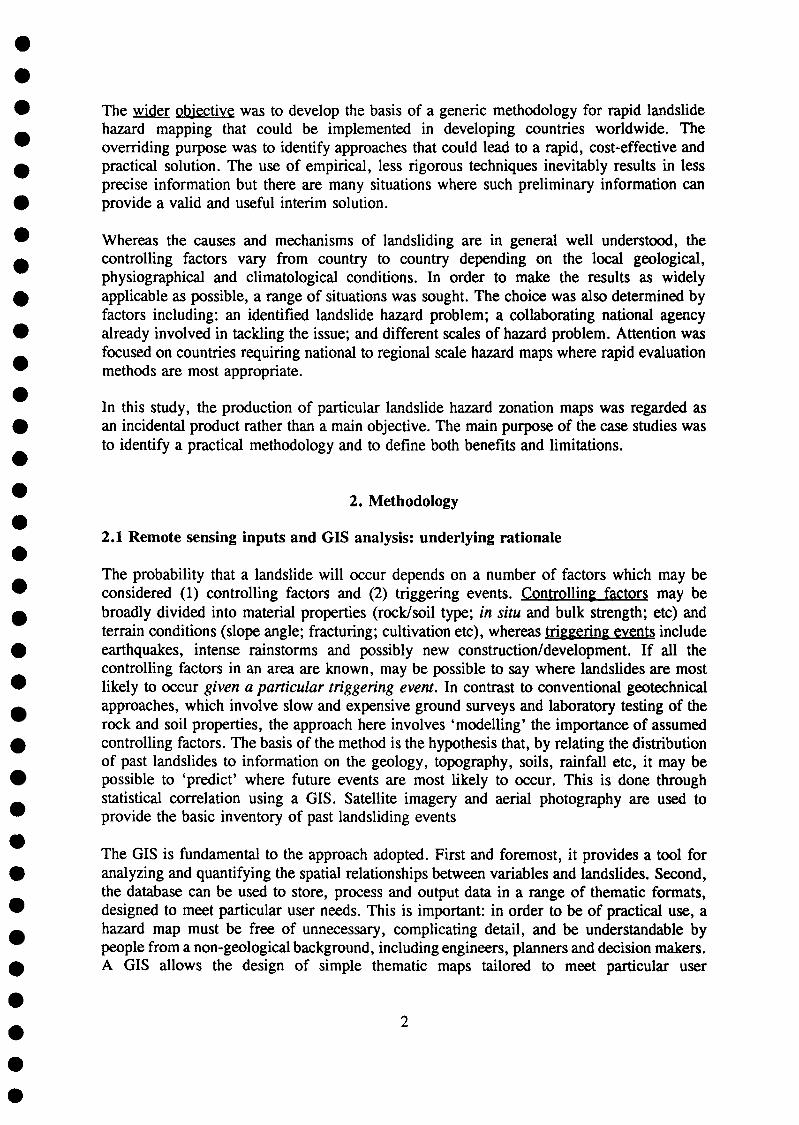
The wider gbiective was to develop the basis of a generic methodology for rapid landslide hazard mapping that could be implemented in developing countries worldwide. The overriding purpose was to identify approaches that could lead to a rapid, cost-effective and practical solution. The use of empirical, less rigorous techniques inevitably results in less precise information but there are many situations where such preliminary information can provide a valid and useful interim solution.
Whereas the causes and mechanisms of landsliding are in general well understood, the controlling factors vary from country to country depending on the local geological, physiographical and climatological conditions. In order to make the results as widely applicable as possible, a range of situations was sought. The choice was also determined by factors including: an identified landslide hazard problem; a collaborating national agency already involved in tackling the issue; and different scales of hazard problem. Attention was focused on countries requiring national to regional scale hazard maps where rapid evaluation methods are most appropriate.
In this study, the production of particular landslide hazard zonation maps was regarded as an incidental product rather than a main objective. The main purpose of the case studies was to identify a practical methodology and to define both benefits and limitations.
2. Methodology
2.1 Remote sensing inputs and GIS analysis: underlying rationale
The probability that a landslide will occur depends on a number of factors which may be considered (1) controlling factors and (2) triggering events. Controlling factors may be broadly divided into material properties (rocMsoi1 type; in situ and bulk strength; etc) and terrain conditions (slope angle; fracturing; cultivation etc), whereas @&gering events include earthquakes, intense rainstorms and possibly new construction/development. If all the controlling factors in an area are known, may be possible to say where landslides are most likely to occur given a particular triggering event. In contrast to conventional geotechnical approaches, which involve slow and expensive ground surveys and laboratory testing of the rock and soil properties, the approach here involves ‘modelling’ the importance of assumed controlling factors. The basis of the method is the hypothesis that, by relating the distribution of past landslides to information on the geology, topography, soils, rainfall etc, it may be possible to ‘predict’ where future events are most likely to occur. This is done through statistical correlation using a GIS. Satellite imagery and aerial photography are used to provide the basic inventory of past landsliding events
The GIS is fundamental to the approach adopted. First and foremost, it provides a tool for analyzing and quantifying the spatial relationships between variables and landslides. Second, the database can be used to store, process and output data in a range of thematic formats, designed to meet particular user needs. This is important: in order to be of practical use, a hazard map must be free of unnecessary, complicating detail, and be understandable by people from a non-geological background, including engineers, planners and decision makers. A GIS allows the design of simple thematic maps tailored to meet particular user
2

e e a a a
a a
a e
a a a a a a a a a a a a e e a a 0 a a 0 e e e e
requirements. Finally, the database can be easily updated as more information becomes available, allowing new maps to be produced.
The simplest form of hazard zonation map from imagery or photography is a distribution map of past landslides, perhaps subdivided into older and more recent events. Here, concentrations of past landslides may be taken to indicate generally unstable areas. At best a landslide hazard map of this type is a general guide to future hazards.
A more informative map will include other information such as topography, geology, rock structures, lineaments, roads, infrastructure, population distribution, etc. In such maps, the spatial association between landslides and these other variables may be visually apparent, but the approach does not make use of the data in any rigorous or quantifiable manner. Maps of this type require only a cartographic capability. A vector-based GIS provides an appropriate means of storing data and outputting customised, easily-updated cartographic map products as and when required.
A more quantitative approach involves ranking the different variables according to their calculated statistical importance to landsliding, and combining them to produce a hazard ‘probability distribution’ map. This type of analysis can be approached in a number of ways depending on the information held and the availability of supporting field or geotechnical evidence. It requires a raster-based GIS (one in which the data is divided into a mesh of grid cells, or ‘pixels’). Here, every point within the area has a classified value, thus making the analysis of spatial relationships easy.
The choice of a GIS will depend on various factors, the main ones being: size/extent of problem; design requirements of the database; analysis needs; output formats; financial constraints; and computer/GIS systems already in use and commercially supported nationally/locally. A community of users is important in regard to training and advice, data sharing, problem solving, and SupportYrnaintenance. The final choice of system may also be influenced by GISs already existing in an organisation, or the need to share the system with other users having different requirements. No single GIS is likely to be best in all respects and it may be necessary to consider using both vector and raster systems for different stages of the work. In the present study the vector system used was MapInfo and the raster system, IDRISI.
Data input to the GIS is a major, time-consuming activity that must precede any analysis. The extent of the database will depend upon what information is available or can be generated. The establishment of a database is never a trivial task and is likely to involve problems of map projection and registration of data sets. A particularly important layer is topography, which is required in the form of a digital elevation model (DEM). Since DEMs are not usually available, they must be generated from available topographic information. This can be a major operation requiring sophisticated computer software and powerful hardware.
2.2 Landslide modelling using a raster GIS
In the following account, ‘variable’ refers to a main GIS layer such as geology, slope, soil. Each variable is in turn sub-divided into several classes (e.g. the variable ‘geology’ is
3

a e e a a
a e a a e a a e a a e a a a e a e e e e 0 0 e 0 0 0 0 0
composed of classes called ‘lithologies’). The GIS analysis relies on testing the spatial correlation of the landslide inventory with each variable, first singly and then in combination. Initially, all classes within the first variable are cross-tabulated in turn with the landslides layer to determine whether the proportion of landslide pixels located in each class is greater or less than the regional average. This measure is then used to compute a weighting for each class (representing the probability of landsliding in that class). The same calculation is repeated for all the other variables.
The significance of a variable as a predictor of landsliding can be measured in different ways. It may, for example, be calculated as the proportion of the total landslide population that can be accounted for by that variable; a high percentage suggests that the ‘model’ is a good indicator of landsliding. Another, slightly different but perhaps more meaningful, test of significance is the percentage of a variable that coincides with landslides.
The next step is to combine variables to see if the predictability of landsliding can be improved. Logically, if two variables (e.g. rock type and soil) each individually relate (in some undefined way) to landsliding, then the two variables taken together should provide a more reliable indicator. The concept is illustrated in Figure 1. Here, Rock A (Figure 1A) accounts for 80% of the total landslides in the area, although only 20% of Rock A corresponds to landslides. Soil B, on the other hand (Figure 1B) accounts for 60% of the region’s landslides but is only 25 % landslides. The area of overlap (Figure 1C) accounts for 55 % of the total landslides but within this smaller area the reliability factor is now 45 % . If past are significant (i.e. not purely random), then one might argue that this area indicates where landslides are most likely to occur in the future.
The analysis is achieved by recasting every class of every variable as a numerical value equal to the weighting previously established. Combinations of variables (or ‘models’) are then formed by adding the weights pixel by pixel across the area, thus producing a new combined weighting for every pixel. To test whether a model is a better or worse predictor of landslides, the percentage of landslides in the combined variable classes are again tested against the regional average. The analysis is continued by sequentially adding more and more variables to the model and retaining those that improve it.
3. Test cases
3.1 Study areas
Test sites were chosen in three countries where landsliding is a significant problem and represents a threat to life and property: Papua New Guinea, Fiji and Colombia. In each country hazard maps are an important and urgent requirement. The national agencies are involved in landslide hazard mapping but the size of the problem, in terms of areas to be covered, is large compared with the resources. If significant progress is to be made, this must involve the use of rapid, more cost-effective techniques. The test sites chosen provide a range of different situations requiring somewhat different approaches.
Papua New Guinea is a large, mountainous and thinly populated country covering 462 840 km2. It has high rainfall and seismicity. The region is tectonically very active, the
4

a a a a a
a a a a a a a a a a a a a a a a a a e a
a
0
0
e 0
a e
a 0
D
1A Rock A accounts for 80% of the landslides in the region but only 20% of Rock A corresponds to landslides
1B Soil B accounts for 60% of the landslides in the region but only 25% of Soil B corresponds to landslides
1C The combined category of ‘Rock A + Soil B’ now accounts for 55% of the region’s landslides and 45% of this category corresponds to landslides
Figure 1 Hypothetical situation where landsliding is controlled by 2 independent variables, Rock A and Soil B.
5

0 e a a e 0 a a a a a a a a a a a a a a 0 a a a a 0
a a a a a a a 0
Highlands experiencing some of the highest rates of uplift of anywhere on earth. As a result, landslides in this rugged terrain are of considerable scale in terms of volume of material involved. Although most occur in sparsely populated regions, their widespread distribution and size result in some loss of life and damage to infrastructure. Given the large area involved, the requirement is for regional to national scale hazard zonation maps at scales of 1:lOO O00 to 1:250 O00.
Fiji is a small South Pacific nation (total area 18 330 km2) consisting of two main islands and many smaller ones. Though geologically young, the islands are tectonically more stable than PNG and the relief more subdued. The association of deep tropical weathering with high intensity rainfall, especially during tropical cyclones, results in generally small, though locally numerous and damaging, landslides. The requirement in Fiji is for medium to regional scale hazard maps covering at least the two main islands.
Colombia (area 1 138 915 km2) has a high incidence of natural hazards, including landslides which occur frequently. High relief and steep slopes together with seismic and volcanic activity, and heavy rainfall, combine to produce conditions conducive to landsliding. In many areas, the natural hazard has been increased by man’s activity such as urban development, roads and agriculture, particularly coffee growing. The national authorities take the problem of landsliding very seriously, and studies of many of the important population centres have been undertaken or are planned. However, a need remains to cover many additional areas at the regional, large and detailed scales.
3.2 Results
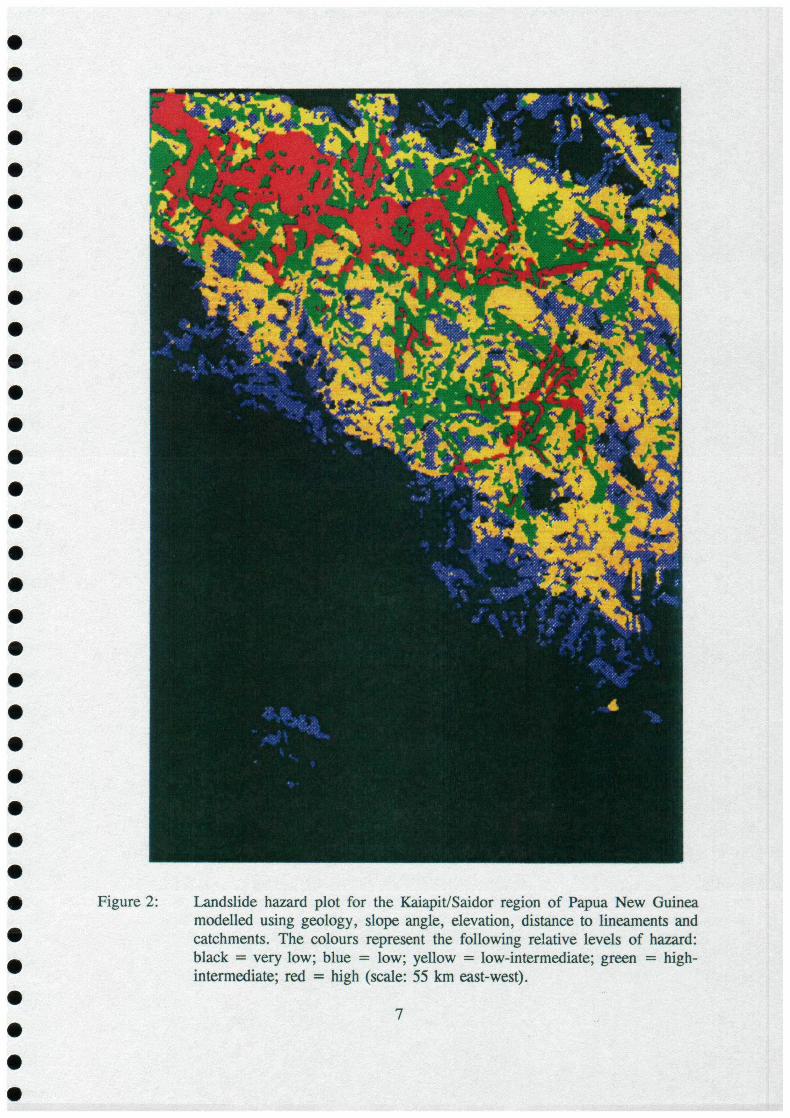
Papua New Guinea: A hazard analysis was undertaken in collaboration with the Geological Survey covering approximately 4500 km2 of the Highlands. The area is tectonically and seismically active and experiences frequent, large and devastating landslides. The region is sparsely populated. Multi-date Landsat TM imagery was processed and interpreted, and combined with information from aerial photographs and other existing data. A DEM was derived from the contour information taken from the published 1:50 OOO maps. The study partly set out to compare the usefulness of vector-based GIS (PNG) and raster-based GIS (BGS) for producing useful preliminary hazard maps. It involved a close collaboration between BGS and the PNG Geological Survey.
The final version of the PNG raster GIS hazard map is shown in Figure 2. The top 4 hazard zones have reliability factors of 25%, 30%, 43% and 70% respectively from low though to high, and together account for 84% of all interpreted landslides.
Fiji: A study site in SE Viti Levu covering a land area of approximately 713 km2 was identified in collaboration with the Mineral Resources Department in Suva. Compared with PNG, the area has relatively subdued topography and smaller, though abundant, landslides. Most appear to have been triggered by intense rainstorms associated with tropical cyclones, but the extent to which other controlling factors influence landsliding is not well understood regionally. Given the small size of most of the landslides, aerial photography rather than satellite imagery was chosen for the analysis. 150 OOO Scale aerial photographs were examined and landslides of various ages (old transitional and young) interpreted. Some
6
0 e 0
e e e 0
e e e e 0
e 0
e e e 0 e 0 0 0 0 0 e 0
e 0 e 0
e 0 0
difficulty was experienced in obtaining a consistent approach among the several geologists undertaking the interpretation.
The results indicated that geological and other controls have less effect than rainfall. In other words, given a high intensity rainfall event, such controls influence the locations and severity of landsliding to a limited degree only. Nevertheless, the final model for Fiji accounted for around 75 % of the identified landslides with a reliability factor of nearly 25 % . The final Fiji hazard zonation map is shown in Figure 3.
Colombia: The Colombia study formed the focus of a training attachment and was completed during a 10-week visit.
The study involved an investigation of a small area of some 66 km2 around the city of Sevilla situated in the central Colombian Andes. This is a coffee-growing area centred about the urban zone in a mountainous setting which is susceptible to a variety of landslide activity. Soil erosion and landslips are common and are, in part, attributable to man’s impact on the environment (deforestation, urban expansion, intense cultivation and cattle raising). The process of landsliding and soil degeneration is accentuated by heavy rainfall. The study used a raster-based GIS called ILWIS which is the system currently used by Ingeominas. The data consisted of a photointerpretation of landslide occurrences, a digital elevation model, a soils map and geology. The study undertook to produce a landslide hazard map combining and cross-correlating various data elements including slope, aspect, geology, structure, soil, drainage, infrastructure and landslides.
4. Dissemination and training
Project-related training in remote sensing and GIS was provided to geologists from each of the three collaborating organisations.
Mr Joe Buleka and Mr Gabriel Kuna of the PNG Geological Survey spent 4 week at the BGS from 8 November 1993 to 3 December 1993. During this time they received instruction in image processing, satellite imagery and aerial photograph interpretation, and GIS analysis of PNG data. The visit was funded from both external and ODA sources.
Mr Satish Prasad of the Fiji Mineral Resources Department spent 4 weeks in BGS from 21 November 1994 to 16 December 1994. The visit was funded by the South Pacific Applied Geoscience Commission (SOPAC) in Suva. Mr Prasad received project training in photointerpretation of landslides, data capture and GIS using data for part of the Viti Levu test area.
Sra Liliana Marin from the Cali office of Ingeominas, Colombia spent 10 weeks in BGS from 8 January 1994 to 20 March 1994. The visit was funded by the British Council. Training involved image processing, aerial photograph interpretation of landslides, data capture, and GIS analysis using ILWIS. Despite the limited time available for the work, a full study and GIS analysis was carried out and a report completed in Spanish and English translation.
In the case of PNG and Fiji, the final country reports were jointly produced documents. Copies were provided to the organisations for internal use and dissemination to other
8


e e 0
e e e e e e e e e e e e e e 0 0 e e e e e e e a e e 0 a 0 0 a
interested parties in their countries. GIS is now becoming increasingly used in many areas, and there is every reason to hope that these and similar techniques will become implemented more widely. It is still planned to produce a summary of the methodology for presentation at meetings and publication in an international scientific journal.
5. Conclusions and recommendations
The project has provided a test of the remote sensing plus GIS approach to landslide hazard mapping in a range of vulnerable environments. Remote sensing can provide a reliable and rapid means of mapping landslide-related terrain features. GIS is an appropriate and efficient tool for (1) storing and displaying data, (2) analyzing relationships between variables, and (3) producing thematic hazard maps. The techniques contribute towards an operational methodology for producing provisional regional hazard maps quickly and cost-effectively. Moreover, the approach is a generic one that can be adapted for a range of geographical situations. It is a valuable contribution to the UN-designated ‘International Decade for Natural Disaster Reduction’ (IDNDR).
The study represents a significant advance in knowledge in this important area of geoscience. The basis of an operational methodology is fully documented in separate and detailed country reports. These provide technical descriptions which will enable workers in these countries and elsewhere to adopt and develop the approaches. The programme has, through direct collaboration and training of counterparts, also provided basic instruction in the techniques.
Despite the overall success of the project, some work still remains to be done. A number of important issues have been highlighted that need to be addressed as part of the implementation process.
1. The interaction between different variables is not in a simple linear relationship. The modelling approach used takes some account of this but further evaluation is needed to understand and refine the interpretation of results. Further work is also required to determine how best to measure the performance of different hazard models.
2. Further examination of these and similar data sets is needed to better understand the ways in which variables contribute to the analysis. This should also involve geotechnical field validation.
3. Although the approach is generic, conditions producing landslides vary from country to country. Prior to implementation, an assessment should be carried out locally to determine the availability of data and to decide on specific analysis methods.
4. The hazard maps produced in the pilot studies are still not validated. Geotechnical field investigations and laboratory testing are required to determine whether such maps are meaningful in terms of more conventional engineering geology approaches. The results of such work should be used to modify and improve the methodology.
In both Papua New Guinea and Fiji, there is a need for hazard zonation maps at the national to regional scales. What is now required is a review in each country to define priorities and a long term strategic programme. Implementation of such a hazard mapping programme is
10

e 0 e e rn
e 0
e e e e 0
e rn e e e a e e e 0 e e a 0 e e e e a e 0 e
likely to require additional staff and resources dedicated to this work, and possibly also further ODA-supported training from the BGS.
It is difficult to predict likely take-up of the methods. They require a certain degree of computer expertise and training, but many developing countries are rapidly achieving this level of sophistication. Dissemination of the early results and further development of the concepts are clearly necessary, but they have to be accompanied by an awareness of the importance of the landslide problem and a desire to deal with it from a planning and mitigation viewpoint. As stated earlier, there is little prospect of providing regional scale landslide hazard maps in many areas other than by rapid methods.
Acknowledgements
Many people contributed directly or indirectly to the study, and their interest and help is gratefully acknowledged. The main participants are indicated by the authorship of the technical reports (see above). Particular thanks are due to the directors of the Geological Survey of Papua New Guinea, the Mineral Resources Department, Fiji, and Ingeominas, Colombia for their support and for the involvement of their staff.
11

0 0 a 0 a 0 e a e a a 0 a a a e a 0 a a a a a e a 0 0
a a 0 a e e a
Appendix 1: Project outputs
The following technical reports contain full details of the work described above.
Greenbaum, D., Tutton, M., Bowker, M.R., Browne, T.J., Buleka, J., Greally, K.B., Kuna, G., McDonald, A.J.W., Marsh, S.H., Northmore, K.J., O’Connor E.A.O., and Tragheim, D.G. 1995. Rapid assessment of landslide hazards: Papua New Guineacase study. BGS Technical Report WCl95127.
Greenbaum, D., Bowker, M.R., Dau, I., Dropsy, H., Greally, K.B., McDonald, A.J.W., Marsh, S.H., Northmore, K.J., O’Connor E.A.O., Prasad, S. and Tragheim, D.G. 1995. Rapid assessment of landslide hazards: Fiji case study. BGS Technical Report WC/95/28.
Marin, L. 1994. Application of ILWIS-GIS to the inventory map of mass movements around the city of Sevilla del Cauca Department - Republic of Colombia, Ingeominas report, 39 pp.
12