
WC/00/011 Landslide hazard mapping: summary report. · landslide hazard modelling that can be...
28
Transcript of WC/00/011 Landslide hazard mapping: summary report. · landslide hazard modelling that can be...
British G e o l o g i c a l Survey
Department for International DFID Development
TECHNICAL REPORT WC/OO/l 1 Overseas Geology Series
DFID Project No. R6839
Landslide hazard mapping: summary report Marsh S H
British Geological Survey
A report prepared for the Department for International Development (DFID) under the Knowledge and Research Programme as part of the UK provision of technical assistance to developing countries. The views expressed are not necessarily those of DFID.
DFID classification : Subsector: Geoscience Theme: G2 - Improve geological, geochemical and geotechnical hazard avoidance strategies in development planning Project title: An implementation strategy for landslide hazard preparedness Project reference: R6839
Bibliographic reference: Marsh S H. 2000. Landslide hazard mapping: summary report. BGS Technical Report WC/OO/ll
Keywords: landslide, natural hazard, disaster mitigation, GIS, remote sensing
Front cover illustration: Top left depicts a Radarsat image over the Javorniky Mountains, Slovakia. Top right shows the digital geological map for the Slovakian study area. The final hazard map is at the bottom, draped on a terrain model and shown in perspective view.
0 NERC 2000
Keyworth, Nottingham, British Geological Survey, 2000
EXECUTIVE SUMMARY
This document is the final summary report resulting from successive research projects on landslide hazard mapping undertaken by the British Geological Survey with support from the Department for International Development (DFID). The aim of the studies has been to develop a generic approach to landslide hazard modelling that can be applied and adapted in any developing country. The purpose of this report is to summarise a strategy for landslide hazard preparedness based on this generic approach. The ultimate goal of the work is to prevent or minimise loss of life and damage to property.
Conventional landslide hazard mapping involves detailed and costly ground geotechnical surveys. These result in accurate maps that are essential in site-specific planning and development. However, such surveys are time-consuming and expensive, and are therefore impractical and usually unjustified for large regions. The approach developed in this research and described here provides an alternative, rapid and cost-effective solution to the problem of providing regional hazard information. It is based on the concept that the past is the key to the future; that is, landslides are most likely to happen in areas where the ground conditions that caused them in the past still persist today. By identifylng the distribution of past landslide events using remote sensing, understanding why they occurred using spatial analysis and mapping the relevant ground condtions over wider areas, it is possible to predict where landslides are most likely to occur in the future. The resulting regional hazard susceptibility maps are not as reliable as those produced by conventional ground surveys and should not be used for site-specific projects, but they do at least provide a preliminary indication of hazard over an entire region. They can be used for general development planning purposes, as a guide to where detailed ground surveys are required, or in disaster mitigation and contingency planning.
This report is aimed at non-technical people in countries where landsliding is a problem. For the technically minded, a brief outline of the methodology is included but reference should be made to the full implementation strategy reported elsewhere. This summary is more concerned with strategic issues that determine the skills and resources needed to plan and cost a landslide hazard preparedness work programme. For planners, decision-makers and other professionals involved with landslide hazard issues, it should provide an understandable guide to landslides, why they occur, and how regional landslide hazard maps can possibly help in their mitigation. The report is written in general terms that stress the need to assess the problem in the context of local and national constraints and requirements. Implementation of the methods requires an investment in resources and probably staff training but it should be achievable in many cases within a reasonable time scale and, given the falling price of information technology, at reasonable cost.
BGS Technical Report WC/OO/11 Issue 1.0
~ ~~
Summary report on landslide hazard preparedness

CONTENTS
.......................................................................................................................... 1 . INTRODUCTION 2 2.1 Significance of the problem ...................................................................................................... 3 2.2 Assessment and management of landslide hazards .................................................................... 3 2.3 What is a landslide? .................................................................................................................. 4 2.4 Landslide causes ....................................................................................................................... 6 2.5 Landslide hazard maps ............................................................................................................. 6
2.5.1 Use of landslide hazard maps ............................................................................................. 7 2.5.2 Limitations of landslide hazard maps ................................................................................. 7 2.5.3 Accuracy of landslide hazard maps .................................................................................... 7
3.1 Concepts of the remote sensing and spatial analysis approach ................................................. 11
3.2.1 Remote sensing data types ................................................................................................ 13 3.2.2 Image processing ............................................................................................................. 13 3.2.3 Data interpretation and verification .................................................................................. 14
3.3.2 Raster GIS terminology .................................................................................................... 15 3.3.3 Building the database ....................................................................................................... 15
3.3.5 Hazard map outputs ......................................................................................................... 17
2.6 National landslide hazard preparedness strategies ..................................................................... 8 3 . HAZARD MAP PREPARATION ................................................................................................. 11
3.2 Developing the landslide inventory ......................................................................................... 12
3.3 GIS hazard modelling ............................................................................................................. 14 3.3.1 Concepts .......................................................................................................................... 14
3.3.4 GIS Analysis .................................................................................................................... 16
3.4 Discussion .............................................................................................................................. 17 4 . IMPLEMENTATION ISSUES ..................................................................................................... 19
4.1 The skills base and training needs ........................................................................................... 19 4.1.1 Remote Sensing ............................................................................................................... 19
4.1.3 Other Considerations ....................................................................................................... 20 4.2 Computer hardware and software requirements ....................................................................... 20
4.2.1 Hardware Requirements ................................................................................................... 20 4.2.2 Software Requirements ..................................................................................................... 20
4.3 Project planning ...................................................................................................................... 21 4 . 4 Public awareness .................................................................................................................... 22
5 . CONCLUDING REMARKS ......................................................................................................... 23 ACKNOWLEDGEMENTS .............................................................................................................. 23 REFERENCES ................................................................................................................................. 24
4.1.2 Databasing and GIS ......................................................................................................... 19
BGS Technical Report WC/OO/11 Issue . 1.0
1 Summary report on landslide hazards preparedness

1 INTRODUCTION
This report is the final output from successive research projects on landslide hazard modelling undertaken by the British Geological Survey with support from the UK government’s Department for International Development (DFID). The original work (Project R5554: Greenbaum, 1995, Greenbaum and others, 1995 a and b) was carried out in Papua New Guinea and Fiji and focused on geologically young and active terrains. The second project (R6839) aimed to extend the methodology to other regions in order to develop a generic approach that could be adapted and applied to developing countries world-wide. Regions studied include Jamaica (Northmore and others, 2000) and Slovakia (O’Connor and others, 2000). The findings of the research have been used to define a generic strategy for landslide hazard preparedness (Greenbaum and others, 2000) that draws on six years of cumulative experience. This report summarises the approach developed, which extracts common themes that are likely to apply whatever the region under study.
Landslides are a common natural hazard throughout much of the developing and developed world. They occur when extreme events, such as heavy rainfall or seismic activity, trigger mass movements of ground that is only marginally stable. They tend to be regarded as unusual occurrences because, on a human scale, the interval between landsliding events may seem large and erratic. However, from a geological viewpoint landslides are nothing exceptional. Indeed, over longer (i.e. geological) periods, landsliding is probably the main erosional process operating in many regions. Thus, prevention may only be possible to a limited degree. Improved understanding of the causes may, however, be used to prevent or modify human actions that increase ground instability. For example, a land clearance in inappropriate terrain could be prohibited or a road cutting redirected across less hazardous ground.
As landslides are a geologically common event, their distribution in space and time can be examined and used to ‘predict’ statistically the likelihood of such events occurring in the future in the same type of terrain. This is the rationale behind landslide hazard modelling. The conventional approaches to mapping the distribution of landslides operate at the local level. They involve detailed ground surveys, including subsurface investigation, that determine the nature of the slip surface and the groundwater pressures acting upon it, rock and soil strength and other key factors. Such methods result in detailed maps that can be used for site-specific planning. However, such surveys are time-consuming and therefore expensive. They are justifiable, and even essential, where major new infrastructure or other significant development work is planned in an area with a history of previous landsliding. But because of the expense and slowness of coverage they are impractical for larger regions.
The approach described here provides an alternative, cost-effective solution to this problem for large, mainly rural areas. The technique is rapid and low-cost. It uses information that is either already available or that can be obtained easily in order to classify broad regions in terms of their probable susceptibility to landsliding. It is based on the concept that the past is the key to the future; that is, landslides are most likely to happen in areas where the ground conditions that caused them in the past persist today. By mapping the existing landslides using remote sensing techniques, understanding why they occurred and then mapping the relevant ground conditions over wider areas, it is possible to predict where landslides are most likely to occur in the future. The resulting maps are not as detailed or reliable as those produced by conventional ground surveys for small areas, but they at least provide a preliminary indication of hazard over a whole region. This information can be used for a variety of general planning purposes and as a guide to where more detailed studies are required.
This summary report is intended primarily for non-technical people in developing countries where there is a landslide problem. It also forms a key deliverable for DFID, who commissioned the work. It should provide an understandable guide to landslides, why they occur, how landslide hazards can be mapped and how to use the resulting regional landslide hazard maps to help develop a landslide hazard preparedness strategy. There is also information on the skills and resources needed to plan, cost and implement such a work programme. The report is written in general terms that emphasise the need to assess the problem, mitigation requirements and implementation constraints in terms of local and national needs. Full details on the methodology and examples of its implementation are provided in the reports referred to above.
BGS Technical Report WC/OO/ll 2 Summary report on Issue. 1.0 landslide hazards preparedness
2. LANDSLIDE HAZARDS
Landslide hazard is the potential for harm caused by existing and future landslides. It is dynamic, because landslides vary in extent, magnitude and frequency over time due to environmental change. Its interaction with human activities is increasing due to population growth and development. The diverse causes, types, setting and size of landslides mean they range from innumerable, insignificant failures to occasional, destructive high-magnitude events that have disastrous impacts on society. Consequently, perceptions of landslide hazards vary considerably. To the general population, the causes of landslides are obscure and often thought to be beyond human control. This attitude often reduces the perceived need for investigations to assess the potential for landslide hazards. In other instances, underestimation of the ways human activities can make slope instability worse, coupled with over-confidence in ‘engineering solutions’, can result in excessive earthworks being constructed with limited stabilisation measures. Inadequate or inappropriate engineering work during building and road construction frequently reactivates old failures or generates new landslides.
2.1 Significance of the problem
Landsliding is a significant problem in many countries. Hansen (1984) estimated that up to 25 per cent of all deaths from natural hazards are caused by landslides. However, the nature and importance of the problem vary greatly from country to country so it is first necessary to decide whether the need for the information justifies the effort involved in mapping the hazard. In an ideal world, detailed landslide hazard maps would be available for most urban and many rural areas, but the necessary human and financial resources are not available; ground surveys are simply too expensive. On the other hand, rapid regional hazard maps can be produced at moderate cost within a short time frame. Given the limitations of such maps, it is important to ask whether they will be of practical use in a particular situation. It is also important to understand the limitations of the method and to inform all those with an interest in the issue. A decision to develop a landslide hazard project requires informed input from all interested parties and potential hazard map users.
Landslides are often considered significant only when a catastrophic failure involves large loss of life. Tragic as these events may be, fortunately they are infrequent. The majority of landslides are rarely disastrous and infrequent catastrophic events tend to divert attention away from the frequent smaller slope movements that, cumulatively, impose at least as great a cost on society. This cost may be more widely distributed, but human activity is increasing the frequency of these smaller events so that total losses attributable to landslides are growing rapidly. The global financial costs of landslide hazards are difficult to assess, but some published estimates give an idea of the scale of the problem. For example, landslide costs in the USA, Japan, the Alpine nations and India have been assessed as being similar in magnitude at between USD1-1.5 billion per year (Schuster, 1978; Aleotti & Chowdhury, 1999). Cost estimates for developing countries are rare and can be grossly inaccurate. In part, this is due to an under appreciation of the significance of landslides that arises because they are often a secondary consequence of triggering events. So, the cost of landsliding tends to be subsumed within the more conspicuous impact of such primary hazards as earthquakes, volcanic eruptions, hurricanes, floods or intense rainstorms. Yet assessment of landslide hazards is especially needed in the developing world because the frequency and magnitude of their impacts is likely to increase as populations expand into more vulnerable areas. Of greatest priority are regions seeing progressive population concentration in areas where the potential for landslides to occur is greatest.
2.2 Assessment and management of landslide hazards
Landslide hazard assessment identifies zones with varying potential for landslides. The next step is to decide whether landslides will place infrastructure or communities at risk. It is therefore critical to understand the difference between hazard and risk. Varnes (1984) describes the relationship as:
Total Risk = Hazard x Elements at Risk x Vulnerability
BGS Technical Report WC/OO/l 1 3 Issue. 1.0
Summary report on landslide hazards preparedness
Total Risk is the expected number of lives lost, persons injured, value of property damaged, and cost of disruption to economic activity. Hazard is the probability of occurrence of a particular magnitude of landslide in a specified area and within a specified time period. The Elements at Risk measures the total value of the population, properties and economic activities threatened within the area under consideration. Vulnerability is the actual degree of loss within the area under consideration inflicted on a given set of elements at risk by the occurrence of the landsliding event.
Thus, a large hazard in a desert affects few vulnerable elements at risk like people or infrastructure and so may pose a small risk. On the other hand, a modest hazard in an over-populated urban setting can in fact threaten a large number of vulnerable elements and so pose a higher risk. This research considered both ends of the spectrum, drawing on studies in Papua New Guinea that concern huge mass movements in remote areas and others in Fiji and elsewhere that looked at smaller movements affecting large numbers of people. It is only possible to develop estimates of potential loss, and hence assess total risk, if hazard and vulnerability assessments are combined. To do this requires that the location, magnitude and timing of landslide events be forecast. This can be done using probabilistic analysis but it is a difficult task and may only be feasible in specific situations. It also requires the vulnerability of the elements at risk to be quantified. These complexities make it hard to achieve an accurate total risk assessment. Management of landslides is therefore currently focused on local or regional landslide hazard assessments.
Local hazard assessment concerns site-specific work, often associated with a proposed construction project. It follows a well-established methodology that involves surface and sub-surface investigation, instrumentation, testing and analysis. A factor of safety approach is used in which the stresses acting on a slope (destabilising forces) and the shear strength of the slope materials (resisting forces) are calculated. It is critical that the location and nature of any pre-existing slip, or shear, surfaces are known and groundwater pressures acting upon them measured (Hutchinson, 1993). Such techniques are too expensive and time-consuming to be employed in regional hazard assessments.
Regional landslide hazard assessments enable preliminary landslide hazard maps to be prepared quickly and at reasonable cost and are of particular relevance to developing countries. They provide information on the statistical likelihood of landsliding at a coarse scale and should not be used at the detailed, site-specific level. Rather, regional landslide hazard maps are a tool for the strategic, pre- development planning of infrastructure, the development of disaster response plans that mitigate loss to life and property, and the identification of sites for local assessment. The logic behind a regional landslide hazard assessment is that the distribution of past landslides reflects the occurrence of the combined factors that resulted in the initial slope failure. If those causal factors can be identified and mapped, then comparison of their mapped distributions allows identification of areas with varying potential for landsliding in the future. Various regional hazard assessment techniques exist whose application depends on the extent of the area under consideration, type of landsliding and available baseline data. The methodology for rapid landslide hazard assessment developed in this study suits a variety of terrain conditions.
Regional landslide hazard assessments have rarely been applied systematically in the developing world for the reasons discussed above. This report describes ways to redress this, at least in part, by:
Increasing general awareness of the nature, distribution, causes and significance of landsliding; Improving the accuracy and applicability of landslide hazard assessments; Improving awareness of the potential of regional landslide hazard assessment for formulating hazard preparedness strategies and thereby reducing landslide losses; and Transferring knowledge, expertise and technology to developing countries such that national awareness and capabilities with respect to landslide hazards may be raised and sustained.
2.3 What is a landslide?
Landslides are gravity-dominated mass movement processes that transport rock, soil, artificial fills and dumped waste materials down slopes. All slopes are under stress due to gravity. If the forces
BGS Technical Report WC/OO/l 1 4 Issue. 1.0
Summary report on landslide hazards preparedness
acting on a slope exceed the resisting strength of its materials, the slope will fail and a landslide will occur. It is as natural for land to slide as it is for water to run downhill. Landslides are one of the most common of the erosional processes that shape the earth’s landscape. One or more of three main mechanisms cause the displacement of the material involved in landslide movements:
Falling: detachment of blocks from steep slopes that descend by free-fall, bouncing or rolling; Sliding: movement of materials as a coherent body over a basal shear surface; and Flowing: turbulent motion of wet or dry material that moves as a viscous fluid which may or may not be bounded by a basal shear surface.
These processes produce a bewildering spectrum of slope movement landforms and behaviours. Size varies and displacements range from a few metres to tens of kilometres. Some movements are rapid while others occur slowly. In some cases the majority of displacement may be achieved in a single, short-lived event, whilst in others movement may be gradual, cyclical or pulsed. Displaced material may move in coherent masses to create a characteristic terrain of scars, ridges, humps and hollows. In other situations it may lose coherence and run away from the initial failure site like dry sugar (e.g. in dry sands) or freshly-mixed wet concrete (e.g. mudflows). One movement mechanism may operate alone, but usually several occur together to produce a landslide complex. Alternatively, the movement mechanism may change progressively down slope to give what is known as a ‘complex’ landslide.
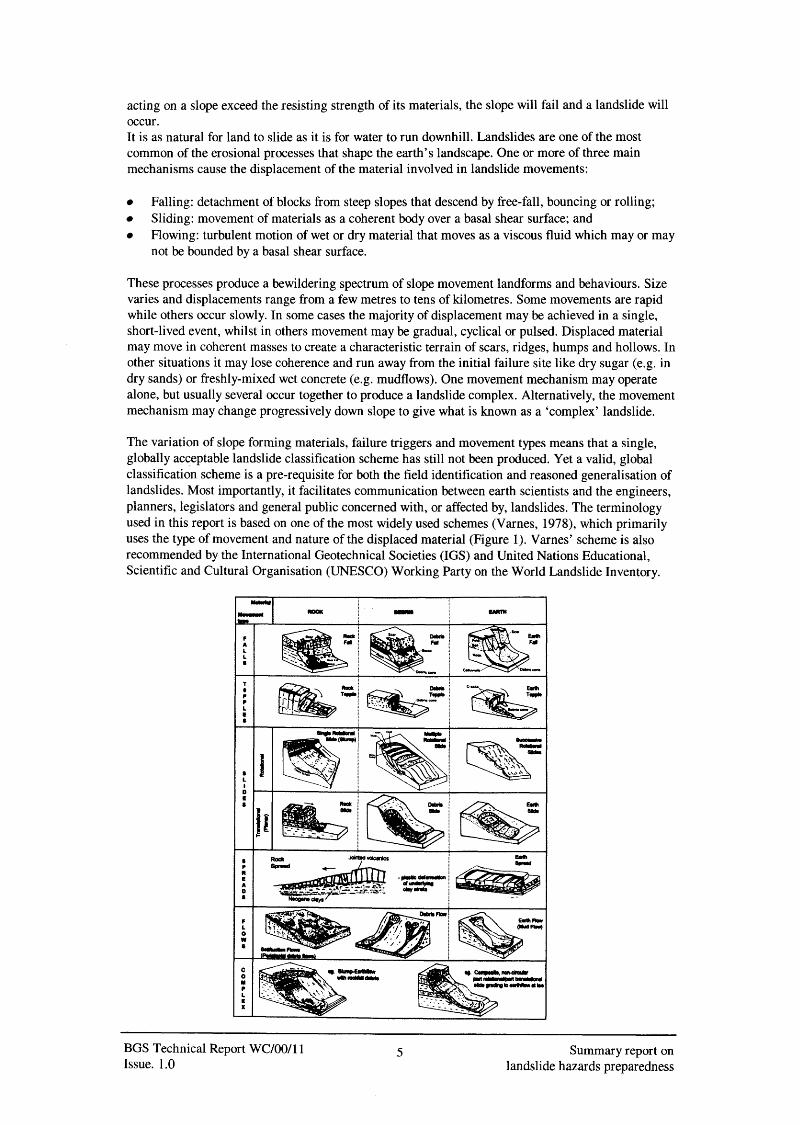
The variation of slope forming materials, failure triggers and movement types means that a single, globally acceptable landslide classification scheme has still not been produced. Yet a valid, global classification scheme is a pre-requisite for both the field identification and reasoned generalisation of landslides. Most importantly, it facilitates communication between earth scientists and the engineers, planners, legislators and general public concerned with, or affected by, landslides. The terminology used in this report is based on one of the most widely used schemes (Varnes, 1978), which primarily uses the type of movement and nature of the displaced material (Figure 1). Varnes’ scheme is also recommended by the International Geotechnical Societies (IGS) and United Nations Educational, Scientific and Cultural Organisation (UNESCO) Working Party on the World Landslide Inventory.
LL
f A L L 8
- T 0 c ? L E 8 -
8 L I 0 c 8
- 8 c R
A 0 8
e
- f L 0 W 8
- E 0 Y c L
X e
-
C.
BGS Technical Report WC/OO/11 Issue. 1.0
5 Summary report on landslide hazards preparedness

Figure 1. Examples of landslide types and terminology based on Varnes’ classification.
2.4 Landslide causes
Conditions that make landsliding more or less likely, such as geology, are termed controlling factors. But landslides actually occur when the stress acting on a slope exceeds the resisting strength of the slope-forming materials. The displaced material moves to a new position so that equilibrium can be re-established between the destabilising forces and the residual strength of the rock or soils along the surface of movement. A landslide, therefore, is a process that changes a slope to a more stable state. This is usually achieved by the initial slope failure but further failures may follow despite increased stability. Weathering, removal of cements, or groundwater changes may reduce the slope’s strength. Stresses acting on a slope can be increased by slope steepening due to erosion or excavation, loading due to dumping or construction, heavy rain or earthquake shocks. These changes often follow periods of relative inactivity lasting hundreds or even thousands of years. Such factors may destabilise a slope in two ways. Firstly, they may act as preparatory factors by making it increasingly susceptible to failure, without actually inducing movement. Secondly, they may act as triggering factors by altering the balance of forces so as to initiate movement. Thus, short- and long-term environmental changes and human activities affect slope stability. In general, slips that have suffered moderate displacements on clay failure surfaces tend to be only marginally stable and are often affected by slow, continuing seasonal movements. Where landslides have involved rapid, large displacements the resulting debris tends to have a higher long-term stability and significant post-failure movements are unusual. Thus observation of the type of movement and the material involved may allow estimation of the landslide debris’ stability. Such estimates can then be incorporated into regional landslide hazard assessments.
2.5 Landslide hazard maps
Regional landslide hazard maps, also referred to as landslide potential or susceptibility maps, are based on the statistical analysis of landslide distribution and the identified controlling factors. They divide a region into zones reflecting the intensity of landslide hazard. The hazard zones are usually classified into at least four categories, for example high, moderate, low and no susceptibility. The hazard map should also indicate areas of existing landslides, which can be distinguished by type or character. Old landslides are often degraded and vegetated, making their recognition difficult, but this should be attempted. It is important that the map’s categories are kept few and simple so that it can be better understood by non-specialist end-users. The map scale will depend on the end use, the extent of the area under consideration and resolution of the data on which the map is based. It must be stressed that landslide hazard maps are not landslide risk maps. The latter involve assessment of the losses that may be incurred through the impact of landslide hazards on vulnerable elements, evaluation of the expected performance of structures, infrastructure, and institutions and consideration of the safety of human lives. When hazard assessments and vulnerability assessments are combined, it is possible to estimate potential losses and hence assess risk. Different areas that are subject to the same hazard
BGS Technical Report WC/OO/11 Issue. 1.0
6 Summary report on landslide hazards preparedness
can face a variety of consequences depending on land use. So, the simplest approach to risk map preparation is to overlay a hazard map with a land-use map. However, the resulting risk maps may be politically ‘sensitive’ and may also oversimplify the information. For this reason, decision-makers and planners often work directly from the landslide hazard map and omit the quantitative risk analysis stage.
2.5.1 Use of landslide hazard maps
Landslide hazard maps are of great value to development planning because they depict regional zones with different levels of potential landslide hazard, within which decisions can be taken on appropriate land-use, building regulation and engineering practices. For planning and mitigation purposes, such landslide hazard assessments provide a basis for addressing three broad concerns (Jones, 1992):
The reasons for widespread or repeated losses affecting a broad range of interests; The hazard potential associated with proposed developments, so that future losses can be minimised by relocation (hazard avoidance) or the adoption of protection measures; and The likelihood of hazards occurring following development (environmental impact assessments).
Landslide hazard maps, together with information on existing or expected vulnerability, can also be used to estimate the risk associated with critical facilities like road and rail networks, hospitals, or water pipelines. Such information may be used to make decisions regarding the ‘acceptable risk’ for one or more facilities, the need for relocation or the application of appropriate remedial measures.
2.5.2 Limitations of landslide hazard maps
Landslide hazard maps do not predict when or exactly where landslides will occur during a specific triggering event. The hazard zones simply represent differences in the chance of landslide occurrence that can be expected over the long-term. The zoning shown on hazard maps is determined by analysis of landslide distribution in relation to the perceived factors controlling those landslides on a regional scale, so it is only applicable to regional planning. Such maps are unsuitable for site-specific stability assessments, determining the siting of specific structures or in engineering design. More detailed local hazard assessments are required for these purposes. Thus, regional hazard maps in no way replace or reduce the need for new development to be designed based on appropriate geotechnical investigation. Rather, the maps serve to focus attention on likely problem areas which, prior to new development, should be assessed in greater detail using site-specific geotechnical techniques.
2.5.3 Accuracy of landslide hazard maps
Like all maps, landslide hazard maps are only as good as the data fiom which they are compiled. The generalisations required in order to delineate hazard zones mean that specific locations within a specific zone may have a different local hazard susceptibility to that indicated for that zone.
The three key assumptions underpinning landslide hazard map preparation are that:
The main factors that cause landsliding can be identified; The relative significance of these factors can be estimated; and The estimation of future slope instability can be based on an assessment of these conditions that led to slope failure in the past.
The premise that the conditions leading to past and present slope instability will apply equally well in the future is only valid in general terms. Both climate change and human intervention influence the stability of slopes over time. Past landsliding may also lead to changes in the landforms that induce stability. And although the main factors like geology that influence landsliding may be identified,
BGS Technical Report WC/OO/ll Issue. 1.0
7 Summary report on landslide hazards preparedness

other relevant parameters are often excluded from regional hazard assessments because the data do not exist or are difficult to measure over a whole region. For example, variable joint and fracture spacing influences a slope’s stability but is extremely time-consuming and expensive to map. Finally, it is not always possible to assign relative levels of significance to landslide causes with a high degree of confidence. All these considerations will affect the accuracy of the hazard zones.
Deficiencies in the landslide distribution inventory will be transmitted to the hazard map. The main reason for such deficiencies is the difficulty of recognising old, degraded landslides in steep, vegetated terrain. These recognition problems are exacerbated in tropical regions where high relief and severe rainfall lead to the widespread development of small landslides. Re-growth of the tropical vegetation cover may obscure evidence of slips after only five to ten years. Recognition problems are particularly important if the landslide distribution inventory is compiled by interpretation of the remotely sensed imagery with only limited field checking. Competent interpretation skills and targeted field checking are essential. The accuracy of the final hazard zonation is also sensitive to whether the landslides are analysed in terms of their ‘complete’ area, source area only or as initiation points. Each technique has merits and limitations, depending on the type of landslides prevalent in the region under consideration and the data available to compile the landslide inventory. The use of Geographic Information System (GIS) capabilities in hazard map preparation does at least allow map accuracy to be readily updated as additional data are acquired. Section 3 describes the procedures adopted for compiling landslide inventories using remote sensing and for undertaking the statistical hazard analysis using a GIS.
2.6 National landslide hazard preparedness strategies
Over the past 25 years, several developed countries have incorporated landslide hazard assessments into national or regional hazard preparedness strategies. In some cases this has led to legislation governing new development in landslide-prone terrain. Notable examples cover parts of the United States, Japan, Austria, and Tasmania (Varnes, 1984). Legislative policies range from the provision of guidance on the need for geotechnical investigation to assess site-specific stability conditions, through to controls on the density, size and type of building permitted in certain zones. In contrast, in many developing countries the traditional response to the threat of landsliding has focused on post-event clearance, remedial measures and reactive engineering. This reflects a lack of knowledge regarding the nature of landslide hazards in general and the potential offered by hazard assessment techniques in particular. It is also assumed that emergency response measures are cheaper and more cost-effective than investing scarce resources preparing for uncertain ‘random’ events. A responsive strategy seems to relate expenditure to need and may attract finance from aid agencies. So, all too often national and regional organisations only consider preparedness, mitigation planning and landslide hazard mapping after a catastrophic event that causes loss of life and damage to infrastructure. At such times, emergency actions are often taken to assess and remediate damage to buildings and roads in particular. Local and regional authorities may enact post-failure plans to study the vulnerability of the region to all kinds of slope failures. Such a retrospective approach suffers from a number of severe limitations:
No provision is made to limit injury or loss of life amongst the local population; No provision is made to safeguard the homes or livelihoods of the local population; No provision is made to safeguard institutions, infrastructure or basic utilities that may be of crucial importance for post-disaster response, clearance and remediation; Post-event stabilisation or rebuilding at individual sites takes little account of the regional causes of landslides and may result in inadequate protection against, or even initiate further, landslides; External aid may not be forthcoming for the frequent but widespread small landslide events that cause few, if any, fatalities but significant economic loss and disruption over wide areas; and Ill-informed post-event response may lead to the unwarranted displacement of local populations and inappropriate post-failure avoidance strategies.
The assumption that responsive strategies are more cost effective than those aimed at prediction and prevention is not borne out by the limited cost-benefit analyses that are available. Studies such as that
BGS Technical Report WC/OO/l 1 Issue. 1.0
8 Summary report on landslide hazards preparedness
conducted by Hansen (1984) have demonstrated the importance of landslide hazard assessment and planning initiatives in the developed world. Landslide hazards occur in developed and developing countries; so should sensible hazard preparedness planning. A hazard preparedness strategy should be developed that is designed to provide essential information prior to the catastrophic event occurring. In this way, regional landslide hazard maps can be used as part of a strategy that aims to:
Recognise geographical areas where landsliding has occurred and future landsliding is likely; Understand the scale of the landslide problem; Deal with the problems that may arise because of landslides on marginally stable slopes; Identify constraints on land use by relating land-use zonation to hazard zonation; Regulate new development in hazardous areas through planning controls; Prepare for, modify, andor mitigate the often disastrous effects of landslides on communities and infrastructure by means of appropriate engineering practice and building codes; and Enhance public education and general knowledge regarding these issues.
Whilst landslide hazard reduction can be undertaken as an ‘individual’ exercise, it must also be recognised that landslides often occur as a result of interrelated multiple natural-hazard processes in which an initial event triggers one or more secondary hazard events. Volcanic eruptions, earthquakes, hurricanes and extreme rainfall events all cause landslides. The resulting multiple-hazard problems require a shift in perspective from the mitigation of individual hazards to a broader framework that takes into account the characteristics and effects of all the processes involved. Therefore, in planning landslide hazard reduction programmes, attention should also be paid to the possible relationships between landslides and other hazards. For example, moving a building from a hillside to low lying, flat ground to avoid landslides might increase the risk from floods.
Although earth scientists and engineers undertake the assessment of landslide hazards, responsible government authorities or departments must apply the results through appropriate planning policies and other instruments. It is beyond the scope of this report to recommend in detail how this may best be achieved for specific countries or regions. However, some general principles of landslide hazard reduction strategies are universally applicable. The development and implementation of a national hazard reduction strategy by the responsible government authorities or departments may hinge on a number of important issues, including:
The level of occurrence of landslides and other natural hazards in a region; The need to sustain a ‘robust’ economy that is not repeatedly setback by successive disasters; The need for proper land-use planning and practices for sustainable development; and The existing level of co-ordination between agencies in applying mitigation procedures.
On the basis of collective experience from various national programmes, and as reviewed by Swanston and Schuster (1989), a successful unified national programme of landslide hazard reduction would be likely to include the following key elements:
Identification of a central organisation for management of a landslide loss-reduction programme; Establishment of the limits of responsibility of national, regional, local, and municipal authorities and private sector organisations in dealing with landslide hazards; National efforts to identify and map hazards, define process characteristics, and determine degree of vulnerability and risk; Development of guidelines for the application of reduction techniques to the identified hazards; Development of minimum standards of application and professional practice by professional societies in collaboration with regional and national governments; Regulation of minimum standards of application and professional practice through their periodic review and the upgrading of building codes and land-use practices; Strong support of university research and regional and national government dealing with process mechanics, reduction techniques and warning systems; Provision of a central clearing house for collection and distribution of publications and guidelines to professionals, agencies and local authorities; and Relief and compensation programmes through regional, national and private insurance funds.
BGS Technical Report WC/OO/11 Issue. 1.0
9 Summary report on landslide hazards preparedness

A comprehensive, national hazard reduction programme must clearly be tailored both to the severity of the hazards and to what can be achieved within the funding constraints. A planned, strategic approach is recommended that sets out realistic goals and tasks for making landslide studies, mapping and evaluating the hazard, disseminating information to potential users, and subsequently evaluating the use of the information.
BGS Technical Report WC/OO/l 1 10 Summary report on Issue. 1.0 landslide hazards preparedness
3. HAZARD MAP PREPARATION
The remote sensing and GIS analysis techniques involved in rapid hazard map preparation have been developed during several, sequential, country-specific case study projects in contrasting landscapes. The full details are set out in case study reports on:
Papua New Guinea, where massive landslides are caused by seismicity and heavy rainfall (reported in Greenbaum and others, 1995a); Fiji, where much smaller landslides occur that are triggered by rainfall (reported in Greenbaum and others, 1995b); Jamaica, where medium landslides occur preferentially on the steeper slopes (reported in Northmore and others, 2000); and Slovakia, where a subtler problem of disturbed ground is associated with certain rock types (reported in O’Connor and others, 2000).
3. I Concepts of the remote sensing and spatial analysis approach
The assumption underlying the landslide modelling approach is that past landslide events indicate what is likely to occur in the future. A landslide inventory is therefore required to provide information on where landsliding has occurred. Where such information already exists from historical records or past ground surveys this may suffice. Usually, however, such information is lacking or incomplete. Remote sensing can provide a cost-effective, rapid way to overcome this deficiency and create a landslide inventory. It involves the acquisition of information about the earth’s surface by satellite- or aircraft-borne sensors. Combined with other data, it provides a practical means of mapping the land surface and deriving information about changes that may result from geological, climatic or human activity.
The applicability of various forms of remote sensing data to the study of landslides depends on both the scales of the slope failures and the climate. Conventional satellite data are useful for identifying large landslides such as those in Papua New Guinea. Most other mass movements are smaller and require very high-resolution satellite data or aerial photography. Optical data are often the most informative but only radar can penetrate the cloud-cover that is so frequent and persistent in certain parts of the world where landslides are most likely to occur, such as the tropics.
GIS allow the combination of remote sensing data with other geographically referenced, co-registered digital data on themes such as geology, land-use, forestry, soils, and other controlling factors. Complex spatial correlations can be calculated with ease. Relationships between the various data sets and the observed landsliding can be tested. GIS-based hazard analysis relies on determining the significance of each controlling factor and then assigning quantitative weighting values to them. The controlling factors may then be combined to derive an overall landslide hazard susceptibility map. The analysis is best carried out using a raster GIS as every point within the study area has a classified value for each attribute. This allows detailed analysis of spatial relationships at a very high spatial density and resolution principally determined by the resolution of the remotely sensed data.
There are uncertainties in the modelling approach. It assumes that: (1) remote sensing can be used to identify landslides reliably; (2) controls and triggering mechanisms remain constant with time; and (3) areas previously affected by landsliding therefore continue to be unstable. A landslide inventory obtained in this way should be supplemented by other landslide occurrence data or by field checks that confirm the remote identification of mass-movement features. Once such ground truth data are available, the remote sensing interpretation can itself be improved using this knowledge. The modelling approach, even if it is over-simplistic, has the advantage of being objective and does not rely on any prior knowledge of causes. A schematic representation of the stages involved in landslide hazard modelling and map preparation is shown in Figure 2.
BGS Technical Report WC/OO/11 Issue. 1.0
1 1 Summary report on landslide hazards preparedness


5.
6.
interpretations by reference to published information and through field checking. Use ancillary information to revise and update the preliminary remote sensing interpretations. Transfer interpretation based on any uncorrected aerial photography to a base map, orthorectified aerial photograph or geocorrected satellite image
Unless already captured digitally, digitise and attribute the landslide inventory and convert to a raster format suitable for GIS analysis.
3.2.1 Remote sensing data types
Optical satellites: most older earth observation satellites acquire data at a ground resolution of at best 10 m. These are useful for detecting large avalanche-type landslides, but ineffective for identifymg smaller landslides. New commercial satellite systems like IKONOS provide optical data at higher spatial resolutions of up to 0.75 m. They have along-track pointing that allows stereo images to be acquired and viewed using photogrammetric software. On-screen interpretation of stereo, very high- resolution satellite imagery will allow direct capture of map-accurate, digital landslide information. Whilst data costs are high at present and stereo visualisation still requires specialist software, these limitations are likely to diminish with time as more data become available and prices fall.
Radar satellites: a limiting factor of optical data is its inability to penetrate cloud. Where this is persistent it may prove difficult to obtain useful imagery. Radar has all-weather capabilities and is available from satellite systems at ground resolutions of between 8 and 25 m. Its inherent geometric distortions, intense shadows and grainy look can make the images more difficult to interpret. Image processing can overcome some of these problems but the data types available currently are probably only of use for mapping large-scale mass-movement events. Higher resolution systems are on the horizon. A further aspect of radar that could be useful to these studies is its ability to measure very small ground movements, based on phase changes that can be detected between pairs of images. This technique, known as interferometry, has not yet been applied successfully to landslide studies for a variety of reasons. Refinements to the technique based on the observation of various Permanent Point Scatterers with a strong radar signal are likely to change this in the near future.
Aerial Photographs: detection of typical, small-scale landslides requires data that can be interpreted at a scale of 1 : 25 000 or better. Only very high-resolution satellite imagery or aerial photography can address this need. Most countries have archives of aerial photographs but these vary considerably in type, age, quality and scale. Much of this photography is black and white and was used as the basis for topographic mapping, land use studies and planning. Despite its age, it is often the most appropriate data for landslide studies as it provides information dating from before modern development. Used in conjunction with later photographs, it can be used to identify change. Aerial photographs also provide the advantage of stereoscopic viewing, which greatly assists the interpretation of terrain features. The disadvantages of traditional, analogue aerial photographs include the large numbers of photographs needed to cover a region, the slowness of the interpretation and the slowness of accurately transferring the information to a base map. Such problems can be overcome by using digital photogrammetry to correct large blocks of photography and allow on-screen interpretation in real-world co-ordinates.
3.2.2 Image processing
Before digital imagery can be interpreted, the data need to be processed using an image analysis (IA) system. The first stage is the georectification of the data to the map projection and spheroid of the country under study using either control fkom topographic maps or Global Positioning System data. During this process, the image can also be re-sampled to a map co-ordinate grid and ground resolution commensurate with other data to be used in the GIS modelling. The image should then be enhanced to emphasise the geological features of interest. The main processes relevant to landslides are edge enhancement and contrast stretching. The former emphasises high spatial frequency, local contrast differences and so enhances fine detail. It is especially important for structural interpretation, or when generating large-scale photographic prints. The latter involves redistributing the data values
BGS Technical Report WC/OO/11 Issue. 1.0
13 Summary report on landslide hazards preparedness

in each wavelength band across the full dynamic range of the display system. Images that occupy only a small portion of the possible brightness range appear dark and lack contrast. This process exaggerates small differences inherent in the data to achieve maximum discrimination between surface materials. For a landslide interpretation, the contrast stretch should provide maximum discrimination of bare rock and soil, possibly at the expense of other surface materials. These processes are most effective on optical data. Radar data require more specialised processing beyond the scope of this summary report. All these processes, whilst quantitative, rely on the qualitative judgement and experience of the operator.
3.2.3 Data interpretation and verification
Satellite imagery and aerial photography can provide information on relict and recent landslides, faults, fractures, bedding, geomorphology, erosion, deposition, habitation, cultivation, infrastructure and roads. But even for experienced analysts the interpretation of remotely sensed data has inherent uncertainties. Ground truth and other information should be used to inform and improve the initial interpretation. Field investigations should attempt to delineate landslides and identify landslide-prone areas in order to understand the controlling and triggering factors. They should also seek information on the physical properties of soils, regolith, bedrock and groundwater regimes. Special attention may be given to landscapes that are especially vulnerable to slope failure: steep and hummocky ground; undercut cliffs and river banks; areas of drainage concentration; groundwater seeps; and faulting.
The interpreted information can be annotated onto a transparent overlay attached to a photographic print, or it can be digitised directly on the computer screen using suitable IA or GIS software. The analogue approach’s main advantage is that the interpreter can see the entire image at full resolution whilst at the same time focusing on a particular area. Detail is seen in its true context. However, the interpretation must then be digitised as a separate step. The digital approach has the advantage that digital data are captured directly with true x,y,z co-ordinates. In the case of stereo imagery and aerial photography, special viewing hardware and software are required. If this is not available, systematic interpretation of hard copy aerial photographs is best done using a mirror stereoscope. This allows an interpreter to see the complete area of overlap between two adjacent photographs in stereo at a low magnification. Interpreted features can be plotted manually onto a transparent overlay. Portions of the stereo image can be viewed at higher magnification using binocular attachments. The main problem is the difficulty of accurately transferring interpreted information to a digital base map. One approach is to scan the interpretation and then warp it within the IA system. Until very high resolution space data become widely available, the optimum approach may be to use analogue aerial photography as the interpretation source and conventional digital satellite data as the plotting base. If appropriate, the study of aerial photographs could also be restricted to particular landslides.
3.3 G/S hazard modelling
3.3.1 Concepts
The likelihood that a landslide will occur at a given location depends on controlling factors and triggering events. Controlling factors may be broadly divided into material properties like rock type and terrain conditions such as slope angle. Triggering events could include earthquakes, intense rainstorms, new construction or changes in cultivation. If all the possible controlling factors in an area are understood and mapped, it should be possible to predict where landslides are most likely to occur after a particular triggering event. Given that the emphasis is on rapid assessment, it is not possible to know and map all the potential controlling factors. But even an imperfect knowledge of the controlling factors can provide an indication of the probability of new landsliding events occurring. So, data that already exist and are easily available are digitised, georeferenced in the IA system and brought in to the GIS. The most commonly available data sets include geological, topographic, soils and land cover information. Building a database in a GIS allows many different models to be
BGS Technical Report WC/OO/l 1 Issue. 1.0
14 Summary report on landslide hazards preparedness
developed, tested and updated once new information becomes available. The analyst uses the GIS to quantify the apparent significance of the potential controlling factors to landsliding in the study area.
3.3.2 Raster GIS terminology
Spatial analysis uses the following key terms:
Theme A particular spatial variable that can be characterised by a map, such as geology. Class A sub-division of a theme; for example, limestone is a class within the geology theme.
The analysis examines the correlation between the landslide inventory map and the various themes in the database using cross tabulation. The themes are best represented in a raster format by nominal data. Maps in raster format consist of a regular grid of cells, each containing a number representing the value of the theme in that cell. Neighbourhood queries and other spatial operations around cells and overlay operations between themes can all be performed rapidly and efficiently. Results are obtained for every ground cell, unlike vector GIS analysis where the answers relate to large, variably shaped areas. Nominal data simply use numbers as codes to represent classes. For example, in the geology theme the code value 1 might represent the class limestone and the value 2, granite. Themes such as elevation are numerical measurements on a continuous scale and must be converted to nominal data before the analysis. Dividing the overall range of theme values into a smaller set of classes achieves this. For elevation information, this level slicing might result in classes that represent a range of 100 m, so that 100 m - 200 m becomes code value 1,200 m - 300 m becomes code value 2, and so on.
3.3.3 Building the database
Building the database is the most time consuming operation of landslide hazard modelling. In most instances, the information will exist as paper maps at different projections and scales, as well as tables in reports. For GIS analysis, it must first be converted into co-registered, digital raster data at an appropriate resolution with a common map projection and co-ordinate system. Ideally, the database comprises information on all controlling factors, but in reality, the information available is often limited and of variable quality or detail. Topography and geology must be available, but otherwise the best must be made of what data already exist. This can affect the reliability and utility of the results. Field work and past studies should be used to decide which factors are of local importance. Elevation is a vital data set since all landslides move under the influence of gravity. Elevation data can also be used to generate secondary data sets on slope angle and aspect (facing direction). Digital terrain models (DTMs) can be derived from map contours. Digitised, stereo aerial photography or satellite imagery can be used to produce a digital elevation model that can be edited to give a DTM. If a DTM of adequate resolution already exists, it should be purchased. Generating a DTM in-house is complex, laborious, time-consuming, and costly and needs specialist software. A large-scale geological map is essential, from which key geological units are digitised as raster polygons attributed according to class. If knowledge of the causes of landslides in the area suggests that different lithologies have similar geotechnical properties, these may be combined into one class. The key is to capture information on lithological differences that are likely to affect landsliding, at a resolution appropriate to the analysis.
Other physical properties can be important. Faulting and jointing influence landsliding because they represent zones of weakness. Important, well-defined structures may be digitised from the geological map. A large number of lineaments of less certain structural significance can often be interpreted from the remotely sensed data. A line drawn on a map has no real thickness so it cannot easily be used in the analysis. Consequently, a narrow ‘buffer’ is generated about a fault representing an assumed zone of weakness surrounding it. This is done at the modelling stage. Soils information is rarely available, but enquiries should be made with the national forestry or agricultural department, or with universities. Soil categories that possess similar engineering properties may be combined. Depth to water table and other hydrogeology information are potentially important. A continuous survey may
BGS Technical Report WC/OO/l 1 Issue. 1.0
15 Summary report on landslide hazards preparedness
be digitised in a similar way to elevation contours, and data restricted to specific lithologies digitised as raster polygons.
Land use data are often important, depicting for example the proportion of vegetated to cleared ground. In some cases land use, forestry or agriculture maps may be available from the same sources as soil maps. Paper maps need to be digitised in a similar way to the geology. Alternatively, a land use classification of the remotely sensed data could form part of the project using standard IA software and ground truth information. The digital data so produced can be included in the database easily. Cuttings associated with road construction may themselves cause landsliding. The road network may be digitised from existing maps, augmented by reference to a recent satellite image. A narrow buffer could be generated around the road network for use in the GIS analysis. However, it is probably not appropriate to do so as road construction is more like a triggering effect rather than a controlling factor. Nevertheless, the digitised road network is a valuable way to link hazard to risk using the final hazard map. It may also explain why certain landslides occur where they do.
3.3.4 GIS Analysis
A summary of the generic analysis procedure first developed by Bonham-Carter (1994) follows.
1. Cross tabulate the individual themes with the landslide inventory map
The first step is to examine the amount of landsliding in every class of each theme using cross tabulation. An area cross tabulation is a two-dimensional table summarising the extent of overlap between all possible class combinations of two input theme maps. The landslide inventory map has two classes, “landslide” and “not landslide”. It is systematically cross tabulated with each of the controlling factor theme maps. The result is a table showing the percentage area affected by and not affected by landslides for each class, which compares the incidence of landsliding to the average.
2. Calculate the significance of each theme
The significance of each theme to landsliding in general must be estimated in a consistent way (e.g. how important is the geology theme for predicting landslides?). This can be used to determine if a theme is a controlling factor and, if so, how much weight it should be given in the model. The method used to establish the significance of a theme is known as Cramer’s co-efficient (V) and varies from 0, representing no influence on landsliding, to a maximum of 1, for strong influence on landsliding. Using Cramer’s V, themes having a high correlation with landslides can be given more weight in the hazard model. For example, in the Jamaican case study geology has V = 0.038 whereas aspect has V = 0.024. This indicates that geology is the more important controlling factor and can be given more weight in constructing the Jamaican hazard model.
3. Reclassify each theme map on the basis of the significance of each class within the theme
The significance of each class within each theme must also be addressed (e.g. does alluvium host more or less landslides than the other classes in the geology theme?). This is used firstly to generate a hazard map for individual themes, and secondly to combine all the themes into a final landslide hazard model. The method recommended for determining the significance of each class within a theme is called association and was proposed by Yule (Fleiss, 1991). Association values for a class range from -1 (maximum negative correlation with landslides) though 0 (no influence on landslides) to + 1 (maximum positive correlation). Cross tabulation and assessment of significance are performed for each theme. The themes are then reclassified using their association values for each class to produce a set of maps showing the varying degree of landslide susceptibility within each theme.
4. Sum and normalise the reclassified themes on a cell-by-cell basis to form the final model
If two themes individually influence landsliding then those themes taken together should provide an even better predictor. So, after assessing each theme it is necessary to look at their combined effect.
BGS Technical Report WC/OO/l 1 Issue. 1.0
16 Summary report on landslide hazards preparedness

This is done by adding the individual susceptibility maps, after first weighting each reclassified theme or landslide association map by its Cramer’s V value. The result is then normalised by the sum of the Cramer’s coefficients to give an overall landslide susceptibility model with values between -1 to +1 that can be interpreted in the same way as association. Providing an objective measure of the success of the model is difficult but there are two options; compare the model with the landslide inventory, or with landslides identified by fieldwork. Both operations can be done by visual comparison, or by using a further cross-tabulation analysis.
3.3.5 Hazard map outputs
Interim hazard models are output as simple, colour A4 or A3 plots to compare and assess alternative models against the original landslide inventory. But the final hazard analysis should be produced as a true map that includes cultural and geographical reference information. The components are:
Hazard zones: A raster image showing three or four levels of hazard, each with an assigned colour.
Topography: Either as a vector contour overlay or a shaded relief image generated from the DTM.
Vector data: Roads, rivers, towns, hospitals, police stations, water tanks etc., and map grid.
Map Legend: An explanation of how the map was made, what the colour zones mean, how the map should be used, and its scale and location that can be understood by the non- specialist.
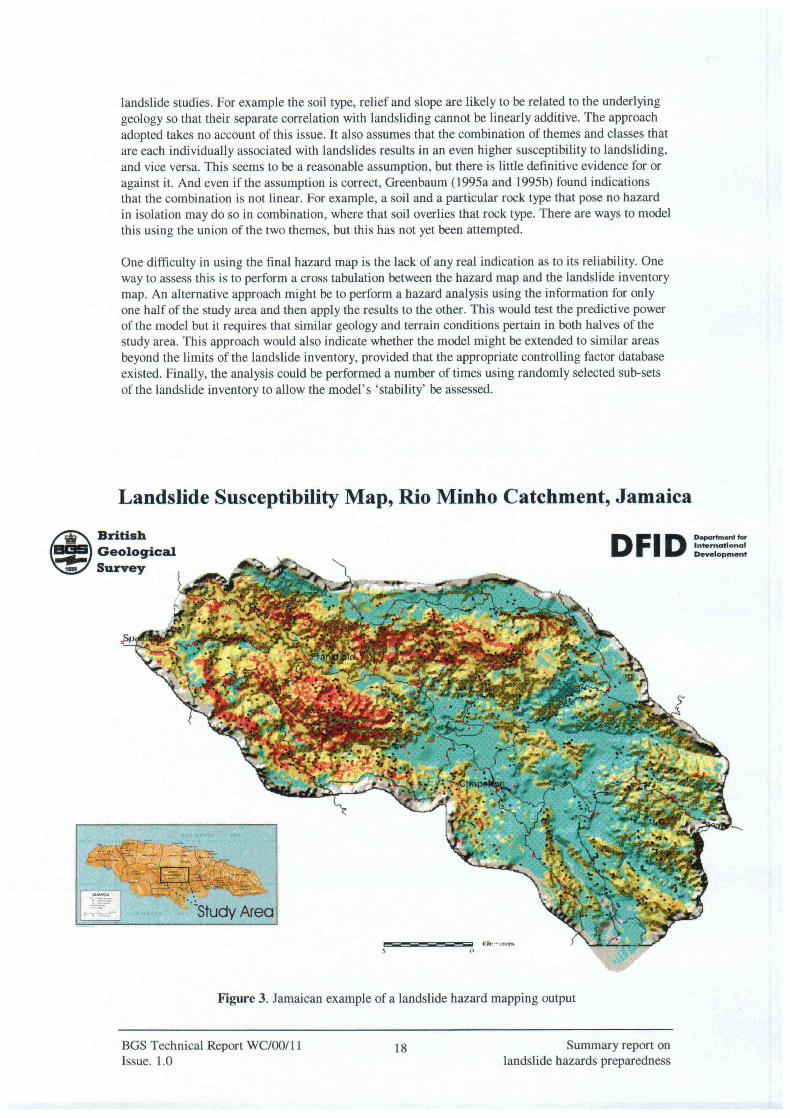
A major consideration is how to represent the topographic information. Conventionally, topography is displayed on maps as contours but they can be difficult to understand for those not familiar with maps and may also crowd the presentation. An alternative is to represent topography as a grey-scale shaded relief image, which provides an easily understood visualisation of the landscape. This image can be generated from the DTM using either IA or raster GIS software. The next problem is how to display the two raster layers together; this can be approached in at least two ways depending on the software options available and the experience of the operator. One approach is to adjust the ‘transparency’ of the hazard colours so that a grey scale shaded relief is visible through them. Alternatively, an intensity-hue-saturation transformation can be used to combine the two, raster images into one where colours are controlled by the hazard zonation but shading is modulated by the intensity of the shaded relief. Both approaches give similar results, but each requires experimentation to achieve the best output. Another useful visualisation technique involves the use of perspective views in which the hazard map can be viewed obliquely from different vantage points and at different angles to the horizon, creating a series of ‘bird’s eye’ views of the terrain. This is done by draping the hazard zones over the DTM. Such presentations can be especially helpful in scenario testing and public education. Figure 3 shows a 1 :75 000 scale hazard map produced for Jamaica, with the hazard zones draped on top of a shaded relief image. Reproduction within an A4 report naturally reduces the detail compared to the full-scale version of the map, but it illustrates the type of product that can be produced.
3.4 Discussion
In most instances, regional landslide hazard maps produced using the methods outlined here will only approximate the ‘truth’. A principal limitation of the method is likely to be the incompleteness of the input controlling factor database. Taking the Slovakian case study as the example, although most of the landslides occurred in the weathered surface layers, no physical property data for this weathered zone was available to be included in the analysis. This deficiency must affect the accuracy of the Slovakian landslide hazard model. However, an advantage of the GIS approach is that the analysis can easily be repeated when additional information becomes available.
Another uncertainty in the analysis is the assumed independence of the themes. Most statistics are designed for use with variables that are independent of one another, but this is unlikely to be true in
BGS Technical Report WC/OO/11 Issue. 1.0
17 Summary report on landslide hazards preparedness

4. IMPLEMENTATION ISSUES
Previous sections of this report have outlined a generic strategy for, and the technical approach to, landslide hazard mapping. Any geological survey or other organisation considering implementing a project will need to develop a detailed implementation plan based on their own needs and resources. Having decided that hazard maps are needed, priority areas must be selected and desk investigations undertaken to establish whether sufficient data on controlling factors exist for the project to succeed. Consideration should be given at the outset to the needs of the potential users and the availability of other resources including suitably qualified staff, computing facilities and funding.
4. I The skills base and training needs
Hazard modelling techniques call for a range of expertise. Organisations need to consider their skills base and training needs in order to assess the costs and benefits, and so ensure that the approach taken matches the resources available.
4.1.1 Remote Sensing
The skills required to build the landslide inventory are varied. A geologist is most suited to the task, preferably one with a geotechnical background, good geomorphological knowledge and certainly with experience of interpreting aerial photography and satellite imagery. If satellite imagery is to be used in the study, then it is preferable that this be processed in-house so that it can be optimally enhanced for landslide identification. The operator should be an experienced image analyst if possible and could well be the same person who will carry out the interpretation. If required, short training courses in image analysis and interpretation with emphasis on geomorphology and terrain modelling can be provided by research institutes and academic centres world-wide, including the British Geological Survey. It takes longer to acquire experience and confidence but the analyst can achieve this on the job, especially if image analysis and interpretation is interspersed with field checking. A geologist with a geotechnical background who already has basic computing skills would make an ideal trainee.
4.1.2 Databasing and GIS
Designing and building the digital database is a major activity of key importance and it requires specialist knowledge. A GIS expert might well provide this and would then have the advantage of fully understanding the data requirements for the subsequent modelling phase. But the digitising necessary to populate the database and GIS would be more cost-effectively undertaken by junior staff under supervision by the database manager. Quality control is an important consideration. The GIS expert is an important member of the team who must work closely with both the project geologist and the project manager. The creation of a landslide hazard map calls on a range of GIS skills including experience of raster GIS for modelling operations and vector GIS for production of the final output. GIS modelling is not a ‘blind’ operation; it requires interaction and the assessment of results to ensure that the end product is realistic. So, the GIS expert will need to have a good basic knowledge and understanding of geology, statistics and mathematics. There is no reason why the databasing and GIS specialist might not be the same person responsible for other tasks, such as image analysis.
The necessary databasing and GIS skills can be obtained through specialist degree, post-graduate training or specially designed short courses. These IT skills are important in many aspects of a modern geological survey’s work programme, so any investment in training will bring wider benefits. It is not essential that the IT expert has a background in geology: indeed, someone with a general computing background may require less training overall. However, anyone with a non-geological background should be given at least basic, on-the-job, geological and geotechnical training.
BGS Technical Report WC/Oo/ll Issue. 1.0
19 Summary report on landslide hazards preparedness

4.1.3 Other Considerations
The long-term sustainability of the programme will, amongst other things, depend on the retention of skilled IT staff. This is difficult in any organisation since IT specialists are increasingly in demand and may have attractive commercial job opportunities both within geology and beyond. Government organisations may find it difficult to compete on salary. The best way to prevent critical staff loss is probably a combination of job satisfaction, good working conditions and payment of a skills retention allowance. Ongoing IT training and recruitment should be implemented as a contingency measure.
4.2 Computer hardware and software requirements
The following is a list of the computing requirements for landslide hazard modelling:
A high specification PC with high-resolution monitor, digitiser, scanner and colour plotter; Digitiser and scanner software, with raster to vector conversion and line-following capability; Image analysis software (e.g. Erdas Imagine, ER Mapper) for image processing/interpretation; A raster GIS (e.g. Idrisi, ILWIS) and a spreadsheet (e.g. Microsoft Excel) for analysis; and An optional vector GIS (e.g. MapInfo, ArcView) for map production and output.
Image analysis packages increasingly feature advanced GIS functionality, and vice versa.
4.2.1 Hardware Requirements
Other than a high-level PC required to run the image analysis software, most hardware may already be available. In this case, the only additional cost will be the software and possibly upgrading of memory and disk storage. If it is necessary to purchase hardware, then this should be considered in terms of the broader benefits that the extra computing facilities bring to the organisation. Although costs have reduced significantly in recent years, the total hardware/software requirement of the image analysis system may still be substantial. The investment may not be justified if the proposed landslide hazard mapping were the only application and any such decision should be taken in the context of the wider needs of the organisation as a whole. Other applications of remote sensing include geological mapping, mineral exploration, groundwater and waste management and environmental monitoring. Organisations not able to make this investment should consider whether it is feasible to use the facilities of another institution (e.g. a university) on a collaborative basis.
4.2.2 Software Requirements
It is not critical that any particular software package be used; the only requirement is that it has the functionality to achieve the task and deal efficiently with the data sets. If software is already available to the project, then it might well be appropriate to make use of it. If new software is to be purchased then consideration needs to be given to various local issues. These include its compatibility with systems already in use, the presence of a local agent for support/maintenance, and the supplementary uses to which the new systems may be put. Although the requirement list at 4.2 implies that the three operations of image processing, GIS modelling and GIS presentation are separate activities carried out using different systems, software systems can increasingly perform more than one of these tasks. Certain image analysis systems now have the capability to perform all three operations - although not necessarily in the most efficient manner. The latest GIS packages offer the functionality of both raster and vector GIS (e.g. Arcview’s Spatial Analyst) at low cost. In addition, all relevant software could now be run on a single high-level PC. These trends will serve to increase operational efficiency by eliminating the need to convert data formats between software packages and transfer data between systems. Such an integrated software system would have significant advantages at both the analysis and the map output stages, permitting the generation of customised map products on demand.
BGS Technical Report WC/OO/l 1 20 Issue. 1.0
Summary report on landslide hazards preparedness
4.3 Project planning
The first stage in implementing a landslide hazard preparedness strategy is to ensure that all parties from regional and local government who have a potential interest, plus representatives of academic institutes and commercial firms if appropriate, become involved. They need to appreciate the scale of the landslide problem and the benefits and limitations of landslide hazard assessment. To this end, it is essential to involve the users in all stages of the hazard assessment programme and the best way to do this is by forming a Steering Committee. As effective use of the information may ultimately require changes to the law, the involvement of government decision-makers from the outset might be also helpful. Those people and organisations who will ultimately be called upon to implement the results of landslide hazard assessments should have an input to the definition of the problem, the selection of investigation methods and the conclusions reached. In this way users will identify with the study and be motivated to apply its findings. The active interest and involvement of outside parties ensures that the scope and objectives are designed to deliver products that are useful to, and used by, those for whom they are intended. The form and content of the final hazard zonation map should therefore be appropriate to these users needs and capabilities. Multi-party endorsement also spreads a sense of ‘ownership’ to all concerned and raises the profile of the project sufficiently to help win funding. As the Steering Committee will have members with only limited understanding of both the geological problem and the scientific approach, it is important to explain the method’s limitations and how the product can and cannot be used. Hazard zonation maps should directly assist these users in taking decisive action concerning practical preventative or corrective measures; they should aid land-use planning decisions, construction design, environmental impact assessments and legislation. The preliminary rapid hazard zonation maps that are the focus of this study provide a valuable basis for initial regional hazard mitigation planning but it must be stressed that they cannot be applied to site specific problems; the limited validity of the outputs should be made clear.
Good project planning is always important, but this is especially true of landslide hazard mapping where the output is intended to be used by various outside individuals and organisations. This pre- project planning phase should result in an outline design specification for the hazard map. This will indicate the types of plots and maps to be produced, the scale of reproduction and list the locational, cultural and infrastructural information to be included. Consideration should also be given to other forms of output like virtual reality that might form part of an educational package. Although this preliminary specification will undoubtedly change, it will set an initial strategy. The pre-project phase will also lead to the identification of study areas. The project’s requirements for computing facilities and professional staff must be considered and costed in a detailed project proposal. There are various approaches to project planning and no specific recommendation is given here. What is important is to have clear and realistic ideas about the project’s objectives and time scales. Some general elements of any project plan are listed below, based in part on the Project CycleLogical Framework approach that is used by the UK’s Department for International Development. This process will deliver a focused, practical project and help convince potential funding agents that the project is achievable.
Goal The higher level objective to which the project hopes to contribute. It is useful to state this as it may help funding departments to justify the award of funds in terms of their own policy objectives (which the project proposers would be well advised to consult). It may be little more than a ‘motherhood’ statement, like: ‘Protect population and infrastructure from natural and man-made disasters’.
Purpose Clearly defined sustainable benefits that will be gained by successful implementation of the project. These may include effects beyond the direct control of the project (e.g. ‘to make available information on potential landslide hazards for use in development planning and disaster contingency/mitigation’ ).
outputs Unlike the Goal and Purpose, the project is held accountable for delivering Outputs. These are not the same as ‘deliverables’ and may be better thought of as an immediate desired effect (e. g , ‘better informed decision-maker s, planners, emergency services’). Tangible deliverables (e.g. the maps themselves) are better considered as ‘verifiable indicators’ (see below) of the Outputs.
BGS Technical Report WC/OO/l 1 21 Issue. 1.0
Summary report on landslide hazards preparedness
Activities
Indicators
Assumptions
Team
Resources
Finances
Specific actions to be undertaken in order to achieve each stated Output. There will usually be one main Activity for each Output, subdivided into an ordered series of individual tasks. They should be described in a narrative and shown graphically on a bar (Gantt) chart. Each task is given a time frame, milestone(s) and team member responsible. For large projects, each component (e.g. a hazard map for a specific region) may be described as a separate phase.
Measures of project progress and the achievement of milestones, usually termed ‘verifiable indicators’, should be provided for each Activity and Output. They are specific interim products, actions or tangible records and they should be quantifiable (e.g. ‘digital data capture for X map sheets by Month Y’).
Internal or external factors that can influence the project’s success should be considered and listed. Success to at least the Output level requires appropriate contingency planning to deal with any damaging, uncontrolled event.
All staff necessary to carry out the project should be described in terms of skills and specialisms. The plan should identify whether they exist in-house, need to be trained, or need to be recruited. It should describe the project’s management and responsibility structure, external links and the steering committee’s role.
Facilities, equipment and data needed by the project should be specified.
The project should be fully costed to take account of all elements. This will include: staff costs (including overheads); training; field costs (including transport and living expenses); computing hardware and software (including ongoing maintenance); purchase of imagery/photography; consumables etc.
The form that the proposal takes will depend on the requirements of the department or funding agency. A good project plan, besides being required to secure funding, is also a tool for project management. However, it should not be so inflexible that it cannot be adapted to deal with specific events or delays that occur. Experience gained at each stage will help improve subsequent plans.
4.4 Public awareness
For the project to be successful the results must not only be applied but the concept of landslide hazard mapping must also gain acceptance in the community. An active and enthusiastic Steering Committee may also serve to raise public awareness and understanding. Such publicity can act for the good of the project provided it is planned and not merely responsive. However, one of the pitfalls of informing the general public about hazards is that the information is open to misinterpretation, which can result in ‘bad press’, public alarm and ‘planning blight’ of certain areas. So, a campaign of public awareness, dissemination and education might therefore be required as part of the project plan to pre-empt this reaction. It is important that everyone involved in and affected by the project, from the emergency services, to the insurance industry, to the population at large should understand in general terms what hazard maps are, what they are used for, and what they do - and don’t - reveal.
BGS Technical Report WC/OO/11 Issue. 1.0
22 Summary report on landslide hazards preparedness
This report is the product of successive three-year research projects on landslide hazard modelling undertaken by the British Geological Survey under support from the UK Department for International Development. The original work focused on geologically very young and active terrains. The second project (R6839) was aimed at extending the methodology to other regions in order to develop a generic approach that could be adapted and applied to any developing country. This report summarises such a strategy, but it must be stressed that it provides no more than a skeleton around which to develop a national programme. The reasons for this include:
Differences in the scale and causes of the landslide problem; Climatic and geographical differences; Consequent variations in the usefulness and availability of different types of remote sensing data; The availability of information layers relevant to landslide modelling; The local technical and especially Information Technology skills base; Local computer hardware and software systems and support; Political and/or local government constraints; and Funding.
There is a significant volume of published literature on the modelling of landslide hazards, including a number of variants on the approach presented here. These differences reflect both the stance taken by different workers and the uncertain nature of the science with which we are dealing. There will always be a compromise between the effort that goes into the model and the reliability of the results. The technique suggested here charts a middle course; one that attempts to provide a useful product with a moderate effort, as this probably represents the lowest common denominator on which most implementations can build. It recognises that local circumstances will dictate what is possible and useful. It allows users to develop their own approach based on the method suggested. It recognises that technology is fast changing. Ikonos-2 satellite imagery did not become available in time to be used in these case studies, but it is appreciated that this and other similar very high spatial resolution imagery may well prove to be the way forward. This is important, since a good landslide inventory is fundamental to developing a reliable model of the hazard.
For those considering developing a landslide hazard work programme, we suggest adopting a staged approach. The initial area chosen should be regarded as a test bed to develop and evaluate techniques and outputs. Following this, a review of the results and further consultation with the potential users should be undertaken in order to define a more formal approach to be adopted in subsequent phases. As GIS becomes more widely available and used, we see there being much greater interaction with other government, university and commercial users since many of the data sets will be of common interest. This is particularly true of digital terrain models but we see it extending to land use data and geocorrected aerial photography and Earth observation imagery. It will have many benefits including the availability of new data from external sources to use within the project. Since database building is one of the major inputs, such shared involvement could result in significant savings in time and money. Finally, we wish to stress again the importance of collaborating with any other parties who have an interest in the work or an involvement at the take-up level. Not only will this ensure that the products are useful to and understood by those they are intended for, but it will also create a feeling of shared intellectual ownership and thus encourage their adoption. The success of such ventures can only be measured in terms of the practical use to which the results are put.
This work was funded under the Knowledge & Research Programme of the Infrastructure and Urban Development Department, DFID. Many people contributed to the individual case studies, including all the authors of the case studies listed in the references. Collaborators from participating institutes
BGS Technical Report WC/OO/l 1 Issue. 1.0
23 Summary report on landslide hazards preparedness

provided invaluable local knowledge in Papua New Guinea, Fiji, Jamaica and Slovakia. The report is published with permission of the Director, British Geological Survey (NERC).
REFERENCES
Aleotti, P. and Chowdhury, R., 1999. Landslide hazard assessment: summary, review and new perspectives. Bulletin of Engineering Geology and Environment, Vol58, 21 -44.
Bonham-Carter, G. F., 1994, Geographic Information Systems for Geoscientists: Modelling with GIS. Pergamon Press (Elsevier Science Ltd.), Oxford, 398p.
Fleiss, J. L., 1991, Statistical Methods for Rates and Proportions. Wiley & Sons, New York, 321p.
Greenbaum, D., 1995, Project Summary Report: Rapid methods of landslide hazard mapping. British Geological Survey Technical Report WC/95/30, 12p.
Greenbaum, D. and others., 1995a, Rapid methods of landslide hazard mapping: Papua New Guinea case study. British Geological Survey Technical Report WC/95/27, 1 12p.
Greenbaum, D. and others., 1995b, Rapid methods of landslide hazard mapping: Fiji case study. British Geological Survey Technical Report WC/95/28, 103p.
Greenbaum, D. G, O’Connor, E. A., Northmore, K. J., Jordan, C. J., Marchant, A. P., Marsh, S. H. and McDonald, A. J. W. 2000. An implementation strategy for landslide hazard preparedness. British Geological Survey Technical Report WC/OO/8,54pp.
Hansen, A., 1984. Landslide hazard analysis. In Slope Instability, Brunsden, D. and Prior, D. B. (eds). John Wiley & Sons. 523-602
Hutchinson, J. N., 1993. The assessment of sub-aerial landslide hazard. In Landslides Hazard Mitigation with Particular Reference to Developing Countries: Proceedings of a Conference held on 12 November, 1993 at the Royal Society, London, 57-66.
Hutchinson, J. N., 1998. General report: Morphological and geotechnical parameters of landslides in relation to geology and hydrogeology. In Proceedings of the Fifth International Symposium on Landslides, C. Bonnard (ed), A.A. Balkema, Rotterdam, Netherlands, Vol 1, 3-35.
Jones, D. K. C., 1992. Landslide hazard assessment in the context of development. In Geohazards Natural and Man-made, McCall, G. C. H., Laming, D. J. C. and Scott, S. C. (eds). Chapman & Hall, London. 117-141.
O’Connor, E. A., Kovacik, M., Northmore, K. J., Greenbaum, D., Marchant, A. P., Jordan, C. J., Macdonald, A. J. W., Kacer, S., Kovak, P. and Marsh, S. H. 2000. Landslide hazard mapping: Slovakia case study. British Geological Survey Technical Report WC/00/9,29pp.
Northmore, K. J., Ahmed, R., O’Connor, E. A., Greenbaum, D., Macdonald, A. J. W., Jordan, C. J., Marchant, A. P., and Marsh, S. H. 2000. Landslide hazard mapping: Jamaica case study. British Geological Survey Technical Report WC/OO/lO, pp. 41.
Schuster, R. L. 1978., Introduction (Economics of slope movements). In Landslides: analysis and control. Schuster, R.L. and Krizek, R.J. (eds). Special Report 176, Transportation Research Board, 1978, National Academy of Sciences: Washington, D.C. 1-10
Swanston, D. N. and Schuster, R. L., 1989. Long-term landslide hazard mitigation programmes: structure and experience from other countries. Association of Engineering Geologists Bulletin, Vol. 26, NO. 1, 109-133.
Varnes, D. J., 1978. Slope movement types and processes. In Landslides: analysis and control. Schuster, R. L., and Krizek, R. J. (eds). Special Report 176, Transportation Research Board, 1978, National Acadamy of Sciences, Washington, D.C. 11-33.
BGS Technical Report WC/OO/l 1 Issue. 1.0
24 Summary report on landslide hazards preparedness
Varnes, D. J., 1984. Landslide hazard zonation: a review of principles and practice. IAEG Commission On Landslides And Other Mass Movements, UNESCO, Paris, 63 pp.
BGS Technical Report WC/OO/11 Issue. 1.0
25 Summary report on landslide hazards preparedness


![A Combined Model for Landslide Susceptibility, Hazard and ... · 18]. However, landslide hazard and risk evaluation are not a frequent topic in recent landslide literature [19, 20].](https://static.fdocuments.us/doc/165x107/5e744b3821bc3621652d4065/a-combined-model-for-landslide-susceptibility-hazard-and-18-however-landslide.jpg)


