Waws january 2015-nikolay-novozhilov
19
WEB ANALYTICS WEDNESDAYS SINGAPORE JANUARY 2015
-
Upload
jeremy-creighton -
Category
Data & Analytics
-
view
54 -
download
0
Transcript of Waws january 2015-nikolay-novozhilov

WEB ANALYTICS WEDNESDAYS SINGAPORE
JANUARY 2015

A/B TESTING AND THE MOST COMMON PROBLEMS, A LOOK AT STATISTICS AND THE WAYS TO GET IT WRONG
Nikolay Novozhilov - Product director of data platforms @ Wego.com.
Nikolay is building big data capabilities at Wego.com, the Asia Pacific and the Middle East's leading travel metasearch engine. He has 7+ years of experience in data analytics working for IT startups and previously for consulting. Nikolay received an MBA from INSEAD in Singapore and before that lived and worked in Moscow.

A/B testing and problems with statistics
Web Analytics Wednesday, Singapore
Nikolay Novozhilov, Wego.com
www.novozhilov.co

Is there a problem with A/B testing?

Imaginary uplifts
100 tests done, 10 successful, 10% uplift each…
…expect 159% growth!
Expectation Reality

Why?
… and what to do about it

Lies, damned lies, and statistics
All different! All based on assumptions!!!
Tool Test used
Optimizely Two-tailed sequential likelihood ratio test with false discovery rate controls
Google Analytics Bayes estimate with uniform beta prior
VWO Intersection of confidence intervals for binominal distribution
Leanplum Confidence intervals at p=5%, unknown statistic
Usereffect Chi-square statistics
Commerce Sciences Welch's t-test
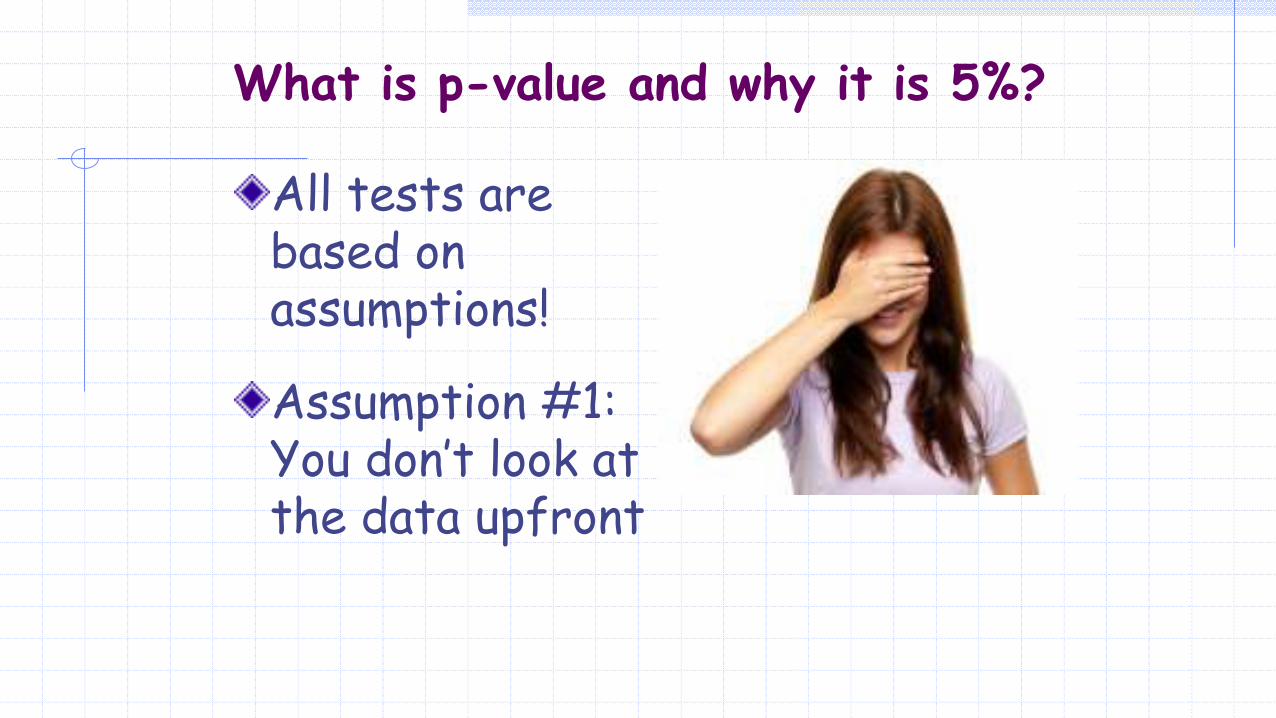
What is p-value and why it is 5%?
All tests are based on assumptions!
Assumption #1: You don’t look at the data upfront

What happens if you look?
I played Monte Carlo in Excel
And here is the result:
• 5% p-value
• 1000 “users” in each sample
• CR of 2%
• A wins over A 29% of the times!

What do you do about it?
Don’t look! (just kidding)
Google “O'Brien & Fleming interim analysis” (no, still kidding )
Keep calm, more stuff coming!

“My test on Buy button showed interesting results…”
Buy Now! Buy Now! Buy Now! Buy Now!
Buy Now! Buy Now! Buy Now! Buy Now!
Buy Now! Buy Now! Buy Now! Buy Now!
-3% -23% +6% -9%
-2% +22% -11% -14%
-1% +9% -12% -1%
10000 users in each variant, base CR=1%
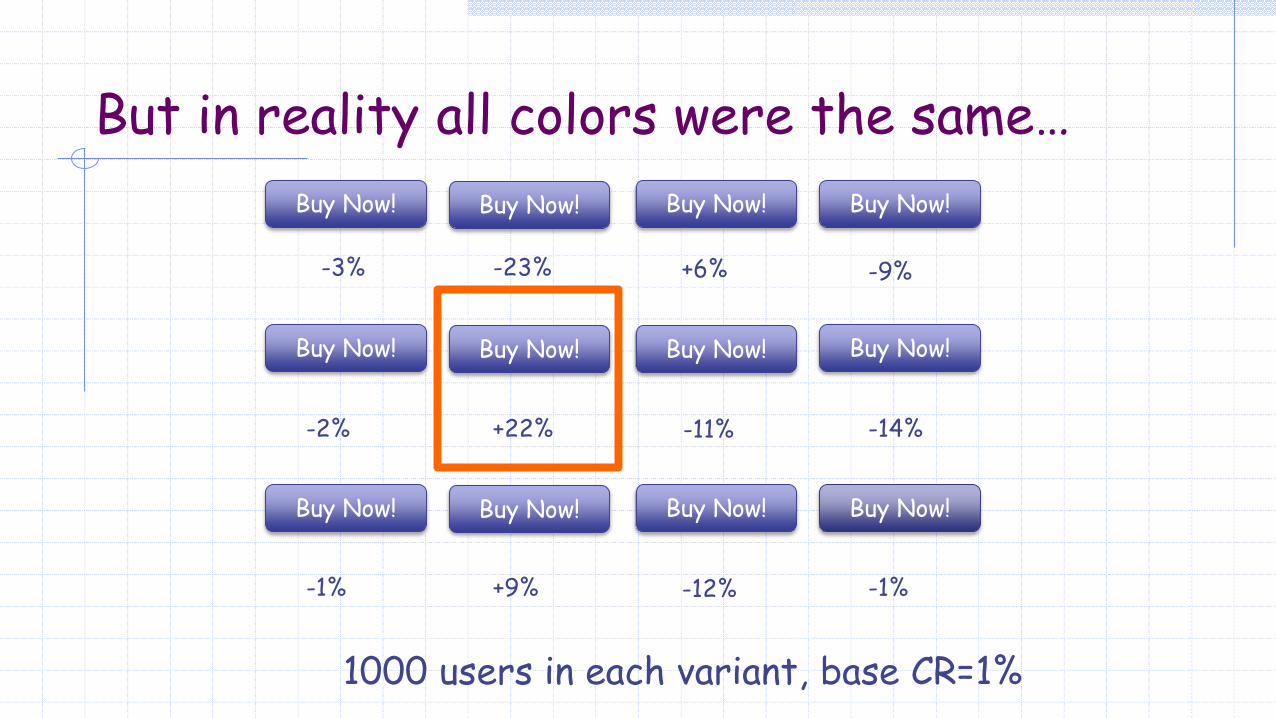
But in reality all colors were the same…
Buy Now! Buy Now! Buy Now! Buy Now!
Buy Now! Buy Now! Buy Now! Buy Now!
Buy Now! Buy Now! Buy Now! Buy Now!
-3% -23% +6% -9%
-2% +22% -11% -14%
-1% +9% -12% -1%
1000 users in each variant, base CR=1%

The real problem!
Multivariate testing
Multiple comparisons
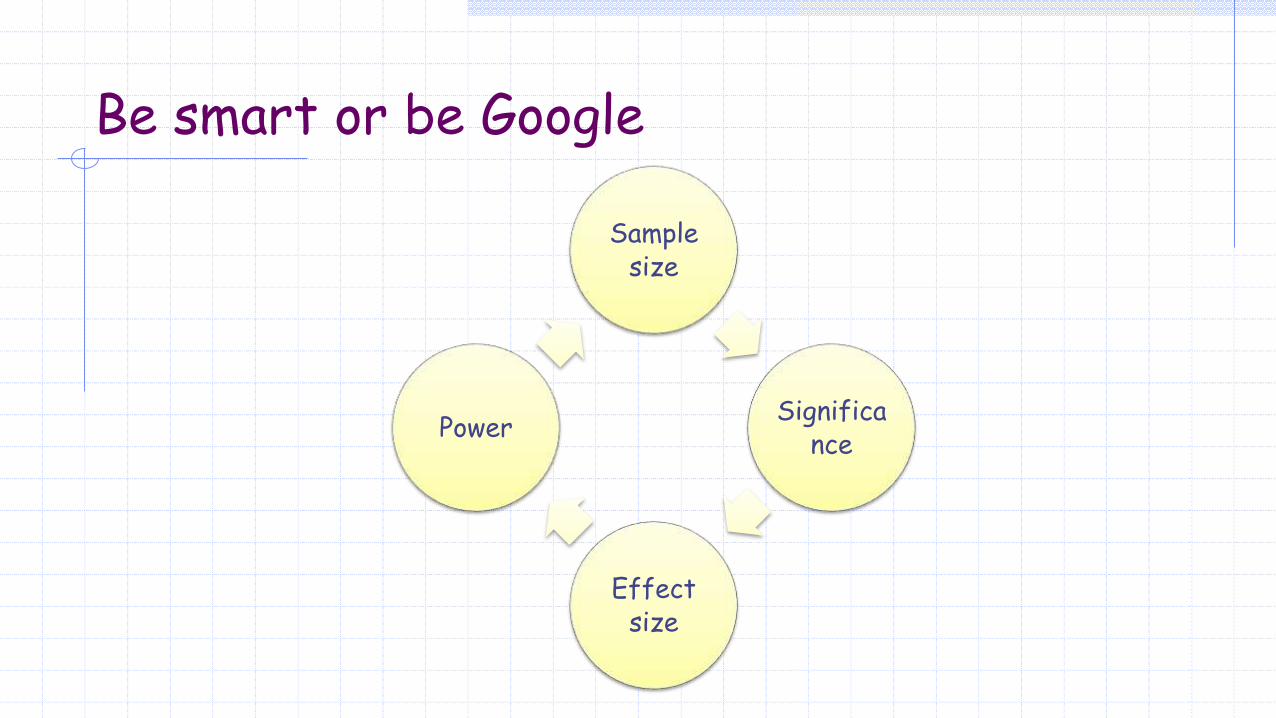
Be smart or be Google
Sample size
Significance
Effect size
Power

Start with a good hypothesis!
But people are good in finding plausible explanations for data!
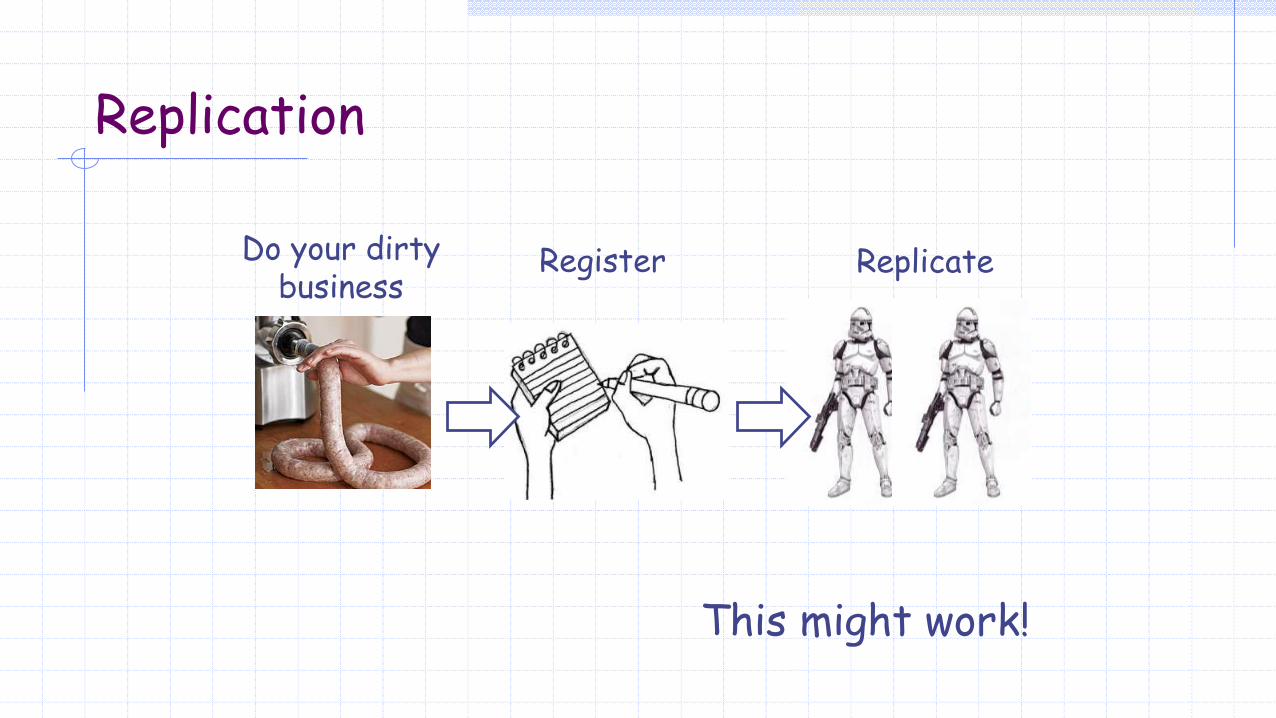
Replication
Do your dirty business
Register Replicate
This might work!

Stop math, I’m a web designer!

Visual way of doing it
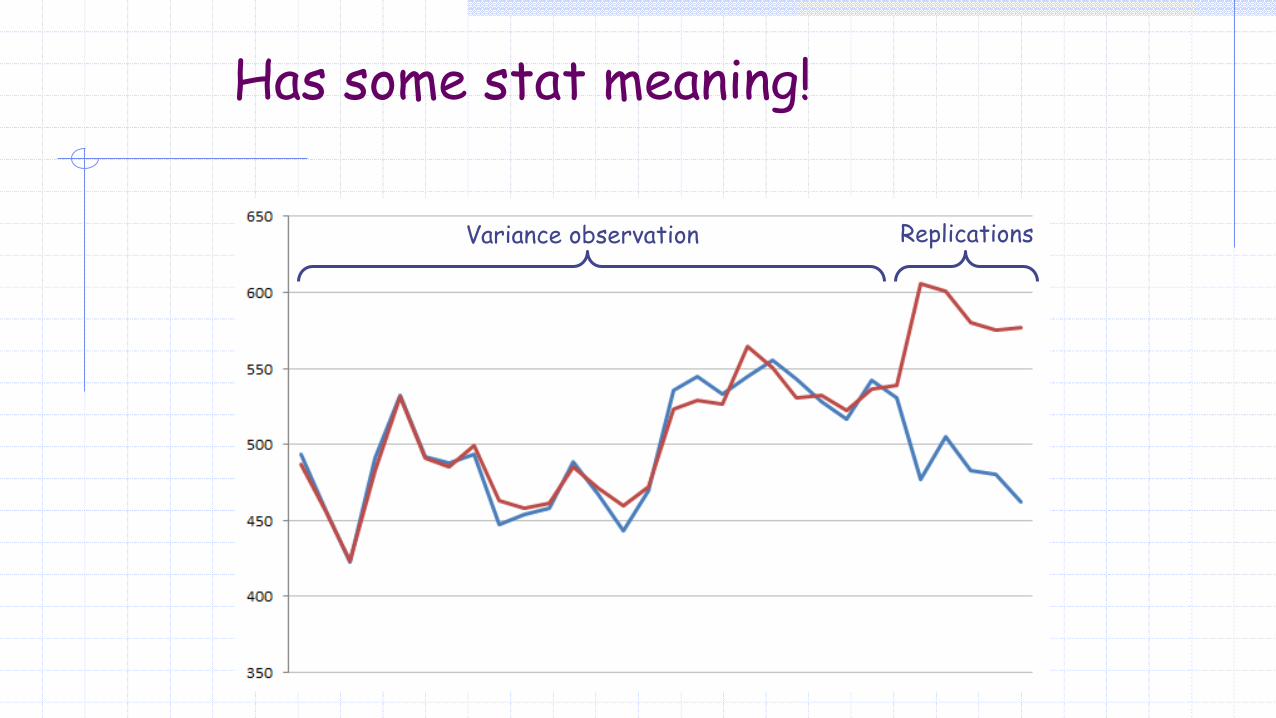
Has some stat meaning!
ReplicationsVariance observation