WAVES OVERTOPPING A WIDE-CRESTED · PDF fileEurOtop manual (2007) a rule of thumb is given ......
9
1 WAVES OVERTOPPING A WIDE-CRESTED DIKE Toon Verwaest 1 , Philippe Vanpoucke 2 , Marc Willems 1 , Tom De Mulder 1 If a coastal dike has a crest width of more than say a few meters, then wave overtopping will be significantly reduced due to the crest width, because kinetic energy can be dissipated on the crest and water on the crest can flow back towards the seaside. In coastal towns built on dune belts often a wide-crested coastal dike was constructed as both coastal protection and sea promenade. However, quantifying the effect of such a wide crest on wave overtopping is not straightforward because no empirical overtopping formulas are given in literature for this kind of configuration. Therefore physical scale model research was carried out. Also a simplified theoretical model concept was used based on an energy balance formulation of a single overtopping wave. Combining the scale model measurements with the theoretical model, a semi-empirical formula was developed and calibrated. Keywords: overtopping; dike; wide-crested PROBLEM DEFINITION Introduction The region of Flanders in Belgium borders the southern part of the North Sea. In winter time, from September until March, storm surges occur in this area caused by depressions traveling over the North Sea. The coastal zone of Flanders is low-lying and densely populated. It is an area with a relatively high risk of damage and casualties caused by coastal flooding. There are both risks associated with large scale flooding of the polder area in case of breaching through the sea defence line, as well as risks for property and people situated close to the coastline especially in the coastal towns where part of the dikes are built up with apartment houses and people live in rooms with a sea view. In the case of a storm surge overtopping over the dike can reach the apartment houses and in worst case scenarios damage and casualties may result, see Fig. 1. One can observe a horizontal distance of several tens of meters between the seaward revetment and the apartment houses. Therefore we call these dikes wide- crested, in contract with the typical grass dikes in rural areas that have a crest width of only a few meters. These wide-crested dikes in coastal towns are often built on former dune belts. Today they function as a coastal protection but most of the time as a recreational promenade with high importance for the touristic sector. Figure 1. Picture of a typical Flemish coastal dike during moderate storm conditions. 1 Flanders Hydraulics Research, Berchemlei 115, 2140 Antwerpen, Belgium 2 Research unit Coastal Engineering, Ghent University, Technologiepark 9, 9052 Gent, Belgium
Transcript of WAVES OVERTOPPING A WIDE-CRESTED · PDF fileEurOtop manual (2007) a rule of thumb is given ......

1
WAVES OVERTOPPING A WIDE-CRESTED DIKE
Toon Verwaest1, Philippe Vanpoucke2, Marc Willems1, Tom De Mulder1
If a coastal dike has a crest width of more than say a few meters, then wave overtopping will be significantly reduced due to the crest width, because kinetic energy can be dissipated on the crest and water on the crest can flow back towards the seaside. In coastal towns built on dune belts often a wide-crested coastal dike was constructed as both coastal protection and sea promenade. However, quantifying the effect of such a wide crest on wave overtopping is not straightforward because no empirical overtopping formulas are given in literature for this kind of configuration. Therefore physical scale model research was carried out. Also a simplified theoretical model concept was used based on an energy balance formulation of a single overtopping wave. Combining the scale model measurements with the theoretical model, a semi-empirical formula was developed and calibrated.
Keywords: overtopping; dike; wide-crested
PROBLEM DEFINITION
Introduction The region of Flanders in Belgium borders the southern part of the North Sea. In winter time, from
September until March, storm surges occur in this area caused by depressions traveling over the North Sea. The coastal zone of Flanders is low-lying and densely populated. It is an area with a relatively high risk of damage and casualties caused by coastal flooding. There are both risks associated with large scale flooding of the polder area in case of breaching through the sea defence line, as well as risks for property and people situated close to the coastline especially in the coastal towns where part of the dikes are built up with apartment houses and people live in rooms with a sea view. In the case of a storm surge overtopping over the dike can reach the apartment houses and in worst case scenarios damage and casualties may result, see Fig. 1. One can observe a horizontal distance of several tens of meters between the seaward revetment and the apartment houses. Therefore we call these dikes wide-crested, in contract with the typical grass dikes in rural areas that have a crest width of only a few meters. These wide-crested dikes in coastal towns are often built on former dune belts. Today they function as a coastal protection but most of the time as a recreational promenade with high importance for the touristic sector.
Figure 1. Picture of a typical Flemish coastal dike during moderate storm conditions.
1 Flanders Hydraulics Research, Berchemlei 115, 2140 Antwerpen, Belgium 2 Research unit Coastal Engineering, Ghent University, Technologiepark 9, 9052 Gent, Belgium
COASTAL ENGINEERING 2010 2
General methodology If a coastal dike has a crest width of more than say a few meters, then wave overtopping will be
significantly reduced due to the crest width, because kinetic energy can be dissipated on the crest and water on the crest can flow back towards the seaside. However, quantifying the effect of such a wide crest on wave overtopping is not straightforward because no empirical overtopping formulas are given in literature for this kind of configuration (EurOtop manual, 2007). Therefore physical scale model research was carried out in a wave flume at Flanders Hydraulics Research. Also a simplified theoretical model concept was used based on an energy balance formulation of a single overtopping wave. Combining the scale model measurements with the theoretical model, a semi-empirical formula was developed and calibrated.
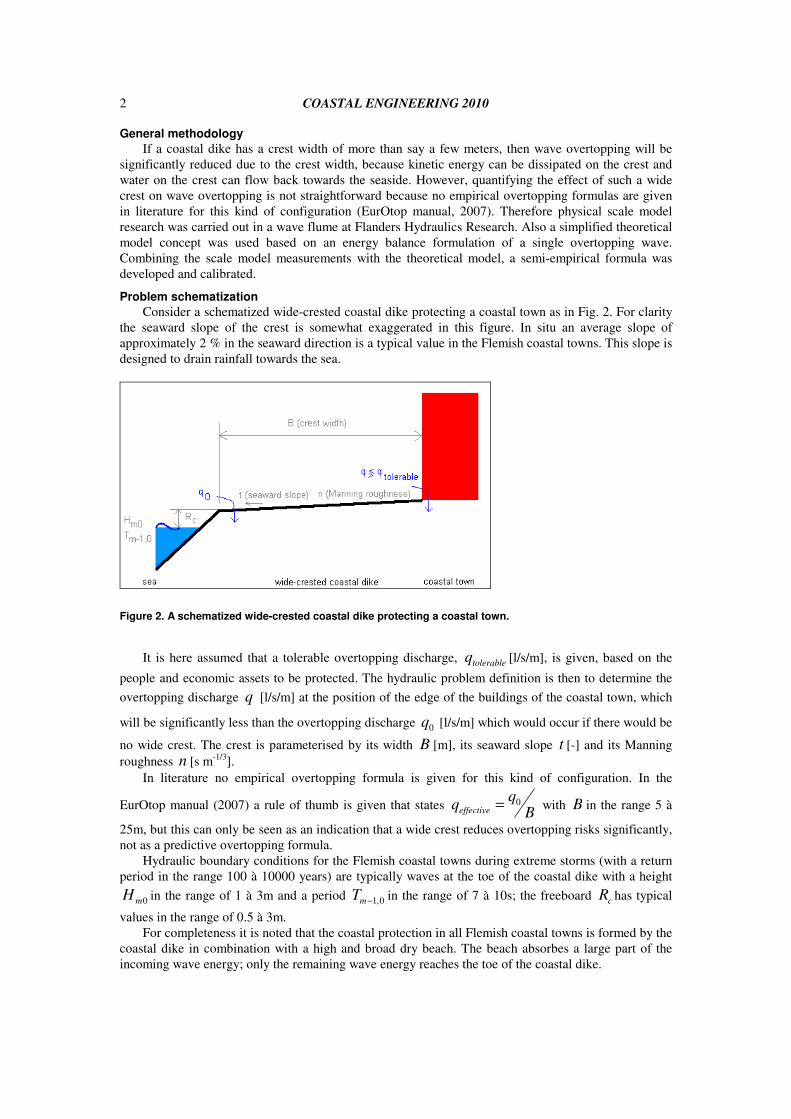
Problem schematization Consider a schematized wide-crested coastal dike protecting a coastal town as in Fig. 2. For clarity
the seaward slope of the crest is somewhat exaggerated in this figure. In situ an average slope of approximately 2 % in the seaward direction is a typical value in the Flemish coastal towns. This slope is designed to drain rainfall towards the sea.
Figure 2. A schematized wide-crested coastal dike protecting a coastal town.
It is here assumed that a tolerable overtopping discharge, tolerableq [l/s/m], is given, based on the
people and economic assets to be protected. The hydraulic problem definition is then to determine the overtopping discharge q [l/s/m] at the position of the edge of the buildings of the coastal town, which
will be significantly less than the overtopping discharge 0q [l/s/m] which would occur if there would be
no wide crest. The crest is parameterised by its width B [m], its seaward slope t [-] and its Manning roughness n [s m-1/3].
In literature no empirical overtopping formula is given for this kind of configuration. In the
EurOtop manual (2007) a rule of thumb is given that states Bqqeffective
0= with B in the range 5 à
25m, but this can only be seen as an indication that a wide crest reduces overtopping risks significantly, not as a predictive overtopping formula.
Hydraulic boundary conditions for the Flemish coastal towns during extreme storms (with a return period in the range 100 à 10000 years) are typically waves at the toe of the coastal dike with a height
0mH in the range of 1 à 3m and a period 0,1−mT in the range of 7 à 10s; the freeboard cR has typical
values in the range of 0.5 à 3m. For completeness it is noted that the coastal protection in all Flemish coastal towns is formed by the
coastal dike in combination with a high and broad dry beach. The beach absorbes a large part of the incoming wave energy; only the remaining wave energy reaches the toe of the coastal dike.

COASTAL ENGINEERING 2010
3
PHYSICAL SCALE MODEL EXPERIMENTS
Description A typical Belgian coastal profile geometry was scaled down 1/30 and materialised as a fixed bed in
a wave flume (length 32 m, width 0.70 m, height 0.86 m). Irregular storm waves with a standard Jonswap spectrum were generated. Approximately 250 different scenarios were run with variations of the water level, the incoming wave height and wave period at the toe of the coastal dike, the crest width, the seaward slope of the crest and also the roughness of the crest surface. The geometry of the foreshore, of the revetment and the crest height of the revetment were kept constant: the foreshore slope is determined as 1/50 representative of the slope of an eroded beach; the revetment has a 1/2.3 slope; the height of the top of the revetment above the toe of the coastal dike is 13.4cm. Variations of the following parameters were tested: • Crest width B : 0m, 0.5m, 1m, 2m, 4m, 6m • Seaward slope of crest t : 0%, 0.42%, 0.83% • Freeboard cR varies in the range 2 à 6cm
• Waves at the toe of the coastal dike: height 0mH varies in the range 5 à 8cm; period 0,1−mT varies
in the range 1.4 à 1.6s Due to the relatively shallow foreshore significantly higher waves were generated at the wave paddle in comparison with the waves at the toe of the structure. The ratio of the wave height at the paddle and the water depth at the toe is in the range 0.5 à 1, which according to van Gent (1999) can be classified as “intermediate” water (a condition in between “deep” water and “shallow” water). Most experiments were performed with a smooth crest surface made of glass plates. In some experiments the surface roughness was artificially increased by using selected gravel grades, however these experiments were not conclusive; therefore these experiments were not taken into account in the further analysis.
Measurements Water level, wave characteristics and the average overtopping discharge were measured as usual in
wave flume overtopping experiments. To determine incident wave parameters reflection analysis was performed on data from a set of three wave gauges with WaveLab3 following the method of Mansard and Funke, and using fixed cutoff frequencies 0.04Hz and 0.5Hz (prototype scale). In every experiment a wave train of ca. 1000 waves was simulated and the total volume of overtopped water was divided by the duration of the experiment to determine the overtopping discharge q .
Breaker parameter values gH
T
m
mm /2
tan
0
0,10,1 π
αξ⋅
⋅= −− were found to be in the range
2.5 à 4, indicating a condition of “non breaking waves” at the revetment according to EurOtop (2007).
Validation of the scale model set-up A validation of the scale model set-up was carried out by comparing the measurement results for
the experiments with a crest width of 0m with calculations using the well established empirical formula Eq. 1 from EurOtop (2007) for coastal dikes with a narrow crest:
)6.2exp(2.00
30
m
cm H
RHgq ⋅−⋅⋅⋅= for 0,1−mξ in the range 2 à 5 (1)
The result of this comparison is shown on Fig. 3. This figure shows a systematic difference between the directly measured and the indirectly calculated overtopping discharges. Note also the systematic difference between the two distinct series of experiments shown on Fig. 3 that were performed by different model operators. Considering also the uncertainties on the empirical formula Eq.1 it is concluded that the scale model gives acceptable results to study the effect of increasing the crest width and its seaward slope.

COASTAL ENGINEERING 2010 4
Figure 3. Comparison between directly measured overtopping discharges (horizontal axis) and calculated values based on the hydraulic boundary conditions using the empirical overtopping formula given in EurOtop (2007) (vertical axis) for experiments with a crest width of 0m.
In prototype the flow regime on the crest will be fully rough turbulent, at least for the critical
situation with significant overtopping discharges causing major risks of damage and people’s safety, it is overtopping discharges in the range 10 à 1000 l/s/m. For fully rough turbulent flow the Manning roughness coefficient is proportional to the equivalent sand grain diameter to the power 1/6 (Gioia and Bombardelli 2002). To convert scale model results to prototype scale Froude law is used, assuming that the flow regime in the scale model is also fully rough turbulent. So, a significant scale effect could be present if the flow regime in the scale model is not fully rough turbulent enough, which would be most present in scenarios with a relatively small Manning roughness and a relatively small overtopping discharge. However due to the intermittent character of overtopping waves and backflow in between it is unlikely that the assumption of fully rough turbulent flow regime is not valid enough. Nevertheless it is suggested to repeat the scale model experiments on a larger scale (e.g. 1/20) especially to reduce model effects in comparison with the 1/30 scale model used. Off course at the same time scale effects would be reduced.
SIMPLIFIED THEORETICAL MODEL
Definition of the reduction factor The relative reduction of the overtopping discharge caused by a wide-crested dike with a small
seaward slope is given by the reduction factor α [-] which is defined by Eq. 2.
0q
q=α (2)
The goal is the develop a model for calculating α . With such a model for α it would then be possible to predict overtopping discharges for wide-crested dikes combining this model with existing empirical formulas for overtopping of coastal dikes with a narrow crest (EurOtop 2007). The model for α will have to be based on characteristics of the wide-crested dike and overtopping hydraulics.

COASTAL ENGINEERING 2010
5
Assumptions regarding overtopping hydraulics Crudely assuming overtopping water masses as rigid bodies, a simple energy balance formulation
results in an equation for the decrease of the velocity of the overtopped water mass in function of the distance travelled. The equation states that the kinetic energy is partially transformed to potential energy (when the water mass gains height travelling on the seaward slope) and is partially dissipated due to turbulent friction losses, estimated by using the Manning formula in which the Manning coefficient n [s m-1/3] is dependant on the roughness of the surface of the crest. The relative decrease of the velocity in function of the distance travelled is then assumed to be equal to the relative reduction of the overtopping discharge in function of the crest width. Representative values of the layer thickness
0h [m] and the velocity 0v [m/s] at the seaward side of the crest are supposed to have the form of the
semi-empirical formulas given in literature by Schüttrumpf (2001), namely Eq. 3 and Eq. 4, in which a [-] and b [m1/2s-1] are assumed to be universal constants (to be determined by calibration).
)(0 cu RRah −⋅= (3)
)(0 cu RRbv −⋅= (4)
Theoretical formula Combining all given assumptions a theoretical formula for the reduction factor α can be deducted,
see Eq. 5.
���
����
�
−⋅⋅⋅−⋅
⋅⋅−⋅−
−⋅⋅⋅= )
)(2
exp(1)(
))(
2exp( 3/43/4
2
22
3/13/4
3/43/4
2
cu
cu
cu RRaBng
nbtRRa
RRaBngα (5)
with 0=α if the expression under the root is negative.
SEMI-EMPIRICAL FORMULA
Development The scale model measurements were used to calibrate the parameters a and b . Initial values for
these parameters were taken from the experimental results by Schüttrumpf (2001), namely the median values 17,0=a and 2,3=b m1/2s-1. Calibration was carried out in two steps. First the parameter a was calibrated by using only the experiments with a horizontal crest (seaward slope 0%). Second the parameter b was calibrated using the experiments with a seaward slope. The calibration of a was concluded with no change of the initial value, so 17,0=a . The calibration of b resulted in a decrease
of 50%, so 1,2=b m1/2s-1. Both calibrations were performed in such a way that the systematic error on α was reduced to zero. The semi-empirical formula developed is Eq. 6
( ))22exp(121.0)22exp(0
βκκ
βκα ⋅⋅−−⋅⋅−⋅⋅−=≡ tq
q (6)
with 0=α if the expression under the root is negative, and with Eq. 7 and Eq. 8 defining the dimensionless parameters κ and β :
3/1
2
)( cu RRng
−⋅=κ (7)
)( cu RRB−
=β (8)

COASTAL ENGINEERING 2010 6
Accuracy The scatter between directly measured and calculated values using the semi-empirical formula for
the reduction factor α has a RMSE value of 11%. The scatter is shown on Fig. 4. This is considered to be a satisfying result, although a further validation with independent data is needed. It is recommended to continue research to further validate the developed semi-empirical formula combining both new physical scale model experiments (preferably scale 1/20) and CFD numerical modeling.
Figure 4. Comparison between directly measured values of the reduction factor αααα (horizontal axis) and calculated values using the semi-empirical formula (vertical axis).
The directly measured values ofα are calculated as the ratio of the measured overtopping rates
from two experiments, namely one with a wide crest and the reference case with crest width 0m. The calculated values of α are found by using the semi-empirical formula Eq. 6 as well as the empirical run-up formula valid for conditions of “non breaking waves” at the revetment (EurOtop 2007) shown in Eq. 9 and a Manning coefficient value 010,0=n s m-1/3 for the glass surfaces used in the scale model.
��
�
�
��
�
�−⋅=
− 0,10
5.14m
mu HRξ
for 0,1−mξ in the range 2 à 8 (9)
Using 81,9=g m/s2 and a typical Manning coefficient for a promenade surface 02,0=n s m-1/3
the semi-empirical formula Eq. 6 can be used in preliminary design or for rough estimates of the effect of a wide, seaward sloped crest on the reduction of overtopping :α as a function of tBRR cu ,),( − .
Obviously it cannot replace specific testing of detailed dike designs using physical modeling and/or CFD numerical modeling.
APPLICATIONS FOR COASTAL TOWNS
The typical Flemish coastal dike For the existing situation in Flemish coastal towns the crest width B is in the range 15 à 30m.
Depending on the difference between run-up and freeboard )( cu RR − and the seaward slope of the
crest t the reduction factor of overtopping at the buildings versus overtopping at the revetment crest

COASTAL ENGINEERING 2010
7
will be larger or smaller. Using Eq.6 with 02,0=n s m-1/3 this dependency of α is shown on Fig. 5
for mB 15= and on Fig. 6 for mB 30= .
Figure 5. Reduction of overtopping discharge due to dike crest width of 15m.
Figure 6. Reduction of overtopping discharge due to dike crest width of 30m.
From Fig. 5 and Fig. 6 one can see that the wide crest in Flemish coastal towns can reduce small
overtopping events to zero or almost zero, but on the other hand very large overtopping discharges are only reduced relatively limitedly by the wide crest. It is obvious that both the width of the crest and the seaward slope of the crest have an important effect on the reduction of the overtopping.

COASTAL ENGINEERING 2010 8
For some typical examples numbers are given in Table 1. Note that a simple correlation is used between )( cu RR − and 0q roughly valid for typical conditions in Flemish coastal towns; this
correlation is based on calculation results of many profiles under extreme storm conditions using the empirical formulas Eq. 1 and Eq. 9 from EurOtop (2007).
Table 1. Reduction of overtopping discharge due to a wide crest.
q0 (Ru-Rc) B t � q 1 l/s/m 0.5m 15m 0.5% 0.00 0 l/s/m 1 l/s/m 0.5m 15m 2% 0.00 0 l/s/m 1 l/s/m 0.5m 30m 0.5% 0.00 0 l/s/m 1 l/s/m 0.5m 30m 2% 0.00 0 l/s/m 10 l/s/m 2m 15m 0.5% 0.68 6,8 l/s/m 10 l/s/m 2m 15m 2% 0.24 2,4 l/s/m 10 l/s/m 2m 30m 0.5% 0.38 3,8 l/s/m 10 l/s/m 2m 30m 2% 0.00 0 l/s/m 100 l/s/m 4m 15m 0.5% 0.86 86 l/s/m 100 l/s/m 4m 15m 2% 0.71 71 l/s/m 100 l/s/m 4m 30m 0.5% 0.72 72 l/s/m 100 l/s/m 4m 30m 2% 0.31 31 l/s/m 1000 l/s/m 8m 15m 0.5% 0.94 940 l/s/m 1000 l/s/m 8m 15m 2% 0.87 870 l/s/m 1000 l/s/m 8m 30m 0.5% 0.88 880 l/s/m 1000 l/s/m 8m 30m 2% 0.73 730 l/s/m
Super-dikes As an adaptation measure to cope with gradual sea level rise, and possibly increased storminess,
one can study the constructive solution to widen existing coastal dikes. Technically this measure lowers the risks of damage and casualties, for a given climate scenario. The reduction of the overtopping discharge is the basic parameter to evaluate the increased coastal safety, although further consequences such as the probability of breaching of the dike are also essential, and apart from the technical effects it is important also to consider the possibilities for coastal development associated with the increase of the area of the coastal promenade at the dike crest. Nevertheless, in this study we only highlight the overtopping discharge for a super-dike, with a crest width B in the range 50 à 100m.
Consider as a measure extending the width of a dike in the seaward direction, schematically represented on Fig.7. The increase of the crest width B will reduce the overtopping discharge q ,
however this reduction is (partly) thwarted by a simultaneous increase of )( cu RR − , which is the
result of both an increase of run-up due to higher wave heights in the larger water depth and a decrease of the freeboard due to the seaward slope. The net result can be evaluated using Eq. 6.
Figure 7. Seaward extension of an existing coastal dike.

COASTAL ENGINEERING 2010
9
Eq. 6 can be solved for the crest width needed to reduce the overtopping discharge to zero 0=qB .
The result is Eq. 10.
( )
( ) ���
����
�
−⋅⋅⋅+⋅
⋅−⋅== 3/1
2
2
3/4
0 21.011ln22
1cu
cuq RRt
ngngRR
B (10)
As long as the seaward slope is larger than zero, 0>t , such a crest width 0=qB exists for any
given hydraulic boundary conditions characterised by )( cu RR − . For practical applications a crest
width in the range of 50 à 100m is considered. Fig. 8 illustrates the dependency of 0=qB on the seaward
slope t and on )( cu RR − ; using 81,9=g m/s2 and 02,0=n s m-1/3.
Figure 8. Crest width needed to reduce the overtopping discharge to zero.
ACKNOWLEDGEMENTS The authors acknowledge the Agency for Maritime and Coastal Services, Coast Division,
Oostende, for partly funding this research.
REFERENCES EurOtop manual. 2007. Wave Overtopping of Sea Defences and Related Structures: Assessment
Manual, www.overtopping-manual.com Gioia, G., and F.A. Bombardelli. 2002. Scaling and similarity in rough channel flows, Physical review
letters, volume 88, number 1. Schüttrumpf, H. 2001. Wellenüberlaufströmung bei Seedeichen -Experimentelle und theoretische
Untersuchungen-, Technischen Universität Braunschweig, PhD thesis. van Gent, M. 1999. Physical model investigations on coastal structures with shallow foreshores; 2D
model tests with single and double-peaked wave energy spectra, WL Delft Hydraulics.