April 2013 Waverley CAB-information for discussion with Waverley Borough Council.

Waverley Economic Development Strategy 2015 — 2020
WAVERLEY

CONTENTSEconomic Vision 4
Foreword 5
Executive Summary 6
Introduction 7
Context 8
Future Trends 10
Economic Profile – Snapshot 11
Strengths and Challenges 15
Priorities 17
Renew 18
Innovate 19
Collaborate 20
Enable 21
Implementation 22
Action Agenda 23
Glossary 32
References 33
Produced by Waverley Council © 2015 Waverley Futures – Shaping Waverley – Economic Development
Waverley Economic Development Strategy 2015 — 2020 3

ECONOMIC VISION
A prosperous Waverley – a vibrant, sustainable and progressive economy that provides a gateway to Sydney’s east.
Waverley Economic Development Strategy 2015 — 2020 4

FOREWORDWith our pristine beaches, natural beauty, a welcoming community and diverse dining and shopping experience, Waverley is renowned as an iconic destination. To help us strengthen and diversify our economy by 2020, I am really proud to present to you Council’s first Economic Development Strategy, which has been made possible thanks to the feedback received from Waverley residents and businesses.
Business is an important part of our community – we have over 30,000 businesses currently operating in Waverley from Bondi Junction to Bondi Beach, Rose Bay to Charing Cross and Tamarama to Bronte. Our area has over 18,000 local jobs and over 33,100 employed residents.
However, our Economic Development Strategy is not only about business, it includes actions that promote the economic and social wellbeing of our residents. With over 6,000 of our local residents employed locally one cannot separate business and residential needs – they are bound together.
We know the drivers of the our local economy are retail, tourism, healthcare and social assistance, professional, scientific and technical services, rental, hiring and real estate services, financial and insurance services, and administrative and support services. We also know the New South Wales Government identifies the Bondi Junction commercial precinct as part of Sydney’s Global Economic Corridor and the major economic centre for the eastern suburbs with additional jobs proposed under Sydney’s Metropolitan Strategy – A Plan for Growing Sydney. This presents an exciting opportunity and we are committed to strengthening existing and establishing new partnerships with all levels of government, the business community, local business organisations such as the Bondi and Districts Chamber of Commerce and the Eastern Suburbs Business Enterprise Centre, residents and visitors to facilitate this growth.
Our Economic Development Strategy sets out a series of strategic directions and actions to help strengthen our economy and cement our position as the economic heartbeat of Sydney’s Eastern Suburbs. It focuses on four priority themes: Renew, Innovate, Collaborate and Enable. We want to help deliver more integrated programs and services, focusing on a range of initiatives such as:
• destination marketing• place management• improving competitiveness• improved partnerships• business support• reducing red tape
We are looking forward to working with you to implement this strategy so that together we can develop a vibrant, sustainable and progressive economy with great benefits for the whole community of Waverley.
Waverley Economic Development Strategy 2015 — 2020 5

EXECUTIVE SUMMARYThe Waverley Economic Development Strategy provides a high level strategic framework for delivering the economic vision and supporting the local economy over the long-term. Development of the strategy has relied on a broad analysis of local challenges, current and future trends, and the role of Waverley in the context of Sydney’s Global Economic Corridor.
Waverley recognises its role in Local Government to lead economic development in collaboration with all levels of government, industry, local business and the community. The strategy concentrates on retaining existing business and attracting new business that supports the creation of local jobs and new opportunities. These activities work towards long-term economic sustainability.
Delivering economic development in Waverley will be managed through the Waverley Economic Development Strategy 2015. This strategy outlines four high-level priorities and nine action headings:
Renew• Destination marketing• Place management• Destination development
Innovate• Improving competitiveness• Increasing diversity
Collaborate• Industry partnerships• Government partnerships
Enable• Reducing barriers• Business support
Waverley Economic Development Strategy 2015 — 2020 6
Local economies continue to evolve and operate in the context of an interconnected global economy. Economic Development at Waverley focuses on maintaining a sustainable economy over the long-term through two key practices - retaining established business and attracting new business. These practices will encourage greater job opportunities and services for the community, and maintain and enhance the quality of life.
The methodology used for preparing and implementing this strategy involves five phases. The first three phases involved research and preparation of this strategy. The fourth and fifth phases involve implementation over five years followed by an evaluation of the outcomes.
Local Government is recognised as having capacity to co-ordinate local planning and deliver on-ground actions. Outcomes are best delivered through collaborative actions across all levels of government, industry and communities. Where possible, support is provided from Federal and State Government.
Waverley’s Community Strategic Plan – Waverley Together 3, outlines a number of sustainable living themes that relate to economic development. These themes have a clear emphasis on people, place and business, and include a focus on industry and infrastructure:
• A vibrant, diverse and robust economy
• Public spaces and built environment are vibrant, inviting, accessible and aesthetically pleasing
• A sense of place and identity is preserved and celebrated
• Visits contribute positively to the community and economy
Waverley has a clear mandate to enable and facilitate sustainable long term economic growth. This has been resourced by the establishment of economic development as a dedicated outcomes focussed team within Council’s Waverley Futures Program.
INTRODUCTION
Waverley Economic Development Strategy 2015 — 2020 7

Local government areas across Australia are becoming increasingly responsible for supporting their local economies as responsibility is shared by all levels of Government. This ensures an integrated approach to delivering long-term economic sustainability.
The Federal and NSW State Governments have produced policies and broad industry action plans that support economic development. The State Government has identified Bondi Junction as a strategic commercial centre linked to the ‘Sydney Global Economic Corridor.’ The Corridor consists of a concentration of Sydney based professional service jobs that operate in finance, insurance, technology, health, education and tourism. Since 2008, this region has provided employment growth three times higher than the Sydney average, and is expected to continue sustaining the Sydney and NSW economies over the coming two decades. The NSW Department of Planning and Environment encourages Bondi Junction to continue evolving as the region’s commercial core, concentrating on retail and professional services jobs.
The Sydney metropolitan area consists of numerous smaller economies that have grown to develop their own competitive advantage. Waverley’s local economy consists of businesses that operate in a core group of industries that include retail, professional services, health, education, creative industries and tourism related. These core, yet diverse set of industries provide local jobs across Waverley with a concentration in Bondi Junction and our village centres.
CONTEXT
Waverley Economic Development Strategy 2015 — 2020 8

The Community Strategic Plan, Waverley Together 3 references multiple directions that seek to support Waverley’s economy. Four primary directions include:
Living 1 – Waverley’s economy is vibrant and robust and supports the creation of a variety of jobs and business opportunities.
Living 2 – Visitors and tourists are welcomed and make a positive contribution to the community and economy.
Living 4 - The unique physical qualities and strong sense of identity of Waverley’s village is respected and celebrated.
Governance 3 - Services are accessible and provided in a professional, friendly and timely manner.
Waverley Economic Development Strategy 2015 — 2020 9
FUTURE TRENDSTrends emerge and evolve over time. Emerging future trends are expected to drive long term change in Waverley’s economy. For example, technology and connectivity are driving change across multiple industries, with the digital economy playing an increasingly important role in Australian life. Online retail and professional services in the United States and United Kingdom now compete directly with traditional retail shops and services operating in Waverley. Competition for traditional accommodation is being challenged by new options through peer to peer rental services. These trends are encouraging local economies to embrace the challenge of ensuring their competitiveness remains relevant within larger economic networks.
Australia’s competitive advantage will have a future focus on the growth of industry sectors such as health, retail, tourism, international education and professional services (wealth management services). Waverley’s core industries
(economic drivers) and competitive advantage will align with future national growth areas, providing multiple opportunities to facilitate a stronger, more sustainable local economy.
Current and future population growth in neighbouring local government areas will provide proximity to a highly skilled workforce. Opportunities exist for Waverley to leverage this workforce by creating for example, knowledge intensive jobs and shared work spaces. In addition, Council is willing to explore the use of community assets to support innovative ways of working and partnering with relevant Government and other agencies to facilitate this initiative.
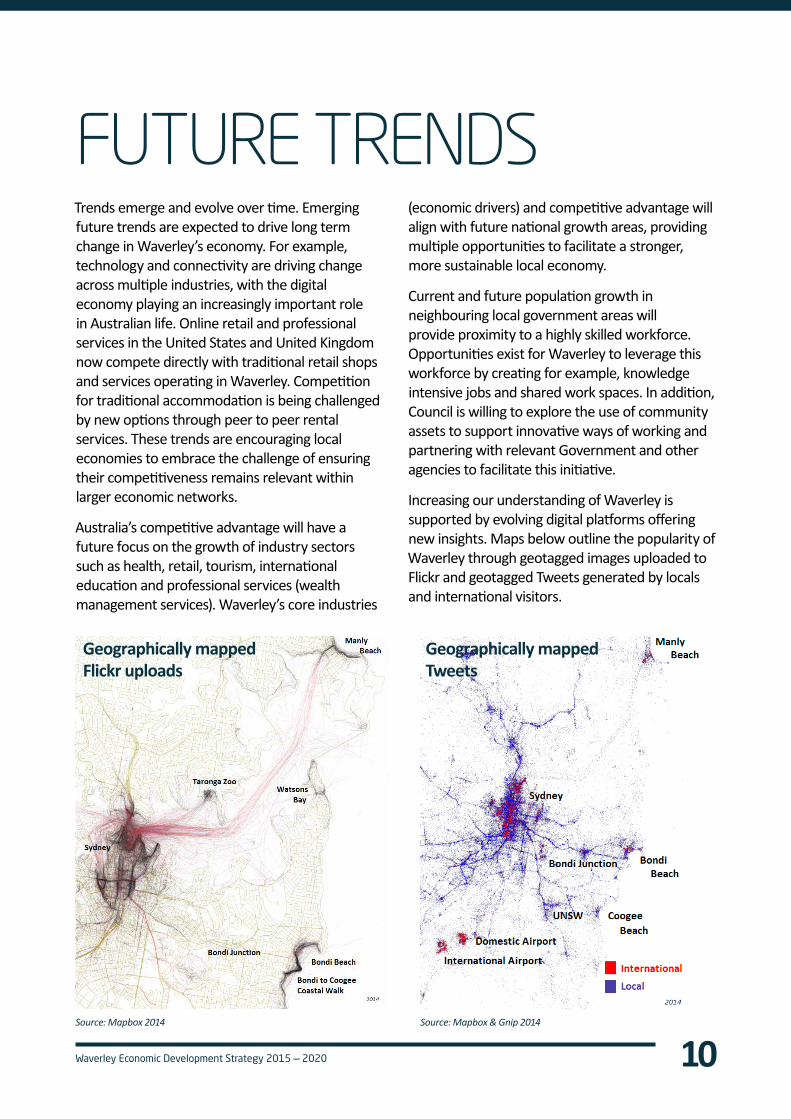
Increasing our understanding of Waverley is supported by evolving digital platforms offering new insights. Maps below outline the popularity of Waverley through geotagged images uploaded to Flickr and geotagged Tweets generated by locals and international visitors.
Source: Mapbox & Gnip 2014Source: Mapbox 2014
Geographically mapped Flickr uploads
Geographically mapped Tweets
Waverley Economic Development Strategy 2015 — 2020 10

ECONOMIC PROFILESNAPSHOTEconomic profiles provide insight into specific strengths of a local economy and its role within a broader economy. Waverley’s economic profile analysed multiple indicators that include Gross Regional Product, number of business, jobs and how these benchmark some against Greater
Sydney. Analysis has also identified the industry sectors that are driving the local economy. These collectively contribute to economic activity in relation to backward linkages, exports, employment and value-added.
Professional, Scientific and Technical Services » 6,418
Construction » 4,723
Financial and Insurance Services » 2,894
Rental, Hiring and Real Estate Services » 2,351
Arts and Recreation Services » 2,242
Health Care and Social Assistance » 1,849
Administrative and Support Services » 1,840
Other Services » 1,657
Retail Trade » 1,586
Information Media and Telecommunications 959
Education and Training » 956
Accommodation & Food Services » 871 Other » 6,999
Professional, Scientific and Technical Services » 27%
Retail Trade » 20%
Health Care and Social Assistance » 14%
Rental, Hiring and Real Estate Services » 13%
Financial and Insurance Services » 13%
Administrative and Support Services » 13%
Number of businesses
Industries driving the local economy
Source: Australian Business Register, June 2015
Source: Australian Bureau of Statistics 2009, 2010, 2011, 2014
Note: Other includes: Wholesale, Transport, Manufacturing, Agriculture, Public Administration, Utility, Mining and Other Services
Waverley Economic Development Strategy 2015 — 2020 11
13%13%
13%
27%
6,418
4,723
2,894
2,242
1,840
1,657
1,586
959
956
871
6,999
2,3511,849
20%
14%

Rental, Hiring and Real Estate Services » $684.26
Professional, Scientific and Technical Services » $571.92
Financial and Insurance Services » $390.43
Retail Trade » $385.08
Construction » $355.28
Administrative and Support Services » $300.68
Health Care and Social Assistance » $291.35
Accommodation and Food Services » $250.28
Manufacturing » $216.71
Information Media and Telecommunications » $206.50
Education and Training » $204.30
Wholesale Trade » $174.01
Public Administration and Safety » $163.91
Arts and Recreation Services » $138.52
Other Industries » $258.17
Employment mix in Waverley
The total employment in the Waverley area is estimated at 18,733 jobs. Industry sectors providing the highest contribution to local employment include retail, health care and social assistance, professional, scientific and technical services.
Industry sector output (GRP)
The Gross Regional Product (GRP) of the Waverley economy is $2.713 billion with a total output for the area of $4.591 billion. The major contributors, in terms of industry sectors, to output are:
Retail Trade 18% » 3,411
Health Care and Social Assistance 13% » 2,432
Professional, Scientific and Technical Services 11% » 2,031
Accommodation and Food Services 11% » 1,967
Education and Training 10% » 1,932
Administrative and Support Services 5% » 962
Other 32% » 5998
Note: Other includes: Construction, Public Administration and Safety, Arts and Recreation Services, Financial and Insurance Services, Wholesale Trade, Rental, Hiring and Real Estate Services, Information Media and Telecommunications, Manufacturing, Transport, Postal and Warehousing, Electricity, Gas, Water and Waste Services, Agriculture, Forestry and Fishing, Mining and Other Services.
Source: Australian Bureau of Statistics, 2009, 2010, 2011, 2014
Source: Australian Bureau of Statistics, 2009, 2010, 2011, 2014
Rental, Hiring and Real Estate Services » $684.26
Professional, Scientific and Technical Services » $571.92
Financial and Insurance Services » $390.43
Retail Trade » $385.08
Construction » $355.28
Administrative and Support Services » $300.68
Health Care and Social Assistance » $291.35
Accommodation and Food Services » $250.28
Manufacturing » $216.71
Information Media and Telecommunications » $206.50
Education and Training » $204.30
Wholesale Trade » $174.01
Public Administration and Safety » $163.91
Arts and Recreation Services » $138.52
Other Industries » $258.17
Waverley Economic Development Strategy 2015 — 2020 12
3,411
$684.26
$138.52
$216.71
$385.08
$571.92
$390.43
$355.28$300.68
$250.28
$206.50
$204.30
$174.01
$258.17$163.91
$291.71
2,432
2,031
1,9671,932
5998
962

Waverley employment in Greater Sydney
The type of employment (jobs) available in Waverley, as benchmarked against Greater Sydney, provides insight into its strength and role within the broader economy. A higher concentration of jobs in particular industry sectors when compared against greater Sydney demonstrates a higher concentration of jobs in retail, health care, professional services, accommodation and food. This reflects a highly educated community, possessing a wide range of specialist skills.
Geographically, employment is concentrated around the destination zones of Bondi Junction, Bondi Beach and North Bondi. Five industry sectors account for over 50 percent of jobs including retail trade (18.21 percent), health care & social assistance (13 percent), professional, scientific and technical services (10.84 percent), accommodation and food services (10.50 percent) and education and training (10.31 percent).
Waverley (A) – 2011 Census
Greater Sydney (GCCSA) – 2011 Census
Retail Trade
Health Care and Social Assistance
Professional, Scientific and Technical Services
Accommodation and Food Services
Education and Training
Administrative and Support Services
Other Services
Construction
Public Administration and Safety
Arts and Recreation Services
Financial and Insurance Services
0% 5% 10% 15% 20%
Industry Sector
Waverley Economic Development Strategy 2015 — 2020 13
Source: Australian Bureau of Statistics 2011

WAVERLEY’S POPULATION
71,7691
2.75%2
UNEMPLOYMENT RATE 33,1083
EMPLOYED RESIDENTS
2.2 MILLION4
PEOPLE VISIT BONDI EACH YEAR*
18,7335
LOCAL JOBS6689 - Jobs employing local residents
35,3456
BUSINESSES Over 80% are small business
MOST POPULAR THINGS TO DO IN BONDIRESTAURANTS, CAFES, SIGHTSEEING, SHOPPING, VISITING FAMILY AND FRIENDS
& GOING TO THE BEACH
* Note: Visitor estimates excludes residents of Sydney. Visitor numbers are averaged over a three year period.
Sources:1. Estimated from Australian Bureau of Statistics to 2014 (Economy ID)2. Australian Bureau of Statistics – Labour Force Survey, December 2014 (Economy ID)3. Australian Bureau of Statistics 2011 (REMPLAN)4. Destination NSW Visitor Profile Surveys – Bondi, 20125. Australian Bureau of Statistics - Population and Housing 2011 (REMPLAN)6. Australian Business Register, Trading as at June 20157. Destination NSW Visitor Profile Surveys – Bondi, 2012
7
Waverley Economic Development Strategy 2015 — 2020 14

STRENGTHS AND CHALLENGESA local economy’s competitive advantage shapes its future direction. Waverley is characterised by a number of strengths within its region that include:
• Strategically located commercial centre for metropolitan Sydney
• Highly educated, skilled and diverse workforce
• Dynamic economy with established and emerging industries
• Innovative and technologically advanced companies
• Established commercial centres with local business ‘villages’ having strong growth potential
• Extensive telecommunications and information technology infrastructure to underpin an advanced economy
• A network of education and training institutions which place the area at the forefront of innovation and development
Bondi Junction is a regionally significant hub for business in the Eastern Suburbs. The centre is supported by transport infrastructure networks, including direct road and rail links that move thousands of residents, workers and visitors each day.
Waverley’s coastal areas including Bondi Beach, are recognised as culturally iconic and one of Australia’s most visited destinations. The area collectively represents a strong association with summer, recreation and food and attracts over two million local and international visitors annually.
Local arts and culture emerges through major cultural events that include Sculpture by the Sea, City2Surf and Festival of the Winds. The iconic status of Bondi Beach is demonstrated by its cultural and heritage influence in Australia and internationally.
Retail experiences in Waverley are diverse with Westfield Bondi Junction operating one of Australia’s most successful shopping centres. The centre complements thousands of retail and service businesses throughout Waverley’s major commercial and village centres.
The growth of the health and education industry sector in Waverley reflects the area’s proximity to some of Sydney’s major hospitals and universities including neighbouring health and educational precincts.
Waverley Economic Development Strategy 2015 — 2020 15

Challenges in Waverley’s economy provide focal points for the strategy. A variety of research and consultation has identified challenges and informed the direction of this strategy, including:
• Eastern Suburbs Economic Profile
• Draft discussion paper – Shaping Waverley’s Economy
• Demographic and economic data
• Waverley Business Forum workshops
Specific challenges for Waverley’s economy vary in the context of current and future trends outlined earlier. These include for example, limited knowledge of the local economy and its relationship to greater Sydney, the changing patterns of work regionally and nationally, limited support for established and new business, poor collaboration between government agencies and industry. These challenges provide multiple opportunities for Council to lead a solutions focused approach.
Opportunities
• Remove unnecessary regulatory processes and delays experienced by new and existing businesses
• Improve destination marketing and local branding
• Enhance a sense of place and cultural character across Bondi Junction and surrounding village centres
• Diversify safe night-time options in Bondi Junction
• Offer greater choice of commercial office space for professional services
• Encourage new business (start-ups) in emerging industries including knowledge intensive, creative and digital business clusters
• Actively engage and support local industry including small businesses
• Improve research information including commercial office space, visitation and accommodation data
• Increase Council’s partnerships with local industry and government agencies to build business capacity and strengthen supply chains
• Provide a balanced approach to the visitor economy
• Advocate and partner with relevant government and industry agencies to improve services and infrastructure, such as public transport and online connectivity
Waverley Economic Development Strategy 2015 — 2020 16

PRIORITIESThe Waverley Economic Development Strategy provides a framework that delivers its vision with a focus on building the economy’s competitive strengths, embracing challenges through leadership, strong partnerships and new ideas. These elements provide an integrated framework with four priorities, nine action headings and twenty-nine project actions.
Priorities define the direction of economic development for Council over the next five years. Research into developing this strategy concentrated on forming high-level priorities that offer flexibility in the context of a changing national and global economic context. The priorities remain focused on attracting and retaining business. Based on research they maintain the underlying principles of supporting established business and attracting new business in the local economy. Priorities will help focus resources and efforts in specific areas where opportunities have been identified through background research.
Waverley Economic Development Strategy 2015 — 2020 17

RENEWUrban economies move through cycles of change by developing, ageing and renewing. Renew focuses on renewing commercial and village centres to ensure there is a consistent approach to marketing, management and future planning. This includes branding and promotion and business investment.
Opportunity also exists to improve the vibrancy of commercial and village centres in addition to reviewing the management systems that deliver services to each centre. Improved visitor experience will form another focus area along with support for cultural assets.
Renew is divided into three ACTION headings:
Destination marketing Place managementDestination development
Outcomes
• Clear branding of commercial and village centres that appeal to a variety of local community, visitors and new business
• Renewed place management initiatives and practices for commercial and village centres
• Range of economic and demographic data sources to encourage better understanding and management of our economy
• Encourage growth of cultural assets for Bondi Junction
• Improved visitor experiences in the area with clearer information and opportunities to enjoy the area
• Improved vibrancy of commercial centres and village centres
Waverley Economic Development Strategy 2015 — 2020 18

INNOVATEEconomies continually evolve through innovation to maintain a competitive advantage. Innovate will focus on strengthening and diversifying Waverley’s core industries by attracting new industries to improve the prospect of sustainable job growth. The actions focus on improving core industry sectors including retail, visitor economy (tourism), professional services, health and education, creative industries and recreation.
An important focus of this priority is increasing the diversity of our businesses and encouraging start-ups. This seeks to improve our competitiveness and reduce the local economy’s exposure in an increasingly interconnected national and global context.
Innovate is divided into two ACTION headings:
Improving competitiveness Increasing diversity
Outcomes
• Grow the number of local jobs available to an increasing population
• Support the generation of co-working opportunities for local industries, creative and professional services (knowledge intensive)
• Improve the supply and range of accommodation and commercial office space in Bondi Junction
• Encourage local industries to collaborate on new initiatives
• Improve opportunities for start-ups to establish businesses in Waverley
Waverley Economic Development Strategy 2015 — 2020 19

COLLABORATEPartnerships help merge real world challenges with political and legal frameworks to provide equitable, specific and measurable results. Collaboration will focus on increasing information sharing to support evaluation of current broader issues and deliver a variety of projects and activities generated by this strategy.
Partnerships will involve a cross section of government agencies, industry and the community with a focus on the local economy. A variety of Government agencies will be engaged to focus on business and investment. Industry partnerships cover a variety of associations and organisations that relate to key local industries that may join or support Council in delivering certain initiatives. The community, represented by local business and residents will contribute to various initiatives.
Collaborate as a priority is divided into two ACTION headings:
Industry partnerships Government partnerships
Outcomes
• Maintain and strengthen collaboration with business and related associations (such as Bondi and Districts Chamber of Commerce)
• Government and industry support for local economic issues
• Increased promotion of collaboration to support Waverley’s strengthening of local business
• Increased funding from appropriate government agencies for projects that are related to this strategy
• Strengthening relationships with Government and industry for innovative projects and sharing of existing and future economic development research
• Co-ordinated approach between industry and government in relation to local visitor economy
Waverley Economic Development Strategy 2015 — 2020 20

ENABLEBusinesses continually undergo change based on a more competitive operating environment. Enable will focus on supporting business by reducing unnecessary barriers to growth, and researching innovative ways for Council to improve process. Support involves assisting businesses to navigate government frameworks and regulation to ensure they can access appropriate support services through advisory and referral services.
The priority acknowledges the regulatory framework that businesses operate and interact with daily, and their need to evolve according to changing demands. Opportunities exist to demonstrate Waverley Council’s emphasis on proactively fulfilling its role as a Local Government, while embracing and developing innovative practices and initiatives.
Enable is divided into two ACTION headings:
Reducing barriersBusiness support
Outcomes
• Council welcomes new ideas and is an enabler of business
• An ‘open for business’ approach that focuses on reduction of Council red tape and processes that negatively impact local business and local activities
• Increased confidence and improved efficiencies for business related to interaction with Council services
• Engage with local businesses and encourage business to business communication, networking and trade
• Increased access to a range of useful Council information for businesses online
Waverley Economic Development Strategy 2015 — 2020 21

IMPLEMENTATIONDelivering the strategy
The Waverley Economic Development Strategy actions will deliver both tangible and intangible outcomes based on the four high-level priorities.
Projects and initiatives will involve a multi-disciplinary approach. Internally, Waverley Council’s Economic Development team will collaborate across a range of Council program areas to engage with project stakeholders and partners. Externally, various government agencies, industry groups and the community will be engaged.
The strategy’s implementation will occur alongside other corporate plans and strategies with results reflected in Council’s integrated planning and reporting framework.
The resource allocation and timing of delivery will vary including resourcing, stakeholder and government agency engagement.
Monitoring and evaluation
Project progress will be monitored to ensure measures, deliverables and outcomes are achieved. Progress reporting to Council will be undertaken for achievement of project initiatives. At the completion of the period of effect of the Waverley Economic Development Strategy in 2020, a detailed report and evaluation of all projects and initiatives will be undertaken and reported. This review will report on lessons learned, results and achievements to inform a future Waverley Economic Development Strategy and action agenda.
Waverley Economic Development Strategy 2015 — 2020 22

ACTION AGENDA
The action agenda provides greater specificity on the delivery of economic development actions in Waverley to 2020. A total of twenty-nine action projects and initiatives are scheduled across the four high-level priorities. These will vary in scale, outcomes and timing.
The Economic Development team will facilitate implementation of the strategy. Delivery of actions will involve collaboration between internal and external stakeholders including Waverley Council, a variety of government agencies, industry organisations and the community. The extent of stakeholder input will vary depending on each action. The action agenda identifies areas within Council that have a professional interest in each action (noted in italics on the action agenda). These areas range widely with Enriching Waverley for example able to contribute through cultural programs and events, Positioning Waverley able to contribute through communications and marketing, and Safe Waverley who contribute through safety related services to the community.
Project plans will be formulated for each action to identify collaborators, team members, stakeholders, specific milestones and timeline for delivery. Summary project plans will be made available for project teams to enable a meaningful collaboration. The successful delivery of the priorities will be reported according to a series of group measures. Each project will contain a community engagement plan. These will be generated to ensure active and innovative engagement to maximise project delivery and impact.
Measures contained within the Waverley Economic Development Strategy are broad in nature and grouped within a measures table for each of the four priority actions. These measures are indicative only and demonstrate how Council can measure its progress on actions. Individual projects and activities will have their own project plans which will include specific outcomes, deliverables and measures.
Waverley Economic Development Strategy 2015 — 2020 23

RENEWActionsDestination marketing
Project actions Project involvementStart year (Financial Yr)
2015 2016 2017 2018 2019 ongoing
1.1 Identify and promote clear branding that highlights the character of Bondi Junction and key commercial village centres
Positioning WaverleyOmbudsman, Governance & Civic
NSW Trade and InvestmentDestination NSWTourism Australia
1.2 Promote Waverley’s competitive advantage to attract new business
Positioning WaverleyClean and Attractive Waverley
Destination NSW NSW Trade and Investment
1.3 Improve supply of essential information about the local area across a variety of communication mediums for domestic and international visitors
Positioning WaverleyEnriching Waverley
Digital WaverleyDestination NSWTourism Australia
Place management
Project actions Project involvementStart year (Financial Yr)
2015 2016 2017 2018 2019 ongoing
2.1 Review business satisfaction with Council services across a range of industry sectors (for example an annual survey)
Positioning WaverleyClean & Attractive Waverley
2.2 Examine and deliver opportunities to improve local experiences through basic services (for example: interactive maps, cross promotions and online solutions and other relevant information)
Positioning WaverleyDestination NSWTourism Australia
2.3 Review the overall place management and function of commercial and village centres
Clean & Attractive Waverley Positioning Waverley
Ombudsman, Governance & Civic
Waverley Economic Development Strategy 2015 — 2020 24

Destination development
Project actions Project involvementStart year (Financial Yr)
2015 2016 2017 2018 2019 ongoing
3.1 Facilitate vibrant commercial and village centres through place activation projects that enhance a sense of place and retain local ambience and identity
Enriching WaverleyCreating WaverleyShaping WaverleyCaring Waverley
Positioning WaverleyOmbudsman, Governance &
Civic
3.2 Facilitate the creation of distinctive cultural assets in Bondi Junction by way of an area, building, artwork or similar
Enriching WaverleyCaring Waverley
3.3 Generate and maintain diverse sources of local economic data for use in long-term planning by Council and the public, such as:a) economic indicator and
demographic information and data sets
b) local cultural assets data (events, natural locations, venues, galleries etc.)
c) local commercial floor space and employment data
d) visitor and accommodation data
Enriching WaverleySafe Waverley
Creating WaverleyRegional Tertiary Institutions
Australian Bureau of Statistics Destination NSWTourism Australia
AustradeNSW Planning and
Environment
3.4 Encourage increased diversity in the night time economy of Bondi Junction
Enriching WaverleyShaping Waverley
Safe Waverley
Measures
Action group indicators How we will measure progress Trends / targets Reporting frequency
• Economic diversity• Business satisfaction• Local and international visitor engagement• Information source• Effective and efficient labour market
Real annual growth in Gross Regional Product (GRP) and contribution by industry sector
Increase in GRP ↑ Annually
Business satisfaction in commercial and village centres Stable ↔ or increasing ↑ Annually
Economic stimulus (jobs and dollar spend) from domestic and international visitation
Increasing ↑ Annually
Volume of pedestrians in key locations Increasing ↑ Annually
Attendance numbers at major events Increasing ↑ Annually
Vacancy and churn rates Decreasing ↓ Biannually
Waverley Economic Development Strategy 2015 — 2020 25

INNOVATEActionsImproving competitiveness
Project actions Project involvementStart year (Financial Yr)
2015 2016 2017 2018 2019 ongoing
4.1 Encourage investment in the sustainable supply of commercial office space
Shaping Waverley Sustainable WaverleyPositioning Waverley
NSW Planning and Environment
Austrade
4.2 Investigate the establishment of co-working office spaces for existing industries including knowledge intensive (professional services)
Enriching WaverleyRegional Development
Australia
4.3 Encourage investment in the sustainable supply of appropriate visitor accommodation
Shaping WaverleyPositioning Waverley
NSW Trade and Investment
4.4 Deliver new initiatives that connect local industries to facilitate sustainable value-add activities to local business
Enriching WaverleyNSW Business Chamber
Increasing diversity
Project actions Project involvementStart year (Financial Yr)
2015 2016 2017 2018 2019 ongoing
5.1 Encourage new business start-ups (creative, hi-tech and knowledge intensive industries) to establish in Waverley (for example, through incubator/s)
Enriching WaverleySustainable Waverley
Business Enterprise Centre
5.2 Encourage new business to establish in Waverley by promoting a range of local economic data and other information to promote ‘doing business’ in Waverley
Positioning Waverley
5.3 Increase competitive advantage by supporting the ongoing operation of local health and educational institutions
NSW Business ChamberRelated industry associations
Waverley Economic Development Strategy 2015 — 2020 26

Measures
Action group indicators How we will measure progress Trends / targets Reporting frequency
• Workforce and employment• Economic diversity• Office and accommodation supply• Employment and workforce participation
Local employment by industry sector Increasing ↑ Biannually
Mix of businesses Stable ↔ or increasing ↑ Biannually
Participation rates in skilled jobs Increasing ↑ Biannually
Commercial office floorspace Stable ↔ or increasing ↑ Annually
Use of council property for business and events Increasing ↑ Annually
Businesses and workers in knowledge intensive, hi-tech and creative industries
Stable ↔ or increasing ↑ Annually
Accommodation supply and demand Increasing ↑ Annually
Number of businesses Stable ↔ or increasing ↑ Biannually
Number employed and participation rates Stable ↔ or increasing ↑ Biannually
Waverley Economic Development Strategy 2015 — 2020 27

COLLABORATE ActionsIndustry partnerships
Project actions Project involvementStart year (Financial Yr)
2015 2016 2017 2018 2019 ongoing
6.1 Strengthen support to small business through established industry partnerships
Bondi and Districts Chamber of Commerce
Eastern Suburbs Business Enterprise Centre
6.2 Maintain and strengthen relationships with media organisations to promote business news in Waverley
Positioning WaverleyLocal media
6.3 Develop new and strengthen existing collaboration for greater research and support
Regional tertiary institutesEconomic Development professional associations
6.4 Investigate the establishment of an entity that facilitates discussion and feedback on Waverley’s visitor economy
Bondi and Districts Chamber of Commerce
Destination NSW Local Businesses
Waverley Economic Development Strategy 2015 — 2020 28

Government partnerships
Project actions Project involvementStart year (Financial Yr)
2015 2016 2017 2018 2019 ongoing
7.1 Collaborate with relevant NSW and Federal Government Agencies to support marketing (for long-term investment and visitation)
NSW Trade and InvestmentNSW Business Chamber
Destination NSWBondi and Districts Chamber of
Commerce
7.2 Collaborate with Government agencies, tertiary institutions and others to undertake annual economic research projects to underpin future economic development projects and activities
Regional tertiary InstitutionsAustralian Bureau of Statistics
NSW Planning and Environment
7.3 Develop regional visitor economy opportunities through cross promotion with surrounding Local Government Areas and State Government
Surrounding CouncilsDestination NSWTourism Australia
Measures
Action group indicators How we will measure progress Trends / targets Reporting frequency
• Doing business• Collaboration and partnerships• Facilitation of economic stimulus
Ease of doing business with Council Increasing ↑ Annually
Business to business trade and communication Increasing ↑ Annually
Media sources and coverage about Bondi* Stable ↔ or increasing ↑ Annually
Regional visitor economy opportunities Increasing ↑ Annually
No. of partnerships Stable ↔ or increasing ↑ Annually
No. of major events Stable ↔ or increasing ↑ Annually*as used across digital channels in media and branding.
Waverley Economic Development Strategy 2015 — 2020 29

ENABLEActionsReducing barriers
Project actions Project involvementStart year (Financial Yr)
2015 2016 2017 2018 2019 ongoing
8.1 Develop and implement an ‘Open for Business’ approach that improves key processes to make it easier to do business in Waverley
Positioning Waverley Customer First
8.2 Review and improve policy and processes involving activity in public spaces
Building WaverleyWaverley Financial Enriching WaverleyDestination NSW
NSW Planning and Environment
Business support
Project actions Project involvementStart year (Financial Yr)
2015 2016 2017 2018 2019 ongoing
9.1 Review opportunities for business to improve sustainability (including improved environmental performance)
Sustainable WaverleyPositioning Waverley
9.2 Improve business support services through an advisory and referral service, employment and mentoring programs
Shaping WaverleyPositioning Waverley
Digital Waverley Caring Waverley
Bondi Chamber of CommerceBusiness Enterprise Centre
Dept. of Education and Communities
9.3 Engage with local businesses in diverse ways including: • Annual business awards• Issues based business workshops• Local business news• Business forums
Positioning WaverleyEnriching Waverley
Bondi and Districts Chamber of Commerce
NSW Small Business Commissioner
Waverley Economic Development Strategy 2015 — 2020 30

Measures
Action group indicators How we will measure progress Trends / targets Reporting frequency
• Reduction in red tape• Business efficiency• Business to business trade• Access to information
and referrals
Timeframes for delivering business related approvals (Eg. footpath seating)
Decreasing ↓ Annually
Interactively inform businesses on how to navigate processes Stable ↔ or increasing ↑ Annually
Business sustainability Increasing ↑ Annually
Business engagement (attendance at forums, workshops, business awards) Increasing ↑ Annually
Waverley Economic Development Strategy 2015 — 2020 31

GLOSSARYBackward linkages - details the industry sectors that spend the most on locally sourced intermediate goods and services per dollar of output. These industry sectors may not represent that largest contributions to an economy yet have capacity to deliver broad economic benefits through supply chains.
Bondi – prevalent use of the term ‘Bondi’ synonymous with Australian beach culture internationally and domestically. This is measured across digital channels in media, branding and the like.
Business incubator – entity that fosters and supports young companies until they become viable, providing them with affordable space, technical and management support, equity and long-term debt financing and employment.
Churn rate – measures the number of businesses moving out of an industry group over a specific period of time.
Commercial centre – a primary centre where a concentration of commercial activities takes place to service a surrounding area and/or region.
Competitive advantage (competitive strength) – represents a specialisation of related businesses that operate within a specific area comparative to other areas (economies) or within a local economy.
Creative industries – industries that have their origin in individual creative skills and talent. These skills represent a potential for wealth and job creation through commercialisation of intellectual property.
Economic development – involves the development and implementation of policy, programs and projects that stimulate communities and regions in positive ways.
Employment - key social outcome of economy development. Employment data represents the number of people employed by businesses /
organisations in each industry sector.
Gross Regional Product – is the total value of final goods and services produced in the region over the period of one year.
High-tech – businesses that produce products or services that require substantial intellectual capital in their creation and delivery.
Indicator – measures that help assess performance of an action over time.
Knowledge intensive – involves high tech businesses such as software, computing and telecommunications that have a highly skilled workforce.
Key industry sectors (drivers) – the industry sectors which are propulsive drivers for the local economy. These industry sectors are prominent for backward linkages (spend the most on locally sourced intermediate goods and services per dollar of output, regional exports, employment and value added; which is the major calculation of Gross Regional Product).
Major events – as defined within Council’s adopted events policy and/or has a high level of significance that is measurable. These events can be managed by either external operators or Council.
Red tape – relates to regulatory or bureaucratic processes.
Value-Added - represents the marginal economic value that is added by each industry sector in a defined region. Value-Added is calculated by subtracting local expenditure and expenditure on regional imports from the output generated by an industry sector. Value-Added by industry sector is the major element in the calculation of Gross Regional Product.
Village centre – refers to a group of shops either neighbourhood centre, village centre or commercial centre.
Waverley Economic Development Strategy 2015 — 2020 32
REFERENCES1. Australian Bureau of Statistics - ABS 2011 – Census Journey to Work Employment Data, retrieved from
REMPLAN June 2015
2. Australian Bureau of Statistics - ABS 2009 / 2010 National Input / Output Tables, retrieved from REMPLAN June 2015
3. Australian Bureau of Statistics - ABS June 2014 Gross State Product, retrieved from REMPLAN June 2015
4. Australian Bureau of Statistics - Labour force survey, catalogue number 6202.0, and DEEWR, Small Area Labour Markets, retrieved from REMPLAN June 2015
5. Destination NSW, 2012, Local Government Area Visitor Profiles, retrieved January 2014 from: www.destinationnsw.com.au/tourism/facts-and-figures/local-area-profiles
6. Destination NSW, 2012, Sydney precinct visitor profiles: Bondi visitor profile, retrieved January 2012 from: www.destinationnsw.com.au/tourism/facts-and-figures
7. NSW Planning and Environment, December 2014, A Plan for growing Sydney, retrieved March 2015, retrieved from: www.strategy.planning.nsw.gov.au/sydney/wp-content/uploads/sites/2/2015/02/A-Plan-For-Growing-Sydney_2015_updated_20Feb_.pdf
8. Waverley Council, 2013, Community Strategic Plan: Waverley Together 3: 2013- 2025, Retrieved January 2015 from: www.waverley.nsw.gov.au/__data/assets/pdf_file/0009/54000/WT3_Strategic_plan_2013-25_WEB_FINAL.pdf
9. SGS Economics and Planning, December 2013, Eastern Suburbs Economic Profile Report, SGS economics and Planning and behalf of Randwick, Waverley and Woollahra Councils.
10. Waverley Council, 2014, Draft Discussion Paper – Shaping Waverley’s Economy, Economic Development, Shaping Waverley, Waverley Futures
11. Waverley Council, 2014, Waverley Business Forum – Stay Connected, Stay Ahead, Workshop, April 2014
Waverley Economic Development Strategy 2015 — 2020 33