Wavelet-based information filtering for fault diagnosis of...
12
Research article Wavelet-based information filtering for fault diagnosis of electric drive systems in electric ships Andre A. Silva a , Shalabh Gupta b,n , Ali M. Bazzi b , Arthur Ulatowski c a Raytheon Missile Systems, Tucson, AZ, USA b Department of Electrical and Computer Engineering, University of Connecticut, Storrs, CT, USA c DRS Consolidated Controls, Bridgeport, CT, USA article info Article history: Received 25 May 2016 Received in revised form 25 July 2017 Accepted 25 August 2017 abstract Electric machines and drives have enjoyed extensive applications in the field of electric vehicles (e.g., electric ships, boats, cars, and underwater vessels) due to their ease of scalability and wide range of operating conditions. This stems from their ability to generate the desired torque and power levels for propulsion under various external load conditions. However, as with the most electrical systems, the electric drives are prone to component failures that can degrade their performance, reduce the efficiency, and require expensive maintenance. Therefore, for safe and reliable operation of electric vehicles, there is a need for automated early diagnostics of critical failures such as broken rotor bars and electrical phase failures. In this regard, this paper presents a fault diagnosis methodology for electric drives in electric ships. This methodology utilizes the two-dimensional, i.e. scale-shift, wavelet transform of the sensor data to filter optimal information-rich regions which can enhance the diagnosis accuracy as well as reduce the computational complexity of the classifier. The methodology was tested on sensor data generated from an experimentally validated simulation model of electric drives under various cruising speed conditions. The results in comparison with other existing techniques show a high correct classification rate with low false alarm and miss detection rates. & 2017 ISA. Published by Elsevier Ltd. All rights reserved. 1. Introduction The induction motor, and in general electric machine and drive systems, are the de facto standard in the industry due to their consistency of speed control, cost effectiveness, and range of ap- plications including electric vehicles (e.g., electric ships, boats, cars, and underwater vessels) and other applications such as air handling systems, extruders, hoists and conveyors. However, as with the most electrical systems, the electric drives are prone to component faults that can degrade their performance, reduce the efficiency, and require expensive maintenance. Therefore, for safe and reliable operation of electric vehicles, there is a need for au- tomated early diagnostics of critical failures (e.g., broken rotor bars and electrical phase failures) for early warnings that may help in system recovery and condition-based maintenance (CBM) [1–4]. This paper presents a fault diagnosis methodology for the electric drive systems in electric ships, with focus on the broken rotor bar faults and the stator winding short-circuit faults. The stator winding short-circuit faults are some of the most common types of faults that encompass 21% of the distribution of all faults in electric motor drive systems [5]. The main reason for occurrence of these faults is due to the unforeseen breakdown of insulation between components, which may occur across one or more of the phase windings in the stator or across the phase and nearby components. Typically these faults are caused by intermittent voltage overloads, winding displacements due to mechanical vi- brations, excessive heating, etc. The effects of such faults are high currents and more heating which results in further growth of faults. The broken rotor bar faults have also received notable at- tention which are more difficult to detect. Broken rotor bars are generally caused by stresses from electromagnetic forces or over- loaded operation conditions, inadequate rotor fabrication, and rotor component wear from poor operating environments or lack of maintenance [6]. Broken rotor bars affect the distribution of current to other bars, sparking, torque fluctuations leading to premature wearing of bearings and other components, etc. Most of the techniques reported in literature for motor fault diagnosis rely on current and/or voltage signal analysis. Since the effects of the above faults directly affect the current signals, the Contents lists available at ScienceDirect journal homepage: www.elsevier.com/locate/isatrans ISA Transactions http://dx.doi.org/10.1016/j.isatra.2017.08.013 0019-0578/& 2017 ISA. Published by Elsevier Ltd. All rights reserved. n Correponding author. E-mail address: [email protected] (S. Gupta). Please cite this article as: Silva AA, et al. Wavelet-based information filtering for fault diagnosis of electric drive systems in electric ships. ISA Transactions (2017), http://dx.doi.org/10.1016/j.isatra.2017.08.013i ISA Transactions ∎ (∎∎∎∎) ∎∎∎–∎∎∎
-
Upload
trinhxuyen -
Category
Documents
-
view
225 -
download
0
Transcript of Wavelet-based information filtering for fault diagnosis of...
ISA Transactions ∎ (∎∎∎∎) ∎∎∎–∎∎∎
Contents lists available at ScienceDirect
ISA Transactions
http://d0019-05
n CorrE-m
Pleasships
journal homepage: www.elsevier.com/locate/isatrans
Research article
Wavelet-based information filtering for fault diagnosis of electric drivesystems in electric ships
Andre A. Silva a, Shalabh Gupta b,n, Ali M. Bazzi b, Arthur Ulatowski c
a Raytheon Missile Systems, Tucson, AZ, USAb Department of Electrical and Computer Engineering, University of Connecticut, Storrs, CT, USAc DRS Consolidated Controls, Bridgeport, CT, USA
a r t i c l e i n f o
Article history:Received 25 May 2016Received in revised form25 July 2017Accepted 25 August 2017
x.doi.org/10.1016/j.isatra.2017.08.01378/& 2017 ISA. Published by Elsevier Ltd. All
eponding author.ail address: [email protected] (S. Gup
e cite this article as: Silva AA, et al.. ISA Transactions (2017), http://dx.d
a b s t r a c t
Electric machines and drives have enjoyed extensive applications in the field of electric vehicles (e.g.,electric ships, boats, cars, and underwater vessels) due to their ease of scalability and wide range ofoperating conditions. This stems from their ability to generate the desired torque and power levels forpropulsion under various external load conditions. However, as with the most electrical systems, theelectric drives are prone to component failures that can degrade their performance, reduce the efficiency,and require expensive maintenance. Therefore, for safe and reliable operation of electric vehicles, there isa need for automated early diagnostics of critical failures such as broken rotor bars and electrical phasefailures.
In this regard, this paper presents a fault diagnosis methodology for electric drives in electric ships.This methodology utilizes the two-dimensional, i.e. scale-shift, wavelet transform of the sensor data tofilter optimal information-rich regions which can enhance the diagnosis accuracy as well as reduce thecomputational complexity of the classifier. The methodology was tested on sensor data generated froman experimentally validated simulation model of electric drives under various cruising speed conditions.The results in comparison with other existing techniques show a high correct classification rate with lowfalse alarm and miss detection rates.
& 2017 ISA. Published by Elsevier Ltd. All rights reserved.
1. Introduction
The induction motor, and in general electric machine and drivesystems, are the de facto standard in the industry due to theirconsistency of speed control, cost effectiveness, and range of ap-plications including electric vehicles (e.g., electric ships, boats,cars, and underwater vessels) and other applications such as airhandling systems, extruders, hoists and conveyors. However, aswith the most electrical systems, the electric drives are prone tocomponent faults that can degrade their performance, reduce theefficiency, and require expensive maintenance. Therefore, for safeand reliable operation of electric vehicles, there is a need for au-tomated early diagnostics of critical failures (e.g., broken rotor barsand electrical phase failures) for early warnings that may help insystem recovery and condition-based maintenance (CBM) [1–4].
This paper presents a fault diagnosis methodology for theelectric drive systems in electric ships, with focus on the brokenrotor bar faults and the stator winding short-circuit faults. The
rights reserved.
ta).
Wavelet-based informationoi.org/10.1016/j.isatra.2017.0
stator winding short-circuit faults are some of the most commontypes of faults that encompass 21% of the distribution of all faultsin electric motor drive systems [5]. The main reason for occurrenceof these faults is due to the unforeseen breakdown of insulationbetween components, which may occur across one or more of thephase windings in the stator or across the phase and nearbycomponents. Typically these faults are caused by intermittentvoltage overloads, winding displacements due to mechanical vi-brations, excessive heating, etc. The effects of such faults are highcurrents and more heating which results in further growth offaults. The broken rotor bar faults have also received notable at-tention which are more difficult to detect. Broken rotor bars aregenerally caused by stresses from electromagnetic forces or over-loaded operation conditions, inadequate rotor fabrication, androtor component wear from poor operating environments or lackof maintenance [6]. Broken rotor bars affect the distribution ofcurrent to other bars, sparking, torque fluctuations leading topremature wearing of bearings and other components, etc.
Most of the techniques reported in literature for motor faultdiagnosis rely on current and/or voltage signal analysis. Since theeffects of the above faults directly affect the current signals, the
filtering for fault diagnosis of electric drive systems in electric8.013i
A.A. Silva et al. / ISA Transactions ∎ (∎∎∎∎) ∎∎∎–∎∎∎2
motor current-signature analysis (MCSA) technique has gainedwide popularity for motor fault diagnosis [7]. Another advantageof the MCSA technique is that it is non-invasive. Using the current-signature analysis both the time-domain methods (e.g., observer-based residual computation [8] and neural networks baseddetection [9]) and frequency-domain methods [10] have been in-vestigated. However, due to the periodic nature of motor rotationit was observed that the effects of faults are well reflected in thefrequency spectrum of the motor current. Thus, frequency-domainbased techniques were accepted in literature as more reliablemeans for motor fault diagnosis. As such, methods such as the FastFourier transform (FFT) were used to extract the most pertinentinformation for motor fault diagnosis [11]. However, due to aver-aging properties of the FFT in the time-domain, the FFT basedmethods proved to be insufficient for general operating condi-tions. Therefore, more recently wavelet transform based methodswere proposed which provided both time and frequency resolu-tion [10,12].
The wavelet transform converts the one-dimensional timeseries data to two-dimensional scale-shift data, and contains moreinformation in the sense that it provides both time and frequencylocalization. However, despite the additional benefits of the two-dimensional information present in the wavelet domain, thereexists added computational complexity for machine learning forfault classification. Second, the information pertinent for the faultclassification problem might be hidden in localized regions in thewavelet domain. Thus, certain regions might contain useful in-formation that can facilitate better separation of classes while theother regions might not be so useful for class separation. As such,the use of such information that is not useful for separation of faultclasses can in fact degrade the performance of any well-knownclassifier. Thus, there exists a gap in understanding whether theentire two-dimensional domain of the wavelet transform is ne-cessary for motor diagnosis.
In this regard, this paper presents a wavelet-based filteringmethod that selects the optimal information-rich regions in thewavelet-domain which provide maximal separation between faultclasses. The data from these regions is then used to extract fea-tures which are compact and used in training a classifier for faultdiagnosis. The advantages are enhancement of the diagnosis ac-curacy as well as reduction of the computational complexity.
The fault diagnosis methodology is built upon the following fourmain processes: 1) Wavelet transformation of the motor currenttime-series data, 2) Filtering of optimal regions from the waveletdomain based on their available information content to separatedifferent fault classes, 3) Feature extraction via further reduction ofthe filtered data using the Principal Component Analysis (PCA), and4) Pattern classification using a diagnostic-tree classifier to diagnosedifferent faults in the system. The methodology was validated undervarious cruising speed conditions on the motor current data gener-ated from an experimentally validated model of the electric drives[13,14]. The results show a high correct classification rate with lowfalse alarm and miss detection rates.
The main contributions of the paper are as follows:
� Development of a method for filtering of information-rich re-gions in the wavelet-domain for extraction of useful features forenhancement of the fault classification accuracy.
� Construction of a diagnostic-tree classifier for sequential faultdiagnosis.
� Testing and validation of the methodology using an experi-mentally validated simulation model of the motor drive systemfor electric ships.
The paper is organized in six sections including the introduc-tion. Section 2 provides the relevant background information.
Please cite this article as: Silva AA, et al. Wavelet-based informationships. ISA Transactions (2017), http://dx.doi.org/10.1016/j.isatra.2017.
Section 3 presents a brief description of the motor drive system inelectric ships and provides the details of data generation for thenominal and different faulty conditions. Section 4 describes thewavelet-based fault diagnosis methodology developed in this pa-per. Section 5 presents the results and discussion, and finally, thepaper is concluded in Section 6 with suggestions for future work.
2. Literature review
Technical literature reports several approaches for motor cur-rent-signature analysis (MCSA) for the purpose of fault diagnosis.Amongst these neural networks based classification methods havebeen commonly used. Schoen et al. [11] implemented an ArtificialNeural Network (ANN) classifier for unsupervised, online learningof induction motor failures. Tallam et al. [9] extended the appli-cation of stator winding turn-fault detection for closed-loop in-duction motor drives based on ANNs. Murphey et al. [15] proposedthe fault diagnostic ANN for single-switch and post-short circuitfaults. Martins et al. [16] proposed a Hebbian-based ANN for un-supervised, online diagnosis of the stator faults utilizing vectorcurrent information. Ghate et al. [17] proposed an optimal multi-layer perceptron ANN and later explored cascaded ANN systemsfor induction motor fault detection [18].
Some methods based on residual computation have also beenproposed. Kallesoe et al. [8] presented an observer-based estima-tion of interturn short circuit faults in delta-connected inductionmotors. Tabbache et al. [19] implemented the Extended KalmanFilter (EKF) for residual generation of the motor parameters forsensor fault detection and post fault tolerance. De Angelo et al. [7]generated vectorial residuals for stator-interturn short-circuit de-tection. Cheng et al. [20] proposed a fault detection and identifi-cation approach of stator-turn faults using the transfer impedanceof closed-loop multiple-motor drives. Besides some machinelearning methods have also been proposed [21]. Georgoulas et al.[22] applied the Principal Component Analysis (PCA) with HiddenMarkov Models (HMM) for broken rotor fault diagnosis in asyn-chronous machines. Tran et al. [23] proposed a feature selection ofcurrent sensors based on decision trees to implement a neuro-fuzzy inference system.
As discussed earlier, the frequency-domain methods have beenaccepted as reliable diagnostic tools for motor fault diagnosis.Specifically, pattern classification using wavelet analysis [24] forfault diagnosis [25,26] have gained recent attention. Mohammedet al. [27] implemented the wavelets for faults diagnosis of per-manent magnet machines using a recently validated model basedon Finite Element Analysis (FEA). Ordaz-Moreno et al. [28] de-signed a broken bar detection algorithm based on discrete wave-lets for FPGA implementation. Cusido et al. [10] utilized the powerspectral density techniques in wavelet decomposition for machinefault detection. Li et al. [29] applied wavelet-based kurtosis sta-tistics for fault diagnosis in rolling bearings. Rajagopalan et al. [30]implemented the Zhao-Atlas-Marks distribution for nonstationarymotor fault detection. Rosero et al. [31] utilized the EmpiricalMode Decomposition (EMD) and Wigner-Ville distribution forshort-circuit detection of permanent magnet machines. Sadeghianet al. [32] detected broken rotor bar faults using wavelet packetsand neural networks. Konar et al. [33] utilized wavelet analysiswith Support Vector Machines (SVM) for bearing fault detection.Seshadrinath et al. [34,35] proposed Dual Tree complex waveletsfor interturn fault diagnosis, and more recently a classificationmethodology by applying the wavelet analysis for optimizedBayesian inference [12]. However, the applications of abovemethods for electric vehicles have been limited [36–39].
The above methods have shown the utility of using the wavelettransform for extracting features for motor fault diagnosis. But, as
filtering for fault diagnosis of electric drive systems in electric08.013i
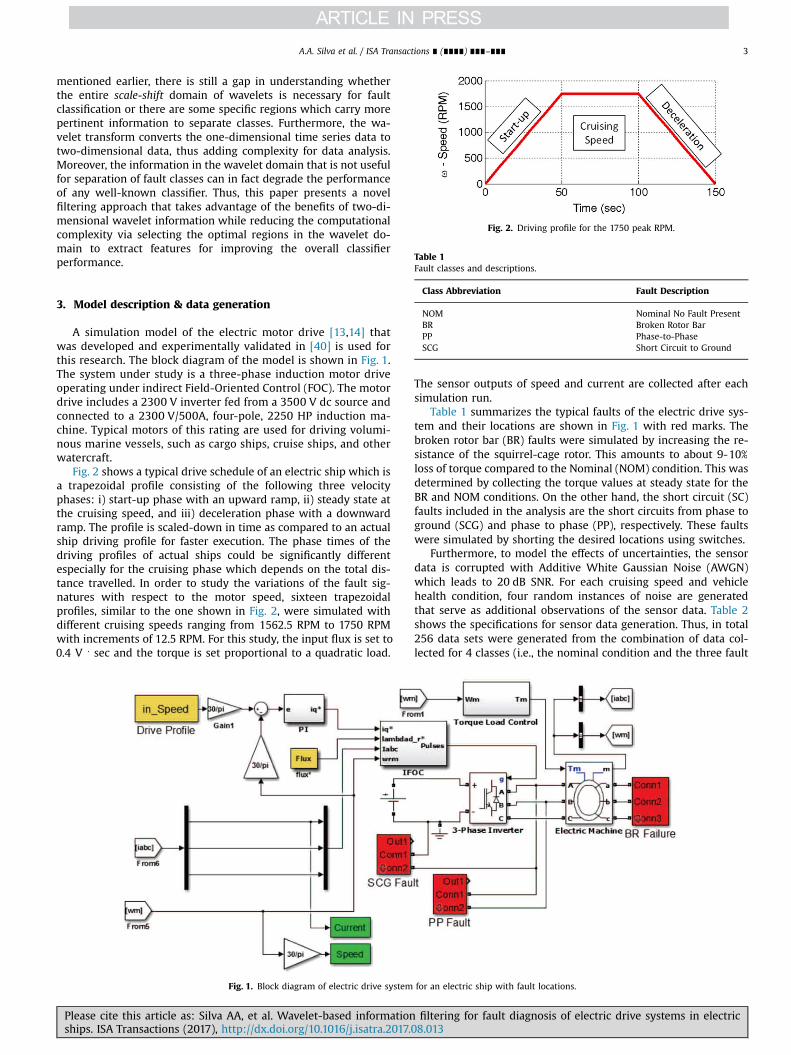
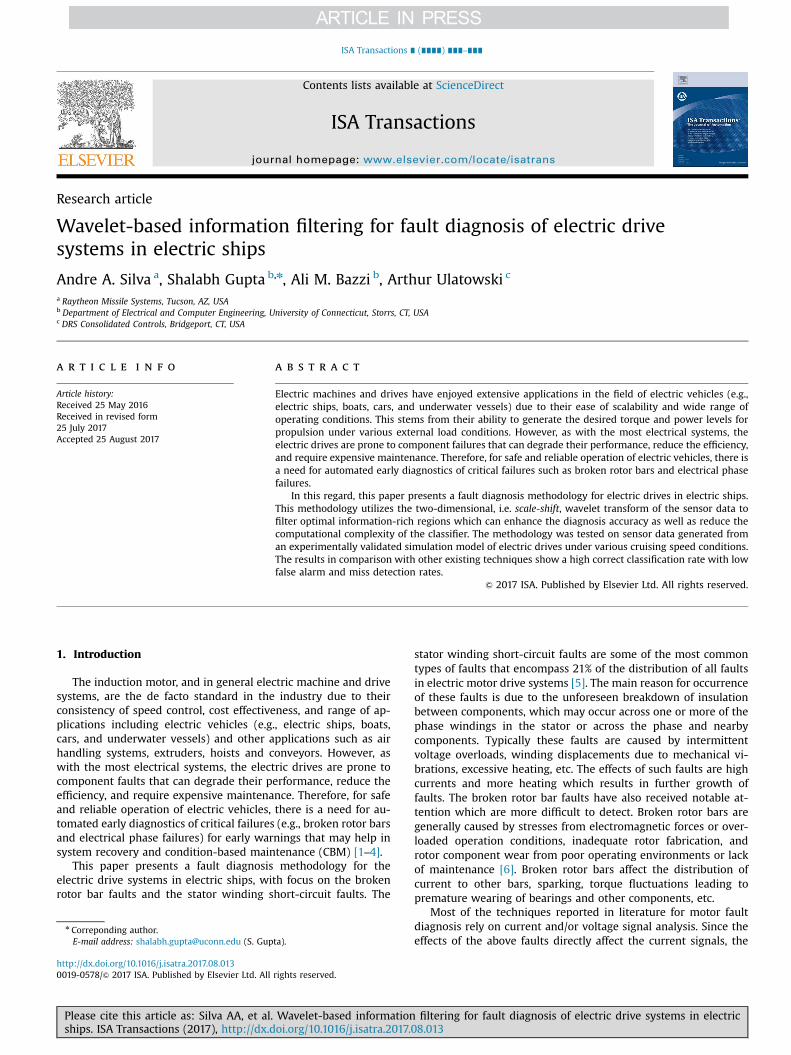
Fig. 2. Driving profile for the 1750 peak RPM.
Table 1Fault classes and descriptions.
A.A. Silva et al. / ISA Transactions ∎ (∎∎∎∎) ∎∎∎–∎∎∎ 3
mentioned earlier, there is still a gap in understanding whetherthe entire scale-shift domain of wavelets is necessary for faultclassification or there are some specific regions which carry morepertinent information to separate classes. Furthermore, the wa-velet transform converts the one-dimensional time series data totwo-dimensional data, thus adding complexity for data analysis.Moreover, the information in the wavelet domain that is not usefulfor separation of fault classes can in fact degrade the performanceof any well-known classifier. Thus, this paper presents a novelfiltering approach that takes advantage of the benefits of two-di-mensional wavelet information while reducing the computationalcomplexity via selecting the optimal regions in the wavelet do-main to extract features for improving the overall classifierperformance.
Class Abbreviation Fault Description
NOM Nominal No Fault PresentBR Broken Rotor BarPP Phase-to-PhaseSCG Short Circuit to Ground
3. Model description & data generation
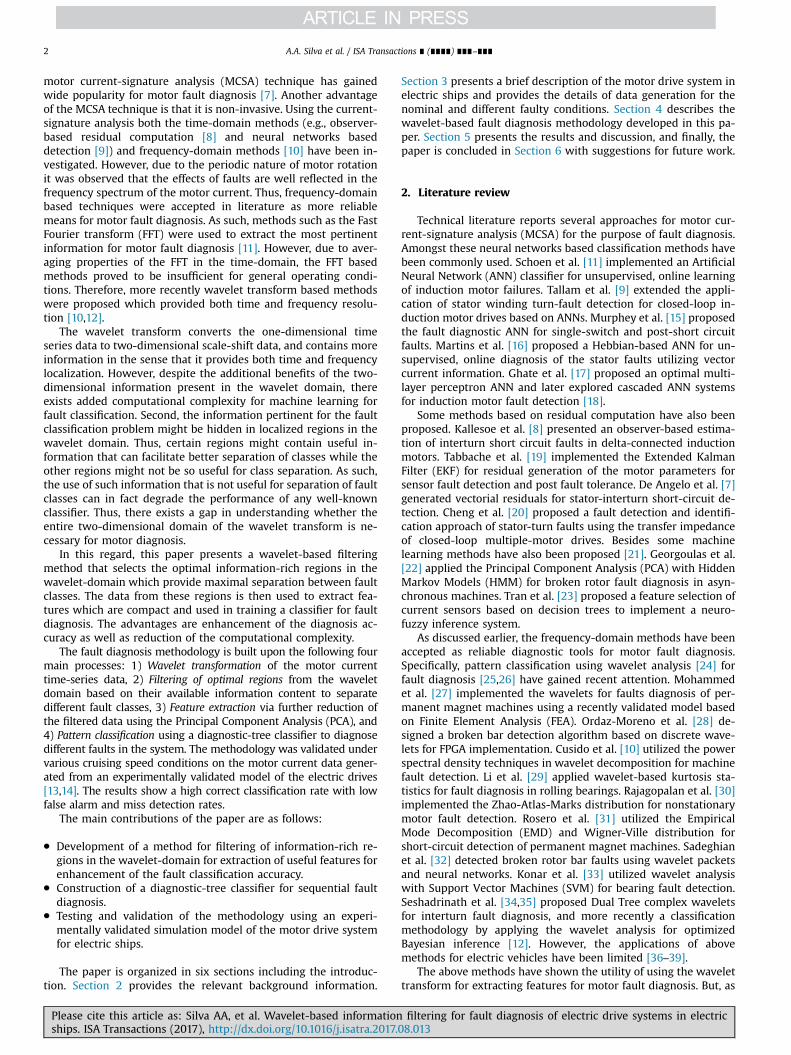
A simulation model of the electric motor drive [13,14] thatwas developed and experimentally validated in [40] is used forthis research. The block diagram of the model is shown in Fig. 1.The system under study is a three-phase induction motor driveoperating under indirect Field-Oriented Control (FOC). The motordrive includes a 2300 V inverter fed from a 3500 V dc source andconnected to a 2300 V/500A, four-pole, 2250 HP induction ma-chine. Typical motors of this rating are used for driving volumi-nous marine vessels, such as cargo ships, cruise ships, and otherwatercraft.
Fig. 2 shows a typical drive schedule of an electric ship which isa trapezoidal profile consisting of the following three velocityphases: i) start-up phase with an upward ramp, ii) steady state atthe cruising speed, and iii) deceleration phase with a downwardramp. The profile is scaled-down in time as compared to an actualship driving profile for faster execution. The phase times of thedriving profiles of actual ships could be significantly differentespecially for the cruising phase which depends on the total dis-tance travelled. In order to study the variations of the fault sig-natures with respect to the motor speed, sixteen trapezoidalprofiles, similar to the one shown in Fig. 2, were simulated withdifferent cruising speeds ranging from 1562.5 RPM to 1750 RPMwith increments of 12.5 RPM. For this study, the input flux is set to0.4 V · sec and the torque is set proportional to a quadratic load.
Fig. 1. Block diagram of electric drive system
Please cite this article as: Silva AA, et al. Wavelet-based informationships. ISA Transactions (2017), http://dx.doi.org/10.1016/j.isatra.2017.0
The sensor outputs of speed and current are collected after eachsimulation run.
Table 1 summarizes the typical faults of the electric drive sys-tem and their locations are shown in Fig. 1 with red marks. Thebroken rotor bar (BR) faults were simulated by increasing the re-sistance of the squirrel-cage rotor. This amounts to about 9-10%loss of torque compared to the Nominal (NOM) condition. This wasdetermined by collecting the torque values at steady state for theBR and NOM conditions. On the other hand, the short circuit (SC)faults included in the analysis are the short circuits from phase toground (SCG) and phase to phase (PP), respectively. These faultswere simulated by shorting the desired locations using switches.
Furthermore, to model the effects of uncertainties, the sensordata is corrupted with Additive White Gaussian Noise (AWGN)which leads to 20 dB SNR. For each cruising speed and vehiclehealth condition, four random instances of noise are generatedthat serve as additional observations of the sensor data. Table 2shows the specifications for sensor data generation. Thus, in total256 data sets were generated from the combination of data col-lected for 4 classes (i.e., the nominal condition and the three fault
for an electric ship with fault locations.
filtering for fault diagnosis of electric drive systems in electric8.013i
Table 2Data generation and specifications.
Simulation Parameters Values
Fault Class NOM, BR, PP, SCGCruising Speed [1562.50: 12.50: 1750] RPMInputs Speed command (RPM), Rotor flux (V · s)Sensor Outputs Speed (RPM), Current (A)Sampling Rate 1 kHzSensor Noise AWGN with 20 dB SNR
A.A. Silva et al. / ISA Transactions ∎ (∎∎∎∎) ∎∎∎–∎∎∎4
classes), 16 different cruising speed profiles, and 4 instances ofAWGN to the sensor data. Fig. 3 shows instances of the time-seriesdata collected for the nominal and the faulty conditions at the1575, 1625, 1675, and 1725 RPM cruising speeds. As seen in Fig. 3,the time-series data for different fault classes are overlapping,especially under the broken rotor bar and the nominal conditions;thus they are hard to separate in the time-domain. Therefore, thispaper presents the wavelet-based method which showed pro-mising results in separating the different fault classes as explainedbelow.
4. Fault diagnosis methodology
This section presents the fault diagnosis methodology forclassifying the signatures of the nominal and the three electricdrive system faults, as described above. Fig. 4 shows the archi-tecture of the methodology, which is divided into training andtesting phases. In the training phase, the system model is simu-lated for different cruise speed conditions. For each cruising speed,the simulation is run to generate sensor data for the nominal andthe three faulty conditions as described in the previous section.Subsequently, the wavelet transform is computed for each time-series data of the stator current. Then the optimal regions in thewavelet domain called pockets or cells are filtered, which containthe information to maximize the separation between differentclasses. The filtered data is then used for feature extraction and fortraining a classifier for fault diagnosis. In the testing phase, the
Fig. 3. Stator current time-series data collected for the nominal condition and for differenand d) 1725 RPM.
Please cite this article as: Silva AA, et al. Wavelet-based informationships. ISA Transactions (2017), http://dx.doi.org/10.1016/j.isatra.2017.
trained classifier is applied to make the correct diagnosis of thesystem using the current sensor data with a priori unknown class.Further details are presented in the following subsections.
4.1. Wavelet analysis of the current data
For a time-domain signal ( )f t in any ( )2 space, the signal canbe expanded by the use of a family of orthonormal wavelet func-tions, such that
⎜ ⎟⎛⎝
⎞⎠∫τ ψ τ[ ]( ) =
| |( ) * −
( )ψW f ss
f tt
sdt,
11
where ψ ( )t is the mother wavelet, = …s m1, , and τ = … n1, , arethe scale and translation parameters respectively, and τ[ ]( )ψW f s, isthe wavelet transform of the signal ( )f t [25]. Wavelet analysis is aneffective tool that extracts the two-dimensional scale-shift in-formation from time-domain signals. Thus the ×m n waveletcoefficient matrix is generated from the current time-series data.The magnitude-square is computed from the wavelet data formathematical convenience.
4.2. Partitioning of the wavelet domain
Once the wavelet transform is computed from the current data,the two-dimensional wavelet domain is partitioned into a series ofregions called cells, as described here. Let ∈ +a and ∈ +b be thenumber of partitions of the scale and translation axes of the wa-velet domain respectively, such that m mod =a 0 and n mod =b 0.Then the total number of cells is equal to ab and each cell is of size( × )m
anb.
Now let ( )i j, denote the index of any particular cell where∈ …i a1, , and ∈ …j b1, , . Then the contents or the wavelet
coefficients inside this cell are given by
= [ ]( ) ( )ψW W f S T, 2i j i j,
where
t fault classes, at different cruising speeds: a) 1575 RPM, b) 1625 RPM, c) 1675 RPM,
filtering for fault diagnosis of electric drive systems in electric08.013i
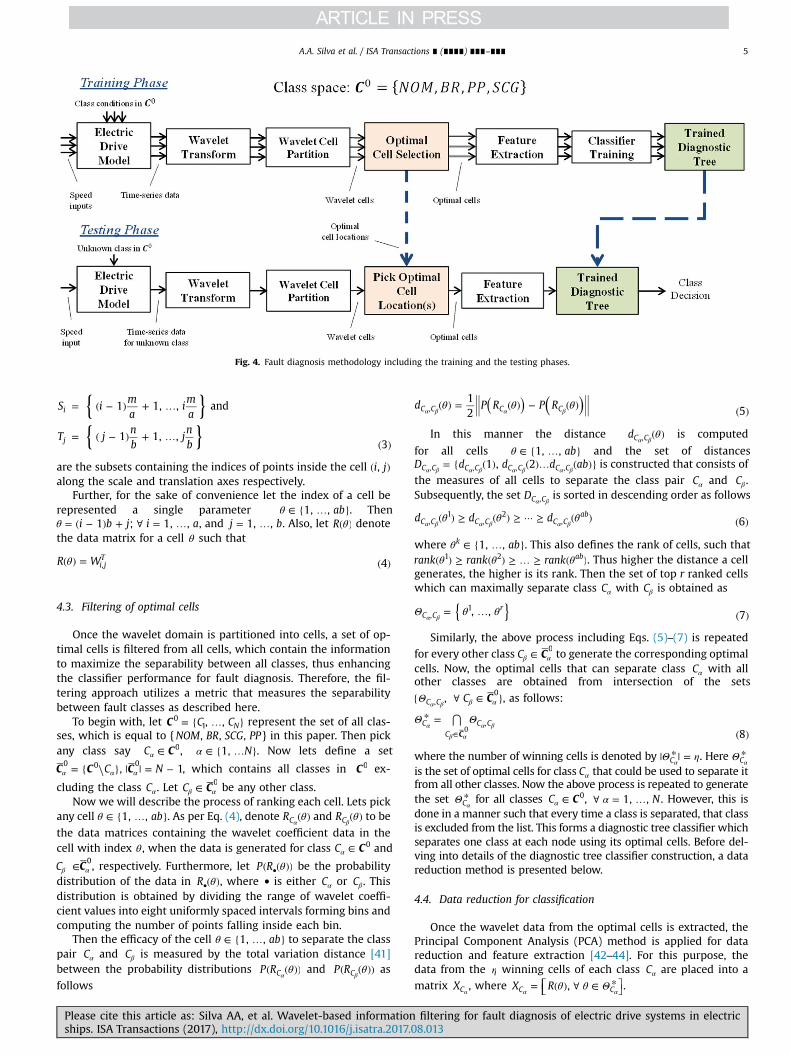
Fig. 4. Fault diagnosis methodology including the training and the testing phases.
A.A. Silva et al. / ISA Transactions ∎ (∎∎∎∎) ∎∎∎–∎∎∎ 5
{ }{ }
= ( − ) + …
= ( − ) + …( )
S ima
ima
T jnb
jnb
1 1, , and
1 1, ,3
i
j
are the subsets containing the indices of points inside the cell ( )i j,along the scale and translation axes respectively.
Further, for the sake of convenience let the index of a cell berepresented a single parameter θ ∈ { … }ab1, , . Thenθ = ( − ) + ∀ = …i b j i a1 ; 1, , , and = …j b1, , . Also, let θ( )R denotethe data matrix for a cell θ such that
θ( ) = ( )R W 4i jT,
4.3. Filtering of optimal cells
Once the wavelet domain is partitioned into cells, a set of op-timal cells is filtered from all cells, which contain the informationto maximize the separability between all classes, thus enhancingthe classifier performance for fault diagnosis. Therefore, the fil-tering approach utilizes a metric that measures the separabilitybetween fault classes as described here.
To begin with, let = { … }C C C, , N0
1 represent the set of all clas-ses, which is equal to {NOM BR SCG PP, , , } in this paper. Then pickany class say ∈α CC 0, α ∈ { … }N1, . Now lets define a set
= { ⧹ } | | = −α α αC C CC N, 10 0 0
, which contains all classes in C0 ex-
cluding the class αC . Let ∈β αCC0 be any other class.
Now we will describe the process of ranking each cell. Lets pickany cell θ ∈ { … }ab1, , . As per Eq. (4), denote θ( )
αRC and θ( )
βRC to be
the data matrices containing the wavelet coefficient data in thecell with index θ , when the data is generated for class ∈α CC 0 and
βC ∈ αC 0, respectively. Furthermore, let θ( ( ))•P R be the probability
distribution of the data in θ( )•R , where • is either αC or βC . Thisdistribution is obtained by dividing the range of wavelet coeffi-cient values into eight uniformly spaced intervals forming bins andcomputing the number of points falling inside each bin.
Then the efficacy of the cell θ ∈ { … }ab1, , to separate the classpair αC and βC is measured by the total variation distance [41]between the probability distributions θ( ( ))
αP RC and θ( ( ))
βP RC as
follows
Please cite this article as: Silva AA, et al. Wavelet-based informationships. ISA Transactions (2017), http://dx.doi.org/10.1016/j.isatra.2017.0
( )( )θ θ θ( ) = ( ) − ( ) ( )α β α βd P R P R
12 5C C C C,
In this manner the distance θ( )α β
dC C, is computed
for all cells θ ∈ { … }ab1, , and the set of distances= { ( ) ( )… ( )}
α β α β α β α βD d d d ab1 , 2C C C C C C C C, , , , is constructed that consists of
the measures of all cells to separate the class pair αC and βC .Subsequently, the set
α βDC C, is sorted in descending order as follows
θ θ θ( ) ≥ ( ) ≥ ··· ≥ ( ) ( )α β α β α βd d d 6C C C C C C
ab,
1,
2,
where θ ∈ { … }ab1, ,k . This also defines the rank of cells, such thatθ θ θ( ) ≥ ( ) ≥ … ≥ ( )rank rank rank ab1 2 . Thus higher the distance a cell
generates, the higher is its rank. Then the set of top r ranked cellswhich can maximally separate class αC with βC is obtained as
{ }Θ θ θ= … ( )α β, , 7C C
r,
1
Similarly, the above process including Eqs. (5)–(7) is repeated
for every other class ∈β αCC0 to generate the corresponding optimal
cells. Now, the optimal cells that can separate class αC with allother classes are obtained from intersection of the sets
Θ{ ∀ ∈ }β αα βCC,C C,
0, as follows:
Θ Θ* = ⋂( )∈
αβ α
α β8C
CC
C C,0
where the number of winning cells is denoted by Θ η| * | =αC . Here Θ *
αC
is the set of optimal cells for class αC that could be used to separate itfrom all other classes. Now the above process is repeated to generatethe set Θ *
αC for all classes ∈α CC 0, α∀ = … N1, , . However, this isdone in a manner such that every time a class is separated, that classis excluded from the list. This forms a diagnostic tree classifier whichseparates one class at each node using its optimal cells. Before del-ving into details of the diagnostic tree classifier construction, a datareduction method is presented below.
4.4. Data reduction for classification
Once the wavelet data from the optimal cells is extracted, thePrincipal Component Analysis (PCA) method is applied for datareduction and feature extraction [42–44]. For this purpose, thedata from the η winning cells of each class αC are placed into a
matrixα
XC , where ⎡⎣ ⎤⎦θ θ Θ= ( ) ∀ ∈ *α α
X R ,C C .
filtering for fault diagnosis of electric drive systems in electric8.013i
A.A. Silva et al. / ISA Transactions ∎ (∎∎∎∎) ∎∎∎–∎∎∎6
Using the Karhunen-Loève (KL) algorithm, the uncorrelatedfeatures, called Principal Components (PC's) or score vectors, areinferred from the data matrix
αXC based on the variance max-
imization principle. These PC's capture the most information in theclasses from the original data matrix, as can be seen by the for-mation of separable clusters in the feature space. The KL algorithmis briefly summarized as follows:
(1) The covariance matrix Σ ofα
XC is computed and the left ei-genvalues λ{ }i and the corresponding eigenvectors { }ei areobtained where η= …i 1, , .
(2) The eigenvalues are sorted and the η<q largest dominatingeigenvalues are selected.
(3) Using the q eigenvectors that correspond to the largest ei-genvalues, a transformation matrix is obtained whichtransforms the data set
αXC into a feature vector
αYC , using Eq.
(9) below.
= × ( )α αY X 9C C
The feature vectorα
YC could be viewed as n feature points in a qdimensional feature space. The above process is repeated for allclasses αC to obtain the feature points for all classes which areincluded in the feature space. Furthermore, since electric shipscould possibly operate at different cruising speeds, the featurevectors
αYC are obtained for different cruising speeds as described
earlier. The feature space is then augmented by an additional axisof the cruising speed ω to make the approach adaptive to differentcruising conditions.
4.5. Fault classification using a diagnostic tree
The fault diagnosis approach is formulated as a diagnostic treeclassifier which separates one class from the rest at each node asshown in Fig. 5. This approach is useful for sequential diagnosis ifthere are multiple classes and their optimal cells are different.Hence, each node of the diagnostic tree uses the optimal cells forthe class that is separated at that node. First, the tree performsoptimization to identify the best class to separate at each level.Then, a classifier is trained to isolate that class on the feature dataextracted from the optimal cells for that class. The construction ofthe tree is explained here.
At node 1 of the tree, the full class set = { … }C C C C, , N0
1 2 formsthe entering class set. Then the most separable class say ϕ ∈ C1 0 isseparated from others using the optimal cells for ϕ1. Then the
Fig. 5. Diagnostic Tree.
Please cite this article as: Silva AA, et al. Wavelet-based informationships. ISA Transactions (2017), http://dx.doi.org/10.1016/j.isatra.2017.
other branch of the tree starts at node 2 with entry class set asϕ= { ⧹ }C C1 0 1 . The above process is repeated at all nodes until all
classes are separated. Now we explain how the optimal cells andclass are obtained at every level of the tree for sequentialclassification.
In general, let ℓ represent a certain level of the tree, whereℓ = … −N1, , 1. Let ℓ−C 1 be the entering class set at level ℓ of thetree, such that it contains | | = − ℓ +ℓ−C N 11 classes. Further, let
∈αℓ−CC 1 be any class that has not already been separated at a
previous level. Let = { ⧹ }α αℓ− ℓ−C C C
1 1 be the set of other remaining
classes such that it contains | | = − ℓαℓ−C N
1classes. Now the opti-
mal cells to separate class ∈αℓ−CC 1 from all other classes ∈β α
ℓ−CC1
are defined in a set Θ *ℓαC which is obtained using the procedure
described in Eqs. (5)–(8). However, as described above the proce-dure is performed only over the available classes at level ℓ, i.e. theclass set α
ℓ−C 1. Similarly the optimal cells Θ *ℓ
αC are obtained for
every class ∈αℓ−CC 1 at level ℓ of the tree.
Now the optimal class ϕ ∈ℓ ℓ−C 1 to be separated at level ℓ ofthe tree is obtained as follows. First, the total separability measureof each class ∈α
ℓ−CC 1 is computed as
∑ ∑Δη
θ= ( )( )*θ Θ
ℓ
∈ ∈α
β α α
α βℓ− ℓ
d1
10C
C
C
C C,
C1
Then, the optimal class to separate at level ℓ is
ϕ Δ= ( )( )
ℓ
∈
ℓ
ααℓ−
arg max11CC
C1
The exit class set of level ℓ that forms the entering class set oflevel ℓ + 1 is then given as
ϕ= { ⧹ } ( )ℓ ℓ− ℓC C 121
Fig. 5 shows the tree for the electric ship fault diagnosis pro-blem and the table underneath describes the optimal class sepa-rated as well as the entering class set at each level. This tree will befurther discussed in the results section. At each level of the tree,the optimal class is selected using Eq. (11) and features are ex-tracted from the optimal cells for that class using the methoddescribed in section 4.4. Subsequently, a classifier is constructed ateach level to separate the optimal class vs the rest. The k-NearestNeighbor (k-NN) classifier is used in this paper that acts accordingto majority vote rule where any test point is assigned to a classwhich has the majority occurrence in its k-nearest neighbors [42]in the feature space. Since at each level of the diagnostic tree theclassifier makes only binary decisions for separation of the optimalclass with the rest, the feature data of all classes other than theoptimal class are grouped together and re-labeled. It was observedthat the binary tree architecture simplifies the construction of theclassifier and also improves the classification accuracy.
4.6. Training and testing of the tree
In the training phase, the diagnostic tree is constructed andfixed. The tree construction includes the following at each level:the optimal class to be separated, the optimal cells for that class,and the corresponding classifier. In the testing phase, the decisionsare made for the new test data with unknown class label. Startingwith ℓ = 1, the test data is transformed into the wavelet domain.Then the optimal cells for the optimal class at level ℓ = 1, thatwere found in the training phase, are used to extract features.Subsequently, the classifier for this level is employed to make abinary decision between the optimal class vs the rest. If the de-cision happens to be that of the optimal class, then the operationstops. Otherwise it moves down to the next level of the tree and
filtering for fault diagnosis of electric drive systems in electric08.013i
A.A. Silva et al. / ISA Transactions ∎ (∎∎∎∎) ∎∎∎–∎∎∎ 7
the same process is repeated as above and so on until we reach thebottom of the tree thus making a final decision.
The performance of the overall diagnostic tree classifier wasevaluated using the K-fold Cross-Validation (CV) algorithm, where(K-1) data sets are randomly selected for training the classifierwhile the remaining one is used for testing, and this process isrepeated K times. In this paper K¼256, which is equal to the totalnumber of data sets generated from different simulation runs. Ateach iteration, the output of the diagnostic tree is recorded into aconfusion matrix, which compares the classifier decisions vs. theactual class labels of the test data.
5. Results & discussion
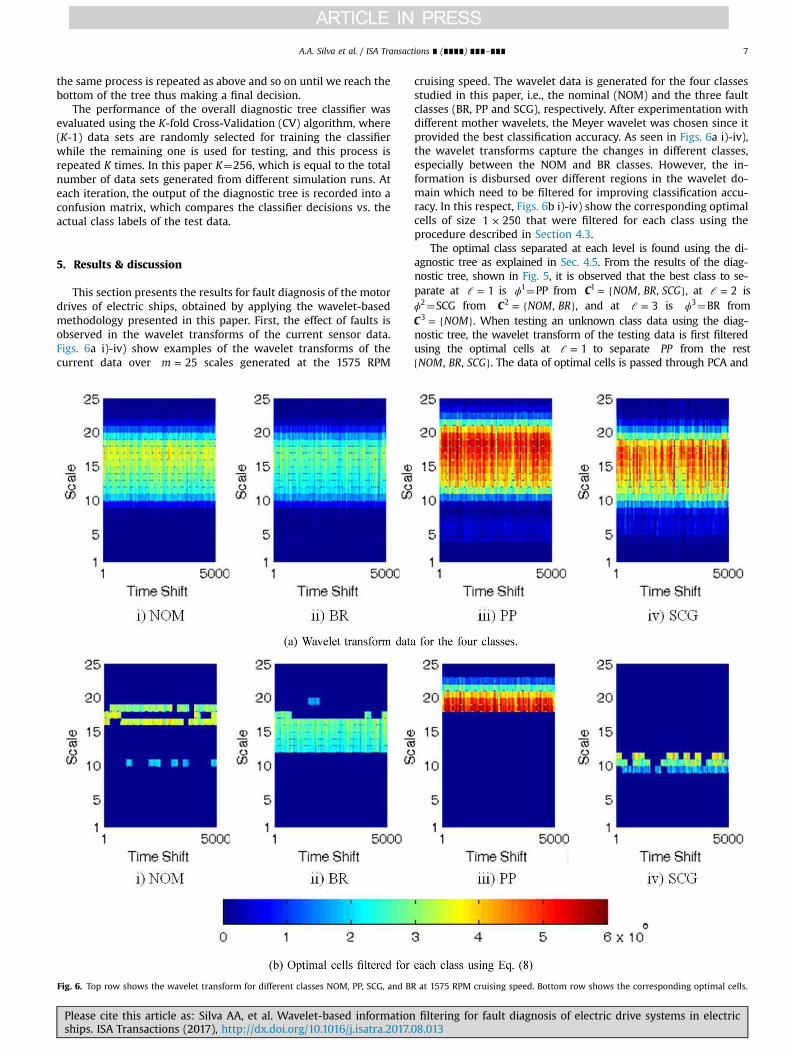
This section presents the results for fault diagnosis of the motordrives of electric ships, obtained by applying the wavelet-basedmethodology presented in this paper. First, the effect of faults isobserved in the wavelet transforms of the current sensor data.Figs. 6a i)-iv) show examples of the wavelet transforms of thecurrent data over =m 25 scales generated at the 1575 RPM
Fig. 6. Top row shows the wavelet transform for different classes NOM, PP, SCG, and BR
Please cite this article as: Silva AA, et al. Wavelet-based informationships. ISA Transactions (2017), http://dx.doi.org/10.1016/j.isatra.2017.0
cruising speed. The wavelet data is generated for the four classesstudied in this paper, i.e., the nominal (NOM) and the three faultclasses (BR, PP and SCG), respectively. After experimentation withdifferent mother wavelets, the Meyer wavelet was chosen since itprovided the best classification accuracy. As seen in Figs. 6a i)-iv),the wavelet transforms capture the changes in different classes,especially between the NOM and BR classes. However, the in-formation is disbursed over different regions in the wavelet do-main which need to be filtered for improving classification accu-racy. In this respect, Figs. 6b i)-iv) show the corresponding optimalcells of size ×1 250 that were filtered for each class using theprocedure described in Section 4.3.
The optimal class separated at each level is found using the di-agnostic tree as explained in Sec. 4.5. From the results of the diag-nostic tree, shown in Fig. 5, it is observed that the best class to se-parate at ℓ = 1 is ϕ1¼PP from = { }C NOM BR SCG, ,1 , at ℓ = 2 isϕ2¼SCG from = { }C NOM BR,2 , and at ℓ = 3 is ϕ3¼BR from
= { }C NOM3 . When testing an unknown class data using the diag-nostic tree, the wavelet transform of the testing data is first filteredusing the optimal cells at ℓ = 1 to separate PP from the rest{ }NOM BR SCG, , . The data of optimal cells is passed through PCA and
at 1575 RPM cruising speed. Bottom row shows the corresponding optimal cells.
filtering for fault diagnosis of electric drive systems in electric8.013i
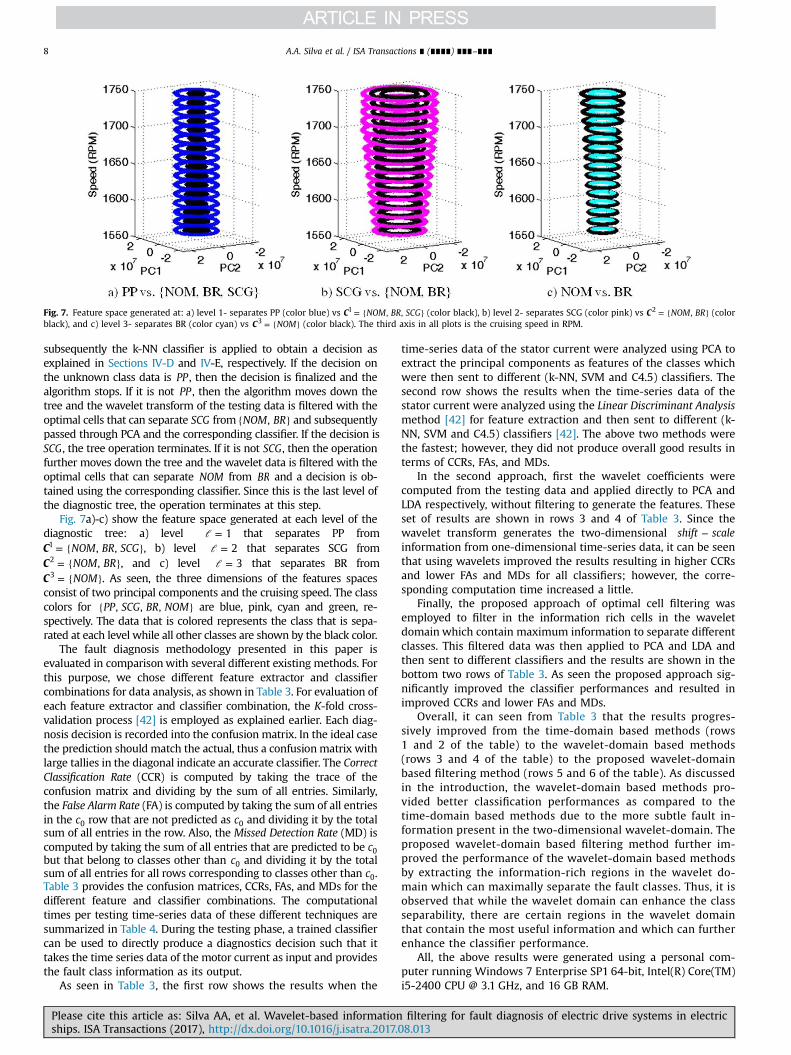
Fig. 7. Feature space generated at: a) level 1- separates PP (color blue) vs = { }C NOM BR SCG, ,1 (color black), b) level 2- separates SCG (color pink) vs = { }C NOM BR,2 (colorblack), and c) level 3- separates BR (color cyan) vs = { }C NOM3 (color black). The third axis in all plots is the cruising speed in RPM.
A.A. Silva et al. / ISA Transactions ∎ (∎∎∎∎) ∎∎∎–∎∎∎8
subsequently the k-NN classifier is applied to obtain a decision asexplained in Sections IV-D and IV-E, respectively. If the decision onthe unknown class data is PP , then the decision is finalized and thealgorithm stops. If it is not PP , then the algorithm moves down thetree and the wavelet transform of the testing data is filtered with theoptimal cells that can separate SCG from { }NOM BR, and subsequentlypassed through PCA and the corresponding classifier. If the decision isSCG, the tree operation terminates. If it is not SCG, then the operationfurther moves down the tree and the wavelet data is filtered with theoptimal cells that can separate NOM from BR and a decision is ob-tained using the corresponding classifier. Since this is the last level ofthe diagnostic tree, the operation terminates at this step.
Fig. 7a)-c) show the feature space generated at each level of thediagnostic tree: a) level ℓ = 1 that separates PP from
= { }C NOM BR SCG, ,1 , b) level ℓ = 2 that separates SCG from= { }C NOM BR,2 , and c) level ℓ = 3 that separates BR from= { }C NOM3 . As seen, the three dimensions of the features spaces
consist of two principal components and the cruising speed. The classcolors for { }PP SCG BR NOM, , , are blue, pink, cyan and green, re-spectively. The data that is colored represents the class that is sepa-rated at each level while all other classes are shown by the black color.
The fault diagnosis methodology presented in this paper isevaluated in comparisonwith several different existing methods. Forthis purpose, we chose different feature extractor and classifiercombinations for data analysis, as shown in Table 3. For evaluation ofeach feature extractor and classifier combination, the K-fold cross-validation process [42] is employed as explained earlier. Each diag-nosis decision is recorded into the confusion matrix. In the ideal casethe prediction should match the actual, thus a confusionmatrix withlarge tallies in the diagonal indicate an accurate classifier. The CorrectClassification Rate (CCR) is computed by taking the trace of theconfusion matrix and dividing by the sum of all entries. Similarly,the False Alarm Rate (FA) is computed by taking the sum of all entriesin the c0 row that are not predicted as c0 and dividing it by the totalsum of all entries in the row. Also, the Missed Detection Rate (MD) iscomputed by taking the sum of all entries that are predicted to be c0but that belong to classes other than c0 and dividing it by the totalsum of all entries for all rows corresponding to classes other than c0.Table 3 provides the confusion matrices, CCRs, FAs, and MDs for thedifferent feature and classifier combinations. The computationaltimes per testing time-series data of these different techniques aresummarized in Table 4. During the testing phase, a trained classifiercan be used to directly produce a diagnostics decision such that ittakes the time series data of the motor current as input and providesthe fault class information as its output.
As seen in Table 3, the first row shows the results when the
Please cite this article as: Silva AA, et al. Wavelet-based informationships. ISA Transactions (2017), http://dx.doi.org/10.1016/j.isatra.2017.
time-series data of the stator current were analyzed using PCA toextract the principal components as features of the classes whichwere then sent to different (k-NN, SVM and C4.5) classifiers. Thesecond row shows the results when the time-series data of thestator current were analyzed using the Linear Discriminant Analysismethod [42] for feature extraction and then sent to different (k-NN, SVM and C4.5) classifiers [42]. The above two methods werethe fastest; however, they did not produce overall good results interms of CCRs, FAs, and MDs.
In the second approach, first the wavelet coefficients werecomputed from the testing data and applied directly to PCA andLDA respectively, without filtering to generate the features. Theseset of results are shown in rows 3 and 4 of Table 3. Since thewavelet transform generates the two-dimensional −shift scaleinformation from one-dimensional time-series data, it can be seenthat using wavelets improved the results resulting in higher CCRsand lower FAs and MDs for all classifiers; however, the corre-sponding computation time increased a little.
Finally, the proposed approach of optimal cell filtering wasemployed to filter in the information rich cells in the waveletdomain which contain maximum information to separate differentclasses. This filtered data was then applied to PCA and LDA andthen sent to different classifiers and the results are shown in thebottom two rows of Table 3. As seen the proposed approach sig-nificantly improved the classifier performances and resulted inimproved CCRs and lower FAs and MDs.
Overall, it can seen from Table 3 that the results progres-sively improved from the time-domain based methods (rows1 and 2 of the table) to the wavelet-domain based methods(rows 3 and 4 of the table) to the proposed wavelet-domainbased filtering method (rows 5 and 6 of the table). As discussedin the introduction, the wavelet-domain based methods pro-vided better classification performances as compared to thetime-domain based methods due to the more subtle fault in-formation present in the two-dimensional wavelet-domain. Theproposed wavelet-domain based filtering method further im-proved the performance of the wavelet-domain based methodsby extracting the information-rich regions in the wavelet do-main which can maximally separate the fault classes. Thus, it isobserved that while the wavelet domain can enhance the classseparability, there are certain regions in the wavelet domainthat contain the most useful information and which can furtherenhance the classifier performance.
All, the above results were generated using a personal com-puter running Windows 7 Enterprise SP1 64-bit, Intel(R) Core(TM)i5-2400 CPU @ 3.1 GHz, and 16 GB RAM.
filtering for fault diagnosis of electric drive systems in electric08.013i
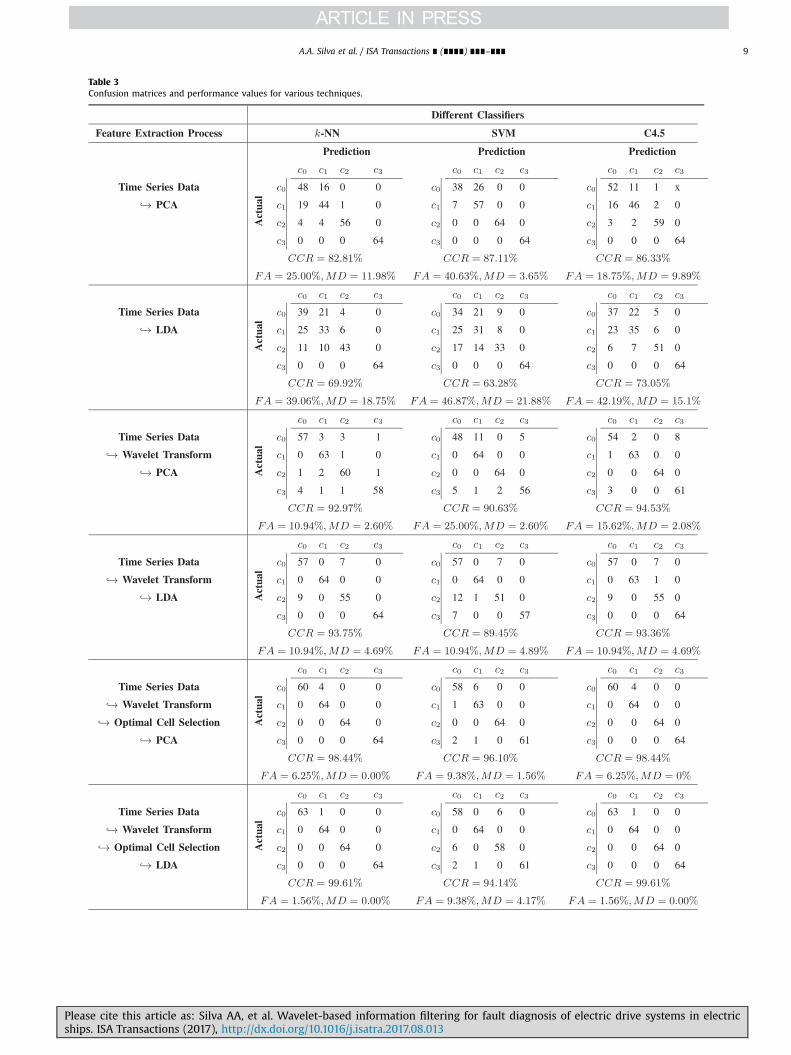
Table 3Confusion matrices and performance values for various techniques.
A.A. Silva et al. / ISA Transactions ∎ (∎∎∎∎) ∎∎∎–∎∎∎ 9
Please cite this article as: Silva AA, et al. Wavelet-based information filtering for fault diagnosis of electric drive systems in electricships. ISA Transactions (2017), http://dx.doi.org/10.1016/j.isatra.2017.08.013i
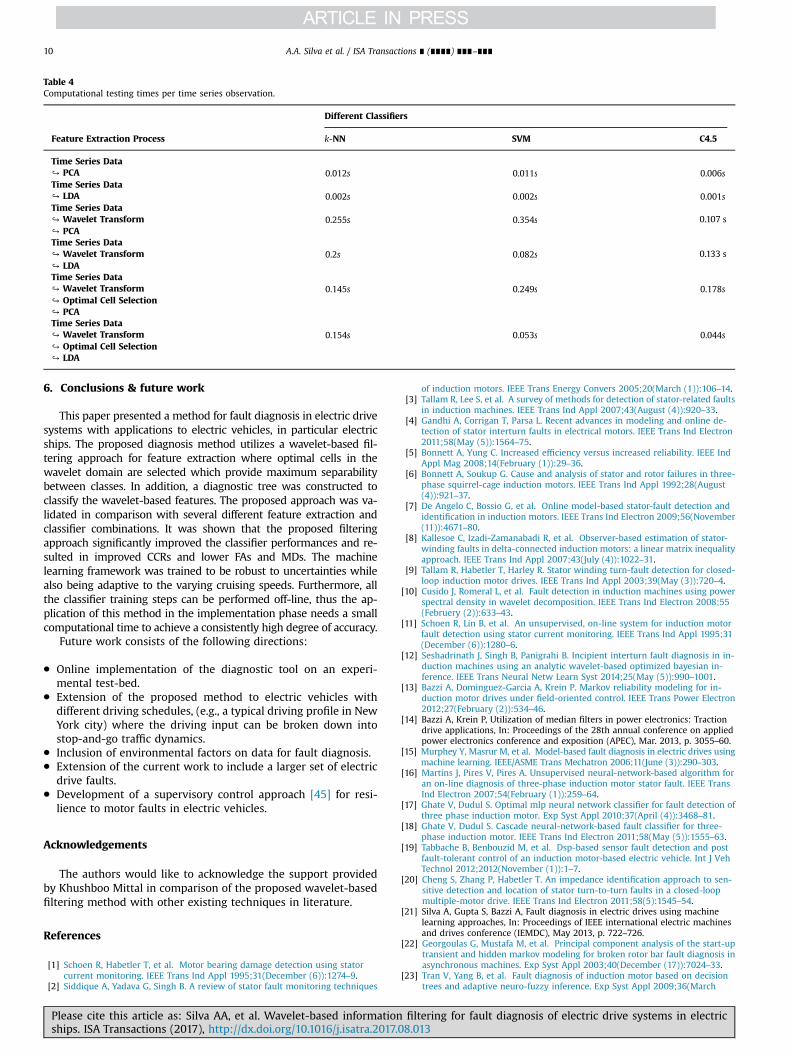
Table 4Computational testing times per time series observation.
Different Classifiers
Feature Extraction Process k-NN SVM C4.5
Time Series Data↪ PCA s0.012 s0.011 s0.006Time Series Data↪ LDA s0.002 s0.002 s0.001Time Series Data↪ Wavelet Transform s0.255 s0.354 0.107 s↪ PCATime Series Data↪ Wavelet Transform s0.2 s0.082 0.133 s↪ LDATime Series Data↪ Wavelet Transform s0.145 s0.249 s0.178↪ Optimal Cell Selection↪ PCATime Series Data↪ Wavelet Transform s0.154 s0.053 s0.044↪ Optimal Cell Selection↪ LDA
A.A. Silva et al. / ISA Transactions ∎ (∎∎∎∎) ∎∎∎–∎∎∎10
6. Conclusions & future work
This paper presented a method for fault diagnosis in electric drivesystems with applications to electric vehicles, in particular electricships. The proposed diagnosis method utilizes a wavelet-based fil-tering approach for feature extraction where optimal cells in thewavelet domain are selected which provide maximum separabilitybetween classes. In addition, a diagnostic tree was constructed toclassify the wavelet-based features. The proposed approach was va-lidated in comparison with several different feature extraction andclassifier combinations. It was shown that the proposed filteringapproach significantly improved the classifier performances and re-sulted in improved CCRs and lower FAs and MDs. The machinelearning framework was trained to be robust to uncertainties whilealso being adaptive to the varying cruising speeds. Furthermore, allthe classifier training steps can be performed off-line, thus the ap-plication of this method in the implementation phase needs a smallcomputational time to achieve a consistently high degree of accuracy.
Future work consists of the following directions:
� Online implementation of the diagnostic tool on an experi-mental test-bed.
� Extension of the proposed method to electric vehicles withdifferent driving schedules, (e.g., a typical driving profile in NewYork city) where the driving input can be broken down intostop-and-go traffic dynamics.
� Inclusion of environmental factors on data for fault diagnosis.� Extension of the current work to include a larger set of electric
drive faults.� Development of a supervisory control approach [45] for resi-
lience to motor faults in electric vehicles.
Acknowledgements
The authors would like to acknowledge the support providedby Khushboo Mittal in comparison of the proposed wavelet-basedfiltering method with other existing techniques in literature.
References
[1] Schoen R, Habetler T, et al. Motor bearing damage detection using statorcurrent monitoring. IEEE Trans Ind Appl 1995;31(December (6)):1274–9.
[2] Siddique A, Yadava G, Singh B. A review of stator fault monitoring techniques
Please cite this article as: Silva AA, et al. Wavelet-based informationships. ISA Transactions (2017), http://dx.doi.org/10.1016/j.isatra.2017.
of induction motors. IEEE Trans Energy Convers 2005;20(March (1)):106–14.[3] Tallam R, Lee S, et al. A survey of methods for detection of stator-related faults
in induction machines. IEEE Trans Ind Appl 2007;43(August (4)):920–33.[4] Gandhi A, Corrigan T, Parsa L. Recent advances in modeling and online de-
tection of stator interturn faults in electrical motors. IEEE Trans Ind Electron2011;58(May (5)):1564–75.
[5] Bonnett A, Yung C. Increased efficiency versus increased reliability. IEEE IndAppl Mag 2008;14(February (1)):29–36.
[6] Bonnett A, Soukup G. Cause and analysis of stator and rotor failures in three-phase squirrel-cage induction motors. IEEE Trans Ind Appl 1992;28(August(4)):921–37.
[7] De Angelo C, Bossio G, et al. Online model-based stator-fault detection andidentification in induction motors. IEEE Trans Ind Electron 2009;56(November(11)):4671–80.
[8] Kallesoe C, Izadi-Zamanabadi R, et al. Observer-based estimation of stator-winding faults in delta-connected induction motors: a linear matrix inequalityapproach. IEEE Trans Ind Appl 2007;43(July (4)):1022–31.
[9] Tallam R, Habetler T, Harley R. Stator winding turn-fault detection for closed-loop induction motor drives. IEEE Trans Ind Appl 2003;39(May (3)):720–4.
[10] Cusido J, Romeral L, et al. Fault detection in induction machines using powerspectral density in wavelet decomposition. IEEE Trans Ind Electron 2008;55(Februery (2)):633–43.
[11] Schoen R, Lin B, et al. An unsupervised, on-line system for induction motorfault detection using stator current monitoring. IEEE Trans Ind Appl 1995;31(December (6)):1280–6.
[12] Seshadrinath J, Singh B, Panigrahi B. Incipient interturn fault diagnosis in in-duction machines using an analytic wavelet-based optimized bayesian in-ference. IEEE Trans Neural Netw Learn Syst 2014;25(May (5)):990–1001.
[13] Bazzi A, Dominguez-Garcia A, Krein P. Markov reliability modeling for in-duction motor drives under field-oriented control. IEEE Trans Power Electron2012;27(February (2)):534–46.
[14] Bazzi A, Krein P, Utilization of median filters in power electronics: Tractiondrive applications, In: Proceedings of the 28th annual conference on appliedpower electronics conference and exposition (APEC), Mar. 2013, p. 3055–60.
[15] Murphey Y, Masrur M, et al. Model-based fault diagnosis in electric drives usingmachine learning. IEEE/ASME Trans Mechatron 2006;11(June (3)):290–303.
[16] Martins J, Pires V, Pires A. Unsupervised neural-network-based algorithm foran on-line diagnosis of three-phase induction motor stator fault. IEEE TransInd Electron 2007;54(February (1)):259–64.
[17] Ghate V, Dudul S. Optimal mlp neural network classifier for fault detection ofthree phase induction motor. Exp Syst Appl 2010;37(April (4)):3468–81.
[18] Ghate V, Dudul S. Cascade neural-network-based fault classifier for three-phase induction motor. IEEE Trans Ind Electron 2011;58(May (5)):1555–63.
[19] Tabbache B, Benbouzid M, et al. Dsp-based sensor fault detection and postfault-tolerant control of an induction motor-based electric vehicle. Int J VehTechnol 2012;2012(November (1)):1–7.
[20] Cheng S, Zhang P, Habetler T. An impedance identification approach to sen-sitive detection and location of stator turn-to-turn faults in a closed-loopmultiple-motor drive. IEEE Trans Ind Electron 2011;58(5):1545–54.
[21] Silva A, Gupta S, Bazzi A, Fault diagnosis in electric drives using machinelearning approaches, In: Proceedings of IEEE international electric machinesand drives conference (IEMDC), May 2013, p. 722–726.
[22] Georgoulas G, Mustafa M, et al. Principal component analysis of the start-uptransient and hidden markov modeling for broken rotor bar fault diagnosis inasynchronous machines. Exp Syst Appl 2003;40(December (17)):7024–33.
[23] Tran V, Yang B, et al. Fault diagnosis of induction motor based on decisiontrees and adaptive neuro-fuzzy inference. Exp Syst Appl 2009;36(March
filtering for fault diagnosis of electric drive systems in electric08.013i
A.A. Silva et al. / ISA Transactions ∎ (∎∎∎∎) ∎∎∎–∎∎∎ 11
(2)):1840–9.[24] Jin X, Gupta S, Mukherjee K, Ray A. Wavelet-based feature extraction using
probabilistic finite state automata for pattern classification. Pattern Recognit2011;44(July (11)):1343–56.
[25] Mallat S. A wavelet tour of signal processing: the sparse way.Burlington, MA:Academic Press; 2008.
[26] Gaeid K, Ping H, et al. Survey of wavelet fault diagnosis and tolerant of inductionmachines with case study. Int Rev Electr Eng 2012;27(June (3)):4437–56.
[27] Mohammed O, Liu Z, et al. Internal short circuit fault diagnosis for pm ma-chines using fe-based phase variable model and wavelets analysis. IEEE TransMagn 2007;43(April (4)):1729–32.
[28] Ordaz-Moreno A, Romero-Troncoso R, et al. Automatic online diagnosis al-gorithm for broken-bar detection on induction motors based on discretewavelet transform for fpga implementation. IEEE Trans Ind Electron 2008;55(May (5)):2193–202.
[29] Li F, Meng G, et al. Wavelet transform-based higher-order statistics for faultdiagnosis in rolling element bearings. J Vib Control 2008;14(November(11)):1691–709.
[30] Rajagopalan S, Restrepo J, et al. Nonstationary motor fault detection usingrecent quadratic time-frequency representations. IEEE Trans Ind Appl 2008;44(June (3)):735–44.
[31] Rosero J, Romeral L, et al. Short-circuit detection by means of empirical modedecomposition and wigner-ville distribution for PMSM running under dy-namic condition. IEEE Trans Ind Electron 2009;56(November (11)):4534–47.
[32] Sadeghian A, Zhongming Y, Wu B. Online detection of broken rotor bars ininduction motors by wavelet packet decomposition and artificial neural net-works. IEEE Trans Instrum Meas 2009;58(February (7)):2253–63.
[33] Konar P, Chattopadhyay P. Bearing fault detection of induction motor usingwavelet and support vector machines (SVMS). Appl Soft Comput 2011;11(September (6)):4203–11.
[34] Seshadrinath J, Singh B, Panigrahi B. Incipient turn fault detection and con-dition monitoring of induction machine using analytical wavelet transform.IEEE Trans Ind Appl 2013;50(September (3)):2235–42.
[35] Seshadrinath J, Singh B, Panigrahi B. Investigation of vibration signatures formultiple fault diagnosis in variable frequency drives using complex wavelets.IEEE Trans Power Electron 2013;29(April (2)):936–45.
[36] Logan K. Intelligent diagnostic requirements of future all-electric ship in-tegrated power system. IEEE Trans Ind Appl 2007;43(January (1)):139–49.
[37] Jeong Y, Sul S, Schulz SE, Patel NR. Fault detection and fault-tolerant control ofinterior permanent-magnet motor drive system for electric vehicle. IEEE TransVeh Technol 2005;41(1):46–51.
[38] Akin B, Ozturk SB, Toliyat HA, Rayner M. Dsp-based sensorless electric motorfault-diagnosis tools for electric and hybrid electric vehicle powertrain ap-plications. IEEE Trans Veh Technol 2009;58(6):2679–88.
[39] Wang R, Wang J. Fault-tolerant control with active fault diagnosis for four-wheel independently driven electric ground vehicles. IEEE Trans Veh Technol2011;60(9):4276–87.
[40] Amrhein M, Krein PT. Dynamic simulation for analysis of hybrid electric ve-hicle system and subsystem interactions, including power electronics. IEEETrans Veh Technol 2005;54(3):825–36.
[41] Levin D, Peres Y, Wilmerm EL. Markov chains and mixing times.Providence,RI: American Mathematical Society; 2008.
[42] Bishop C. Pattern recognition and machine learning.New York, NY: Springer;2006.
[43] Najjar N, Hare J, et al. Heat exchanger fouling diagnosis for an aircraft air-conditioning system. In: Proceedings of SAE 2013 aerotech congress & ex-hibition, Sep. 2013, p. 3055–3060.
[44] Najjar N, Gupta S, Hare J, Kandil S, Walthall R. Optimal sensor selection andfusion for heat exchanger fouling diagnosis in aerospace systems. IEEE Sens J2016;16(12):4866–81.
[45] Mittal K, Wilson JP, Bailie BP, Gupta S, Bollas GM, Luh PB. Supervisory controlfor resilient chiller plants under condenser fouling. IEEE Access 2017;5(Au-gust):14028–46.
Andre A. Silva was born in Lima, Peru and raised inHartford, Connecticut since 1997. In 2012, he receivedthe Bachelor's of Science in Electrical Engineering fromthe University of Connecticut. Subsequently he joinedthe Laboratory of Intelligent Networks and Knowledge-perception Systems (LINKS) at the University of Con-necticut for his graduate education. In 2015, he re-ceived the Master's of Science in Electrical Engineering,specializing in Machine Learning for Aerospace andPower System applications. He is currently employedwith Raytheon Missile Systems in Tucson, AZ as anElectro-Optical Systems Engineer.
Please cite this article as: Silva AA, et al. Wavelet-based informationships. ISA Transactions (2017), http://dx.doi.org/10.1016/j.isatra.2017.0
Shalabh Gupta received the B.E. degree in mechanicalengineering from IIT Roorkee, India, in 2001. He re-ceived the M.S. degree in mechanical engineering, theM.S. degree in electrical engineering, and the Ph.D.degree in mechanical engineering from the Pennsyl-vania State University, University Park, PA, USA, in2004, 2005, and 2006, respectively. He is currently anAssistant Professor with the Department of Electricaland Computer Engineering, University of Connecticut.His current research interests include distributed au-tonomy, cyber-physical systems, robotics, network in-telligence, data analytics, information fusion, and fault
diagnosis in complex systems. Dr. Gupta is currentlyserving as the Chief Editor of Frontiers in Robotics and AI (Specialty Sensor Fusionand Machine Intelligence) and an Associate Editor of Structural Health Monitoring:An International Journal. Dr. Gupta has published around 100 peer-reviewedjournal and conference papers. He is a member of the IEEE, IEEE Systems, Man andCybernetics Society, and ASME.
Ali M. Bazzi received the B.E. and M.E. degrees inelectrical engineering from the American University ofBeirut, Beirut, Lebanon, in 2006 and 2007, respectively.He received the Ph.D. degree from the University ofIllinois at Urbana-Champaign (UIUC), Urbana, IL, USA in2010. He joined the Department of Electrical andComputer Engineering (ECE), University of Connecticut(UCONN), USA, in 2012 as an Assistant Professor wherehe established and currently directs the AdvancedPower Electronics and Electric Drives Laboratory(APEDL). He was a senior power electronics electricalengineer with Delphi Electronics and Safety in 2011-
2012, a visiting assistant professor at UIUC duringspring 2011, an engineer with Bitrode Corporation in the summers of 2008 and2009, and a research and teaching assistant at UIUC between 2007 and 2010. Hisresearch interests include power electronics design, control, optimization, faultdiagnosis, and reliability modeling in motor drives, solar photovoltaics, and otherapplications. He is also interested in renewable energy integration in micro-grids,and real-time control and optimization of energy systems in general. Dr. Bazzi hasserved on the organizing and technical committees of many IEEE conferences. Hereceived the Mavis Memorial Scholarship at UIUC in 2009, the OutstandingTeaching Award from the ECE Department at UCONN in 2014, and the ResearchExcellence Award at UCONN in 2015. In 2016, he became a UTC Assistant Professorfor Engineering Innovation at UCONN. He has over 80 peer-reviewed and refereedtechnical publications. Dr. Bazzi is a member of the IEEE, IEEE Industry ApplicationsSociety, IEEE Power Electronics Society, IEEE Power and Energy Society, and IEEEIndustrial Electronics Society.
Artur Ulatowski received the B.Sc. degree (with greatdistinction) and M.Sc. in electrical engineering from theUniversity of Connecticut (UConn), Storrs, CT, USA, in2014 and 2016, respectively. He is currently an elec-trical engineer at DRS Consolidated Controls. Beforejoining DRS, he was a graduate student at the AdvancedPower Electronics and Electric Drives Laboratory atUConn. His research interests include robust, reliable,and efficient control over induction motor drives sys-tems, data-driven modeling of the behavior of suchsystems, and real-world applications and implementa-tions of those ideas and methodologies.
filtering for fault diagnosis of electric drive systems in electric8.013i

本文献由“学霸图书馆-文献云下载”收集自网络,仅供学习交流使用。
学霸图书馆(www.xuebalib.com)是一个“整合众多图书馆数据库资源,
提供一站式文献检索和下载服务”的24 小时在线不限IP
图书馆。
图书馆致力于便利、促进学习与科研,提供最强文献下载服务。
图书馆导航:
图书馆首页 文献云下载 图书馆入口 外文数据库大全 疑难文献辅助工具


![Untitled-1 [] · Run Capacitor Stator Winding Relay Rotary Switch Rotor Start capacitor Main or Run Windin Stator Winding Main Winding Start capacitor Rotor](https://static.fdocuments.us/doc/165x107/5fc791720420d159865384b0/untitled-1-run-capacitor-stator-winding-relay-rotary-switch-rotor-start-capacitor.jpg)