Wave - beamexchange.org · SMK Sekolah Menengah Kejuruan (Vocational High School) UBSP Unit Bersama...
52
Second Wave Report on Maize Sub- Sector in Sumenep 2 nd Wave Longitudinal Livelihood Study (LLS) JANUARY 2017 PRISMA Author: Abdur Rofi Technical Support: Richard Rose
Transcript of Wave - beamexchange.org · SMK Sekolah Menengah Kejuruan (Vocational High School) UBSP Unit Bersama...
Second Wave Report on Maize Sub-
Sector in Sumenep
2nd Wave Longitudinal Livelihood Study
(LLS)
JANUARY 2017
PRISMA
Author: Abdur Rofi
Technical Support: Richard Rose

LLS | January 2017
ii
LLS | January 2017
iii
LONGITUDINAL LIVELIHOOD STUDY
Second Wave Report on Maize Sub-Sector in Sumenep
PRISMA
Author: Abdur Rofi
Technical Support: Richard Rose
January 2017

Table of Contents
List of Abbreviation and Explanation of Expressions .......................................................... 2
1 Introduction ............................................................................................................... 6
2 Sampling .................................................................................................................... 6
2.1 Sampling Quantitative .................................................................................................... 6
2.2 Sampling Qualitative ...................................................................................................... 7
2.3 Poverty Rate of Households using PPI ............................................................................. 7
3 Five Livelihood Assets ................................................................................................. 7
3.1 Human Assets ................................................................................................................ 8
3.2 Physical Assets ............................................................................................................. 10
3.3 Natural Assets .............................................................................................................. 22
3.4 Social Assets................................................................................................................. 23
3.5 Financial Assets ............................................................................................................ 23
4 Income Generation ................................................................................................... 25
4.1 Agricultural Activity with Focus on Maize ...................................................................... 26
4.2 Livestock Activities ....................................................................................................... 31
5 Expenditures and Financial Expenditure ................................................................... 31
5.1 Education Expenditure ................................................................................................. 32
5.2 Social Expenditure ........................................................................................................ 36
5.3 Livestock Expenditure ................................................................................................... 41
5.4 Agricultural Assets and Inputs....................................................................................... 42
5.5 Repaying Debt .............................................................................................................. 42
5.6 Food Expenditures........................................................................................................ 43
6 Income Use of Maize ................................................................................................ 47
7 Seasonality and Vulnerability ................................................................................... 49

LLS | January 2017
Livelihood Study Second wave Report 2
Maize Sub-Sector in Sumenep
PRISMA January 2017
List of Abbreviation and Explanation of Expressions
Abbreviations
DVD Digital Versatile Disc
SD Sekolah Dasar (Primary School)
SMP Sekolah Menengah Pertama (Junior High School)
SMA Sekolah Menengah Atas, (Senior High School),
SMK Sekolah Menengah Kejuruan (Vocational High School)
UBSP Unit Bersama Simpan Pinjam (Small Savings and Borrowings Group)
UPK Unit Pengelola Kagiatan ((Government) Activity Managing Units)
VCR Videocassette Recorder
VCP Videocassette Player
VCD Video Compact Disc
Expressions
Adat Local traditions
Arisan Group-based rotating savings and lending fund
Desa Village
Koperasi, Cooperative
Pasar Local traditional market
Warung Local shop/ restaurant
List of Figures
Figure 1: Highest Education of Persons 25+ years (2015) ......................................................................... 10
Figure 2: Highest Education of Persons 25+ years (2016) ......................................................................... 10
Figure 3: Assets - House and Land (2015) ................................................................................................ 11
Figure 4: Assets - House and Land (2016) ................................................................................................ 11
Figure 5: Assets – Housing 2015) ............................................................................................................. 12
Figure 6: Assets – Housing 2016) ............................................................................................................. 12
Figure 7: Assets – Transport (2015) ......................................................................................................... 13
Figure 8: Assets – Transport (2016) ......................................................................................................... 13
Figure 9: Assets – Communication (2015) ................................................................................................ 14
Figure 10: Assets – Communication (2016) .............................................................................................. 14
Figure 11: Assets – Kitchen and Storage (2015) ....................................................................................... 15

LLS | January 2017
Livelihood Study Second wave Report 3
Maize Sub-Sector in Sumenep
PRISMA January 2017
Figure 12: Assets – Kitchen and Storage (2016) ....................................................................................... 15
Figure 13: Assets – Other Household Items (2015) .................................................................................. 16
Figure 14: Assets – Other Household Items (2016) .................................................................................. 16
Figure 15: Assets - Agricultural Items (2015) ............................................................................................ 17
Figure 16: Assets - Agricultural Items (2016) ............................................................................................ 17
Figure 17: Large Livestock by Quintile (2015) .......................................................................................... 18
Figure 18: Large Livestock by Quintile (2016) .......................................................................................... 18
Figure 19: Other Livestock by Quintile (2015) .......................................................................................... 19
Figure 20: Other Livestock by Quintile (2016) .......................................................................................... 19
Figure 21: Amount of Large Livestock by Quintile (2015) ......................................................................... 20
Figure 22: Amount of Large Livestock by Quintile (2016) ......................................................................... 20
Figure 23: Amount of Other Livestock by Quintile (2015) ........................................................................ 21
Figure 24: Amount of Other Livestock by Quintile (2016) ........................................................................ 21
Figure 25: Land Holdings by Quintile (2015) ............................................................................................ 22
Figure 26: Land Holdings by Quintile (2016) ............................................................................................ 22
Figure 27: Own Production and Received Food/ Total Food Consumption (2015) .................................... 23
Figure 28: Own Production and Received Food/ Total Food Consumption (2016) .................................... 23
Figure 29: Saving and Borrowing by Quintile (2015) ................................................................................ 24
Figure 30: Saving and Borrowing by Quintile (2016) ................................................................................ 24
Figure 31: Saving and Borrowing by Quintile - total amount in IDR (2015) ............................................... 25
Figure 32: Saving and Borrowing by Quintile - total amount in IDR (2016) ............................................... 25
Figure 33: Agriculture and Livestock Income Generation (2015) .............................................................. 26
Figure 34: Agriculture and Livestock Income Generation (2016) .............................................................. 26
Figure 35: Frequency of Crops mentioned as one of the three most important (except maize) in terms of
income (2015) ................................................................................................................................. 27
Figure 36: Frequency of Crops mentioned as one of the three most important (except maize) in terms of
income (2015) ................................................................................................................................. 27
Figure 37: Crops for Self-consumption (reported no selling) 2015) .......................................................... 28
Figure 38: Crops for Self-consumption (reported no selling) 2016 ........................................................... 28
Figure 39: Crops which are mainly sold (reported as 50%+ selling) (2015) ............................................... 29
Figure 40: Crops which are mainly sold (reported as 50%+ selling) (2016) ............................................... 29
Figure 41: Maize selling by calendar month (2015) .................................................................................. 30
Figure 42: Maize selling by calendar month (2016) .................................................................................. 30
Figure 43: Month when people sell Livestock (2015) ............................................................................... 31
LLS | January 2017
Livelihood Study Second wave Report 4
Maize Sub-Sector in Sumenep
PRISMA January 2017
Figure 24: Month when people sell Livestock (2016 ................................................................................ 31
Figure 45: Significant household expenditure (2015) ............................................................................... 32
Figure 46: Significant household expenditure (2016) ............................................................................... 32
Figure 47: Expenditure on Education (total) (2015) ................................................................................. 33
Figure 48: Expenditure on Education (total) (2016) ................................................................................. 33
Figure 49: Expenditure on education per child (2015).............................................................................. 34
Figure 50: Expenditure on education per child (2016).............................................................................. 34
Figure 51: financing of Education (2015) ................................................................................................. 35
Figure 52: financing of Education (2016) ................................................................................................. 35
Figure 53: Timing of significant expenditures: Education (2015) .............................................................. 36
Figure 54: Timing of significant expenditures: Education (2016) .............................................................. 36
Figure 55: Social Expenditure (2015) ....................................................................................................... 37
Figure 56: Social Expenditure (2016) ....................................................................................................... 37
Figure 57: Financing Marriage (2015) ...................................................................................................... 38
Figure 58: Financing Marriage (2016) ...................................................................................................... 38
Figure 59: Financing other Adat (2015) .................................................................................................... 39
Figure 60: Financing other Adat (2016) .................................................................................................... 39
Figure 61: Timing of significant expenditure – Marriage (2015) ............................................................... 40
Figure 62: Timing of significant expenditure – Marriage (2015) ............................................................... 40
Figure 63: Timing of significant expenditure (other Adat/ religious/ village celebration) (2015) ............... 41
Figure 64: Timing of significant expenditure (other Adat/ religious/ village celebration) (2016) ............... 41
Figure 65: Timing of Significant Expenditure - buying animal stock (2015) ............................................... 42
Figure 66: Timing of significant expenditure - repaying debt (2015) ......................................................... 42
Figure 67: Timing of significant expenditure - repaying debt (2016) ......................................................... 43
Figure 68: Food Expenditure by Quintile (2015) ....................................................................................... 43
Figure 69: Food Expenditure by Quintile (2016) ....................................................................................... 44
Figure 70: Total Food and non-food Expenditure by Quintile (2015) ........................................................ 44
Figure 71: Total Food and non-food Expenditure by Quintile (2016) ........................................................ 45
Figure 72: Type of Food Expenditure by Quintile (total spend) (2015) ...................................................... 45
Figure 73: Type of Food Expenditure by Quintile (total spend) (2016) ...................................................... 46
Figure 74: Share of Expenditure on Rice and Other staples by Quintile (2015) ......................................... 46
Figure 75: Share of Expenditure on Rice and Other staples by Quintile (2016) ......................................... 47
Figure 76: Most important use of income derived from maize (2015) ...................................................... 47

LLS | January 2017
Livelihood Study Second wave Report 5
Maize Sub-Sector in Sumenep
PRISMA January 2017
Figure 77: Most important use of income derived from maize (2016) ...................................................... 48
Figure 78: Second most important use of income derived from maize (2015) .......................................... 48
Figure 79: Second most important use of income derived from maize (2016) .......................................... 48
List of Tables
Table 1: Sampling ...................................................................................................................................... 6
Table 2: Sampling of Quantitative Data Collection ..................................................................................... 7
Table 4: Poverty Rate of Households using PPI .......................................................................................... 7
Table 5: Per Capita Expenditure per Quintile in Rp. per Month (2015) ....................................................... 7
Table 5: Per Capita Expenditure per Quintile in Rp. per Month (2016) ....................................................... 7
Table 6: Household Characteristics ............................................................................................................ 8
Table 7: Female-headed households ......................................................................................................... 8
Table 8: Education of People 15 Years or Older ......................................................................................... 8
Table 9: Education of children 7-15 years .................................................................................................. 8
Table 10: School Enrolment by Age Group (2015) ...................................................................................... 9
Table 11: School Enrolment by Age Group (2016) ...................................................................................... 9
Table 12: Income Earned with Maize ....................................................................................................... 30
Table 13: Female Decision Making Power and Engagement in Maize Activities ........................................ 31
Table 14: Control and Decision Power of Earnings from Maize ................................................................ 49
Table 15: Food Security ........................................................................................................................... 49

LLS | January 2017
Livelihood Study Second wave Report 6
Maize Sub-Sector in Sumenep
PRISMA January 2017
1 Introduction
This second wave report is part of a study, which aims to gain a deeper understanding on how targeted
households use additional income generated through the PRISMA intervention. Sumenep is one of many
districts in East Java that has been targeted by PRISMA and where the project tries to alleviate poverty.
PRISMA supports maize farmers by promoting hybrid seed for dry land farming. The goal is to increase the
productivity of maize and therefore increase the income of maize farmers. The goal of this longitudinal
livelihood study (LLS) is to gain a deeper understanding on how the maize farmers use their additional
income anticipated to be generated through the intervention. This will run until the end of the program.
The households interviewed during this year will be tracked during the following years to see how their
livelihood situation has changed and how the changes relate to the intervention. Such a study is
important for PRISMA because it helps assess whether targets selected for raising rural income are
reasonable and how it can affect rural livelihoods.
The goal of this second wave report is to give an overview over the current livelihood situation to see in
later stages how this situation changed. The report provides an overview with special focus on income
generation and use of income. The second wave study uses a mixed method approach including the
collection of both qualitative and quantitative data. 175 households were interviewed for quantitative
data collection with a questionnaire and nine respondents were interviewed for qualitative data collection
through semi-structured interviews. Together this data provides a picture of the current livelihood
situation of the farmers. The same households will be interviewed in coming years as part of the next
waves of the LLS.
The second wave report initially provides the frame sampling for the study (Section 2); the five assets of
the sustainable livelihood framework are described in Section 3; with a discussion of income generation
discussed in Section 4. Section 5 describes expenditure; while Section 6 focuses on use of income
generated by maize earnings. Section 7 discusses seasonality and vulnerability of the households.
2 Sampling
2.1 Sampling Quantitative
Table 1: Sampling
2015 2016
Babbalan 20 17
Batu Dinding 25 22
Bilapora Timur 20 19
Kasengan 34 28
Kebundadap Timur 15 14
Kopedi 20 18
Manding Timur 19 19
Moncek Tengah 20 20
Sarokah 4 2
Totosan 20 16
Total 197 175

LLS | January 2017
Livelihood Study Second wave Report 7
Maize Sub-Sector in Sumenep
PRISMA January 2017
2.2 Sampling Qualitative
Table 2: Sampling of Quantitative Data Collection
Name of Desa Number of
respondents 2015
Number of
respondents 2016
Bilapora Timur 1 1
Babbalan 2 2
Moncek Tengah 2 2
Kopedi 2 2
Kebondadap Timur 2 1
2.3 Poverty Rate of Households using PPI
The Poverty Rate of Households using PPI is given below:
Table 3: Poverty Rate of Households using PPI
2015 2016
Nr. Obs mean Nr.
Obs
mean
100% National Poverty Rate 155.00 9.48 175 8,36
150% National Poverty Rate 155.00 42.30 175 39,35
$2.5 2005 PPP Poverty Rate 155.00 74.27 175 66,35
3 Five Livelihood Assets
The discussion of five livelihood assets of the sustainable livelihood framework gives a good overview over
the resources that are available to a household (DFID, 1999). The assets are classified in five categories
which are human assets, physical assets, natural assets, social assets, and financial assets. As discussed in
the baseline report, the sample and understand information about different quintile levels. Table 5 is
reproduced from the baseline report, table 6 provides the updated figures for 2016.
Table 4: Per Capita Expenditure per Quintile in Rp. per Month (2015)
Nr. Obs Mean Sd Min Max
Q1 37.00 328,011.74 49,446.83 193,222.22 396,533.31
Q2 36.00 464,549.17 37,792.70 400,305.53 537,916.63
Q3 37.00 634,447.01 54,087.71 548,416.63 706,966.63
Q4 36.00 789,443.31 52,424.34 711,805.56 913,750.00
Q5 36.00 1,557,029.56 740,344.44 930,955.56 4,432,291.50
Table 5: Per Capita Expenditure per Quintile in Rp. per Month (2016)
Nr. Obs Mean Sd Min Max
Q1 35.00 235.448,2 51.643,0 95.597,2 294.900,0 Q2 35.00 333.799,3 21.409,2 298.750,0 364.783,3 Q3 35.00 405.845,0 25.018,6 364.812,5 444.633,3 Q4 35.00 521.771,3 51.262,4 455.606,7 622.444,4 Q5 35.00 759.369,1 109.137,5 634.086,7 992.861,1
LLS | January 2017
Livelihood Study Second wave Report 8
Maize Sub-Sector in Sumenep
PRISMA January 2017
3.1 Human Assets
Human assets describe assets which lie with the person or household itself. This might be health,
education or other household characteristics. This sub-section first focuses on household characteristics
and then on education.
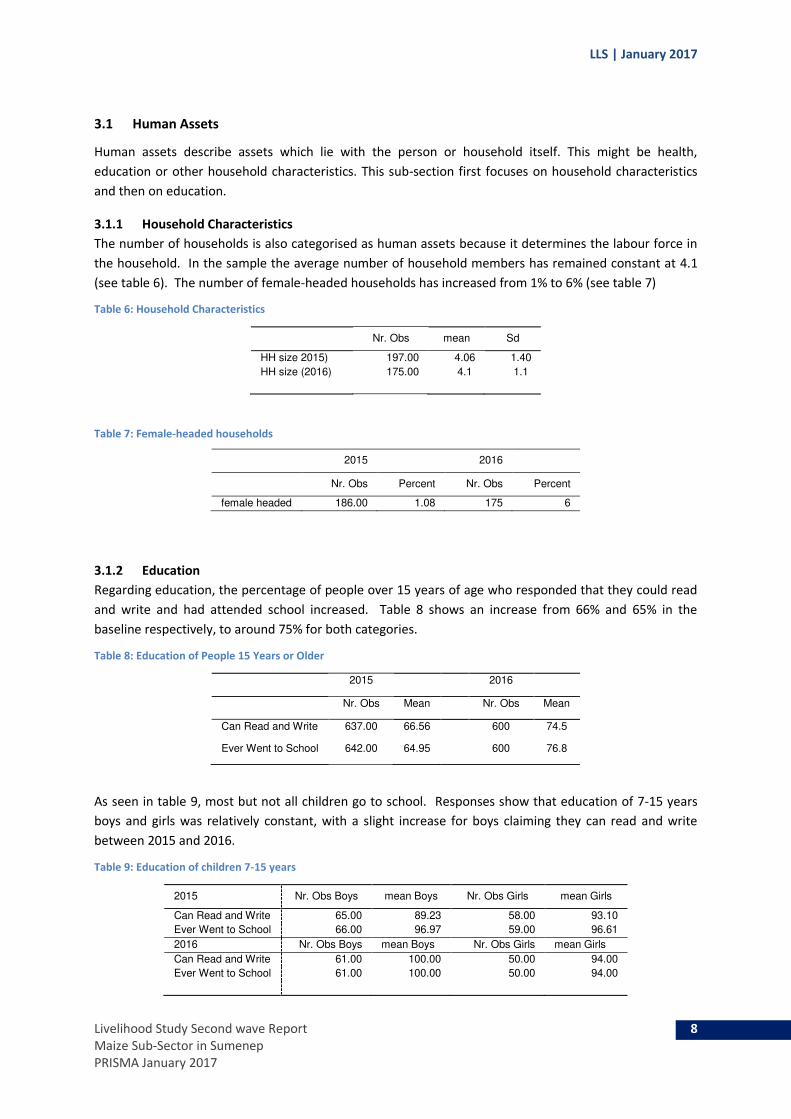
3.1.1 Household Characteristics
The number of households is also categorised as human assets because it determines the labour force in
the household. In the sample the average number of household members has remained constant at 4.1
(see table 6). The number of female-headed households has increased from 1% to 6% (see table 7)
Table 6: Household Characteristics
Nr. Obs mean Sd
HH size 2015) 197.00 4.06 1.40
HH size (2016) 175.00 4.1 1.1
Table 7: Female-headed households
2015 2016
Nr. Obs Percent Nr. Obs Percent
female headed 186.00 1.08 175 6
3.1.2 Education
Regarding education, the percentage of people over 15 years of age who responded that they could read
and write and had attended school increased. Table 8 shows an increase from 66% and 65% in the
baseline respectively, to around 75% for both categories.
Table 8: Education of People 15 Years or Older
2015 2016
Nr. Obs Mean Nr. Obs Mean
Can Read and Write 637.00 66.56 600 74.5
Ever Went to School 642.00 64.95 600 76.8
As seen in table 9, most but not all children go to school. Responses show that education of 7-15 years
boys and girls was relatively constant, with a slight increase for boys claiming they can read and write
between 2015 and 2016.
Table 9: Education of children 7-15 years
2015 Nr. Obs Boys mean Boys Nr. Obs Girls mean Girls
Can Read and Write 65.00 89.23 58.00 93.10
Ever Went to School 66.00 96.97 59.00 96.61
2016 Nr. Obs Boys mean Boys Nr. Obs Girls mean Girls
Can Read and Write 61.00 100.00 50.00 94.00
Ever Went to School 61.00 100.00 50.00 94.00
LLS | January 2017
Livelihood Study Second wave Report 9
Maize Sub-Sector in Sumenep
PRISMA January 2017
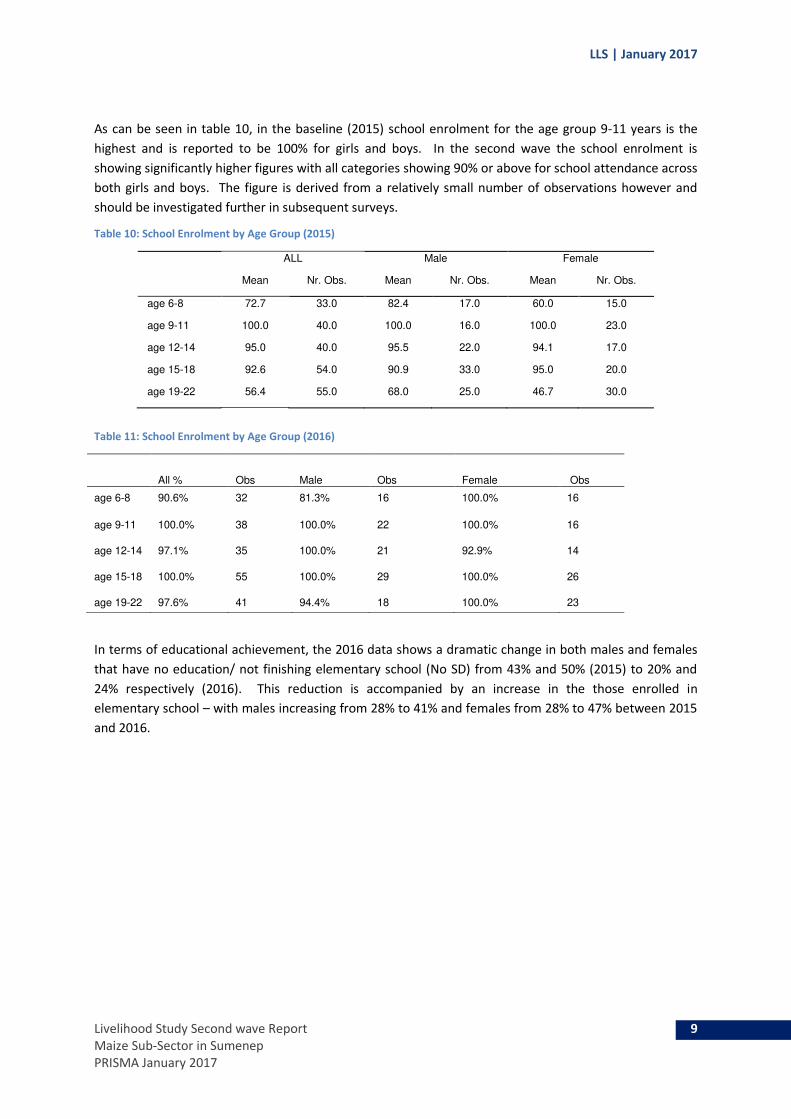
As can be seen in table 10, in the baseline (2015) school enrolment for the age group 9-11 years is the
highest and is reported to be 100% for girls and boys. In the second wave the school enrolment is
showing significantly higher figures with all categories showing 90% or above for school attendance across
both girls and boys. The figure is derived from a relatively small number of observations however and
should be investigated further in subsequent surveys.
Table 10: School Enrolment by Age Group (2015)
ALL Male Female
Mean Nr. Obs. Mean Nr. Obs. Mean Nr. Obs.
age 6-8 72.7 33.0 82.4 17.0 60.0 15.0
age 9-11 100.0 40.0 100.0 16.0 100.0 23.0
age 12-14 95.0 40.0 95.5 22.0 94.1 17.0
age 15-18 92.6 54.0 90.9 33.0 95.0 20.0
age 19-22 56.4 55.0 68.0 25.0 46.7 30.0
Table 11: School Enrolment by Age Group (2016)
In terms of educational achievement, the 2016 data shows a dramatic change in both males and females
that have no education/ not finishing elementary school (No SD) from 43% and 50% (2015) to 20% and
24% respectively (2016). This reduction is accompanied by an increase in the those enrolled in
elementary school – with males increasing from 28% to 41% and females from 28% to 47% between 2015
and 2016.
All % Obs Male Obs Female Obs
age 6-8 90.6% 32 81.3% 16 100.0% 16
age 9-11 100.0% 38 100.0% 22 100.0% 16
age 12-14 97.1% 35 100.0% 21 92.9% 14
age 15-18 100.0% 55 100.0% 29 100.0% 26
age 19-22 97.6% 41 94.4% 18 100.0% 23
LLS | January 2017
Livelihood Study Second wave Report 10
Maize Sub-Sector in Sumenep
PRISMA January 2017
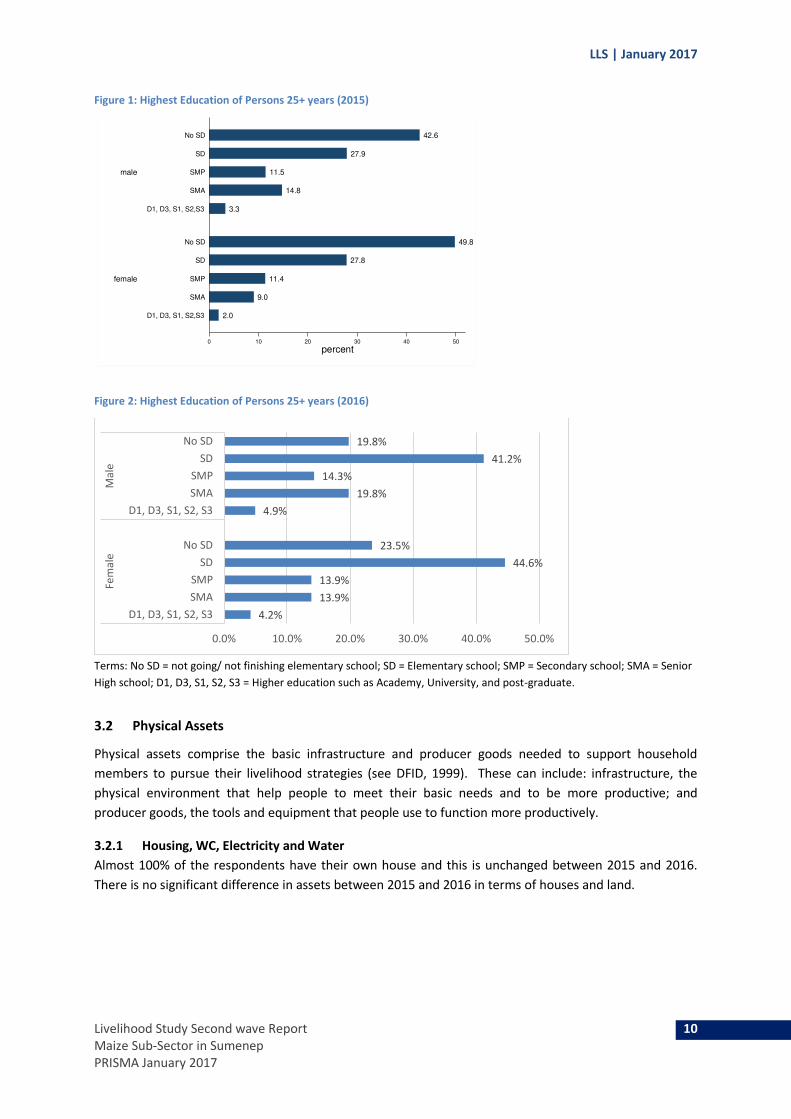
Figure 1: Highest Education of Persons 25+ years (2015)
Figure 2: Highest Education of Persons 25+ years (2016)
Terms: No SD = not going/ not finishing elementary school; SD = Elementary school; SMP = Secondary school; SMA = Senior
High school; D1, D3, S1, S2, S3 = Higher education such as Academy, University, and post-graduate.
3.2 Physical Assets
Physical assets comprise the basic infrastructure and producer goods needed to support household
members to pursue their livelihood strategies (see DFID, 1999). These can include: infrastructure, the
physical environment that help people to meet their basic needs and to be more productive; and
producer goods, the tools and equipment that people use to function more productively.
3.2.1 Housing, WC, Electricity and Water
Almost 100% of the respondents have their own house and this is unchanged between 2015 and 2016.
There is no significant difference in assets between 2015 and 2016 in terms of houses and land.
2.0
9.0
11.4
27.8
49.8
3.3
14.8
11.5
27.9
42.6
0 10 20 30 40 50
percent
female
male
D1, D3, S1, S2,S3
SMA
SMP
SD
No SD
D1, D3, S1, S2,S3
SMA
SMP
SD
No SD
4.2%
13.9%
13.9%
44.6%
23.5%
4.9%
19.8%
14.3%
41.2%
19.8%
0.0% 10.0% 20.0% 30.0% 40.0% 50.0%
D1, D3, S1, S2, S3
SMA
SMP
SD
No SD
D1, D3, S1, S2, S3
SMA
SMP
SD
No SD
Fe
ma
leM
ale

LLS | January 2017
Livelihood Study Second wave Report 11
Maize Sub-Sector in Sumenep
PRISMA January 2017
Figure 3: Assets - House and Land (2015)
Figure 4: Assets - House and Land (2016)
Not all households have electricity. In 2015 (figure 5) over 80% of the households have electricity across
all expenditure quintiles, this is unchanged in 2016. Significantly the data shows that while in 2015 more
than 50% of homes had a W/C (with the percentage rising to over 90% in the highest quintile) the 2016
data shows that ownership is steady across all quintiles at around 40-45%. Well/ Tube-well ownership
appears to have increased significantly across all quintiles and dramatically amongst lower quintiles (from
17% to 51% in Q1). These figures should be investigated further before any conclusions can be drawn in
terms of attribution to the intervention.
100.0
91.9
52.8
100.0
94.4
61.8
97.394.6
54.1
97.2100.0
55.6
97.2100.0
57.1
0
20
40
60
80
100
Q1 Q2 Q3 Q4 Q5
Assets: House and Land
House Agricultural Land
Other House/Building
100.0% 100.0%94.3%
91.4%
100.0%
91.4% 97.1% 94.3%
94.3%
91.4%
57.1%60.0%
51.4%
68.6%
57.1%
0.0%
10.0%
20.0%
30.0%
40.0%
50.0%
60.0%
70.0%
80.0%
90.0%
100.0%
Q1 Q2 Q3 Q4 Q5
House Agricultural Land Other House/Building

LLS | January 2017
Livelihood Study Second wave Report 12
Maize Sub-Sector in Sumenep
PRISMA January 2017
Figure 5: Assets – Housing 2015)
Figure 6: Assets – Housing 2016)
3.2.2 Transport
The most common means of transportation in Sumenep remains the motor cycle (figures 7 and 8). More
households possess motor cycles in higher expenditure quintiles. Bicycle ownership appears to have
reduced though ownership remains proportionately less than motor-cycles and more than cars/ trucks.
86.5
43.2
62.9
16.7
86.1
57.1
68.6
17.6
89.2
54.3
88.9
8.1
94.4
77.8
88.9
41.7
82.9
69.4
90.9
52.8
0
20
40
60
80
100
Q1 Q2 Q3 Q4 Q5
Electricity Floor not Eearth or Bamboo
WC Well/Tubewell
91.4% 91.4%94.3%
97.1% 97.1%
85.7%94.3%
97.1%94.3%
100.0%
45.7%40.0%
42.9% 42.9%40.0%
51.4%48.6%
54.3%51.4%
71.4%
0.0%
20.0%
40.0%
60.0%
80.0%
100.0%
Q1 Q2 Q3 Q4 Q5
Electricity Floor not eart/bamboo WC Well/Tubewell

LLS | January 2017
Livelihood Study Second wave Report 13
Maize Sub-Sector in Sumenep
PRISMA January 2017
Figure 7: Assets – Transport (2015)
Figure 8: Assets – Transport (2016)
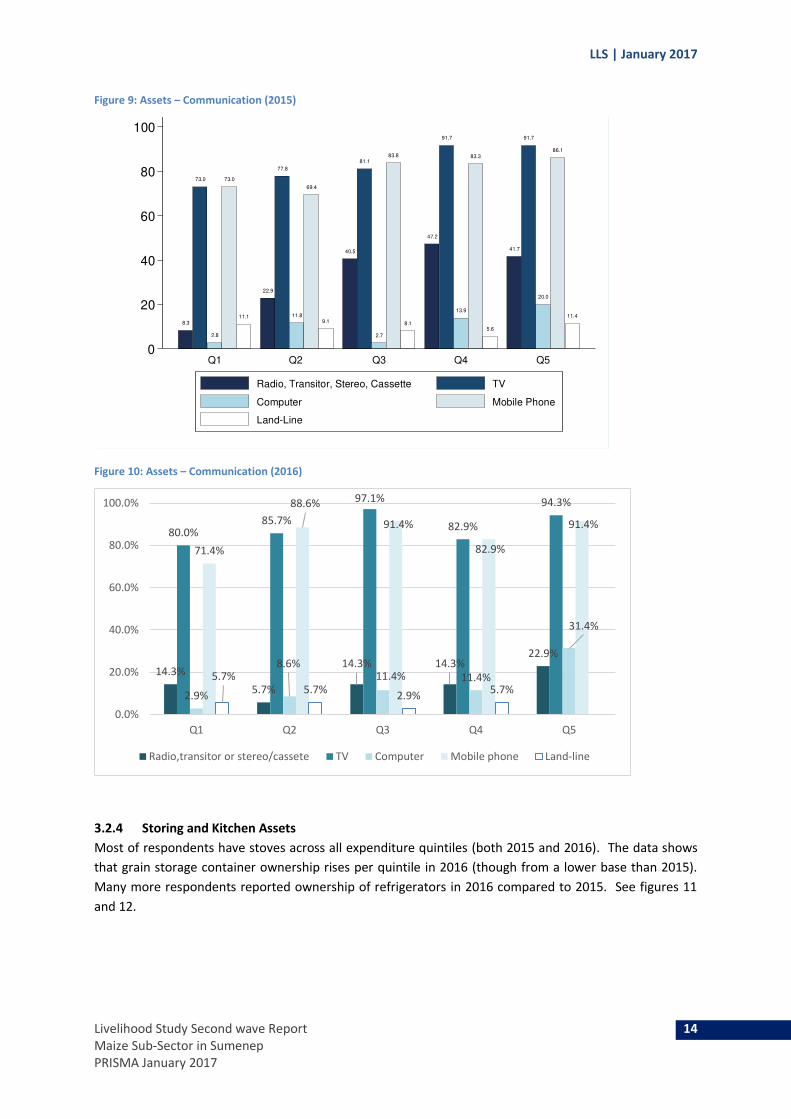
3.2.3 Communication Assets
As seen figures 9 and 10, television and mobile phone are the most common communication assets.
There is no significant change across 2015 and 2016, except that the number of respondents claiming
ownership of stereos/ radios has reduced.
0.0
67.6
86.5
0.0
63.9
75.0
2.7
67.6
81.1
0.0
63.9
94.4
0.0
69.4
100.0
0
20
40
60
80
100
Q1 Q2 Q3 Q4 Q5
Assets: Transport
Car/Truck Bicycle
Motorbike
0.0%
5.7%8.6%
0.0%
8.6%
40.0%
48.6%
37.1%40.0%
54.3%
74.3%
88.6% 88.6% 88.6%
97.1%
0.0%
20.0%
40.0%
60.0%
80.0%
100.0%
Q1 Q2 Q3 Q4 Q5
Car/Truck Bicycle Motorbike
LLS | January 2017
Livelihood Study Second wave Report 14
Maize Sub-Sector in Sumenep
PRISMA January 2017
Figure 9: Assets – Communication (2015)
Figure 10: Assets – Communication (2016)
3.2.4 Storing and Kitchen Assets
Most of respondents have stoves across all expenditure quintiles (both 2015 and 2016). The data shows
that grain storage container ownership rises per quintile in 2016 (though from a lower base than 2015).
Many more respondents reported ownership of refrigerators in 2016 compared to 2015. See figures 11
and 12.
8.3
73.0
2.8
73.0
11.1
22.9
77.8
11.8
69.4
9.1
40.5
81.1
2.7
83.8
8.1
47.2
91.7
13.9
83.3
5.6
41.7
91.7
20.0
86.1
11.4
0
20
40
60
80
100
Q1 Q2 Q3 Q4 Q5
Radio, Transitor, Stereo, Cassette TV
Computer Mobile Phone
Land-Line
14.3%
5.7%
14.3% 14.3%22.9%
80.0%85.7%
97.1%
82.9%
94.3%
2.9%
8.6%11.4% 11.4%
31.4%
71.4%
88.6%
91.4%
82.9%
91.4%
5.7%5.7%
2.9%5.7%
0.0%
20.0%
40.0%
60.0%
80.0%
100.0%
Q1 Q2 Q3 Q4 Q5
Radio,transitor or stereo/cassete TV Computer Mobile phone Land-line

LLS | January 2017
Livelihood Study Second wave Report 15
Maize Sub-Sector in Sumenep
PRISMA January 2017
Figure 11: Assets – Kitchen and Storage (2015)
Figure 12: Assets – Kitchen and Storage (2016)
3.2.5 Other Household Assets
Washing and sewing machines remain uncommon amongst households in the 2016 sample (figure 14).
Most respondents have jewellery in their household. VCR/CP/VCD/DVD ownership increases by wealth
quintile.
83.3
30.6
2.7
75.0
44.1
2.9
64.9
40.5
5.6
72.2
44.4
16.7
80.077.8
19.4
0
20
40
60
80
Q1 Q2 Q3 Q4 Q5
Assets: Kitchen and Storing
Stove Grain Storage Container
Fridge/Freezer
80.0%
94.3%
88.6% 88.6%91.4%
14.3%
28.6%
31.4%
40.0%
51.4%
22.9%
40.0%
45.7%
37.1%
51.4%
0.0%
20.0%
40.0%
60.0%
80.0%
100.0%
Q1 Q2 Q3 Q4 Q5
Stove Grain storage container Fridge/Freezer

LLS | January 2017
Livelihood Study Second wave Report 16
Maize Sub-Sector in Sumenep
PRISMA January 2017
Figure 14: Assets – Other Household Items (2016)
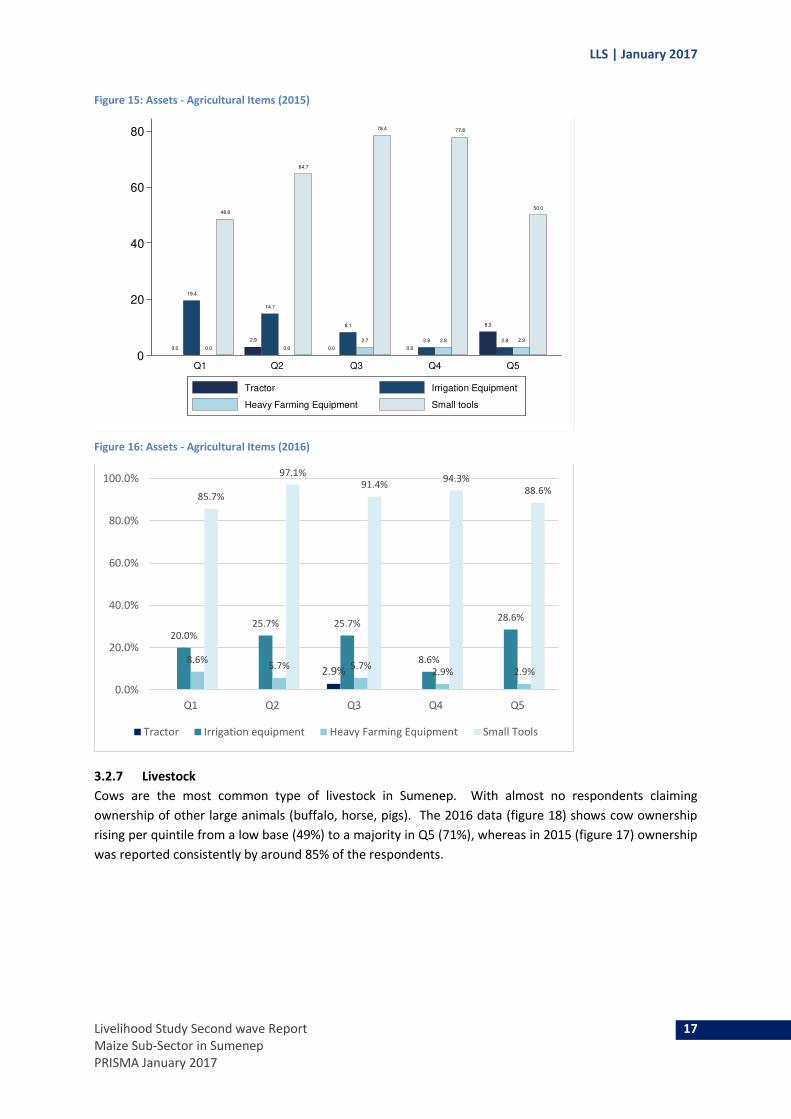
3.2.6 Agricultural Assets
2016 (figure 15) is consistent with the 2015 data (figure 14) in that very few households reported
owning tractors or other heavy farming equipment. Irrigation systems are not common locally with
around 20% of respondents across all quintiles (2016). Ownership of small tools is common across all
expenditure quintiles.
5.7%
2.9%
5.7%
2.9%5.7%
2.9%
2.9%
60.0%
77.1% 77.1% 77.1%
82.9%
22.9%
31.4%
37.1%40.0%
48.6%
0.0%
20.0%
40.0%
60.0%
80.0%
100.0%
Q1 Q2 Q3 Q4 Q5
Sewing Machine Washing Machine Jewerly VCR/VCP/VCD/DVD
Figure 13: Assets – Other Household Items (2015)
2.8
0.0
73.0
13.5
2.9 2.9
63.9
20.0
2.7
0.0
56.855.6
11.1
2.8
66.7
63.9
14.3
2.9
50.0 50.0
0
20
40
60
80
Q1 Q2 Q3 Q4 Q5
Sewing Machine Washing Machine
Jewelry VCR/VCP/VCD/DVD
LLS | January 2017
Livelihood Study Second wave Report 17
Maize Sub-Sector in Sumenep
PRISMA January 2017
Figure 15: Assets - Agricultural Items (2015)
Figure 16: Assets - Agricultural Items (2016)
3.2.7 Livestock
Cows are the most common type of livestock in Sumenep. With almost no respondents claiming
ownership of other large animals (buffalo, horse, pigs). The 2016 data (figure 18) shows cow ownership
rising per quintile from a low base (49%) to a majority in Q5 (71%), whereas in 2015 (figure 17) ownership
was reported consistently by around 85% of the respondents.
0.0
19.4
0.0
48.6
2.9
14.7
0.0
64.7
0.0
8.1
2.7
78.4
0.0
2.8 2.8
77.8
8.3
2.8 2.9
50.0
0
20
40
60
80
Q1 Q2 Q3 Q4 Q5
Assets: Agricultural Items
Tractor Irrigation Equipment
Heavy Farming Equipment Small tools
2.9%
20.0%
25.7% 25.7%
8.6%
28.6%
8.6%5.7% 5.7%
2.9% 2.9%
85.7%
97.1%91.4%
94.3%
88.6%
0.0%
20.0%
40.0%
60.0%
80.0%
100.0%
Q1 Q2 Q3 Q4 Q5
Tractor Irrigation equipment Heavy Farming Equipment Small Tools

LLS | January 2017
Livelihood Study Second wave Report 18
Maize Sub-Sector in Sumenep
PRISMA January 2017
Figure 17: Large Livestock by Quintile (2015)
Figure 18: Large Livestock by Quintile (2016)
The 2016 data for smaller animals (figure 20) shows that chickens are the most common livestock after
cows in Sumenep. The 2015 data (figure 19) and the 2016 data show a broadly similar picture – with
chicken ownership with around 40-65% of households, and goat and sheep ownership at around 10 – 35%
depending upon expenditure quintile.
86.5
0.0 0.0 0.0
83.3
2.80.0 0.0
86.5
0.0 0.0 0.0
83.3
0.0 0.0 0.0
86.1
13.9
0.0 0.00
20
40
60
80
Q1 Q2 Q3 Q4 Q5
Livestock 1
Cow Buffalo
Horse Pig
48.6%51.4%
65.7%68.6%
71.4%
0.0%
20.0%
40.0%
60.0%
80.0%
100.0%
Q1 Q2 Q3 Q4 Q5
Cow Bufallo Horse

LLS | January 2017
Livelihood Study Second wave Report 19
Maize Sub-Sector in Sumenep
PRISMA January 2017
Figure 19: Other Livestock by Quintile (2015)
Figure 20: Other Livestock by Quintile (2016)
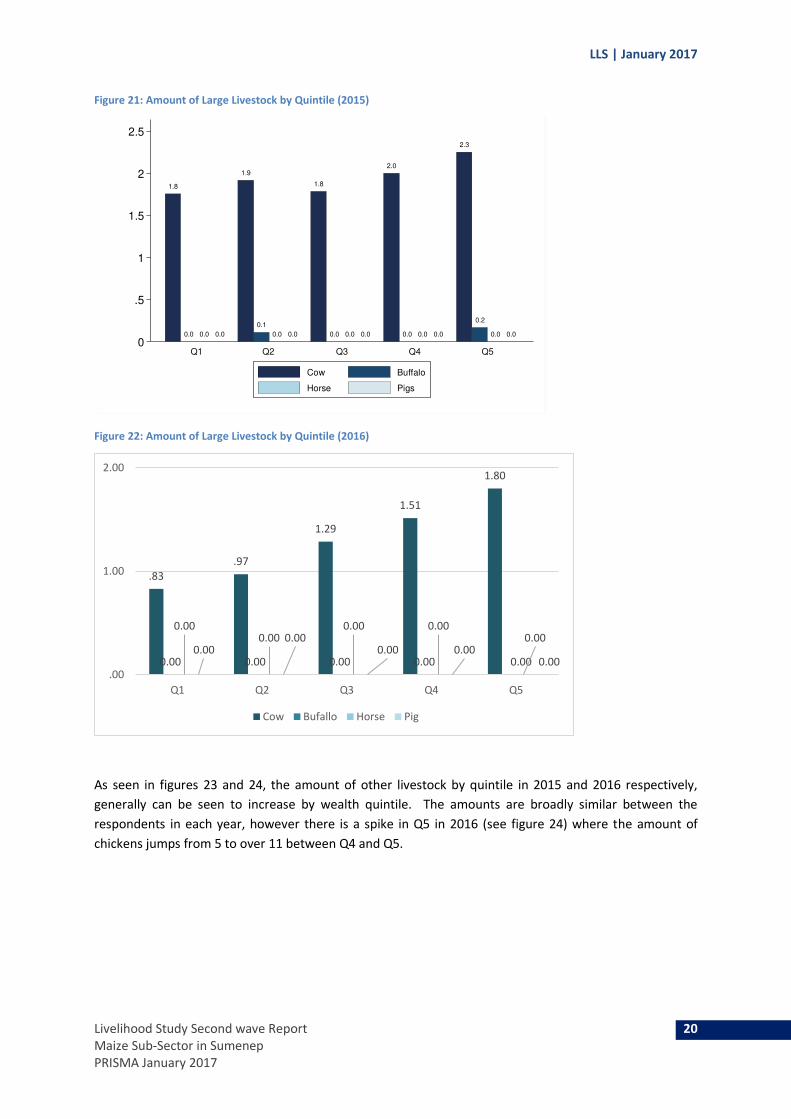
In terms of the amount of large livestock owned by respondents in Sumenep, the 2016 data (figure 22)
shows a sharp increase per wealth quintile, consistent with the findings in 2015 (figure 21). However, the
2016 data also shows a greater disparity between the lowest quintile (at 0.83 animals per household – in
the 2015 the figure was 1.8) and the highest (1.8 in 2016 – compared with 2.3 in 2015). It is notable that
the 2016 amount of livestock for the highest quintile is the same as the 2015 amount for the lowest.
24.3
43.2
0.0 0.0
33.3
47.2
2.80.0
21.6
62.2
0.0 0.0
33.3
66.7
5.6
0.0
30.6
66.7
5.6 5.6
0
20
40
60
80
Q1 Q2 Q3 Q4 Q5
Livestock 2
Goat and Sheeps Chicken
Duck Fish
11.4%
34.3%
20.0%22.9%
17.1%
42.9%
65.7%68.6%
62.9%60.0%
5.7%2.9% 2.9% 2.9% 2.9%2.9%
0.0%
20.0%
40.0%
60.0%
80.0%
100.0%
Q1 Q2 Q3 Q4 Q5
Goat and sheep Chicken Duck Fish
LLS | January 2017
Livelihood Study Second wave Report 20
Maize Sub-Sector in Sumenep
PRISMA January 2017
Figure 21: Amount of Large Livestock by Quintile (2015)
Figure 22: Amount of Large Livestock by Quintile (2016)
As seen in figures 23 and 24, the amount of other livestock by quintile in 2015 and 2016 respectively,
generally can be seen to increase by wealth quintile. The amounts are broadly similar between the
respondents in each year, however there is a spike in Q5 in 2016 (see figure 24) where the amount of
chickens jumps from 5 to over 11 between Q4 and Q5.
1.8
0.0 0.0 0.0
1.9
0.1
0.0 0.0
1.8
0.0 0.0 0.0
2.0
0.0 0.0 0.0
2.3
0.2
0.0 0.0
0
.5
1
1.5
2
2.5
Q1 Q2 Q3 Q4 Q5
Amount of Livestock 1
Cow Buffalo
Horse Pigs
.83
.97
1.29
1.51
1.80
0.00 0.00 0.00 0.00 0.00
0.000.00
0.00 0.000.00
0.000.00
0.00 0.000.00
.00
1.00
2.00
Q1 Q2 Q3 Q4 Q5
Cow Bufallo Horse Pig

LLS | January 2017
Livelihood Study Second wave Report 21
Maize Sub-Sector in Sumenep
PRISMA January 2017
Figure 23: Amount of Other Livestock by Quintile (2015)
Figure 24: Amount of Other Livestock by Quintile (2016)
0.6
2.5
0.0
1.1
3.1
0.1
0.6
3.2
0.0
1.1
5.1
0.4
1.1
5.5
0.1
0
2
4
6
Q1 Q2 Q3 Q4 Q5
Goat and Sheeps Chicken
Duck
.74 .89 .74 .83 .71
2.29
4.513.89
5.29
11.49
1.20.31
.06 .34 .29
0.00
.31
0.00 0.000.00
.00
2.00
4.00
6.00
8.00
10.00
12.00
14.00
Q1 Q2 Q3 Q4 Q5
Goat and sheep Chicken Duck Fish
LLS | January 2017
Livelihood Study Second wave Report 22
Maize Sub-Sector in Sumenep
PRISMA January 2017
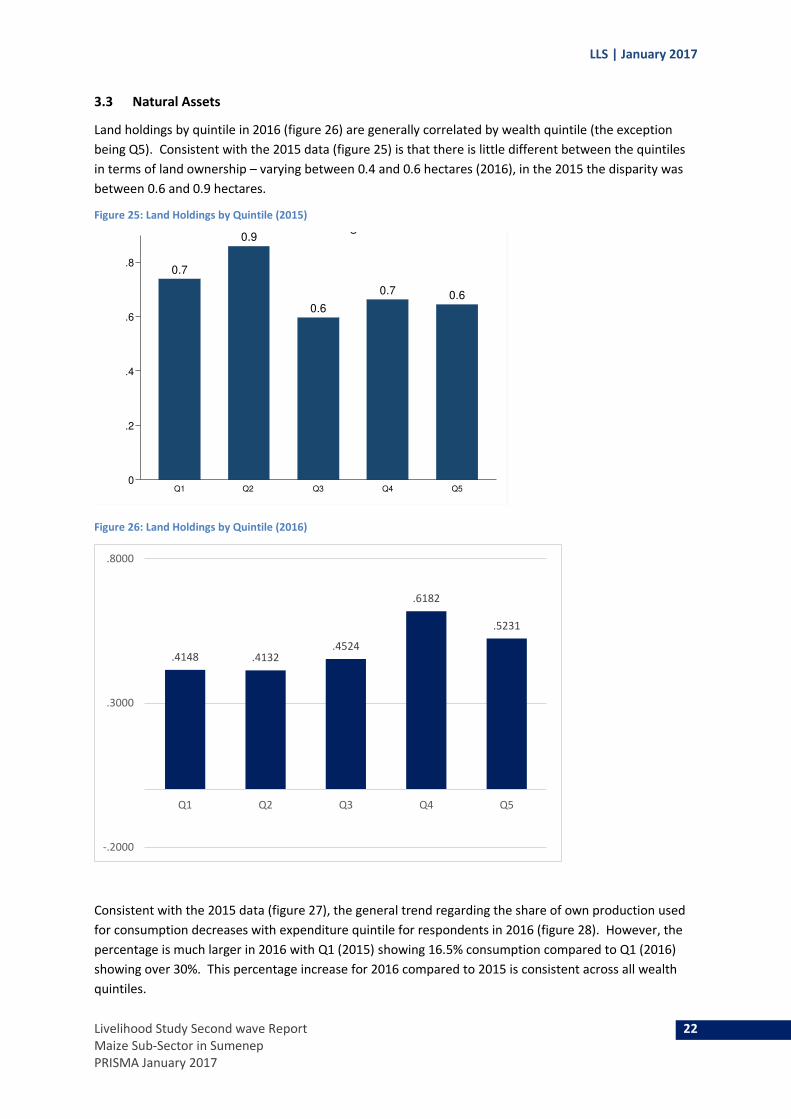
3.3 Natural Assets
Land holdings by quintile in 2016 (figure 26) are generally correlated by wealth quintile (the exception
being Q5). Consistent with the 2015 data (figure 25) is that there is little different between the quintiles
in terms of land ownership – varying between 0.4 and 0.6 hectares (2016), in the 2015 the disparity was
between 0.6 and 0.9 hectares.
Figure 25: Land Holdings by Quintile (2015)
Figure 26: Land Holdings by Quintile (2016)
Consistent with the 2015 data (figure 27), the general trend regarding the share of own production used
for consumption decreases with expenditure quintile for respondents in 2016 (figure 28). However, the
percentage is much larger in 2016 with Q1 (2015) showing 16.5% consumption compared to Q1 (2016)
showing over 30%. This percentage increase for 2016 compared to 2015 is consistent across all wealth
quintiles.
0.7
0.9
0.6
0.7 0.6
0
.2
.4
.6
.8
Q1 Q2 Q3 Q4 Q5
Land Holdings
.4148 .4132.4524
.6182
.5231
-.2000
.3000
.8000
Q1 Q2 Q3 Q4 Q5

LLS | January 2017
Livelihood Study Second wave Report 23
Maize Sub-Sector in Sumenep
PRISMA January 2017
Figure 27: Own Production and Received Food/ Total Food Consumption (2015)
Figure 28: Own Production and Received Food/ Total Food Consumption (2016)
3.4 Social Assets
No new qualitative data collected for social assets.
3.5 Financial Assets
Financial assets show a stark difference between 2015 data (figure 29) and 2016 data (figure 30). In 2015
a far higher percentage of respondents claimed to have savings in lower quintiles while borrowing was
relatively stable across all wealth quintiles (with the exception of Q3). In 2016 the picture is reversed,
with over 50% of respondents in lower quintiles claiming to have borrowed, and savings being relative
stable across all quintiles. It is unclear at this stage why the data would show such a profound change and
it is recommended that this is investigated for the final analysis.
16.5
11.2
13.4
7.2
13.9
0
5
10
15
20
Q1 Q2 Q3 Q4 Q5
Total Food Conusmption
30.59
19.3021.17 20.94
17.90
0.00
5.00
10.00
15.00
20.00
25.00
30.00
35.00
Q1 Q2 Q3 Q4 Q5

LLS | January 2017
Livelihood Study Second wave Report 24
Maize Sub-Sector in Sumenep
PRISMA January 2017
Figure 29: Saving and Borrowing by Quintile (2015)
Figure 30: Saving and Borrowing by Quintile (2016)
59.5
10.8
52.8
14.3
37.840.5 41.7
14.3
27.8
19.4
0
20
40
60
Q1 Q2 Q3 Q4 Q5
Saving and Borrowing
Saving Borrowing
17.1%14.3%
17.1%
8.6%
17.1%
51.4%
71.4%
60.0% 60.0%
42.9%
0.0%
10.0%
20.0%
30.0%
40.0%
50.0%
60.0%
70.0%
80.0%
Q1 Q2 Q3 Q4 Q5
Saving Borrowing

LLS | January 2017
Livelihood Study Second wave Report 25
Maize Sub-Sector in Sumenep
PRISMA January 2017
Figure 31: Saving and Borrowing by Quintile - total amount in IDR (2015)
Figure 32: Saving and Borrowing by Quintile - total amount in IDR (2016)
Regarding the amounts saved or borrowed per quintile, the 2015 and 2016 data show significant
deviation. As with the percentage of savings vs borrowings (figures 29 and 30), the data shows a reverse
picture of the amounts on borrowing and savings in 2016 compared to 2015. Also the absolute values
have changed substantially, with the highest reported borrowing amounts in Q5 at 2.6M IDR (2015)
where in 2016 it is over 5.3M IDR. The 2016 data shows no correlation between borrowing amount and
quintile, where savings appears to reduce by wealth quintile.
4 Income Generation
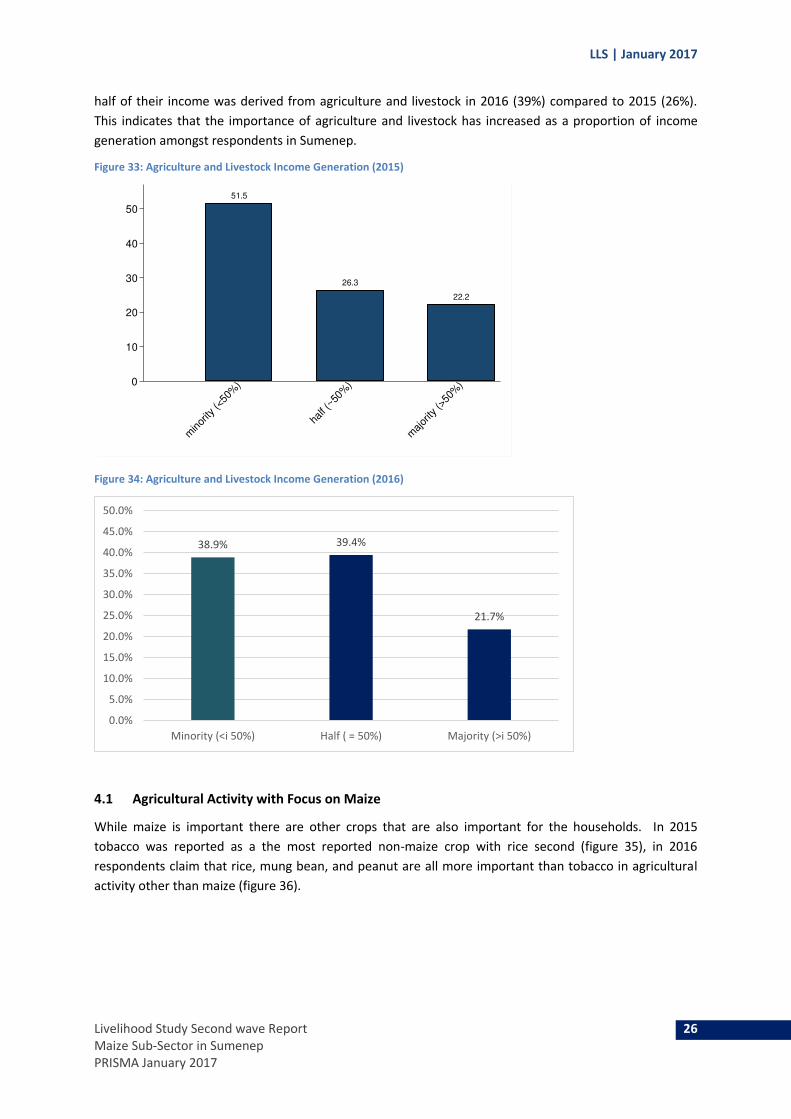
Regarding the income generation strategies of the households, as can be seen in figures 33 and 34, a
similar percentage of respondents confirmed that a majority of their income is derived from agriculture
and livestock (just over 20%) in both 2015 and 2016. A higher proportion of respondents claimed that
1.5
0.6
2.4
0.7
3.0
1.5
3.1
0.8
2.8
2.6
0
1
2
3
Q1 Q2 Q3 Q4 Q5
Saving and Borrowing
Saving Borrowing
2,950,000
2,295,157
1,275,000
775,000
1,941,683
2,888,889
4,136,000
3,783,333
2,082,286
5,366,667
-
1,000,000
2,000,000
3,000,000
4,000,000
5,000,000
6,000,000
Q1 Q2 Q3 Q4 Q5
IDR
Savings Borrowing
LLS | January 2017
Livelihood Study Second wave Report 26
Maize Sub-Sector in Sumenep
PRISMA January 2017
half of their income was derived from agriculture and livestock in 2016 (39%) compared to 2015 (26%).
This indicates that the importance of agriculture and livestock has increased as a proportion of income
generation amongst respondents in Sumenep.
Figure 33: Agriculture and Livestock Income Generation (2015)
Figure 34: Agriculture and Livestock Income Generation (2016)
4.1 Agricultural Activity with Focus on Maize
While maize is important there are other crops that are also important for the households. In 2015
tobacco was reported as a the most reported non-maize crop with rice second (figure 35), in 2016
respondents claim that rice, mung bean, and peanut are all more important than tobacco in agricultural
activity other than maize (figure 36).
51.5
26.3
22.2
0
10
20
30
40
50
minor
ity (<
50%
)
half (~
50%
)
major
ity (>
50%
)
Agricultural and Livestock Income Geneartion
38.9% 39.4%
21.7%
0.0%
5.0%
10.0%
15.0%
20.0%
25.0%
30.0%
35.0%
40.0%
45.0%
50.0%
Minority (<i 50%) Half ( = 50%) Majority (>i 50%)

LLS | January 2017
Livelihood Study Second wave Report 27
Maize Sub-Sector in Sumenep
PRISMA January 2017
Figure 35: Frequency of Crops mentioned as one of the three most important (except maize) in terms of income (2015)
Figure 36: Frequency of Crops mentioned as one of the three most important (except maize) in terms of income (2015)
Regarding self-consumption crops (where no-selling was reported), maize remains the most important
crop for self-consumption relative to the others, with rice second (figures 37 and 38). Mung bean and
peanut are also used as a source of consumption by a significant number of respondents.
118
9
1
8
55
1
5
12
28
36
1
12
2
0 50 100 150frequency
Tobacco
Cassava
Watermelon
Banana
Rice
Pineapple
Cucumber
Soybeans
Peanut
Mung Bean
Guava
Chili Pepper
Chili
cro
p
in Terms of Income
81
69
61
28
10
8
5
4
3
2
1
1
0 10 20 30 40 50 60 70 80 90
Rice
Peanut
Mung Bean
Tobacco
Cassava
Banana
Long Nourishing (String bean)
Coconut: Fruit
Chili Pepper
Cucumber Trees
Avocado
Shallots
Frequency
Cro
ps

LLS | January 2017
Livelihood Study Second wave Report 28
Maize Sub-Sector in Sumenep
PRISMA January 2017
Figure 37: Crops for Self-consumption (reported no selling) 2015)
Figure 38: Crops for Self-consumption (reported no selling) 2016
The picture for crops that are primarily sold (more than 50%+ going to market), has changed dramatically
between 2015 and 2016 (see figures 39 and 40). Where in 2015 the most sold crops were maize and
tobacco, in 2016 is mung bean (21 respondents), tobacco (14), and peanut (12), with a very low number
of respondents (3) claiming to sell maize. This is derived from a fairly small sample size however.
2
1
15
1
64
1
0 20 40 60frequency
Cassava
Banana
Rice
Mung Bean
Maize
Chili Pepper
cro
p
Crops for Self-Consumption(Reported No Selling)
68
54
29
21
8
8
5
3
2
2
1
0 10 20 30 40 50 60 70 80
Maize
Rice
Peanut
Mung Bean
Cassava
Tobacco
Long Nourishing (String bean)
Chili Pepper
Banana
Cucumber Trees
Avocado
Frequency
Cro
ps

LLS | January 2017
Livelihood Study Second wave Report 29
Maize Sub-Sector in Sumenep
PRISMA January 2017
Figure 39: Crops which are mainly sold (reported as 50%+ selling) (2015)
Figure 40: Crops which are mainly sold (reported as 50%+ selling) (2016)
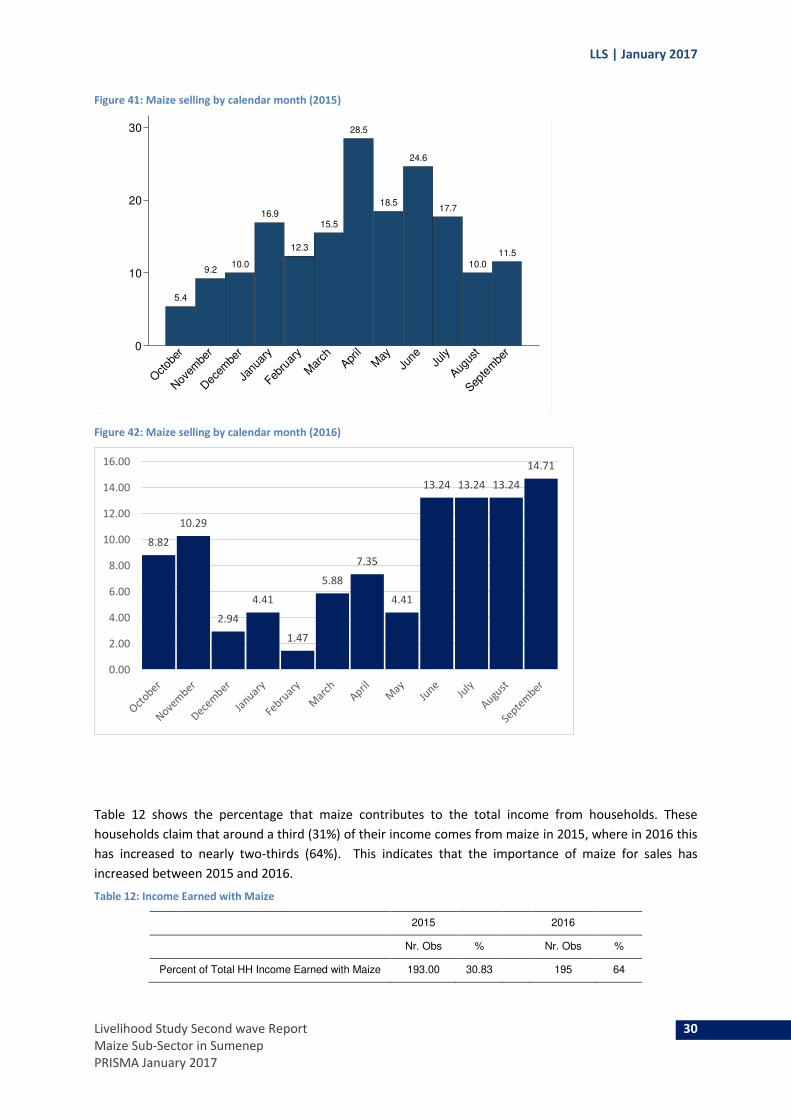
In 2015 households generated most income from maize between April and June (figure 41) whereas in
2016 (figure 42) there is a more even distribution with most sold between June and September.
115
7
1
7
30
1
5
12
27
35
1
120
8
2
0 50 100 150frequency
Tobacco
Cassava
Watermelon
Banana
Rice
Pineapple
Cucumber
Soybeans
Peanut
Mung Bean
Guava
Maize
Chili Pepper
Chili
cro
p
1
3
21
12
6
14
6
0 5 10 15 20 25
Coconut: Fruit
Maize
Mung Bean
Peanut
Rize
Tobacco
Others
LLS | January 2017
Livelihood Study Second wave Report 30
Maize Sub-Sector in Sumenep
PRISMA January 2017
Figure 41: Maize selling by calendar month (2015)
Figure 42: Maize selling by calendar month (2016)
Table 12 shows the percentage that maize contributes to the total income from households. These
households claim that around a third (31%) of their income comes from maize in 2015, where in 2016 this
has increased to nearly two-thirds (64%). This indicates that the importance of maize for sales has
increased between 2015 and 2016.
Table 12: Income Earned with Maize
2015 2016
Nr. Obs % Nr. Obs %
Percent of Total HH Income Earned with Maize 193.00 30.83 195 64
5.4
9.210.0
16.9
12.3
15.5
28.5
18.5
24.6
17.7
10.0
11.5
0
10
20
30
Octob
er
Nov
embe
r
Dec
embe
r
Janu
ary
Febru
ary
Mar
chApr
ilM
ayJu
ne July
Augus
t
Septe
mbe
r
Month When People Sell Maize
8.82
10.29
2.94
4.41
1.47
5.88
7.35
4.41
13.24 13.24 13.24
14.71
0.00
2.00
4.00
6.00
8.00
10.00
12.00
14.00
16.00

LLS | January 2017
Livelihood Study Second wave Report 31
Maize Sub-Sector in Sumenep
PRISMA January 2017
Table 13: Female Decision Making Power and Engagement in Maize Activities
2015 2016
Nr. Obs mean Nr. Obs mean
Most important decision maker in HH is female: Selling
Maize
129.00 27.13 112 34,8
Second important decision maker in HH is female: Selling
Maize
128.00 75.78 112 56,2
Table 13 shows the responses regarding female decision-making power in selling maize. This shows a
small increase in the respondents’ reporting that the most important decision-maker is female from 27%
(2015) to 35% (2016). Correspondingly there is a reduction in the second most important from 76%
female (2015) to 56% (2016). This may be related to the number of female-headed households in the
locality.
4.2 Livestock Activities
Livestock rearing is also part of household income. As discussed the livestock can be seen as a form of
investment. They are sold throughout the year as can be seen in figure 24.
Figure 43: Month when people sell Livestock (2015)
Figure 44: Month when people sell Livestock (2016
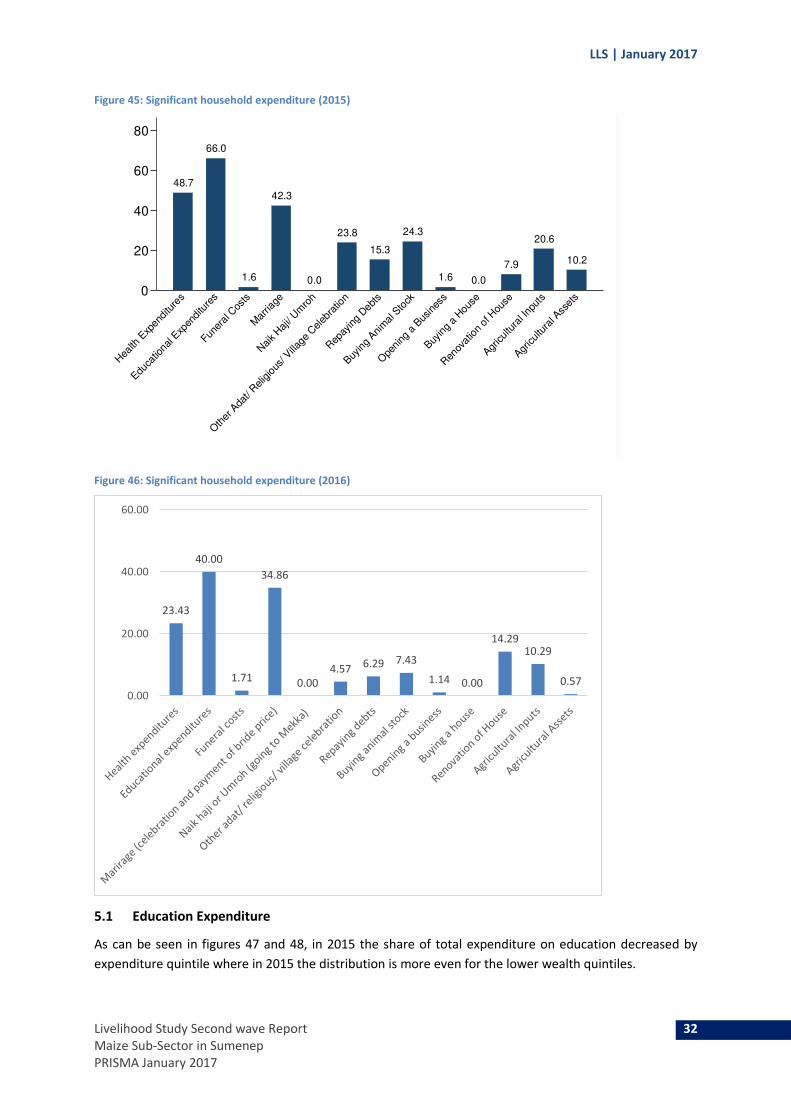
5 Expenditures and Financial Expenditure
As can be seen in figure 45, in 2015 education expenditure was mentioned by 66% of the households to
be a significant expenditure in the last 12 months. Also health, marriage and other adat celebrations
were mentioned as most significant expenditure. For 24% of the households buying animal stock is a
significant expenditure and 21% consider agricultural inputs are a significant expenditure. In 2016 (figure
46) there is a similar picture with education, health, and marriage seen as the most significant
expenditure.
10.710.1
18.519.6
19.017.9
27.4
14.9 15.5
17.9
23.2
9.5
0
10
20
30
Octob
er
Nov
embe
r
Dec
embe
r
Janu
ary
Febru
ary
Mar
chApr
ilM
ayJu
neJu
ly
Augus
t
Septe
mbe
r
Month When People Sell Livestock
LLS | January 2017
Livelihood Study Second wave Report 32
Maize Sub-Sector in Sumenep
PRISMA January 2017
Figure 45: Significant household expenditure (2015)
Figure 46: Significant household expenditure (2016)
5.1 Education Expenditure
As can be seen in figures 47 and 48, in 2015 the share of total expenditure on education decreased by
expenditure quintile where in 2015 the distribution is more even for the lower wealth quintiles.
48.7
66.0
1.6
42.3
0.0
23.8
15.3
24.3
1.6 0.0
7.9
20.6
10.2
0
20
40
60
80
Hea
lth E
xpen
ditu
res
Educa
tiona
l Exp
endi
ture
s
Funer
al C
osts
Mar
riage
Nai
k Haj
i/ Um
roh
Oth
er A
dat/
Relig
ious
/ Villa
ge C
eleb
ratio
n
Rep
ayin
g Deb
ts
Buyin
g Ani
mal
Sto
ck
Ope
ning
a B
usin
ess
Buyin
g a
Hou
se
Ren
ovat
ion
of H
ouse
Agricul
tura
l Inp
uts
Agricul
tura
l Ass
ets
Significant Expendiutres
23.43
40.00
1.71
34.86
0.00
4.57 6.29 7.43
1.14 0.00
14.2910.29
0.57
0.00
20.00
40.00
60.00

LLS | January 2017
Livelihood Study Second wave Report 33
Maize Sub-Sector in Sumenep
PRISMA January 2017
Figure 47: Expenditure on Education (total) (2015)
Figure 48: Expenditure on Education (total) (2016)
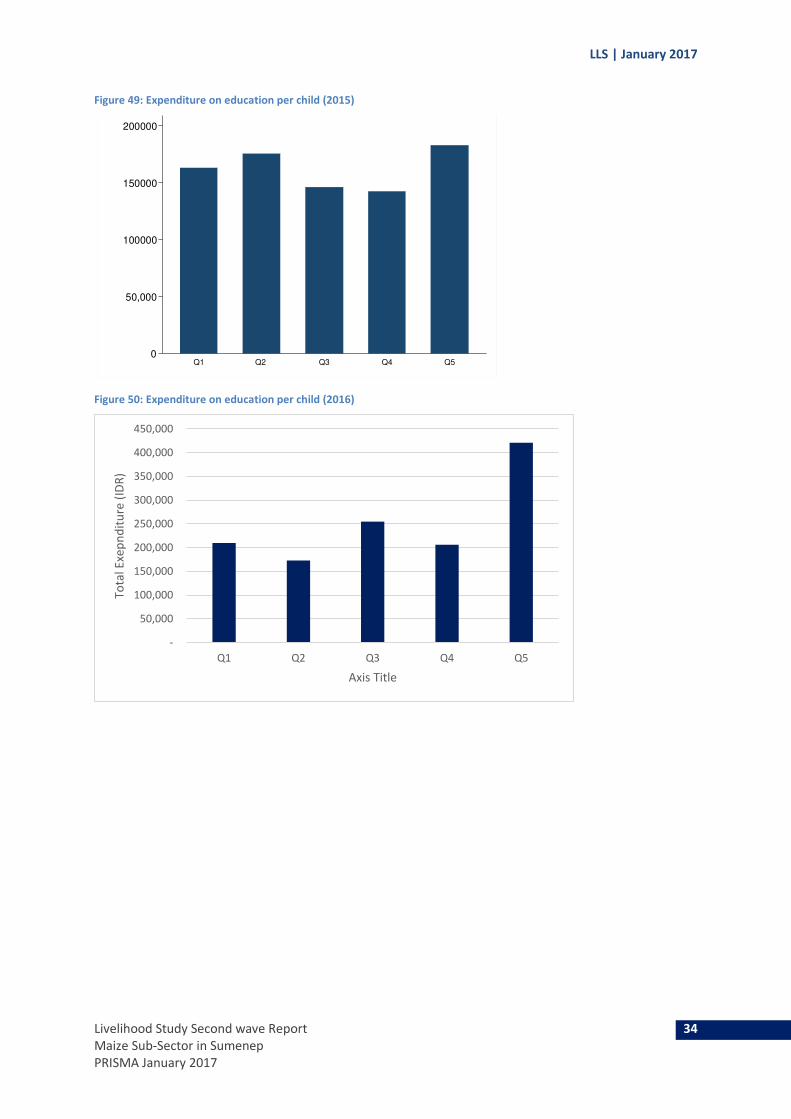
In terms of actual expenditure on education, the distribution across quintiles and the total amounts are
broadly similar between 2015 (figure 49) and 2016 (figure 50). The outlier is Q5 (2016) where there is a
large increase in reported expenditure (from under 200,000 IDR to over 400,000 IDR).
10.710.3
7.0
4.8
3.3
0
2
4
6
8
10
Q1 Q2 Q3 Q4 Q5
Education Expenditure
21.43 21.43
25.71
12.86
18.57
0.00
5.00
10.00
15.00
20.00
25.00
30.00
Q1 Q2 Q3 Q4 Q5
LLS | January 2017
Livelihood Study Second wave Report 34
Maize Sub-Sector in Sumenep
PRISMA January 2017
Figure 49: Expenditure on education per child (2015)
Figure 50: Expenditure on education per child (2016)
0
50,000
100000
150000
200000
Q1 Q2 Q3 Q4 Q5
Education Expenditure per Child
-
50,000
100,000
150,000
200,000
250,000
300,000
350,000
400,000
450,000
Q1 Q2 Q3 Q4 Q5
To
tal
Exe
pn
dit
ure
(ID
R)
Axis Title

LLS | January 2017
Livelihood Study Second wave Report 35
Maize Sub-Sector in Sumenep
PRISMA January 2017
Figure 51: financing of Education (2015)
Figure 52: financing of Education (2016)
As can be seen in figure 51, in 2015 most households financed education through selling crops and
livestock or by drawing upon their savings. In 2016 (figure 52) the majority of respondents claimed that
education was financed through savings with no respondents claiming they sell livestock for this reason.
This is a significant change given that this was the main mains of financing education in 2015.
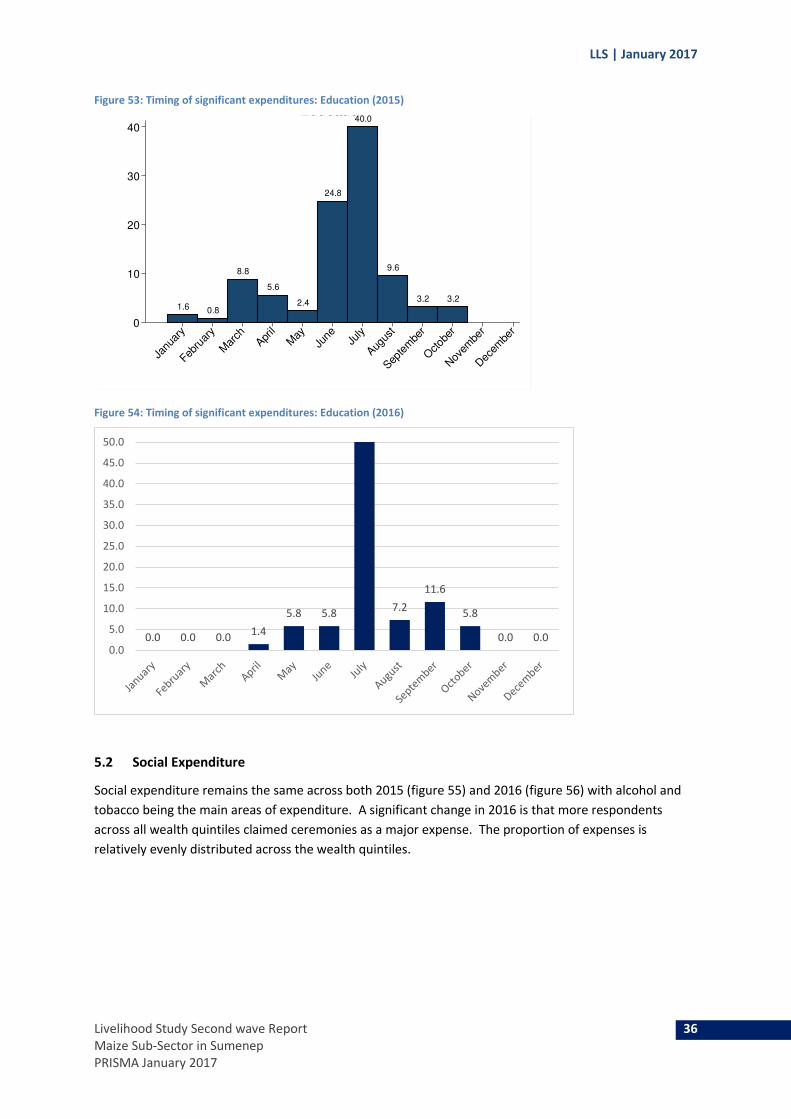
The timing of significant expenditure remains similar across both 2015 and 2016 (figures 53 and 54
respectively) with these expenditures being made in July.
33.1
0.8 0.8 0.8 0.8
40.3
19.4
4.0
0
10
20
30
40
Sav
ings
Hel
p fro
m R
elat
ives
/Frie
nds
Hel
p fro
m G
over
nmen
t
Hel
p fro
m N
GO/R
eligio
us In
stitu
tion
Cha
nge
Eatin
g Pat
tern
s
Em
ploy
ed H
ouse
hold
Mem
bers
Inte
nsified
Wor
k
Adu
lt Hou
seho
ld M
embe
rs S
tarte
d to
Wor
k
Hou
seho
ld M
embe
rs M
igra
te
Red
uce
Exp
endi
ture
s on
Hea
lth a
nd/ o
r Edu
catio
n
Cre
dit
Sell A
gricultu
ral A
sset
s
Sell D
urab
le A
sset
s
Sell L
and/
Build
ing
Sell C
rop
Sto
ck
Sell L
ives
tock
Inte
nsify
Fishi
ng
Sen
d Chi
ldre
n to
Live
Elsew
here
Spirit
ual E
fforts
Cur
rent
Inco
me
Did
Not
Do
Any
thin
g
Oth
er
Financing Education
78.6
0.0 0.0
14.3
0.0 0.0 0.05.7
0.0 1.4
0.0
10.0
20.0
30.0
40.0
50.0
60.0
70.0
80.0
90.0
LLS | January 2017
Livelihood Study Second wave Report 36
Maize Sub-Sector in Sumenep
PRISMA January 2017
Figure 53: Timing of significant expenditures: Education (2015)
Figure 54: Timing of significant expenditures: Education (2016)
5.2 Social Expenditure
Social expenditure remains the same across both 2015 (figure 55) and 2016 (figure 56) with alcohol and
tobacco being the main areas of expenditure. A significant change in 2016 is that more respondents
across all wealth quintiles claimed ceremonies as a major expense. The proportion of expenses is
relatively evenly distributed across the wealth quintiles.
1.6 0.8
8.8
5.6
2.4
24.8
40.0
9.6
3.2 3.2
0
10
20
30
40
Janu
ary
Febru
ary
Mar
chApr
ilM
ayJu
ne July
Augus
t
Septe
mbe
r
Octob
er
Nov
embe
r
Dec
embe
r
Education
0.0 0.0 0.01.4
5.8 5.87.2
11.6
5.8
0.0 0.00.0
5.0
10.0
15.0
20.0
25.0
30.0
35.0
40.0
45.0
50.0
LLS | January 2017
Livelihood Study Second wave Report 37
Maize Sub-Sector in Sumenep
PRISMA January 2017
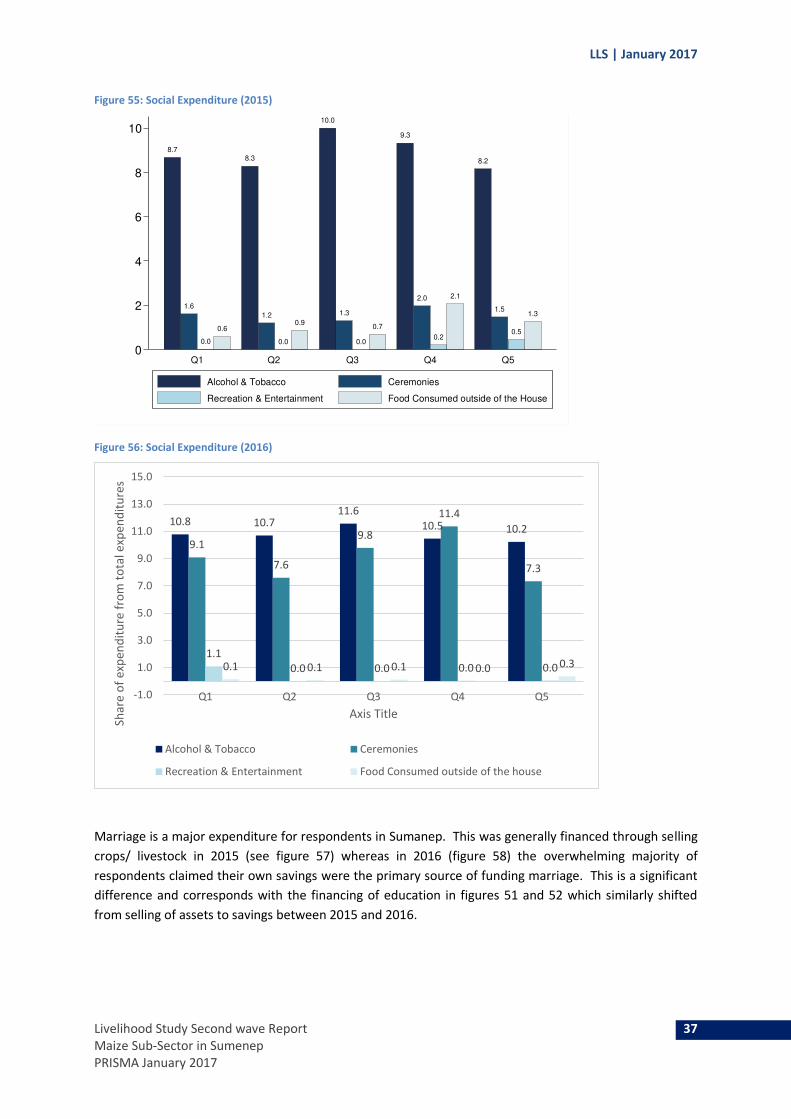
Figure 55: Social Expenditure (2015)
Figure 56: Social Expenditure (2016)
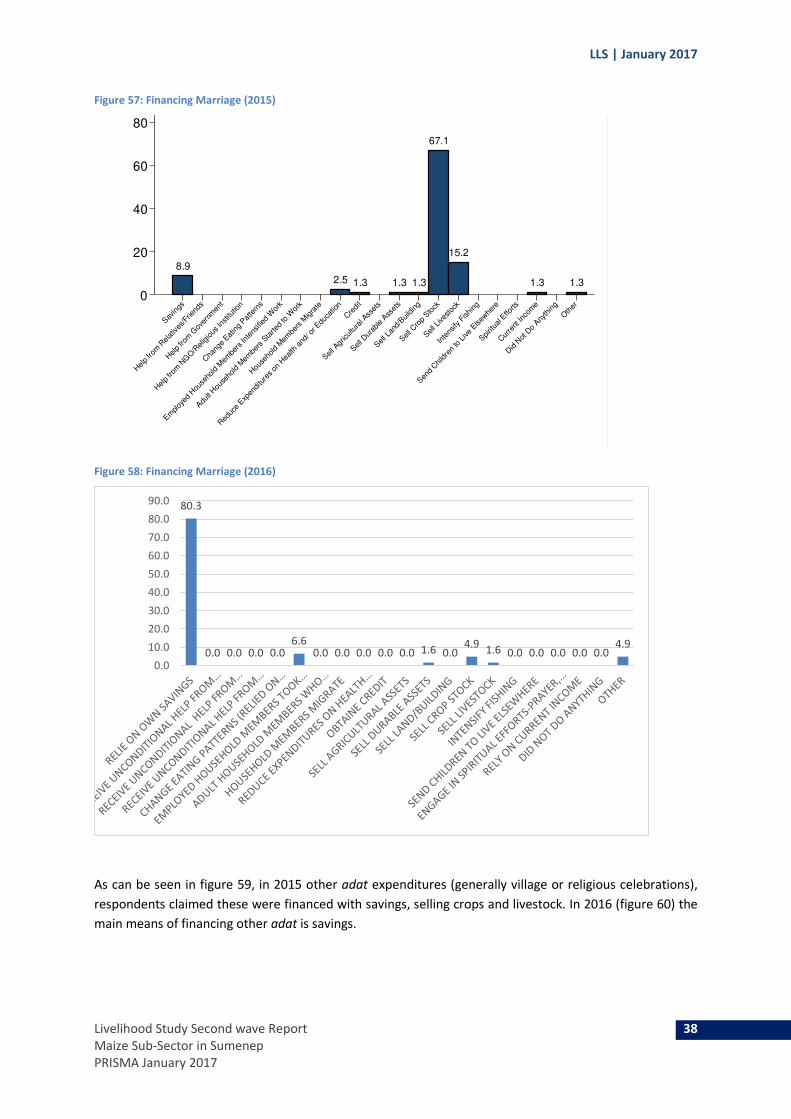
Marriage is a major expenditure for respondents in Sumanep. This was generally financed through selling
crops/ livestock in 2015 (see figure 57) whereas in 2016 (figure 58) the overwhelming majority of
respondents claimed their own savings were the primary source of funding marriage. This is a significant
difference and corresponds with the financing of education in figures 51 and 52 which similarly shifted
from selling of assets to savings between 2015 and 2016.
8.7
1.6
0.0
0.6
8.3
1.2
0.0
0.9
10.0
1.3
0.0
0.7
9.3
2.0
0.2
2.1
8.2
1.5
0.5
1.3
0
2
4
6
8
10
Q1 Q2 Q3 Q4 Q5
Social Expenditures
Alcohol & Tobacco Ceremonies
Recreation & Entertainment Food Consumed outside of the House
10.8 10.711.6
10.5 10.2
9.1
7.6
9.8
11.4
7.3
1.1
0.0 0.0 0.0 0.00.1 0.1 0.1 0.0 0.3
-1.0
1.0
3.0
5.0
7.0
9.0
11.0
13.0
15.0
Q1 Q2 Q3 Q4 Q5
Sh
are
of
exp
en
dit
ure
fro
m t
ota
l e
xpe
nd
itu
res
Axis Title
Alcohol & Tobacco Ceremonies
Recreation & Entertainment Food Consumed outside of the house
LLS | January 2017
Livelihood Study Second wave Report 38
Maize Sub-Sector in Sumenep
PRISMA January 2017
Figure 57: Financing Marriage (2015)
Figure 58: Financing Marriage (2016)
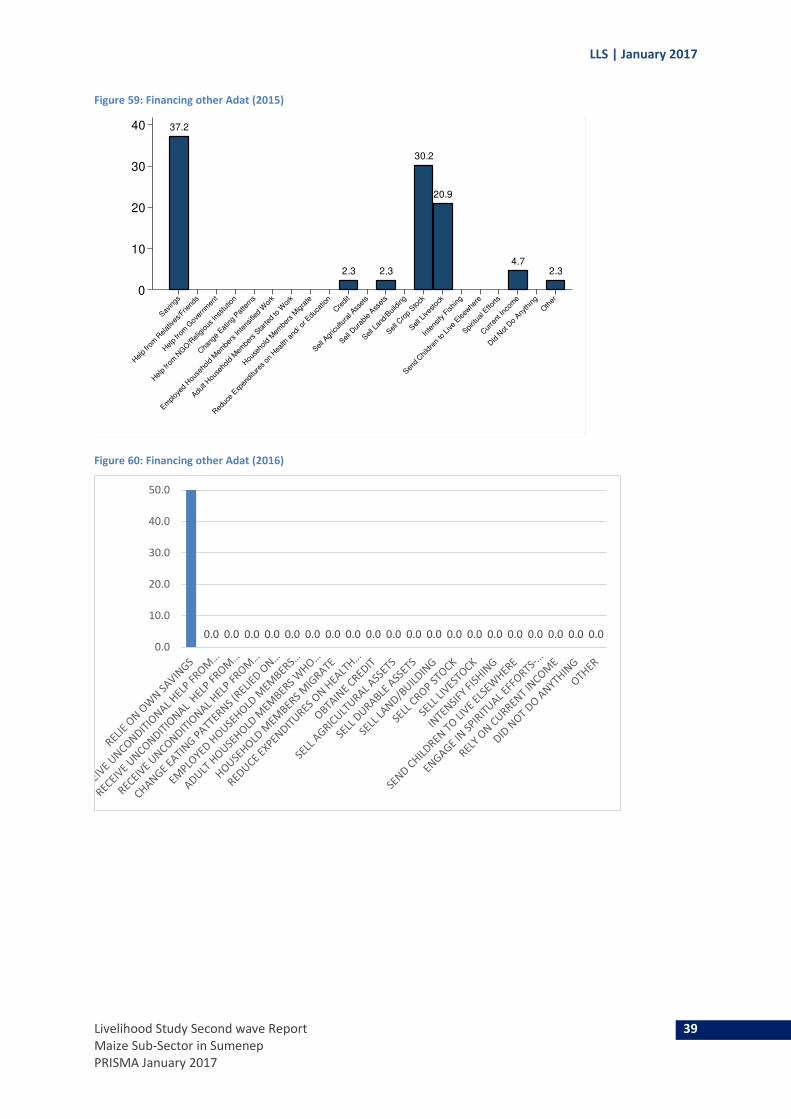
As can be seen in figure 59, in 2015 other adat expenditures (generally village or religious celebrations),
respondents claimed these were financed with savings, selling crops and livestock. In 2016 (figure 60) the
main means of financing other adat is savings.
8.9
2.5 1.3 1.3 1.3
67.1
15.2
1.3 1.3
0
20
40
60
80
Sav
ings
Hel
p fro
m R
elat
ives
/Frie
nds
Hel
p fro
m G
over
nmen
t
Hel
p fro
m N
GO/R
eligio
us In
stitu
tion
Cha
nge
Eatin
g Pat
tern
s
Em
ploy
ed H
ouse
hold
Mem
bers
Inte
nsified
Wor
k
Adu
lt Hou
seho
ld M
embe
rs S
tarte
d to
Wor
k
Hou
seho
ld M
embe
rs M
igra
te
Red
uce
Exp
endi
ture
s on
Hea
lth a
nd/ o
r Edu
catio
n
Cre
dit
Sell A
gricultu
ral A
sset
s
Sell D
urab
le A
sset
s
Sell L
and/
Build
ing
Sell C
rop
Sto
ck
Sell L
ives
tock
Inte
nsify
Fishi
ng
Sen
d Chi
ldre
n to
Live
Elsew
here
Spirit
ual E
fforts
Cur
rent
Inco
me
Did
Not
Do
Any
thin
g
Oth
er
80.3
0.0 0.0 0.0 0.06.6
0.0 0.0 0.0 0.0 0.0 1.6 0.04.9
1.6 0.0 0.0 0.0 0.0 0.04.9
0.0
10.0
20.0
30.0
40.0
50.0
60.0
70.0
80.0
90.0
LLS | January 2017
Livelihood Study Second wave Report 39
Maize Sub-Sector in Sumenep
PRISMA January 2017
Figure 59: Financing other Adat (2015)
Figure 60: Financing other Adat (2016)
37.2
2.3 2.3
30.2
20.9
4.72.3
0
10
20
30
40
Sav
ings
Hel
p fro
m R
elat
ives
/Frie
nds
Hel
p fro
m G
over
nmen
t
Hel
p fro
m N
GO/R
eligio
us In
stitu
tion
Cha
nge
Eatin
g Pat
tern
s
Em
ploy
ed H
ouse
hold
Mem
bers
Inte
nsified
Wor
k
Adu
lt Hou
seho
ld M
embe
rs S
tarte
d to
Wor
k
Hou
seho
ld M
embe
rs M
igra
te
Red
uce
Exp
endi
ture
s on
Hea
lth a
nd/ o
r Edu
catio
n
Cre
dit
Sell A
gricultu
ral A
sset
s
Sell D
urab
le A
sset
s
Sell L
and/
Build
ing
Sell C
rop
Sto
ck
Sell L
ives
tock
Inte
nsify
Fishi
ng
Sen
d Chi
ldre
n to
Live
Elsew
here
Spirit
ual E
fforts
Cur
rent
Inco
me
Did
Not
Do
Any
thin
g
Oth
er
Financing other Adat
0.0 0.0 0.0 0.0 0.0 0.0 0.0 0.0 0.0 0.0 0.0 0.0 0.0 0.0 0.0 0.0 0.0 0.0 0.0 0.00.0
10.0
20.0
30.0
40.0
50.0

LLS | January 2017
Livelihood Study Second wave Report 40
Maize Sub-Sector in Sumenep
PRISMA January 2017
The timing of marriage in Sumanep is generally in May-June and August-September – this is consistent
across 2015 (figure 61) and 2016 (figure 62). In the 2016 more respondents also claimed that marriage
expenditure is timed in February than respondents in 2015.
Figure 61: Timing of significant expenditure – Marriage (2015)
Figure 62: Timing of significant expenditure – Marriage (2015)
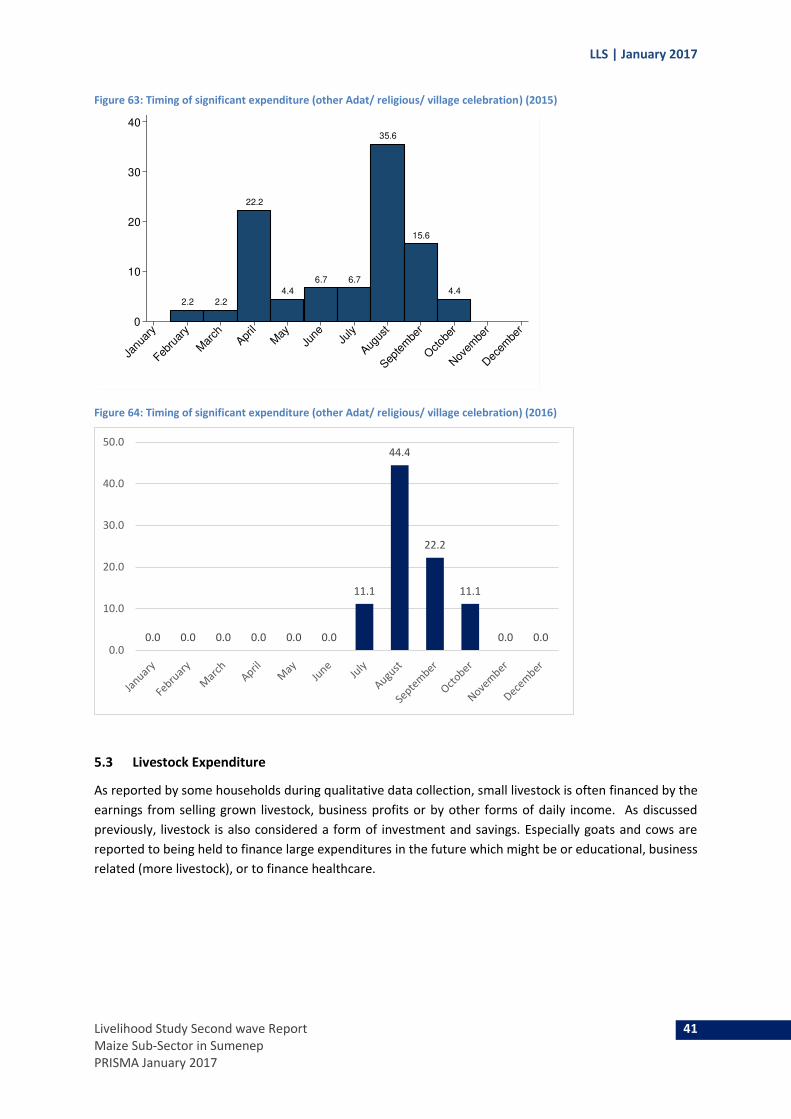
Regarding the timing of significant other expenditure (such as other adat, religious or village
celebrations), the months of August and September are the peak months for both 2015 (figure 63) and
2016 (figure 64).
2.5 2.53.8
2.5
15.0
20.0
7.5 7.5
15.0
23.8
0
5
10
15
20
25
Janu
ary
Febru
ary
Mar
chApr
ilM
ayJu
neJu
ly
Augus
t
Septe
mbe
r
Octob
er
Nov
embe
r
Dec
embe
r
Marriage
0.0
5.0
10.0
15.0
20.0
25.0
LLS | January 2017
Livelihood Study Second wave Report 41
Maize Sub-Sector in Sumenep
PRISMA January 2017
Figure 63: Timing of significant expenditure (other Adat/ religious/ village celebration) (2015)
Figure 64: Timing of significant expenditure (other Adat/ religious/ village celebration) (2016)
5.3 Livestock Expenditure
As reported by some households during qualitative data collection, small livestock is often financed by the
earnings from selling grown livestock, business profits or by other forms of daily income. As discussed
previously, livestock is also considered a form of investment and savings. Especially goats and cows are
reported to being held to finance large expenditures in the future which might be or educational, business
related (more livestock), or to finance healthcare.
2.2 2.2
22.2
4.4
6.7 6.7
35.6
15.6
4.4
0
10
20
30
40
Janu
ary
Febru
ary
Mar
chApr
ilM
ayJu
neJu
ly
Augus
t
Septe
mbe
r
Octob
er
Nov
embe
r
Dec
embe
r
0.0 0.0 0.0 0.0 0.0 0.0
11.1
44.4
22.2
11.1
0.0 0.00.0
10.0
20.0
30.0
40.0
50.0

LLS | January 2017
Livelihood Study Second wave Report 42
Maize Sub-Sector in Sumenep
PRISMA January 2017
Figure 65: Timing of Significant Expenditure - buying animal stock (2015)
5.4 Agricultural Assets and Inputs
No data available for 2016.
5.5 Repaying Debt
Usually households borrow money from their neighbours, family, and friends but have also access to
formal institutions as discussed previously. Data from 2015 (figure 66) and 2016 (figure 67) are consistent
in showing that the majority of expenditure on repaying debt is in the August-September window.
Figure 66: Timing of significant expenditure - repaying debt (2015)
6.5 6.5
8.7
10.9
6.5
8.7
17.4 17.4
10.9
4.3
2.2
0
5
10
15
20
Janu
ary
Febru
ary
Mar
chApr
ilM
ayJu
neJu
ly
Augus
t
Septe
mbe
r
Octob
er
Nov
embe
r
Dec
embe
r
7.1
3.6
10.7 10.7
3.6 3.6
17.9
21.4 21.4
0
5
10
15
20
Janu
ary
Febru
ary
Mar
chApr
ilM
ayJu
neJu
ly
Augus
t
Septe
mbe
r
Octob
er
Nov
embe
r
Dec
embe
r
Repaying Debt

LLS | January 2017
Livelihood Study Second wave Report 43
Maize Sub-Sector in Sumenep
PRISMA January 2017
Figure 67: Timing of significant expenditure - repaying debt (2016)
5.6 Food Expenditures
The share of food consumption is increased with expenditure quintile in 2015 (figure 68), which was
surprising, since wealthier households usually tend to have lower shares of food expenditure. In 2016
(figure 69) the data shows a slight decline in the percentage of expenditure on food by wealth quintile.
Figure 68: Food Expenditure by Quintile (2015)
9.1%
0.0% 0.0% 0.0% 0.0%
9.1%
0.0%
18.2%
9.1%
36.4%
9.1%
0.0%0.0%
10.0%
20.0%
30.0%
40.0%
63.465.7
69.470.9
74.0
0
20
40
60
80
Q1 Q2 Q3 Q4 Q5
Food Expenditure
LLS | January 2017
Livelihood Study Second wave Report 44
Maize Sub-Sector in Sumenep
PRISMA January 2017
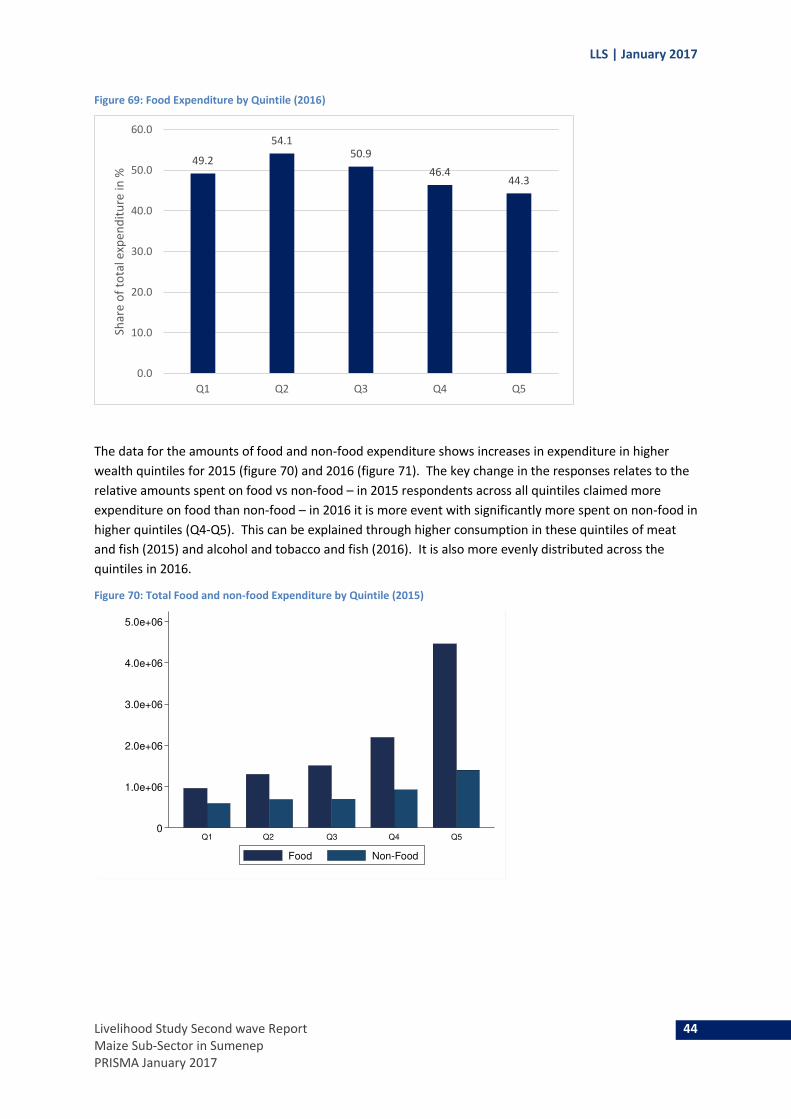
Figure 69: Food Expenditure by Quintile (2016)
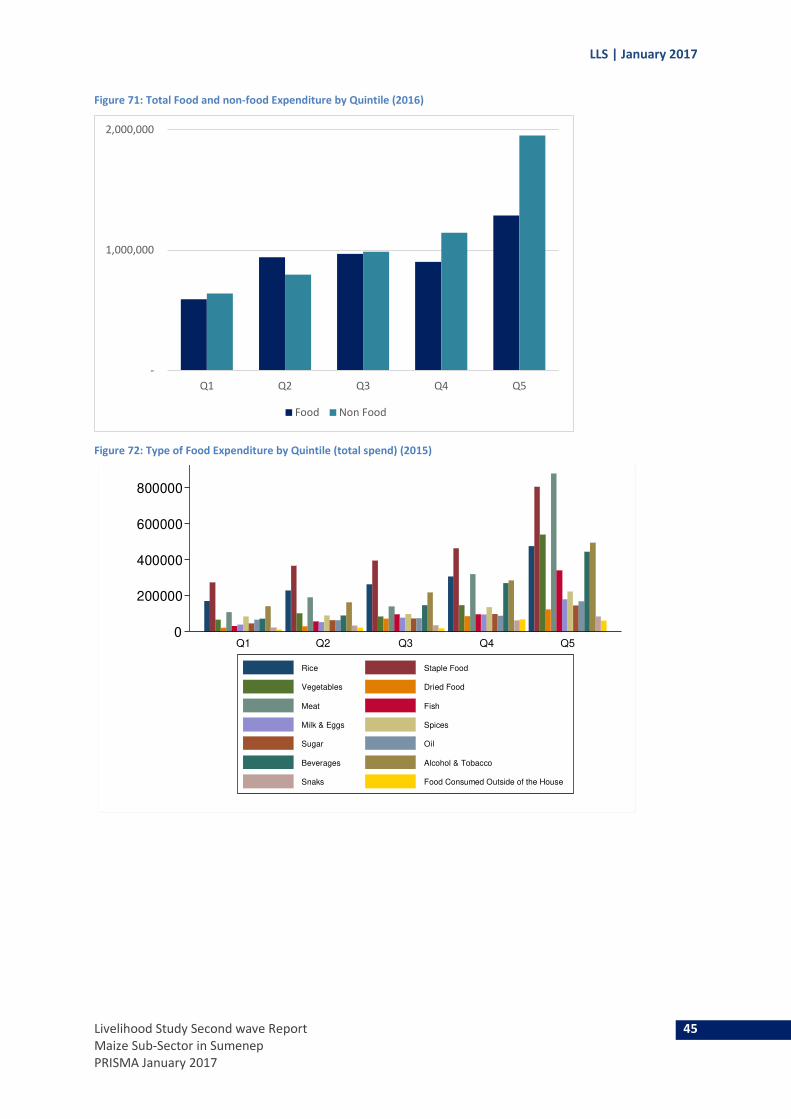
The data for the amounts of food and non-food expenditure shows increases in expenditure in higher
wealth quintiles for 2015 (figure 70) and 2016 (figure 71). The key change in the responses relates to the
relative amounts spent on food vs non-food – in 2015 respondents across all quintiles claimed more
expenditure on food than non-food – in 2016 it is more event with significantly more spent on non-food in
higher quintiles (Q4-Q5). This can be explained through higher consumption in these quintiles of meat
and fish (2015) and alcohol and tobacco and fish (2016). It is also more evenly distributed across the
quintiles in 2016.
Figure 70: Total Food and non-food Expenditure by Quintile (2015)
49.2
54.150.9
46.444.3
0.0
10.0
20.0
30.0
40.0
50.0
60.0
Q1 Q2 Q3 Q4 Q5
Sh
are
of
tota
l exp
en
dit
ure
in
%
0
1.0e+06
2.0e+06
3.0e+06
4.0e+06
5.0e+06
Q1 Q2 Q3 Q4 Q5
Total Food and Non-Food Expendiures by Quintile
Food Non-Food
LLS | January 2017
Livelihood Study Second wave Report 45
Maize Sub-Sector in Sumenep
PRISMA January 2017
Figure 71: Total Food and non-food Expenditure by Quintile (2016)
Figure 72: Type of Food Expenditure by Quintile (total spend) (2015)
-
1,000,000
2,000,000
Q1 Q2 Q3 Q4 Q5
Food Non Food
0
200000
400000
600000
800000
Q1 Q2 Q3 Q4 Q5
Rice Staple Food
Vegetables Dried Food
Meat Fish
Milk & Eggs Spices
Sugar Oil
Beverages Alcohol & Tobacco
Snaks Food Consumed Outside of the House

LLS | January 2017
Livelihood Study Second wave Report 46
Maize Sub-Sector in Sumenep
PRISMA January 2017
Figure 73: Type of Food Expenditure by Quintile (total spend) (2016)
The share of expenditure on rice and other staples is largely similar between 2015 (figure 74) and 2016
(figure 75). The percentage of expenditure on staples is around 15-20% in 2015 and 2016, where rice is
around 10-15% for both years (with exception being Q2 in 2016). The reported expenditure on alcohol
and tobacco is substantially increased in 2016 against 2015.
Figure 74: Share of Expenditure on Rice and Other staples by Quintile (2015)
-
50,000.0
100,000.0
150,000.0
200,000.0
250,000.0
300,000.0
Q1 Q2 Q3 Q4 Q5To
tal
exp
en
du
ture
pe
r m
on
th
Rice Staple food (included rice) Vegatable
Dried Food Meat Fish
Milk&Eggs Spices Oil
Sugar Beverages Alcohol&Tobacoo
Snaks
0
5
10
15
20
Q1 Q2 Q3 Q4 Q5
Rice Staple Food
Vegetables Dried Food
Meat Fish
Milk & Eggs Spices
Sugar Oil
Beverages Alcohol & Tobacco
Snaks Food Consumed Outside of the House

LLS | January 2017
Livelihood Study Second wave Report 47
Maize Sub-Sector in Sumenep
PRISMA January 2017
Figure 75: Share of Expenditure on Rice and Other staples by Quintile (2016)
6 Income Use of Maize
The way income of maize is reported to be used. As can be seen in 2015 (figure 76) ad 2016 (figure 77),
maize earnings are mainly used to finance daily household needs.
Figure 76: Most important use of income derived from maize (2015)
0.0
5.0
10.0
15.0
20.0
25.0
Q1 Q2 Q3 Q4 Q5
Sh
are
of
tota
l exp
en
dit
ure
Rice Staple food (icluded rice) Vegatable Dried Food
Meat Fish Milk&Eggs Spices
Oil Sugar Beverages Alcohol&Tobacoo
Snaks
10.2
14.1
46.1
10.2
0.8 1.6
9.4
3.9 3.9
0
10
20
30
40
50
0
Hea
lth E
xpen
ditu
res
Educa
tiona
l Exp
enditu
res
Daily H
ouse
hold N
eeds
Agricultu
ral Inp
uts
Agricultru
al A
sset
s
Hou
se re
nova
tion/
buying
Deb
t Rep
aym
ent
Cas
h Sav
ings
Live
stoc
k
Oth
er D
urab
le G
oods
Oth
er
Most Important Income Use of Maize
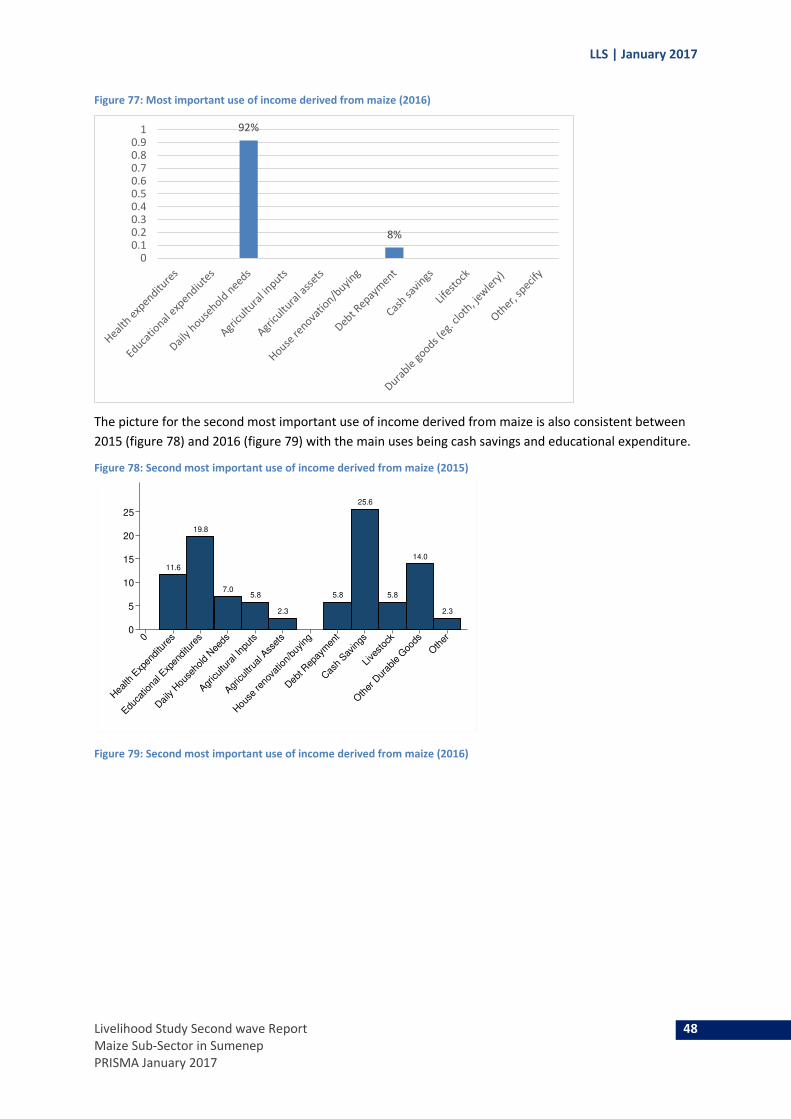
LLS | January 2017
Livelihood Study Second wave Report 48
Maize Sub-Sector in Sumenep
PRISMA January 2017
Figure 77: Most important use of income derived from maize (2016)
The picture for the second most important use of income derived from maize is also consistent between
2015 (figure 78) and 2016 (figure 79) with the main uses being cash savings and educational expenditure.
Figure 78: Second most important use of income derived from maize (2015)
Figure 79: Second most important use of income derived from maize (2016)
92%
8%
00.10.20.30.40.50.60.70.80.9
1
11.6
19.8
7.05.8
2.3
5.8
25.6
5.8
14.0
2.3
0
5
10
15
20
25
0
Hea
lth E
xpen
ditu
res
Educa
tiona
l Exp
enditu
res
Daily H
ouse
hold N
eeds
Agricultu
ral Inp
uts
Agricultru
al A
sset
s
Hou
se re
nova
tion/
buying
Deb
t Rep
aym
ent
Cas
h Sav
ings
Live
stoc
k
Oth
er D
urab
le G
oods
Oth
er

LLS | January 2017
Livelihood Study Second wave Report 49
Maize Sub-Sector in Sumenep
PRISMA January 2017
Table 14: Control and Decision Power of Earnings from Maize
2015 2016
Nr. Obs mean Nr. Obs mean
Most important decision maker in HH is female 129.00 23.26 175 41,7
Second important decision maker in HH is female 128.00 76.56 175 58,3
Regarding the control and decision-making power of earnings from maize, the data shows a shift towards
increased decision-making power by women. In 2015 the most important decision-maker was reported
to be a woman by 23% of respondents, in 2016 (table 14) this had risen to 42% of respondents.
7 Seasonality and Vulnerability
As can be seen in table 15, in 2015 only 2% of households worried that they did not have enough food to
eat in the last seven days and 0.5% of the households faced a situation within the last 12 months were
they did not have enough food in their household. In 2016 this has changed to nearly 6% of respondents
claiming that they are worried about food security with over 3% claiming they did not have enough food
to eat. This shows a decrease in the food security situation of the respondents between 2015 and 2016.
Table 15: Food Security
2015 2016
Nr. Obs % Nr. Obs %
Worried 193.00 2.07 175 5,7
Did not Have Enough Food 192.00 0.52 175 3,4
33%
8%
17%
25%
8% 8.3%
0%
5%
10%
15%
20%
25%
30%
35%
![Soal UN Teori Kejuruan Multimedia SMK Paket-B - [the-xp.blogspot.com]](https://static.fdocuments.us/doc/165x107/55cf9251550346f57b957f09/soal-un-teori-kejuruan-multimedia-smk-paket-b-the-xpblogspotcom.jpg)