
WAVE HEIGHT FORECAST ING USING … recorder, 1 – 28 February and 26 Maret 1997 – 22 Augtust...
16
http://www.iaeme.com/IJCIE International Journal of Civil E Volume 8, Issue 5, May 2017, pp Available online at http://www.ia ISSN Print: 0976-6308 and ISSN © IAEME Publication WAVE HEI MEAS DISTRIBUT Denny N Department of Ocea Department D Departement D Departement G ABSTRACT The information of w meteorological communic data of daily or maximum condition on the ground. T based on the group of win able to provide more speci results obtained from wa empirical and significant r term of wave height. Keywords: Forecasting, W Cite this Article: Denny Suripin, Suseno Darsono Measurement Wind Speed Journal of Civil Engineerin http://www.iaeme.com/IJCI ET/index.asp 604 ed Engineering and Technology (IJCIET) p. 604–619, Article ID: IJCIET_08_05_068 aeme.com/IJCIET/issues.asp?JType=IJCIET&VTyp N Online: 0976-6316 Scopus Indexed IGHT FORECASTING U SUREMENT WIND SPEE TION EQUATION IN JAV INDONESIA Nugroho Sugianto, Muhammad Zainuri anography, Faculty of Fisheries and Marine S Diponegoro University Indonesia. Alfin Darari Of Physics, Faculty Science And Mathematic Diponegoro University, Indonesia. Suripin, Suseno Darsono Of Civil Engineering, Faculty Of Engineerin Diponegoro University, Indonesia. Nur Yuwono Of Civil Engineering, Faculty Of Engineerin Gadjah Mada University, Indonesia. waves is an important factor in the serv cation. During that time, analyzing wind a m wind speed average, that is less able to de This research aims to determinate the durat nd speed using Beaufort scale and of wind d ific information to describe the condition of t ave forecasting showed equation model tha relationship between U wind speed and wave Wind Speed Distribution Equation, Wave Hei y Nugroho Sugianto, Muhammad Zainuri, o and Nur Yuwono Wave Height Fore d Distribution Equation In Java Sea, Indonesia ng and Technology, 8(5), 2017, pp. 604–619. IET/issues.asp?JType=IJCIET&VType=8&ITy [email protected] pe=8&IType=5 USING ED VA SEA, Sciences, c, ng, ng, vice of marine always uses the escribe the real tion of the wind direction that is the season. The at demonstrate e forecasting in ight, Java Sea , Alfin Darari, ecasting Using a. International . ype=5
Transcript of WAVE HEIGHT FORECAST ING USING … recorder, 1 – 28 February and 26 Maret 1997 – 22 Augtust...

http://www.iaeme.com/IJCIET/index.
International Journal of Civil Engineering and Technology (IJCIET)Volume 8, Issue 5, May 2017, pp.
Available online at http://www.iaeme.com/IJCIET/issues.
ISSN Print: 0976-6308 and ISSN
© IAEME Publication
WAVE HEIGHT FORECAST
MEASUREMEN
DISTRIBUTION EQUATION IN JA
Denny Nugroho Sugianto, Muhammad Zainuri
Department of Oceanography,
Department Of Physics, Faculty Science And Mathematic,
Diponegoro University, Indonesia
Departement Of Civil Engineering, Faculty Of Engineering,
Diponegoro University, Ind
Departement Of Civil Engineering, Faculty Of Engineering,
Gadjah Mada University, Indonesia
ABSTRACT
The information of wave
meteorological communication
data of daily or maximum wind speed average
condition on the ground. T
based on the group of wind speed
able to provide more specific
results obtained from wave forecasting showed
empirical and significant relationship between U wind speed and wave forecast
term of wave height.
Keywords: Forecasting, Wind Speed Distribution Equation, Wave Height, Java Sea
Cite this Article: Denny Nugroho Sugianto, Muhammad Zainuri, Alfin Darari,
Suripin, Suseno Darsono and Nur Yuwono Wave Height Forecasting Using
Measurement Wind Speed Distribution Equation In Java Sea, Indonesia
Journal of Civil Engineering and Techn
http://www.iaeme.com/IJCIET/issues.
IJCIET/index.asp 604 [email protected]
International Journal of Civil Engineering and Technology (IJCIET) 2017, pp. 604–619, Article ID: IJCIET_08_05_068
http://www.iaeme.com/IJCIET/issues.asp?JType=IJCIET&VType=8&IType=5
6308 and ISSN Online: 0976-6316
Scopus Indexed
WAVE HEIGHT FORECASTING USING
MEASUREMENT WIND SPEED
UTION EQUATION IN JAVA SEA,
INDONESIA
Denny Nugroho Sugianto, Muhammad Zainuri
Oceanography, Faculty of Fisheries and Marine Sciences,
Diponegoro University Indonesia.
Alfin Darari
Department Of Physics, Faculty Science And Mathematic,
Diponegoro University, Indonesia.
Suripin, Suseno Darsono
Departement Of Civil Engineering, Faculty Of Engineering,
Diponegoro University, Indonesia.
Nur Yuwono
Departement Of Civil Engineering, Faculty Of Engineering,
Gadjah Mada University, Indonesia.
waves is an important factor in the service of marine
communication. During that time, analyzing wind always use
daily or maximum wind speed average, that is less able to describe the
. This research aims to determinate the duration of the wind
wind speed using Beaufort scale and of wind dire
specific information to describe the condition of the season.
wave forecasting showed equation model that demonstrate
significant relationship between U wind speed and wave forecast
Forecasting, Wind Speed Distribution Equation, Wave Height, Java Sea
Denny Nugroho Sugianto, Muhammad Zainuri, Alfin Darari,
Suripin, Suseno Darsono and Nur Yuwono Wave Height Forecasting Using
Measurement Wind Speed Distribution Equation In Java Sea, Indonesia
Journal of Civil Engineering and Technology, 8(5), 2017, pp. 604–619.
http://www.iaeme.com/IJCIET/issues.asp?JType=IJCIET&VType=8&IType=5
asp?JType=IJCIET&VType=8&IType=5
ING USING
T WIND SPEED
VA SEA,
Sciences,
Department Of Physics, Faculty Science And Mathematic,
Departement Of Civil Engineering, Faculty Of Engineering,
Departement Of Civil Engineering, Faculty Of Engineering,
is an important factor in the service of marine
d always uses the
less able to describe the real
the duration of the wind
wind direction that is
to describe the condition of the season. The
that demonstrate
significant relationship between U wind speed and wave forecasting in
Forecasting, Wind Speed Distribution Equation, Wave Height, Java Sea
Denny Nugroho Sugianto, Muhammad Zainuri, Alfin Darari,
Suripin, Suseno Darsono and Nur Yuwono Wave Height Forecasting Using
Measurement Wind Speed Distribution Equation In Java Sea, Indonesia. International
.
asp?JType=IJCIET&VType=8&IType=5
Wave Height Forecasting Using Measurement Wind Speed Distribution Equation In Java Sea, Indonesia
http://www.iaeme.com/IJCIET/index.asp 605 [email protected]
1. INTRODUCTION
Waves of the Java Sea have characteristics generated by the wind, many of which are limited
by the mainland such as the island of Sumatera, Kalimantan, and Sulawesi. These conditions
make the Java Sea area has strategic position in Indonesia as international shipping routes for
the benefit of the world economy [1] [2].
The waves is an important factor in marine meteorological services. Frequent occurrence
of high waves certainly can cause disruption to marine transportation activities between
islands which can affect people`s live in land. Such things as scarcity of foodstuffs in several
small islands and any kinds of development activities are relies heavily on the lack of
construction materials supply. The waves are more likely to cause the forces acting on the
existing infrastructure and building on the coast. Moreover, it is able to generate currents and
on sediment mobilization in the coastal areas [3]. Hence, the need for knowledge about the
condition of the Java Sea wave which is used for planning, determining the geometry of
beach building coast, port planning, handling coastal damage, as well as the power of
building infrastructure in coastal areas is urgently needed [4]
Currently the wave data which is exist in the Java Sea is still limited and generally
difficult to be obtained [5]. Therefore to overcome this limitations, wave forecasting usually
used wind data obtained from wind measurement stations of the Meteorology, Climatology
and Geophysics (BMKG)[6]. During this time, data analysis is always conducted by using the
daily average wind speed data or maximum. Consequently, the data are less describe the real
condition [7]. Wave forecasting method generally use wave forecasting curve of height and
the wave period, similar with the one developed by Darbyshire and Draper [8] for coastal
waters and by Green and Dorrestein [9] for the deep sea [10], the SMB Method Sverdrup-
Munk-Bretschneide [11] and a method of using a nomogram to determine height and wave
period forecasts with analysis [12] [13]. However, this method still has weaknesses such as
the distribution of wind speed of the wave generator can not describe the duration and
distribution of wind speed per hour. In addition, it can not classify based on wind direction
that can describe the general condition, and there are no waves data that can be calibrated
with the model. Thus it could not determine the duration of the wind (td) that influence
significantly to the wave forecasting in Java Sea by using maximum wind data [14] [15].
Thereby, it is necessary to conduct research regarding how to predict wave height in the
Java Sea based on the modelling of wind speed distribution, and daily maximum wind speed
in a real-time (every hour). In this research, conducted determination of the wind duration
based on a Group of wind speed (Beaufort scale) and the wind direction which has the
tendency of certain direction to describe condition of the season. Wave forecasting method of
wind data uses Darbyshire curves, which is further developed to determine duration of the
wind is equivalent to the maximum speeds. Wind data that will be used is the wind speed data
every hour, with periods of wind data be processed for more than 10 years. However, the
previous research about the modelling wind speed distribution in the western region of
Indonesia [16]; Indonesia central region [17] and the eastern region of Indonesia [18], are
using wind data every three hours and the period of wind data are processed only three years.
This research aims to harness the modelling wind speed distribution to obtain the empirical
relationship between wind speed and wave height in the Java Sea for the wave forecasting
needs.
Denny Nugroho Sugianto, Muhammad Zainuri, Alfin Darari, Suripin, Suseno Darsono and Nur Yuwono
http://www.iaeme.com/IJCIET/index.asp 606 [email protected]
2. METHODS
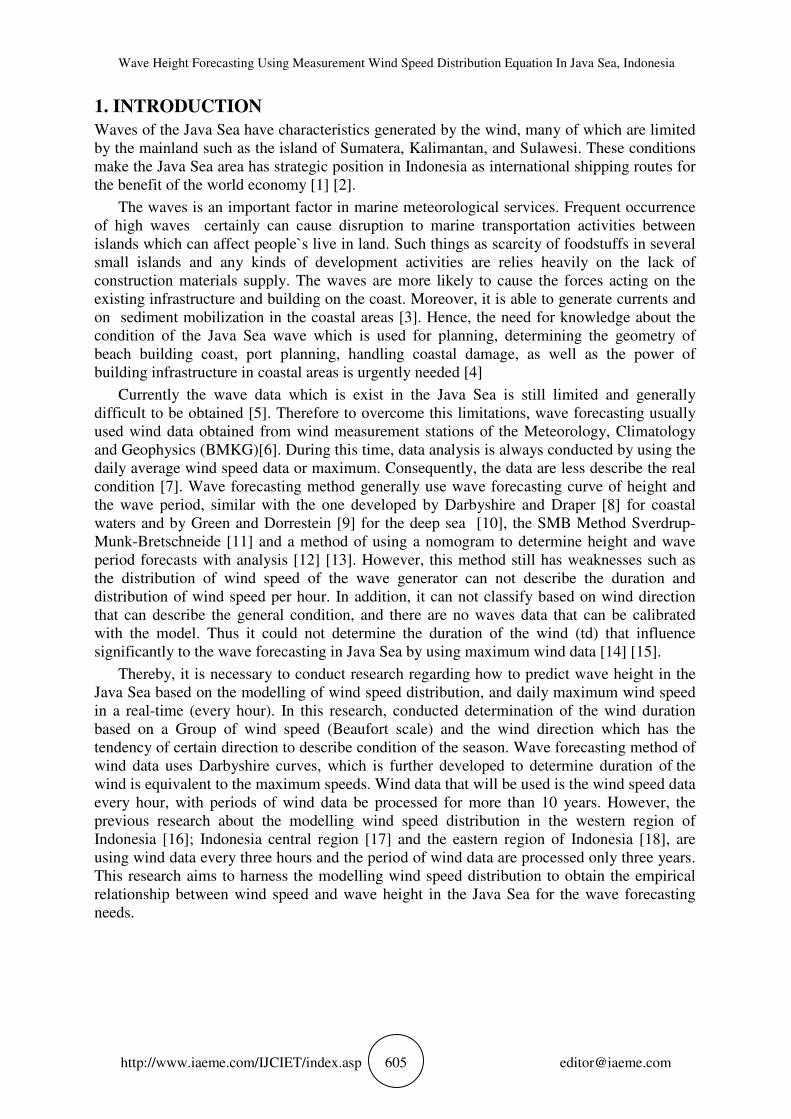
The research was conducted in the Java Sea which is located 5 area bojonegoro – banten (18
– 21 July 2008), semarang - central java (28 – 30 December), Jepara-central java ( take from
wave recorder, 1 – 28 February and 26 Maret 1997 – 22 Augtust 1999), Rembang-Central
Java (3 – 13 July 2007) , pacitan – east java(16 – 20 October 2009), fig 1
Figure 1 The Location of collecting data Area
The method of collecting wind data directly conducted by using survey techniques in situ,
where the tools used in the form of a simple anemometer, on the screen that read
subsequently recorded anemometer wind speed and direction, wind direction on the wind data
recording is taken from wind came from or arrive. As for the wind data for the years 2007-
2013 was obtained from wind measurement stations of the Meteorology, Climatology and
Geophysics (BMKG) every location in 2007-2013, in the form of wind data every hour. Data
gathered around a period of more than 10 years for each location recording wind data by
these agencies. Data retrieval is done to present the model of the distribution of wind speed in
Semarang, Jakarta, Surabaya. Maximum wind speed values obtained with the classification of
the moderate breeze, fresh breeze, and strong breeze. These data are the result of average
modelling wind speed distribution in all seasons table 1.

Wave Height Forecasting Using Measurement Wind Speed Distribution Equation In Java Sea, Indonesia
http://www.iaeme.com/IJCIET/index.asp 607 [email protected]
Table 1 The equation of Wind Speed Distribution Model: Classified in the moderate breeze, fresh
breeze, and strong breeze in Semarang, Jakarta, Surabaya, and Java Sea
Location Breeze
Classification t = 0 – 6 hours t = 6 – 12 hours
Semarang
Moderate U/Umax (%) = 1,208 t2
+ 0,435 t +
54,37 (R² = 0,996) Pers. (4.1)
U/Umax (%) = 1,242 t2 – 29,98 t +
235,3 (R² = 0,997) Pers. (4.2)
Fresh U/max (%) = 1,592 t2
– 0,226 t +
44,50 (R² = 0,975) Pers. (4.3)
U/Umax (%) = 1,571 t2 – 37,89 t+
271,3 (R² = 0,988) Pers. (4.4)
Strong U/Umax (%) = 1,926 t2
– 0,423 t +
33,59 (R² = 0,993) Pers. (4.5)
U/Umax (%) = 1,846 t2 – 44,46 t +
300,8 (R² = 0,994) Pers. (4.6)
Jakarta
Moderate U/Umax (%) = 1,061 t2
+ 1,041 t +
57,30 (R² = 0,991) Pers. (4.7)
U/Umax (%) = 1,091 t2 – 27,08 t +
225,1 (R² = 0.990) Pers. (4.8)
Fresh U/Umax (%) = 1,583 t2
– 0,144 t +
44,42 (R² = 0,998) Pers. (4.9)
U/Umax (%) = 1,667 t2 – 39,61 t +
278,2 (R² = 0,998) Pers. (4.10)
Strong U/Umax (%) = 2,178 t2
– 2,460 t +
36,13 (R² = 0,978) Pers. (4.11)
U/Umax (%) = 2,292 t2 – 52,38 t +
332,4 (R² = 0,990) Pers. (4.12)
Surabaya
Moderate U/Umax (%) = 0,917 t2
+ 1,711 t +
58,23 (R² = 0,981) Pers. (4.13)
U/Umax (%) = 0,996 t2 – 25,11 t +
216,2 (R² = 0,974) Pers. (4.14)
Fresh U/Umax (%) = 1,417 t2
+ 0,510 t +
46,71 (R² = 0,997) Pers. (4.15)
U/Umax (%) = 1,341 t� - 33,39 t +
252,6 (R² = 0,997) Pers. (4.16)
Strong U/Umax (%) = 2,131 t2
– 1,895 t +
34,59 (R² = 0,982) Pers. (4.17)
U/Umax (%) = 2,234 t2 – 50,88 t+
324,8 (R² = 0,981) Pers. (4.18)
LautJava
Moderate U/Umax (%) = 1,062 t2
+ 1,148 t +
56,55 (R² = 0,988) Pers. (4.19)
U/Umax (%) = 1,11 t2 – 27,49 t +
226,6 (R² = 0,987) Pers. (4.20)
Fresh U/Umax (%) = 1,531 t2
+ 0,159 t +
45,10 (R² = 0,994) Pers. (4.21)
U/Umax (%) = 1,526 t2 – 37,08 t +
268,6 (R² = 0,994) Pers. (4.22)
Strong U/Umax (%) = 2,128 t2
– 1,837 t +
34,44 (R² = 0,986) Pers. (4.23)
U/Umax (%) = 2,175 t2 – 50,20 t +
323,3 (R² = 0,991) Pers. (4.24)
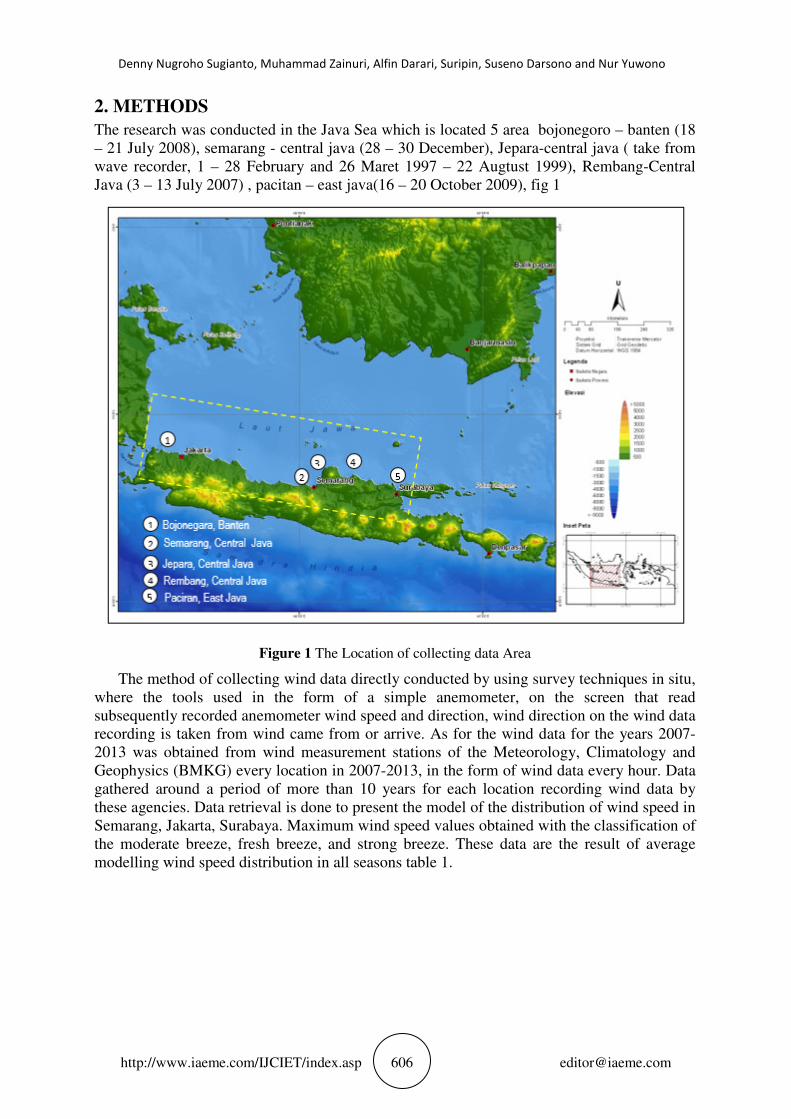
The next step is calculation and determination of wind duration equivalent (tdEQ) by using
Darbyshire curves[8]. Moreover, processing data to obtain the relationship chartbetween
wind duration equivalent and the wind speed U in the Java island. The equation of its
relationship is as follows :
tdEQ = 0,006 U 2 – 0,437 U + 10,70 (1)
the equation is be able to use for wave forecasting in Java Sea based on the model of wind
speed distribution or daily wind speed maximum.
3. RESULT OF DISCUSSION
The relationship chart of wind duration equivalenttdEQ (hours) with the wind speed U (knot)
in the Java Sea is showed by the equation (1). If the value of the wind speed U are 10, 15, 20,
25, 30, 35, and 40 knot, therefore the value of wind duration equivalent (tdEQ) are able to be
obtained. By using Darbyshire [8] curves, the significant of wave height and period are also
be able to be determined, given by fig. 2.
Denny Nugroho Sugianto, Muhammad Zainuri, Alfin Darari, Suripin, Suseno Darsono and Nur Yuwono
http://www.iaeme.com/IJCIET/index.asp 608 [email protected]
Figure 1 Determination Curves of Significant Wave Height and Period Obtained from The Equivalent
Wind Speed Duration(tdEQ) in the Java Sea by using Darbyshire Methods
linede scribes particular wind speed with its wind duration equivalent (tdEQ), thus the
significant of wave height and period are be able to be obtained.
Table 2 The Relationship between Wind speed U and wind duration equivalent(tdEQ) to Determine
Significant of Wave Height (Hs) and Period (Ts) by Using Darbyshire Methods.
No Wind Speed
U (Knot)
Wind Speed
U (m/sec)
Wind Duration
EquivalenttdEQ
(hours)
Significant
of Wave
Height
Hs (m)
Significant of
Wave Period
Ts (sec)
1 10 5,1 7 0,6 4,1
2 15 7,7 5 0,9 4,8
3 20 10,3 4 1,2 5,3
4 25 12,9 3,5 1,7 6,0
5 30 15,4 3 2,1 6,4
6 35 17,9 3 2,8 7,1
7 40 20,6 3 3,7 7,8
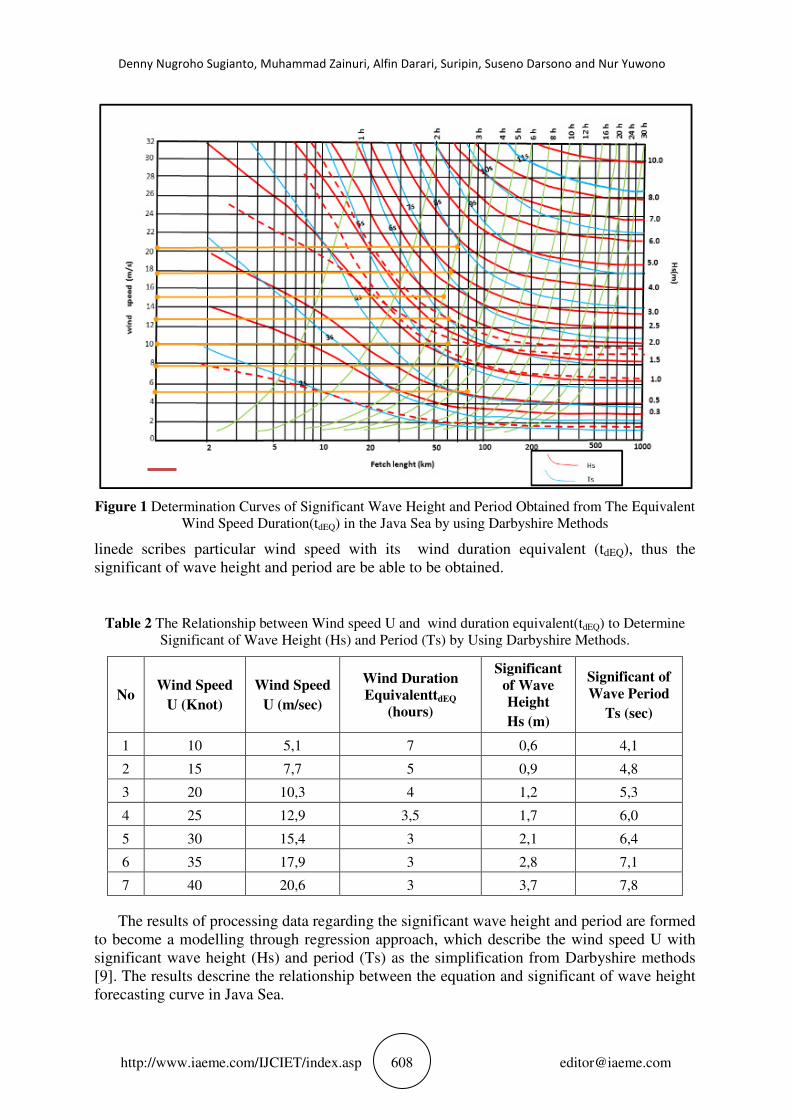
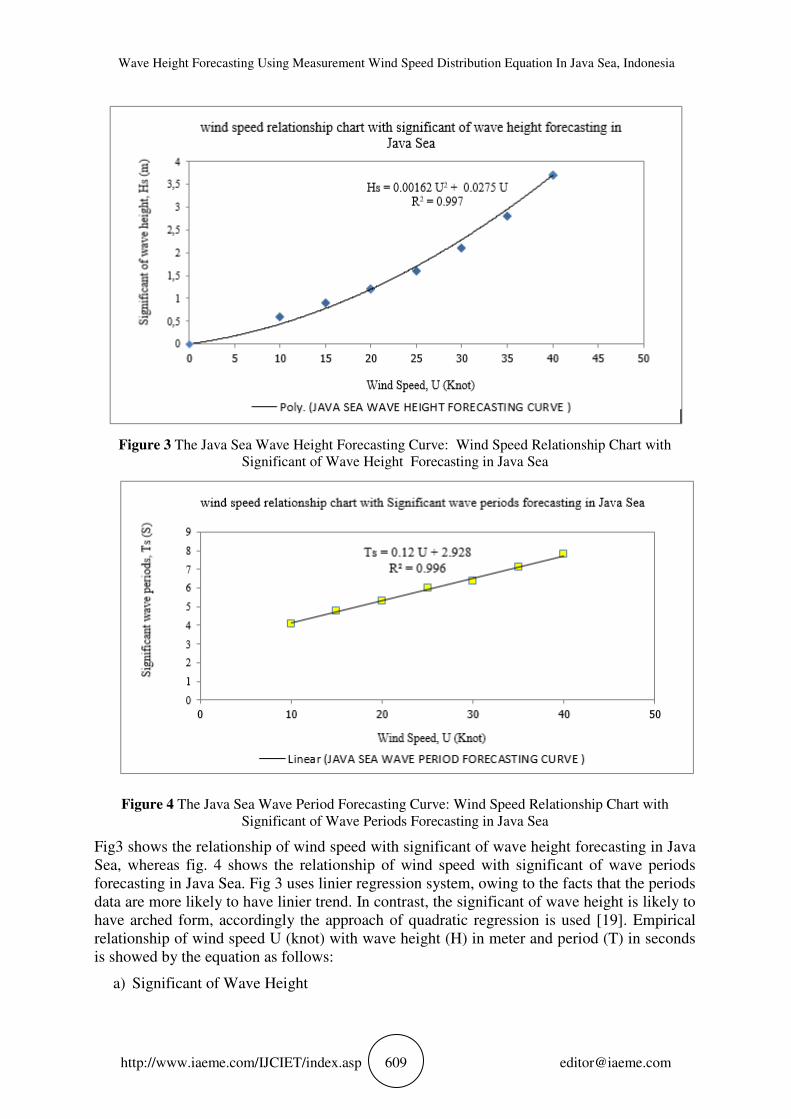
The results of processing data regarding the significant wave height and period are formed
to become a modelling through regression approach, which describe the wind speed U with
significant wave height (Hs) and period (Ts) as the simplification from Darbyshire methods
[9]. The results descrine the relationship between the equation and significant of wave height
forecasting curve in Java Sea.
Wave Height Forecasting Using Measurement Wind Speed Distribution Equation In Java Sea, Indonesia
http://www.iaeme.com/IJCIET/index.asp 609 [email protected]
Figure 3 The Java Sea Wave Height Forecasting Curve: Wind Speed Relationship Chart with
Significant of Wave Height Forecasting in Java Sea
Figure 4 The Java Sea Wave Period Forecasting Curve: Wind Speed Relationship Chart with
Significant of Wave Periods Forecasting in Java Sea
Fig3 shows the relationship of wind speed with significant of wave height forecasting in Java
Sea, whereas fig. 4 shows the relationship of wind speed with significant of wave periods
forecasting in Java Sea. Fig 3 uses linier regression system, owing to the facts that the periods
data are more likely to have linier trend. In contrast, the significant of wave height is likely to
have arched form, accordingly the approach of quadratic regression is used [19]. Empirical
relationship of wind speed U (knot) with wave height (H) in meter and period (T) in seconds
is showed by the equation as follows:
a) Significant of Wave Height
Denny Nugroho Sugianto, Muhammad Zainuri, Alfin Darari, Suripin, Suseno Darsono and Nur Yuwono
http://www.iaeme.com/IJCIET/index.asp 610 [email protected]
Wind speed starts from U = 0 knot
Hs = 0,00162 U2+ 0,0275 U (R
2 = 0,997) (2)
b) Wave Period
Wave Period starts from U = 10 knot
Ts = 0,12 U + 2,928 (R2 = 0,996) (3)
In which the significant of wave period is only valid and able to be calculated for wind
speed more that 10 knot, because of the wind speed ranging from 0 – 10 knot is not be able to
be formed as a modelling.
The results of equation (2) and (3) are examined regarding its validation and model
callibration, to see if the model represents the actual conditions. The data used in the
validation is in Semarang (28 – 30 December 2010), Rembang (3 – 13 July 2007), Jepara (1 –
28 February 1998 and 1 – 28 February 1999) Bojonegoro, (18 – 21 July 2008), and Pacitan
(18 – 21 July 2008). The data of wave height measurement field is depicted on a model or
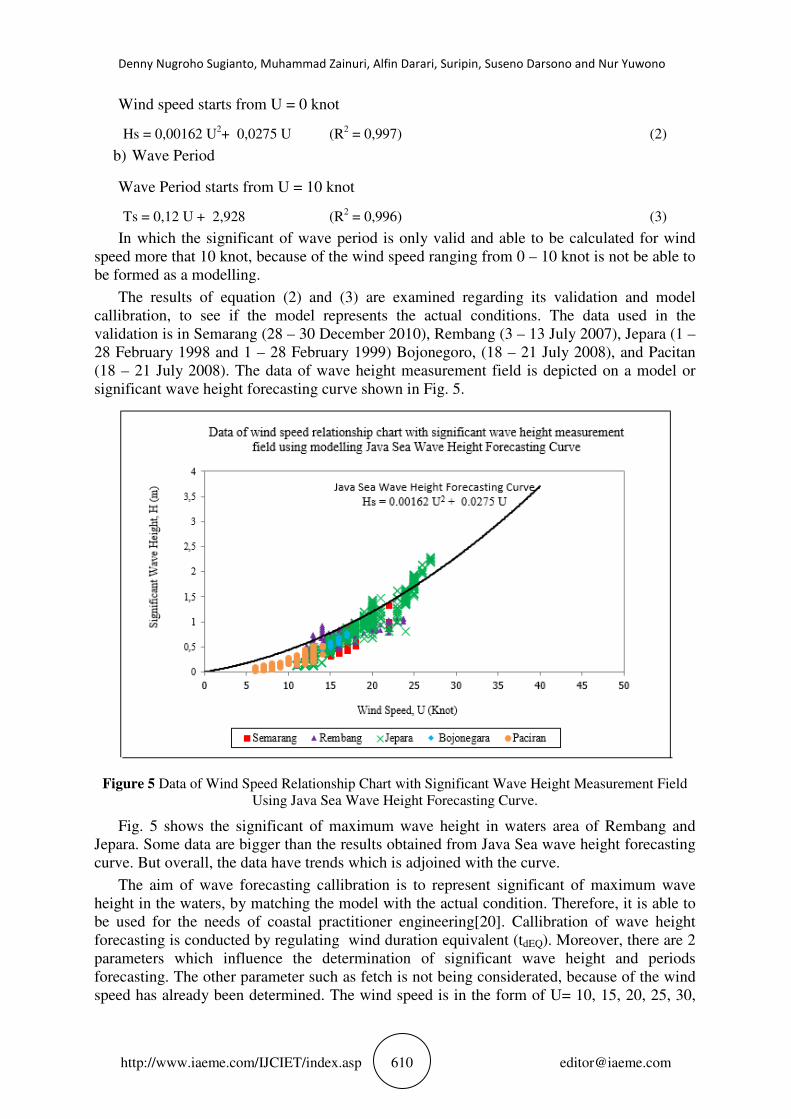
significant wave height forecasting curve shown in Fig. 5.
Figure 5 Data of Wind Speed Relationship Chart with Significant Wave Height Measurement Field
Using Java Sea Wave Height Forecasting Curve.
Fig. 5 shows the significant of maximum wave height in waters area of Rembang and
Jepara. Some data are bigger than the results obtained from Java Sea wave height forecasting
curve. But overall, the data have trends which is adjoined with the curve.
The aim of wave forecasting callibration is to represent significant of maximum wave
height in the waters, by matching the model with the actual condition. Therefore, it is able to
be used for the needs of coastal practitioner engineering[20]. Callibration of wave height
forecasting is conducted by regulating wind duration equivalent (tdEQ). Moreover, there are 2
parameters which influence the determination of significant wave height and periods
forecasting. The other parameter such as fetch is not being considerated, because of the wind
speed has already been determined. The wind speed is in the form of U= 10, 15, 20, 25, 30,

Wave Height Forecasting Using Measurement Wind Speed Distribution Equation In Java Sea, Indonesia
http://www.iaeme.com/IJCIET/index.asp 611 [email protected]
35, and 40 knots. Callibration is able to be conducted by regulating the valueof wind duration
equivalent(tdEQ).
The calibration results of wind duration equivalent (tdEQ) is approximately similar with
wind duration equivalent (tdEQ) obtained before callibration as given by table 2. In addition,
there are the value of wind duration equivalent (tdEQ) obtained after callibration as given by
table 3.
Table 3 The Value Of Wind Duration Equivalent(tdEQ) for The Callibration Model of Wave
Forecasting in Java Sea
No Wind Speed
U (Knot)
Wins Speed
U (m/sec)
Wind Duration
EquivalenttdEQ
(hours)
Before
Callibration
Wind Duration
EquivalenttdEQ
(hours)
After
Callibration
1 10 5,1 7 8
2 15 7,7 5 6
3 20 10,3 4 5
4 25 12,9 3,5 4,5
5 30 15,4 3 4
6 35 17,9 3 4
7 40 20,6 3 4
On wind duration equivalent (tdEQ), the results of callibration show that each of the
tdEQvalue is added by 1 hour. As a consideration from the fig. 5 that data distribution of
significant wave height measurement field in Rembang and Jepara is higher than the Java Sea
wave height forecasting curve.The calculation of wave forecasting (height and periods) using
Darbyshire curve is obtained based on the value of wind speed U and equaivalent wind
duration (tdEQ) as given by table 3. Whereas, the results of callibration are presented in the
table 4, and depicted into Java Sea wave forecasting curve as given by fig. 6 and fig. 7.
Table 4 The Relationship Table between The Callibration Results of Equivalent Wind Speed Duration
to Determine Significant of Wave Height by Using Darbyshire Methods.
No Wind Speed
U (Knot)
Wind Speed
U (m/sec)
Wind Duration
Equivalent Tdeq
(Hours)
After
Callibration
Significant
of Wave
Height
Hs (m)
Significant of
Wave Period
Ts (sec)
1 10 5,1 8 0,65 4,2
2 15 7,7 6 1 5,1
3 20 10,3 5 1,48 6
4 25 12,9 4,5 2,1 7
5 30 15,4 4 2,5 7,4
6 35 17,9 4 3,2 8
7 40 20,6 4 4,2 8,8

Denny Nugroho Sugianto, Muhammad Zainuri, Alfin Darari, Suripin, Suseno Darsono and Nur Yuwono
http://www.iaeme.com/IJCIET/index.asp 612 [email protected]
Figure 6 Wind Speed and Java Sea Wave Height Forecasting Relationship Chart with Wind Duration
Equivalent (tdEQ) Base Callibration
Figure 7 Wind Speed and Java Sea Significant Wave Periods Relationship Chart with Wind Duration
Equivalent (tdEQ) Base Callibration
Fig. 6 and Fig. 7 is obtained from the equation and Jawa Sea wave height and period
forecasting curve based on the data of wind speed and wind duration equivalent (tdEQ) after
Wave Height Forecasting Using Measurement Wind Speed Distribution Equation In Java Sea, Indonesia
http://www.iaeme.com/IJCIET/index.asp 613 [email protected]
callibration. Empirical relationship of wind speed U (Knot) with wave height (meter) and
wave period (seconds) as given by fig 6 and 7 is showed by equation (4) and (5).
• Wave height forecasting for wind duration equivalent (tdEQ) base callibration
Wind speed starts from U = 0 knot
Hs = 0,0016 U2+ 0,0406 U (R
2 = 0,996) (4)
• Wave period forecasting for wind duration equivalent (tdEQ) base callibration
Wind speed starts from U = 10 knot
Ts = 0,15 U + 2,892 (R2 = 0,987) (5)
Equation (5) for wave period forecasting are valid and able to be calculated by the wind
speed with > 10 knot, because of the wind speed between 0-10 knot is unlikely to be formed
as model. In addition, wind speed < 10 knot is less speed for the wave formatting as given by
fig. 8.
The following step is the validation conducted to validate the empirical relationship of
wind speed U (Knot) with wave height (meter) of wind duration equvalent (tdEQ) base
callibration, by using the data of wind speed relationshipwith significant wave height
measurement field onJava Seawave height forecasting curve. The similar step is used to the
data distribution of significant wave period measurement field in Java Sea. The graph to
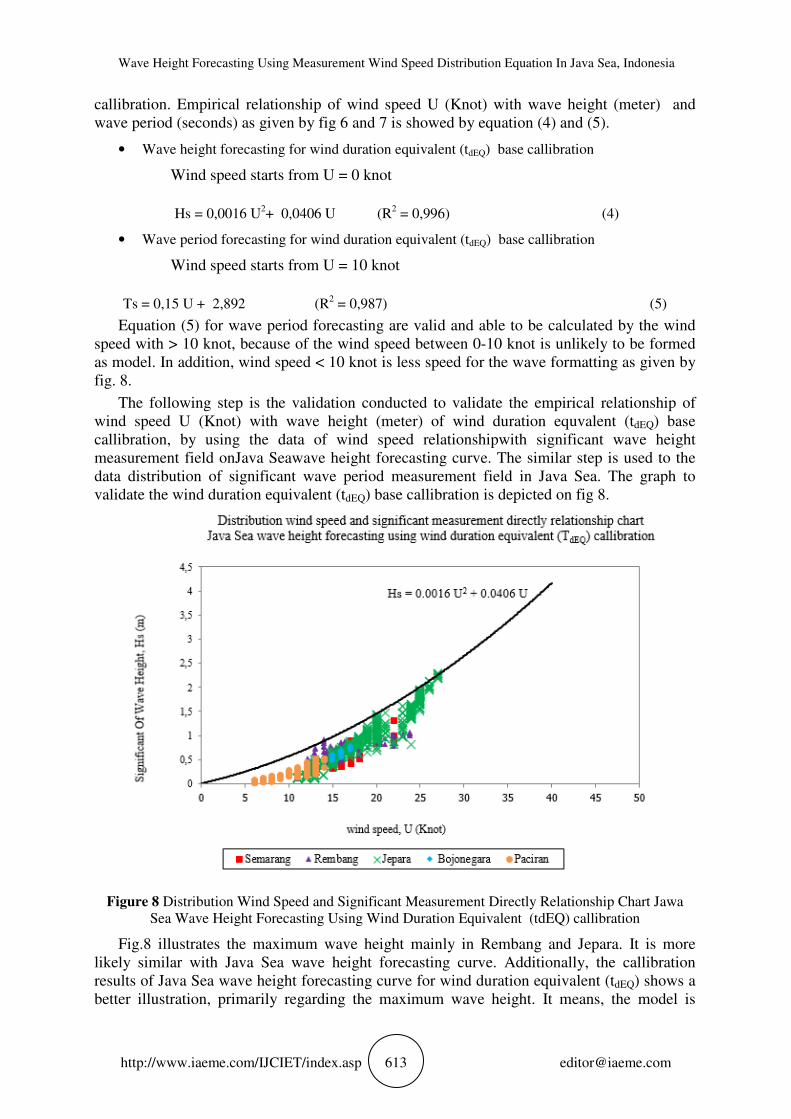
validate the wind duration equivalent (tdEQ) base callibration is depicted on fig 8.
Figure 8 Distribution Wind Speed and Significant Measurement Directly Relationship Chart Jawa
Sea Wave Height Forecasting Using Wind Duration Equivalent (tdEQ) callibration
Fig.8 illustrates the maximum wave height mainly in Rembang and Jepara. It is more
likely similar with Java Sea wave height forecasting curve. Additionally, the callibration
results of Java Sea wave height forecasting curve for wind duration equivalent (tdEQ) shows a
better illustration, primarily regarding the maximum wave height. It means, the model is

Denny Nugroho Sugianto, Muhammad Zainuri, Alfin Darari, Suripin, Suseno Darsono and Nur Yuwono
http://www.iaeme.com/IJCIET/index.asp 614 [email protected]
selected conservatively. Thus, in coastal planning the results of Java Sea wave height
forecasting curve can be used or implemented. Thereby, the wave forecasting is able to
present significant wave height happened in the waters. Despite it is difficult to determine its
fit in deks, because of the comparison reference used is the maximum wave height. There is
whole description regarding Java Sea wave height forecasting curve for wind duration
equivalent (tdEQ) before callibration, as given by fig.9.
Figure 9 Distribution Data of Wind and Significant Wave Height Direct Measurement Relationship
Chart with Wind Duration Equivalent (tdEQ) before Callibration
Based on fig.9 it is concluded that the wave height forecasting by using wind duration
equivalent (tdEQ) after callibration has better results in interpreting the empirical relationship
between wind speed U (knot) and wave height significant Hs (meter). Specifically for waves
that have maximum wave height. The validation and callibration model in this study are
based on maximum of the wave height significant (Hs). It is with consideration for "security"
wave forecasting results especially for waves that have the maximum value less the results of
the generated wave forecasting model in this study.
The validation is conducted by determining the selection of the model or wave forecasting
curves based on data only at the height of a wave of significant field and wave forecasting
curves model for the Java Sea wave height forecasting curve. Because of the significant wave
period of variation is large enough for each measurement location, thus that consideration on
period aspects have yet to be used in determining which model is better to be applied [21].
Duration data regarding the significant wave period and its measurement are depicted
by Java Sea wave height froecasting as given by fig. 10 and fig.11. However, waters in
Pacitan is unlikely to be analyze due to the wave which is relatively small.

Wave Height Forecasting Using Measurement Wind Speed Distribution Equation In Java Sea, Indonesia
http://www.iaeme.com/IJCIET/index.asp 615 [email protected]
Figure 10 Distribution Data of Wind Speed and Significant Wave Periods Direct Measurement
Relationship Chart with Wind Duration Equivalent (tdEQ) before Callibration
Figure 11 Distribution Data of Wind Speed and Significant Wave Periods Direct Measurement
Relationship Chart with Wind Duration Equivalent (tdEQ) After Callibration
The result of the wave forecasting model of the study, additionally compared to the previous
studies. Regarding to the relationship between wind speed and significant wave height in the
Java Sea by Basuki Rajendra Budi [22], in Semarang and Surabaya by Thambas [17]

Denny Nugroho Sugianto, Muhammad Zainuri, Alfin Darari, Suripin, Suseno Darsono and Nur Yuwono
http://www.iaeme.com/IJCIET/index.asp 616 [email protected]
Figure 12 The Relationship Chart between Wind Speed and Significant Wave Height Hs (m)
Compared to The Previous Study.
Fig. 12. Shows that there is a visible difference of wave height, in which the results of the
previous study indicates significant wave height is larger compared to the results of this
study. Therefore, the calculation of wave forecasting stages use data every hour, thus the
duration and distribution of wind are more likely to be better to determine the duration of
wind speed. In the previous study used data on wind speed every 3 hours, so the alleged
approach for the calculation of the duration and distribution of wind are more likely to be
larger so that obtained results of calculation of wave forecasting from wind data the result is
also larger.
It is clearly seen that the previous study generated the relationship between wind speed U
(knots) and a significant wave height Hs (m). In addition, it produced also without a tangent
point on the conditions of wind speed 0 (zero). Besides the result of the equation looks also
applies to the values of wind speed less than 15 knots. Whereas the results of the model
equations and wave forecasting curves form the Java Sea produced in this study has been
made between the results of validation step model with measurement data field in which this
validation step is not be able to conduct by previous researchers, therefore the results
obtained in this study has better results. This is as presented in Fig. 13.

Wave Height Forecasting Using Measurement Wind Speed Distribution Equation In Java Sea, Indonesia
http://www.iaeme.com/IJCIET/index.asp 617 [email protected]
Figure 13 Distribution Data of Wind Speed and Significant Wave Height Compared to Some Studies
regarding Wave Forecasting in The Java Sea
Fig. 13 shows the distribution data of wind speed and wave height significant direct
measurement field on some studies of wave height forecasting in the Jawa Sea. The results of
Thambas (Semarang, 2003), Thambas (Surabaya, 2003) are more likely to have greater data
on wave forecasting then field measurement when the wind speed is above 20 knots.
However, for the lower wind speed has lower tren and its wave height forecasting is less then
the field measurement data. Therefore, it has low quality trend compared to the results of
field measurement. Whereas the model by Basuki[22] has greater value or above the wave
measurement. It can be concluded the recents studies have better quality than the previous
studies.
4. CONCLUSION
Wave forecasting theoretically can be done by using the model equation of empirical
relationship between wind speed and significant of wave height and period forecasting. The
results obtained from wave forecasting showed equation model that demonstrate empirical
and significant relationship between U wind speed and wave forecasting in term of wave
height. Therefore, it practically and easily provides the information both for researcher and
planner in the wave forecasting (storm) in Java Sea.
5. ACKNOWLEDGEMENT
We would thank to Oceanography Department, Diponegoro University for funding our
research and to Sulistiyono Susilo and Mirra Fatharani for valuable editing assistance.

Denny Nugroho Sugianto, Muhammad Zainuri, Alfin Darari, Suripin, Suseno Darsono and Nur Yuwono
http://www.iaeme.com/IJCIET/index.asp 618 [email protected]
REFERENCES
[1] Atmoko, R. A., Aisjah, A. S., & Nugroho, G. (2016). Analysis of Spatial Characteristic of
Maritime Weather in Java Sea. IPTEK Journal of Proceedings Series, 2(1).
[2] Nuryanto, D. E., Pawitan, H., Hidayat, R., & Aldrian, E. (2016). Heavy Rainfall
Distributions Over Java Sea in Wet Season. Procedia Environmental Sciences, 33, 178-
186.
[3] Horikawa, K. (Ed.). (1988). Nearshore dynamics and coastal processes: Theory,
measurement, and predictive models. University of Tokyo press.
[4] Coastal Hydraulic Laboratory, “Coastal Enginering Manual.,” in Part I-IV, Washington
DC: Department of the Army. U.S. Army Corp of Engineering, 2002.
[5] Yuwono, N. (1992). Dasar Dasar Perencanaan Bangunan Pantai. Keluarga Mahasiswa
Teknik Sipil Unuversitas Gadjah Mada, Yogyakarta.
[6] Kurniawan, R., Habibie, M. N., & Suratno, S. (2011). Variasi Bulanan Gelombang Laut
Di Indonesia. Jurnal Meteorologi dan Geofisika, 12(3).
[7] Hadikusumah. (2009 ). Karakteristik Gelombang dan Arus di Eretan Indramayu,” J.
Makara Seri Sains, vol. 13, no. 2, pp. 163–172.
[8] Darbyshire, M., & Draper, L. (1963). Forecasting wind-generated sea waves.
Engineering, 195, 482-484.
[9] Dorrestein, R. (1960). Simplified method of determining refraction coefficients for sea
waves. Journal of Geophysical Research, 65(2), 637-642.
[10] Yuwono, N., & Kodoatie, R. J. (2004). Pedoman Pengembangan Reklamasi Pantai dan
Perencanaan Bangunan Pengamanannya.
[11] Hands, E. B. (1984). The Great lakes as a test model for profile response to sea level
changes (No. CERC-84-14). Coastal engineering research center vicksburg ms.
[12] B. Triatmodjo. (1996). Pelabuhan. Yogyakarta: Beta Offset.
[13] B. Triatmodjo. (1999). Teknik Pantai. Yogyakarta: Beta Ofset.
[14] Wu, T., Timo, H., Qin, B., Zhu, G., Janne, R., & Yan, W. (2016). In-situ erosion of
cohesive sediment in a large shallow lake experiencing long-term decline in wind speed.
Journal of Hydrology, 539, 254-264.
[15] Draper, L. (1963). Derivation of adesign wavefrom instrumental records of sea waves.
Proceedings of the Institution of Civil Engineers, 26(2), 291-304.
[16] HERMAWAN, S., & Yuwono, I. H. N. (2002). Model distribusi kecepatan angin dan
pemanfaatannya dalam peramalan gelombang di wilayah barat Indonesia (Pulau
Sumatera) (Doctoral dissertation, [Yogyakarta]: Universitas Gadjah Mada).
[17] THAMBAS, A. H., & Yuwono, I. H. N. (2003). Model distribusi kecepatan angin dan
pemanfaatannya dalam peramalan gelombang di wilayah tengah Indonesia:: Pulau Java,
Sulawesi dan Kalimantan (Doctoral dissertation, [Yogyakarta]: Universitas Gadjah
Mada).
[18] Edy, H., Yuwono, I. H. N., & HE, D. (2004). Model Distribusi Kecepatan Angin Dan
Pemanfaatannya Dalam Peramalan Gelombang Di Wilayah Timur Indonesia (Pulau
Sulawesi, Nusa Tenggara, Maluku Dan Papua) (Doctoral dissertation, [Yogyakarta]:
Universitas Gadjah Mada).
[19] Mughal, M. O., Lynch, M., Yu, F., McGann, B., Jeanneret, F., & Sutton, J. (2017). Wind
modelling, validation and sensitivity study using Weather Research and Forecasting
model in complex terrain. Environmental Modelling & Software, 90, 107-125.
[20] Massel, S. R., & Mei, C. C. (1977). Transmission of random wind waves through
perforated or porous breakwaters. Coastal Engineering, 1, 63-78.
[21] Miller, S. T. K., Keim, B. D., Talbot, R. W., & Mao, H. (2003). Sea breeze: Structure,
forecasting, and impacts. Reviews of geophysics, 41(3).

Wave Height Forecasting Using Measurement Wind Speed Distribution Equation In Java Sea, Indonesia
http://www.iaeme.com/IJCIET/index.asp 619 [email protected]
[22] B. S. Budi (2000). “Model Distribusi Kecepatan Angin dan Pemanfaatannya dalam
Peramalan gelombang di Wilayah Tengah Indonesia,” Gadjah Mada University.
[23] Messi Alfred François, Tewa Jean Jule, Lezin Seba Minsili, Piam Njomo Fritz, Koumbe
Mbock, Kenne Rodrigue, Critical Analysis of the Methodology Adopted By Certain
Cameroonian Studies for the Evaluation of the Wind Speed: Case of the Economical City
of Douala. International Journal of Civil Engineering and Technology, 8(2), 2017, pp. 34–
50.
[24] S. Bhakiyaraja, Dr. S. Vaithyanathan, Dr. S. Palanivelraja and V. Krishna Prasad,
Dispersion of Air Pollutant in the Neighbourhood of a Typical Thermal Power Station
under Critical Wind Speed using CFD-Fluidyn PANACHE. International Journal of
Mechanical Engineering and Technology, 7(6), 2016, pp. 245–252.