Wave Assessment on Loch Ericht - British Dam Society · PDF fileWave Assessment on Loch Ericht...
15
Wave Assessment on Loch Ericht DEBBIE HAY-SMITH, JBA Consulting, previously FaberMaunsell RICHARD DOAKE, FaberMaunsell WILLIAM ALLSOP, H R Wallingford KIRSTY McCONNELL, H R Wallingford SYNOPSIS. This paper uses the example of two dams to illustrate generic problems and solutions to the analysis of waves and wave forces on wave walls. Dalwhinnie Dam and Ericht Dam impound Loch Ericht, which straddles Perthshire and Highland Regions in Scotland. Inadequate freeboard at both dams means that remedial works are required to increase the wave overtopping protection. In both cases, standard design methodologies had to be extended to achieve a credible design basis for the works. INTRODUCTION Loch Ericht is a natural loch drained by the River Ericht, flowing in a southerly direction into Loch Rannoch. The loch level was first raised in 1930/31 by the construction of Ericht Dam at the south western end, and further in 1937 by the raising of Ericht Dam and construction of Dalwhinnie Dam at the north eastern end. The reservoir is now over 24 km long. The reservoir is owned and operated by Scottish and Southern Energy plc, and supplies the Rannoch hydo power station as part of the Tummel Hydro Electric scheme. Following a statutory inspection in June 2000 under the Reservoirs Act 1975 (1), Loch Ericht was recategorised from Category B to Category A. As such, both Ericht Dam and Dalwhinnie Dam were subject to more severe design flood standards, the result of which was that freeboard was inadequate for both dams. Concerns were also raised over the arrangement of the scour penstock and general spillway basin configuration at Ericht Dam. FaberMaunsell (FM) was retained by Scottish & Southern Energy plc (SSE) for the detailed design of the works. Long-term benefits and performance of dams. Thomas Telford, London, 2004
Transcript of Wave Assessment on Loch Ericht - British Dam Society · PDF fileWave Assessment on Loch Ericht...

Wave Assessment on Loch Ericht
DEBBIE HAY-SMITH, JBA Consulting, previously FaberMaunsell RICHARD DOAKE, FaberMaunsell WILLIAM ALLSOP, H R Wallingford KIRSTY McCONNELL, H R Wallingford SYNOPSIS. This paper uses the example of two dams to illustrate generic problems and solutions to the analysis of waves and wave forces on wave walls. Dalwhinnie Dam and Ericht Dam impound Loch Ericht, which straddles Perthshire and Highland Regions in Scotland. Inadequate freeboard at both dams means that remedial works are required to increase the wave overtopping protection. In both cases, standard design methodologies had to be extended to achieve a credible design basis for the works.
INTRODUCTION Loch Ericht is a natural loch drained by the River Ericht, flowing in a southerly direction into Loch Rannoch. The loch level was first raised in 1930/31 by the construction of Ericht Dam at the south western end, and further in 1937 by the raising of Ericht Dam and construction of Dalwhinnie Dam at the north eastern end. The reservoir is now over 24 km long. The reservoir is owned and operated by Scottish and Southern Energy plc, and supplies the Rannoch hydo power station as part of the Tummel Hydro Electric scheme. Following a statutory inspection in June 2000 under the Reservoirs Act 1975 (1), Loch Ericht was recategorised from Category B to Category A. As such, both Ericht Dam and Dalwhinnie Dam were subject to more severe design flood standards, the result of which was that freeboard was inadequate for both dams. Concerns were also raised over the arrangement of the scour penstock and general spillway basin configuration at Ericht Dam. FaberMaunsell (FM) was retained by Scottish & Southern Energy plc (SSE) for the detailed design of the works.
Long-term benefits and performance of dams. Thomas Telford, London, 2004

LONG-TERM BENEFITS AND PERFORMANCE OF DAMS
The works comprised wave overtopping protection and corewall extension at Dalwhinnie Dam, wave overtopping protection at Ericht Corewall Dam and Ericht Embankment Dam, and penstock protection, spillway channel training and invert protection at Ericht Dam. This paper focuses on the assessment of wave conditions and wave forces for the design of wave overtopping protection works at Dalwhinnie Dam, and at Ericht Corewall Dam. A full description of the project is reported separately (2).
WAVE ASSESSMENT AT DALWHINNIE DAM
General The wave surcharge on a dam is a function of the wave height and other wave characteristics. Initial estimates of the wave characteristics at Dalwhinnie Dam, and the corresponding remedial works required, were based on standard methods for waves developed in deep water conditions. It was appreciated that these methods were not necessarily fully appropriate for the conditions at Dalwhinnie Dam because of the extremely long, narrow nature of the reservoir, and shallowness in the approach region to the dam. A full review of the wave assessment methodologies was therefore carried out.
Wave prediction in reservoirs Most wave prediction methods are based on measurements carried out in oceanic and coastal waters, with fetch lengths and fetch widths very different from those found in most UK reservoirs. The Saville/SMB method was the standard method in UK prior to the production of the 3rd Edition of Floods and Reservoir Safety Guide (3). A full review of available methods such as Saville/SMB, JONSEY and Donelan/JONSWAP can be found in HR Wallingford Report EX1527 (4). Following concern that the Saville/SMB method did not provide good predictions of waves on long, narrow reservoirs, measurements of wind and waves were made notably at Megget reservoir and Loch Glascarnoch (5). It was concluded that while none of the methods gave particularly good agreement with measured wave heights for all wind speeds and directions, Donelan/JONSWAP gave fairly good agreement for a wide range of wind directions, and any errors in predicted wave heights were likely to be conservative. This simplified Donelan/JONSWAP method was subsequently recommended in the Floods and Reservoir Safety Guide, 3rd edition (3).

HAY-SMITH ET AL
For the Loch Ericht study, it was felt that further investigation of the appropriate wave prediction method would yield little without site specific data, and that the simplified Donelan/JONSWAP method should be retained.
Duration limited wave generation Wind-wave generation in most reservoirs is governed by fetch-limited conditions for wave generation. A duration factor is applied to the wind speed in the method described above to take account of the fact that usually fetch lengths in inland waters are small and waves fully develop within 15 minutes; waves are thus “fetch-limited”. However, Loch Ericht is unusually long, with a fetch approaching Dalwhinnie Dam of 24.4 km, shown in . Examination of the wave characteristics of the JONSWAP spectrum reveal that the minimum wind duration required to develop waves of this size is greater than 2.5 hours (refer to Figure 9 of BS 6349 Part 1 (6)). Waves on Loch Ericht are therefore “duration-limited”.
Ericht Dam
Dalwhinnie Dam
Figure 2: Loch Ericht showing fetch to Dalwhinnie and Ericht Dams
Various duration factors are given in CIRIA 83 Rock Manual (6), and these are applied to the mean annual maximum hourly wind speed to estimate mean annual maximum wind speeds for increased durations. For a duration of 2.5 hours, the appropriate factor is 0.97. Calculation of the design mean

LONG-TERM BENEFITS AND PERFORMANCE OF DAMS
annual maximum wind speed and resulting significant wave height is shown in Table 1. Table 1: Calculation of Dalwhinnie Dam significant wave height – deep water
fetch (m) 24400 fetch direction ON 239 50 year max hourly wind speed U50 (m/s) 23.50 return period adjustment fT 0.79 altitude adjustment fA 1.36 over water adjustment fW 1.31 duration adjustment fD (2.5 hour duration) 0.97 direction adjustment fN 1.00 mean annual max wind U (m/s) 32.06 deep water significant wave height HS (m) 2.84
Wave conditions at Dalwhinnie Dam At Dalwhinnie Dam, shallow water depths extend approximately 1 km into the reservoir from the dam. The onset of shallow water processes depends on the water depth (d) in relation to the deep water wavelength. The deep water wavelength was estimated assuming small amplitude wave theory:
L = gT2 giving Lop = 54.33 m
2π
For deep water wave conditions, d/L > 0.5 For shallow water wave conditions, d/L < 0.05 The ground level at the toe of the dam is approximately 356.8 mAOD. The average depth of water at the toe for a Probable Maximum Flood (PMF) level of 360.65 mAOD is therefore 3.85 m. The lowest part of the toe towards the north end of the dam is 356.113 mAOD, giving a maximum depth of water of 4.535 m. In this case, d/L = 0.08, in deepest water at the toe. Deep water wave conditions, where wave speed is determined solely by wavelength, therefore do not apply. Asymptotic shallow water wave conditions where wave celerity is determined solely by water depth are also not fulfilled. The speed of waves approaching Dalwhinnie Dam is therefore determined by both wavelength and water depth. This result implies that shallow water processes will affect the waves approaching the dam.

HAY-SMITH ET AL
Estimate of shallow water wave characteristics Reducing water depths lead to the transformation of incoming deep water waves by refraction, shoaling and eventually breaking. On the assumption that the wave period is constant, these processes affect the wave height and wavelength.
Refraction Wave refraction is a consequence of the wave moving out of deep water. The portion of the crest in shallower water has its celerity reduced and is progressively turned parallel to the bed contours. Refraction due to the bathymetry of the foreshore upstream of Dalwhinnie Dam is difficult to assess without more detailed bathymetric data than was available. Budget and contract time constraints meant that numerical modeling could not be accommodated. It was therefore assumed that incident wave fronts are parallel to the loch bed contours which are themselves parallel to the dam face and no refraction takes place.
Shoaling Shoaling is the increase in wave height and decrease in wavelength and wave celerity caused as waves propagate in reducing water depths. Using linear wave theory, this effect can be expressed as a shoaling coefficient KS; the equation for is given in CIRIA 83 Rock Manual (6) as follows:
KS = 1/{[1+2kd/sinh(2kd)]tanh(kd)}0.5 Where k = wave number = 2π d = water depth L
At the toe of the dam, the wavelength can be estimated using first order wave theory as follows: L = gT2 tanh(2πd) 2π L For average water depth, L = 33.55 m For maximum water depth, L = 35.89 m This wavelength is used to estimate the shoaling coefficient to give a new estimate of significant wave height at the toe of the dam shown in Table 2: Table 2: Shoaling wave heights
Average d = 3.85 m Max d = 4.535 m
Wavelength L (m) 33.55 35.89 Shoaling coeff KS 1.128 1.063 Wave height HS (m) 3.20 3.02

LONG-TERM BENEFITS AND PERFORMANCE OF DAMS
Wave breaking As waves approach a shoreline, and the water becomes shallower, they may become unstable and break, either through steepness induced breaking, or depth induced breaking. In shoaling water, breaking is usually caused by the latter, but both should be considered. Steepness induced breaking occurs when H/L < (H/L)max = 0.14tanh(2πd/L) Depth induced breaking occurs when H/d < (H/d)max = γbr (breaker index) For regular waves, theoretical γbr is 0.78, but in practice, for irregular waves, γbr is found to be 0.5-0.6. A summary of the wave breaking calculations are shown in Table 3. Table 3: Summary of wave breaking at Dalwhinnie
Steepness induced breaking
Depth induced breaking
H/L H/Lmax H/d H/dmax
Comment
Average depth d = 3.85 m
0.096 0.086 0.83 0.6 steepness and depth induced breaking
Max depth d = 4.535 m
0.084 0.092 0.67 0.6 depth induced breaking
Depth induced breaking will be the most critical event in this situation. The theoretical breaker index of 0.78 occurs in 4.0 m water depth. The reported figure of 0.5 for irregular waves would cause waves to break in about 5.0 m of water, and a breaker index of 0.6 would cause breaking in 5.5 m of water. Depth induced breaking could therefore occur anywhere from 200 m from the dam, up to the dam face itself, assuming a foreshore slope of 1 in 120. CIRIA 83 Rock Manual (6), figure 121 gives design graphs for shoaling on uniform slopes with breaking. For a foreshore slope of 0.01 or shallower (1 in 100), and relative water depth (d/Lop) of 0.07, the resulting significant wave height was found to be 1.86 m. Owen (8) also suggested a simple method to provide an estimate of the upper limit to the significant wave height in any depth of water. The method describes simple empirical equations for varying foreshore slopes. For a slope of 1 in 100, the equation is as follows: HS = 0.58 - 2d d gTm
2 giving HS = 2.12 m for average d = 3.855 m
HS = 2.47 m for max d = 4.535 m
HAY-SMITH ET AL
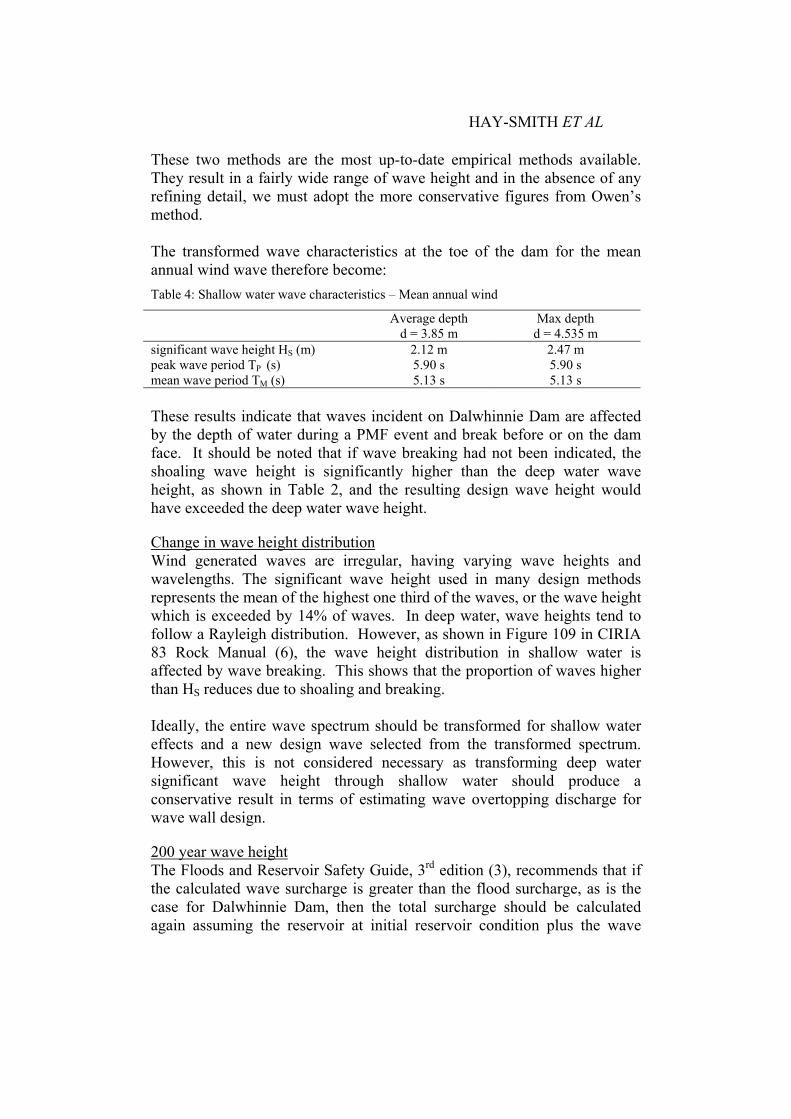
These two methods are the most up-to-date empirical methods available. They result in a fairly wide range of wave height and in the absence of any refining detail, we must adopt the more conservative figures from Owen’s method. The transformed wave characteristics at the toe of the dam for the mean annual wind wave therefore become: Table 4: Shallow water wave characteristics – Mean annual wind
Average depth d = 3.85 m
Max depth d = 4.535 m
significant wave height HS (m) 2.12 m 2.47 m peak wave period TP (s) 5.90 s 5.90 s mean wave period TM (s) 5.13 s 5.13 s These results indicate that waves incident on Dalwhinnie Dam are affected by the depth of water during a PMF event and break before or on the dam face. It should be noted that if wave breaking had not been indicated, the shoaling wave height is significantly higher than the deep water wave height, as shown in Table 2, and the resulting design wave height would have exceeded the deep water wave height.
Change in wave height distribution Wind generated waves are irregular, having varying wave heights and wavelengths. The significant wave height used in many design methods represents the mean of the highest one third of the waves, or the wave height which is exceeded by 14% of waves. In deep water, wave heights tend to follow a Rayleigh distribution. However, as shown in Figure 109 in CIRIA 83 Rock Manual (6), the wave height distribution in shallow water is affected by wave breaking. This shows that the proportion of waves higher than HS reduces due to shoaling and breaking. Ideally, the entire wave spectrum should be transformed for shallow water effects and a new design wave selected from the transformed spectrum. However, this is not considered necessary as transforming deep water significant wave height through shallow water should produce a conservative result in terms of estimating wave overtopping discharge for wave wall design.
200 year wave height The Floods and Reservoir Safety Guide, 3rd edition (3), recommends that if the calculated wave surcharge is greater than the flood surcharge, as is the case for Dalwhinnie Dam, then the total surcharge should be calculated again assuming the reservoir at initial reservoir condition plus the wave

LONG-TERM BENEFITS AND PERFORMANCE OF DAMS
surcharge resulting from a 200-year wind speed. The higher surcharge should then be used. For Dalwhinnie Dam, the water depth is less in this situation, and because the waves are depth limited, the 200 year significant wave height is less than the mean annual maximum significant wave height. The condition of PMF plus concurrent mean annual wind wave event is therefore more severe and this event was used as the design basis for the overtopping protection works. The final design wave height represented a significant reduction compared to previous estimates assuming deep water and fetch-limited conditions, and allowed a more economical solution to be designed, details of which are reported separately (2).
WAVE FORCES AT ERICHT DAM At Ericht Dam a new wave wall to the corewall section was required to provide sufficient freeboard. The height of the new wave wall would be designed to ensure acceptable overtopping discharges during the more severe of the following conditions: • Peak pool elevation during the PMF event, plus mean annual
maximum wind-wave • Top Water Level plus 1 in 200 year wind-wave Initial investigation of the wave conditions approaching the dam indicated that the new parapet wall could be subject to impact wave loading, when waves break directly on the structure. Following evidence of damage to the breakwater at Amlwch on Anglesey, failure of a wave wall at Porthcawl and other instances, HR Wallingford has advised that wave impact forces be included in the analysis of all such walls. For Ericht, a methodology for deriving impact forces and calculating effective forces for Ericht Corewall wave wall was developed to provide an improved prediction of impact forces, taking into consideration the duration of impact forces and 3-D spatial effects.
Wave loading on structures Wave loading on vertical or composite structures can be either pulsating loads or impact loads: Pulsating or quasi-static wave loading arises when a wave impinges directly against the structure, the wave surface rises up and applies a quasi-static pressure difference on the structure.

HAY-SMITH ET AL
Impact or dynamic pressures occur when a wave breaks directly on the structure due to the particular combination of foreshore slope, water depth and wave characteristics. Wave impacts are generally of high magnitude, but of short duration, and may be too fast for massive structures, such as the corewall itself to respond to, but may be more critical for smaller structure components, such as the parapet wave wall. They are also spatially limited, so average loads will decrease with increasing section length. Initial investigations indicated that for the mean annual wind/wave event at PMF level, wave loadings at Ericht Corewall Dam were pulsating. However, impact loadings might act on the proposed parapet wall during the 1 in 200 year wind/wave event occurring at top water level.
Development of wave impact loading methodology Methods to estimate pulsating wave loads are reasonably well established. Goda’s method (6) to estimate pulsating wave forces was used. However, methods to estimate impact loadings are far from comprehensive and, in particular, methods to estimate the wave pressure distribution in order to estimate the effective pressures on the wave wall alone had not been published. Advice was sought from HR Wallingford, who has published the most recent design methodologies for estimating wave impact loadings. These methodologies were still incomplete with regard to a few aspects of wave impact loadings that were necessary to complete the calculations at Ericht. The aim was to produce a methodology to provide an improved prediction of impact forces for Ericht Corewall wave wall, taking into consideration the duration of impact force and 3-D spatial effects. The resulting methodology has been developed from published design methods (9), (9), (10), (11), supplemented with data held by HR Wallingford.
Procedure to derive effective wave forces on Ericht corewall parapet wall Four sections of the west corewall dam were considered to investigate wave loading. Sections 1 and 2 were treated as composite structures, having a berm in front of the corewall, as shown in Figure 3; while sections 3 and 4 were treated as vertical walls. In the absence of survey data, a foreshore slope of 1 in 20 was assumed as this gave the highest design wave heights. The relevant structural and hydraulic data are given in Table 6 and Table 7.

LONG-TERM BENEFITS AND PERFORMANCE OF DAMS
Figure 3: Typical section through Ericht Corewall (sections 1 and 2)
Table 6: Corewall structural data
Section 1 2 3 4 Top of wall (mAOD) 361.57 361.57 361.57 361.57 Wall base (mAOD) 360.58 360.58 360.58 360.58 Top of berm (mAOD) 356.62 356.62 N/A N/A Bed level (mAOD) 353.42 354.64 356.77 358.3 Foreshore slope 0.05 0.05 0.05 0.05
Table 7: Hydraulic data for Ericht Corewall Dam
Water level (TWL mAOD) 359.4 1 in 200 year wave height Hs (m) 1.55 1 in 200 year wave period Ts (s) 3.48 Deep water wavelength Lop (m) 24.9 The developed methodology is as follows:
1. Pulsating wave forces As a first estimate of wave induced loads on the wall, Goda’s method (6) was used to estimate pulsating wave forces, taking into consideration wave shoaling and shallow water depth-limiting effects. The results are shown in Table 8.

HAY-SMITH ET AL
Table 8: Pulsating wave loads
Section 1 2 3 4 Total force (kN/m) 90 87 68 21 Total force on wave wall (kN/m) 14 13 10 3 Pressure at top of wall (kN/m2) 10.84 10.43 12.16 0 Pressure at wall base (kN/m2) 16.21 15.74 6.85 5.15
2. Identify likely loading conditions from parameter map In order to assess whether wave impact forces are likely to occur, the geometric and wave parameters were checked against the parameter map given in (11). For the wave conditions considered, impacting waves are possible at all four sections.
3. Predict wave impact force Impact forces were calculated using Allsop & Vincinanza’s equation (12): Fimp,1/250 = 15(Hsi/d)3.134 ρw g d2
4. Impact force duration and dynamic effects Impact force durations were then estimated from HR Wallingford test data. Using the outer envelope, the impact rise time was estimated at 0.4 seconds. Data within the average band suggested a rise time of 0.04 seconds. These impact durations were then compared to the natural frequency of the wall, estimated using a standard cantilever formula to lie between 0.014 and 0.028 seconds. In both cases, the impact rise time exceeds the natural frequency of the wave wall. It is therefore reasonable to assume that impact wave loads will not be significantly damped, and the wall will effectively experience this load as quasi-static.
5. Pressure distribution The prediction methods above give total wave forces over the full active depth, not just the parapet wall. In order to establish the proportion of load acting on the parapet wall section, the pressure distribution over the height of dam must be known. For pulsating wave forces, Goda’s method assumes a trapezoidal pressure distribution. Although this was not intended by Goda to predict pressure distributions, the general level of wave forces predicted is well validated, and no better guidance is available. The proportion of wave force acting over the parapet wall must therefore be estimated using this distribution. For impact forces, Hull (13) analysed measurements of wave impact pressures by McKenna (10) and others from which Hull developed a method for estimating pressure distributions as a function of the pressure at still water level (pmax) given in Table 9.
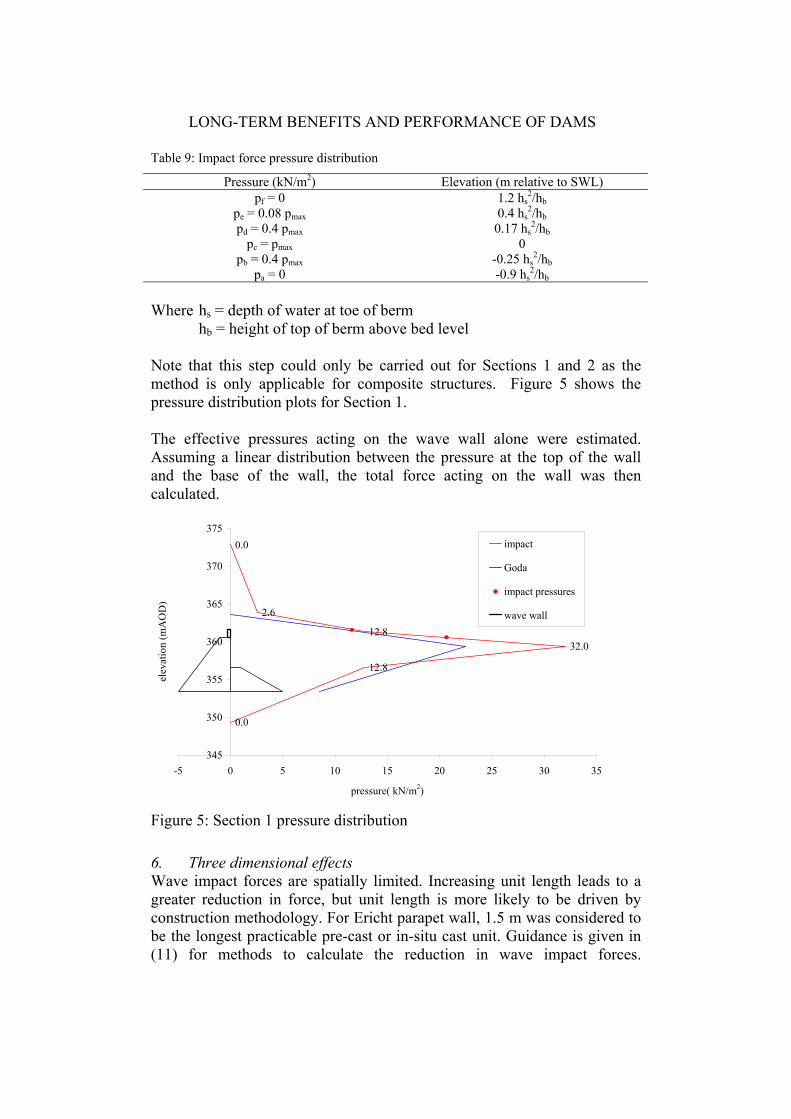
LONG-TERM BENEFITS AND PERFORMANCE OF DAMS
Table 9: Impact force pressure distribution
Pressure (kN/m2) Elevation (m relative to SWL) pf = 0 1.2 hs
2/hb pe = 0.08 pmax 0.4 hs
2/hb pd = 0.4 pmax 0.17 hs
2/hb pc = pmax 0
pb = 0.4 pmax -0.25 hs2/hb
pa = 0 -0.9 hs2/hb
Where hs = depth of water at toe of berm hb = height of top of berm above bed level Note that this step could only be carried out for Sections 1 and 2 as the method is only applicable for composite structures. Figure 5 shows the pressure distribution plots for Section 1. The effective pressures acting on the wave wall alone were estimated. Assuming a linear distribution between the pressure at the top of the wall and the base of the wall, the total force acting on the wall was then calculated.
0.0
12.8
32.012.8
2.6
0.0
345
350
355
360
365
370
375
-5 0 5 10 15 20 25 30 35
pressure( kN/m2)
elev
atio
n (m
AO
D)
impact
Goda
impact pressures
wave wall
Figure 5: Section 1 pressure distribution
6. Three dimensional effects Wave impact forces are spatially limited. Increasing unit length leads to a greater reduction in force, but unit length is more likely to be driven by construction methodology. For Ericht parapet wall, 1.5 m was considered to be the longest practicable pre-cast or in-situ cast unit. Guidance is given in (11) for methods to calculate the reduction in wave impact forces.
HAY-SMITH ET AL
Assuming a wall unit length of 1.5 m resulted in a reduction in impact force of 9%.
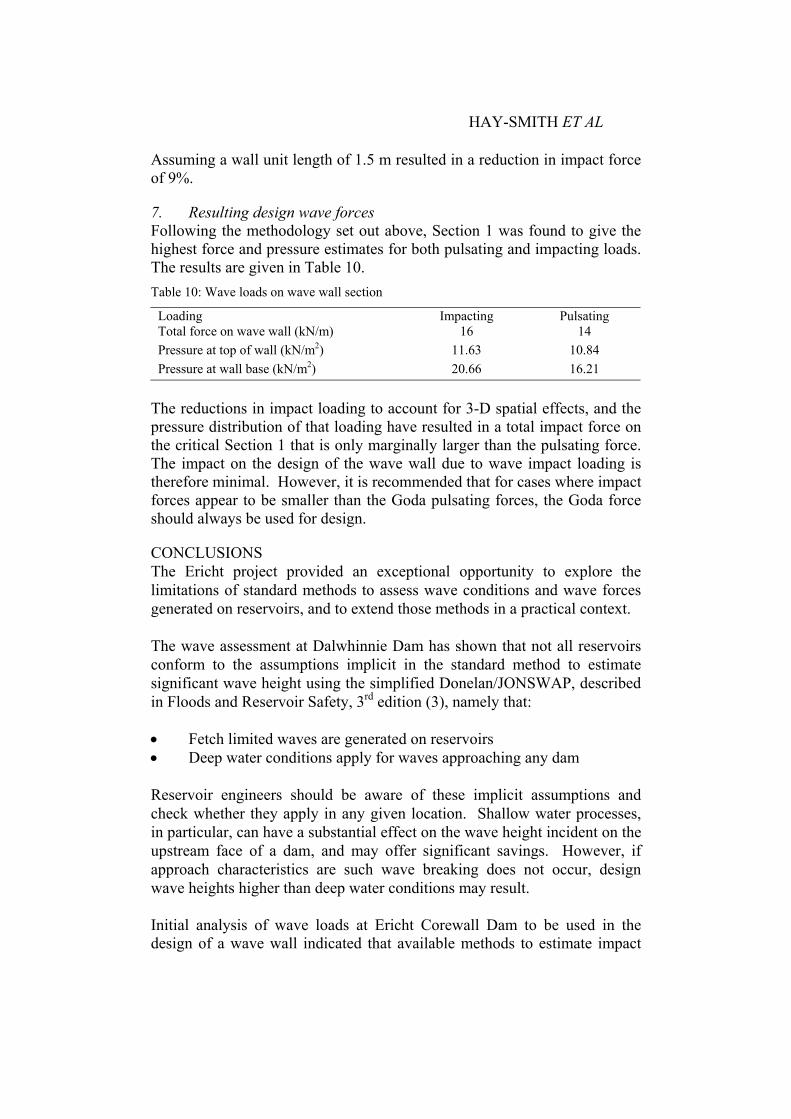
7. Resulting design wave forces Following the methodology set out above, Section 1 was found to give the highest force and pressure estimates for both pulsating and impacting loads. The results are given in Table 10. Table 10: Wave loads on wave wall section
Loading Impacting Pulsating Total force on wave wall (kN/m) 16 14 Pressure at top of wall (kN/m2) 11.63 10.84 Pressure at wall base (kN/m2) 20.66 16.21
The reductions in impact loading to account for 3-D spatial effects, and the pressure distribution of that loading have resulted in a total impact force on the critical Section 1 that is only marginally larger than the pulsating force. The impact on the design of the wave wall due to wave impact loading is therefore minimal. However, it is recommended that for cases where impact forces appear to be smaller than the Goda pulsating forces, the Goda force should always be used for design.
CONCLUSIONS The Ericht project provided an exceptional opportunity to explore the limitations of standard methods to assess wave conditions and wave forces generated on reservoirs, and to extend those methods in a practical context. The wave assessment at Dalwhinnie Dam has shown that not all reservoirs conform to the assumptions implicit in the standard method to estimate significant wave height using the simplified Donelan/JONSWAP, described in Floods and Reservoir Safety, 3rd edition (3), namely that: • Fetch limited waves are generated on reservoirs • Deep water conditions apply for waves approaching any dam Reservoir engineers should be aware of these implicit assumptions and check whether they apply in any given location. Shallow water processes, in particular, can have a substantial effect on the wave height incident on the upstream face of a dam, and may offer significant savings. However, if approach characteristics are such wave breaking does not occur, design wave heights higher than deep water conditions may result. Initial analysis of wave loads at Ericht Corewall Dam to be used in the design of a wave wall indicated that available methods to estimate impact

LONG-TERM BENEFITS AND PERFORMANCE OF DAMS
loadings are far from comprehensive. In particular, methods to estimate the wave pressure distribution to allow an estimate of the effective pressures on the wave wall alone had not been published. A methodology was developed to provide an improved prediction of impact forces for Ericht Corewall parapet wall, taking into consideration the duration of impact force and 3-D spatial effects. Impact forces can be substantially higher than pulsating forces. However, in this case, because of the position of the parapet wall relative to the still water level where the maximum impact pressure occurs, the impact force did not greatly exceed the estimated pulsating force.
REFERENCES (1) Reservoirs Act (1975), HMSO, London (2) Dempster KJ, Gaskin M, Doake RM, Hay-Smith D (2004), Ericht and
Dalwhinnie Dam refurbishment and protection works, Long Term Benefits & Performance of Dams, Thomas Telford, London
(3) Institution of Civil Engineers (1996), Floods and Reservoir Safety Third Edition, Thomas Telford, London
(4) Owen MW (1987), Wave prediction in reservoirs: a literature review, Report EX1527, Hydraulics Research, Wallingford
(5) Owen MW & Steele AAJ (1988), Wave prediction in reservoirs – comparison of available methods, Report EX 1809, Hydraulics Research, Wallingford
(6) British Standards Institution (2000), British Standard Code of Practice for Maritime Structures, Part 1, General Criteria, BS 6349: Part 1, BSI, London
(7) CIRIA/CUR (1991), Manual on the use of rock in coastal and shoreline engineering, Simm JD (Ed) Special Publication, CIRIA, London
(8) Owen MW (1980), Design of sea walls allowing for wave overtopping, Report EX924, Hydraulics Research, Wallingford
(9) Allsop NWH & Kortenhaus A (2001), Hydraulic aspects, Chapter 2 of Probabilistic Design Tools for Vertical Breakwaters, pp61-156, ISBN 90 580 248 8, Balkema, Rotterdam
(10) McKenna JE (1997), Wave forces on caissons and breakwater crown walls, PhD thesis, Queen’s University of Belfast, September 1997, Belfast
(11) Allsop NWH (2000), Wave forces on vertical and composite walls, Chapter 4 in Handbook of Coastal Engineering, Editor J Herbich, McGraw-Hill, New York

HAY-SMITH ET AL
(12) Allsop NWH & Vincinanza D (1996), Wave impact loadings on vertical breakwaters: development of new prediction formulae, Proc 11th International Harbour Congress, Antwerpen, Belgium
(13) Hull P (2001), Wave impact loading and its effects on blockwork structures, PhD thesis, Queen’s University of Belfast, September 2001, Belfast