Watershed Modeling and Landuse Change: A new approachWatershed Modeling and Landuse Change: A new...
35
Watershed Modeling and Landuse Change: A new approach Chris Duffy Lele Shu Penn State University
Transcript of Watershed Modeling and Landuse Change: A new approachWatershed Modeling and Landuse Change: A new...
Watershed Modeling and LanduseChange: A new approach
Chris Duffy
Lele Shu
Penn State University
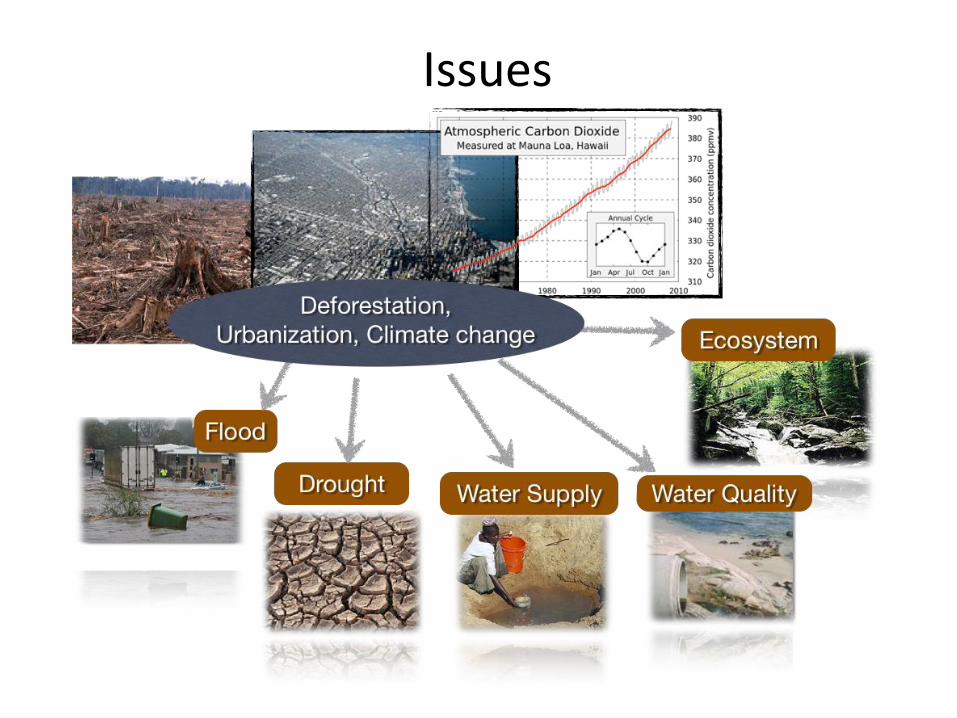
Issues
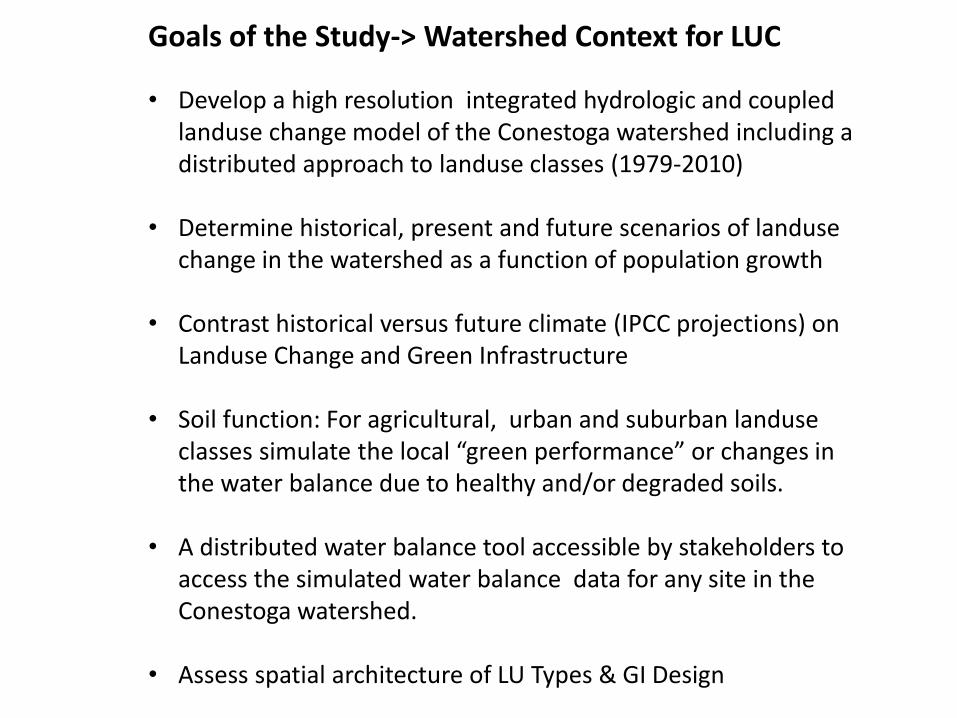
Goals of the Study-> Watershed Context for LUC
• Develop a high resolution integrated hydrologic and coupled landuse change model of the Conestoga watershed including a distributed approach to landuse classes (1979-2010)
• Determine historical, present and future scenarios of landusechange in the watershed as a function of population growth
• Contrast historical versus future climate (IPCC projections) on Landuse Change and Green Infrastructure
• Soil function: For agricultural, urban and suburban landuseclasses simulate the local “green performance” or changes in the water balance due to healthy and/or degraded soils.
• A distributed water balance tool accessible by stakeholders to access the simulated water balance data for any site in the Conestoga watershed.
• Assess spatial architecture of LU Types & GI Design
Tools
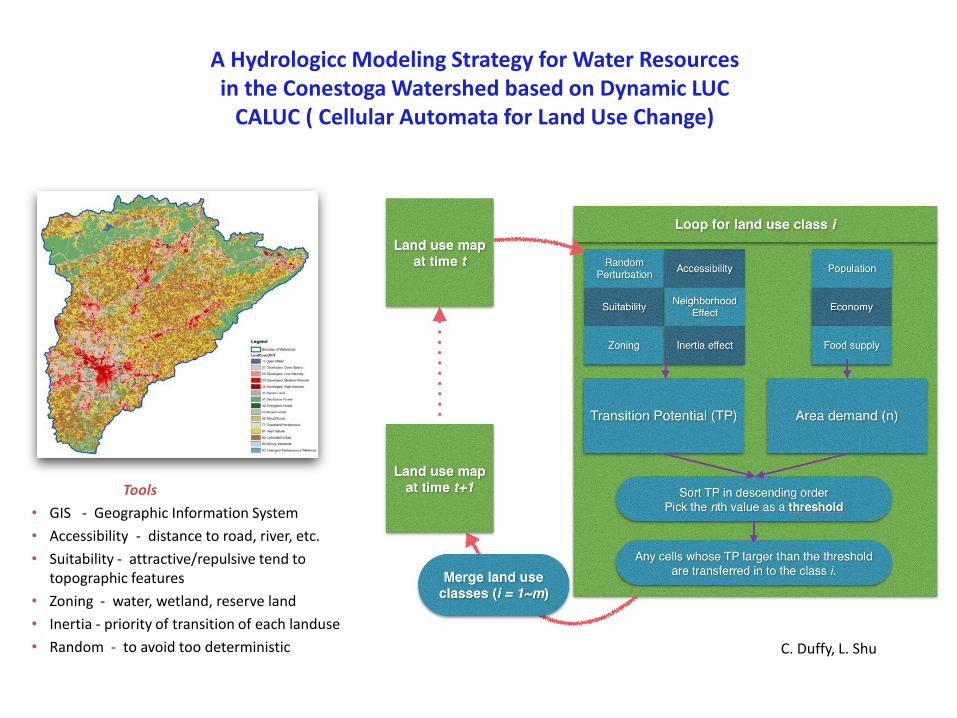
• GIS - Geographic Information System
• Accessibility - distance to road, river, etc.
• Suitability - attractive/repulsive tend to topographic features
• Zoning - water, wetland, reserve land
• Inertia - priority of transition of each landuse
• Random - to avoid too deterministic
A Hydrologicc Modeling Strategy for Water Resourcesin the Conestoga Watershed based on Dynamic LUC
CALUC ( Cellular Automata for Land Use Change)
C. Duffy, L. Shu
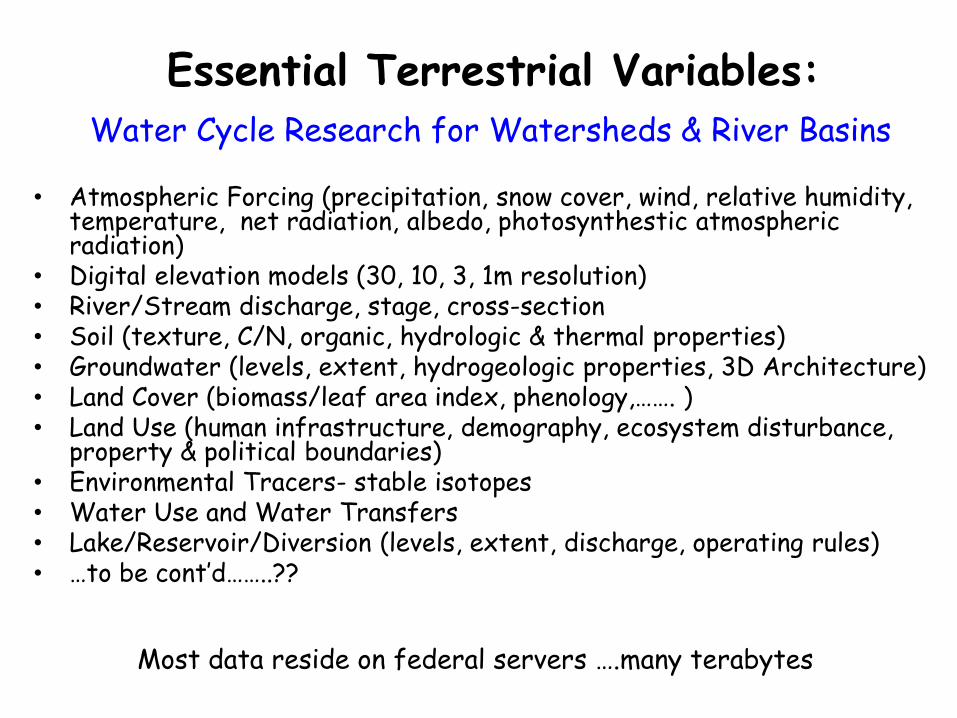
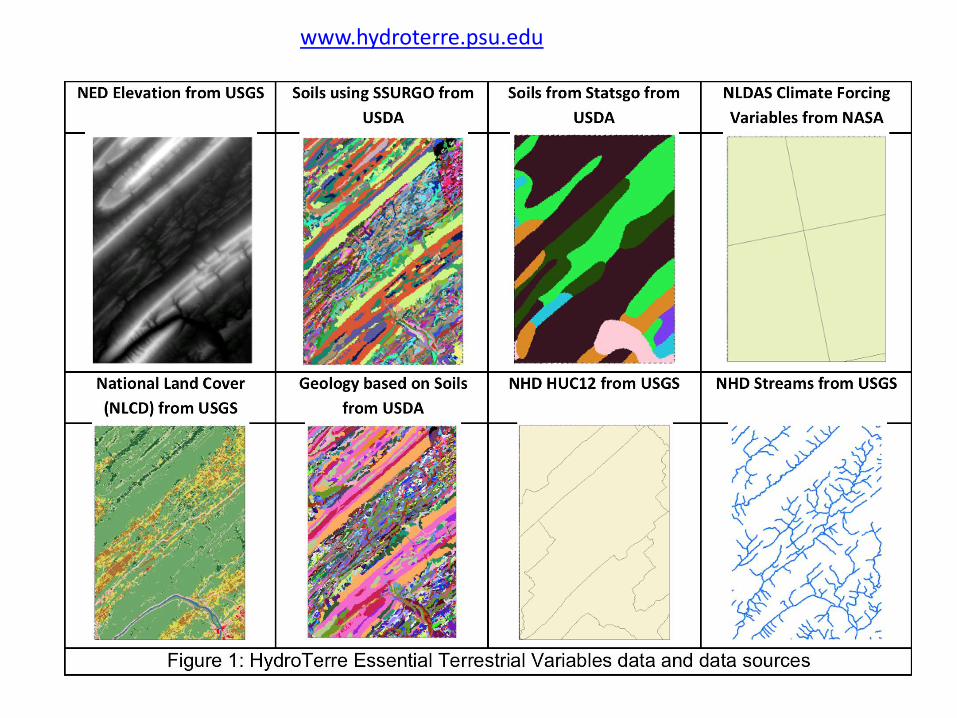
Essential Terrestrial Variables:
• Atmospheric Forcing (precipitation, snow cover, wind, relative humidity, temperature, net radiation, albedo, photosynthestic atmospheric radiation)
• Digital elevation models (30, 10, 3, 1m resolution) • River/Stream discharge, stage, cross-section • Soil (texture, C/N, organic, hydrologic & thermal properties)• Groundwater (levels, extent, hydrogeologic properties, 3D Architecture)• Land Cover (biomass/leaf area index, phenology,……. )• Land Use (human infrastructure, demography, ecosystem disturbance,
property & political boundaries) • Environmental Tracers- stable isotopes • Water Use and Water Transfers• Lake/Reservoir/Diversion (levels, extent, discharge, operating rules)• …to be cont’d……..??
Most data reside on federal servers ….many terabytes
Water Cycle Research for Watersheds & River Basins
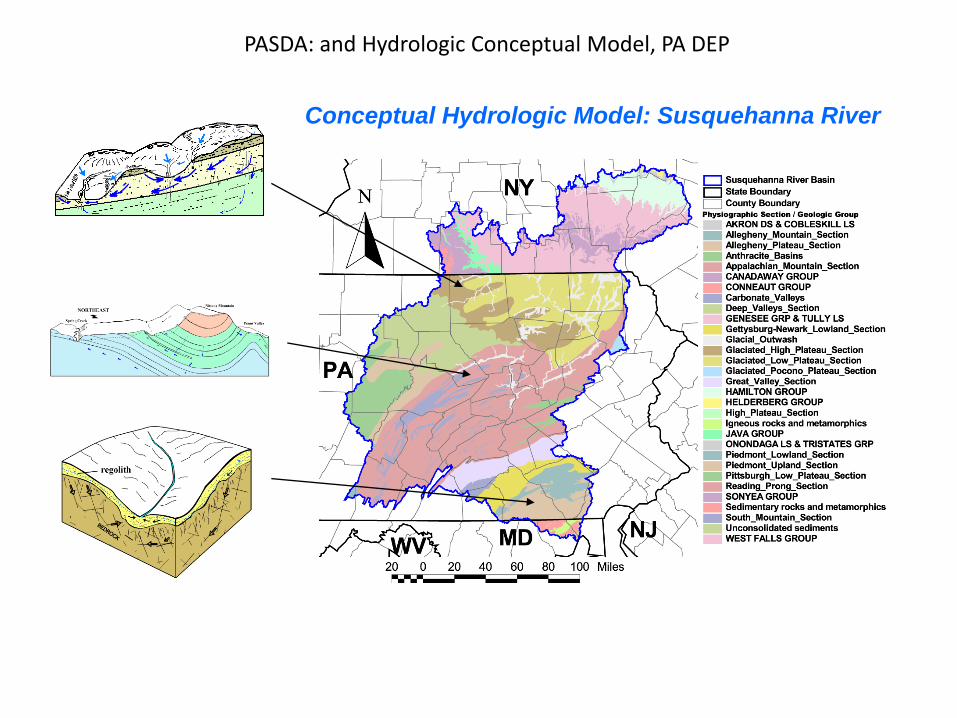
Conceptual Hydrologic Model: Susquehanna River
PASDA: and Hydrologic Conceptual Model, PA DEP
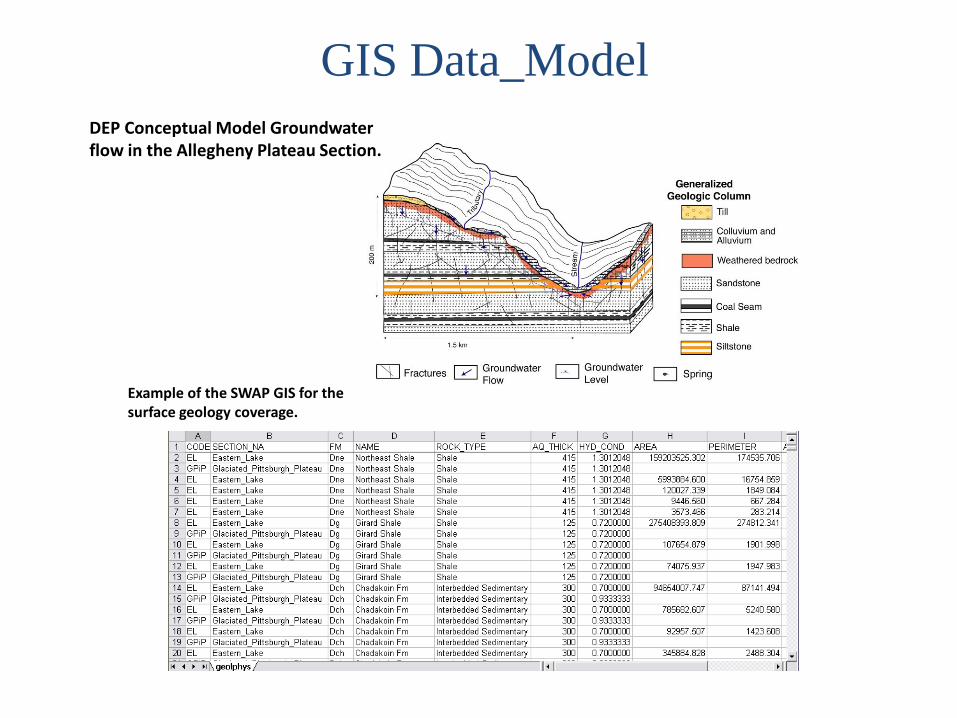
GIS Data_Model
Example of the SWAP GIS for the surface geology coverage.
DEP Conceptual Model Groundwater flow in the Allegheny Plateau Section.
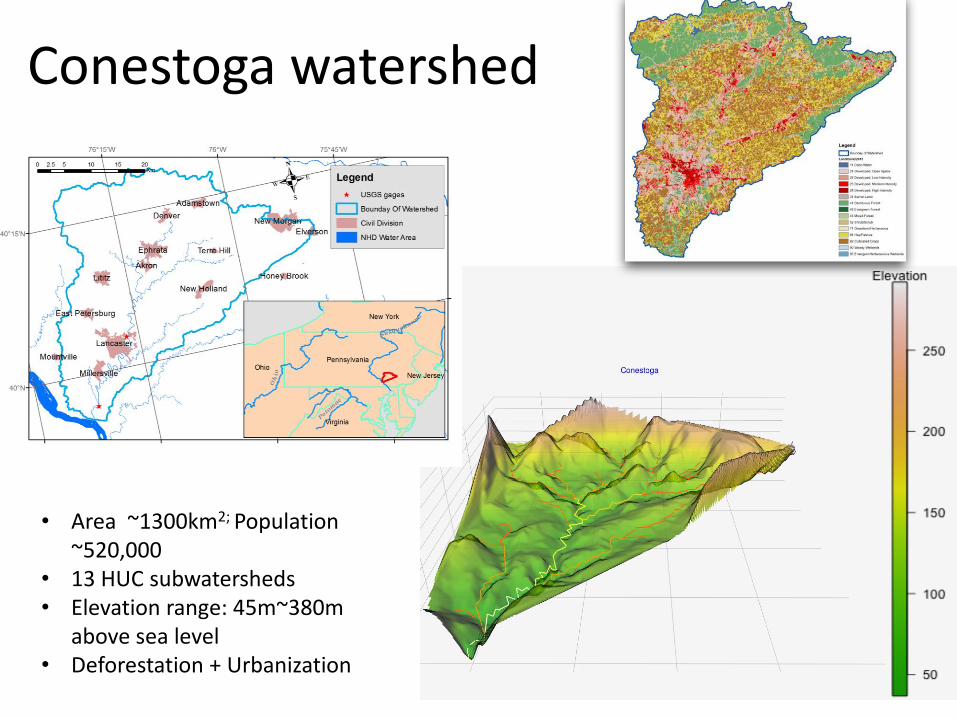
Conestoga watershed
• Area ~1300km2; Population~520,000
• 13 HUC subwatersheds• Elevation range: 45m~380m
above sea level• Deforestation + Urbanization
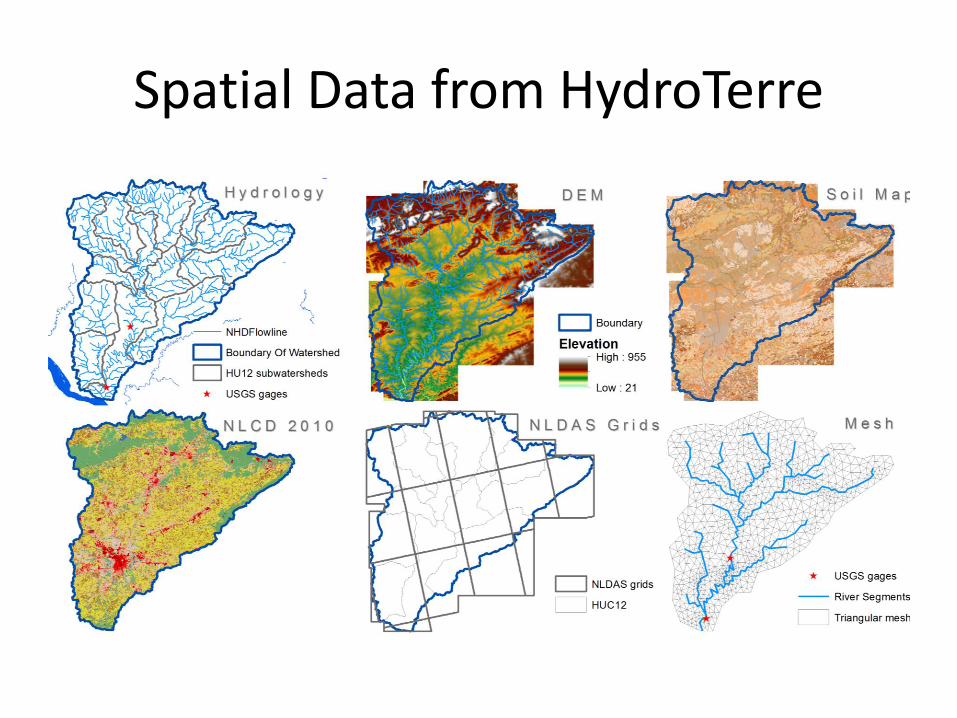
Spatial Data from HydroTerre
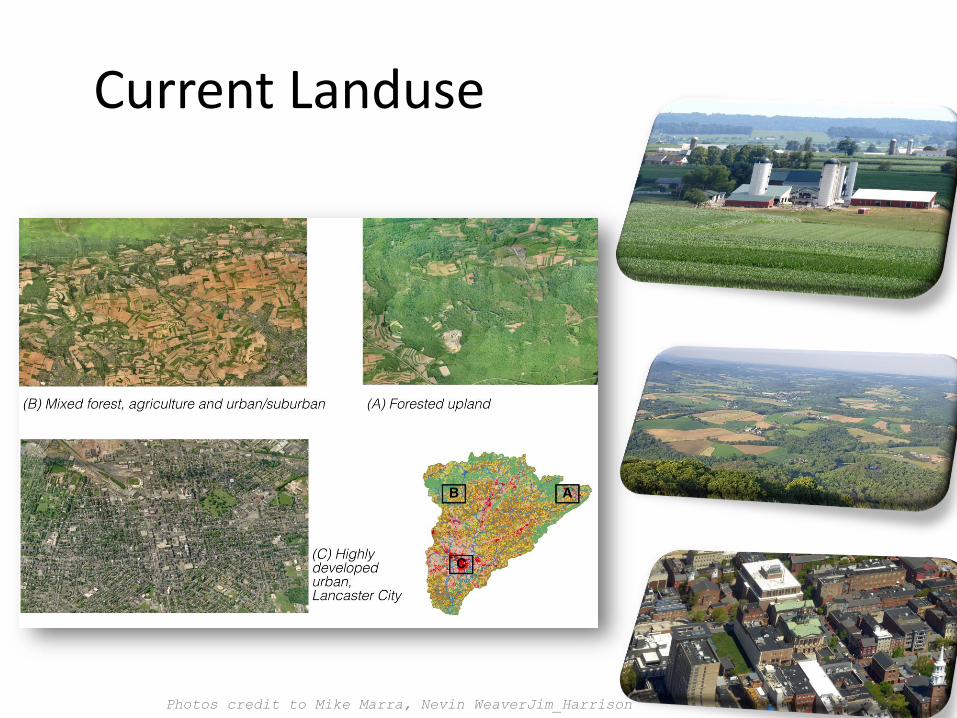
Current Landuse
Photos credit to Mike Marra, Nevin WeaverJim_Harrison
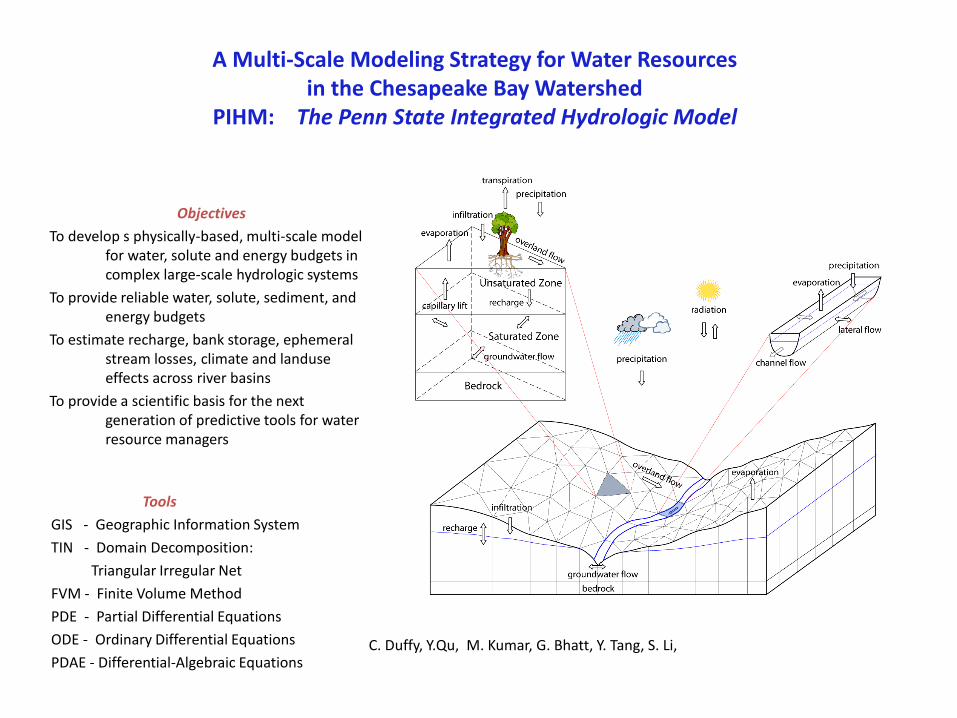
Tools
GIS - Geographic Information System
TIN - Domain Decomposition:
Triangular Irregular Net
FVM - Finite Volume Method
PDE - Partial Differential Equations
ODE - Ordinary Differential Equations
PDAE - Differential-Algebraic Equations
Objectives
To develop s physically-based, multi-scale model for water, solute and energy budgets in complex large-scale hydrologic systems
To provide reliable water, solute, sediment, and energy budgets
To estimate recharge, bank storage, ephemeral stream losses, climate and landuse effects across river basins
To provide a scientific basis for the next generation of predictive tools for water resource managers
A Multi-Scale Modeling Strategy for Water Resourcesin the Chesapeake Bay Watershed
PIHM: The Penn State Integrated Hydrologic Model
C. Duffy, Y.Qu, M. Kumar, G. Bhatt, Y. Tang, S. Li,
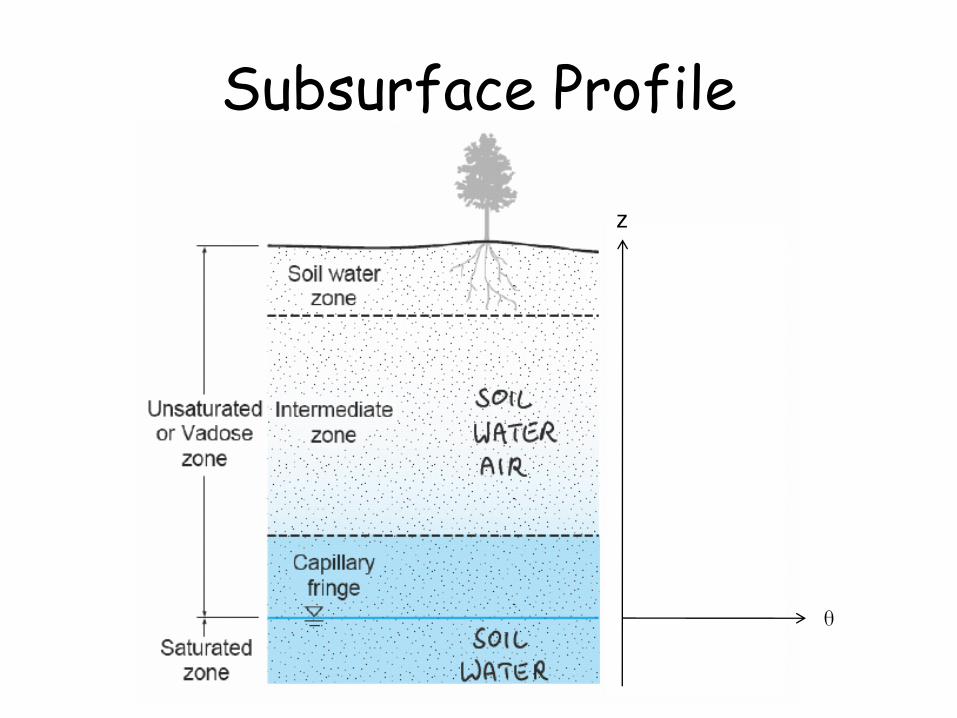
Subsurface Profile
13
z
θ
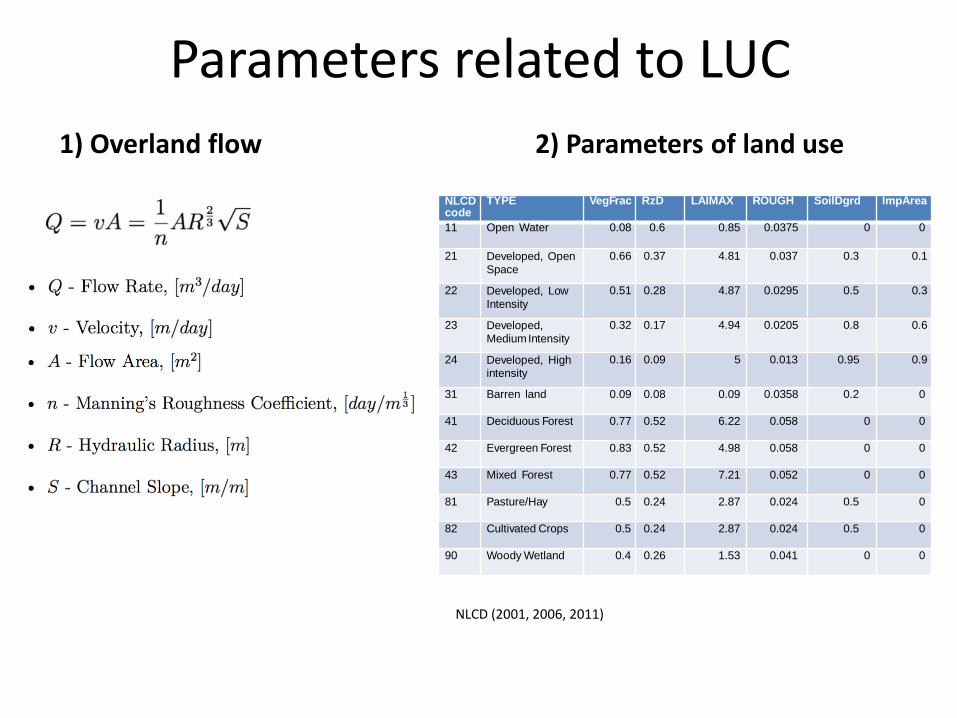
1) Overland flow 2) Parameters of land use
NLCDcode
TYPE VegFrac RzD LAIMAX ROUGH SoilDgrd ImpArea
11 Open Water 0.08 0.6 0.85 0.0375 0 0
21 Developed, OpenSpace
0.66 0.37 4.81 0.037 0.3 0.1
22 Developed, LowIntensity
0.51 0.28 4.87 0.0295 0.5 0.3
23 Developed,Medium Intensity
0.32 0.17 4.94 0.0205 0.8 0.6
24 Developed, Highintensity
0.16 0.09 5 0.013 0.95 0.9
31 Barren land 0.09 0.08 0.09 0.0358 0.2 0
41 Deciduous Forest 0.77 0.52 6.22 0.058 0 0
42 Evergreen Forest 0.83 0.52 4.98 0.058 0 0
43 Mixed Forest 0.77 0.52 7.21 0.052 0 0
81 Pasture/Hay 0.5 0.24 2.87 0.024 0.5 0
82 Cultivated Crops 0.5 0.24 2.87 0.024 0.5 0
90 Woody Wetland 0.4 0.26 1.53 0.041 0 0
NLCD (2001, 2006, 2011)
Parameters related to LUC
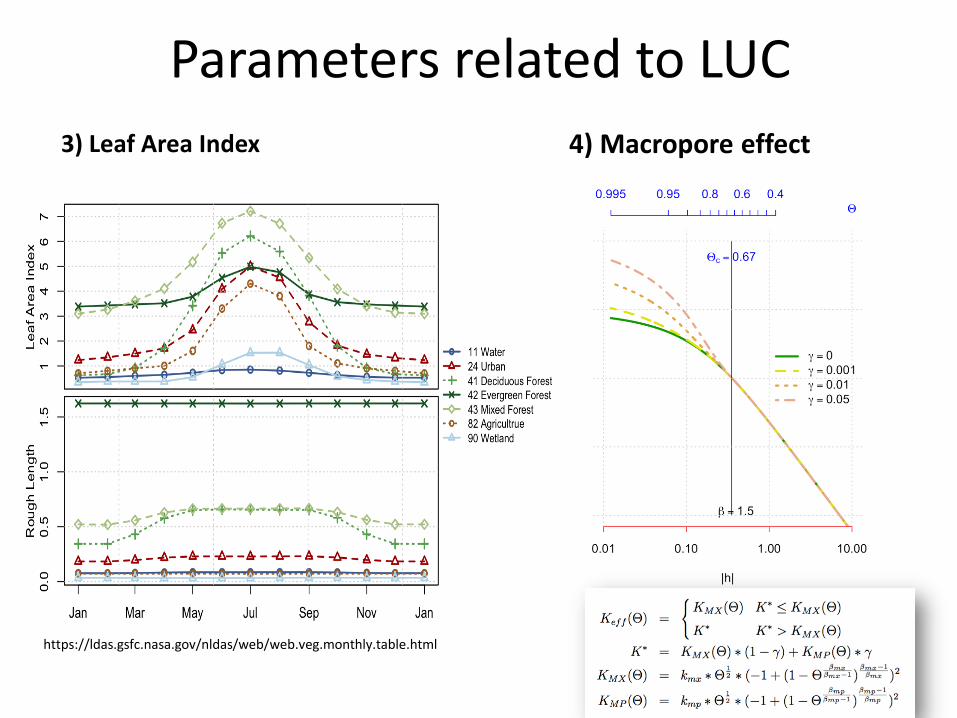
Parameters related to LUC
3) Leaf Area Index 4) Macropore effect
https://ldas.gsfc.nasa.gov/nldas/web/web.veg.monthly.table.html
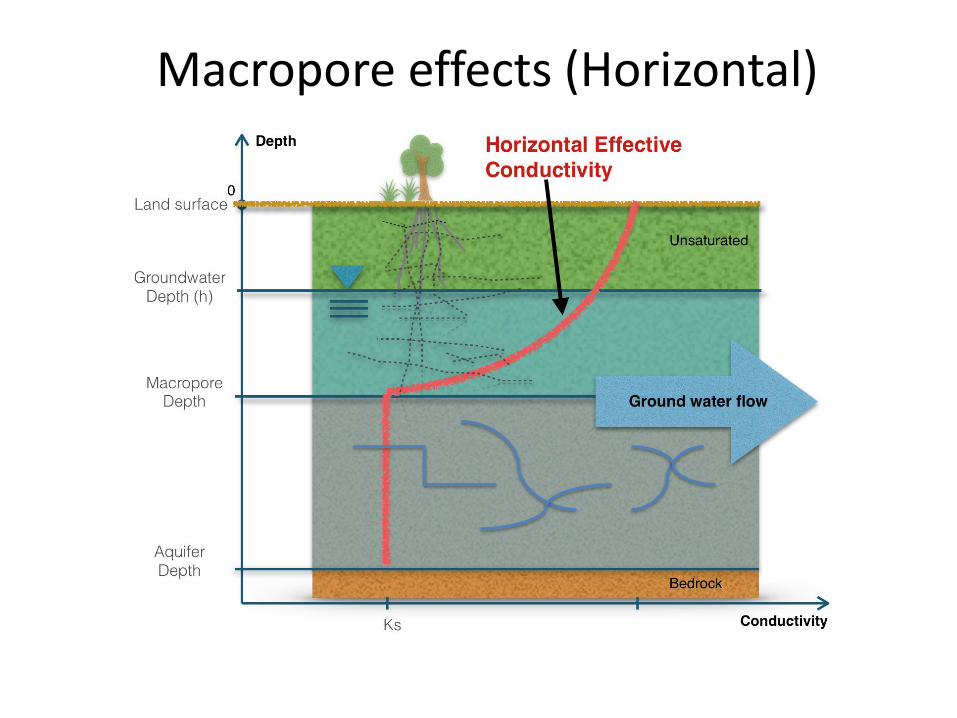
Macropore effects (Horizontal)
17
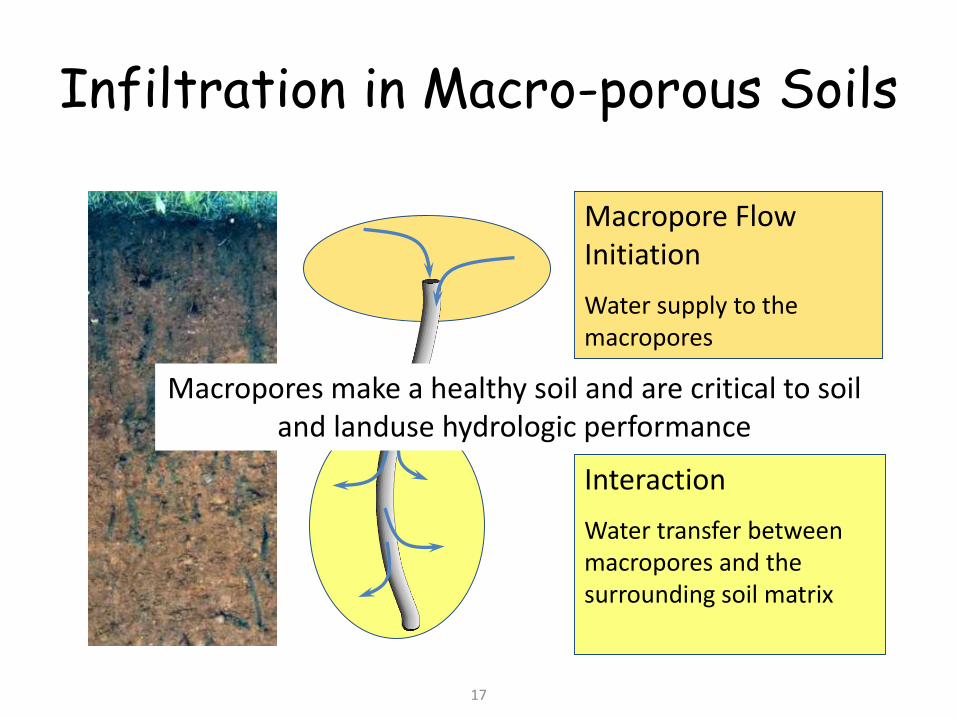
Infiltration in Macro-porous Soils
Macropore Flow Initiation
Water supply to the macropores
Interaction
Water transfer between macropores and the surrounding soil matrix
Macropores make a healthy soil and are critical to soil and landuse hydrologic performance
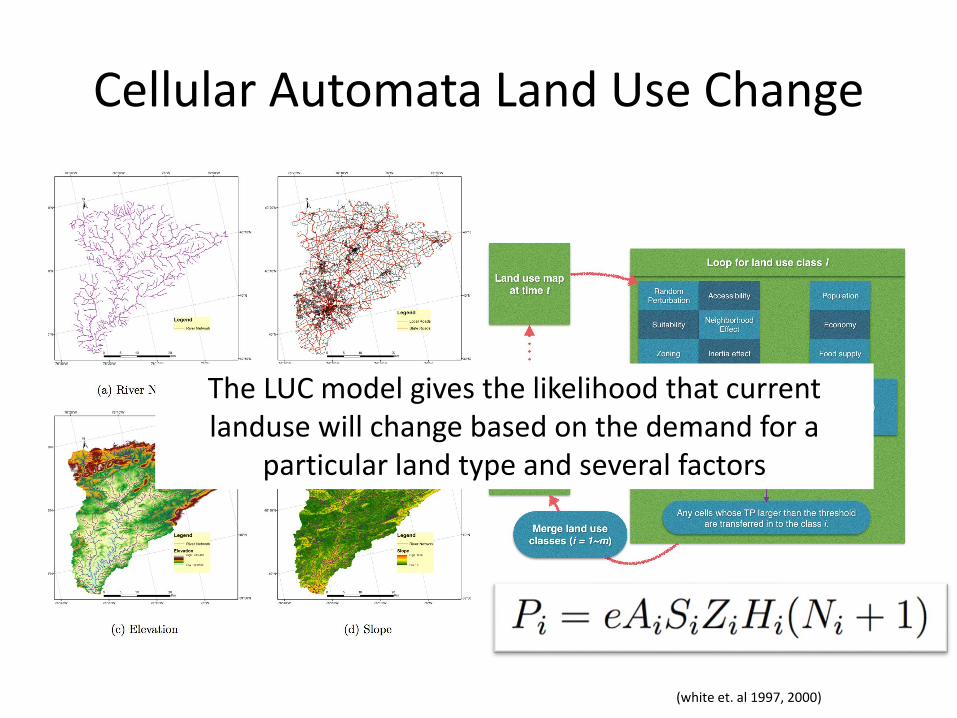
Cellular Automata Land Use Change
(white et. al 1997, 2000)
The LUC model gives the likelihood that current landuse will change based on the demand for a
particular land type and several factors
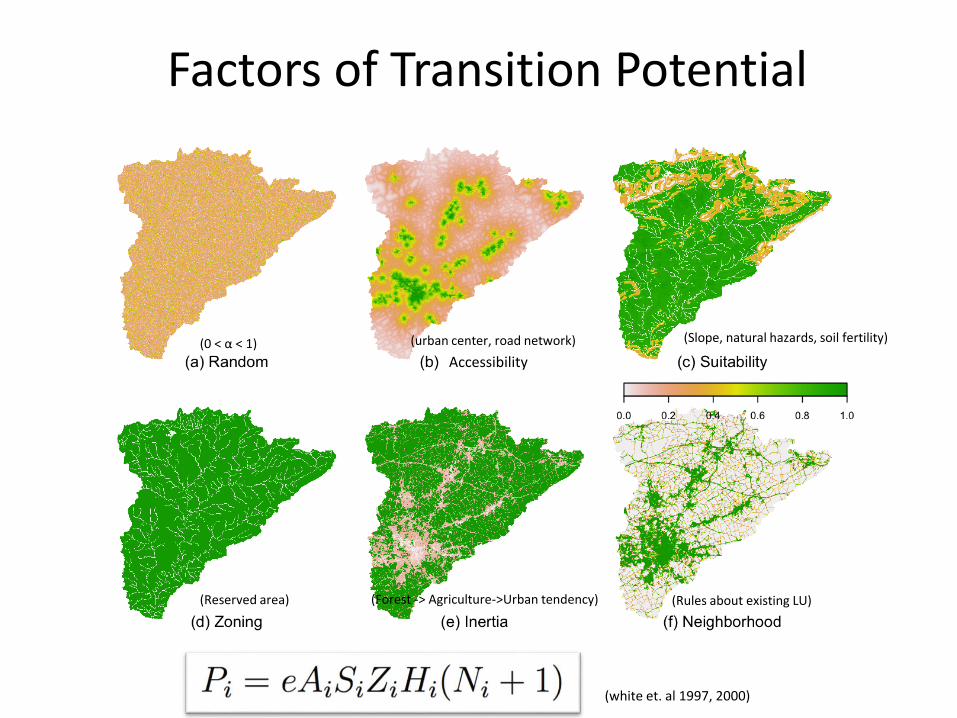
Factors of Transition Potential
(Reserved area) (Forest -> Agriculture->Urban tendency)
(urban center, road network)(0 < α < 1) (Slope, natural hazards, soil fertility)
(Rules about existing LU)
(white et. al 1997, 2000)
Accessibility
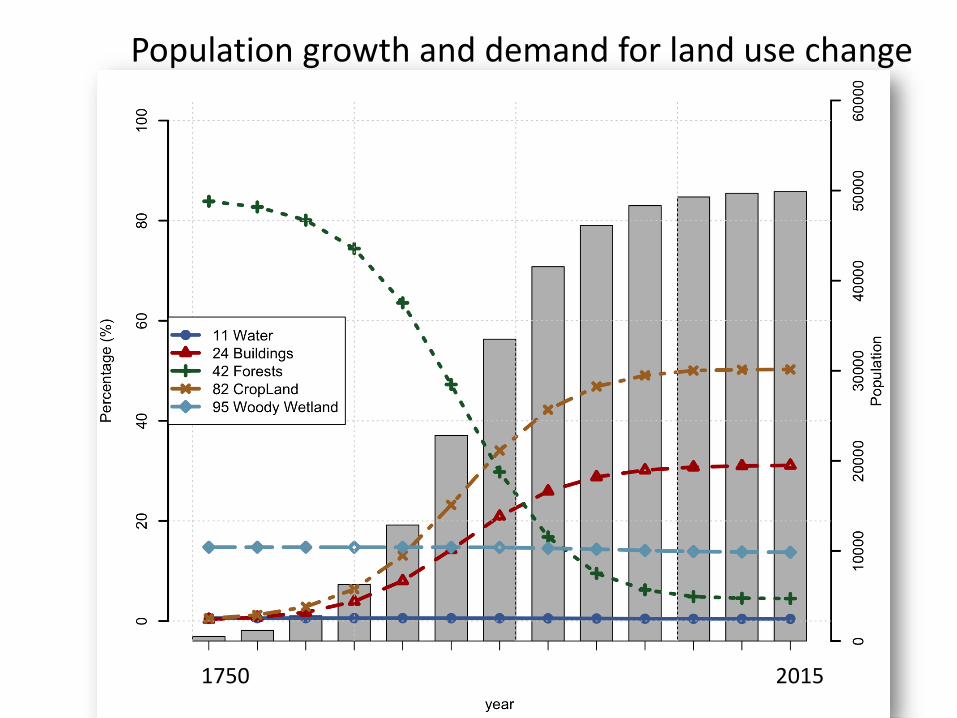
Population growth and demand for land use change
1750 2015
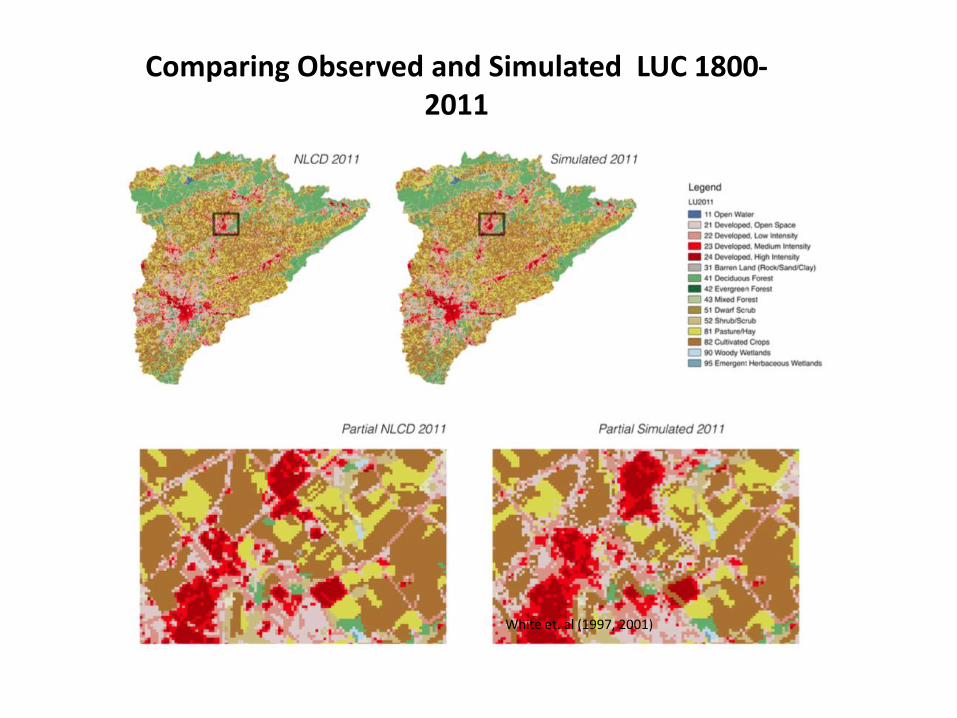
Comparing Observed and Simulated LUC 1800-2011
White et. al (1997, 2001)
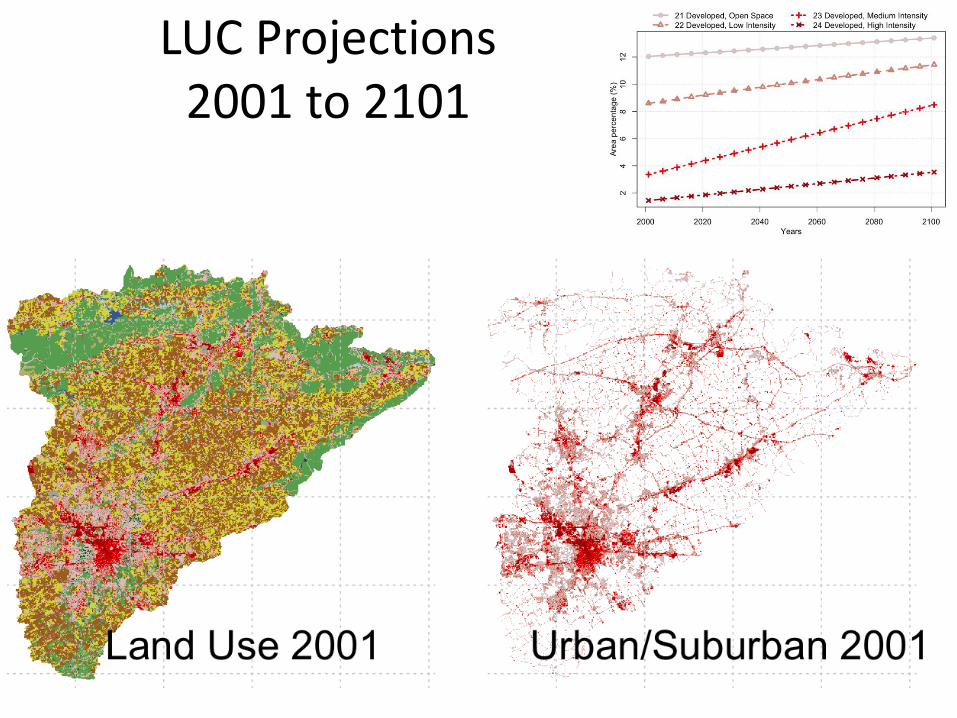
LUC Projections 2001 to 2101
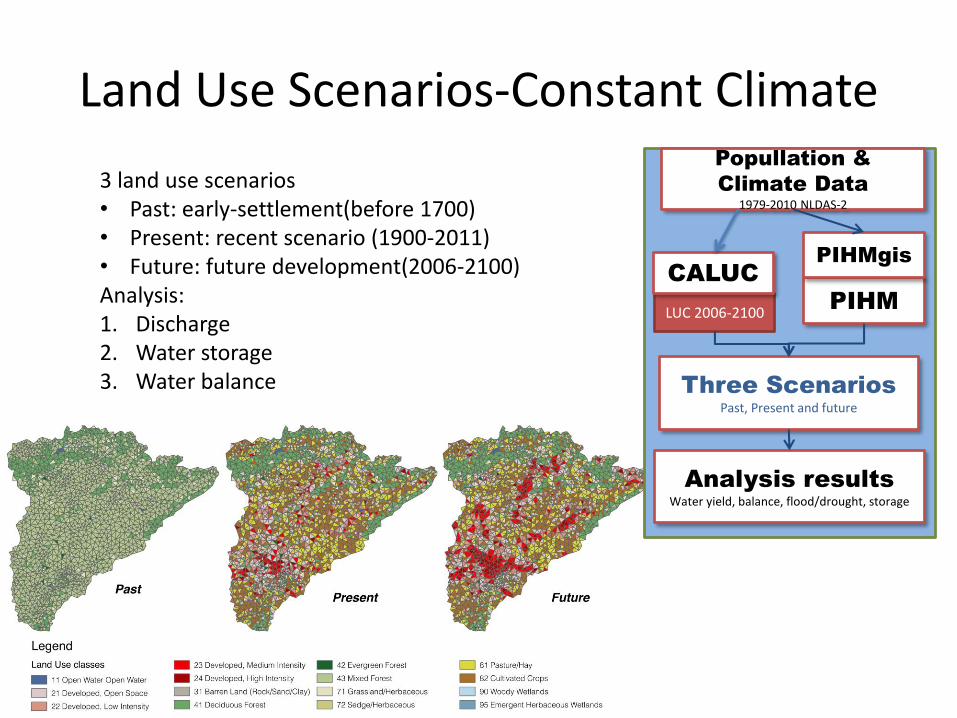
Land Use Scenarios-Constant Climate
3 land use scenarios• Past: early-settlement(before 1700)• Present: recent scenario (1900-2011)• Future: future development(2006-2100)Analysis:1. Discharge2. Water storage3. Water balance
LUC 2006-2100
CALUC
Three Scenarios
Past, Present and future
Analysis results
Water yield, balance, flood/drought, storage
PIHM
PIHMgis
Popullation &
Climate Data
1979-2010 NLDAS-2
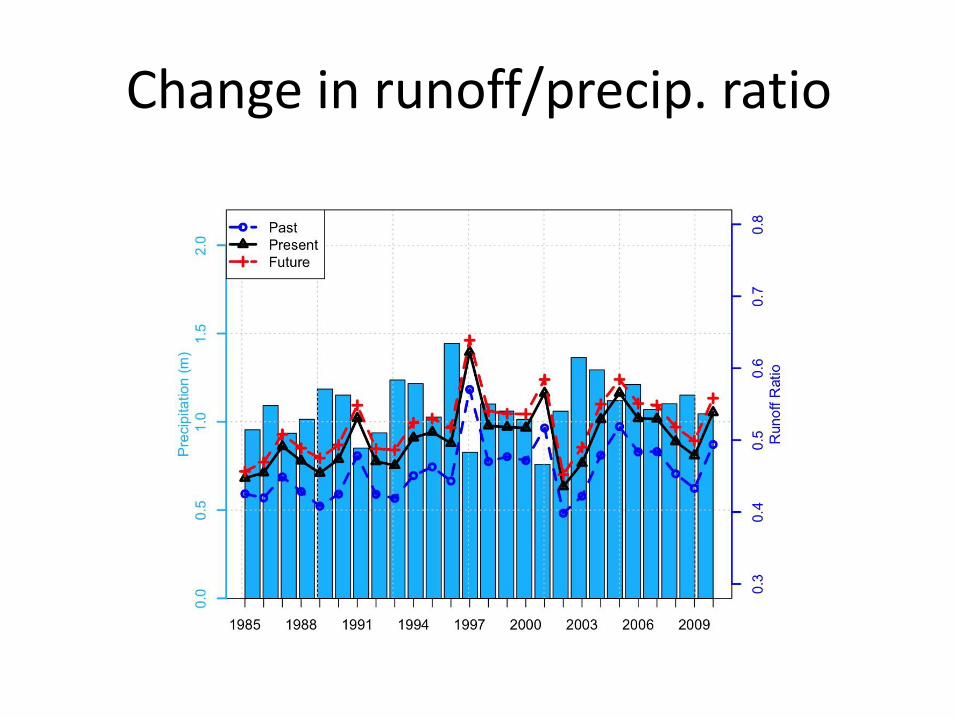
Change in runoff/precip. ratio
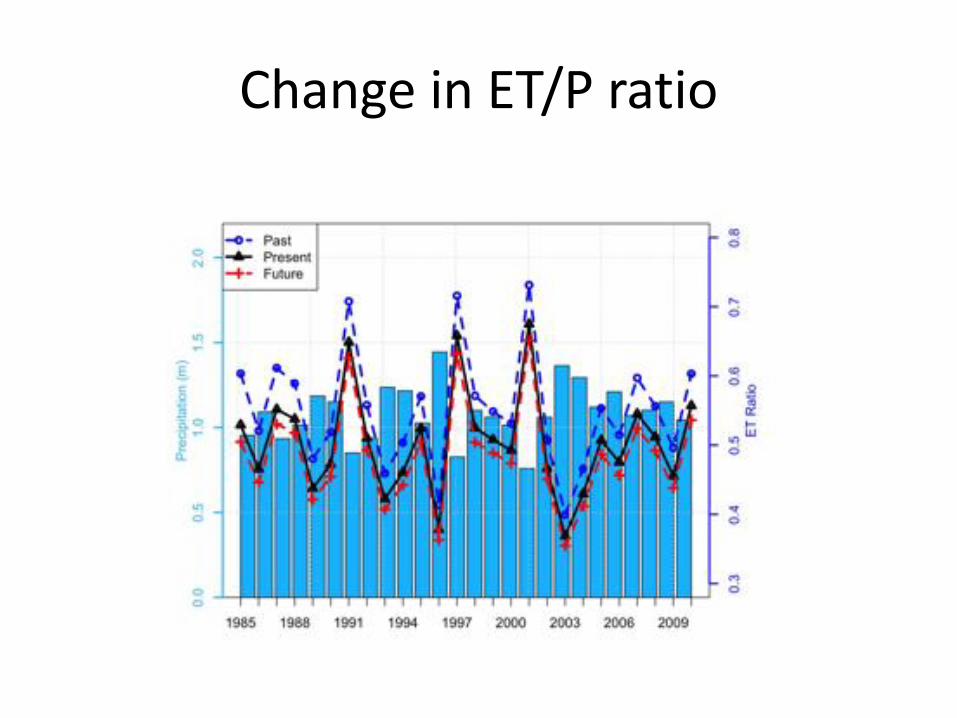
Change in ET/P ratio
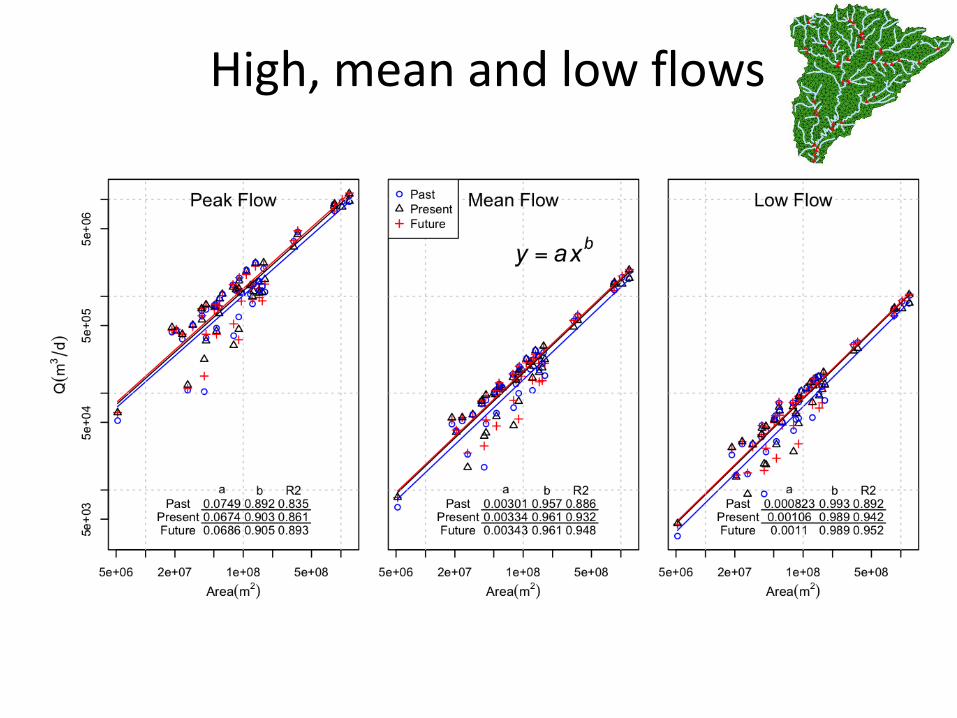
High, mean and low flows
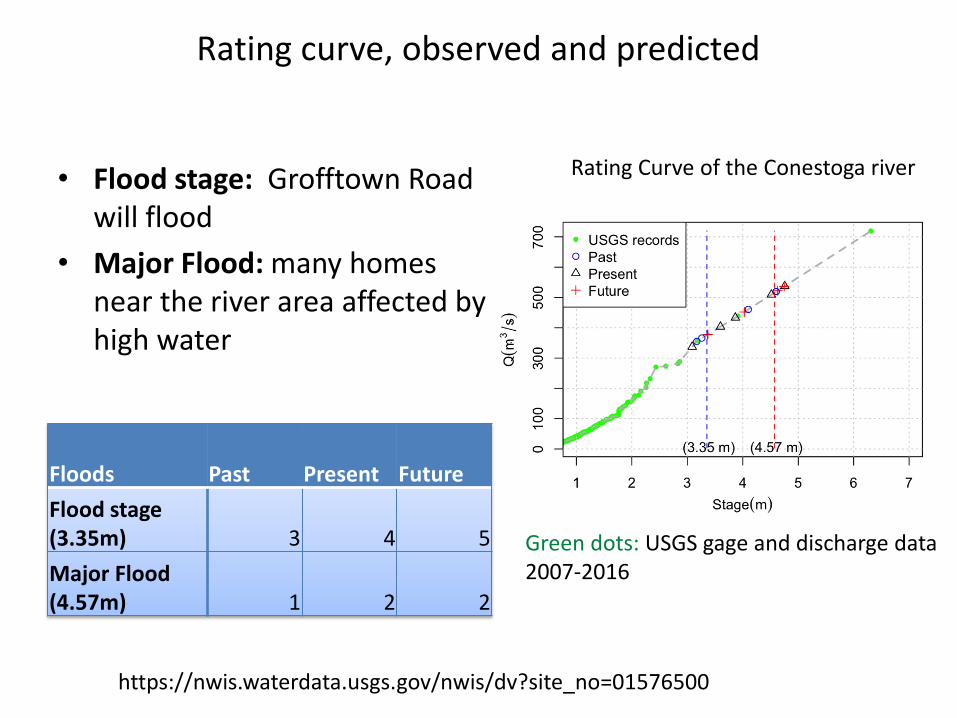
Rating curve, observed and predicted
• Flood stage: Grofftown Road will flood
• Major Flood: many homes near the river area affected by high water
Floods Past Present Future
Flood stage (3.35m) 3 4 5
Major Flood(4.57m) 1 2 2
https://nwis.waterdata.usgs.gov/nwis/dv?site_no=01576500
Rating Curve of the Conestoga river
Green dots: USGS gage and discharge data 2007-2016
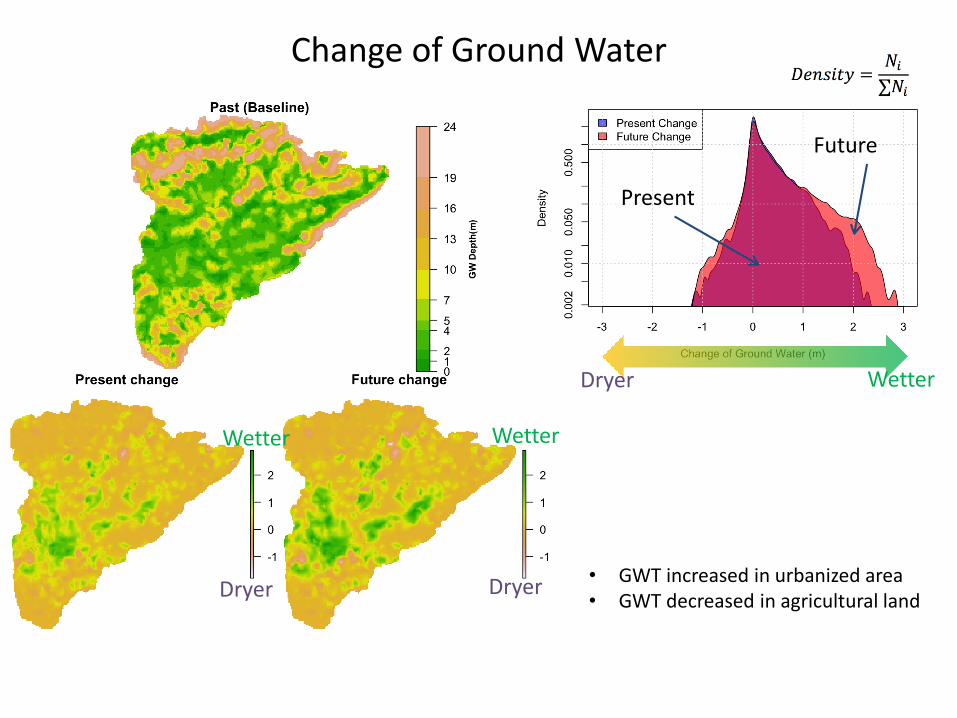
Change of Ground Water
Dryer
Wetter
Dryer
Wetter
Dryer Wetter
• GWT increased in urbanized area• GWT decreased in agricultural land
Present
Future
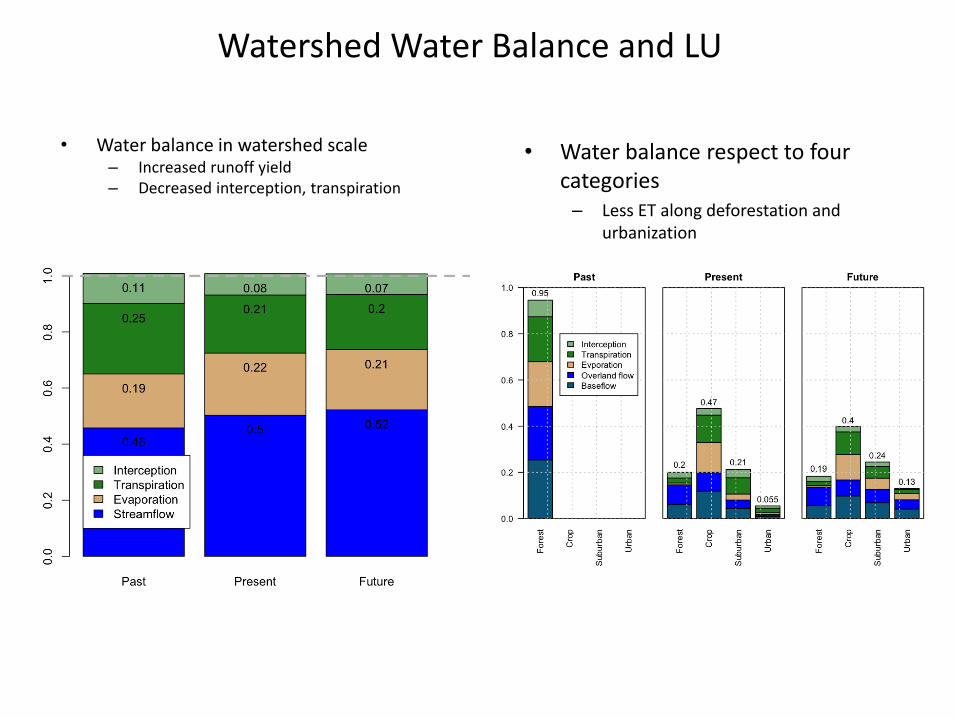
Watershed Water Balance and LU
• Water balance in watershed scale– Increased runoff yield– Decreased interception, transpiration
• Water balance respect to fourcategories– Less ET along deforestation and
urbanization
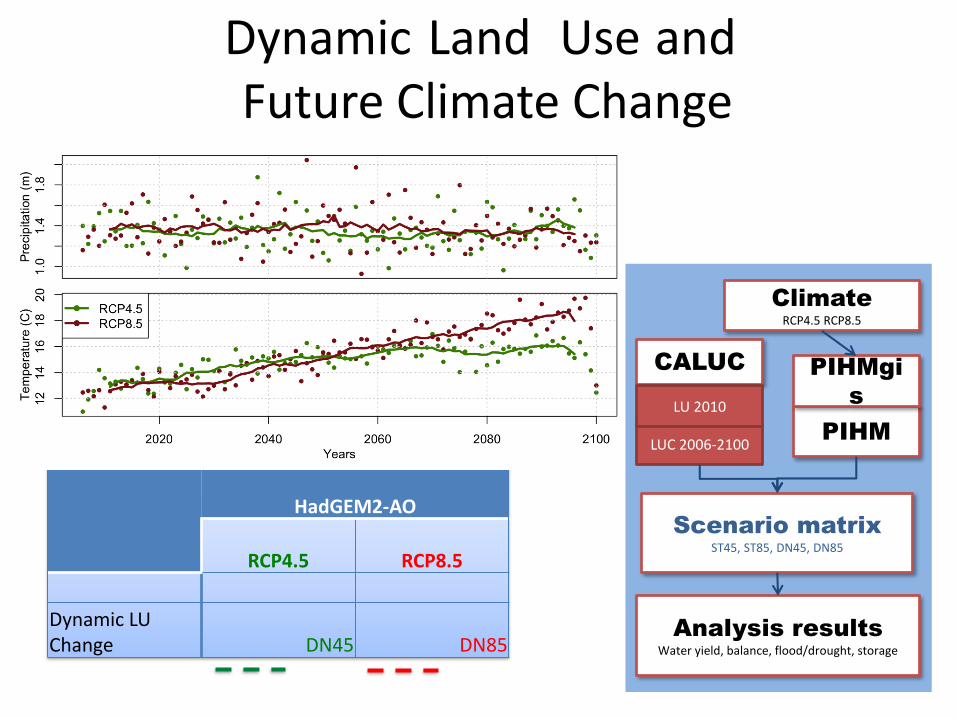
Dynamic Land Use andFuture Climate Change
HadGEM2-AO
RCP4.5 RCP8.5
Dynamic LU Change DN45 DN85
LUC 2006-2100
CALUC
Scenario matrix
ST45, ST85, DN45, DN85
Analysis results
Water yield, balance, flood/drought, storage
PIHM
PIHMgi
s
Climate
RCP4.5 RCP8.5
LU 2010
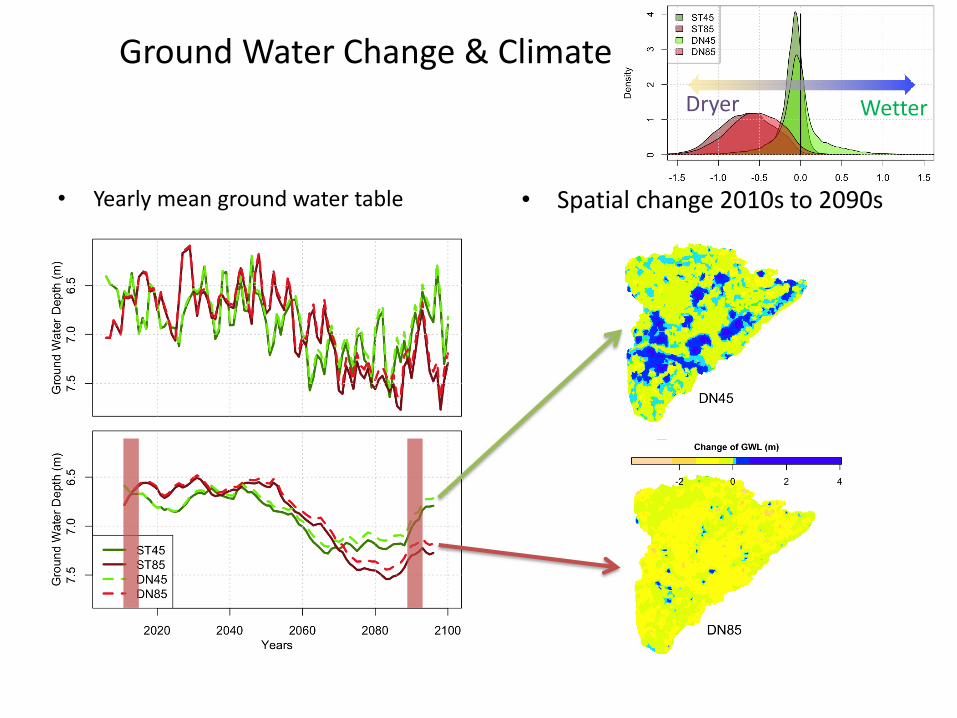
Ground Water Change & Climate
• Yearly mean ground water table • Spatial change 2010s to 2090s
Dryer Wetter
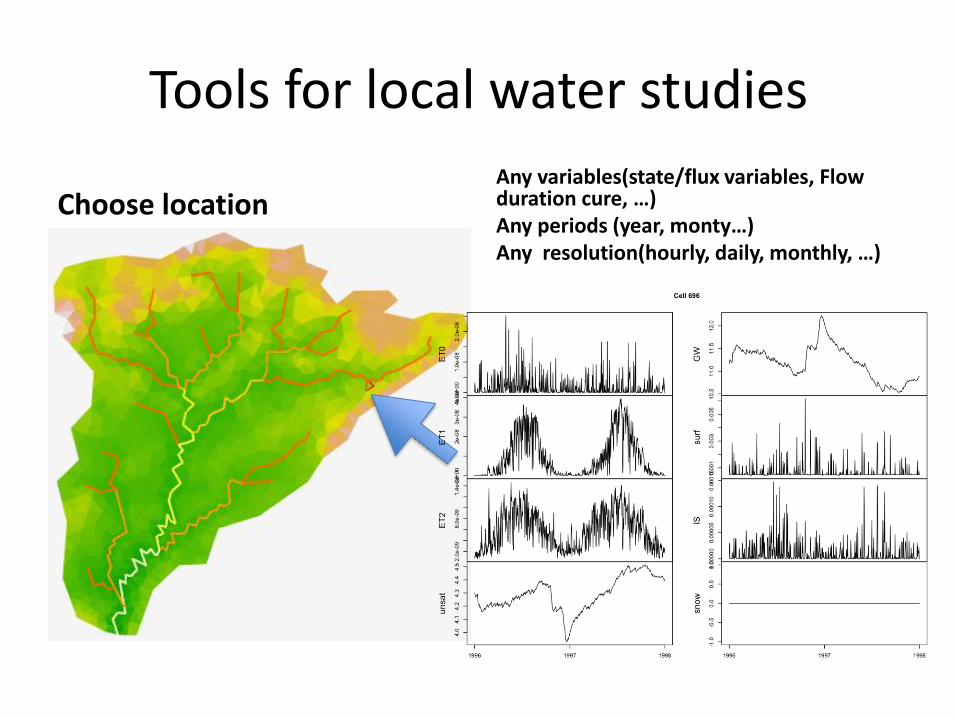
Tools for local water studies
Choose locationAny variables(state/flux variables, Flow duration cure, …)Any periods (year, monty…)Any resolution(hourly, daily, monthly, …)
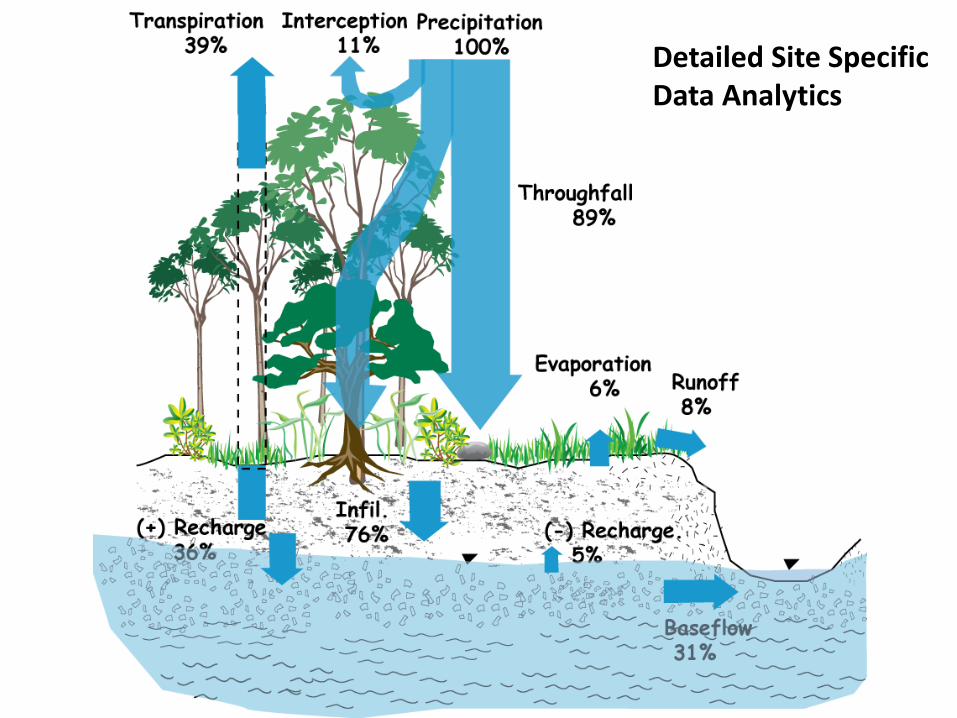
Detailed Site Specific Data Analytics
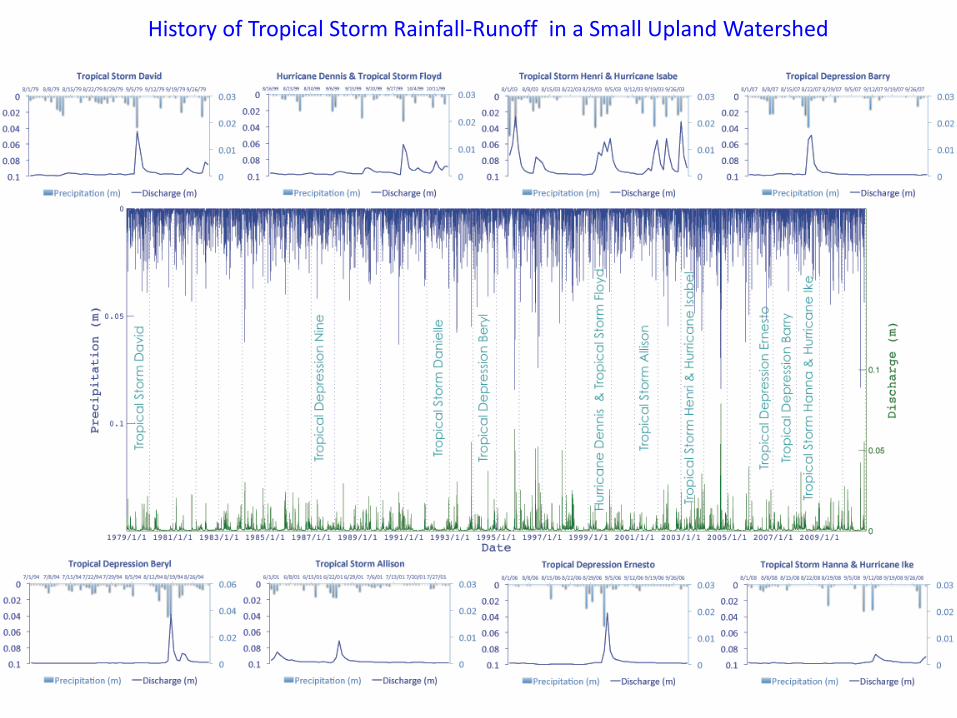
History of Tropical Storm Rainfall-Runoff in a Small Upland Watershed
Conclusions: Conestoga watershed
• Deforestation has had a dramatic impact on floods and droughts
• Urbanization increases runoff yield and decreases ET.• Agriculture development increases runoff and decreases
ET.• Spatial patterns of land use change were associated with
increasing ground water levels under urban land use.• The land use change increases runoff variability.• The relative effect of climate change on runoff variability
is somewhat larger than land use change.• Dynamic climate and land use change together tend to
accelerate the hydrologic cycle at watershed scale.