Water.org WaterCredit Case Study (WCS) Kenya …static.water.org.s3.amazonaws.com/watercredit/WASH...
30
Water.org WaterCredit Case Study (WCS) Kenya Executive Summary Prepared for Water.org by Captiva Africa LLC, October 2014
Transcript of Water.org WaterCredit Case Study (WCS) Kenya …static.water.org.s3.amazonaws.com/watercredit/WASH...

Water.org WaterCredit Case Study (WCS) Kenya Executive Summary
Prepared for Water.org by Captiva Africa LLC, October 2014

Executive Summary
Context of the WaterCredit Case Study
Water.org piloted its first WaterCredit program in Kenya in 2005, following its success with the program in India and Bangladesh. Water.org has since launched the program by partnering with four financial institutions (FIs) in Kenya to catalyze small loans to individuals, entrepreneurs and communities that do not have access to traditional credit markets. As of September 2014, four FI partners in Kenya had disbursed 17,533 water and sanitation loans, serving 91,091 people in Kenya.
It is in this context that that Water.org has retained Captiva Africa LLC to conduct the case study to:
• Identify the factors that have contributed to the relative
success of the water tank loans • highlight the factors that account for the limited
success of sanitation products • Identify options for scaling up household sanitation
loan market
Methodology and Approach:
The case study included literature review and primary research. The desk review focused on relevant literature including reports of studies conducted by the FI partners as well as internal reports from Water.org.
The primary research included focus group discussions (FGDs) as well as interviews of the following stakeholders: Water.org partner financial institutions, non-partner financial institutions, households, WASH NGOs, Water.org staff, apex organizations, partner manufacturers of WASH products, county government and umbrella organizations.
Situation Analysis
The key characteristics of the WASH sector are: 80% of households do not have piped water at home, while 69% of the population does not have improved sanitation. This presents market opportunities for private sector interested in scaling up the adoption of improved WASH products. A snapshot of the WASH situation is set out in the figure above.
Experiences of Partner Financial Institutions KWFT has disbursed 10,607 WASH loans since 2012, comprising 3.3% of its loan business. FI partners have all had relative success with the water tank loans compared to sanitation credit. Only ECLOF appears to have had marked success with the sanitation loans with 30% of its WASH portfolio in sanitation. The other FI partners have less than 1% of their WASH portfolio in sanitation. Factors cited for poor performance of the sanitation loans range from low market awareness of sanitation products to the technical nature of the sanitation products for which the Credit Officers found difficult to sell. It is therefore not surprising that the FI partner with relative success with sanitation loans has had to invest in sanitation training for their Credit Officers. The average loan recovery for WASH loans for FI partners is at 96% which is above the industry average of 94.8%. KWFT’s recovery rate of 98% is even higher than that of its entire loan business. This indicates that WASH credit products offer a compelling business case for the participating FIs. FI partners have generally cited inadequate staff capacity as one of the operational barriers to the growth of their WASH loan portfolio. Factors That Account for the Poor Performance of Sanitation Loans Table 1: Proportion of Sanitation in the FI WASH Portfolio
The study revealed several structural and tactical factors that account for the poor performance of sanitation loans. A key structural factor is the high satisfaction levels amongst most of the households without improved sanitation. Other factors included the following: • Perception that little value is attached to sanitation • Low awareness of existing sanitation products and

Executive Summary
sanitation loan products • Inadequate business development initiatives, if any,
have been carried out by the manufacturers to improve uptake of sanitation
• Credit officers find toilets too technical and are not motivated to sell them
• Credit officers focus on water tanks that enable them achieve sales target faster
• For one of the FIs, product development for sanitation did not transition from the pilot phase
• Improved sanitation is ranked low on the list of most households’ expenditures
• Lack of demonstration products and readymade sanitation products
• High cost of latrines. A simple option ranges from US$250-350 and VIP ranges from US$470-1170
Why Water Tanks Have been Successful
There is a number of push and pull factors that have contributed to the success of the FI partners with the water tank loans. The structural factors that have pushed consumers to invest in water tanks include the following:
80% of households have no piped water at home and 39% rely on rain water during the rainy season
• Declining coverage of drinking water in urban areas • Low coverage of drinking water in rural areas • Reliance on water kiosks which are expensive • Poor management of water resources • Inadequate service from water providers • Frequent droughts While the need and demand for water tanks cuts across income groups and urban and rural areas, the need for improved sanitation is concentrated in the base of the pyramid (BOP) segments and mainly in rural and peri-urban areas.
Tactical Factors
The key pull factors arising from business development activities by value chain actors to enhance the uptake of improved sanitation included the following:
• Availability of a broad range of sizes of ready-made
tanks that cater for all income groups • Extensive distribution network for water tanks • The tanks are easy to install and are often bundled with
transport to the home • Product warranties minimize post purchase dissonance
for the clients • Manufacturers and FI partners have invested in
extensive marketing promotions for the water tanks and loans
Perhaps the most visible market development initiative has been the effective partnership between the FI partners and the water tank manufacturers. This has resulted in increased affordability, increased market awareness as well as increased distribution channels for the water tanks.
Conclusions and Way Forward While 69% of the Kenyan population does not have access to improved sanitation, 80% of the surveyed households are satisfied with their sanitation facilities. Developing the sanitation market will therefore require addressing this paradox by disrupting the status quo of high satisfaction levels amongst the households. This can be achieved through interpersonal communications that focus on emotional and social rather than functional benefits of the sanitation products. Other core activities arising from the case study that need to be reinforced or undertaken to improve the scale up of the sanitation loan products include the following: • Water.org should continue to partner with FIs who have
the resources and geographic reach to scale up once they have graduated from the pilot phase
• The program should consider recruiting more large MFIs with promising WASH business models
• The partner FIs will continue to require business development support-, in particular training the credit officers on the fundamentals of the sanitation market to enable them effectively sell and manage the sanitation loans
• Create linkages and work closely with AMFI to promote the uptake of WASH credit products amongst its members. AMFI has the capacity to access soft funding to support the members build capacity for the WASH business
• Provide market intelligence on business opportunities and risks in the sanitation sector. The market intelligence should be at granular level to enable the FI partners target market segments in which they have competitive advantages
• Link the FIs to sanitation promotion activities in particular community-led total sanitation (CLTS). While the overall open defecation free (ODF) communities may not hold the critical numbers, targeting recently certified communities presents the FIs with an opportunity to confirm the commercial viability of the sanitation loans.
• The FIs should take the lead in the WASH business development support activities initiated by Water.org to ensure they do not form a dependency on Water.org.
• Water.org should consider developing a collaboration platform that will enable the program to benefit from the perspectives and resources of other such WASH actors as the County and Central Governments, private sector and development agencies.
Generally, market development activities should look beyond CLTS efforts which will not generate the critical mass in demand creation. The game-changing opportunities for scaling up appear to be with the 5 million households in the rural and peri-urban areas who are in need of improved sanitation. Urban areas have complex land tenure systems and most of the residents are tenants with little incentive to invest in sanitation improvements.

What factors make these products successful?
What factors explain this limited success to date?
What options should be considered in improving the scaling up of household sanitation loan products?
Report On Water.org Watercredit Case Study (WCS), Kenya
Background
Water.org is a U.S.-based non-profit organization that has transformed the lives of more than two million people in Africa, South Asia, Central America and the Caribbean by providing access to safe water and sanitation for nearly
25 years. .After previous success in Bangladesh and India, Water.org piloted its first WaterCredit program in Kenya in 2005. It has since partnered with four financial institutions (FIs) in Kenya to catalyze small loans to individuals, entrepreneurs and communities that do not have access to traditional credit markets. Under this partnership more than 11,350 loans had been disbursed as of the end of June 2014.
It is in this context that Water.org has contracted Captiva Africa LLC to conduct a WaterCredit case study to answer the following questions regarding the portfolios and experiences of its four FI partners in Kenya:
Examine the following factors at the macro and micro level of why these water and sanitation (WASH) financial products are or are not successful:
• People’s attitudes towards different types of WASH
improvements • The affordability of WASH improvements • Effect of community-led total sanitation efforts by the
government • Ready-made WASH products that manufacturers
produce in the market • The FI’s experience with WASH products
• Other relevant factors not included in this list
Scope of the Assignment The scope of the case study included a review of primary and secondary sources relevant for noted challenges and success with WaterCredit products in Kenya and in particular the following: • Existing literature on microfinance and WASH linkages
in Kenya including national, regional and/or global reports
• WaterCredit background documents, reports and related materials
• Additional documents related to microfinance and WASH, including those from governmental agencies.
• Publications, proposals, grant/loan agreements, field reports, monitoring reports, program and financial data
• Documents related to product development and portfolio performance of FI partners in the WaterCredit program in Kenya
• Meet with all or a sub-set of the stakeholders listed in the terms of reference provided by Water.org to collect primary data; at a minimum, the case study data collection should cover Water.org staff, FI partner staff, borrowers and relevant WASH service providers or manufacturers.
• Assemble a table listing all meetings, dates, parties involved and contact information
• Summarize all information obtained during each relevant meeting
Methodology and Approach The methodology included the following dimensions: • Research design • Review of both published literature and Water.org’s
internal reports • Face-to-face in-depth interviews (IDIs) and • FGDs and where applicable observation during the
primary research • Writing a report with findings from the research Figure 1 gives an overview of the methodology we adopted for this case study.

Report On Water.org WaterCredit Case Study (WCS), Kenya 2
Section I: Introduction, Objectives and Methodology
Step 1. Agree on Scope, Team Roles and Timetable with Water.org
Develop List of Literature to be reviewed Carry out Literature Review
Field Work Document data
Figure 1: Overview of Methodology for Water Credit Study
Step 2. Develop the Research Design Research Objectives Identify Information Gaps Define Methodology
Step 3. Develop Research Tools Develop Indicator Table Develop List of Respondents Draft Interview Guides
Step 4. Conduct Desk Review
Step 6. Data Analysis
Preliminary Data Analysis Corroborate with Literature Final Data Analysis Step 7. Report Writing
Summary Finding to Water.org Key Objectives Analysis Recommendations
Sampling
We applied purposeful sampling guided by both the results of the literature review, input from Water.org based on their experiences on the Kenya program as well as our own recent experiences of the WASH sector. We set out in the table below the profile of the respondents interviewed in the primary research:
Table 1: Target Respondents for Primary Research
Category Tools Reason for inclusion Respondents 1. Partner Financial
Institutions
In-depth Interviews (IDI) Experience with WaterCredit products
Equity Bank, ECLOF, KWFT, SMEP
2. Non-Partner FIs
IDI Experience with WASH products
Faulu
3. Households
Focus Group Discussion (FGD)
Understand attitudes toward sanitation improvements and how these are financed
6- 8 Households from each of the 2 counties to be included in the FGD
4. WASH NGOs
IDI
Information on water & sanitation especially in BOP sector
Practical Action, KWAHO
5. Community-based organizations
FGD
Directly involved with communities both in rural & urban centres
2 local community leaders per county included in the FGD
6. Water.org staff
FGD Experience with the WaterCredit program
Both Kenya and US Staff
7. Apex Organizations
IDI
Organizations that provide funding to MFIs for onward lending
USAID
8. Partner Manufacturers of physical WASH products
IDI
Assess available technologies and range of products
Kentainers, Polytank
9. County Government
IDI
Departments dealing with WASH policy and CLTS efforts
Kisumu and Machakos
10. Umbrella Organization
IDI
An industry perspective of the opportunities and challenges of for the WASH loan market
Association of Microfinance Institutions (AMFI)
Report On Water.org WaterCredit Case Study (WCS), Kenya 3
Section I: Introduction, Objectives and Methodology
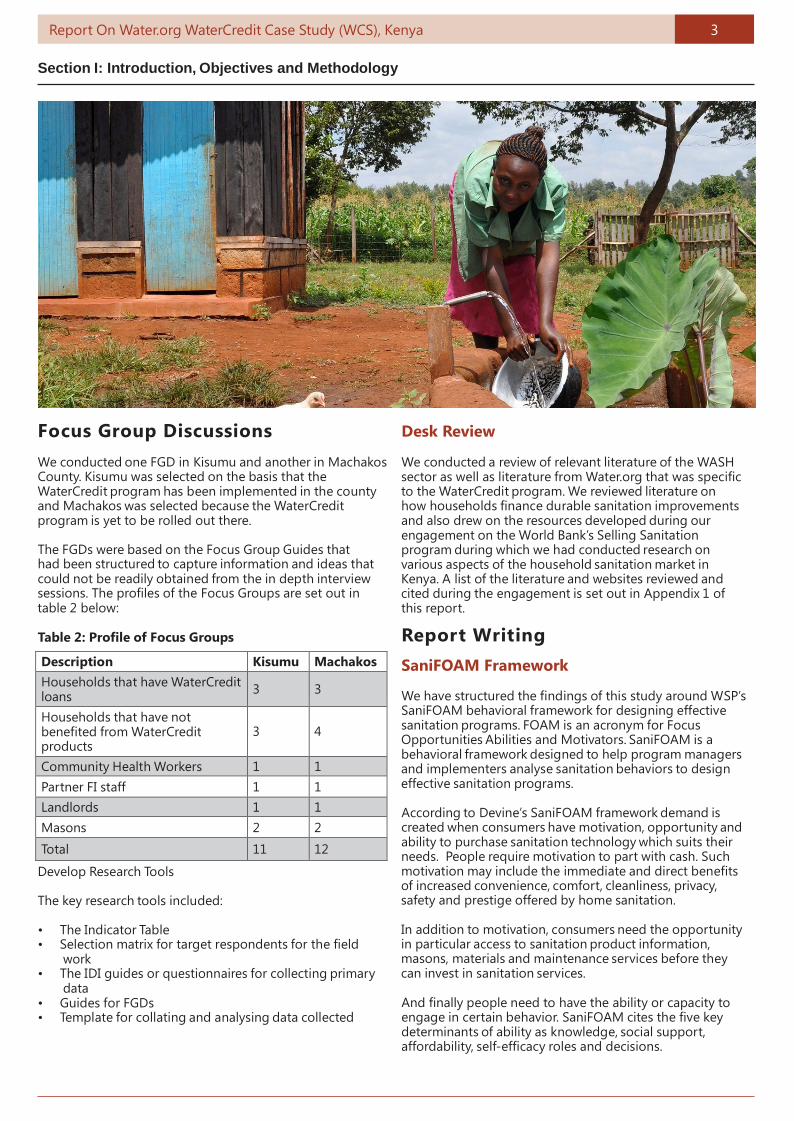
Focus Group Discussions
We conducted one FGD in Kisumu and another in Machakos County. Kisumu was selected on the basis that the WaterCredit program has been implemented in the county and Machakos was selected because the WaterCredit program is yet to be rolled out there.
The FGDs were based on the Focus Group Guides that had been structured to capture information and ideas that could not be readily obtained from the in depth interview sessions. The profiles of the Focus Groups are set out in table 2 below:
Table 2: Profile of Focus Groups
Description Kisumu Machakos Households that have WaterCredit loans
3
3
Households that have not benefited from WaterCredit products
3
4
Community Health Workers 1 1 Partner FI staff 1 1 Landlords 1 1 Masons 2 2
Total 11 12
Develop Research Tools
The key research tools included:
• The Indicator Table • Selection matrix for target respondents for the field
work • The IDI guides or questionnaires for collecting primary
data • Guides for FGDs • Template for collating and analysing data collected
Desk Review We conducted a review of relevant literature of the WASH sector as well as literature from Water.org that was specific to the WaterCredit program. We reviewed literature on how households finance durable sanitation improvements and also drew on the resources developed during our engagement on the World Bank’s Selling Sanitation program during which we had conducted research on various aspects of the household sanitation market in Kenya. A list of the literature and websites reviewed and cited during the engagement is set out in Appendix 1 of this report.
Repor t Writing
SaniFOAM Framework We have structured the findings of this study around WSP’s SaniFOAM behavioral framework for designing effective sanitation programs. FOAM is an acronym for Focus Opportunities Abilities and Motivators. SaniFOAM is a behavioral framework designed to help program managers and implementers analyse sanitation behaviors to design effective sanitation programs. According to Devine’s SaniFOAM framework demand is created when consumers have motivation, opportunity and ability to purchase sanitation technology which suits their needs. People require motivation to part with cash. Such motivation may include the immediate and direct benefits of increased convenience, comfort, cleanliness, privacy, safety and prestige offered by home sanitation. In addition to motivation, consumers need the opportunity in particular access to sanitation product information, masons, materials and maintenance services before they can invest in sanitation services. And finally people need to have the ability or capacity to engage in certain behavior. SaniFOAM cites the five key determinants of ability as knowledge, social support, affordability, self-efficacy roles and decisions.
Report On Water.org WaterCredit Case Study (WCS), Kenya 4
Section II: Situation Analysis
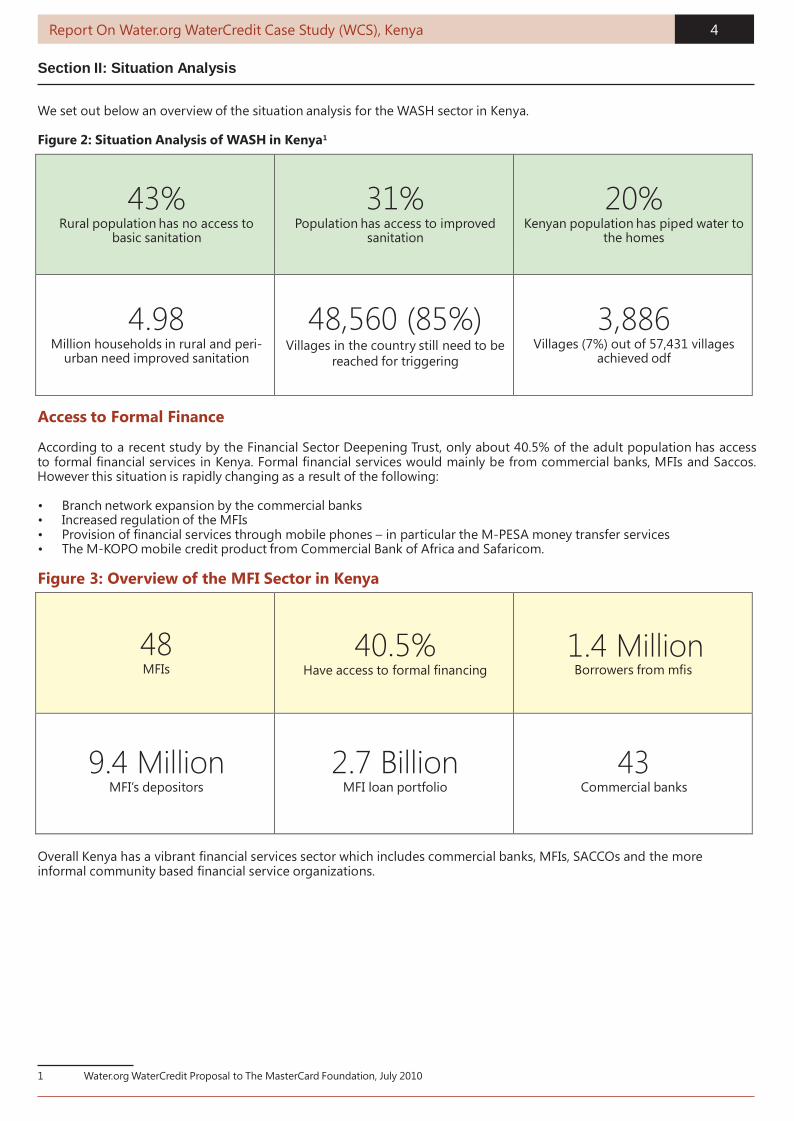
We set out below an overview of the situation analysis for the WASH sector in Kenya.
Figure 2: Situation Analysis of WASH in Kenya1
43% Rural population has no access to
basic sanitation
31% Population has access to improved
sanitation
20% Kenyan population has piped water to
the homes
4.98 Million households in rural and peri-
urban need improved sanitation
48,560 (85%) Villages in the country still need to be
reached for triggering
3,886 Villages (7%) out of 57,431 villages
achieved odf
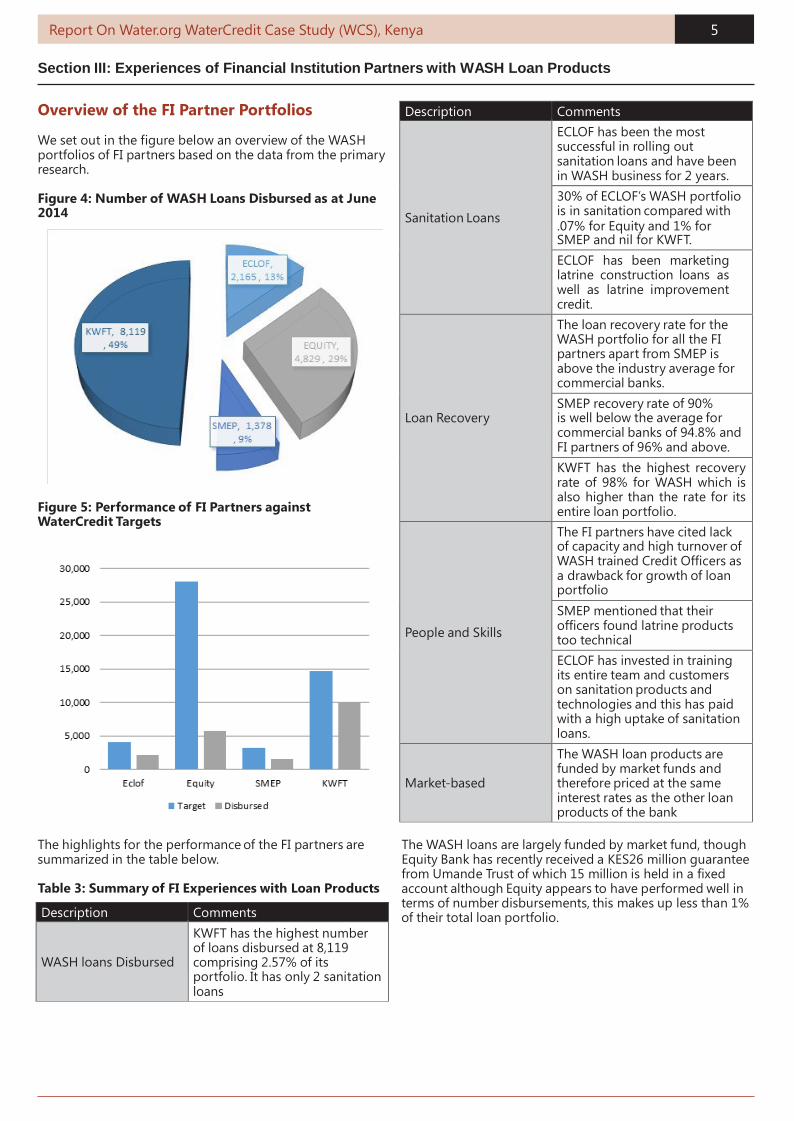
Access to Formal Finance
According to a recent study by the Financial Sector Deepening Trust, only about 40.5% of the adult population has access to formal financial services in Kenya. Formal financial services would mainly be from commercial banks, MFIs and Saccos. However this situation is rapidly changing as a result of the following:
• Branch network expansion by the commercial banks • Increased regulation of the MFIs • Provision of financial services through mobile phones – in particular the M-PESA money transfer services • The M-KOPO mobile credit product from Commercial Bank of Africa and Safaricom.
Figure 3: Overview of the MFI Sector in Kenya
48 MFIs
40.5% Have access to formal financing
1.4 Million Borrowers from mfis
9.4 Million MFI’s depositors
2.7 Billion MFI loan portfolio
43 Commercial banks
Overall Kenya has a vibrant financial services sector which includes commercial banks, MFIs, SACCOs and the more informal community based financial service organizations.
1 Water.org WaterCredit Proposal to The MasterCard Foundation, July 2010
Report On Water.org WaterCredit Case Study (WCS), Kenya 5
Section III: Experiences of Financial Institution Partners with WASH Loan Products
Description Comments
Sanitation Loans
ECLOF has been the most successful in rolling out sanitation loans and have been in WASH business for 2 years. 30% of ECLOF’s WASH portfolio is in sanitation compared with .07% for Equity and 1% for SMEP and nil for KWFT. ECLOF has been marketing latrine construction loans as well as latrine improvement credit.
Loan Recovery
The loan recovery rate for the WASH portfolio for all the FI partners apart from SMEP is above the industry average for commercial banks. SMEP recovery rate of 90% is well below the average for commercial banks of 94.8% and FI partners of 96% and above. KWFT has the highest recovery rate of 98% for WASH which is also higher than the rate for its entire loan portfolio.
People and Skills
The FI partners have cited lack of capacity and high turnover of WASH trained Credit Officers as a drawback for growth of loan portfolio SMEP mentioned that their officers found latrine products too technical ECLOF has invested in training its entire team and customers on sanitation products and technologies and this has paid with a high uptake of sanitation loans.
Market-based
The WASH loan products are funded by market funds and therefore priced at the same interest rates as the other loan products of the bank
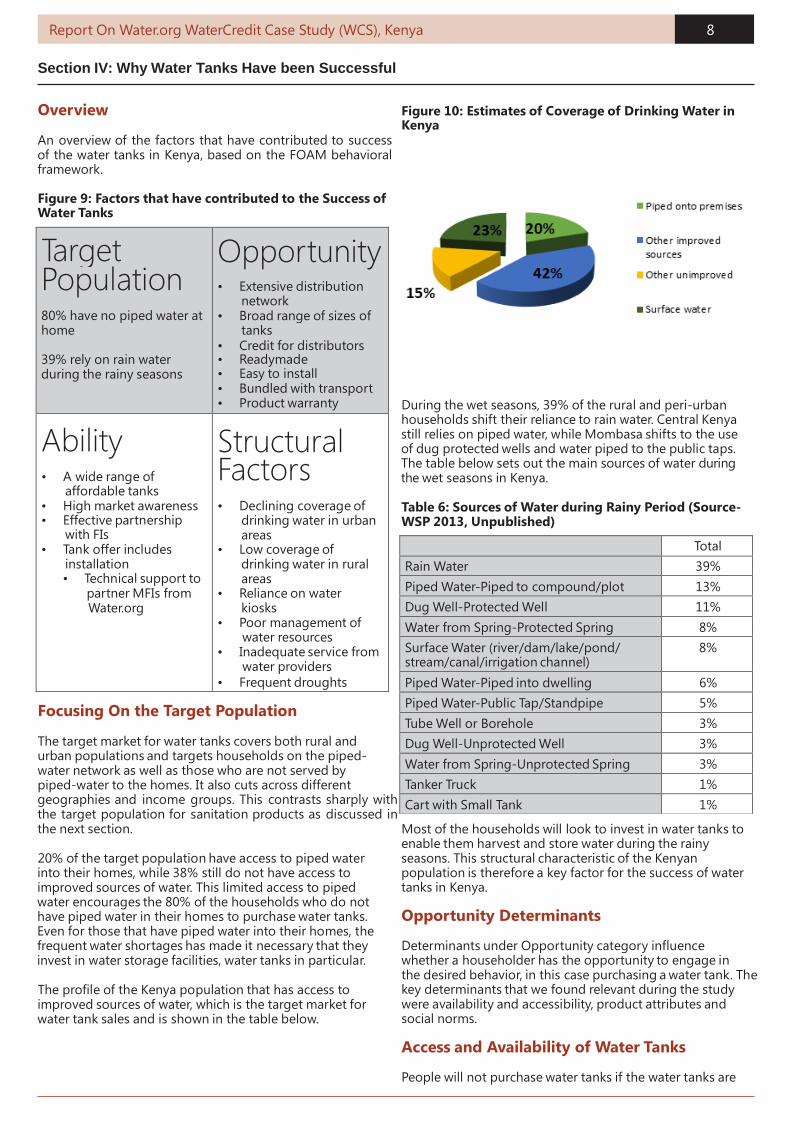
Description Comments WASH loans Disbursed
KWFT has the highest number of loans disbursed at 8,119 comprising 2.57% of its portfolio. It has only 2 sanitation loans
Overview of the FI Partner Portfolios
We set out in the figure below an overview of the WASH portfolios of FI partners based on the data from the primary research.
Figure 4: Number of WASH Loans Disbursed as at June 2014
Figure 5: Performance of FI Partners against WaterCredit Targets
The highlights for the performance of the FI partners are summarized in the table below.
Table 3: Summary of FI Experiences with Loan Products
The WASH loans are largely funded by market fund, though Equity Bank has recently received a KES26 million guarantee from Umande Trust of which 15 million is held in a fixed account although Equity appears to have performed well in terms of number disbursements, this makes up less than 1% of their total loan portfolio.

Report On Water.org WaterCredit Case Study (WCS), Kenya 6
Section III: Experiences of Financial Institution Partners with WASH Loan Products
FI Partner Experience with Sanitation Loans SMEP
SMEP indicated that the credit officers find the toilets too technical and people generally have a negative attitude toward sanitation. SMEP further attributed the poor performance of sanitation to lack of consumer awareness of sanitation products. Sanitation is generally marginalized by the Credit Officers as it is perceived as a low volume business.
Equity
Equity Bank offers the Jamii Safi loan which includes construction of pit latrines and toilets, septic tanks, connections to sewer lines and biogas digesters. Equity has recently hired WASH credit officers, though there has been no focus on sanitation.
FI Partner Experience with Sanitation Loans ECLOF
ECLOF attributes the success in sanitation to a training program conducted in 2012 for all staff and customers focusing on sanitation. This enabled credit officers better understand improved sanitation products and more confident in selling sanitation loans.
Customers appreciated the benefits of sanitation more. The training was facilitated by a government health officer with a consultant for water and sanitation.
KWFT
KWFT has the highest number of loans-all but 2 loans are in water. A look at their website extols the product benefits of water tanks but is silent on any specific sanitation product or the benefits thereof. Conducted a pilot sanitation project that did not transition to market. The price of US$400 for a simple pit latrine was viewed as too high by the customers. Other competing HHs needs were cited as reasons for low uptake. There has been little focus on sanitation with some credit officers unaware of sanitation as a loan product. Plans to re-introduce sanitation under a new Home Improvement program that looks at the home as a package and incrementally provides loans with sanitation being part of the package.
Figure 6: % of Loan Portfolio that is in WASH
With 2.57%, KWFT is second to ECLOF in terms of the % of its loan portfolio that is in WASH. However it has virtually no loans disbursed for sanitation. Similarly SMEP has 1378 WASH loans which make up 0.7% of its entire loan portfolio and yet no sanitation loans.
FI Experiences with Sanitation Loans
Table 4: FI Experiences with Sanitation Loans
Figure 7: % of WASH Portfolio that is in Sanitation
WASH Loan Recovery Rates All the FI partners apart from SMEP have experienced a loan recovery rate that is higher than the industry average of 94.8% for commercial banks. SMEP loan recovery rate of 90% or bad debt experience of 10% is well below the FI’s partner ’s average of 96% and industry average of 94.8%. This has implications for sustainability of the WASH products. Overtime SMEP will need to increase the interest rates in order to make up for the high incidence of bad debt. At the time of drafting this report we were awaiting for further data as why SMEP is experiencing a much higher risk of bad debts. Wash Interest Rates For Financial Institutions
FI SMEP EQUITY KWFT ECLOF FAULU Interest Rate
20% 8-22% 20% 20% 18%
From Captiva’s field research the interest rate charged on WASH loan products was not cited as a barrier to the uptake of WASH loan products

Report On Water.org WaterCredit Case Study (WCS), Kenya 7
Section III: Experiences of Financial Institution Partners with WASH Loan Products
FI Partner Reasons for Poor Performance of Sanitation Loans
Manufacturers
Most households attach little value to sanitation and therefore are not inspired to invest in it Lack of awareness of existing sanitation products. We have affordable products e.g. the Ksh. 3000 plastic slabs but HHs do not invest in them Lack of marketing promotions for sanitation products No business development initiatives have been carried out to improve the uptake of sanitation products Lack of awareness within communities on the importance of improved sanitation.
FI Partner Reasons for Poor Performance of Sanitation Loans
SMEP
Credit officers find toilets too technical and are not motivated to sell them People have a negative attitude towards sanitation Lack of consumer awareness of the existence of sanitation products
ECLOF
Perception that there’s no value attached to sanitation (Water is more basic than sanitation) Credit Officers are focusing more on water tanks because they are able to hit their sales target faster
Equity Sanitation products are expensive KWFT
Products tried before have not transitioned from pilot to market The products are expensive Competing priorities for HHs
Practical Action, KWAHO
Collateral required by the banks The uptake of commercial sanitation financing via FIs is slow Mentality by urban landowners that sanitation facilities on their property do not generate income Communities attach no value to sanitation
Figure 8: Loan Recovery Rate for the WASH Portfolio
Limitations to the Performance of the Loan Portfolio
We set out below the limitations to the scale up of the sanitation loan market as cited by the FI partners during the primary research.
Table 5: Factors for Poor Performance of Sanitation Loans
Overall the FI partners find it easier to market and sell water tank loans than sanitation loans. This has resulted in disproportionate emphasis on financing water products compared to sanitation products. This imbalance has been reinforced by the fact that the manufacturers with whom the FI partners collaborate to market WASH products put more of their resources in marketing water tanks than household sanitation products.
The factors for the dismal performance of the sanitation products are discussed in detail in Section V: Factors That Explain the Limited Success of Sanitation.
Report On Water.org WaterCredit Case Study (WCS), Kenya 8
Section IV: Why Water Tanks Have been Successful
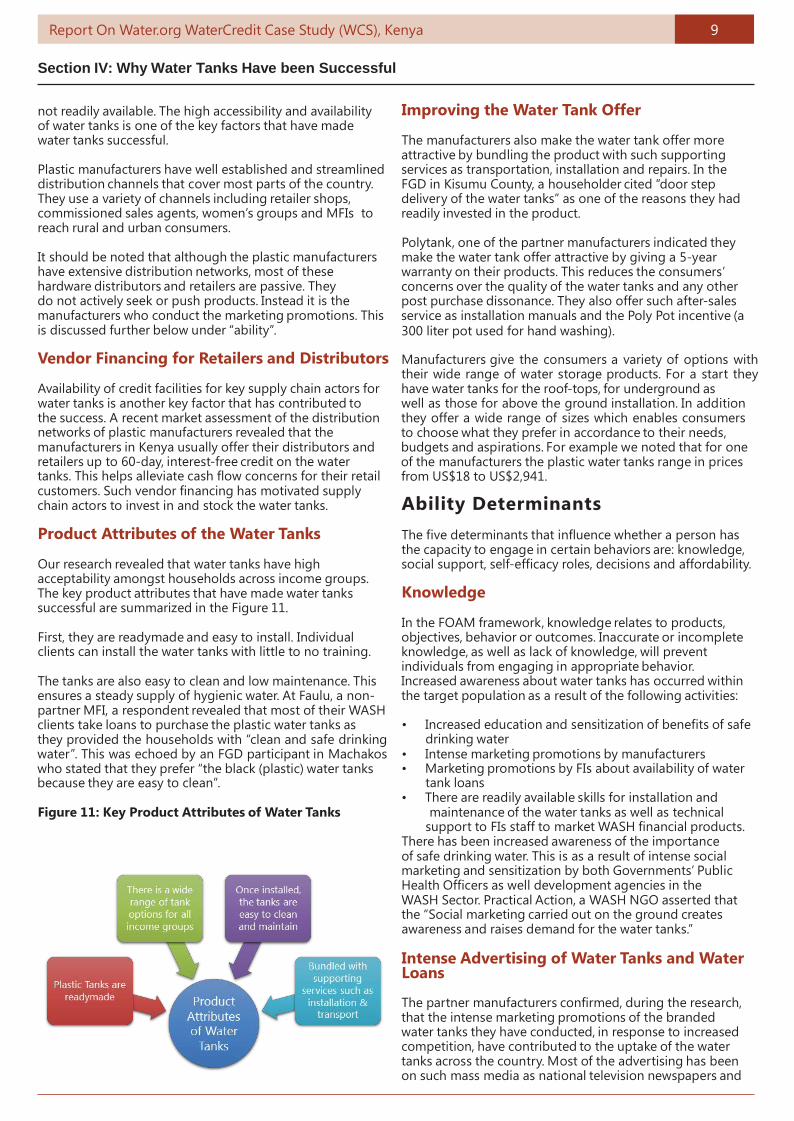
Target Population
80% have no piped water at home
39% rely on rain water during the rainy seasons
Opportunity • Extensive distribution
network • Broad range of sizes of
tanks • Credit for distributors • Readymade • Easy to install • Bundled with transport • Product warranty
Ability • A wide range of
affordable tanks • High market awareness • Effective partnership
with FIs • Tank offer includes
installation • Technical support to
partner MFIs from Water.org
Structural Factors
• Declining coverage of
drinking water in urban areas
• Low coverage of drinking water in rural areas
• Reliance on water kiosks
• Poor management of water resources
• Inadequate service from water providers
• Frequent droughts
Total Rain Water 39% Piped Water-Piped to compound/plot 13% Dug Well-Protected Well 11% Water from Spring-Protected Spring 8% Surface Water (river/dam/lake/pond/ stream/canal/irrigation channel)
8%
Piped Water-Piped into dwelling 6% Piped Water-Public Tap/Standpipe 5% Tube Well or Borehole 3% Dug Well-Unprotected Well 3% Water from Spring-Unprotected Spring 3% Tanker Truck 1% Cart with Small Tank 1%
Overview
An overview of the factors that have contributed to success of the water tanks in Kenya, based on the FOAM behavioral framework.
Figure 9: Factors that have contributed to the Success of Water Tanks
Figure 10: Estimates of Coverage of Drinking Water in Kenya
During the wet seasons, 39% of the rural and peri-urban households shift their reliance to rain water. Central Kenya still relies on piped water, while Mombasa shifts to the use of dug protected wells and water piped to the public taps. The table below sets out the main sources of water during the wet seasons in Kenya. Table 6: Sources of Water during Rainy Period (Source- WSP 2013, Unpublished)
Focusing On the Target Population
The target market for water tanks covers both rural and urban populations and targets households on the piped- water network as well as those who are not served by piped-water to the homes. It also cuts across different geographies and income groups. This contrasts sharply with the target population for sanitation products as discussed in the next section.
20% of the target population have access to piped water into their homes, while 38% still do not have access to improved sources of water. This limited access to piped water encourages the 80% of the households who do not have piped water in their homes to purchase water tanks. Even for those that have piped water into their homes, the frequent water shortages has made it necessary that they invest in water storage facilities, water tanks in particular.
The profile of the Kenya population that has access to improved sources of water, which is the target market for water tank sales and is shown in the table below.
Most of the households will look to invest in water tanks to enable them harvest and store water during the rainy seasons. This structural characteristic of the Kenyan population is therefore a key factor for the success of water tanks in Kenya.
Opportunity Determinants Determinants under Opportunity category influence whether a householder has the opportunity to engage in the desired behavior, in this case purchasing a water tank. The key determinants that we found relevant during the study were availability and accessibility, product attributes and social norms.
Access and Availability of Water Tanks People will not purchase water tanks if the water tanks are
Report On Water.org WaterCredit Case Study (WCS), Kenya 9
Section IV: Why Water Tanks Have been Successful
not readily available. The high accessibility and availability of water tanks is one of the key factors that have made water tanks successful.
Plastic manufacturers have well established and streamlined distribution channels that cover most parts of the country. They use a variety of channels including retailer shops, commissioned sales agents, women’s groups and MFIs to reach rural and urban consumers.
It should be noted that although the plastic manufacturers have extensive distribution networks, most of these hardware distributors and retailers are passive. They do not actively seek or push products. Instead it is the manufacturers who conduct the marketing promotions. This is discussed further below under “ability”.
Vendor Financing for Retailers and Distributors
Availability of credit facilities for key supply chain actors for water tanks is another key factor that has contributed to the success. A recent market assessment of the distribution networks of plastic manufacturers revealed that the manufacturers in Kenya usually offer their distributors and retailers up to 60-day, interest-free credit on the water tanks. This helps alleviate cash flow concerns for their retail customers. Such vendor financing has motivated supply chain actors to invest in and stock the water tanks.
Product Attributes of the Water Tanks
Our research revealed that water tanks have high acceptability amongst households across income groups. The key product attributes that have made water tanks successful are summarized in the Figure 11.
First, they are readymade and easy to install. Individual clients can install the water tanks with little to no training.
The tanks are also easy to clean and low maintenance. This ensures a steady supply of hygienic water. At Faulu, a non- partner MFI, a respondent revealed that most of their WASH clients take loans to purchase the plastic water tanks as they provided the households with “clean and safe drinking water”. This was echoed by an FGD participant in Machakos who stated that they prefer “the black (plastic) water tanks because they are easy to clean”.
Figure 11: Key Product Attributes of Water Tanks
Improving the Water Tank Offer The manufacturers also make the water tank offer more attractive by bundling the product with such supporting services as transportation, installation and repairs. In the FGD in Kisumu County, a householder cited “door step delivery of the water tanks” as one of the reasons they had readily invested in the product. Polytank, one of the partner manufacturers indicated they make the water tank offer attractive by giving a 5-year warranty on their products. This reduces the consumers’ concerns over the quality of the water tanks and any other post purchase dissonance. They also offer such after-sales service as installation manuals and the Poly Pot incentive (a 300 liter pot used for hand washing). Manufacturers give the consumers a variety of options with their wide range of water storage products. For a start they have water tanks for the roof-tops, for underground as well as those for above the ground installation. In addition they offer a wide range of sizes which enables consumers to choose what they prefer in accordance to their needs, budgets and aspirations. For example we noted that for one of the manufacturers the plastic water tanks range in prices from US$18 to US$2,941.
Ability Determinants The five determinants that influence whether a person has the capacity to engage in certain behaviors are: knowledge, social support, self-efficacy roles, decisions and affordability.
Knowledge In the FOAM framework, knowledge relates to products, objectives, behavior or outcomes. Inaccurate or incomplete knowledge, as well as lack of knowledge, will prevent individuals from engaging in appropriate behavior. Increased awareness about water tanks has occurred within the target population as a result of the following activities: • Increased education and sensitization of benefits of safe
drinking water • Intense marketing promotions by manufacturers • Marketing promotions by FIs about availability of water
tank loans • There are readily available skills for installation and
maintenance of the water tanks as well as technical support to FIs staff to market WASH financial products.
There has been increased awareness of the importance of safe drinking water. This is as a result of intense social marketing and sensitization by both Governments’ Public Health Officers as well development agencies in the WASH Sector. Practical Action, a WASH NGO asserted that the “Social marketing carried out on the ground creates awareness and raises demand for the water tanks.”
Intense Advertising of Water Tanks and Water Loans The partner manufacturers confirmed, during the research, that the intense marketing promotions of the branded water tanks they have conducted, in response to increased competition, have contributed to the uptake of the water tanks across the country. Most of the advertising has been on such mass media as national television newspapers and

Report On Water.org WaterCredit Case Study (WCS), Kenya 1
Section IV: Why Water Tanks Have been Successful
outdoor advertising.
The awareness has further been enhanced by the partnership between the manufacturers and MFIs. The FIs on their part have invested in their own targeted marketing promotions to create awareness of the availability of loan products for water tanks. All four Water.org partner FIs cited intense marketing of water financial products as a key success factor for the water tanks.
In contrast there have not been such marketing promotions for sanitation products or sanitation loan products. This is discussed in more details elsewhere in this report.
Skills
Another ability determinant is the availability of skills, in particular the technical assistance provided to the partner FIs by Water.org in the form of training and capacity building.
In addition, KWFT has indicated that their credit officers follow up and communicate the feedback from their clients to the manufacturers, who in turn look at addressing the clients’ concerns in order to meet their needs and expectations. In order to enhance the usage of the water tanks by the households, Polytank on the other hand gives user-installation manuals for each purchase over and above post-sales service.
Affordability
The following are the key factors that have made water tanks more affordable:
• Availability of a broad range of water tanks that cater
for both poor and non-poor households • Availability of credit facilities for key supply chain actors • Partnerships with FIs to provide water loans Manufacturers have entered into partnerships with FIs to distribute water tanks. These partnerships address a number of the behavioral determinants in the FOAM framework. First they address accessibility by acting as an alternative distribution channel for the manufacturers.
The FIs also fill the knowledge gap by providing the manufacturers with a communication platform and assisting them create awareness for the availability of water tanks amongst the FIs customers.
Third; and the purpose for the FI partnership is that it addresses affordability of the water tanks. A key barrier to the purchase of WASH improvements is the initial cash outlay required. This barrier has been significantly lowered for water tanks by the partnerships between FIs and the plastic manufacturers where the FIs provide loans to their customers to purchase water tanks.
The availability and ease of access for the WASH loan products have therefore made the water tanks more affordable to many clients. Participants in the FGD in Kisumu County indicated that it took only three days for their water loan applications to SMEP to be processed.
Some financial institutions such as KWFT have gone further to enhance affordability by negotiating with the
manufacturers for bulk discounts for their customers. Sometimes, as much as 50% off the list prices plus free delivery to the rural households.
Broad Range of Water Storage Products Affordability has also been enhanced by the broad range of water storage products provided by the manufacturers. The water tanks come in all sizes. For example Kentainers indicated during the research that they have water storage tanks that range from (US$18 to US$3,120). Poly Tanks on the other hand offers products from (US$30 to US$1,553). This marketing strategy ensures that households across income groups have access to the water storage products in accordance with their needs and ability to pay. Structural Factors that Have Contributed to the Success of Water Tanks Only 62% of Kenyan population has access to improved water (Source-JMP 2014). The situation in rural areas is worse with only 55% having access to improved water and only 12% with water piped into their premises. There are therefore a number of structural factors that have contributed to water shortages and in turn resulted in the uptake of water storage products. These factors are summarized in the figure below: Figure 12: Structural Factors That Have Contributed to the Success of Water Tanks

Report On Water.org WaterCredit Case Study (WCS), Kenya 1
Section IV: Why Water Tanks Have been Successful
Table 7: Structural Factors That Have Contributed to the Success of Water Tanks
Factor Details 1. Population Growth Kenya’s population almost doubled from 23 million in 1990 (World Bank 2013) to 45 million
in 2014. With the increase in population, water is less accessible.
2. Declining Coverage of drinking water in urban areas
Access to improved water in urban areas has declined from 92% in 1990 to 82% in 2012. Investment in urban water infrastructure has not been matched with the rapid urban population growth. High percentages of inactive water connections in urban areas (Nairobi 56%, Kisumu 26% and Mombasa 38%).
3. Low coverage in Rural areas
Over 45% of the rural households do not have access to improved water. Funding of investments in the water sector does not reflect the need. According to the World Bank planned investments in water for rural areas is 57% short of what it should be, while for the urban areas planned investment is 10% more than what it is required!
4. Reliance on Urban Water Kiosks
It is estimated that 15% of households in Nairobi rely on water kiosks while the proportion in Kisumu and Mombasa is as high as 45% . On average households spend 4-6 trips daily to fetch water. The amount of time it takes to fetch water from the kiosks magnifies the costs of access to many households in urban areas.
5. Poor Management of Water Resources
According to the Kenya Government Kenya National Water Development Report of 2006 Kenya’s water resources have been mismanaged through unsustainable water and land use policies, laws, institutions, weak water allocation practices and growing pollution .
6. Service from Water Providers is inadequate
A recent study by CRC revealed that 13%-42% of non-poor and 19-44% of poor households in urban areas in Kenya experience water scarcity even where they have piped- water networks. To cope with these shortages many households will purchase and install water tanks.
7. Droughts The frequency of drought in Kenya has reduced from every ten years, to every five year, then 2-3 years. Currently every year is characterized by some dry spell or other.
Figure 13: Declining Coverage of Drinking Water in Urban Areas
Table 8: Drought in Recent Years in Kenya
Year Details 1991/1992 North Eastern, Rift Valley and Coast Province
1.5 million people affected. 1995/1996 Kenyan government announced a national
disaster after 2 million people faced famine as a result of widespread drought.
1999/2000 4.4 million people affected when Kenya suffered its worst drought in 37 years
2004/2005 The March-June long rains failed, leaving more than 2.3 million people in need of assistance
2008 1.4 million people affected 2009-2010 10 million people affected
This increased frequency of droughts in various parts of the country and inadequate long-term measures to address the impact has caused households and institutions to put a premium on water storage facilities.
Motivation The figure below provides a summary of the motivation factors that have contributed to the success of water tanks.

Report On Water.org WaterCredit Case Study (WCS), Kenya 1
Section IV: Why Water Tanks Have been Successful
Figure 14: Overview of Key Motivation Factors for the Success of Water Tanks
Attitudes and Beliefs towards Water Tanks
A recent study by WSP in Kenya revealed that over 40% of people believe that the better way of preventing diarrheal diseases is by using treated water. In contrast only 7% thought that proper use of latrines would prevent the diseases.
Figure 15: Ways of Preventing Diarrheal Diseases in Households (Formative Research - Kenya WSP 2013)

Report On Water.org WaterCredit Case Study (WCS), Kenya 13
Section V: Factors That Explain the Limited Success of Sanitation
Products
Target Population for Sanitation Products
The target population for the purchase of improved sanitation are households with unimproved latrines and those with shared sanitation facilities. People that engage in open defecation are not the immediate target market for improved sanitation as they are at the bottom of the sanitation ladder.
In addition, the target market for improved sanitation products is more likely to be rural and peri-urban households who own the land on which they reside. In the urban areas, the land tenure system is complex and most occupants are tenants who do not own the land on which they reside. They are therefore unlikely to be motivated to make investments in improved sanitation.
Market Size for Improved Sanitation
A recent study by Captiva Africa revealed that rural and peri-urban households with the need for improved sanitation in Kenya were in the range of 5 million as set out in the graph below:
Figure 16: Households in Need of Improved Sanitation Products (Captiva Africa RMA - 2013 - Unpublished)
The actual demand and in turn potential market for sanitation products will depend on amongst other things the willingness to pay for the sanitation product. This, in our view, is where the critical mass for scaling up the market for improved sanitation resides.
Sources of Income
The main source of income for the target population is sell of agricultural produce followed by business and paid employment coming a distant second and third respectively. A study by the World Bank (2013) revealed that 46% of households in rural and peri-urban areas get their incomes from sale of farming produce.
Figure 17: Sources of Income for Rural and Peri-Urban Households (Source: Captiva - RMA 2013)
In addition most of the target households experience seasonal fluctuations in their incomes. This is largely explained by the nature of economic activities they engage in. Approximately 30% of individuals surveyed indicated that they receive equal incomes all year round with the exception of Nyanza province as shown in the table below. Table 9: Months Households Receive Highest Incomes (Source: WSP - 2013 Unpublished)
Months They Receive The Highest Income Province
Tota
l (20
00)
Cent
ral (
223)
Coas
t (13
7)
East
ern
(349
)
Nor
th E
aste
rn (1
38)
Nya
nza
(322
)
Rift
Val
ley(
566)
Wes
tern
(265
)
January 7% 6% 4% 8% 1% 12% 6% 6%
February 8% 11% 3% 17% 4% 7% 6% 6% March 6% 9% 2% 12% 4% 6% 4% 3% April 11% 13% 1% 21% 14% 7% 10% 8% May 6% 5% 6% 8% 4% 10% 4% 5%
June 6% 4% 4% 5% 6% 8% 5% 8% July 6% 4% 4% 7% 6% 8% 4% 6% August 20% 17% 9% 16% 20% 28% 16% 32%
September 12% 11% 2% 9% 10% 10% 13% 25%
October 11% 8% 1% 11% 12% 11% 10% 18% November 15% 11% 4% 7% 25% 11% 22% 21% December 31% 39% 15% 26% 13% 34% 32% 40% Equal income in all the months
30%
25%
47%
38%
36%
19%
27%
34%
The high income seasons for the targeted households

Report On Water.org WaterCredit Case Study (WCS), Kenya 14
Section V: Factors That Explain the Limited Success of Sanitation
appear to be in the second half of the year in particular August, November and December. The supply chain actors therefore need to structure their production planning and marketing campaigns for sanitation products to target the high income seasons for these households.
Oppor tunity Determinants
Availability and Accessibility of Sanitation Products
A key barrier to the success of the sanitation products in Kenya is the fact there are no readymade sanitation products that target the consumer market. The limited range of readymade products supplied by the manufacturers tends to target institutional customers. In addition there is a general lack of effective distribution mechanism to reach the rural households.
Unlike with water tanks where they have a well, established and broad national distribution network, large manufacturers and distributors have not been willing to invest in consumer market for household sanitation at scale. There are hardly any readymade sanitation products at the usual hardware channels for construction and home improvement material. In contrast, water tanks are readily available and most come bundled with door-step delivery to the home.
The apparent apathy towards sanitation products arises because the manufacturers and other key supply chain actors do not see a business case for such investments. The perceived costs and risks appear to outweigh, by far, the expected profits. Our previous market assessments of the sanitation market in Kenya revealed that instead these manufacturers focus on institutional customers, in particular relief agencies and schools.
There is limited market information on consumer preferences, needs and drivers. There is therefore the need for sanitation program managers to address this apathy towards the consumer market for sanitation by facilitating market studies to provide data that would demonstrate a compelling business case for private investment in the sector.
A number of development agencies in the sector have already taken note of the glaring dearth of readymade sanitation products in the Kenya market. For example, to address this problem, WSP and the International Finance Corporation have partnered with the Ministry of Public Health to encourage and support plastic manufacturers to produce and distribute plastic sanitation slabs.
The program dubbed “Selling Sanitation” includes generating market data to demonstrate to the manufacturers the commercial viability and growth prospects in the BOP consumer market for sanitation. In addition the program has also invested heavily in conducting countrywide consumer awareness for the sanitation products.
Lack of Demonstration Products
Lack of demonstration products during the introductory stage of new products has been cited as a key barrier to
the success of sanitation products. Fabricators of sanitation products seldom incorporate demonstration products as part of the product development for new latrine options. This undermines marketing promotions for the new product. Retailers and distributors we interviewed during a recent market assessment for a new sanitation product indicated that the launch of the product would be more successful if they (distributors and retailers) were given demonstration products to market to prospective clients. For example, we noted that when implementing Rural Sanitation Marketing in Kamwenge district in Western Uganda, the uptake of the new modular latrines was not as fast as it had been in Kapchorwa district where we anchored the marketing promotions with demonstration latrines at vantage locations. This arose because the households, as expected, had not been exposed to a variety of sanitation technologies. It was therefore difficult for them to visualize the features and benefits of the new latrine without the demo units.
Availability of Masons Availability of supporting services and products is a key barrier to the construction of latrines. In a recent pilot project in Eastern Uganda, Captiva was retained to support local community MFIs to develop the sanitation market in these rural areas. The marketing campaign resulted in a growing list of local households looking to purchase and construct latrines however, the demand could not be readily met because there was a severe shortage of skilled masons to construct the latrines. In addition, latrine construction material was not readily available at the local hardware channels.
Product Attributes Another limitation to the success of the sanitation products is that most of the products do not address consumer preferences, needs and drivers. There is little involvement by the end users in the design of improved sanitation solutions. For example, the manufacturers produce a variety of sanitation slabs but they do not distribute them through their extensive distribution network. These slabs have been designed by NGOs and agencies. They are manufactured for NGOs and sold directly to NGOs. Manufacturers have very little knowledge of consumer preferences and usage of their sanitation products. No overt effort appears to have been made to tap the consumer market with these products. One of the partner-manufacturers has included in their portfolio of ready-made products the Ecosan toilet. Yet research elsewhere has shown that the Ecosan has low acceptability amongst most households. Another manufacturer lamented during the interview that there are affordable readymade sanitation slabs at KES3,000 (US$35) but “households have not invested in them”.
Feedback on User-Experience Manufacturers do not proactively seek feedback on user-

Report On Water.org WaterCredit Case Study (WCS), Kenya 15
Section V: Factors That Explain the Limited Success of Sanitation
Water Products
Price Range US$
Sanitation Products
Price Range US$
Water tanks $17-$2,697 Flush toilets $29-$225 Water Drums $22-$29 Septic tanks $303-$764 Water $899-$124 Plastic slabs $28-$79 Harvesting System
Water Purifier
$112-$225 Mobile toilets
$955
Taps $5-$17 Toilet super $281-$449 structure Gutters $20-$35 Squatting
pan $3-$17
Pipes $12-$35 Concrete $21-$29 slabs Ceramic
toilets $3-$17
Hand $75-$115 washing structure
Pit liners per meter
$153-$165
experience to assess the extent to which the products meet customers’ expectations. Although one of the manufacturers interviewed indicated that they go as far as giving 5-year warranties for the water tanks, there appears to be less effort made to ensure that the sanitation products adequately address the benefits sought by customers.
There is therefore an opportunity here for the sanitation program manager to develop the sanitation market by supporting the key supply chain actors to build capacity that will enable them supply customer-centered sanitation solutions.
Ability Determinants
Knowledge
Whilst there have been extensive marketing promotions for water storage products, in particular the plastic water tanks, there hasn’t been a visible marketing campaign for sanitation products. During the primary research, respondents at Kentainers and SMEP cited the “lack of consumer awareness of sanitation products” as a key barrier to the success of their sanitation business.
Poly Tank on the other hand revealed that “there were no marketing promotional activities: for sanitation products and went further to cite lack of awareness within communities on the importance of improved sanitation as a key barrier to the success of the sanitation business.
Participants at both FGDs in Kisumu and Machakos indicated that they were not aware of availability of sanitation loan products or any readymade sanitation products other than the latrines they use in the village.
Skills
Unlike installation of water tanks, construction of latrines is complex and involving. Households experience technical challenges constructing pit latrines as they have limited knowledge of pit, shelter and slab construction. They therefore have to rely on the local masons both on the choice of technology and the actual construction. In Machakos for example, individuals in the FGD stated that the unstable soil conditions discouraged many of them from digging pit latrines.
Respondents in the primary research indicated that existing skill gaps within the sanitation sector were a drawback to the sanitation business. A respondent at an Apex organization cited inadequate understanding of the sanitation business models by funders.
FIs on the other hand do not consider sanitation their area of expertise. They have limited staff capacity for the WASH products. One of the partner FIs conceded that their credit officers found toilets too technical and were therefore not motivated to sell the sanitation loans. A County Officer in Kisumu gave “minimal knowledge on latrine construction and improved sanitation” as the reason for the low uptake of sanitation products.
Overall, it would appear the value chain actors found it easier and less technically demanding to promote and develop the water tank business as compared to the
sanitation products. This underscores the need for the ongoing technical assistance by Water.org to the FI and manufacturer partners on the WaterCredit program.
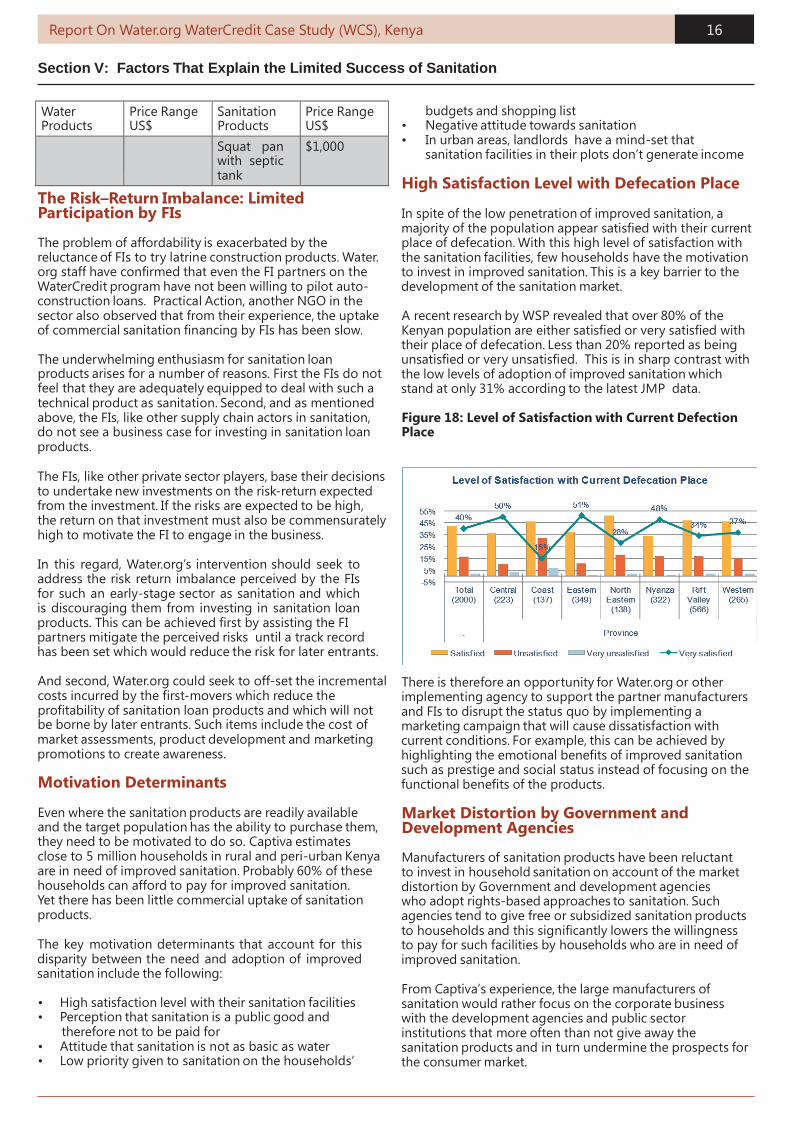
Affordability Affordability was mentioned as a limitation to the success of the sanitation products on a number of dimensions. First householder participants at the FGDs in both Kisumu and Machakos stated that the average cost of constructing a latrine ranged between US$470-$941 for Kisumu, while that for Machakos ranged from US$706 to $1176 for an improved latrine. Thus, they found to be expensive and not within the reach of most households. This sentiment was echoed by a respondent at equity bank who stated that the cost of latrines was high for most of their target customers. The differences in the cost of construction between regions is as a result of amongst other things differences in costs of transport as well as the in the terrain and soil types which in turn impact on the costs of digging the pits. In Machakos for example, the FGD participants indicated that over 50% of the cost of a pit latrine was attributable to digging the pit. We set out below the indicative costs of the sanitation products in the market. Table10: Cost of Construction of Pit Latrines (Source- Focus Group Discussions)
Description Kisumu Machakos Cost of VIP US$470-941 $706-1176 Latrine Cost of Simple Latrine
$294 $353
Table 11: Water & Sanitation Products and Price Range
Report On Water.org WaterCredit Case Study (WCS), Kenya 16
Section V: Factors That Explain the Limited Success of Sanitation
Water Products
Price Range US$
Sanitation Products
Price Range US$
Squat pan $1,000 with septic tank
The Risk–Return Imbalance: Limited Participation by FIs
The problem of affordability is exacerbated by the reluctance of FIs to try latrine construction products. Water. org staff have confirmed that even the FI partners on the WaterCredit program have not been willing to pilot auto- construction loans. Practical Action, another NGO in the sector also observed that from their experience, the uptake of commercial sanitation financing by FIs has been slow.
The underwhelming enthusiasm for sanitation loan products arises for a number of reasons. First the FIs do not feel that they are adequately equipped to deal with such a technical product as sanitation. Second, and as mentioned above, the FIs, like other supply chain actors in sanitation, do not see a business case for investing in sanitation loan products.
The FIs, like other private sector players, base their decisions to undertake new investments on the risk-return expected from the investment. If the risks are expected to be high, the return on that investment must also be commensurately high to motivate the FI to engage in the business.
In this regard, Water.org’s intervention should seek to address the risk return imbalance perceived by the FIs for such an early-stage sector as sanitation and which is discouraging them from investing in sanitation loan products. This can be achieved first by assisting the FI partners mitigate the perceived risks until a track record has been set which would reduce the risk for later entrants.
And second, Water.org could seek to off-set the incremental costs incurred by the first-movers which reduce the profitability of sanitation loan products and which will not be borne by later entrants. Such items include the cost of market assessments, product development and marketing promotions to create awareness.
Motivation Determinants
Even where the sanitation products are readily available and the target population has the ability to purchase them, they need to be motivated to do so. Captiva estimates close to 5 million households in rural and peri-urban Kenya are in need of improved sanitation. Probably 60% of these households can afford to pay for improved sanitation. Yet there has been little commercial uptake of sanitation products.
The key motivation determinants that account for this disparity between the need and adoption of improved sanitation include the following:
• High satisfaction level with their sanitation facilities • Perception that sanitation is a public good and
therefore not to be paid for • Attitude that sanitation is not as basic as water • Low priority given to sanitation on the households’
budgets and shopping list • Negative attitude towards sanitation • In urban areas, landlords have a mind-set that
sanitation facilities in their plots don’t generate income
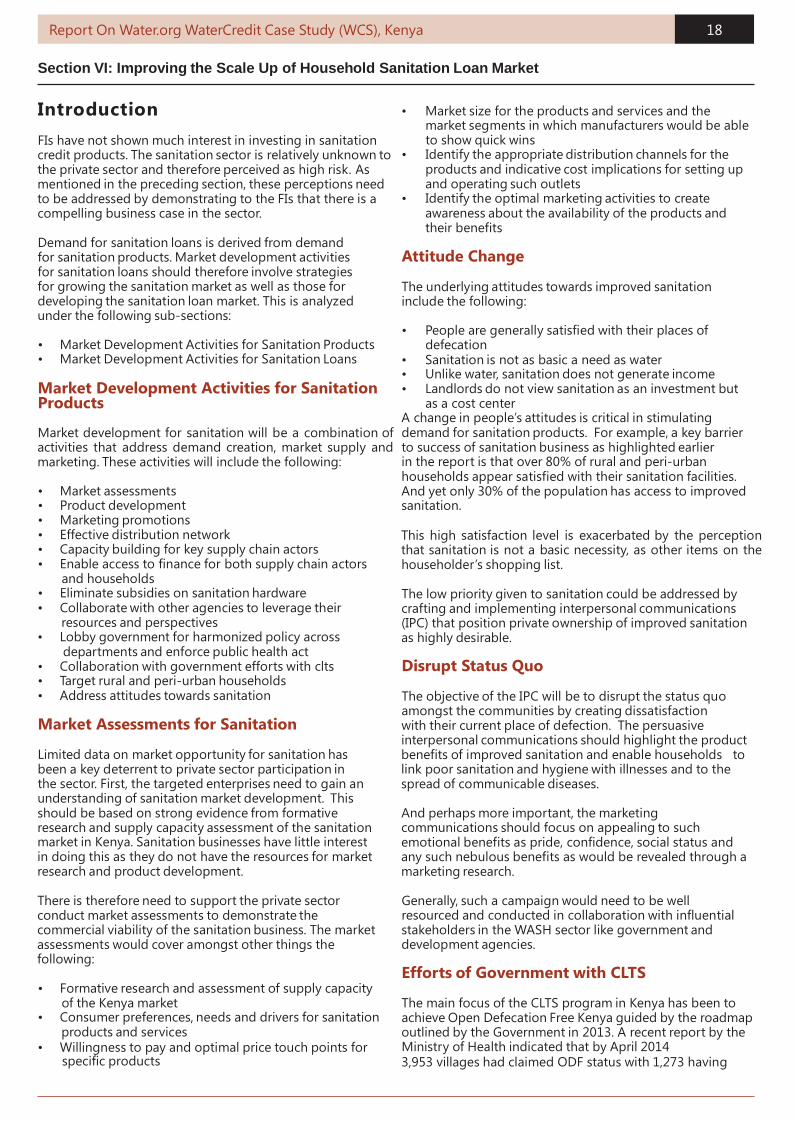
High Satisfaction Level with Defecation Place In spite of the low penetration of improved sanitation, a majority of the population appear satisfied with their current place of defecation. With this high level of satisfaction with the sanitation facilities, few households have the motivation to invest in improved sanitation. This is a key barrier to the development of the sanitation market. A recent research by WSP revealed that over 80% of the Kenyan population are either satisfied or very satisfied with their place of defecation. Less than 20% reported as being unsatisfied or very unsatisfied. This is in sharp contrast with the low levels of adoption of improved sanitation which stand at only 31% according to the latest JMP data. Figure 18: Level of Satisfaction with Current Defection Place
There is therefore an opportunity for Water.org or other implementing agency to support the partner manufacturers and FIs to disrupt the status quo by implementing a marketing campaign that will cause dissatisfaction with current conditions. For example, this can be achieved by highlighting the emotional benefits of improved sanitation such as prestige and social status instead of focusing on the functional benefits of the products.
Market Distortion by Government and Development Agencies Manufacturers of sanitation products have been reluctant to invest in household sanitation on account of the market distortion by Government and development agencies who adopt rights-based approaches to sanitation. Such agencies tend to give free or subsidized sanitation products to households and this significantly lowers the willingness to pay for such facilities by households who are in need of improved sanitation. From Captiva’s experience, the large manufacturers of sanitation would rather focus on the corporate business with the development agencies and public sector institutions that more often than not give away the sanitation products and in turn undermine the prospects for the consumer market.

Report On Water.org WaterCredit Case Study (WCS), Kenya 17
Section V: Factors That Explain the Limited Success of Sanitation
Description Proportion of Household Expenditure Consumer goods 10% Clothing 9% Productive Assets 5% Ceremonies/gifts 2% Building toilet 1% Improving toilet/latrine 1% Housing 0%
Description Proportion of Household Expenditure Food 35% Education 16% Health Care 11% Agricultural Inputs 10%
Sanitation Viewed as a Public Good
A recent market research by KWFT revealed that most people still consider sanitation facilities as a public good and are unwilling to pay for these services .One of the respondents in our primary research stated that people consider sanitation a public good that should be provided by the government. Individuals should therefore not spend their earned money on the sanitation.
Competing Priorities
The negative attitude towards sanitation does not motivate the target households to purchase the sanitation products. The following views that we received from respondents on people’s attitudes toward sanitation demonstrate why people have not been highly motivated to purchase improved sanitation.
• “There’s no value attached to sanitation”- an FI partner • People consider “water more basic than sanitation” • “People have competing priorities and sanitation is least
considered.” • In urban areas, landlords have a mind-set that
sanitation facilities in their plots don’t generate income- a WASH NGO
• People believe that sanitation is not a necessity • Communities view water as an economic good rather
than a social good It is there not surprising that a recent study by WSP revealed that sanitation does not score high on the householder’s shopping list. On the contrary it is ranked at the bottom of the list well below other such expenditure items as food, health, education and recreation.
Table 12: Household Spending Patterns over a 12-month Period
The challenge therefore is to disrupt the status quo so that households can give the purchase of sanitation as a high priority as that given to other household expenditure items as clothing and health care.
Other Factors Impending Scaling of Sanitation Business • Inadequate public investments. Funds routed to other
sectors • Poor public infrastructure in remote areas directly
impacts availability and affordability of WASH services & products
• Environmental sanitation and hygiene policy that was not enacted
• Seasonality of income for the rural population • Sanitation a priority for women & children and yet men
make the final purchase decisions in the house • People in the community not wanting to maintain good
hygiene. Such people do not want to set up a rubbish pit or dig up pit latrines and are not involved in keeping their homesteads clean.
• Land subdivision was raised as a major barrier for residents of Karatina and Wangige since residents no longer have enough land to construct pit latrines
• Regular floods in areas such as Ahero • Soil profile in some areas makes it difficult • Poverty is said to be one of the major barriers to
adoption of improved sanitation and hygiene mainly because majority of the people cannot afford to put in place proper measures such as toilet facilities, clean water points.
Report On Water.org WaterCredit Case Study (WCS), Kenya 18
Section VI: Improving the Scale Up of Household Sanitation Loan Market
Introduction
FIs have not shown much interest in investing in sanitation credit products. The sanitation sector is relatively unknown to the private sector and therefore perceived as high risk. As mentioned in the preceding section, these perceptions need to be addressed by demonstrating to the FIs that there is a compelling business case in the sector.
Demand for sanitation loans is derived from demand for sanitation products. Market development activities for sanitation loans should therefore involve strategies for growing the sanitation market as well as those for developing the sanitation loan market. This is analyzed under the following sub-sections:
• Market Development Activities for Sanitation Products • Market Development Activities for Sanitation Loans
Market Development Activities for Sanitation Products
Market development for sanitation will be a combination of activities that address demand creation, market supply and marketing. These activities will include the following:
• Market assessments • Product development • Marketing promotions • Effective distribution network • Capacity building for key supply chain actors • Enable access to finance for both supply chain actors
and households • Eliminate subsidies on sanitation hardware • Collaborate with other agencies to leverage their
resources and perspectives • Lobby government for harmonized policy across
departments and enforce public health act • Collaboration with government efforts with clts • Target rural and peri-urban households • Address attitudes towards sanitation
Market Assessments for Sanitation
Limited data on market opportunity for sanitation has been a key deterrent to private sector participation in the sector. First, the targeted enterprises need to gain an understanding of sanitation market development. This should be based on strong evidence from formative research and supply capacity assessment of the sanitation market in Kenya. Sanitation businesses have little interest in doing this as they do not have the resources for market research and product development.
There is therefore need to support the private sector conduct market assessments to demonstrate the commercial viability of the sanitation business. The market assessments would cover amongst other things the following:
• Formative research and assessment of supply capacity
of the Kenya market • Consumer preferences, needs and drivers for sanitation
products and services • Willingness to pay and optimal price touch points for
specific products
• Market size for the products and services and the market segments in which manufacturers would be able to show quick wins
• Identify the appropriate distribution channels for the products and indicative cost implications for setting up and operating such outlets
• Identify the optimal marketing activities to create awareness about the availability of the products and their benefits
Attitude Change The underlying attitudes towards improved sanitation include the following: • People are generally satisfied with their places of
defecation • Sanitation is not as basic a need as water • Unlike water, sanitation does not generate income • Landlords do not view sanitation as an investment but
as a cost center A change in people’s attitudes is critical in stimulating demand for sanitation products. For example, a key barrier to success of sanitation business as highlighted earlier in the report is that over 80% of rural and peri-urban households appear satisfied with their sanitation facilities. And yet only 30% of the population has access to improved sanitation. This high satisfaction level is exacerbated by the perception that sanitation is not a basic necessity, as other items on the householder’s shopping list. The low priority given to sanitation could be addressed by crafting and implementing interpersonal communications (IPC) that position private ownership of improved sanitation as highly desirable.
Disrupt Status Quo The objective of the IPC will be to disrupt the status quo amongst the communities by creating dissatisfaction with their current place of defection. The persuasive interpersonal communications should highlight the product benefits of improved sanitation and enable households to link poor sanitation and hygiene with illnesses and to the spread of communicable diseases. And perhaps more important, the marketing communications should focus on appealing to such emotional benefits as pride, confidence, social status and any such nebulous benefits as would be revealed through a marketing research. Generally, such a campaign would need to be well resourced and conducted in collaboration with influential stakeholders in the WASH sector like government and development agencies.
Efforts of Government with CLTS The main focus of the CLTS program in Kenya has been to achieve Open Defecation Free Kenya guided by the roadmap outlined by the Government in 2013. A recent report by the Ministry of Health indicated that by April 2014 3,953 villages had claimed ODF status with 1,273 having

Report On Water.org WaterCredit Case Study (WCS), Kenya 19
Section VI: Improving the Scale Up of Household Sanitation Loan Market
been certified as such by the Ministry of Health.
We set out in the graphics below a summary of the latest highlights of the CLTS efforts in Kenya by the numbers.
Figure 19: Overview of CLTS Efforts in Kenya - March 2014
Figure 20: Potential Market Arising for ODF Status
The devolved government system has resulted in different counties having different conditions for CLTS which may hamper or promote CLTS. In addition, it is difficult to sustain ODF status without effective monitoring and follow up.
CLTS combined with sanitation marketing and microfinance would result in additional demand generation for sanitation products. However for this to be realized the following core activities should therefore be undertaken in relation to the CLTS activities:
• Conduct formative research to identify commercially
viable sanitation marketing strategies in the targeted areas. The research would include market sizing and assessing the capacity of the supply chain actors to meet the demand once the areas have been declared ODF.
• Market research should be conducted before the CLTS campaign to allow time for the market capacity to be developed.
• Scaling up mechanism will require funding for both
suppliers and households. Ultimately, the demand generated from the CLTS efforts is unlikely to be a game changer. To date, only 6.6% of the villages claim to be ODF and only 2.1% have been certified as such. Overall, the potential market size generated from CLTS efforts is unlikely to be higher than the 13% of the population that currently engage in open defecation. Figure 21: % of Villages That Have Been Declared ODF
It is therefore not surprising that a recent study by WSP (2013) revealed that less than 1% of the rural and peri- urban households cited CLTS-triggering as the reason they build their first latrine. Figure 22: The Role of CLTS in Demand Generation for Latrines

Report On Water.org WaterCredit Case Study (WCS), Kenya 20
Section VI: Improving the Scale Up of Household Sanitation Loan Market
Although CLTS efforts are important in reducing the number of individuals engaging in open defecation, its role in demand-generation for sanitation products and loan products will be limited as shown in the graph above.
It is our view therefore, that the more high impact option for scaling up the sanitation product and loan markets will be to look beyond CLTS and target the 59% of the households in rural and peri-urban areas who are in need of improved sanitation.
Thinking Beyond CLTS
Water.org should look to leverage CLTS and other demand creation activities spear-headed by the government. However we suggest that the core market development activities should look beyond the 13% of the population that are open defectors and the target for CLTS.
The program should instead focus on 59% of the population or the 5 million households in rural and peri- urban areas who already use unimproved latrines. This is where the critical mass for the sanitation market lies.
Target Rural and Peri-Urban Households
Demand creation activities should therefore target rural and small and medium-sized towns where there is less pressure on land use and most of the households own the latrines or the land on which they reside. As indicated elsewhere in this report, a recent study by WSP revealed that over 80% of households in rural and peri-urban areas in Kenya own the land in which they reside.
Table 13: Household Land and Living Structure Ownership (Source WSP/IFC 2013-Unpublished)
Household Land and Living Structure Ownership Province ( Sample size= 2000 households)
Cent
ral
Coas
t
East
ern
Nor
th
East
ern
Nya
nza
Rift
Val
ley
Wes
tern
Household owns the household structure in which the live in
100%
100%
100%
100%
99%
99%
100%
Household owns the land on which structure they live in stands.
100%
99%
100%
92%
95%
96%
100%
These households in rural and peri-urban areas who own the land on which they reside are better placed to make final decisions for purchase and construction of latrines as compared to the households in the urban areas.
Demand creation activities in urban and densely populated areas, on the other hand, are likely to be constrained by complex formal and informal land ownership arrangements. Most urban dwellers are tenants and do not have the motivation to invest in construction of latrines. Even where the landlords are willing to invest in latrines for their
tenants, they are also constrained by space. Lack of Affordable and Desirable Products: Build Capacity of the Supply Chain Actors There is generally lack of desirable, affordable product and service options. To enable demand, this limitation needs to be addressed. The core activity would involve supporting sanitation businesses build capacity to enable them inform consumers and to introduce, advertise, promote, and sell their new products and services. This core activity would comprise the following dimensions. • Recruit WaterCredit partner businesses in targeted
geographic areas to produce and provide sanitation products and services
• Recruit business development support partners to assist build capacity for the sanitation businesses. Capacity building would include training and supporting businesses and front-line promoters to give consistent effective sales pitches to overcome objections and convince households to purchase.
• Develop easy-to-understand generic business advertising, product/service marketing, and informational materials. This would include fliers, business cards, banners, and catalogs that partner businesses can easily and cheaply reproduce, personalize, and use to promote their products and services in rural communities.
Product Development A key barrier to sanitation business has been the poor linkage between sanitation demand, promotion and product availability. Product development should be the immediate priority after conclusion of formative research. The overarching objective for product development will be to ensure that the businesses supply products that adequately address the needs and preferences of individuals and that are inspirational. In this regard, it is essential that partner manufacturers and suppliers use appropriate and affordable technologies. The smaller fabricators of sanitation products and service providers may also need technical support and assistance with contracts.
Large Manufacturers vs. SMEs There is debate as to whether the more effective approach would be to recruit large established manufacturers and service providers who already have the resources and operational capacity to operate at scale. Other approaches have included partnering with promising small and medium sized enterprises which in spite of being fragmented have high penetration within the rural areas. Our recent experience in the sector has however shown that such localized models have limitations in terms of the reach of these businesses and the program costs involved in scale-up and replication. It is likely that the more optimal approach will be a hybrid of the two.
Effective Distribution Network Although the partner manufacturers we spoke to in the

Report On Water.org WaterCredit Case Study (WCS), Kenya 21
Section VI: Improving the Scale Up of Household Sanitation Loan Market
research have extensive distribution networks for their products, they have virtually no distribution channels for sale of sanitation products to households. The impact of this is further reflected in the FGD discussions where households exhibited limited knowledge of existing ready- made sanitation products.
It will therefore not be enough to support the manufacturers produce desirable and aspirational products for the households. The manufacturers will need to develop and implement innovative distribution channels to enable households access sanitation products. The current outlets including the traditional hardware channels may not be optimal at this early stage of the sanitation products due to low market awareness of readymade sanitation products.
Market Development Activities for Sanitation Loan Products
The market development activities for the sanitation loan sector could be coupled easily with the market development activities for sanitation products set out in the preceding section. The highest potential for making a clear business case is through individual retail loans for sanitation.
The following are the core activities that should be considered in scaling up sanitation loan business:
• Market assessment, to understand demand from both
the household and MFI perspectives; • Engaging more MFI partners in order to expand
geographic coverage of sanitation loans e.g. by working through association of MFIs
• Developing partnership platform for sanitation, coordinated by District Government as part of ongoing decentralization process, inclusive of private sector and MFIs
• Experiment with delivering targeted partial subsidies to the poor through MFI channels
• Availability of business development support (BDS) to support SMEs working in the WSS sector
• Research support for product development, to determine loan tenor, assess risk, and set interest rates;
• Project development support, to help reduce appraisal costs and risk,
• Additionally, guarantees may be needed to lower risk for MFIs to enter this market.
Tactical Level
• Persuade and support MFIs provide auto construction loans
• Create awareness for sanitation loan products • Create WASH resource materials • Design sanitation toolkits to increase FIs’ knowledge on
sanitation • Connect FI partners with government CLTS initiatives to
boost uptake of sanitation loan products • Increase staff capacity at branch level to sell benefits of
sanitation loans
Market Assessments
Sanitation business is uncharted territory for FIs most of which have limited understanding of the sector. Sanitation program managers on the other hand do not
have adequate understanding of the demands of FIs. It will therefore be necessary to support FIs conduct market assessments on the sanitation credit market to provide data on amongst other things the following: • Market size of the sanitation credit market • Understand the capabilities of the FIs in the sector • Identify market segments in which the FIs may have
competitive advantages • Assess customer preferences and needs to enable FIs
develop credit products that address the benefits and features sought by the target households
• Identify optimal communication platforms and strategies for creating market awareness for the sanitation credit products
• Government policy and the regulatory environment for the sector in Kenya
• Identify optimal communication platforms and strategies for creating market awareness for the sanitation credit products
• Determine appropriate choices in institutional design and financing mechanisms that are commercially viable on a national scale
This market data will enable both Water.org and the FIs understand the commercial viability of the sector and in turn make decisions on what and where they should commit resources to grow sanitation loan business. The program design should include a learning platform and feedback loop that allows for sharing of experience within and across the borders. In addition, strategic choices for support will need to be made carefully to ensure that different business models evolve from experience .
Business Development Support As mentioned in the preceding section, market development for sanitation credit would require building capacity amongst the key supply chain actors, in particular the SMEs along the sanitation product value chain. It will therefore be necessary to recruit business development support (BDS) partners to provide support to both the SMEs and where applicable the MFIs as well. This has been discussed in a little more details in the preceding section. The FIs would also be encouraged to build their own capacity by recruiting sales and business development managers to grow the sanitation credit business. In reality, this is normally an uphill task as it often runs contract to HR plans for the FI.
Support Research for Product Development Focus Group participants in both Kisumu and Machakos suggested that the FIs should do more on product development. In Kisumu, the participants suggested that the MFI should offer more favorable terms and conditions for sanitation loans. In Machakos, the participants went further to suggest that the MFIs provide loans for all types of sanitation improvements. They also needed advice on the type of sanitation products available in the market. Evidently, product development is a key factor for scaling up sanitation loan business. It is positive that Water.org has put emphasis on this as part of the technical support to the partner FIs.

Report On Water.org WaterCredit Case Study (WCS), Kenya 22
Section VI: Improving the Scale Up of Household Sanitation Loan Market
The data from this research as well as that from the initial market assessment would be used to outline the product segmentation. We expect that the more viable products segments would be the retail loans to households to purchase latrines and then to a less extent loans to SME along the sanitation value chain.
It would also appear from the FGD in both Kisumu and Machakos that some of the more attractive features for sanitation loans include giving the households a broad range of options for the type of sanitation improvements, the loan term and the quality of improvement. The sanitation loan offer could be made more attractive to households by bundling it with technical advice and assistance with negotiating the latrine construction contracts.
The flexibility in the loan terms enables both the householder and the MFI to test the sanitation loan program at lower risk to each party.
Financing Latrine Construction
One of the options suggested during our primary research is for the FIs to develop and roll out latrine construction loans. It is our view that the retail loans to households for the purchase of latrines holds the most realistic potential for scale up. Larger loan amounts to the SMEs along the latrine construction value chain are the other credit product segment but are unlikely to generate the critical volumes comparable to the loans to households.
As indicated at the introduction of this section there is significant potential for retail loans for latrine construction for rural and peri-urban areas where close to 5 million households are in need of improved sanitation.
How Auto Construction Loans Would Work
We expect that the program design for the latrine construction loans would mimic the process we adopted in a recent pilot of Sanitation as a Business (SAAB) for rural Uganda. Given the high penetration of SACCOs in rural Uganda we sought to have household credit delivered through these SACCOs as they appeared the most scalable and replicable.
The following are key lessons learned from our pilot of SAAB for rural in Uganda.
Lessons Learnt from Partnering with SACCOs
• Engaging SACCOss takes time and resources and may require soft-funding to support the set up costs.
• The FI may not want to get involved in the logistical and supply chain issues of latrine construction as this is not their main business.
• Delays in delivery of latrines lead to cancellation as the households priorities change to more pressing issues like school fees.
• Dedicated sales agents for sanitation loans speed up the transaction cycle and sales volumes but the MFI may not have the capacity for this.
• Need to streamline supply chain. Local masons are unreliable as they tend to over commit. Local hardware outlets may not have the construction material.
• Poor workmanship on some latrines discouraged
households from servicing loans. • Need to include hidden costs-in particular transport-
when costing and pricing latrines. If this is not done the loan amount may not be sufficient to get the job completed.
• Need to define an exit strategy as the MFI and sanitation businesses may become reliant on the program manager for coordination of activities to integrate sales, latrine construction and financing.
Figure 23: Overview of Process for Latrine Construction Loans- (Captiva Africa-SAAB 2013)
Generally for latrine construction loans to be successful and scaled up, the FI will need to be drawn out of its comfort zone and play a much bigger role, particularly in product development and creating awareness for both the latrine products and the latrine loans.
Affordability of Credit-The Case for Concessionary Funding FIs are reluctant to develop sanitation loan products due to the costs associated with the learning curve and new processes, with no track record on revenue and profit for these loans. Soft funding may therefore be necessary to lower the risks of entry for the FIs. Water.org should therefore consider experimenting with such targeted concessionary funding as guarantees, subsidies or grants to absorb the losses associated with the early stage status of the sanitation loan products. This would give the FIs the comfort needed to invest in sanitation loans while a track record is being established. It is our view that loan guarantee schemes will be more appropriate for SME project loans where the amounts involved would be much larger than the loans advanced for latrine construction. In the case of sanitation the guarantee

Report On Water.org WaterCredit Case Study (WCS), Kenya 23
Section VI: Improving the Scale Up of Household Sanitation Loan Market
scheme would be more apt for SMEs looking to purchase such equipment as cesspool trucks for pit emptying or to set up Decentralized Waste Treatment systems (DEWATS).
The amounts involved in such project financing would be more significant and probably require a term loan as opposed to the micro-loan with tenors of not more than 2 years. The MFIs do not have the balance sheets or experience to cater for project financing and would therefore require support on financing and operational capacity.
No Concessionary Rates for Household Sanitation Loans
The interest rates charged by the MFIs are, for various reasons, much higher than those charged by commercial banks. However, the monthly repayments are still within comfortable reach of the clients because the loan amounts are generally much smaller than those to SMEs. From our recent experiences with household sanitation loans, the key barriers for scaling up was capitalization of the MFIs, administrative and supply chain bottlenecks rather than affordability of the loans in spite of the loans being priced much higher than those at commercial banks.
A Blend of Concessionary Funding
The appropriate type of funding to motivate private sector participation will vary from one FI to another depending on their circumstances. It is unlikely that only one type of financial instrument will be effective in achieving this. The more effective concessionary funding to stimulate the private sector in financing and uptake of sanitation loans will be a blend of different financial instruments including guarantee schemes, subsidies, grants and equity participation.
Such financial instruments may trigger the FIs to start proactively developing sanitation loan business. In any case such concessionary funding should not be structured in a way that would distort the market and crowd out commercial financing from other FIs.
Develop Multi-Dimensional Partnerships
There are a number of structural barriers that have impeded the development of the sanitation and the sanitation loan markets. To address these barriers requires an enabling environment, resources, and various material capabilities for which it may not be practical for a single agency to muster.
It may therefore be necessary that Water.org initiates and seeks to develop multi-dimensional partnerships that cut across the private sector, government and other progressive development agencies in order to address these structural limitations. These will enable Water.org benefit from the resources, capabilities and diverse perspectives that such collaborations or consortia would bring to the table.
One such partnership cited during the primary research was for Water.org to connect FI partners with Government efforts with CLTS. The FI partners would then target the triggered areas and those that have been declared ODF. This has been discussed in detail elsewhere in this report.
Minimizing Subsidies on Sanitation Hardware A key barrier that undermines market development activities for sanitation is the distortion that results from indiscriminate subsidies of sanitation products and services. Such distortion has discouraged manufacturers and other private sector entrepreneurs from investing in sanitation products for households. MFIs will not be motivated to invest in sanitation loan products as subsidies for sanitation hardware increases the risk profile of the credit products. To address this market-barrier, a supportive regulatory regime combined with cooperation and collaboration from key stakeholders, in particular development agencies is required. Strong coordination in policy and planning between different governments departments promoting improved sanitation is imperative. Water.org could, in collaboration with other stakeholders lobby for creation of an enabling environment where subsidies and regulations are structured in a manner that eliminates contradictory policies and practices that could limit the use of microfinance where appropriate . For example microfinance for sanitation is only likely to be viable if hardware subsidies are simultaneously discontinued.
Recruit More FI Partners Water.org should consider recruiting more MFIs into the WaterCredit program to increase coverage of other segments of the sanitation loan markets. A review of the survey of the members of the Association of Microfinance Institutions conducted by Water.org revealed mixed results in terms of their interest to roll out sanitation products. Water.org should screen the members and identify those that look promising and might want to commit resources and build operational capacity for sanitation credit business. It is not surprising that one recurring theme for most of the MFIs interviewed were the need for a business case and “cashflow projections”. The other key requirements cited by AMFI for them to invest in the sector were the following: • Demonstrate a business case for the investment • Need training in sanitation • Streamlining of the sanitation supply chain reliable
suppliers, distribution channels and “training of masons”
• Funds for onward lending • Support with marketing WASH products
Mainstreaming Sanitation Loans Another drawback for market development of sanitation credit has been the failure of the FIs to mainstream the sanitation loans. Sanitation business in FIs often starts off a pilot (most likely subsidized) project but fail to make the transition from pilot to mainstream program due to lack of proper financing plans and unclear exit strategy for the project sponsor. The result is that the sanitation business is left pigeon-holed in special projected where it may be viewed as transient and therefore marginalized and generally under-resourced within the FI.
Report On Water.org WaterCredit Case Study (WCS), Kenya 24
Section VII: Conclusions and Way forward
1. Water.org should continue to partner with the large MFIs who have the resources and geographic reach to scale up once they have graduated from the pilot phase. The role of Water.org should be to support the participating FIs in market-sizing, product development and field testing, training and developing a team in preparation for scale up and crafting business plans for the sanitation loan product.
2. The program should consider recruiting more large
MFIs with promising WASH business models such as Faulu and Family bank. This will provide opportunity for cross-pollination of the more successful WASH business practices amongst the partners.
3. Business development support required for the FIs.
The study has revealed that the FI Credit Officers find sanitation products difficult and complex to sell. The partner FIs will therefore continue to require business development support, in particular training the credit officers on the fundamentals of the sanitation products and market to enable them effectively sell and manage the sanitation loans.
4. Create linkages and work closely with AMFI to
promote the uptake of WASH credit products amongst its members. This study revealed that the AMFI would be amenable to promoting the WASH loan business amongst its members. In addition AMFI has the capacity to access soft funding that can be used to support the members build capacity for the WASH business.
5. Provide market intelligence on business
opportunities and risks in the sanitation sector. The market intelligence should be at granular level to enable the FI partners target market segments in which they have competitive advantages and where they are able to score quick wins. Water.org could consider zoning certain geographies to ensure the partner FIs
do not saturate certain regions and engage in attritious competition. This may undermine the commercial viability of the nascent sanitation credit products.
6. Link the MFIs to sanitation promotion activities in
particular CLTS. While the overall ODF communities may not hold the critical numbers, targeting recently certified communities presents the FIs with an opportunity to confirm the commercial viability of the sanitation loans. The model can then be replicated on a larger scale, targeting households seeking WASH improvements.
7. The MFIs should take the lead in the WASH business
development support activities initiated by Water. org. This will ensure they do not become dependent on the support of Water.org. It will enable Water.org firm up a timely exit plan by encouraging the FIs focus on the sustainability and commercial viability of the core activities undertaken including product development, marketing promotions and capacity building for the WASH business.
8. Water.org should consider developing a
collaboration platform that will enable the program benefit from the perspectives and resources of other such WASH actors as the County and Central Governments, private sector and development agencies. The partnership platform will be crucial in addressing structural barriers such as indifferent attitudes towards sanitation improvements, sanitation hardware subsidies, government policies and WASH business enabling environment.
9. Demand for sanitation loans is derived from
demand for sanitation products. We set out in the table below a summary of other core activities that need to be conducted both at sector level and firm level to develop the sanitation market.
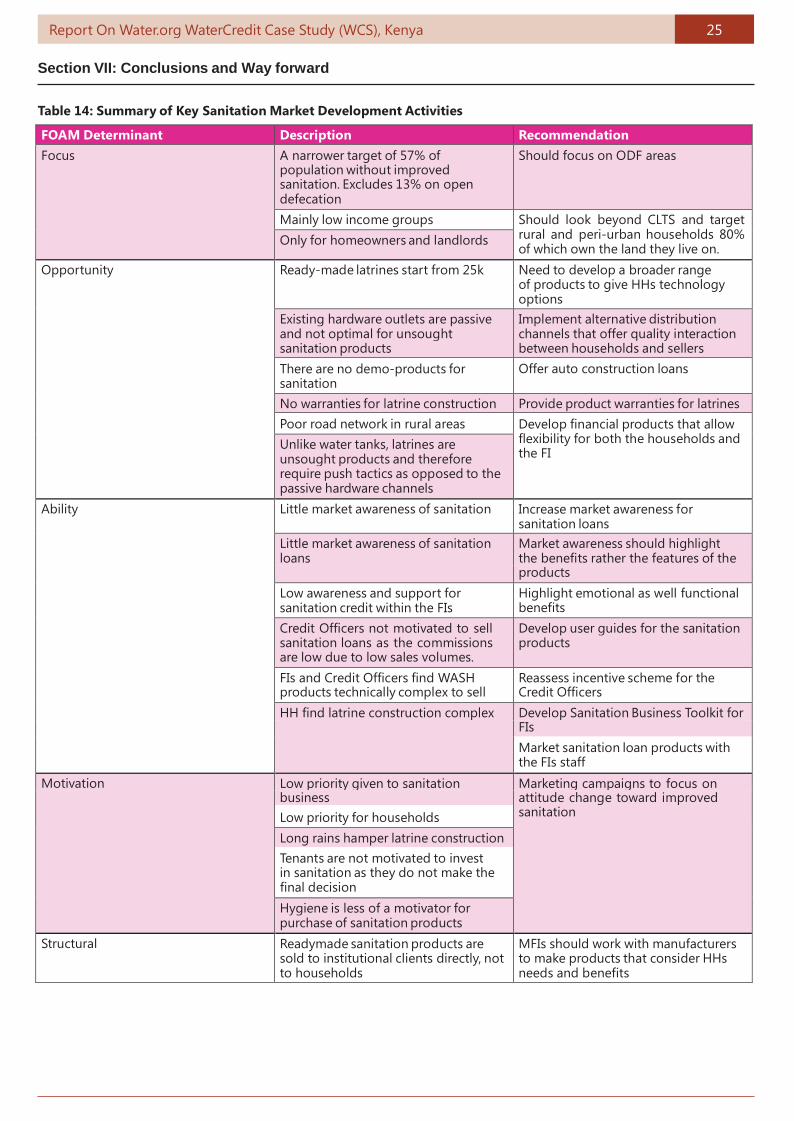
Report On Water.org WaterCredit Case Study (WCS), Kenya 25
Section VII: Conclusions and Way forward
Table 14: Summary of Key Sanitation Market Development Activities
FOAM Determinant Description Recommendation Focus A narrower target of 57% of Should focus on ODF areas
population without improved sanitation. Excludes 13% on open defecation
Mainly low income groups Should look beyond CLTS and target rural and peri-urban households 80% of which own the land they live on.
Only for homeowners and landlords
Opportunity Ready-made latrines start from 25k Need to develop a broader range of products to give HHs technology options
Existing hardware outlets are passive and not optimal for unsought sanitation products
Implement alternative distribution channels that offer quality interaction between households and sellers
There are no demo-products for sanitation
Offer auto construction loans
No warranties for latrine construction Provide product warranties for latrines Poor road network in rural areas Develop financial products that allow
flexibility for both the households and the FI
Unlike water tanks, latrines are unsought products and therefore require push tactics as opposed to the passive hardware channels
Ability Little market awareness of sanitation Increase market awareness for sanitation loans
Little market awareness of sanitation loans
Market awareness should highlight the benefits rather the features of the
products Low awareness and support for sanitation credit within the FIs
Highlight emotional as well functional benefits
Credit Officers not motivated to sell sanitation loans as the commissions
Develop user guides for the sanitation products
are low due to low sales volumes. FIs and Credit Officers find WASH products technically complex to sell
Reassess incentive scheme for the Credit Officers
HH find latrine construction complex Develop Sanitation Business Toolkit for FIs
Market sanitation loan products with the FIs staff
Motivation Low priority given to sanitation Marketing campaigns to focus on business attitude change toward improved
Low priority for households sanitation
Long rains hamper latrine construction Tenants are not motivated to invest in sanitation as they do not make the final decision Hygiene is less of a motivator for purchase of sanitation products
Structural Readymade sanitation products are sold to institutional clients directly, not to households
MFIs should work with manufacturers to make products that consider HHs needs and benefits
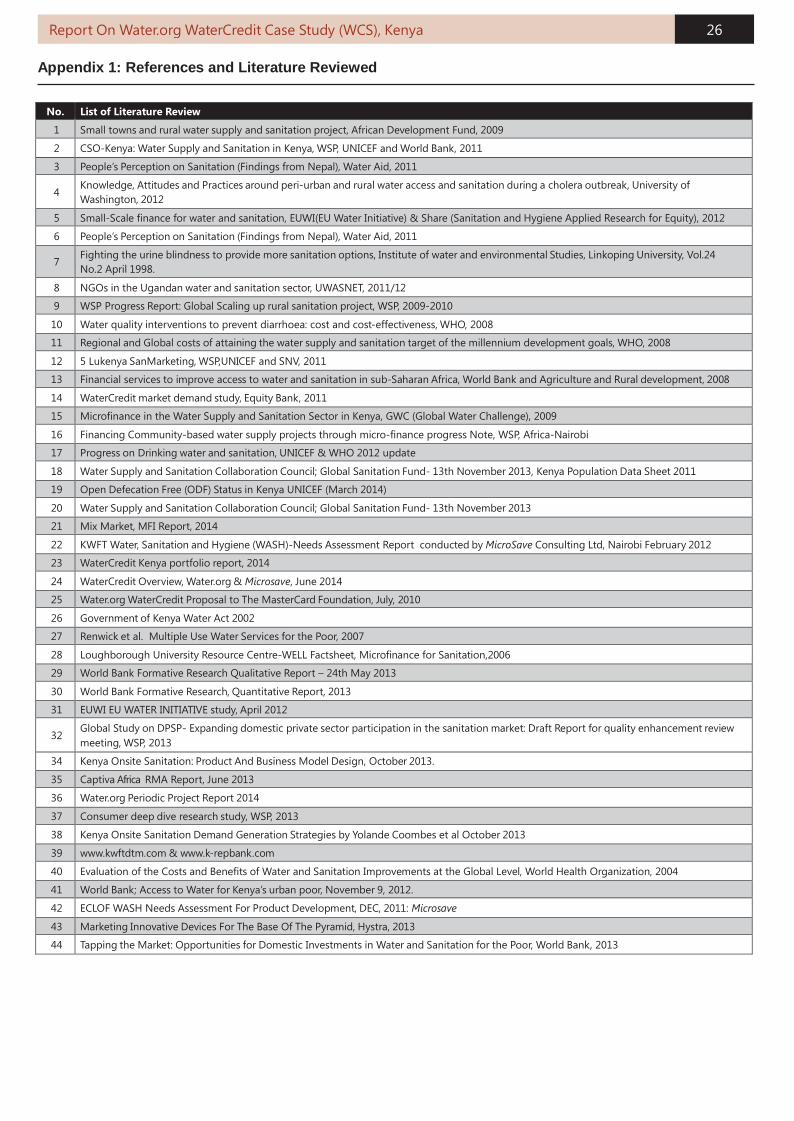
Report On Water.org WaterCredit Case Study (WCS), Kenya 26
Appendix 1: References and Literature Reviewed
No. List of Literature Review
1 Small towns and rural water supply and sanitation project, African Development Fund, 2009
2 CSO-Kenya: Water Supply and Sanitation in Kenya, WSP, UNICEF and World Bank, 2011
3 People’s Perception on Sanitation (Findings from Nepal), Water Aid, 2011
4 Knowledge, Attitudes and Practices around peri-urban and rural water access and sanitation during a cholera outbreak, University of Washington, 2012
5 Small-Scale finance for water and sanitation, EUWI(EU Water Initiative) & Share (Sanitation and Hygiene Applied Research for Equity), 2012
6 People’s Perception on Sanitation (Findings from Nepal), Water Aid, 2011
7 Fighting the urine blindness to provide more sanitation options, Institute of water and environmental Studies, Linkoping University, Vol.24 No.2 April 1998.
8 NGOs in the Ugandan water and sanitation sector, UWASNET, 2011/12
9 WSP Progress Report: Global Scaling up rural sanitation project, WSP, 2009-2010
10 Water quality interventions to prevent diarrhoea: cost and cost-effectiveness, WHO, 2008
11 Regional and Global costs of attaining the water supply and sanitation target of the millennium development goals, WHO, 2008
12 5 Lukenya SanMarketing, WSP,UNICEF and SNV, 2011
13 Financial services to improve access to water and sanitation in sub-Saharan Africa, World Bank and Agriculture and Rural development, 2008
14 WaterCredit market demand study, Equity Bank, 2011
15 Microfinance in the Water Supply and Sanitation Sector in Kenya, GWC (Global Water Challenge), 2009
16 Financing Community-based water supply projects through micro-finance progress Note, WSP, Africa-Nairobi
17 Progress on Drinking water and sanitation, UNICEF & WHO 2012 update
18 Water Supply and Sanitation Collaboration Council; Global Sanitation Fund- 13th November 2013, Kenya Population Data Sheet 2011
19 Open Defecation Free (ODF) Status in Kenya UNICEF (March 2014)
20 Water Supply and Sanitation Collaboration Council; Global Sanitation Fund- 13th November 2013
21 Mix Market, MFI Report, 2014
22 KWFT Water, Sanitation and Hygiene (WASH)-Needs Assessment Report conducted by MicroSave Consulting Ltd, Nairobi February 2012
23 WaterCredit Kenya portfolio report, 2014
24 WaterCredit Overview, Water.org & Microsave, June 2014
25 Water.org WaterCredit Proposal to The MasterCard Foundation, July, 2010
26 Government of Kenya Water Act 2002
27 Renwick et al. Multiple Use Water Services for the Poor, 2007
28 Loughborough University Resource Centre-WELL Factsheet, Microfinance for Sanitation,2006
29 World Bank Formative Research Qualitative Report – 24th May 2013
30 World Bank Formative Research, Quantitative Report, 2013
31 EUWI EU WATER INITIATIVE study, April 2012
32 Global Study on DPSP- Expanding domestic private sector participation in the sanitation market: Draft Report for quality enhancement review meeting, WSP, 2013
34 Kenya Onsite Sanitation: Product And Business Model Design, October 2013.
35 Captiva Africa RMA Report, June 2013
36 Water.org Periodic Project Report 2014
37 Consumer deep dive research study, WSP, 2013
38 Kenya Onsite Sanitation Demand Generation Strategies by Yolande Coombes et al October 2013
39 www.kwftdtm.com & www.k-repbank.com
40 Evaluation of the Costs and Benefits of Water and Sanitation Improvements at the Global Level, World Health Organization, 2004
41 World Bank; Access to Water for Kenya’s urban poor, November 9, 2012.
42 ECLOF WASH Needs Assessment For Product Development, DEC, 2011: Microsave
43 Marketing Innovative Devices For The Base Of The Pyramid, Hystra, 2013
44 Tapping the Market: Opportunities for Domestic Investments in Water and Sanitation for the Poor, World Bank, 2013

Acknowledgements
This report was commissioned by Water.org, in partnership with The MasterCard Foundation, under the auspices of the WaterCredit program which is designed to assist the poor by giving them access to loan capital to meet their water and sanitation needs.
The report was prepared by Captiva Africa LLC. Water.org is grateful to its WaterCredit partners and other stakeholders in Kenya for participating in the primary research for this study.
The conclusions and judgments contained in this report should not be attributed to, and do not necessarily represent the views of Water.org or its Board of Directors. Water.org does not guarantee the accuracy of the data in this publication and accepts no responsibility for any consequences of their use.
About Water.org
Water.org is a non-profit organization that has transformed the lives of more than a million people in Africa, South Asia, Central America and the Caribbean by providing access to safe water and sanitation. Founded by Gary White and Matt Damon, Water.org pioneers innovative solutions, such as WaterCredit to help solve the global water crisis, giving women hope, children health and communities a future.
WaterCredit by Water.org
WaterCredit is a microfinance-based solution that first began in Bangladesh in 2003 and has since expanded to India, Kenya and Uganda. Under WaterCredit, financial institutions have the flexibility to use their existing lending methodologies to develop products that finance locally appropriate WASH facilities. To date, WaterCredit loans for water access have financed network connections, protected wells and boreholes, water pumps, rain water harvesting systems, and storage tanks. Loans for sanitation access have financed toilet and latrine construction, septic tank installation and sewage networks connections.
Water.org is currently launching WaterCredit programs in Peru, Indonesia and the Philippines and is exploring potential expansion to additional countries in Latin America, Asia and Africa
Contact Details Water.org 920 Main St. Ste. 1800 Kansas City MO 64105 USA http://water.org