Watergy - Alliance to Save Energy | Using less. Doing … · 1.2 The Case for Watergy Efficiency...
142
Watergy Taking Advantage of Untapped Energy and Water Efficiency Opportunities in Municipal Water Systems
Transcript of Watergy - Alliance to Save Energy | Using less. Doing … · 1.2 The Case for Watergy Efficiency...

Alliance to Save Energy1200 18th Street, NW • Washington, DC 20036
(202) 857-0666 • fax: (202) 331-9588 email: [email protected] • Website: www.ase.org
Watergy
Wate
rgy
Takin
g A
dvan
tag
e o
f Un
tap
ped
En
erg
y a
nd
Wate
r Efficie
ncy
Op
po
rtun
ities in
Mu
nicip
al W
ate
r Syste
ms
Taking Advantage of Untapped Energy
and Water Efficiency Opportunities
in Municipal Water Systems

i
WatergyTaking Advantage of Untapped Energy
and Water Efficiency Opportunities
in Municipal Water Systems
Third Decade of Leadership

ii
The Alliance to Save Energy is a coalition of prominent business, government, environmen-tal, and consumer leaders who promote the efficient and clean use of energy worldwideto benefit consumers, the environment, the economy, and national security.
The Alliance International Program is helping to save energy around the world, workingon five continents. The International Team boasts activities in over 25 countries with nearly30 staff located in seven countries. Its programmatic work falls into six areas: Education andOutreach, NGO Development and Capacity Building, Energy Efficient Industry Partnerships,Policy Reform, Sustainable Cities Initiative, and the Municipal Water Efficiency Program.
The Alliance’s Sustainable Cities Initiative and Municipal Water Pumping Efficiencyprograms, which provide the context for this document, focus on capacity developmentat the municipal level and creating critical links among the public, private, and non-governmental organization (NGO) sectors. The efforts under way engage each of thesesectors by touting the multiple benefits of energy efficiency. By helping these sectors findcommon cause through energy efficiency, the Alliance mobilizes community-wide activityto improve the environment, reduce electricity use and costs, and improve provision ofcritical water and energy services in municipalities.
The Alliance is currently chaired by United States Senator Byron L. Dorgan and co-chaired by Dean T. Langford, former president of OSRAM Sylvania. United States SenatorJames M. Jeffords, United States Senator Jeff Bingaman, and United States RepresentativeEdward J. Markey are vice chairs. David M. Nemtzow is the President.
© Copyright 2002 Alliance to Save Energy
This publication was made possible through support provided to the Alliance to SaveEnergy by the Office of Energy, Environment, and Technology in the Economic Growth,Agriculture, and Trade Bureau of USAID, under the terms of Cooperative AgreementNumber LAG-A-00-97-00006-00. The opinions expressed herein are those of theauthors and do not necessarily reflect the views of USAID.
Cover photo: E. David Luria Photography
For more information contact:Alliance to Save Energy1200 18th St. NWSuite 900Washington, DC 20036(+1 202) 857-0666Fax (+1 202) 331-9588E-mail: [email protected]: www.ase.org
Third Decade of Leadership
Printed on 20% post-consumerwaste recycled paper

iii
Table of Contents
Preface . . . . . . . . . . . . . . . . . . . . . . . . . . . . . . . . . . . . . . . . . . . . . . . . . . . . . . . . . . . . . . . . . . v
Acknowledgments . . . . . . . . . . . . . . . . . . . . . . . . . . . . . . . . . . . . . . . . . . . . . . . . . . . . . . . . vii
Authors . . . . . . . . . . . . . . . . . . . . . . . . . . . . . . . . . . . . . . . . . . . . . . . . . . . . . . . . . . . . . . . . . viii
Foreword . . . . . . . . . . . . . . . . . . . . . . . . . . . . . . . . . . . . . . . . . . . . . . . . . . . . . . . . . . . . . . . . ix
Abbreviations . . . . . . . . . . . . . . . . . . . . . . . . . . . . . . . . . . . . . . . . . . . . . . . . . . . . . . . . . . . . . x
Conversions for Units of Measurements . . . . . . . . . . . . . . . . . . . . . . . . . . . . . . . . . . . . . . . xi
Executive Summary . . . . . . . . . . . . . . . . . . . . . . . . . . . . . . . . . . . . . . . . . . . . . . . . . . . . . . . . 1
I. Introduction . . . . . . . . . . . . . . . . . . . . . . . . . . . . . . . . . . . . . . . . . . . . . . . . . . . . . . . . . . . . 51.1 The Link between Energy and Water: “Watergy Efficiency” . . . . . . . . . . . . . . . . . . . . . . 71.2 The Case for Watergy Efficiency . . . . . . . . . . . . . . . . . . . . . . . . . . . . . . . . . . . . . . . . . . 7
2. Water Management Models . . . . . . . . . . . . . . . . . . . . . . . . . . . . . . . . . . . . . . . . . . . . . . 112.1 The Ad Hoc Approach . . . . . . . . . . . . . . . . . . . . . . . . . . . . . . . . . . . . . . . . . . . . . . . . 112.2 Single Manager Approach . . . . . . . . . . . . . . . . . . . . . . . . . . . . . . . . . . . . . . . . . . . . . 122.3 The Watergy Efficiency Team Approach . . . . . . . . . . . . . . . . . . . . . . . . . . . . . . . . . . . . 13
3. Crafting a Watergy Efficiency Team Infrastructure . . . . . . . . . . . . . . . . . . . . . . . . . . . . 173.1 The Goal of a Watergy Efficiency Team . . . . . . . . . . . . . . . . . . . . . . . . . . . . . . . . . . . . 173.2 The Formation of a Watergy Efficiency Team . . . . . . . . . . . . . . . . . . . . . . . . . . . . . . . . 173.3 Tools and Resources of a Watergy Management Team . . . . . . . . . . . . . . . . . . . . . . . . . 19
4. Building Institutional Capacity . . . . . . . . . . . . . . . . . . . . . . . . . . . . . . . . . . . . . . . . . . . . 234.1 Watergy Metering and Monitoring System . . . . . . . . . . . . . . . . . . . . . . . . . . . . . . . . . 234.2 Baselines and Metrics . . . . . . . . . . . . . . . . . . . . . . . . . . . . . . . . . . . . . . . . . . . . . . . . . 254.3 Facility Assessment . . . . . . . . . . . . . . . . . . . . . . . . . . . . . . . . . . . . . . . . . . . . . . . . . . . 254.4 Data Analysis . . . . . . . . . . . . . . . . . . . . . . . . . . . . . . . . . . . . . . . . . . . . . . . . . . . . . . . 26
5. Supply-Side Improvement Opportunities . . . . . . . . . . . . . . . . . . . . . . . . . . . . . . . . . . . . 295.1 Introduction to Supply-Side Activities . . . . . . . . . . . . . . . . . . . . . . . . . . . . . . . . . . . . . 295.2 Maintenance and Operational Practices . . . . . . . . . . . . . . . . . . . . . . . . . . . . . . . . . . . . 295.3 System Redesign . . . . . . . . . . . . . . . . . . . . . . . . . . . . . . . . . . . . . . . . . . . . . . . . . . . . 345.4 Municipal Wastewater Treatment–Specific Processes . . . . . . . . . . . . . . . . . . . . . . . . . . . 375.5 Project Implementation . . . . . . . . . . . . . . . . . . . . . . . . . . . . . . . . . . . . . . . . . . . . . . . 41
6. Demand-Side Improvement Opportunities . . . . . . . . . . . . . . . . . . . . . . . . . . . . . . . . . . . 476.1 Introduction . . . . . . . . . . . . . . . . . . . . . . . . . . . . . . . . . . . . . . . . . . . . . . . . . . . . . . . . 476.2 Demand-Side Technologies: Residential and Commercial . . . . . . . . . . . . . . . . . . . . . . . 496.3 Programs . . . . . . . . . . . . . . . . . . . . . . . . . . . . . . . . . . . . . . . . . . . . . . . . . . . . . . . . . . 536.4 Industrial . . . . . . . . . . . . . . . . . . . . . . . . . . . . . . . . . . . . . . . . . . . . . . . . . . . . . . . . . . 546.5 Policy Options . . . . . . . . . . . . . . . . . . . . . . . . . . . . . . . . . . . . . . . . . . . . . . . . . . . . . . 55
7. Conclusion . . . . . . . . . . . . . . . . . . . . . . . . . . . . . . . . . . . . . . . . . . . . . . . . . . . . . . . . . . . . 59Case Studies . . . . . . . . . . . . . . . . . . . . . . . . . . . . . . . . . . . . . . . . . . . . . . . . . . . . . . . . . . 61
Watergy Efficiency . . . . . . . . . . . . . . . . . . . . . . . . . . . . . . . . . . . . . . . . . . . . . . . . . . . 61Demand-Side Management . . . . . . . . . . . . . . . . . . . . . . . . . . . . . . . . . . . . . . . . . . . . 61Supply-Side Management . . . . . . . . . . . . . . . . . . . . . . . . . . . . . . . . . . . . . . . . . . . . . . 61
Case Study Compendium . . . . . . . . . . . . . . . . . . . . . . . . . . . . . . . . . . . . . . . . . . . . . . . . . . . 61I. Austin, United States: Watergy Efficiency . . . . . . . . . . . . . . . . . . . . . . . . . . . . . . . . . . . 62II. Stockholm, Sweden: Watergy Efficiency . . . . . . . . . . . . . . . . . . . . . . . . . . . . . . . . . . . . 65III. Sydney, Australia: Watergy Efficiency . . . . . . . . . . . . . . . . . . . . . . . . . . . . . . . . . . . . . . 67IV. Toronto, Canada: Watergy Efficiency . . . . . . . . . . . . . . . . . . . . . . . . . . . . . . . . . . . . . . 70V. Medellín, Colombia: Demand-Side Management . . . . . . . . . . . . . . . . . . . . . . . . . . . . . . 73
VI. Johannesburg, South Africa: Demand-Side Management . . . . . . . . . . . . . . . . . . . . . . . . 76VII. San Diego, United States: Demand-Side Management . . . . . . . . . . . . . . . . . . . . . . . . . . 78

Watergy
iv
VIII. Singapore: Demand-Side Management . . . . . . . . . . . . . . . . . . . . . . . . . . . . . . . . . . . . . 80IX. Accra, Ghana: Supply-Side Management . . . . . . . . . . . . . . . . . . . . . . . . . . . . . . . . . . . 83X. Ahmedabad, India: Supply-Side Management . . . . . . . . . . . . . . . . . . . . . . . . . . . . . . . . 85XI. Bulawayo, Zimbabwe: Supply-Side Management . . . . . . . . . . . . . . . . . . . . . . . . . . . . . . 87XII. Columbus, United States: Supply-Side Management . . . . . . . . . . . . . . . . . . . . . . . . . . . 89XIII. Fairfield, United States: Supply-Side Management . . . . . . . . . . . . . . . . . . . . . . . . . . . . . 91XIV. Fortaleza, Brazil: Supply-Side Management . . . . . . . . . . . . . . . . . . . . . . . . . . . . . . . . . . 93XV. Indore, India: Supply-Side Management. . . . . . . . . . . . . . . . . . . . . . . . . . . . . . . . . . . . . 96
XVI. Lviv, Ukraine: Supply-Side Management . . . . . . . . . . . . . . . . . . . . . . . . . . . . . . . . . . . . 98XVII. Pune, India: Supply-Side Management. . . . . . . . . . . . . . . . . . . . . . . . . . . . . . . . . . . . . 100
Appendix A: Water Resource Management . . . . . . . . . . . . . . . . . . . . . . . . . . . . . . . . . . . 103
Appendix B: Resources for Audits and Benchmarks . . . . . . . . . . . . . . . . . . . . . . . . . . . . . 105
Appendix C: Data Analysis: Key Players and Resources . . . . . . . . . . . . . . . . . . . . . . . . . . . 107
Appendix D: Additional Resources for Equipment Upgrades . . . . . . . . . . . . . . . . . . . . . . 111
Appendix E: DSM/Policy Options and Other Resources . . . . . . . . . . . . . . . . . . . . . . . . . . 115
Appendix F: Sample Watergy Fact Sheets . . . . . . . . . . . . . . . . . . . . . . . . . . . . . . . . . . . . . 117
Glossary . . . . . . . . . . . . . . . . . . . . . . . . . . . . . . . . . . . . . . . . . . . . . . . . . . . . . . . . . . . . . . . 125
References. . . . . . . . . . . . . . . . . . . . . . . . . . . . . . . . . . . . . . . . . . . . . . . . . . . . . . . . . . . . . . 131
Index of Major Terms . . . . . . . . . . . . . . . . . . . . . . . . . . . . . . . . . . . . . . . . . . . . . . . . . . . . . 135
Endnotes . . . . . . . . . . . . . . . . . . . . . . . . . . . . . . . . . . . . . . . . . . . . . . . . . . . . . . . . . . . . . . 137
List of Tables and Figures
Figure 1: Description of Watergy . . . . . . . . . . . . . . . . . . . . . . . . . . . . . . . . . . . . . . . . . . . 5
Table 1: Watergy Efficiency Management Structures. . . . . . . . . . . . . . . . . . . . . . . . . . . . 11
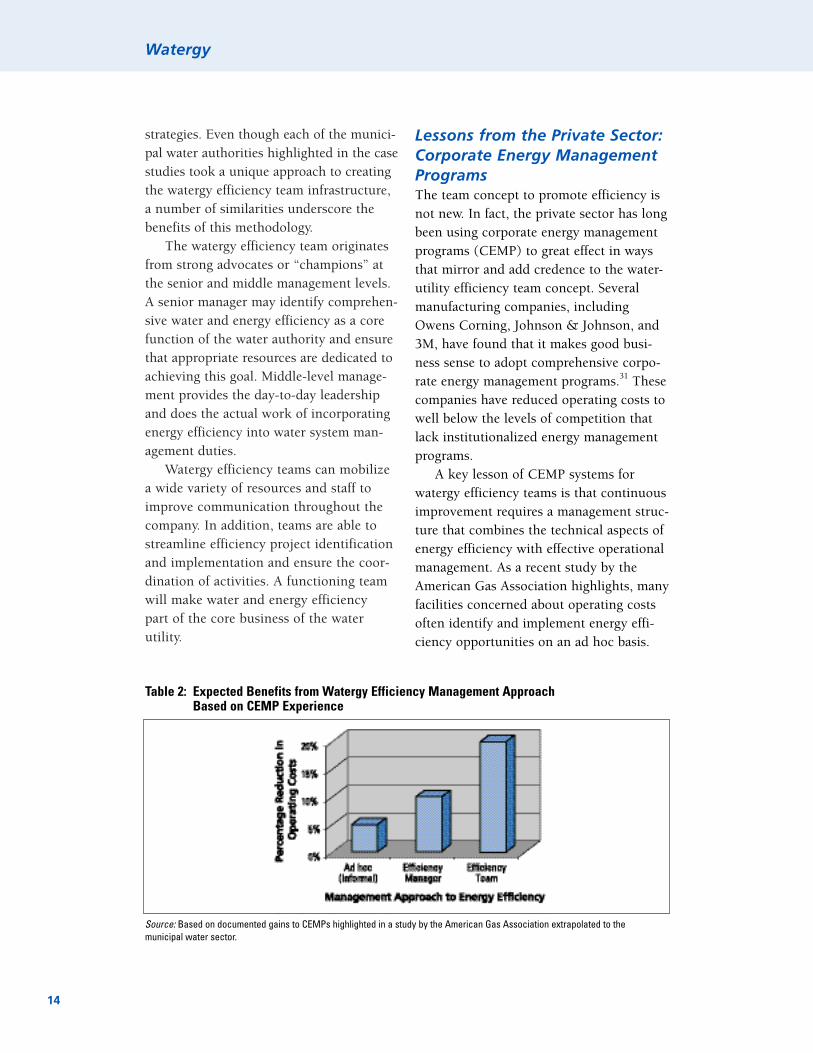
Table 2: Expected Benefits from Watergy Efficiency Management Approach Based on CEMP Experience . . . . . . . . . . . . . . . . . . . . . . . . . . . . . . . . . . . . . . . 14
Table 3: Human Resources Required for Watergy Efficiency Team . . . . . . . . . . . . . . . . . . 18
Table 4: Watergy Efficiency Performance Measurements . . . . . . . . . . . . . . . . . . . . . . . . . 24
Table 5: Typical Metrics for Tracking Watergy Efficiency. . . . . . . . . . . . . . . . . . . . . . . . . . 25
Figure 2: Water Accounting System . . . . . . . . . . . . . . . . . . . . . . . . . . . . . . . . . . . . . . . . 31
Table 6: Water-Saving Devices for Existing Houses . . . . . . . . . . . . . . . . . . . . . . . . . . . . . 52
Table 7: Water-Saving Devices for New Construction . . . . . . . . . . . . . . . . . . . . . . . . . . . 52
Table 8: Most Common Efficiency Measures by Business and Industry . . . . . . . . . . . . . . . 55
Table 9: Air Pollution Produced per 1,000 Gallons (3,785 Liters) Treated in Austin, Texas . . . . . . . . . . . . . . . . . . . . . . . . . . . . . . . . 62
Figure 3: Empresas Públicas de Medellín Average Residential Consumption Levels . . . . . . . . . . . . . . . . . . . . . . . . . . . . . . 74
v
Preface
The Alliance to Save Energy is pleased to publish Watergy: Taking Advantage of UntappedEnergy and Water Efficiency Opportunities in Municipal Water Systems. This document isthe result of a yearlong effort that has sought to draw on the experience of municipalwater utilities around the world. It highlights the innovative ways water utilities arereducing their energy use at the same time that they are being asked to increase andimprove service.
The recommendations contained within this document offer a new perspective on therelationship between water and energy. By linking the management of water and energyresources, water utilities have the potential to increase the efficiency in which these twocritical resources are employed. The potential benefits to individuals around the worldfrom improving the management of water and energy resources range from cleaner air toimproved economic opportunity to better utility service for lower costs.
It is our hope that this document will attract the attention of decision makers chargedwith the management of water resources in many parts of the world, as well as here athome. We certainly look forward to future examples of “watergy efficiency” innovationsthat this work may inspire and that may lead us all toward a more efficient, productive,and sustainable world.
Honorable Byron L. Dorgan Dean T. LangfordChair Co-Chair

The Alliance to Save Energy gratefullyacknowledges the efforts of all those whoplayed a part during the many stages ofthis document’s development. Many indi-viduals made valuable contributions to thefinal product during the initial conceptualphases, development of the case studies, aswell as in the final review process.
The U.S. Agency for International Devel-opment (USAID) provided financial supportfor this project. Griffin Thompson, Ph.D.,Director of USAID’s Office of Energy, Envi-ronment, and Technology in the EconomicGrowth, Agriculture, and Trade Bureau,Sharon Murray, Ph.D., Regina Ostergaard-Klem, Ph.D., and Robert MacLeod supporteddevelopment of the concept and gave feed-back at various stages in the writing process.
Additional support for this documentwas provided by the more than 70 Allianceto Save Energy Associates—corporations andbusiness trade associations working togetherthrough the Alliance to promote greaterinvestment in cost-effective energy efficiency.
Those taking part in the review processmade equally important observations onthis work’s relevance, both in the developedand developing world context. Reviewersincluded Linda Reekie (Awwa ResearchFoundation), Mary Louise Vitelli (AdvancedEngineering Associates International[AEAI]), Dr. Allan R. Hoffman (Office ofPower Technologies, United States Depart-ment of Energy), Professor EduardoPacheco Jordão (School of Engineering,Federal University of Rio de Janeiro[UFRJ]), Jimmy Ng (New York State EnergyResearch and Development Authority[NYSERDA]), Cliff Arnett (Columbus WaterWorks), Sandeep Tandon (USAID/India),S. Padmanaban (USAID/India), CaptainVon Millard (U.S.-Asia EnvironmentalPartnership/India), Carol Mulholland(Academy for Educational Development),Amit Bando (Chemonics), Dr. AhmadGhamarian (Institute of InternationalEducation), and Carl Duisberg (Nexant).
An important part of this work includesthe case study compendium, which dis-cusses actual water and energy efficiency
projects in depth. Alliance staff workedclosely with many of the following individ-uals to document these projects. Thosecontributing to this section included BillHoffman (City of Austin Water andWastewater Utility); Berndt Björlenius(Stockholm Water Company); John Petre(Sydney Water Corporation); Joe Boccia,Roman Kaszczij, Leonard Lipp, and TracyKorovesi (Toronto Water Utility); JuanCarlos Herrera Arciniegas (EmpresasPúblicas de Medellín); Karin Louwrens,Grant Pearson (Rand Water, South Africa);Michael Scahill and Jesse Pagliaro (SanDiego Metropolitan Wastewater Depart-ment); Ng Han Tong (Public UtilitiesBoard, Singapore); Ramesh Juvekar (PrimaTechno Commercial Services, India);Dr. A. K. Ofosu-Ahenkorah (Ghana EnergyFoundation); Jeff Broome (Bulawayo CityCouncil); Cliff Arnett (Columbus WaterWorks); Drew Young (Fairfield WastewaterTreatment Facility); Edinardo Rodriguesand Renato Rolim (Companhia de Água eEsgoto do Ceará [CAGECE]); Mayor KailasVijaywargiya, Commissioner SanjayShukla, and R. K. Singh Kushwah (IndoreMunicipal Corporation); Kris Buros (CH2MHill/Lviv, Ukraine, Vodokanal project); andAshok Deshpande (Pune MunicipalCorporation).
Alliance to Save Energy President DavidNemtzow and Vice-President Mark Hopkinsboth provided direction and technical inputinto this document. Leslie Black-Cordes,Sachu Constantine, and Joe Loper of theAlliance also contributed significantly toconcept development, as well as providedfeedback at different stages during thewriting process. Other Alliance staff thatcontributed in many different ways to thedevelopment of this work include LauraLind, David Jaber, James Termin, SwarupaGanguli, Estelle Bessac, and MadhuSundararaman.
Pamela S. Cubberly, Cubberly &Associates, provided editorial assistance.EEI Communications provided designand layout support.
vii
Acknowledgments

Kevin JamesMr. James, Senior Program Manager forthe Alliance to Save Energy, works to buildthe capacity within municipalities, utilities,and industries to recognize and take ad-vantage of energy efficiency opportunities.He manages the Alliance’s SustainableCities and the Municipal Water EfficiencyPrograms. Mr. James has authored severalreports and articles covering among othertopics—tracking energy use and air emis-sions and outlining efficiency opportunitiesin the industrial sector. He holds a master’sdegree in Public and International Affairsfrom the University of Pittsburgh and abachelor’s degree in political science fromBates College in Lewiston, Maine.
Stephanie L. CampbellMs. Campbell, Senior Program Associatefor International Programs, has threeyears of experience in the research, promo-tion, and development of energy efficiencyprojects. Ms. Campbell helps manage theMunicipal Water Efficiency Program activi-ties in Brazil. Ms. Campbell also acts as theLatin America Regional Coordinator forthe Collaborative Labeling and ApplianceStandards Program (CLASP), a global ini-tiative designed to expand the implementa-tion of energy efficiency standards andlabels. Her activities focus on institutionalcapacity building initiatives, coordinationof regional workshops, and preparation ofpolicy and regulatory guidance. She joinedthe Alliance after completing her master’sdegree in Environmental Management atYale University.
Christopher E. GodloveMr. Godlove, Program Associate forInternational Programs, has over five yearsof experience developing internationalenergy and environment activities. At theAlliance Mr. Godlove supports the Sus-tainable Cities’ programs in India andBrazil, working with water utility partnersto improve the water and energy efficiencyof their operations. Prior to joining theAlliance Mr. Godlove managed environ-mental training initiatives with the U.S.Environmental Training Institute (USETI),working in Central and Eastern Europe,Asia, and Latin America. This workfocused on the development of USAID,USDOC, and USEPA public-private part-nership activities addressing environmentalchallenges globally. Mr. Godlove holds amaster’s degree in Latin American Studiesfrom American University, and a bachelor’sdegree in Spanish Literature fromWashington University in Saint Louis.
viii
Authors

ix
Foreword
The initial concept for this report devel-oped around the Alliance’s work withmunicipal water utilities in India andBrazil. The Alliance was originally drawnto the municipal water sector in these twocountries because of the tremendouspotential for energy savings. The signifi-cant results and lessons learned throughthis work provide the impetus and thefoundation for this report.
As part of its ongoing programs in Indiaand Brazil, the Alliance began to researchthe experiences of other municipalitiesaround the world. The goal of this effortwas to identify best practices promotingenergy and water efficiency. It became clearthat the same opportunities for energy andwater efficiency in India and Brazil werecommon not only in other developingcountries, but also in countries in transi-tion and the developed world.
As the Alliance researched success sto-ries to share with municipalities in Indiaand Brazil, it became apparent that firstand foremost the key to success of each
effort was good management. An examina-tion of all the commonalities among man-agement structures of water and energyefficiency programs provided the founda-tion for the concepts in this report.
The Alliance to Save Energy in its mis-sion to save energy around the world hasfound the energy intensive municipal watersector to be fertile ground for sowing theseeds of energy efficiency. This report, aspart of the Alliance’s comprehensive effortto propagate energy efficiency, seeks to:
� Advocate for improving municipalwater utility management structures tofacilitate energy efficiency actions;
� Educate municipalities and the globalcommunity on the potential benefits ofsaving water and energy in water utili-ties and methods to accomplish thisaim; and
� Solicit thoughts and ideas from a wideraudience on how best to take advantageof the opportunity for energy savings inmunicipal water utilities.

x
AMC Ahmedabad Municipal Corporation
ASD adjustable speed drive
CAGECE Companhia de Água e Esgoto do Ceará
CEMP corporate energy management program
CII Confederation of Indian Industry
EEPPM Empresas Públicas de Medellín
EMC energy management cell
EPRI Electric Power Research Institute
ESCO energy service company
gpcd gallons per capita per day
GWC Ghana Water Company
IAMU Iowa Association of Municipal Utilities
IMC Indore Municipal Corporation
kgf/cm2 kilogram-force per square centimeter
kVA one thousand volt-amps
kVAR one thousand volt-amps reactive power
kW kilowatt
KWh kilowatt-hour
MWWD Metropolitan Wastewater Management Department
NAESCO National Association of Energy Service Companies
NGO nongovernmental organization
NSW New South Wales
O&M operation and maintenance
PID proportional, integral, derivative
PMC Pune Municipal Corporation
PSAT Pumping System Assessment Tool
PSI pounds per square inch
PUB Public Utilities Board
SCADA Supervisory Control and Data Acquisition
SEWA Self-Employed Women’s Association
UFW unaccounted-for water
USAID United States Agency for International Development
UV ultraviolet
VFD variable frequency drive
Abbreviations

xi
1 inch (in) = 2.54 centimeters (cm) = 25.4 millimeters (mm)
1 foot (ft) = 30.5 centimeters (cm) = 0.305 meters (m)
1 yard (yd) = 36 inches (in) = 0.914 meters (m)
1 mile (mi) = 5,280 feet (ft) = 1.61 kilometers (km)
1 square yard (yd2) = 9 square feet (ft2) = 0.836 square meters (m2)
1 acre (ac) = 43,560 square feet (ft2) = 0.405 hectares (ha) = 4,050 square meters (m2)
1 square mile (mi2) = 640 acres (ac) = 259 hectares (ha)
1 cubic foot (ft3) = 7.48 gallons (gal) = 28.3 liters (l)
1 cubic yard (yd3) = 27 cubic feet (ft3) = 202 gallons (gal) = 0.765 cubic meters (m3)
1 gallon (gal) = 0.137 cubic feet (ft3) = 8.33 pounds (lbs) water = 3.78 liters (l)
1 acre-inch (ac-in) = 3,630 cubic feet (ft3) = 27,154 gallons (gal) = 102.8 cubic meters (m3)
1 acre-foot (ac-ft) = 43,560 cubic feet (ft3) = 325,851 gallons (gal) = 1,234 cubic meters (m3)
1 pound (lb) = 454 grams (g) = 0.454 kilograms (kg)
1 ton (ton) = 2,000 pounds (lbs) = 907 kilograms (kg) = 0.907 megagrams (Mg)
1 pound per acre (lb/ac) = 1.12 kilograms per hectare (kg/ha)
1 cubic foot per second (cfs) = 449 gallons per minute (gpm) = 28.32 liters per second (l/s)
1 million gallons per day (MGD) = 1.55 cubic feet per second (cfs) = 3,785 cubic meters per day (m3/day)
1 milligram per liter (mg/l) = 1 part per million (ppm) = 1,000 parts per billion (ppb)
1 pound per square inch (psi) = 2.04 inches mercury (in Hg) = 27.7 inches water (in H2O)
1 Quad = 1015 BTU
Conversions for Units of Measurements

1
Between 2 and 3 percent* of the world’senergy consumption is used to pumpand treat water for urban residents andindustry.1 Energy consumption in mostwater systems worldwide could bereduced by at least 25 percent throughcost-effective efficiency actions.2 Waterutilities globally have the potential to cost-effectively save more energy than theentire country of Thailand uses annually.3
Unfortunately, relatively little attention hasbeen given to reducing energy use inmunicipal water systems.
Energy costs draw precious budgetaryresources from other important municipalfunctions such as education, public trans-portation, and health care. In the develop-ing world, the cost of energy to supplywater may easily consume half of a munic-ipality’s total budget. Even in developedcountries’ municipal water systems,energy is typically the second largestcost after labor.
The burning of fossil fuels to generatethe energy used to supply water affectslocal and global air quality. Emissionsfrom power plants contribute to alreadyhigh levels of pollutants in the urbanenvironment and the acidification of lakesand forests. In addition, millions of tonsof carbon dioxide are emitted every year,contributing to global climate change.Global climate change has the potentialto reduce water tables and disrupt watersupplies in many areas, making watereven more costly and energy intensiveto obtain in the future.
Some Utilities Are Leadingthe WaySome municipal water managers in citiessuch as Austin, United States; Toronto,Canada; Stockholm, Sweden; and Sydney,Australia are aggressively taking advantageof opportunities to save energy in theirfacilities. The Alliance to Save Energy iden-tified more than 30 municipalities imple-menting a range of simple, cost-effectiveactions to reduce energy use, while main-taining or even improving service.
The Alliance has worked with severalmunicipalities in the past five years learn-ing about both the potential opportunityfor energy savings and the difficulties inachieving them. Fortaleza, Brazil, hasdramatically reduced total energy use by5 MW in its first year after adopting energyefficiency goals, while actually increasingservice connections. The city of Indore,India, was able to save 1.6 million rupees(US$35,000) within the first three monthsof action with no investment cost just byimproving the way existing pumps workedtogether. The city of Pune, India, quicklyidentified more than 7 million rupees(US$150,000) of energy savings opportu-nities after kicking off an energy efficiencyprogram but has only managed to imple-ment one-fifth of the projects.
* About 8 Quads (1 Quad = 1015 BTU)
Executive Summary
Watergy: energy used in water systems
Watergy efficiency: optimizing energy use to cost-effectively meet water needs
Energy consumption in most watersystems worldwide could be reduced
by at least 25 percent throughcost-effective efficiency actions

The utilities we have identified standin stark contrast to the vast majority ofmunicipal water utilities around the worldthat have not taken basic measures toreduce energy use. Water system managersfrequently do not have the technicalknowledge or capacity needed to tacklethe numerous efficiency opportunities. Inmany cases, they lack the necessary meter-ing and monitoring systems to collect data,establish baselines and metrics, and con-duct facility assessments. Often when datado exist, they are not shared among depart-ments and groups within a municipalwater utility.
Blueprint for SuccessThis report outlines the elements of a“watergy efficiency” system optimizingenergy use to cost-effectively meet waterneeds. These elements reflect many of theapproaches taken by the water utilitiesoutlined in the case studies boasting themost comprehensive programs.
Utilities employing cross-cuttingteams have found that additional energyand capital savings can be achieved whenthey analyze potential water delivery sys-tem improvements while simultaneously
promoting more efficient water use bycustomers. In some instances, reducing theconsumer’s demand for water may allow forreductions in the capacity needs of pumpsand pipes.
Critical steps in building the capacityof the team include supplying the tools tometer and monitor energy and water use,training in energy efficiency techniques,and providing adequate resources to investin identified projects.
Many worthwhile energy efficiencyactions can be completed for little or nocost. In fact, installing metering and moni-toring systems can save ten percent ofenergy costs simply through behavioralchanges and improved maintenance. Whilesome simple improvements can easily bedetected just by metering, many oppor-tunities will remain unexploited withoutfurther analysis of data. Many utilities havefound benchmarking similar systems with-in their own operations to be an excellentway to measure energy efficiency progress.
For larger projects, investment capitalis commonly a key stumbling block.Finding funds to implement more costlyefficiency projects can often be foundthrough savings resulting from other
Watergy
2
Expected Efficiency Gains by Water Utility Management Approach to Energy Efficiency

3
Executive Summary
“watergy” efficiency actions such as reduc-ing water waste and theft, improving basicmaintenance practices, reducing subsidies,and optimizing system performance.
Identifying OpportunitiesSome of the specific water system energysaving opportunities are easy to identify,such as leaks and malfunctioning equip-ment. Other energy saving actions aremore difficult to detect, such as impropersystem layout or degraded pipes.
Common problems include: � Leaks� Low c-value for pipes (high level
of friction inside pipes)� Improper system layout� System overdesign� Incorrect equipment selection � Old, outdated equipment� Poor maintenance � Waste of usable water.
Remedies may involve: � System redesign and retrofitting of
equipment� Pump impeller reduction� Leak and loss reductions� Equipment upgrades� Low-friction pipe� Efficient pumps� Adjustable speed drive motors� Capacitors � Transformers� Maintenance and operation practices
improvements� Water reclamation and reuse.
Water utilities often overlook thepotential of saving energy and money byreducing the water consumption of theircustomers. Helping customers do more
with less water, using technologies such aslow-flush toilets, low-flow showerheads,and energy efficient washing machines isoften the most cost-effective way to saveenergy.
This Problem Is Not Going Away The urban population of the world isexpected to double within the next40 years.4 If we continue on the currentpath, energy consumption by municipalwater utilities will double as well. Onlyhalf of urban dwellers currently havewater connections. Energy prices arerising. Water resources are dwindling atthe same time that urban populationsare swelling. Municipal water utilities,customers, politicians, the environment,and just about everyone else will paythe price for continued waste. Municipalwater utilities therefore have a powerfulincentive to pursue the potential ofwatergy efficiency.

4
2. Water Management Models
A tremendous amount of energy is used to provide water services globally.• Energy consumed worldwide for delivering water—more than 26 Quads (1 Quad = 1015
BTU)—approximately equals the total amount of energy used in Japan and Taiwancombined, on the order of 7 percent of total world consumption.5
• In the United States, the water and wastewater sector annually consumes 75 billion kWh—3 percent of the total consumption of electricity6 or equal to the total electricityconsumed by the pulp and paper and petroleum sectors.7
Water is becoming scarcer, often making it more energy intensive to procure.• Less than 1 percent of the world’s freshwater—about 0.008 percent of all water on earth—
is readily accessible for direct human use.8
• Average annual global renewable water resources equaled 7,045 m3 per person in theyear 2000,9 a drop of 40 percent per person since 1970, due to growing worldpopulation.
• Twenty countries (most of them in Africa and the Middle East) suffer chronic water scarcity,causing severe damage to food production and stunted economic development.10
• More energy is required to pump water greater distances and from deeper in the ground.
Major segments of the urban population are not getting adequate service.• The average city only provides electricity connections to about 85 percent of urban
households11 and may lack sufficient energy supplies to meet existing demand.
• Only about half of urban dwellers in developing countries currently have waterconnections in their homes and more then one-quarter have no access to safe drinkingwater.12
• To reach universal coverage by 2025, almost 3 billion people need to be linked withwater supply and more than 4 billion with sanitation.13
• Low-income urban dwellers not connected to water systems often must turn toalternative supplies, such as water vendors who may charge 16 times or more than theformal piped water tariff.14
Urban demand for both water and energy resources is expected to grow dramatically.• Energy use world-wide is expected to grow by more than 60 percent over the next 20
years.15
• By 2020 more than 50 percent of the population in developing countries will be urban.16
• The total electricity consumption of the water and wastewater sectors will grow globallyby a predicted 33 percent in the next 20 years.17
• Global water consumption grew sixfold between 1900 and 1995.18
• In 2025 one-third of the global population is expected to live in chronic water shortageareas.19
To help meet the water and energy resource needs, municipalities can reduceenergy and water waste.• Municipal water utilities alone can cost-effectively save more energy (on the order of 2.5
Quads) than the entire country of Thailand consumes in a year through simple efficiencysteps.20
• Eliminating unaccounted-for water (leaks, theft, etc.) in many large cities in developingcountries would more than double the amount of water available for delivery21 anddrastically reduce energy use.
B A S I C G L O B A L W A T E R G Y F A C T S
©20
02,
CO
RB
IS

In their role as water providers for almost50 percent of the world’s population,municipal water utilities play a vital rolein managing this often-scarce resource. Asglobal urbanization continues, municipalwater utilities have the complex task ofcost-effectively providing water to keepcities functioning. Limited energyresources, sparse freshwater supplies, andmounting environmental concerns makewater delivery even more challenging.
Most water utilities in the world neithermaximize the benefits of energy and waterresources, nor minimize their negativeenvironmental impacts. By creating andempowering comprehensive “watergy” effi-ciency management structures, municipalwater utilities can cost-effectively providewater services, reduce energy consump-tion, and protect the environment.
The term “watergy” is used in thispaper to describe the linkage that existsbetween water and energy in the context of
municipal water utilities. This linkage ofwater and energy exists given the part thatenergy plays in conveying water to the enduser as well as its role in potable water dis-infection and wastewater treatment. Whenwater is wasted in a municipal water sys-tem, energy is almost always squandered aswell. See figure 1 for a pictorial descriptionof this relationship.
For this discussion, “watergy efficiency”means cost-effectively providing the con-sumer with the desired services associatedwith water, while using the least amountof water and energy possible. “Watergyefficiency” encompasses the spectrum ofwater efficiency activities, energy efficiencyactivities, and resulting synergies fromcomanaging water and energy resources.By understanding all of the existing link-ages between water and energy within awater delivery system, water utilities havea tremendous opportunity to adapt theirpolicies and practices to improve efficiency
5
I. Introduction
Figure 1: Description of Watergy

compared with simply addressing waterand energy needs separately.
The need for maximizing the potentialof existing water and energy resources iscritical. The average amount of renewablewater* per person in the world hasdropped by 40 percent since 1970, duemainly to increases in population.22 Twentycountries, most of them in Africa and theMiddle East, currently face chronic watershortages that severely disrupt economicdevelopment. This number will more thandouble in the next 25 years, as more thanthree billion people around the world willlack access to safe, adequate water sup-plies.23 Many of these same countries facesimilarly crippling energy shortages thatdisrupt business and lives. In fact, on theorder of 7 percent of worldwide energyproduction is used to pump water.
Municipalities are important actors inefforts to improve the efficient utilizationof water and energy. By the year 2020,more than half of the developing worldpopulation is expected to live in cities.24
With increased urban populations andgrowing municipal industrial sectors, theamount of water and energy use will growsteadily. Furthermore, although the propor-tion of water consumed by the agriculturalsector currently represents 70–80 percentof water use worldwide, urban and indus-trial users will continue to place ever-greater demands on increasingly scarcewater resources.
The potential for watergy efficiencyimprovements is tremendous. In India,for example, the Confederation of IndianIndustry (CII) estimates that the typical
Watergy
6
* The amount of renewable water over a period of timeat a specific location corresponds to the quantity of waterthat is naturally replaced in that same timeframe throughnatural processes, such as rain, runoff, or snowmelt.
Indian municipal water utility has thepotential to improve water system efficiencyby 25 percent.25 Because many municipalwater utilities in India spend upward of 60percent of their energy budgets for waterpumping, this significant savings could beused to improve service. Based on a recentstudy of watergy efficiency opportunities inTexas (see page 9) water utilities in theUnited States could easily reduce 15 per-cent of total electricity use, saving almostUS$1 billion. Latin Americans spend US$1to $1.5 billion annually just to pump waterthat never reaches the end user due to sys-tem leaks, theft, and faulty equipment.Coincidently, US$1 to $1.5 billion is alsothe amount needed annually to providewater and sanitation services to all LatinAmerica’s currently unserved citizens.26
This document includes seven sections:1. Section One defines the concept of
watergy efficiency and justifies theneed for efficient water and energyresource management.
2. Section Two lists various water andenergy efficiency management modelsused by municipalities.
3. Section Three describes how to craftan efficient watergy managementstructure.
4. Section Four reviews the process fordeveloping the appropriate institu-tional capacity to carry out watergyefficiency actions.
5. Sections Five and Six outline stepsmunicipalities can take to addressefficiency opportunities on both thesupply side and demand side.
6. Section Seven presents the report’sconclusion.
Following Section Seven, a case studycompendium outlines the watergy efficien-cy activities of 17 cities around the world.

1. Introduction
Appendixes A–F list additional technicalresources.
Although this document is a resourcefor building appropriate water efficiencyprograms, it is not a blueprint. Because theproblems and resources of each municipalwater authority are unique, the best prac-tices and case studies described must beadapted to fit the realities of a givensituation. For example, vast differencescan occur among existing infrastructure,financial resources and other aspects ofwater utilities in developing and developedcountries; however, many of the basic prin-ciples covered in this report are equallyapplicable. In addition, the report does notdistinguish between public and privatemanagement structures, but instead isintended to deliver information valuable toany variant of public and private deliverysystems.
1.1 THE LINK BETWEENENERGY AND WATER:“WATERGY EFFICIENCY”In the process of improving overall watersystem efficiency, municipal water authori-ties should view energy and water con-sumption as linked inputs, rather thanviewing them as separate and unrelated.Energy is necessary for moving waterthrough municipal water systems, makingwater potable, and removing waste fromwater. Each liter of water moving througha system represents a significant energycost. Water losses in the form of leakage,theft, consumer waste, and inefficientdelivery all directly affect the amount ofenergy required to deliver water to theconsumer. Wastage of water regularlyleads to a waste of energy.
Activities undertaken to save water andthose to save energy can have a greater
impact when they are planned together.For example, a leak reduction programalone will likely save water and reducepressure losses leading to energy savingsfrom reduced pumping demand. Replacinga pump with a more efficient one by itselfwill likely save energy. If the two are coor-dinated together through a watergy effi-ciency program, the reduction in pressurelosses from leaks will allow smaller pumpsto be purchased for the upgrade than oth-erwise possible, saving additional energyand money.
1.2 THE CASE FORWATERGY EFFICIENCYIncentives for municipal water authoritiesto improve water efficiency include lower-ing costs, ensuring energy and water secu-rity, and reducing environmental impacts.
The Most Cost-Effective OptionWatergy efficiency is often the most cost-effective way to improve water deliveryservices to existing consumers and at thesame time meet the needs of growing pop-ulations. Comprehensive water efficiencyefforts reduce costs, increase the service
7
Case Study of Indore Municipal Corporation
In the 1970s the Indore Municipal Corporation in Indore,India, built an expensive 70 km water line over a moun-tain to deliver additional water resources to meet anexpected increase in demand from a growing population.The actual population increase, however, far exceededanticipated growth, and Indore is again facing a watershortage. Additional capacity will take years and cost mil-lions of rupees to bring on line. New capacity would alsohave a significant impact on the availability of electricityresources in Indore for years to come. Efficiency effortswith immediate impact are now under way to try to getmore benefit from existing resources. Had Indore plannedfor efficiency from the outset, its capital investmentsmight still be adequate to serve city needs.
capacity of the existing system, andimprove customer satisfaction.
Cities can provide additional water forgrowing consumption by installing newcapacity, although this has sustainabilityimplications, as natural water supplies fromany source are finite. The other option is toget more from existing capacity by imple-menting water utility efficiency programs.For example, many municipal water utili-ties in developing countries typically havesystem water losses between 30 and 60percent. Even many municipalities indeveloped countries see water lossesbetween 15 and 25 percent.27
Toronto estimates that saving waterthrough its efficiency program costs one-third less than developing new capacity.By choosing to focus on efficiency, the Cityof Toronto has chosen to maintain andimprove the benefits consumers currentlyreceive, while minimizing costs.28
Ensuring AdequateEnergy SupplyThe energy savings realized through waterefficiency can play a significant part inensuring an adequate supply of energy forthe entire municipality. Many municipali-ties throughout the world currently eitherface energy shortages or will in the nearfuture. Generating new power suppliestakes large amounts of time and money.Because water systems use a significantamount of energy, municipalities canquickly help reduce the potential forenergy shortfalls and the need for expen-sive new energy infrastructure throughwatergy efficiency.
In the central and northern parts ofBrazil, for example, low rainfall createda crisis situation for electricity supply in
2001 by limiting available power fromhydroelectric plants. The City of Fortalezain the northeast State of Ceará facedpotential blackouts due to an estimated20 percent electric power shortfall. In aneffort to reduce the impact of the electrici-ty shortage, the state identified Fortaleza’swater utility as a major potential source ofelectricity demand reductions. The waterutility is a key player in Ceará’s efforts,both because it is one of the largest elec-tricity consumers and because it holds somany opportunities to reduce electricityuse rapidly through efficiency.
Maintaining SufficientWater SuppliesAs many municipalities around the worldface water shortages, watergy efficiencywill become an even more important toolin ensuring the availability of water.
More than 40 percent of the world’spopulation currently lives in water-stressedareas; this percentage is likely to increaseto 50 percent by the year 2025, as demandfor water grows. Municipalities in particu-lar have seen an increase in water demand,due mostly to population growth, burgeon-ing rural to urban migration, and industri-alization.29 Many municipalities are findingit harder to secure adequate sources ofwater to meet this growing demand.
Watergy efficiency is one of the majortools municipalities have to maintainwater supplies large enough to meetdemand. Reducing system water lossesand waste can have the same effect asincreasing supply: more water is availableto go to the consumer. In addition, waterutilities can help ensure municipal watersupplies by working with consumers toget more benefit from each unit of water
Watergy
8

1. Introduction
used through water-efficient technologiesand reduced waste.
Minimizing EnvironmentalImpactsMunicipal water authorities must not onlyconsider financial and resource securitybenefits resulting from using water moreefficiently, but also need to recognize the
environmental risks from energy use andoverharvesting of water resources.
Energy is predominantly produced byburning fossil fuels, such as coal, oil, andnatural gas, which, when burned, releasehigh quantities of sulfur dioxide (SO2),nitrogen oxides (NOx), carbon dioxide(CO2), carbon monoxide (CO), particulates,mercury, and other dangerous pollutants.
9
The Scope of the Opportunity: The Case of the State of Texas, United States
Fact:By striving to achieve very modest efficiency targets, Texas could not only improve its water resourcesituation, but could also plan on saving at least 1.6 billion kWh and 7 billion ft3 (200 million m3) of gasannually in a very cost-effective manner.
Texas, located in the southern United States, has a relatively dry climate and limited water resources.It encompasses 261,914 square miles and is home to 20.1 million people. To address its burgeoning waterneeds, the state has taken an aggressive approach to water efficiency. In spite of this, huge opportunities stillexist for municipalities in this state to save water and reduce energy usage
Overview of Municipal Water Utilities in Texas• Water utilities in Texas use 2.5 kWh –4.0 kWh per 1,000 gal pumped (.66 kWh–1.05 kWh per 1,000 liters).• Nearly 3.0 billion gal of treated water is delivered for municipal and industrial purposes.• Total electricity usage for water delivery is 2.8–4.8 billion kWh a year.• Water authorities spend $180–288 million yearly for electricity.• The electricity needed to produce chlorine and other water and wastewater treatment chemicals is
equal to an additional 0.02–0.10 kWh per 1,000 gal of water used (0.005 to 0.028 kWh per 1,000 liters).
Potential Energy and Water Savings by Sector
Water UtilitiesBy reducing water utility losses by an amount equal to 5 percent of water distributed, Texas could save140–240 million kWh of electricity annually with a cost savings of approximately US$9–$14 million. Energyefficiency improvements of 10 percent in the delivery system could save an additional 300 million kWh.
ResidentialStudies conducted in Texas and supported by other sources document the opportunity for reductions of10–20 percent in residential hot water usage. This is possible through programs such as retrofitting ofshowerheads, installing faucet aerators, promoting efficient appliances, and so on. By promoting thesetechnologies, Texas could save annually 1 billion kWh of electricity, 7 billion ft3of gas, and US$21 million.
Industrial
The industrial sector currently uses 2.8 billion gal (10.6 billion liters) of water daily and has pumping andtreating energy requirements of 0.5–2.0 kWh for every 1,000 gallons used (0.13 kWh–0.53 kWh per 1,000liters). Reducing this amount by even 10 percent would save around 100 million kWh per year.
Source: Texas Water Development Agency, no date, Relationships between Water and Energy Use inTexas, unpublished.

Emissions of SO2 and NOx from burningfossil fuels are specifically responsible formany urban air quality problems. Burningof coal remains one of the most prolificsources of mercury contamination world-wide. In addition, CO2 is the primary gasresponsible for global climate change; itwill, it is believed, have future adverseimpacts on the world’s cities through moreextreme weather events, such as droughts,heat waves, floods, and storms.
Overharvesting of water is also envi-ronmentally risky. Removing too muchwater from the ground, lakes, and riverscan devastate local ecosystems and lead tosoil salinization and even desertification.The Aral Sea in Central Asia is an ominousreminder of the potential dangers of exces-
sive water harvesting. The lake and itsfreshwater sources, once teeming withlife and aquatic resources, were diverted,plundered and polluted to the point thatthe lake has shrunk to less than half itsoriginal size. What remains is virtuallya dead body of brackish water.
Municipal water authorities consideringwatergy efficiency actions will find themeven more attractive after taking intoaccount the reduction of environmentalrisks and impacts.
Watergy
10

Municipal water utilities, both publicly andprivately owned, often lack sufficient insti-tutional capacity to develop practicalapproaches for maximizing watergy effi-ciency, even after recognizing the potentialbenefits. The failure is mainly rooted inmanagement structures that do not empow-er staff to address efficiency issues directly.
The management models that mostwater utilities employ to deal with efficien-cy, irrespective of the composition of theirownership, fall somewhere among threegeneral approaches: ad hoc, single manag-er, and team (see table 1). Municipal water
authorities have found that the furtherthey move from ad hoc decision making toa holistic team approach, the more watergyefficiency gains they realize.
2.1 THE AD HOC APPROACHWater utilities relying on ad hoc responsesto promote water and energy efficiency lackthe institutional capacity and commitmentto take advantage of the vast majority ofefficiency opportunities. Utilities operatingin this mode may have no comprehensivemanagement plan. Instead, the responsibilityfor initiating water and energy efficiency
Key Characteristics Tools and ResourcesType of Management
Response
• This is often the default approach.• Upper-level management focus is limited.• Efficiency activities are done without
considering systemwide impacts.• System maintenance is done on a
reactive basis.• Little or no communication takes place
among operating units.
• Water and energy metering or monitoringinfrastructure is limited or nonexistent.
• Water and energy data available areneither widely shared nor prepared inusable form.
• Project funds are often unavailable.
• Response is often focused on oneparticular efficiency opportunity (locationor technology).
• Upper-level management recognizes theneed to focus on efficiency.
• Limited communication, but insignificantlevel of collaboration takes place amongoperating units.
• Efficiency manager has little direct controlover key personnel.
• Financing is available on the merits of theactual project.
• Data gathering occurs, but is limited inscope and distribution.
• Some personnel and equipment aredesignated for specific projects.
• Projects are funded on a case-by-casebasis.
• Response approaches efficiency as asystemwide issue; all operating unitspromote efficiency.
• Upper-level management makesefficiency a priority and regularly checksprogress.
• System maintenance is an integral part ofday-to-day activities.
• Managers and staff recognize inter-connection of various parts of the systemin designing efficiency projects.
• Watergy utility efficiency team leadershiphas some control over key personnel.
• Access to personnel with broad range ofskills
• Major data collection program with well-designed and distributed reports
• Efficiency is a key component of allfinancial decisions.
• Cost savings from projects are often putback into a fund for additional upgrades.
• Other innovative funding mechanisms areoften available to implement projects.
Ad Hoc
SingleManager
Team
Table 1: Watergy Efficiency Management Structures
HIG
H E
FFIC
IEN
CY
PO
TEN
TIA
LLO
W E
FFIC
IEN
CY
PO
TEN
TIA
L
11
2. Water Management Models

improvements typically falls to staff that canonly react to problems as they occur. Energyand water projects are often implementedwithout consciously addressing efficiencyand are unlikely to be proactively linkedwith other efforts to maximize savings.
The ad hoc approach is characterizedby a scarcity of water and energy use data,lack of coordination among various depart-ments, and limited capital allocation toefficiency projects. Top managers do notfocus on watergy efficiency and do notassign resources to this purpose.
For example, the Indore MunicipalCorporation, prior to its recent efforts tocreate a water utility efficiency team, hadnot been measuring or tracking any of itsenergy use data. Instead, it relied on theelectric utility to quantify its use of elec-tricity for pumping water. One of the firstthings the team discovered after institutinga metering and monitoring program wasthat it was being charged for more elec-tricity than it actually used.30
2.2 SINGLE MANAGER APPROACHMunicipal water authorities may choose toappoint an individual to address specificconcerns, such as pump efficiency, waterconservation, or wastewater treatment. Inmany cases, the creation of a dedicatedefficiency manager is a positive step inaddressing key watergy efficiency issues.An individual focused on a single issue
can deliver significant savings to the utility.An efficiency manager will likely stimulateincreased levels of data collection andsharing. This can help other departmentsimprove efficiency.
The appointment of an efficiency man-ager, however, does not go far enough inbringing together all the resources requiredto maximize watergy efficiency. The weak-nesses of the efficiency manager approachstem from the limited involvement of keystaff members in the watergy efficiencyprocess. Simply hiring an energy efficiencymanager does not stimulate the compre-hensive effort by multiple departments andstaff needed to achieve the greatest savings.
Some common complaints from effi-ciency managers employed in this type ofsystem include:
� Sufficient control over resources andother staff’s time is lacking for efficiencyefforts.
� Many stakeholders from numerousdepartments are often left underin-volved and unempowered on waterand energy efficiency issues, becausewatergy efficiency is not a direct partof their job.
� Limited interaction, planning, and coor-dination among various departments isdetrimental to promoting the effective-ness of systemwide efficiency measures.
� Efficiency projects are more likelyto fail if they lack buy-in and coordi-nation among departments.In Fortaleza, Brazil, the municipal water
authority, Companhia de Água e Esgoto doCeará (CAGECE), employs an energy effi-ciency manager who promotes severalsuccessful programs. One of the manager’simportant achievements was includingenergy efficiency as a key element in themunicipal water authority’s strategic planfor improvement; this included establishing
Watergy
12
Most municipal water authorities willfind that the further they move fromad hoc decision making to a holisticteam approach, the more watergy
efficiency gains they realize.
goals for energy efficiency. Although thegoals themselves are impressive andimprovements have been made, the energyefficiency manager has encountered anumber of impediments.
The first problem involved informationsharing. CAGECE invested in a sophisti-cated metering and monitoring system,but the information it provided only wentto certain individuals. The energy efficien-cy manager did not receive the requireddata in a usable format.
The second problem was how littleinput the energy efficiency manager hadinto key investment decisions that criticallyaffected energy efficiency throughout thesystem. For example, maintenance staffmade repair decisions for motors andpumps based solely on the cost of therepair, compared with the cost of purchas-ing new, more efficient equipment. Theydid not take into account the depreciatedvalue of older equipment and potentialadditional savings from upgrading to moreefficient equipment. In effect, a 10-year-oldinefficient motor requiring the same repairas a 1-year-old, high-efficiency motor wasgiven similar consideration for replacement.
A third problem involved the fact thatmany of the ideas, proposals, and deci-sions coming from the energy efficiencymanager were not completely coordinatedwith other investments in water supply,system pressure, and water treatment.These investments typically did not cap-ture the maximum potential efficiencyimprovements.
The appointment of an energy efficien-cy manager has been a significant step inimproving CAGECE’s water efficiency.Nonetheless, both senior managers and theenergy efficiency manager recognize theneed to include additional resources, ideas,and participation to make further progress.
2.3 THE WATERGY EFFICIENCYTEAM APPROACHBased on the experiences of numerouswater utilities and lessons learned undersimilar circumstances in the private sector,water utilities employing a team manage-ment approach to watergy efficiency willbe better positioned to take advantage ofefficiency opportunities.
The experiences of many municipalwater authorities, such as those docu-mented in this report indicate that theteam approach to watergy efficiency isan integral part of successful operational
2. Water Management Models
13
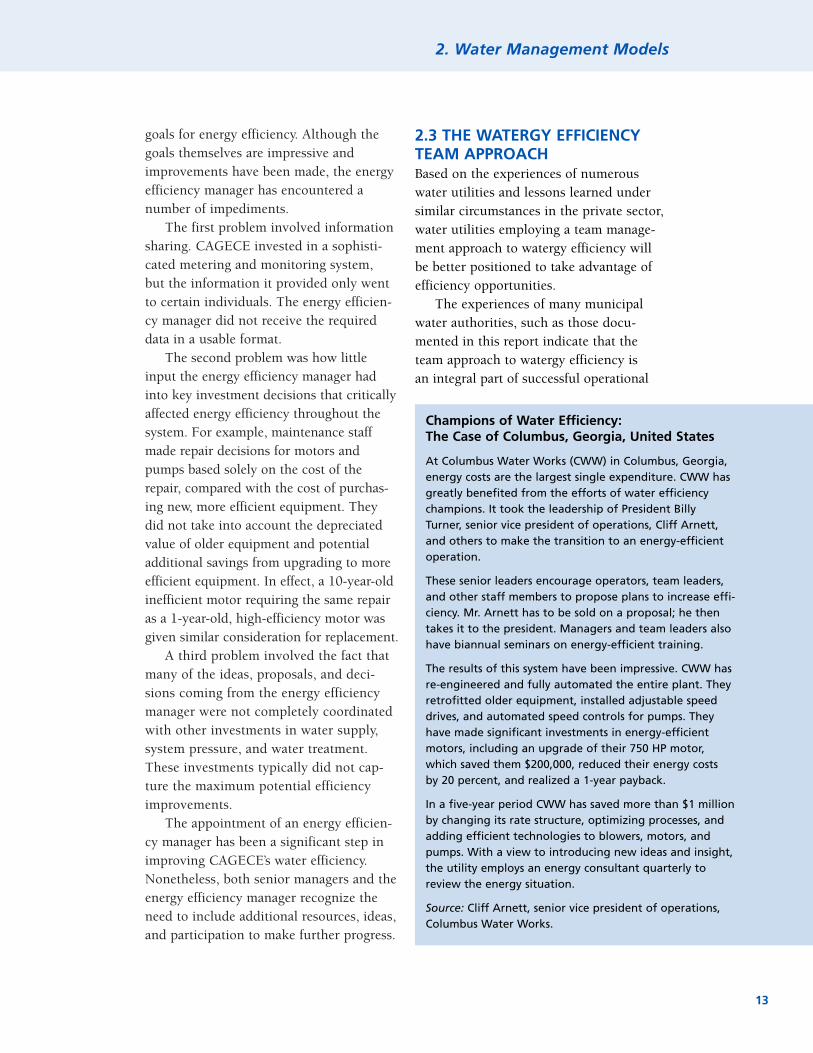
Champions of Water Efficiency: The Case of Columbus, Georgia, United States
At Columbus Water Works (CWW) in Columbus, Georgia,energy costs are the largest single expenditure. CWW hasgreatly benefited from the efforts of water efficiencychampions. It took the leadership of President BillyTurner, senior vice president of operations, Cliff Arnett,and others to make the transition to an energy-efficientoperation.
These senior leaders encourage operators, team leaders,and other staff members to propose plans to increase effi-ciency. Mr. Arnett has to be sold on a proposal; he thentakes it to the president. Managers and team leaders alsohave biannual seminars on energy-efficient training.
The results of this system have been impressive. CWW hasre-engineered and fully automated the entire plant. Theyretrofitted older equipment, installed adjustable speeddrives, and automated speed controls for pumps. Theyhave made significant investments in energy-efficientmotors, including an upgrade of their 750 HP motor,which saved them $200,000, reduced their energy costsby 20 percent, and realized a 1-year payback.
In a five-year period CWW has saved more than $1 millionby changing its rate structure, optimizing processes, andadding efficient technologies to blowers, motors, andpumps. With a view to introducing new ideas and insight,the utility employs an energy consultant quarterly toreview the energy situation.
Source: Cliff Arnett, senior vice president of operations,Columbus Water Works.
strategies. Even though each of the munici-pal water authorities highlighted in the casestudies took a unique approach to creatingthe watergy efficiency team infrastructure,a number of similarities underscore thebenefits of this methodology.
The watergy efficiency team originatesfrom strong advocates or “champions” atthe senior and middle management levels.A senior manager may identify comprehen-sive water and energy efficiency as a corefunction of the water authority and ensurethat appropriate resources are dedicated toachieving this goal. Middle-level manage-ment provides the day-to-day leadershipand does the actual work of incorporatingenergy efficiency into water system man-agement duties.
Watergy efficiency teams can mobilizea wide variety of resources and staff toimprove communication throughout thecompany. In addition, teams are able tostreamline efficiency project identificationand implementation and ensure the coor-dination of activities. A functioning teamwill make water and energy efficiencypart of the core business of the waterutility.
Lessons from the Private Sector:Corporate Energy ManagementPrograms The team concept to promote efficiency isnot new. In fact, the private sector has longbeen using corporate energy managementprograms (CEMP) to great effect in waysthat mirror and add credence to the water-utility efficiency team concept. Severalmanufacturing companies, includingOwens Corning, Johnson & Johnson, and3M, have found that it makes good busi-ness sense to adopt comprehensive corpo-rate energy management programs.31 Thesecompanies have reduced operating costs towell below the levels of competition thatlack institutionalized energy managementprograms.
A key lesson of CEMP systems forwatergy efficiency teams is that continuousimprovement requires a management struc-ture that combines the technical aspects ofenergy efficiency with effective operationalmanagement. As a recent study by theAmerican Gas Association highlights, manyfacilities concerned about operating costsoften identify and implement energy effi-ciency opportunities on an ad hoc basis.
Watergy
14
Source: Based on documented gains to CEMPs highlighted in a study by the American Gas Association extrapolated to themunicipal water sector.
Table 2: Expected Benefits from Watergy Efficiency Management Approach Based on CEMP Experience

Initial savings from this approach generallytotal between 5 and 10 percent of energycosts. Through CEMPs, however, compa-nies not only realize the initial 5–10 per-cent savings, but another 5–15 percent(see table 2) in improved operations andmaintenance practices.32 Additionally,because energy production and use at afacility is not static, facility performancecan deteriorate to crisis proportions in afew years without ongoing management.33
Characteristics of an EffectiveWatergy Efficiency TeamA recent report by the Alliance to SaveEnergy on corporate energy managementcharacterized eight key elements in corpo-rate energy management programs. Thesecritical CEMP components are all essentialfor creating a successful watergy efficiencymanagement program:34
1. Commitment by top-level management2. Clearly defined energy reduction goals3. Communication of the goals through-
out all levels in the company4. Assignment of project responsibility
and accountability at the proper level5. Formulation and tracking of energy-
use metrics6. Identification of all potential projects
on a continuous basis7. Adoption of project investment crite-
ria, reflecting project risks and returns8. Provision of recognition and reward
for achieving the goals.
One element of an effective watergyefficiency team that directly parallels theCEMP structure is the enactment of ametering and monitoring system to pinpointenergy and water waste. This system pro-vides key members of affected departmentswith an integrated view of pertinent infor-mation. The City of Austin, for example,
has developed an aggressive monitoringprogram to provide its staff the maximumopportunity to enact efficiency gains.Austin’s water utility provides a regularstream of appropriate data to staff viae-mail to empower its managers andemployees. Data, such as specific pumpinginformation, customer sales, and systemperformance, are constantly sent to appro-priate staff who can then optimize theirwater and energy efficiency efforts. Thesedata are stored in accessible databasesthat provide benchmarks on efficiencyefforts.
An excellent example of the successof Austin’s data-sharing system comes inthe area of leak reduction. By installingmultiple submeters and coordinating theflow of pertinent information directlyfrom meters to crews that repair lines,Austin has reduced system losses to only8 percent.
Austin also has an advanced consumermonitoring system that helps focus theresources of their demand-side efficiencyprograms. Employees are able to differenti-ate up to 30 categories of water users, suchas hospitals and schools. This informationallows Austin’s staff to target resourcesbetter to inefficient water users, either bycomparing sectors or by benchmarkingcustomers within a sector. For example,a hospital using more water than itscounterparts would be a likely candidatefor a water audit.
Corporate energy management pro-grams have been documented as excellentvehicles to reach maximum efficiencygains. Just as industries have found thismanagement approach empowering,municipal water authorities will find somehybrid of the management team approachto be the most effective methodology topromote water and energy efficiency.
2. Water Management Models
15

17
3. Crafting a Watergy EfficiencyTeam Infrastructure
3.1 THE GOAL OF AWATERGY EFFICIENCY TEAMThe purpose of creating a watergy efficiencyteam is to marshal resources and tools tomaximize efficiency. The end result is toprovide the same or greater benefit to thewater end user while reducing operatingcosts, energy use, waste, and per capitaenergy and water consumption. Thewatergy efficiency team’s role is to:
� Organize and coordinate water andenergy efficiency efforts
� Generate a pool of technical know-howto identify and implement projects
� Assemble pertinent data to identifyinefficiencies
� Create a management focus on waterand energy efficiency.
3.2 THE FORMATION OF AWATERGY EFFICIENCY TEAMCreating a watergy efficiency team involvesputting together the right group of people,armed with the appropriate resources, toidentify opportunities, develop and imple-ment projects, and track results.
No single correct approach exists tobuilding a watergy efficiency team. Manyvariables, including size, financial capabili-ties, and experience with watergy efficien-cy, will dictate how individual utilitiesapproach the effort. As part of the planningprocess to build a watergy efficiency pro-gram, serious consideration should be givento available staff and financial resources andthe opportunity costs of engaging theseresources in the pursuit of efficiency.
The team-building process for CAGECE,the water utility in Fortaleza, Brazil, beganwith management recognition of the keyrole of energy in their water system. Thatled to the appointment of an energy effi-
ciency manager. Initial steps to gain cred-ibility included improving operationalefficiency of several components of thewater system and getting energy-usereduction targets adopted by senior man-agement. The energy efficiency manager,however, recognized the limitations of hisposition in terms of gathering data andenacting systemwide efficiency measures.The energy manager was limited by thefact that senior management did not iden-tify efficiency as part of the core jobs ofseveral key staff members.
After deciding to adopt a teamapproach, CAGECE went through a plan-ning process to determine the criticalaspects of their water system that neededimprovement. From this process, CAGECEwas able to establish its measures of suc-cess, including specific energy-use reduc-tion goals, and target priority areas ofinitial work. The planning process provid-ed the link to identifying the key playersthe utility needed to mobilize for theirwatergy efficiency team.
Table 3 lists likely key players and theirroles on a watergy efficiency team based onfindings from many of the successful pro-grams canvassed in this study. Few waterutilities will have the resources to allow
Creating a water utility efficiency teaminvolves putting together the right
group of people armed with theappropriate resources to identify
opportunities, develop and implementprojects, and track results.

Watergy
18
Description of RolePotential Team
Member
• Sell to mayor and other city officials• Break bottlenecks• Advocate for project funding• Ensure a team budget• Track progress
• Motivate team members• Provide team vision and create goals• Develop a work plan and implementation schedule• Assign tasks• Coordinate information flows• Evaluate systemwide opportunities• Advocate for project financing• Facilitate interdepartmental cooperation
• Provide critical data• Identify and involve key technical staff• Implement and maintain projects• Discover critical design efficiency issues
Top management
Watergy efficiencymanager
Unit level managers(water supply plant,
treatment plant,delivery operations,
and so on)
Table 3: Human Resources Required for Watergy Efficiency Team
Hydrology staff • Contribute key technical know-how• Provide an important data source• Offer significant contribution to water supply/sanitation systemwide planning• Liaison with a basin-level resource planning entity
Maintenance staff • Identify and implement efficiency opportunities• Provide critical data
Energy staff • Supply a major component of data• Contribute to project identification and implementation• Serve as resource for technology option
Data collection/input staff
• Perform basic data management and distribution functions
System planner • Offer long-term investment awareness to watergy efficiency process
Finance staff • Prioritize activities based on cost-effectiveness• Assess project-financing opportunities
Customer outreachstaff
• Create demand-side awareness and reductions
Private sector • Undertake consumption reductions as appropriate• Offer efficiency know-how and resources
Electric utility • Provide expertise and means to promote efficiency• Potential source of financing

each of the suggested members to work onefficiency for a major proportion of theirtime. The core team members, however,will be better off developing links andworking relations with as many colleaguesas possible to improve the exchange ofinformation and facilitate the team’s activi-ties. The list offers a starting point for utili-ties looking to develop a watergy efficiencyteam, but every successful team will clearlyhave its own identity and may be phasedin over a period of time.
OutsourcingAs a watergy program develops, it maybecome clear that a municipal waterutility lacks the resources, expertise, and/or time to staff and implement the activi-ties of a watergy efficiency team effectively.Outsourcing work to companies thatspecialize in needed areas is often a cost-effective way to enable a water authorityto pursue water and energy reductionsaggressively.
A municipal water authority can out-source anything from a small specificneed to the majority of functions of anefficiency team.
The Municipal Water Company ofColumbus, Georgia, in the United Statesprovides one example of a water utilityusing outsourcing to address a particularneed. In Columbus, the water utility hasan energy consultant conduct an efficiencyaudit on a quarterly basis to look for addi-tional energy efficiency opportunities.The consultant’s additional set of eyes andtheir outsider perspective allows them tocheck and ensure that staff concerned withday-to-day operations of the system havenot overlooked saving opportunities.
In contrast, the City of Toronto usedoutside consultants to help draft its entire
water efficiency plan. Bulawayo, Zimbabwe,employed outside consultants to helpdevelop its efficiency program and trainlocal staff to implement it. Instead ofappointing a full-time staff person, theAhmedabad Municipal Corporation inIndia used an outside consultant as itsenergy manager for 2 years. This allowedthe energy manager to focus on efficiencywithout getting pulled into other projects.
Outsourcing, however, involves somekey constraints, so managers should givespecial consideration to creating groundrules for outsourced activities. Outsourcingmay require even greater managementsupervision to make certain activities aresuccessful. To manage outsourced activitiesproperly and ensure results, managers needto confirm baselines and create mechanisms
to verify work and savings. Outsourcingactivities also require the vigilant attentionof senior managers to ensure that activitiesprogress as scheduled and that they inter-face with other related measures.
3.3 TOOLS AND RESOURCES OF AWATERGY MANAGEMENT TEAMDuring the process of organizing a watergyefficiency team and programming its activi-ties, managers also need to recognize andprovide the multiple resources that the
3. Crafting a Watergy Efficiency Team Infrastructure
19
Outsourcing work to companies thatspecialize in needed areas is often a
cost-effective way to enable a municipalwater authority to continue to pursuewater efficiency aggressively and help
galvanize the team’s activities.

team requires for success. Below is a list ofcommon resources required.
� Budget. Ensuring an annual budget isan important part of institutionalizationin any bureaucracy. For a municipalwatergy efficiency team, a budget iscritical to acquiring appropriate toolsand expertise, commissioning technicalstudies, implementing appropriateprojects, and providing continuity.
� Time. Team members need to beallotted time to focus their effortson efficiency. In Indore, India, keyteam members repeatedly pointed outthat their workloads often did notallow them the necessary time to focuson accomplishing water and energyefficiency activities.
� Access to key staff. To empower awatergy efficiency team fully, manage-ment should allow the team the abilityto access and task key people fromboth inside and outside the team.
� Training. Appropriate training empow-ers team members to achieve efficiencygoals. Training can acquaint team
members with up to date efficiencytechnologies, teach up to date opera-tions and maintenance practices, andshow managers how best to enabletheir staff to achieve efficiency gains.
� Metering and monitoring equipment.One of the first tasks of the teamshould be to assess the current meter-ing and monitoring system to identifyareas for improvement and determineadditional equipment needs (flowmeters, pressure gauges, and so on).Data can always be improved byincreasing the scope and accuracyof the system’s measuring capacity.
� Database management tools. Rawdata are ineffectual unless they arerecorded and manipulated into a usableform. Technologies to track and analyzesystemwide data, such as computers,database software, and report genera-tors, are vital resources for improvingefficiency. If funds are limited, leasingthis type of equipment is an option.
� Project financing. To prevent a team’sefforts from turning into a strictly aca-demic exercise, identified opportunitiesneed to be implemented. The teamneeds a mechanism to fund worthyprojects. This could include somecombination of the following: develop-ing a relationship with a water and/orenergy service company, leasing equip-ment, creating a separate budget withinthe utility for efficiency projects, fasttracking projects that meet certainpayback goals, and using savings fromlow- or no-cost projects to help fundnew projects.
Watergy
20

3. Crafting a Watergy Efficiency Team Infrastructure
21
� Office space. Office space can be animportant institutional building blockfor a watergy efficiency team. The officeserves as a meeting point and an infor-mation hub. In the Indian cities ofPune and Indore, creation of an actualoffice space has been important to insti-tutionalizing the water and energy effi-ciency team. Phones, computers, staff,and other data collection resources fol-lowed the allocation of office space.
The examples of Pune and Indore inIndia provide excellent insights into theimportance of endowing the team withthe proper resources and tools. In manyrespects, the progress of these two munici-pal water companies in implementingwatergy efficiency measures can be directlycorrelated to their ability to engage theappropriate tools and resources.
In the year 2000, the Pune and IndoreMunicipal Corporations began workingwith an NGO to develop managementcapacity to address water and energy effi-ciency. Each of these municipalities hadstrong leadership at the senior manage-ment level that recognized the potentialfor savings based on initial assessmentsof their operations. Each recognized thedata gaps and measuring inadequaciesin their existing system. By deciding toaddress these problems by building awater and energy efficiency team, thesemunicipalities began to reap significantsavings as the most easily addressedprojects were implemented.
As the team-building effort ensued,however, the lack of certain measurementequipment and their inability to procurenecessary resources quickly began to ham-per efforts. Data collection, a key elementof earlier success, could not be improved.To address these issues, both Pune andIndore developed operating plans thatincluded budget, staff, equipment, andtraining to empower the team to achieveeven greater success.
In Pune, for example, the water andenergy efficiency management team was ata near standstill until it procured computerand database systems to track and analyzedata. Once data were gathered and enteredin the system, the energy managementteam started to identify additional savingsopportunities and recognize areas needingfurther attention. The Indore MunicipalCorporation facing a similar lack of equip-ment, created a line item in the municipalbudget for water and energy efficiencywork. In the first year, the corporation pro-vided about US$100,000, which is beingprogrammed to support the team’s activi-ties. By making these additional invest-ments, both Indore and Pune have beenable to take advantage of additional savingsopportunities and discover billing errorsmade by the electric utility.

23
4. Building Institutional Capacity
Developing an accurate understanding ofcurrent operating conditions is the first stepfor a water utility to create and implementa watergy efficiency strategy. To understandthe potential of water and energy efficiencyand implement effective solutions, waterutilities need to create a water-metering and-monitoring system, develop baselines andmetrics, carry out facility assessments, andanalyze data to determine the appropriateallocation of resources.
4.1 WATERGY METERING ANDMONITORING SYSTEMAn accurate metering and monitoring sys-tem empowers watergy efficiency teams tobecome aware of system problems and bot-tlenecks, identify the cause of problems,and take corrective actions. Metering andmonitoring systems alone have allowedmany organizations to cut energy con-sumption by 10 percent.35
Resolution of technical issues such asisolating water losses and system pumpingrequirements relies on valid metering dataon water flow and electricity use. Forexample, in wastewater systems, regularmonitoring of flows can indicate problemswith water from the outside infiltrating thesystem. Increased water flow can indicatethat groundwater is seeping into collectionmains through loose joints, main breaks,and cracks. It can also stem from rainfallrunoff that enters from manholes or con-nections such as eave spouts or sumppumps. Water infiltration can create exces-sive demand on system equipment, wastingenergy and money.36
The first task in establishing a meteringand monitoring system is to create a net-work of meters and submeters measuringwater flow and energy use. Although thetechnology employed and the number ofmeters will vary depending on each water
utility’s access to resources, this networkmust measure water and energy enteringinto the system and calculate the waterdelivered to users. In the best-case scenario,the metering system will extend throughoutthe facility to areas where water and energyare used. Separating the system and plantsinto discrete areas (e.g., specific equipmentor section of a building) can facilitate themeasurement of energy and water inputsand outputs.37
The quality of the data will be greatlyaffected by the quantity, quality, and place-ment of measurement equipment. To main-tain accuracy, meters need to be checkedregularly and recalibrated as necessary.
Factors to consider when selectingmeasurement equipment include:
� Type of instrument for a given parameter� Portable compared with stationary� Accuracy compared with cost� Operating environment (e.g., physical
stresses or corrosion potential)� Physical location and space in the
system.
Table 4 summarizes common types ofinstruments available for a given parameter.
Key Steps to Building Institutional Capacity
• Create a watergy metering and monitoring system.Many potential supply-side and demand-side savingsopportunities can be identified, implemented, andverified by developing comprehensive data collectionand management systems.
• Develop a baseline and metrics. By creating a baselineand metrics, water management teams can better iden-tify efficiencies, sell projects to management, and tracksuccess.
• Carry out facility assessments. Water efficiency man-agement teams can gain a more detailed understand-ing of where opportunities lie within the water systemby conducting facility assessments.
• Analyze data. Once all the data are collected, waterutility efficiency teams need to be able to use them tomake decisions on where to focus resources and efforts.

Because several tools exist that can oftenoffer similar measurements, water utilitiesmust identify the best equipment for thespecific job based on internal criteria.
Permanently installed meters can beextremely useful in creating a functionalmetering system. These meters can be con-sistently monitored by staff or electronical-ly to maintain a reasonably reliable dataset. Portable instrumentation, however, isoften advisable for better accuracy. Portableinstruments are easier to maintain and cali-brate and should be used where possible tocheck the precision of installed meters.
Certain tasks may require extremelyaccurate measurement equipment, whereasothers may just require reasonable estimates.Similarly, more physically demanding systemareas that subject equipment to considerable
physical stress and potential damage mightrequire more durable and expensive meters.Water utilities will need to develop criteriato select equipment based on their needscompared with product costs.
It is also important to determine theproper locations to take measurements.Measurements for flow and pressure aregenerally taken around major pumps toassess their efficiency. In fact, major pumpsmay warrant further analysis to identifyoptimal performance conditions.39
Meters cannot provide every measure-ment required. Estimates are necessary forsuch quantities as the vertical rise betweenthe water source and the destination(head*) and in those cases where it is notpractical to take measurements due to pip-ing layout or the physical space available.
Watergy
24
Typical Measurement InstrumentsParameters
• Differential pressure devices, such as orifice meters andVenturi meters
• Velocity flow meters, such as pitot tubes• Open flow meters• Positive displacement meters
• Bourdon tubes• Bellows• Diaphragm• Piezo-resistive transducers
• Ammeters• Voltmeters• Power factor meters
Water flow rateComparing water flow rates in different parts of the systemcan help pinpoint leaks, high pipe friction, and real-timepumping requirements.
Water pressureMonitoring water pressure can help find leaks, reduceunneeded pumping, and maintain constant service.
Motor input powerInput power readings can help determine if a motor isoperating at its optimal efficiency.
Pump rotating speedRotating speed data can help determine if a motor isoperating at its optimal efficiency.
• Strobe light
Equipment nameplate information• Rated motor speed, horsepower, full load amperage, and
nominal efficiency• Pump flow, head, and speedThis information is vital in determining the optimal efficiencypoint for equipment.
Ongoing monitoring
Head38
Pumps need to be fitted to match the system’s headrequirements.
Estimated
Table 4: Watergy Efficiency Performance Measurements
* Head is the vertical distance between the water source and its destination.

In addition to the physical installationof a metering and monitoring system, it isimportant to institutionalize the operationand management of the metering system.Whether checking instruments by hand,using portable tools to take measurements,or receiving data automatically throughcomputer systems, individuals need to beresponsible for accurately recording meas-urements. Maintaining trained and motivat-ed staff in these crucial functions will greatlyimprove the quality of the data output.
4.2 BASELINES AND METRICSTo measure progress on efficiency, it is criti-cal to develop water- and energy-use metricsand then create a baseline to compare thesemetrics with future improvements. Trackingwater efficiency metrics, such as those listedin table 5, can provide critical informationabout a system’s efficiency. By selecting a setof metrics to gauge improvements and iden-tify inefficiencies, water utility efficiencymanagement teams will be able to prioritizeopportunities and assess their progress bet-ter. To provide an accurate comparison,water and energy consumption baselinesmust account for intraday, daily, and season-al fluctuations in demand. Development ofmetrics and baselines is necessary for bothwater delivery facilities and customers.
Sydney Water in Australia tracks theirwater and wastewater system performancebased on a number of indicators:
� Overflows and leakage from the sewersystem
� Sewage treatment effluent quality� Greenhouse gases� Energy used� Biosolids generated� Sewer discharge reductions at source� Environmental management and per-
formance� Species impact.
Using this data, Sydney Water tracksseveral metrics including those related tofacility energy consumption:
� Per capita electricity consumption� Electricity consumed per unit of service
delivered� Percentage of electricity purchased as
green power (electricity from renewablesources)
� Greenhouse gases generated bothdirectly and indirectly from the system’sconsumption of energy.
Progress on these indicators is reported inSydney Water’s annual environment report.
4.3 FACILITY ASSESSMENTAs part of the process of identifying a com-prehensive inventory of measures to reduceoperating costs, watergy efficiency manage-ment teams need to undertake in-depthfacility assessments. These assessmentsshould cover all equipment and devicesinvolved with the processing, delivery, andtreatment of water.
4. Building Institutional Capacity
25
Cost Supply Demand
Total Water DeliveredTotal Cost* Example: liters per dollar
Total Water DeliveredTotal Amount of Energy UsedExample: liters per kWh
Total Water DeliveredTotal PopulationExample: liters per person
Total CostTotal Water DeliveredExample: dollars per liter
Total Water DeliveredTotal Input WaterExample: liters per liter entering system
Total Water DeliveredNumber of ConnectionsExample: liters per connection
* Including energy, water, capital depreciation, and maintenance
Table 5: Typical Metrics for Tracking Watergy Efficiency

For example, the Confederation ofIndian Industry’s Energy Management Cell,by conducting facility energy audits, esti-mates an annual potential savings of 1.5billion rupees (US$32 million) in Indianpublic waterworks in pumping systemsalone. The confederation estimates that asystematic approach to identifying energysavings opportunities often yields savingsas high as 25 percent.40
To complete an accurate analysis ofcurrent operating efficiencies, it is vitalto verify such equipment data as hours
of operation, equipment type, efficiencyrating, and other basic information. Inaddition, factoring in the current operatingconditions for equipment will improvethe accuracy of the efficiency analysis.
To identify opportunities correctly, thefacility assessment team must know howto take accurate measurements, where themeters are located, and when measurementsare to be taken. Proper staff training needsto cover the techniques involved in moni-toring equipment selected for the plant. Inaddition, managers need to develop systemsto ensure that accurate measurements arebeing taken. Plant managers typically citehuman error in collection as a major con-tributing factor to inaccurate data.
4.4 DATA ANALYSISAfter implementing a system to gatheraccurate data, the team must develop aprocess for using the data to maximizetheir efficiency efforts. To use the data toisolate efficiency opportunities, the actuallevels of energy consumption and waterflows should be compared with the optimaltheoretical consumption.
To determine the optimal consumption,the team will have to use:
� Engineering calculations� Equipment manufacturers’ standards� Internal norms and standards� External standards and benchmarks� A systems analysis approach.41
Engineering CalculationsTechnical tools such as pump nomographs,optimization software, and fluid dynamicsengineering formulae can assist with theengineering assessments of both specificequipment and of particular parts of watersystems. The U.S. Department of Energy,for example, offers a software packagecalled the Pumping System Assessment
Watergy
26
Case Study: Bunbury, Australia
Bunbury relies totally on electricity to extract and movewater through the city’s distribution system. The city’swater board set a goal minimizing water costs to thecommunity. It determined the best way to achieve thiswas to use life-cycle operating costs as the basis fordecision making. Their investment decisions, therefore,minimize both energy input costs and maintenance costs.At times, this has required greater capital outlay thanother investment options.
Bunbury monitors the ratio of treatment plant energyconsumption to water production as a performance metricto help reduce costs. The city also undertakes an annualreview of energy consumption trends and performanceagainst a 5 percent reduction goal. Energy audits pin-pointed the following specific areas of energy savings:• Using smaller, more efficient pumps in
water treatment plants• Replacing fixed-speed drive pumps with
adjustable speed drives• Optimizing sand filter backwashing• Establishing a preferred sequence of
water treatment plant start-up based onthe plant energy efficiency ratings
• Modifying pipes to reduce head loss.
These measures, implemented during four years, saved$164,000 (US$83,000). With a total outlay of $115,000(US$53,000), this amount equals a payback of 2.8 years.
Source: Center for the Analysis and Dissemination ofDemonstrated Energy Technologies, “Energy Managementby a Water Supply Utility” (Center for the Analysis andDissemination of Demonstrated Energy Technologies,Netherlands, March 1999).

Tool that allows the user to create perform-ance curves for pumps and motors togauge their actual operating efficiency.
Equipment StandardsEquipment standards and norms providedby the manufacturer also provide valuableinformation concerning the optimal oper-ating efficiency of certain equipment. Apump, for example, operating at an effi-ciency level well below its manufacturer’sspecifications may be an ideal candidatefor maintenance or replacement. It mayalso indicate the need for system redesign.
Internal Norms and StandardsWater and energy use information can alsobe compared with similar facilities withinthe company to assess opportunities forimprovements. For example, Fortaleza,Brazil is helping to prioritize pumping sta-tions that need efficiency upgrades, simplyby comparing them with each other interms of cost per unit of water pumped.
External BenchmarkingAlternatively, water utility efficiency teamsmight choose to contact other companiesto solicit operating standards and bench-marks. They may also speak to tradeorganizations, such as the American WaterWorks Association or international groupsto gather similar information.
A World Bank–led effort focusing on12 countries in Africa is sharing operatingdata and benchmarking water facility per-formance. The participating water utilitieshave been able to measure their perform-ance with that of their peers, while gather-ing information on innovative ideas toimprove efficiency and service.42
In addition, in the Baltic region, severalutilities are benchmarking water utilityperformance with each other by compiling
an array of identical water and wastewaterperformance indicators. Several Estonian,Latvian, and Lithuanian utilities measure
their performance both internally andexternally for the following metrics:
� Percentage of population served(water supply)
� Total water produced per capita per day� Unaccounted-for water losses� Population of cities served� Nitrogen removal rate (yearly average)
4. Building Institutional Capacity
27
Major systems that offer significantefficiency improvement opportunities inwater and wastewater facilities include:• Piping systems• Pumps• Motors• Compressors• Primary treatment equipment• Secondary treatment equipment,
such as aerators and blowers• Disinfection equipment such as
chlorine mixers, ozonation, andultraviolet equipment.
Potential for Pumping System Improvementsin the United States
A common area for improvement in the municipal watersystem is the pumping system. Pumping systems comprisean estimated 70 to 90 percent of electrical energy costsfor U.S. municipal water companies. In groundwater sys-tems that only use disinfection and no other treatment,almost all of the energy used is for pumping. With 60,000water supply plants and 15,000 wastewater treatmentplants in operation in the U.S., municipal water pumpingaccounts for nearly 2.5 percent of U.S. electricity use.
Sources: Oliver and Putnam 1997 and IAMU 1998.

� Phosphorus removal rate (yearlyaverage).By aggregating these data, the Baltic
utilities can compare their performancewith their peers to give them an indicationof their potential for improvement.43
Systems ApproachIn looking for water savings, it is impor-tant to view potential measures in the con-text of their overall impact on the waterand energy inputs for the water system as awhole. For example, separate assessmentsmight indicate that changing a pump inone part of the system and making a pipingsize change in another will augment effi-
ciency. Not coordinating the two efforts,however, may actually reduce overallsystem efficiency and waste resources.
A good illustration of the potentialimpact of one capital improvement onother efficiency projects can be found inPune, India. A recent assessment of one ofPune’s water-pumping stations uncovereda substantial savings opportunity fromrelining a rising main to reduce frictionallosses. Relining the main would reduceelectricity consumption by an estimated500,000 kWh and save 2 million rupees(US$45,000) annually. The assessment alsorecommended redistributing pumpingloads more efficiently among the differentexisting pumps and potentially replacingsome of the pumps with more efficientunits. To maximize efficiency gains fromboth projects, the calculation of the redis-tribution of the pumping load and determi-nation of what size pumps should bepurchased needs to be coordinated withthe results of the relining project. Thereduction in friction from the relining willreduce pumping requirements and allowfor employment of fewer and/or smallerpumps.
Although the improvement opportuni-ties discussed in the following two sectionsall offer potential savings, maximizing ben-efits with limited resources requires well-planned activities based on accurate datainputs. Once the watergy efficiency teamhas developed a fundamental understand-ing of the operations of the water utility,it can prioritize and coordinate the mostappropriate supply-side and demand-sideefficiency improvements.
Watergy
28
Case Study: Sydney Water Use of Technology for Facility Assessment
Based in the largest city of Australia, Sydney Water pro-vides drinking water and wastewater services to morethan four million people. Being a major user of electricity,the company rigorously pursues cost-effective energyefficiency initiatives. It manages energy use through itsIICATS telemetry and control system. The hydraulic systemis continually and comprehensively monitored. This hasenabled scheduling of water pumping stations to:• Maximize off-peak operation• Minimize costs stemming from the maximum demand
component of electricity supply charges.
Monitoring has led the company to undertake energyaudits of a number of operational facilities. Based on theseaudits, Sydney Water came up with quite a few interestingproject recommendations. For example, aeration blowersare the major electricity consumers in inland sewage treat-ment plants. Additional dissolved oxygen probes were usedfor more accurate monitoring in the inlets and outlets ofthe aeration tanks. This allowed the blower to run at mini-mum speed for most of the day, saving energy and money.In six years (1994–2000), Sydney Water decreased electricityconsumption per unit of service delivered by 14.6 percentfor wastewater and 7 percent for water delivery.
Source: Sydney Water, “Environmental Impact of UsingEnergy” (Sydney, Australia: Annual Environment andPublic Health Report 2000) at <www.sydneywater.com.au/html/Environment/enviro_index.htm>.

29
5. Supply-Side ImprovementOpportunities
This section provides an overview of manyof the common supply-side steps thatwater utilities can take to reduce the ener-gy used for pumping water. Supply-sidemeasures are designed to improve the effi-ciency of the water supply system, makingeach unit of water delivered less energyintensive.
It is important to remember that mak-ing individual improvements withoutexamining the impact on the entire systemcan actually lead to significant inefficien-cies and wasted capital. The order in whichutilities pursue solutions for improvementis also important.
A watergy efficiency team or managerneeds to prioritize opportunities with thehighest savings potential and scheduleactivities in the correct chronological orderto maximize energy efficiency benefits. Forexample, in many cases, leak reductionshould take place prior to system redesignand installation of new equipment.Otherwise, the specification and size ofequipment will be based on parametersthat may change after the leaks are fixed.Prioritizing opportunities also includescoordinating supply-side measures with thedemand-side activities discussed in thenext section.
5.1 INTRODUCTION TOSUPPLY-SIDE ACTIVITIESMajor supply-side improvement opportu-nities lie in operations and maintenancepractices, system redesign, and wastewatertreatment processes. The task of the water-
gy efficiency team or manager is to identifyand prioritize improvement opportunities.The planning process should recognize theimpacts of improvements in one area onother parts of the system.
5.2 MAINTENANCE ANDOPERATIONAL PRACTICESOften the least expensive efficiency oppor-tunities come from improvements in opera-tions and maintenance practices. One suchtask that is critical for water utilities isreducing leaks and losses.
Valuable water and energy inputs arecommonly wasted through system leaks,poorly maintained equipment, defectivemeters, unused machines left idling, and
“Power’s one of our three biggest expenses, along with chemicals and labor.”—Carl Stonoff, Water Plant Supervisor, Burlington, Iowa, United States
Common problems include:• Leaks• Low c-value for pipes (high level of friction inside pipes)• Improper system layout• System overdesign• Incorrect equipment selection• Old, outdated equipment• Poor maintenance• Waste of usable water
Remedies may involve:• System redesign and retrofitting of equipment• Pump impeller reduction• Leak and loss reductions• Equipment upgrades• Low-friction pipe• Efficient pumps• Adjustable speed drive motors• Capacitors• Transformers• Maintenance and operation practices improvements• Water reclamation and reuse

systems improperly operated. To alleviatethese problems, a watergy managementteam can create a procedures manualoutlining operating norms, maintenanceschedules, oversight mechanisms andemployee-training modules.
Beneficial practices in such a proceduresmanual might include:
� Guidance on managing the system tomeet flow needs without excessivepressure
� Schedules for surveying equipmentand piping for leaks
� Measures for replacing cracked watermains and fixing manholes
� Timetables for checking meter accuracyand cleaning equipment
� Advice for identifying and replacinginefficient equipment
� Regulations for switching off waste-water treatment equipment, motors,HVAC, and other equipment not in use
� Guidelines for using water storageand hours of operation to reduce peaksystem operation requirements.
For a water utility, reducing systemwater pressure has several positive impactson system efficiency. Reduced water pres-sure can lead to decreases in leakage, stresson pipes and joints, and flow through theend user’s open water fixtures. Pressurereduction also extends the life of equip-ment, decreases system deterioration, anddiminishes the need for repairs. Small water-use customers with system pressures greaterthan 80 pounds per square inch (psi) or5.62 kilogram-force per square centimeter(kgf/cm2) should be considered candidatesfor water pressure reduction, as long as anyreduction does not compromise the qualityof service to the customer.44
Water systems that have multiple pres-sure zones often have higher energy costs
due to the operation of booster pumpingstations that increase water pressure.Adjustable speed drives (ASD) for pumpscompensate for different flow and pressureconditions and offer one energy-savingsolution. Pressure-reducing valves mayalso prove beneficial.
Groundwater and rainfall infiltrationinto the system causes pumps in lift sta-tions to operate longer and may requirelarger pumps or multiple pumps to handlethe higher flows. Replacing cracked mainsand fixing manholes reduces inflow andinfiltration problems, decreasing the energyused for pumps at lift stations and treat-ment plants.45
All meters, especially older meters,should be tested for accuracy on a regularbasis. Meters should also be appropriatelysized, as meters that are too large for a cus-tomer’s level of use can underregister wateruse. Regular meter recalibration is alsohelpful to ensure accurate water account-ing and billing.46
Leak and Loss ReductionReducing leaks and losses is a critical partof any water utility’s watergy efficiencystrategy. Although vast differences existamong water utilities in unaccounted-forwater rates, no utility is immune to expen-sive, inefficient water leaks and losses.
In countries such as the United Statesand Israel, 85 percent or more of the waterentering the system commonly reaches theend user. Austin, Texas, for example,boasts only 8 percent unaccounted-forwater in its system, maintaining this ratethrough an aggressive leak reduction pro-gram. The figure for unaccounted-forwater, however, goes as high as 50 percentin many other countries, such as Turkeyand Egypt. A review of 54 developing
Watergy
30

country projects financed by the WorldBank found the average water loss in watersupply and treatment was 34 percent.47 Inmany cases, significant losses are caused bypoor system maintenance, especially wheremetering systems are weak or nonexistent.Reducing these losses will enhance theoverall efficiency of the system.
In addition, water utilities with leakageproblems are forced not only to pump morewater than is actually needed, but also toincrease system pressure to assure that thewater reaches the consumer. Increasingpressure is usually less cost-effective than
fixing the leaks and maintaining a lowerpressure. Furthermore, higher systempressure actually exacerbates the leakage,wasting even more water and energy.
Water Accounting SystemsImplementing a system of water account-ing is a valuable first step in controllinglosses. Water accounting should ideallybegin at the source and extend to end usersto determine water losses. Figure 2, whichmaps the flow of water entering throughthe system, can provide a framework forwater utilities in measuring unaccounted-for water.
5. Supply-Side Improvement Opportunities
31
Figure 2: Water Accounting System48

By quantifying the known andunknown delivered water deficit, lossaccounting can give the watergy efficiencymanagement team an idea of how muchleakage exists in the distribution system.Losses should be tracked monthly, especial-ly in high-risk areas, to help identify newleaks, inaccurate meters, and illegal waterdiversions. A comparison of the amountof water leaving the system with that soldto customers will help quantify losses.
Even under good management condi-tions, unaccounted-for water normallyconstitutes 10–15 percent of the waterproduced; thus, if water loss is greater than15–20 percent of water produced, correctiveaction is necessary.49 It is important to stressthat unaccounted-for water reduction pro-grams need constant maintenance; leakswill reoccur if water utilities are not vigilant.
Leak Detection and Repair StrategyA comprehensive leak detection and repairstrategy allows the watergy efficiency man-
agement team to take advantage of theinformation gleaned from loss accountingby coupling it with specific action toreduce losses. This strategy may includeregular on-site testing using computer-assisted leak detection equipment, a sonicleak-detection survey, or any other accept-able method for detecting leaks. Leakreduction can involve pipe inspection,equipment cleaning, and other mainte-nance efforts to improve the distributionsystem as it currently operates and preventfuture leaks and ruptures from occurring.50
Seepage from canals is a commonwater loss problem for both rural andurban water systems. Both canal liningand piping can reduce seepage. Unlinedcanals often lose 30 to 50 percent of water,depending on the type of soil, but a well-operated and -lined system can keep lossesto less than 10 percent. Using buried pipesrather than canals can similarly result indistribution efficiency improvement onthe order of 30 percent.51 This can alsohave a significant impact on water qualityand reduce water theft.
Leak Detection EquipmentAlthough some leaks that occur are visiblethrough general inspection of leak-proneareas, many leaks occur in pipes under-ground. Some of these leaks may be detect-ed as water flows to the surface, but oftenleaks go undetected for long periods oftime. Municipalities can employ a varietyof flow measurement devices and canutilize sonic and acoustic leak detectionequipment to pinpoint leaks. Althoughthese devices require an initial investmentof at least several thousand dollars, theyquickly pay for themselves.
A sonic leak correlator measures thetime it takes for the leak’s sound to travelto sonic sensors on both sides of the leak
Watergy
32

in order to pinpoint accurately the leak’slocation. In order for the correlator to takeaccurate measurements, the user requiresdetailed information on the type, size, andlayout of the pipe being measured.52
Flow-metering equipment can be usedto help isolate leaks by determining howmuch water is entering a certain part of the
water system and how much is being deliv-ered to the end user. Taking a variety ofmeasurements from different access pointscan further isolate leaks for repair. This isthe method of choice in PVC or concretepipe systems that do not carry sound well.
In one study funded by USAID in Galati,Romania, the consulting company Cadmus
5. Supply-Side Improvement Opportunities
33
Case Study: Bulawayo, Zimbabwe, Leak Detection Program
Bulawayo is a city of approximately one million people in Southwest Zimbabwe. The CityCouncil is responsible for providing water and sewerage services. Rainfall has historically beenvery erratic, leading to water shortages. Stringent rationing has, therefore, been in force formost of the past two decades. Water efficiency efforts in Bulawayo began in 1998 at theheight of a serious drought. The city council approached the Norwegian Embassy for assistancein relieving pressure on water resources. A water management study for Bulawayo that hadbeen funded by the British government in 1992 provided the basis for the city’s actions.
Losses from the system were estimated to be on the order of 22 million liters per day (MLD),about 25 percent of the rationed and restricted supply. The city set a target of reducing this to6–7.5 MLD. This will also have a significant impact on energy use, which currently accounts forabout 50 percent of delivery costs.
Water loss reduction is the city’s primary water management objective. A water managementsystem was designed to assist the city in increasing its capacity for water loss control.
To begin with, the city established a Leak Detection Division in the Engineering ServicesDepartment. Significant work was also carried out to map the water and sewer utility usingcomputer-assisted design, because previously available maps were inaccurate and out of date.
Calibration of a water network computer model is also being undertaken. For continuity andinstitutionalization of management efforts, the project managers document their actions,submit project policy documents, and construct procedure manuals.
The actual repair of leaks and breaks was identified as the main system management bottle-neck. Efforts are currently under way to streamline the process of identifying leaks and breaksand having them repaired as soon as possible.
Operations and maintenance of the water distribution system is also a major area of focus toprevent leaks and improve efficiency. Ensuring allocation of more resources for operations andmaintenance is a major responsibility of the project managers.
Additionally, in recognition of the need to measure bulk water flow and distribution, the cityhas been divided into about 50 metered zones. These will be equipped with managementmeters to be read monthly. Recorded flow will be compared with predicted average flow andbilled consumption. Minimum night flow measurements will also be taken at least annually.The city plans to undertake a series of water supply audits at the city level in addition to themeter zone level. Pressures are also being controlled with more accuracy with the introductionof 20 or so new pressure zones to control static pressures within the range of 30–60 meters.
Sources: Jeff Broome, project coordinator of the Bulawayo Water Conservation and SectorServices Upgrading Project, February 2001.

Group discovered energy conservation meas-ures that would cost about US$665,000, butsave US$400,000 in electricity costs annu-ally—a payback of 1.6 years. The measurewith the quickest payback was leak detec-tion. Because the parts to fix leaks are cheap(washers, seals, and so on), a leak detectionand elimination program would rapidly payfor itself. With simple measures, US$13,000per year savings were possible with onlyUS$5,000 of investment.53
5.3 SYSTEM REDESIGNMunicipal water utilities are often made upof complex, engineered infrastructure sys-tems. The overall design of these systems isone of the most critical features in a waterutility in terms of efficiency. This is onefeature that most operators or managersunfortunately have little noticeable controlover, unless in the midst of a systemupgrade. Redesigning the entire system orjust improving the design of specific areascan lead to major savings opportunities.
In the area of pump-system design, forexample, The Confederation of IndianIndustry recommends a systems approachto determine potential efficiency opportu-nities. Based on its experience, the confed-eration estimates that energy savings ofup to 25 percent are possible by following
the systematic methodology summarizedin these six questions:1. Is the pump really required?2. Is the pump correctly designed?3. Is the pump really efficient?4. Are the heads matched? (pump
heads with system heads)5. Is a variable speed drive installed to
match varying capacities?6. Are controls efficient?54
These questions, although designedspecifically in reference to pumps, raiseinteresting concerns valid for the entirewater system.
Is the System Really Required?Examining the question of whether a systemis really needed or not can potentially leadto the largest saving opportunities. Doesthe system really require all of its presentpumps, valves, bypass lines, and so on, orcan it be redesigned to make better use ofgravity and reduce frictional losses? Forinstance, many municipal water authoritieshave been able to remove pumps by takinggreater advantage of gravity or by makingbetter use of other existing pumps.
Is the System CorrectlyDesigned?Once it is determined that a system isactually necessary, a watergy efficiencyteam needs to determine if the system isdesigned correctly. For example, systemdesigners often intentionally oversizeequipment to ensure the equipment meetsmaximum system requirements. In somecases, the excess margins are as high as50 percent. Besides being inefficient, opera-tional problems of overdesign can includeexcess flow noise, pipe vibrations, andpoor performance. Overdesign can also
Watergy
34
Leaks can occur in many different areas,but common leak-prone areas include:• Water distribution mains and pipelines• Piping and equipment connections• Valves• Meters• Corroded or damaged system areas

result in unnecessarily large costs formaterials, installation, and operation.
Corrections to overdesign of pumpingsystems include:
� Installing a correctly sized pump� Installing an adjustable speed drive
(ASD) motor� Reducing impellers� Adding a smaller pump to reduce
intermittent operation.55
Is the Equipment Efficient?Upgrading to newer, higher efficiencyequipment will likely improve system per-formance if correctly sized and integratedinto the entire water system. Equipmentlikely to produce the most savings include:
� Energy-efficient motors� Adjustable speed drives� Impellers� Lower friction pipes and coatings� Valves� Capacitors.
Efficient MotorsChoosing a pump motor with a higheroperating efficiency will add to the overallefficiency of the pumping system. In addi-tion, to function efficiently, the motor mustbe selected to work correctly with the pump,that is, to match various requirements ofthe pump, such as start-up time, numbersof stops and starts, pump speed, andrequired torque.56
Adjustable Speed DrivesTo match varying load requirements, oneof the best available options to improvingefficiency is to install an ASD motor. Asthe name implies, ASDs make pump speedadjustments to meet the particular require-ments of a given system at a given time.One popular type of ASD is the variable
frequency drive (VFD), which uses elec-tronic controls to regulate motor speed.By slowing an oversized pump, a VFDreduces energy losses in pump operation.In addition to pumps, ASDs can reducewater treatment costs in aerated grit cham-ber blowers. ASDs work best in systemswith large frictional head. They may, infact, prove less efficient than other optionsin systems with large static head.57
ImpellersAnother alternative to improve efficiency isinstalling a smaller impeller or trimming theimpeller in the existing pump. An impelleris the spinning component in a centrifugal-type pump that pushes fluid through thesystem. Similar to the VFD motor, a smalleror trimmed impeller decreases the speed ofthe fluid to reduce energy losses. Becausetrimming the impeller reduces flow, friction-al losses from bypass lines and throttlevalves are reduced.58
Lower Friction Pipe and CoatingsPipes made of smooth material, such aspolyvinyl chloride, when compared withtraditional cast iron pipes, can reducefriction losses. Lower friction pipes canincrease energy savings by 6 to 8 percent.Applying certain resin and polymer coat-ings to the insides of a pump can achieveanother 1 to 3 percent improvement.Coatings can also reduce erosion andcorrosion in pipes and pumps.59
ValvesValves play a critical role in any watersystem by controlling flow and pressure.There are numerous types of valves fordifferent functions. In choosing the propervalve for a specific purpose, however, theimpact of the valve on system efficiency
5. Supply-Side Improvement Opportunities
35

should be considered. Some valves addmore friction to the system than others.For example, throttle valves are more effi-cient than bypass valves. This is the case,because, as a throttle valve is closed, it isstill able to maintain an upstream pressurethat can assist in moving water throughparallel parts of the system. The energyused to pump water that is bypassed ina system using a bypass valve is wasted.As the main option to control flow andpressure, water utilities may find it moreefficient to use ASDs instead of valves.60
CapacitorsInstalling capacitors can reduce theenergy required to run certain equipment.Capacitors are devices that store electrical
energy and are used to correct low powerfactors. Certain electrical equipment, suchas transformers, motors, and high intensitylighting, create magnetic fields in theiroperation that cause low power factors.Often this equipment represents a majorportion of the electricity used at a facility.Besides wasting energy, a low power factorcan cause premature equipment failure.Additionally, electric utilities often levypenalty fees for low power factors, so useof capacitors may avoid unnecessaryexpenses.61 The Ahmedabad MunicipalCorporation in India found significantbenefits in terms of cost savings andequipment performance by installingcapacitors on some of its major pumps.
Is the Equipment Matchedto the Task?Even if equipment is deemed efficient, thesystem’s efficiency will suffer if it is notappropriately matched to the task. Thismeans that pumps need to correspond tothe system’s requirements, impellers needto be sized to create desired flow rates, andVFDs must be installed in areas with highfrictional head to be effective.
Cost-effectively matching water pres-sure and flow-rate requirements with, forexample, pump and motor characteristicsis one of the most critical efficiency stepsin system design.62 Pumps will more oftenwork at their best efficiency point if awater utility is able to analyze water systemrequirements accurately and match themwith the appropriate pumps using pumpperformance curves. Software packages,such as the U.S. Department of Energy’sPumping System Assessment Tool, aredesigned to help users assess the efficiencyof a pumping system’s design.
Watergy
36

Pune, India, provides an example ofequipment not being matched to a task. Onreviewing several recent system upgrades,Pune’s newly formed water utility efficiencyteam determined that a number of expen-sive pumps added to a water intake stationwere not properly designed to work in tan-dem with the existing pumps. Even thoughthese new pumps were operating 24 hoursevery day, they were, in fact, not movingany water through the pipeline. Simplyby turning them off, the Pune MunicipalCorporation saved US$35,000 annuallywith no reduction in water delivered.
Is the Equipment Flexible toChanging System Demands?System demands are not static. Eventhough water systems are designed to meetthe requirements of peak usage, they donot operate at their peak load for a majori-ty of the time. A watergy efficiency teamneeds to determine how to optimize effi-ciency across the entire load cycle. Usinggravity storage, multiple pump arrange-ments, small pumps for off-peak use, andASDs, systems can be designed to reduceor eliminate efficiency losses from chang-ing system demands.
In the case of Kolhapur, India, forexample, an assessment was carried outwith support from USAID to maximize theefficiency of the current pumping systemby improving the division load require-ments among eight pumps. It was deter-mined that the utility could annually savemore than 2 million kWh and 8 millionrupees (US$180,000) by simply matchingthe most efficient pump combinations tothe required load.63
Are Controls Efficient?Computerized control systems can helpreduce energy use by monitoring pumpefficiencies, managing pump operation,shifting loads to off-peak times, and con-trolling VFDs for pumps.64 For example,programmable logic controls applied toelectrically controlled equipment suchas VFDs for pumps can help minimizeequipment-operating time. They alsoallow utilities to take advantage of lowerelectricity prices if the electrical utilitycharges different prices per kilowatt-hourin the course of the day.
Another type of control is the propor-tional, integral, and derivative (PID)control. PIDs can be used to moderatewastewater flows rather than allow waste-water to surge and then stop. Not onlyis this less energy intensive, but also canavoid offensive sewage odor. The MoultonNiguel Water District and the MaderaValley Water Company are two waterutilities based in California that havesignificantly cut operating costs by usingPID controls.
5.4 MUNICIPAL WASTEWATERTREATMENT–SPECIFIC PROCESSESImplementing energy efficiency measuresin wastewater treatment plants is impor-tant, as wastewater treatment oftenaccounts for 25 to 50 percent of a plant’soperating budget. Some processes consumemore energy than others and shouldreceive more concentrated attention. Forexample, in an activated sludge treatmentplant, the biological phase accounts for30–80 percent of a facility’s power costs.65
Groundwater and rainfall infiltrationinto the collection system is anotherimportant consideration, as this infiltra-tion increases the flow and load in the
5. Supply-Side Improvement Opportunities
37

wastewater treatment plants, overloadingequipment and pumps. Use of appropriatepipes and joints, such as PVC pipes insewers, decreases infiltration, and use ofan appropriate bypass at the plantentrance diverts excess flow from thepump station.
Preliminary andPrimary TreatmentPreliminary treatment of domestic sewagephysically removes solids through processessuch as screening, influent pumping, andgrit removal. In primary treatment, solidsand floating materials are removed in set-tling tanks.
Although most primary treatmentprocesses are not energy intensive, oppor-tunities to increase efficiency still exist.For example, debris in wastewater is some-times ground up into finer particles withcomminutors as an alternative to usingscreens to remove the debris from thewater. By using comminutors, more energy
is later required in the secondary treatmentstage to remove this material. A preferredalternative is removal of the debris usinga screen.66
For further reduction of operating costsin primary treatment:
� Remove as much debris from the wateras possible in the primary stage toavoid increased secondary treatmentoperating costs.
� Reduce water in the processed sludge,because lower water content can reducepumping needs and disposal costs.
� Use variable speed drives with aeratedgrit chamber blowers.
Secondary TreatmentSecondary wastewater treatment includesbiological water purification. These bio-logical processes are either a suspended-growth biological type, such as activatedsludge, or an attached-growth type, suchas trickling filters or biological contactors.The latter, usually applicable in medium-sized plant operations, is less energy con-suming than activated sludge. The energycosts associated with each of these optionswill obviously be a deciding factor on theultimate selection of an option.
Secondary treatment is much moreenergy intensive than primary treatment, soefficiency improvements can present sizablecost savings. For example, aeration devices,such as nozzles, diffusers, or mechanicalagitators, which provide oxygen formicroorganisms and mix wastewatersludge, use large amounts of energy.
The choice of agitation devices shouldbe considered carefully. Fine bubble dif-fusers have a tendency to be more energyefficient than coarse bubble diffusers,because smaller bubbles result in greateroxygen transfer. Conversion from coarse-bubble diffusers or agitators to a fine-bubble system should lower energy costsfor sewage aeration by at least 25 percent.Fine bubble diffusers, however, mayrequire more maintenance than coarse-bubble diffusers to keep them clean andoperating at optimal efficiency. For aparticular facility, the type and makeup ofthe wastewater will dictate the best choice.67
Watergy
38
Secondary treatment is much moreenergy-intensive than primary
treatment, so efficiency improvementscan present sizable cost savings.

There are other actions that can be takento improve secondary treatment efficiency:
� Install aeration control systems. Thesesystems optimize water treatment per-formance by controlling and adjustingthe amount of air put into wastewaterbasins.
� Investigate an oxidation ditch, if thefacility operates a lagoon system.Oxidation ditch systems are consideredefficient and easy to operate. They alsocreate no noise or odor problems, ifoperated properly. For lagoon systems,in contrast with tanks, care must alsobe taken not to pollute aquifers, lakes,or rivers.
� Optimize water flow, if the facility hastrickling filters that require wastewaterto be recirculated over the filter. Waste-water recirculation can be reduced whena facility’s wastewater load is lower, suchas at night; however, flow rates must beadequate to maintain bacteria growth.
� Reduce water in secondary sludge tominimize pumping and disposal costs.68
� If extended-aeration activated sludgeis considered, evaluate the conventionalactivated sludge option as well, becauseextended aeration requires aerationtanks four to six times greater than theconventional system, consuming fourto six times more energy.
� If land is available and a pond system isan option, it is important to note thatanaerobic and facultative ponds do notconsume energy, whereas aerated pondsrequire around 3–6 kWh/m3.69
After primary and secondary treatment,the solids removed from the water or sludgegenerally require further processing, offer-ing additional opportunities for efficiencyimprovements. Several methods of sludgetreatment are options, such as dewatering,
digestion, stabilization, air drying andincineration, and thickening. In sludgedewatering, different systems, such as filterpresses, centrifuges, and vacuum filters,have varying energy and maintenancecosts; the facility needs to assess the bene-fits and trade-offs that exist among thecosts for energy, operations and mainte-nance, and disposal. Incineration, anotherprocessing choice, can reduce the sludgedisposal volume considerably; however,air pollution controls should be adoptedif incineration is selected to avoid degra-dation of water resources that can resultfrom deposition of airborne pollutantsinto surface groundwater.
Disinfection OptionsAny water that undergoes primary and sec-ondary treatment must be disinfected toprotect public health. The three majordisinfection processes for wastewater arechlorination, ozonation, and ultraviolet(UV) irradiation.
Many municipal water and wastewatertreatment systems globally use the chlorina-tion disinfection method. Although a com-mon option, it should be noted that theOrganochlorine chemicals that accompanythis disinfection process can cause publichealth problems, jeopardize aquatic life,and reside in the environment for extendedperiods of time. Given the interest in bal-ancing the environmental impacts of chlori-nation with the ongoing need for effectivedisinfection, many water utilities havebegun to turn to other disinfection options.
Ozonation and UV radiation are twoadditional disinfection options that do notresult in deposition of any residual chemi-cals to treated water. Ozonation treatmentsystems have been employed in watertreatment operations since the early 1900s.Only in the 1970s did design engineers in
5. Supply-Side Improvement Opportunities
39

the United States begin to look at usingozone as an alternative to chlorine forwastewater disinfection. Ozone disinfec-tion systems produce ozone by creatinga corona discharge, similar to lighteningduring electrical storms.70 The ozone isthen mixed with water or wastewater toachieve the desired disinfection.
In the UV radiation process, UV raysact to disinfect wastewater by inactivatingthe pathogenic organisms through inducedphotochemical changes within the organ-ism’s cells. UV disinfection functions differ-ently from chlorination and ozonation, inthat, during the UV process, pathogens arenot destroyed, but instead lose their abilityto replicate. In a UV wastewater disinfec-tion system, the natural action of UV disin-fection is sped up through the intenseconcentration of UV rays.
UV systems are typically less costly tobuild and operate when compared withozonation. Both UV and ozonation O&Mand power costs depend on water quality,but final comparisons generally favor UVdisinfection.71 In the U.S. context, UV alsotends to be less expensive compared with
the costs of running a chlorination system.This is largely due to the hazards associat-ed with handling the chlorine feedstockand the costs of insuring against possibleaccidents at the facility. The Electric PowerResearch Institute expects UV to becomemore accepted, as wastewater facilitiesgrapple with the environmental concernsassociated with chlorination.72
Producing Energy fromWastewaterNot only are multiple energy-cost reduc-tions possible in the wastewater treatmentprocess, but utilities may also be able toproduce energy at some facilities usingexisting processes. The anaerobic digestionoption for sludge processing, for example,produces methane that can be burned as afuel source. Capturing digester gas canproduce both heat and electricity throughcogeneration. In addition, installing a tur-bine to generate electricity on the effluentoutfall can generate hydropower in selectfacilities. Plants with a 57-million-liter(15-million-gallon) per day flow and avertical drop of 15 ft could be candidates
Watergy
40
Case Study: Des Moines, Iowa, United States Methane Generation at CentralIowa Plant Turns Trash to Treasure
At the Integrated Community Area Regional Wastewater Treatment Plant serving central Iowa,operators are turning trash into treasure with an anaerobic digester system. Anaerobic diges-tion is a biological process in which microorganisms feed on organic matter, converting it tomethane gas and carbon dioxide. The anaerobic digesters in Des Moines produce an averageof 26,200 ft3 per hour of methane gas. The gas fuels three 600 kW engines.
In a wastewater treatment facility, sludge provides the organic matter. Thickened biologicalsludge, which is bacteria used to treat wastewater, is blended with primary sludge andpumped into an anaerobic digester. This digestion process works without oxygen. One type ofbacteria converts the organic material to organic acids. A second type of bacteria consumesthe organic acids and produces methane. The methane gas is collected, stored, and burned indiesel generators, producing electricity for use at the regional facility. Heat from the combus-tion of the gas is not wasted; it is used to heat the sludge entering the digesters as well as toheat buildings. The digested sludge is dewatered and belt pressed to produce cake that isapplied to land as fertilizer.
Source: IAMU 1998.

for effluent hydropower, generating about24 kW of power.73
Water Reclamation and Reuse“Gray water”—treated wastewater from autility plant that is not quite potable—hasa variety of applications. These includerecharging groundwater aquifers, supplyingindustrial processes, irrigating certain cropsand possibly even augmenting potablesupplies. Although reclamation of graywater may not change the amount of waterused by the customer, it does save energyand reduces treatment costs for that use ofthe water.
Pure water is very often used in applica-tions in which lower-grade water could bejust as effective. In Namibia, since 1968,residents have even used treated wastewaterto supplement up to 30 percent of the city’spotable water supply. Seventy percent ofIsraeli municipal wastewater is treated andreused, mainly for agricultural irrigation ofnonfood crops. In addition, extensive agri-cultural areas surrounding Mexico City(Mexico), Melbourne (Australia), Santiago(Chile), and multiple Chinese cities aresimilarly irrigated with wastewater.74 And,as of the mid-1990s in California, morethan 606 billion liters (160 billion gal) ofreclaimed water are annually used for irri-gation and groundwater recharge and inindustrial processes.75
It is important to note that reusedwater must meet water quality standardsto avoid public health problems and pre-vent surface water pollution. Many coun-tries have their own water quality criteriaand standards, based on either effluentstandards or water quality–limited bodiesof water. For agricultural water reuse orfor irrigation purposes, the World HealthOrganization has established specific
guidelines defining acceptable microbio-logical limits for reclaimed water.76
The city of Austin, Texas recentlyput out a municipal bond issue toinstall a water pipeline for the city cen-ter, solely for reclaimed water. This newpipeline will provide end users with acheaper source of water for lawns andgardens and other functions that donot require potable water. Austin plansto recoup its investment quickly byspending significantly less on deliveringpotable water from freshwater sourcesand greatly reducing demands on theentire system.
5.5 PROJECT IMPLEMENTATIONAfter developing a sizable list of potentialefficiency opportunities, a water utilitymust make well-informed decisions onwhich opportunities to implement andhow to make the projects happen. Costalong with several other factors will playa significant role in determining whatreally gets done.
5. Supply-Side Improvement Opportunities
41
Case Study: Beijing, China, IndustrialWater Reclamation
Industries in Beijing have historically reclaimedwater for a variety of processes. From 1978 to1984, the percentage of reused industrial waterrose from 46 to 72 percent. Manufacturing sec-tors, such as metal refining, metal products, andchemicals, had higher than 80 percent reuse;power generation, coal mining, and textile man-ufacturing were other key reuse sectors. Becauseof the water savings, even though industrial out-put increased 80 percent during this timeframe,water consumption actually declined slightly. Theexperience of Beijing’s industry shows that waterrecycling can be less expensive than transportingwater over long distances.
Sources: Xie, Kuffner, and LeMoigne 1993, p. 25.

A watergy efficiency management teammust now play the role of salesperson intrying to convince a funding source toprovide resources to implement projects.The team must prepare itself with criticalinformation that will make the projectmore attractive to potential funders. Tothis end, it may be useful for the watergymanagement team to solicit input fromkey financial personnel.
To get approval, a project proposal willlikely need to address the following keyissues:
� Equipment sizing and specification� Impact of projects on other parts of
the system� Planning for growth� Maintenance scheduling and accounting
for depreciation� Prioritization in accordance with:
— Company financial and maintenanceresources
— Available financing— Project return on investment— Overall capital investment needed— System technical constraints.
Doing the Financial AnalysisMany water companies may be limited inthe amount of resources they can devoteto improvement projects; thus, after iden-tifying improvements, the company shouldprioritize projects and implement optionsfor which it has the required resources.Measurements and monitoring not onlyprovide data for technical analysis, butalso yield figures for an economic analysis.To allow the project financial decisionmakers to assess projects, the expectedcost and savings for the project must bequantified.
Furthermore, identifying project costsand savings allows for the calculation of
payback, return on investment, or what-ever financial metric the company usesto assess projects. As with many privatesector financial decisions, various inflationadjustments may be made to identifyresults more accurately.
Project implementation will alsodepend on the ability of the facility tomake any operating changes needed forequipment installation. Not only doesnew equipment often need to be fittedcorrectly to work with existing systems,operators also need substantial trainingto make the equipment work.
Should You Start withPilot Projects?To reduce risk and develop the appropriatecapacity to implement projects on a largescale, many municipal utilities test ideasand potential actions on a small “pilot”level, before they commit to a large invest-ment. On the downside, pilot projects, dueto their size, cannot deliver the immediatesavings that larger projects might offer.Pilot projects nonetheless provide advan-tages such as:
� Verifying technology and savings� Identifying unforeseen technical or
logistical problems� Gauging public acceptance.
How Sure Are the Savings?Even though the best engineers can neverbe 100 percent sure of the potential calcu-lated savings for a given project, a fewpractical rules exist for improving thelong-term success of a watergy efficiencymanagement program:
� Start small and build a track record ofsuccess.
Watergy
42

5. Supply-Side Improvement Opportunities
43
Case Study: City of Fairfield, Ohio, United StatesTechnical Upgrades at a Small Facility
In 1986 the Fairfield Wastewater Treatment Facility got anew superintendent with a private business background.In an attempt to be proactive and innovative in reducingoperating costs, he decided to investigate peak electricaldemand and a costly power factor penalty. In the processof pinpointing viable options for improvements, thesuperintendent targeted several areas for enhancement.
He first convinced the utility to move to an automateddata collection system and update their process equipment.
Fairfield Wastewater also adopted a 3–5 year paybackthreshold for project investments. As a policy, if a projectfalls within this range it is easily financed and if the over-all costs are less than $15,000, it is automatically author-ized. This policy gives project managers more flexibility towork within a budget, with less micromanagement fromcompany executives.
To create cross-fertilization opportunities betweenemployees and departments, Fairfield holds weekly oper-ations team meetings at which employees can discuss newtechnology and energy efficiency ideas.
As one of their first projects, facility engineers carried outindividual equipment tests (for example, on motors 10 HPand up) to measure their efficiency. Now, they use thosedata trends to monitor if operating equipment falls with-in a reasonable band of operation. If there is any discrep-ancy, they carry out further investigations. Fairfield hasalso created a system to document and validate the savingsfrom energy efficiency measures.
Fairfield has also used load shifting and real-time pricingto achieve up to a 21–22 percent reduction in energy costs.When electricity prices peak, the facility can opt to use itsautomated system to shut down for 3–4 hours. Fairfieldmanagers have compared their operations with those ofother managers in Ohio, and estimate that most otherfacilities have wastewater costs that are twice as high.
Source: Drew Young, Fairfield Wastewater TreatmentFacility, February 2001.
� Be conservative with estimates; if atechnology promises 10–15 percentsavings, assume 10 percent.
� Check with peers to verify technologyand results of similar projects.
Project FundingTo fund a project, water utilities may haveto investigate a broad array of internal andexternal funding options. Many municipal-ities have experience borrowing moneyand may choose to address water efficiencyopportunities by approaching lendinginstitutions directly or issuing municipalbonds. Several innovative approaches,however, have been developed to providegreater flexibility to water utilities tofinance efficiency projects.
One internal funding mechanism thatcan help provide support for new efficien-cy projects involves returning a portion ofefficiency project savings into an accountto be used exclusively for more efficiencyactivities. After managers have shownsome initial success in reducing operatingcosts through efficiency, they can utilizeprevious project savings to pay for addi-tional activities.
Another alternative designed to stream-line funding for efficiency projects (seeFairfield, Ohio text box) is setting a pay-back threshold. Because efficiency projectsoften pay for themselves through savings,utilities can automatically fund projectsthat pay for themselves within a certainamount of time. Utilities generally set amaximum investment amount along withthe threshold. Payback thresholds allowefficiency projects to be initiated withoutwaiting for decisions from higher manage-ment.

If an important project does not meetthis threshold, managers can opt to bundleseveral smaller projects together into alarger project. For example, a pipe-reliningproject may have a payback of 6 years andnot meet the threshold of implementationalone. By including the lining project withan energy-efficient pump and a variablefrequency drive project with a much short-er payback, the combined project maymeet the payback threshold required toreceive funding.
Financing through EnergyService ContractsIf the municipality lacks the needed finan-cial resources and/or technical capacity toimplement a project, a range of financingarrangements may be possible throughenergy service companies (ESCOs). Energyservice contracts take many forms, but thebasic concept entails agreement by an out-side entity to take on part or all of the riskin implementing an efficiency project byinvesting some combination of money,equipment, and know-how into the cus-tomer’s facility. The customer then pays theinvestment back along with some presetprofit from the savings resulting from theproject. In most cases the outside entityonly makes its money back if the savingsactually occur.
Each municipal water company willneed to investigate the potential and appli-cability of ESCOs in their own particularcircumstances. The following is a list ofsome of the organizations working toexpand the reach of ESCOs around theworld. These organizations can also bevaluable resources to help educate interest-ed municipalities on ESCOs and link themto potential ESCO partners.
� Brazil: Association of Brazilian ESCOs(ABESCO) (<www.abesco.com.br>)
� Canada: Canadian Association ofEnergy Service Companies (CAESCO)(<www.ardron.com/caesco/>)
� Egypt: Egyptian Energy ServiceBusiness Association (EESBA)(<www.eesba.org/>)
� India: Council of Energy EfficiencyCompanies (CEEC)(<www.ase.org/ceeci/index.htm>)
� Japan: Japanese Association of EnergyService Companies (JAESCO)(<www.jaesco.gr.jp/>)
� Korea: Korean Association of ESCOs(KORESCO)(<www.energycenter.co.kr/>)
� United Kingdom: Energy SystemsTrade Association (ESTA)(<www.esta.org.uk/>)
� United States: National Association ofESCOs (NAESCO), which has conduct-ed trade missions to Mexico, Japan,Thailand, Australia, Brazil, and thePhilippines (<www.naesco.org>)77
Equipment LeasingLeasing equipment, such as capacitors,VSDs, and energy-efficient motors andpumps, is an additional mechanism avail-able to municipal water utilities to addressenergy efficiency opportunities. Municipalwater utilities that lack funding or accessto credit or are interested in testing tech-nologies before making large purchasesmay be especially interested in leasingenergy-efficient equipment.
Through leasing, municipalities candetermine in a real working environmentif a vendor’s product performance claimsare accurate without making long-termfinancial commitments. In addition,
Watergy
44

municipal water utilities can eliminatethe risk of purchasing faulty equipment.Municipalities having trouble raisingcapital or securing a loan to purchaseequipment may find vendors still inter-ested in leasing equipment, becauseof the relative ease in reposing leasedequipment.
In many cases, the municipality caneven pay for the cost of the lease throughenergy savings. One study done by theAhmedabad Municipal Corporation inIndia concerning the potential of leasing89 capacitors for water pumps found thateven with the most conservative estimates,energy savings from the capacitors wouldcover the lease costs.78
Leasing is not always the best option.The same study in Ahmedabad mentionedabove showed a simple payback of between1.5 to 3 years for purchasing the capaci-tors, which could be even more financiallyattractive for the municipality.
Technology andVendor SelectionOnce a project has been selected andfinanced, the choice of technology andvendor must be made. It is important toremember that vendors often make anarray of claims on the performance oftheir product. After installation, however,product performance in the facility com-monly can vary from the vendor’s claim.To mitigate project risks and make thebest investment:
� Contact peers who have implementedsimilar projects to gain their adviceabout technology and vendors
� Talk to peers about product benefitsand drawbacks
� Contact other clients of the vendor
� Check with local NGOs or tradeassociations where available
� Ask the vendor for performanceguarantees and a warranty.
5. Supply-Side Improvement Opportunities
45

47
6. Demand-Side ImprovementOpportunities
6.1 INTRODUCTIONReducing the amount of water consumed,while maintaining the level of benefit tothe customer can greatly reduce both theconsumer’s and utility’s cost. Water utilitiescan save money, because reducing demandeffectively creates more system capacity.By decreasing demand, a water utility canhelp avoid investments in new facilitiesand equipment. In addition, reducing theamount of water flowing through a systemwill likely reduce frictional energy losses,thereby reducing the cost of pumping. Theconsumer benefits from demand reductionthrough the reduced cost of delivery, thediminished chance of water shortfalls, andthe decreased likelihood of major invest-ment expenditures. Although some utilitiesare wary of demand-side programs thatmay affect revenue, in most cases, boththe short- and long-term savings fromdemand-side programs far outweigh costs.
This section describes several cost-effective methods and technologies thatcan be helpful in reducing municipaldemand on both water and energyresources. The cost-effectiveness of manyof these methods and technologies inpractice, however, requires accurate pricingof water to consumers to convey the true
cost of the water supplied by water treat-ment and delivery systems.
In addition to proper pricing, otherfactors that determine the applicability ofcertain demand-side measures to waterutilities include the market penetration ofwater-using appliances, the types of indus-tries linked to the system, and the technolo-gies available for the domestic market.
In Australia, for example, SydneyWater’s Mt. Victoria treatment plant wasoperating at close to capacity, so the utilityconducted a least-cost capacity upgradingstudy. The study found that the most cost-effective option to increasing capacitycombined several demand managementprograms that would significantly reducewater consumption, wastewater discharges,and nutrient loading. By turning to demand-side actions, the utility could defer andreduce the costs of expanding the treat-ment plant.79
A “Win-Win” for Utilitiesand CustomersThe goal of demand-side management isto provide the customer the same orgreater benefit using less water. In mostcases, a water customer derives no addi-tional value from using water inefficiently.
“Water is precious and scarce. If we all work together in the spirit of‘izandla ziyagezana’ (‘one hand washes the other’) to pay for water and use itwisely, we can all contribute to the task of managing water for the future...The undertaking of a Water Demand Management Programme to save waterthrough the efficient use of water is not a luxury but an absolute necessity.”
—Water Wiser Program, Johannesburg, South Africa

For example, a consumer flushing a toiletdoes not get any added benefit from atoilet that wastes water.
Water use can be reduced throughrelatively simple customer actions, suchas turning off the faucet while brushingteeth or using nontoxic wastewater towater plants. In addition, such water-saving devices as horizontal axis washingmachines, low-flow showerheads, faucetaerators, and ultralow flush toilets canreduce consumption. Ensuring each watercustomer uses water efficiently will helpoptimize the performance of the entireutility’s system. It may also defer oreliminate the need for spending largeamounts of capital for added capacity.
The City of Toronto , for example, hasbeen actively pursuing demand-side man-agement activities. The city has investedin programs such as ultralow flush toiletincentives, industrial water capacity buy-back, and horizontal axis washing machinepromotion, with the goal of reducingpeak water demand by 15 percent. Torontoestimates that its demand-side reductionefforts will cost about one-third as much ascreating an equal amount of new capacity.In addition, thousands of dollars in savingshave accrued to end users using less water.
Mexico City offers another exampleof how reducing demand can increasecapacity. Because of the difficulty of findingnew water sources for a burgeoning andincreasingly middle class population, cityofficials launched a water conservationprogram that involved replacing 350,000old toilets. These replacements havealready saved enough water to supply250,000 additional residents.80
CobenefitsThe impacts of demand-side measures canactually be much greater when organizedin conjunction with supply-side actions.For example, by coordinating a majordemand-side program with the purchaseof new energy-efficient pumps, the waterutility will not only save energy from thereduction of water moving through thesystem, but can also buy smaller, lessexpensive pumps to meet the reducedpumping demand. In many cases, demandreduction should precede system upgradesto help determine what the real baselinewater demand is on the system.
One of the most appealing aspectsof demand-side management activitiescompared with investing major capitalimprovements is the ability of the waterutility to develop, expand, or reduce agiven demand-side program quickly tomeet current conditions. Demand-sideprograms can have a major impact withina year, whereas major capital developmentprojects must be made years in advanceand are hard to alter to meet changingcircumstances.
The City of Toronto cited flexibility asone of the critical benefits to its demand-side project. With many uncertainties
Watergy
48
Reducing the amount of waterconsumed, while maintaining thelevel of benefit to the customer
can greatly reduce both theconsumer’s and the utility’s cost.

surrounding future demand, Toronto wasmuch more comfortable making smallerand incremental investments in demand-side management instead of making a 5-or 6-year investment for new capacity.
Another cobenefit of decreasing wateruse is the reduced demands on rivers,lakes, and groundwater resources. This isespecially important considering the num-ber of major lakes and waterways that aredisappearing and aquifers that are declin-ing due to overuse of water resources.
For example, the largest natural lakein northern China, Lake Baiyangdian inthe Hebei province is likely to dry outcompletely due to a combination of over-drafting and diminished rainfall. This willlikely have a major negative effect on thepopulace and stability of the region.81
An example of the overuse of ground-water can be found in Ahmedabad, India,where overextraction has caused the city’swater table to drop an average of 7 ft peryear in the past 20 years. Not only doesthis put the future of the regional aquiferin jeopardy, but it also forces consumerswho rely on groundwater to pay more toget it. The local power company estimatesthat it requires an additional 0.04723 wattsper gallon to pump water to the surfacewith every 7 ft drop in the water table.This translates into an additional 1 millionkWh per year to bring the same amountof water to the surface at an added annualcost of more than US$60,000.82
6.2 DEMAND-SIDETECHNOLOGIES: RESIDENTIALAND COMMERCIALA multitude of residential and commercialtechnologies exist that can help achievesignificant water savings and reduce costs.Some of these measures may actuallysave the consumer additional money byreducing energy expended to heat greaterquantities of hot water.
One example of the enormous watersavings potential of these technologiescan be found in a March 2000 USAIDstudy on the opportunity for water efficien-cy improvements in the hotel industry inBarbados. The study found that hotelsthat aggressively use water-saving tech-nologies, such as low-flow toilets, faucetaerators, and drip irrigation, consume aslittle as one-fifth of the water per guest assimilar hotels with less aggressive waterefficiency actions; guests at the morewater-efficient hotels noticed no reductionin service. In addition, the study estimatedthat the least-efficient hotel surveyed couldachieve more than US$250,000 in savingsper year in water bills alone if it emulatedthe most efficient hotel.83
A water utility demand-side programmay promote one or more of severalavailable efficiency technologies.
6. Demand-Side Improvement Opportunities
49

Common Water-SavingTechnologiesSeveral technologies are available to savewater:
Ultralow Flow ToiletsIn the past, typical toilets have usedbetween 19 and 26 liters (5–7 gal) perflush. Ultralow flush toilets can do thesame job using as little as 3 liters (0.8 gal)per flush. Consideration should be givento the model(s) of toilet selected for anyultralow flow toilet programs, given awide discrepancy in performance.
Toilet Dams or Other WaterDisplacement DevicesToilet dams are devices that block part ofthe tank so that less water is required tofill the toilet following each flush. Otherwater displacement devices simply reducethe amount of space in a toilet’s holdingtank so that each flush uses less water. Aplastic bottle filled with water does a goodjob in limiting the tank’s capacity. Someproblems may occur with the need to dou-ble flush, but water savings from thesedevices are estimated at about 10 percent.
Low-Flow ShowerheadsTypical showerheads use about 17 to 30liters (4.5–8 gal) per minute. Low-flowshowerheads use less than 9.5 liters (2.5gal) per minute with no marked reductionin quality or service. These devices saveboth water and reduce water heating bills.
Efficient Faucet AeratorsThese devices can easily be installed onthe ends of most faucet systems to replaceexisting aerators. Even though thesedevices allow less water to flow throughthe faucet, most consumers will not notice
Case Study: Tampa, Florida, United StatesComprehensive Approach
Since 1989 Tampa’s water efficiency program has promot-ed revised rate structures, retrofits, xeriscaping, and con-sumer education. Within the first 9 months, waterconsumption fell from 320.2 million liters to 274.4 millionliters (84.6 million to 72.5 million gal). During the drymonths of March through June, a 15–18 percent reduc-tion in demand was achieved. The average reduction forthe year was 7 percent.
In addition, Tampa has adopted an increasing block-ratestructure, irrigation restrictions, landscape codes, andultralow-volume plumbing requirements. Voluntaryxeriscape programs advocate corporate landscape con-versions and state-of-the-art irrigation and design fornew construction.
In December 1989 water-saving kits were delivered toabout 10,000 Tampa homes. Each kit included two toilettank dams, two low-flow showerheads, two lavatoryfaucet aerators, some Teflon tape to seal connections,a pamphlet on finding and fixing leaks with a general“water-saving tips” card, an installation instruction folder,a window display card, and leak detection dye tablets.The kit came with instructions in both Spanish andEnglish and included a letter from the mayor encouragingparticipation. This effort resulted in more than 94 percentof the recipients installing the devices and a savings of7–10 gal of water per person, per day. Tampa estimatessimilar retrofitting of all the homes in Tampa will realizesavings of more than 2.1 million gal of water per day.
Additional efforts in Tampa include school water conser-vation poster and limerick contests, an expanded retrofitprogram, toilet-replacement incentive projects includinga rebate program, implementation of water checkupsfor large residential water users, and enhanced in-schoolcurriculum-based education.
Source: Rocky Mountain Institute, Water Efficiency:A Resource for Utility Managers, Community Planners,and Other Decision Makers, (Snowmass, CO: RockyMountain Institute, The Water Program, 1991).
Watergy
50

a difference, except in the reduction intheir water and water heating bills. Thesedevices can save between 12 and 65 liters(3.2–17.2 gal) per day.
Efficient Clothes WashersWater- and energy-efficient clothes washerscan save tremendous amounts of energyand water. Front-loading clothes washersuse up to 40 percent less water than theirtop-loading peers.
Tables 6 and 7, taken from theAmerican Water Works Association’s WaterConservation Guidebook, highlight the sav-ing potential of some of these technologiesin both new homes and existing homeretrofits.84
XeriscapingPlanting native plant species that are ableto survive under local rain and climateconditions can save large amounts ofirrigation water.
Drip IrrigationUsing an underground drip irrigation water-ing system that tightly controls the amountsof water delivered to specific locations cansave between 15–40 percent of water usecompared with other watering systems.85
Other Energy Efficiency MeasuresSeveral other technologies may be of inter-est to consumers looking to save energyand water, but do not usually have a majorimpact on the water utility. Energy-efficientwater heaters,* hot water pipe insulation,and hot water-on-demand systems can helpsave both energy and water, and the con-sumer receives the bulk of the benefit.These technologies may be of considerablymore interest to a natural gas or electricutility for demand-side actions.
6. Demand-Side Improvement Opportunities
51
Case Study: Community Involvementin Ahmedabad, India
Self-Employed Women’s Association (SEWA), anAhmedabad-based organization, has launched a watercampaign in Gujarat to empower women, the primaryuser group, to demand a safe and sustainable watersupply at the village level. The campaign is intendedto integrate the three “Ws”: women, water and work.Mobilizing women to manage local water resources hasmade this possible, enhancing income levels and creatingnew economic opportunities.
As part of SEWA’s water campaign, women have success-fully constructed plastic-lined pond and rooftop waterharvesting tanks in a number of arid villages. Efforts havealso been made toward implementing watershed devel-opment measures to conserve water. Unused wells arebeing repaired, tanks desilted and check dams construct-ed. Women have formed water committees and set upwater funds for the maintenance of water structures.There have been instances in which women have beentrained as ‘barefoot technicians’ to repair and maintainhand pumps.
The impact of SEWA’s intervention is apparent with thetransformation in the socioeconomic conditions of thevillages. Apart from developing water sources at thevillage level, women have largely benefited from theemployment opportunities that have been generated.Women have been employed in artisan work, handicrafts,gum collection, and salt manufacture. Productivity hasincreased, which in turn, has led to enhanced incomesand increased savings. Other benefits of this waterinitiative are exemplified by improved women’s health(normally the lowest priority); safe motherhood; safechildbirth; lower infant mortality; increased social securityfor woman and child; and, most important, reducedmigration during the lean season. Augmentation ofwater sources has also ensured food and fodder security.
Source: Self-Employed Women’s Association,<www.sewa.org> (accessed December 2001).
* Efficient hot water heaters are rated at 234 therms per year for a 40 gal/152 liter gas water heater or 4,671 kWhper year for a 40 gal/152 liter electric unit (American Council for an Energy Efficient Economy, 2001, ConsumerGuide to Home Energy Savings, <www.aceee.org>).

Watergy
52
ApplicationWater-Saving
Device Function Water Savings
Estimated PerPerson Water
Savings in gpcdand (lpcd)
Toilet Two toilet tankdisplacement bottles
Reduce flush volume 1.5 gal/flush(5.7 l/flush)
2.0(7.6)
Toilet Toilet tank dam Reduce flush volume 1 gal/flush(3.8 l/flush)
4.0(15.1)
Toilet Toilet tank bag Reduce flush 0.7 gal/flush(2.6 l/flush)
2.8(10.6)
Shower Flow restrictor Limit flow to 2.75gal/min(10.4 l/min)
1.5 gal/min(5.7 l/min)
3.7a
(13.2)
Shower Reduced-flowshowerhead
Limit flow to 2.75gal/min(10.4 l/min)
1.5 gal/min(5.7 l/min)
7.2(27.2)
Faucet Aerator with flowcontrol
Reduced splashing,create appearance ofgreater flow
1.2–2.5 gal/min(4.5–9.5 l/min)
0.5(1.9)
Toilet Ball cocks, flappervalves
Stop leaks 24 gal/day/toilets(91 l/flush)
4.8b
(18.2)
Table 6: Water-Saving Devices for Existing Houses86
ApplicationWater-Saving
Device Function Water Savings
Estimated PerPerson Water
Savings in gpcdand (lpcd)
Toilet Low-flush toilet3.5 gal/flush(13.2 l/flush)
Reduce flush volume 2 gal/flush(7.6 l/flush)
8.0(30.3)
Toilet Ultralow flush toilet1.6 gal/flush(6.1 l/flush)
Reduce flush volume 4 gal/flush(15.1 l/flush)
16.0–23.1(60.6–87.4)
Shower Reduced-flowshowerhead2.75 gal/min(10.4 l/min)
Reduce shower flowrate
1.5 gal/min(5.7 l/min)
7.2(27.2)
Faucet Aerator with flowcontrol
Reduce splashing,create appearance of greater flow
1.8–2.5 gal/min(6.8–9.5 l/min)
0.5(1.9)
Appliances Water-efficientdishwasher
Reduce waterrequirement
5 gal/load(18.9 l/load)
1.0(3.8)
Appliances Water-efficientclothes washingmachine
Reduce waterrequirement
6 gal/load(22.7 l/load)
1.7(5.6)
Table 7: Water-Saving Devices for New Construction87
a. Shower time increases over that for reduced-flow showerheadb. Assumes one person per toilet and 20 percent leakage rate of toiletsNote: gpcd = gallons per capita per day
lpcd = liters per capita per day

6. Demand-Side Improvement Opportunities
53
6.3 PROGRAMSMunicipal water utilities can undertakenumerous activities to promote demand-side reductions at the residential andcommercial level. These programs fallunder the following areas:
� Education and outreach� Water audits� Water efficiency kits� Rebate/installation programs.
Education and CommunityOutreachThe consumption behavior of customershas a dramatic effect on water demand.Educating customers on ways to reducewater use and save money can, in fact, bean extremely cost-effective way to reducedemand. Many municipal water utilitieshave developed educational outreachprograms targeted at residential and com-mercial consumers. In Singapore for exam-ple, such a program developed a waterefficiency curriculum, including textbook,workbooks, and experiments, for schoolchildren and routinely distributed informa-tional pamphlets on water savings oppor-tunities to all residences. As a result of thisprogram, a survey conducted in 1999showed that 84 percent of the respondentshad taken some action to save water.88
Programs, such as the one in Singapore,have communicated the importance ofwater efficiency through a host of activitiessuch as:
� Giving educational talks at schools andcommunity organization meetings
� Participating in speakers’ bureaus� Operating booths at community events� Organizing water efficiency workshops
for plumbers, landscapers, and builders� Advertising on radio and television and
in newspapers
� Organizing a committee of localstakeholders to provide feedback andreview of water use activities
� Producing materials for school scienceand environmental curricula
� Including water efficiency tips inbilling statements.
Water AuditsThrough water audits and implementationassistance, a water utility can work withresidential and commercial water users toimprove watergy efficiency. In many cases,water audits can direct the end user tothe greatest savings opportunities and actas a catalyst to induce implementation ofefficiency measures.
Residential water audits can producemajor water savings. Residential audits areoften critical in detecting leaky toilets,faucets, and pipes and informing residentsof the savings opportunities associated withtaking action. It is also a good way to edu-cate consumers on many of the water-savingtechnologies available. It may be advisableto target water audits at groups that mightget the most benefit from the audits, suchas older homes or apartments that may havemore opportunities for improvements.
Many utilities employ mascots, such asCAGECE’s two water efficiency gurus,Pingo and Gota d’Agua, for their water-saving outreach programs.

For example, a four-month water auditpilot project in Thokoza (township),South Africa, resulted in savings of 195million liters of water and 2 million SouthAfrican Rands (US$250,000) a year forabout 2,000 homeowners. During thistime, 24 township entrepreneurs were alsotrained in basic plumbing skills, enablingthem to continue with their own smallbusinesses.89
Offering Efficiency Kits toCustomersIn many cases, it is cost-effective to offerfree or low-cost water efficiency kits tocustomers. These kits may contain inex-pensive water-saving devices such as:
� Toilet water displacement bags ortoilet dams
� Leak detection tablets� Low-flow faucet aerators� Low-flow showerheads.
Rebate/Installation ProgramsRebate and installation programs are oftenone of the most effective measures toensure demand-side reductions. Municipalwater utilities can offer to cover part or allof the costs of water-saving equipmentand installation. Some of the most com-mon equipment covered under theseprograms are:
� Low-flow faucets� Ultralow flush toilets� Efficient washing machines in apart-
ment buildings.
In Toronto, for example, one pilotprogram installed 16,000 ultralow-flushtoilets at no cost to the end user andtracked savings of 3.6 million liters perday. The tracking of savings will continuefor the long term to make sure thatinvestment by the city is maintained.
6.4 INDUSTRIALMany of the same tools municipal waterauthorities have in reducing demand in theresidential and commercial sector also applyto the industrial sector. Water efficiency inthe industrial sector can be enhancedthrough water audits, capacity buyback pro-grams, and incentives to reuse wastewater.Similar to the residential and commercialsectors, water efficiency can be augmentedin the industrial sector through education,outreach, and financial incentives.
Water AuditsWater audits can help bigger water cus-tomers, such as large farms, manufacturingfacilities, building complexes, and universi-ties, institute their own water managementprograms.
For example, a water and energy auditat a textile mill in Ecuador identifiedmeasures to reduce water use by almost25 percent. The recommendations includedreusing water from the rinse and coloringprocesses, optimizing washing equipment,minimizing water-pumping operations,and replacing inefficient pump motors.The water-saving measures cost onlyUS$2,652 to implement and annuallysave almost US$22,000.90
Table 8 (next page) shows commonlyimplemented industrial efficiency measures.
Capacity Buyback ProgramsWater utilities that are especially conscien-tious of water supply issues can turn towater capacity buyback programs to helpinduce water efficiency in the industrialsector. This type of program pays indus-tries to reduce their water demand signifi-cantly on a permanent basis. In Austin,Texas, industries of all sizes are offered adollar for every gallon (3.8 liters) of water
Watergy
54
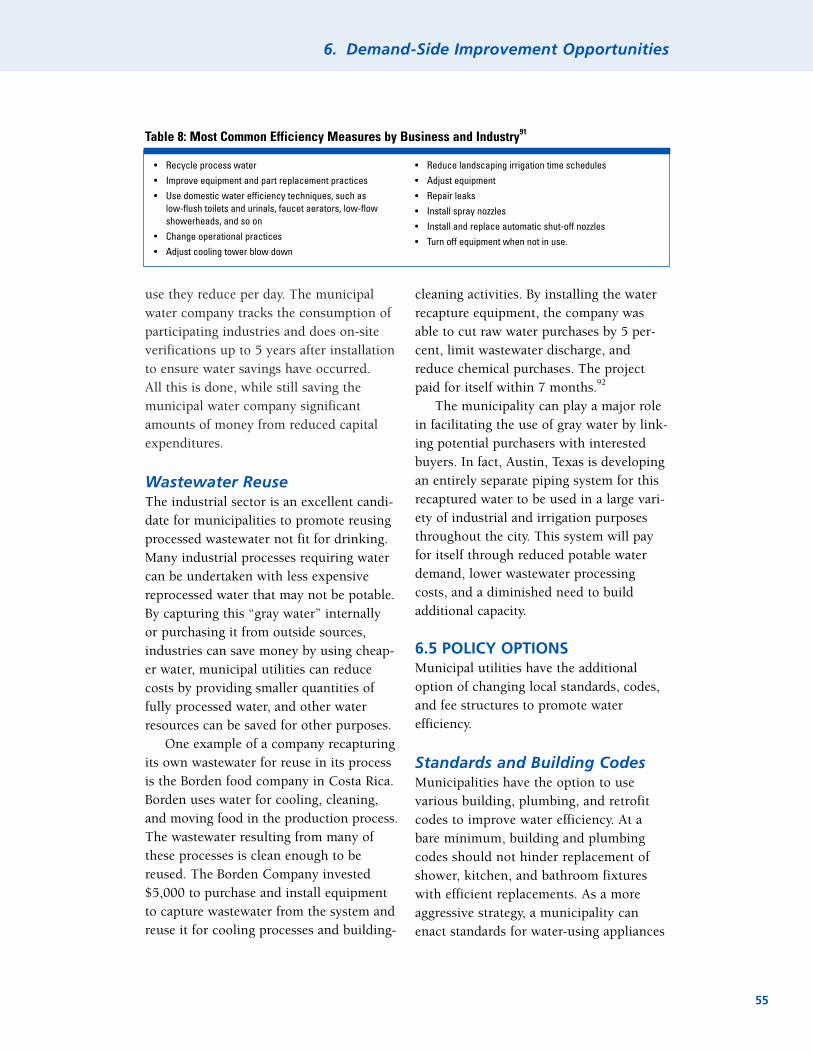
use they reduce per day. The municipalwater company tracks the consumption ofparticipating industries and does on-siteverifications up to 5 years after installationto ensure water savings have occurred.All this is done, while still saving themunicipal water company significantamounts of money from reduced capitalexpenditures.
Wastewater ReuseThe industrial sector is an excellent candi-date for municipalities to promote reusingprocessed wastewater not fit for drinking.Many industrial processes requiring watercan be undertaken with less expensivereprocessed water that may not be potable.By capturing this “gray water” internallyor purchasing it from outside sources,industries can save money by using cheap-er water, municipal utilities can reducecosts by providing smaller quantities offully processed water, and other waterresources can be saved for other purposes.
One example of a company recapturingits own wastewater for reuse in its processis the Borden food company in Costa Rica.Borden uses water for cooling, cleaning,and moving food in the production process.The wastewater resulting from many ofthese processes is clean enough to bereused. The Borden Company invested$5,000 to purchase and install equipmentto capture wastewater from the system andreuse it for cooling processes and building-
cleaning activities. By installing the waterrecapture equipment, the company wasable to cut raw water purchases by 5 per-cent, limit wastewater discharge, andreduce chemical purchases. The projectpaid for itself within 7 months.92
The municipality can play a major rolein facilitating the use of gray water by link-ing potential purchasers with interestedbuyers. In fact, Austin, Texas is developingan entirely separate piping system for thisrecaptured water to be used in a large vari-ety of industrial and irrigation purposesthroughout the city. This system will payfor itself through reduced potable waterdemand, lower wastewater processingcosts, and a diminished need to buildadditional capacity.
6.5 POLICY OPTIONS Municipal utilities have the additionaloption of changing local standards, codes,and fee structures to promote waterefficiency.
Standards and Building CodesMunicipalities have the option to usevarious building, plumbing, and retrofitcodes to improve water efficiency. At abare minimum, building and plumbingcodes should not hinder replacement ofshower, kitchen, and bathroom fixtureswith efficient replacements. As a moreaggressive strategy, a municipality canenact standards for water-using appliances
6. Demand-Side Improvement Opportunities
55
• Recycle process water• Improve equipment and part replacement practices• Use domestic water efficiency techniques, such as
low-flush toilets and urinals, faucet aerators, low-flowshowerheads, and so on
• Change operational practices• Adjust cooling tower blow down
• Reduce landscaping irrigation time schedules• Adjust equipment• Repair leaks• Install spray nozzles• Install and replace automatic shut-off nozzles• Turn off equipment when not in use.
Table 8: Most Common Efficiency Measures by Business and Industry91

and fixtures in new and publicly ownedbuildings and mandate building retrofitsfor efficiency. Requirements for landscap-ing, drainage, and irrigation might alsobe created for new development areas andpublic spaces.
During times of drought and otherwater supply emergencies, certain uses canbe restricted, such as washing sidewalks,nonrecirculating fountains, and wateringgardens and soccer fields.
Tax breaks for major water efficiencyprojects and rebates for water-efficientfixtures are also viable ways to stimulateefficient water use.
Proper Pricing andRevenue GenerationWater subsidies may be one of thestrongest enemies working against waterefficiency. First, sending consumers anincorrect price signal by charging a lowerthan cost water rate can lead to water beingundervalued and wasted. Second, artificial-ly low prices increase the payback time formany water efficiency projects. Third, lowrates can lead to municipal water compa-nies having limited resources with whichto enact other efficiency measures.
By developing a price structure thatreflects the true cost of water, consumersare sent the correct signal on the value ofwater and will be more apt to act on effi-ciency opportunities. Experience showsthat developing and implementing properpricing policies takes careful thought,preparation, and consumer education.The true cost of using water may consistof multiple variables including chemical
Watergy
56
Case Study: Sydney WaterActive Leakage Control Program
To reduce water demand, Sydney Water has made signifi-cant efforts to minimize water delivery losses and recycleused water.
Sydney’s Active Leakage Control Program is a remarkableeffort. It is intended to reduce leakage from the systemfrom an estimated 11 percent to 8 percent of total supply.Leakage studies were completed in their Vaucluse andWiley Park reservoir zones; six more areas are scheduledfor investigation in 2000 and 2001. The pilot studies dis-covered a range of system losses, including some largeleaks. Additionally, a planned pressure reduction trial willassess the potential cost-effectiveness of reducing pres-sure for leak reduction.
Sydney Water has increased the volume of reused waterby 60 percent since 1994–95 to approximately 27 millionliters per day. Most of the diverted water from dischargeis for use in sewage treatment plant processes. Recycledwastewater now makes up almost 80 percent of the waterused by Sydney Water treatment plants. Furthermore,the amount of drinking-quality water used by the plantshas been cut in half. Additionally, several major waterrecycling projects with large industrial customers in theIllawarra region and at Kurnell are expected to becomeoperational by 2003. Contractors are completing installa-tion of upgraded treatment facilities at Sydney’s Rouse Hillrecycled water plant to meet the requirements of NewSouth Wales Health, the territory agency that protectspublic health. With upgrades, Rouse Hill will ultimatelysupply recycled water to 100,000 homes for toilet flushingand garden use.
As a component of WaterPlan 21, Sydney Water produceda 20-year strategic plan for water recycling in December1999. WaterPlan 21 is a vision for sustainable water andwastewater management for the entire Sydney, Illawarra,and Blue Mountains region.
Source: Sydney Water, 2000, “Environmental Impact ofUsing Energy,” Annual Environment and Public HealthReport 2000, <www.sydneywater.com. au/html/Environment/enviro_index.htm> (Sydney, Australia).

6. Demand-Side Improvement Opportunities
57
agents, electrical pumping, peak demandcharges, on-site pretreatment, and relatedlabor.93 Prices should also include capitaland environmental costs, and encourageefficient use of water.94
In allocating costs in a rate structure,the impact on both the quantity of waterdemanded and the revenue from differenttypes of users should be considered. Todetermine an appropriate price, the utilitycan try to ascertain what percentage demandwill be reduced by a given percentage ofchange in price. A pricing structure willideally help:
� Meet demands on both the infra-structure and natural systems in amore efficient manner
� Maintain sufficient revenue and recovercosts for the company
� Allow a customer to afford payments� Provide targeted lifeline subsidies for
the very poor, developed in a trans-parent and equitable manner.For example, the Ghana Water and
Sewerage Corporation began a program inthe early 1990s to convert water systemsto community-managed services. Theyran into difficulty, however, in collectingpayments from poorer rural communities.Because the Water and Sewage Corporationcould not recover costs, the community-managed approach could not be sustained.An important lesson to be taken from this
example is that community involvementfrom the beginning is essential. Communityinput must be sought concerning all deci-sions on the water systems they want, thesystems they can afford, and where the sys-tems should be installed. This is especiallytrue where water users follow traditionalpractices, such as in rural villages, or wherecustomers may be poor.95
Demand-side reductions offer a cost-effective mechanism for municipal waterutilities to reduce costs and improve cus-tomer satisfaction. Multiple technologiesare available that allow the consumer toget equal or better service from water,while actually using less. Promoting thesetechnologies often costs much less thanincreasing capacity. By pursuing demand-side reduction aggressively, water utilitieswill also be in a better position to reapsupply-side savings.
Water subsidies may be one of thestrongest enemies working against
water efficiency. Prices should reflectthe costs of production; sending the
proper price signals can spurinvestment in efficiency.

By 2020 developing countries will join thedeveloped world in having more than 50percent of their populations living inurban centers.96 As people move in ever-greater numbers to cities, the burden ofproviding water to growing urban popula-tions will become even more critical to thesustainability and prosperity of municipal-ities. Only about half of urban dwellers indeveloping countries currently have waterconnections in their homes, and morethan one-quarter have no access to safedrinking water.97Additionally, in manydeveloping world cities, upward of 50 per-cent of water pumped into the system islost before it ever reaches the consumer.98
Many cities in the developed world alsohave water losses of more than 20 percent,underutilize potential energy-saving tech-nologies, and have consumers who regu-larly waste water.
It is clear that cities, in both the devel-oped and developing world, waste energy,water, and financial resources because ofinefficiency present within public and pri-vate municipal water utilities. This reporthas described the many cost-effective waysavailable to reduce waste and expenses,while improving overall service. Many ofthese actions can be undertaken by utili-ties with limited resources. Even themost efficient municipal water authoritieshave a large number of options to helpmaximize the efficiency with which theydeliver water.
Water utilities can address efficiencymore successfully by creating and improv-ing watergy efficiency management struc-tures and capacity. In many cases, buildinga team of well-equipped staff willing tolook holistically at the water and energynexus, as identified by the watergy con-cept, can maximize efficiency gains.Additionally, by educating consumers,water utilities can continuously improvetheir contribution to the public good.
The ability of a municipal water utilityto deliver water in a cost-effective andresource-efficient manner has a greatimpact on people’s standard of living. Byembracing opportunities to improve theefficiency of water delivery cost-effectively,municipal water utilities can help improveand ensure the quality of life for cityinhabitants for generations to come.
59
7. Conclusion

The municipal water utilities highlightedin the following case studies representorganizations at various stages in the pro-gression toward establishing dedicatedwatergy management structures and devel-oping corresponding institutional capacity.As described earlier in the document,watergy efficiency describes the nexusbetween water and energy within munici-pal water utilities.
These 17 case studies attempt to illus-trate how the watergy efficiency concept isbeing applied in day-to-day operations ofutilities around the globe. They collectivelydisplay the many attributes that make upthe watergy efficiency concept. Each casestudy demonstrates innovative ways thatutilities have sought to integrate watergyconcepts into their operations. The com-pendium includes municipal utilities fromdifferent parts of the world in both devel-oped and less developed countries to offera broad spectrum of watergy approaches.Also, the cities range from being very waterand energy rich to being in the middle ofsevere water and energy shortages.
The case studies are divided into threesections entitled watergy efficiency,demand-side management, and supply-sidemanagement. Although all the municipalwater utilities included in this study areimplementing some combination of waterand energy efficiency activities, few havebeen able to achieve a clear level of coman-agement. Examples of four municipalitiesthat have successfully begun to adoptwatergy efficiency team practices areincluded under the watergy efficiencysection. The next two sections describemunicipalities that have implementedstrong demand and/or supply-sideefficiency programs.
CASE STUDIES
Watergy EfficiencyI. Austin, United StatesII. Stockholm, SwedenIII. Sydney, AustraliaIV. Toronto, Canada
Demand-Side ManagementV. Medellín, ColombiaVI. Johannesburg, South AfricaVII. San Diego, United StatesVIII. Singapore
Supply-Side ManagementIX. Accra, GhanaX. Ahmedabad, IndiaXI. Bulawayo, ZimbabweXII. Columbus, United StatesXIII. Fairfield, United StatesXIV. Fortaleza, BrazilXV. Indore, IndiaXVI. Lviv, UkraineXVII. Pune, India
61
Case Study Compendium
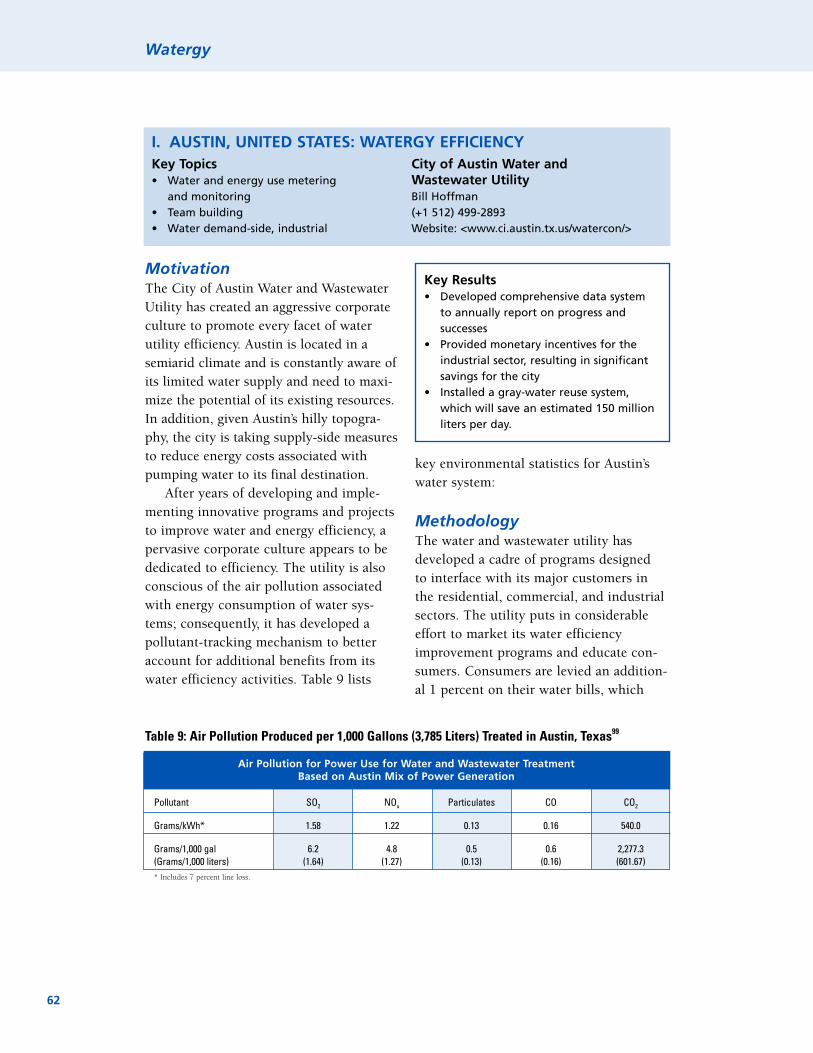
Watergy
62
MotivationThe City of Austin Water and WastewaterUtility has created an aggressive corporateculture to promote every facet of waterutility efficiency. Austin is located in asemiarid climate and is constantly aware ofits limited water supply and need to maxi-mize the potential of its existing resources.In addition, given Austin’s hilly topogra-phy, the city is taking supply-side measuresto reduce energy costs associated withpumping water to its final destination.
After years of developing and imple-menting innovative programs and projectsto improve water and energy efficiency, apervasive corporate culture appears to bededicated to efficiency. The utility is alsoconscious of the air pollution associatedwith energy consumption of water sys-tems; consequently, it has developed apollutant-tracking mechanism to betteraccount for additional benefits from itswater efficiency activities. Table 9 lists
key environmental statistics for Austin’swater system:
MethodologyThe water and wastewater utility hasdeveloped a cadre of programs designedto interface with its major customers inthe residential, commercial, and industrialsectors. The utility puts in considerableeffort to market its water efficiencyimprovement programs and educate con-sumers. Consumers are levied an addition-al 1 percent on their water bills, which
Air Pollution for Power Use for Water and Wastewater TreatmentBased on Austin Mix of Power Generation
Pollutant SO2 NOx Particulates CO CO2
Grams/kWh* 1.58 1.22 0.13 0.16 540.0
Grams/1,000 gal 6.2 4.8 0.5 0.6 2,277.3(Grams/1,000 liters) (1.64) (1.27) (0.13) (0.16) (601.67)* Includes 7 percent line loss.
Table 9: Air Pollution Produced per 1,000 Gallons (3,785 Liters) Treated in Austin, Texas99
Key Results• Developed comprehensive data system
to annually report on progress andsuccesses
• Provided monetary incentives for theindustrial sector, resulting in significantsavings for the city
• Installed a gray-water reuse system,which will save an estimated 150 millionliters per day.
I. AUSTIN, UNITED STATES: WATERGY EFFICIENCYKey Topics• Water and energy use metering
and monitoring• Team building• Water demand-side, industrial
City of Austin Water andWastewater UtilityBill Hoffman(+1 512) 499-2893Website: <www.ci.austin.tx.us/watercon/>

goes into a fund to support municipalwater efficiency.
About the Program
Metering and MonitoringThe Austin water utility has a rigorousenergy use– and water flow–monitoringprogram. By installing multiple submetersand coordinating transmission of pertinentinformation directly from meters to crewsthat repair lines, Austin has achieved theadmirable rate of only 8 percent unac-counted-for water.
The utility also has an advanced waterconsumption–monitoring system thathelps focus the resources of its demand-side programs. It is able to track up to 30categories of water users, such as hospitalsand schools. This permits the demand-sideprogram to target major water wasters bet-ter, either by comparing across sectors orbenchmarking customers within a sector.For example, if one hospital is consumingmuch more water than its peers, it is aprime candidate for a water audit.
To empower managers and employees,the Austin water utility also provides use-ful data to employees via e-mail. Data suchas specific pumping information, customersales, and system performance are continu-ously sent to designated staff, who canthen optimize their water efficiency efforts.These data are stored in easy-to-accessdatabases, which can be drawn on toprovide historical perspectives on currentefficiency efforts.
Innovative Efforts
Industrial Capacity Buyback ProgramThe water utility offers the industrialsector a significant incentive for reducinglong-term industrial water demand. Thewater utility pays one dollar for everygallon (3.8 liters) of demand reduced perday for up to US$40,000 per company.Industries large and small can accessthis one-time payment by making lastingefficiency improvements to their systems.The utility continually monitors thecompany to ensure the savings continueand even does spot inspections for upto 5 years after initial implementation.
Reclaimed Water UseThe Austin water utility recently passed amunicipal bond issue that has allowed thewater utility to install a reclaimed waterpumping system parallel to the existingpotable water system. A series of blue pipesinterconnect throughout the city providingindustries, commercial irrigation worksand other nonpotable water users withcheaper reclaimed water. The system isdesigned to recycle upward of 40 milliongal (approximately 150 million liters) perday. This greatly reduces stress on rawwater sources, decreases costs and capitalexpenses for wastewater treatment, andprovides customers with a highly demand-ed product at the right price. The utility isconfident that the system will pay for itself.
Case Study Compendium
63

Appliance Rebate ProgramsThe Austin water utility and Austin EnergyUtility meet on a continual basis to coordi-nate programs and evaluate joint program-matic goals. To provide incentives toencourage customers to save water andenergy, the city implements a joint appli-ance rebate program for water- and energy-efficient washing machines.
TeamThe Austin water utility uses a looseconfiguration of various departments tomanage efficiency efforts. On particularefforts and projects, appropriate membersof the pertinent departments work togetherto develop and implement both water andenergy efficiency programs. Members fromseveral departments meet frequently tofind ways to improve the efficiency of theirpumping system. They have taken meas-ures to install energy-efficient equipment,such as variable-phase pumps, and havetaken measures to limit pumping to off-peak hours.
The constant stream of data helps theteam to keep these efforts on track andappropriately interlinked. Key departmentheads meet on an ad hoc basis to reviewprogress and strategize new measures. Inaddition, the team develops an annualreport of goals, progress, and successes.The Texas Water Development Boardutilizes this report in a statewide waterresource planning and benchmarkingprocess.
Watergy
64

Case Study Compendium
65
BackgroundAs part of Environment 2000, the Cityof Stockholm is conducting an ambitiousurban redevelopment project in severalareas of the city. The project has beendivided among three areas of the city,one newly and two already constructedzones. One area is Hammarby Sjöstad,previously a run-down port and industrialarea that is being transformed into a mod-ern, ecologically sustainable residentialdistrict. Initiated in the early 1990s, theHammarby Sjöstad Project will be com-pleted in 2010; as of June 2001, approxi-mately 200 residents have moved into theresidential area.
GoalThe project goals include using the best-applied technology for new buildingdesign to reduce the environmental impact(water, energy, and waste) of the newbuildings by 50 percent when comparedwith normal construction. The HammarbySjöstad Project is intended to set up itsown local sewage treatment plant andsystem for combined collection of foodwaste. The target for the water and sewagecomponent of the project is a 50 percentreduction in water use in residentialapartments when compared with newinner city production apartments.100
MotivationThe Hammarby Sjöstad Project grew out ofthe long-term environmental goals of theCity of Stockholm established in the springof 1995 and applicable to the entire city.The project is intended to minimize envi-ronmental impact by focusing on the wholeresource management system, includingexploring land use planning and energy con-sumption. Three organizations in the City ofStockholm—Birka Energi, the StockholmWater Company, and the City of StockholmWaste Management Administration—jointlydeveloped a comprehensive model for ener-gy, waste, and water management known asthe Hammarby Model.
MethodologyThe Hammarby Sjöstad Project will identifyways to minimize energy and water con-sumption as well as waste production. Theproject will have a local wastewater treat-ment plant where waste heat (biogas) willbe extracted from the sewage treatmentprocess. To lessen the load on this plant,surface water will be cleaned in a separate
Key Results• Developed a comprehensive model for
energy, waste, and water management• Involved multiple municipal stakeholders
in project implementation
II. STOCKHOLM, SWEDEN: WATERGY EFFICIENCY
Key Topics• Team building• Residential water and
energy demand reductions• Ecocycle model
Hammarby Sjöstad ProjectBerndt Björlenius, Stockholm Water
CompanyProject Leader, Hammarby Local Sewage
Treatment Plant IE-mail: [email protected]: <www.hammarbysjostad
.stockholm.se/english/frameset>

plant. In addition, the district heating plantwill produce energy with a strong emphasison using renewable fuels.101
About the ProgramThe Hammarby Sjöstad Project’s overallwater management program addresses bothsupply and demand efficiencies through:
� Strategies for encouraging efficient useof water by the residents, includingpromotion of reduced-flow waterequipment
� Water efficiency initiatives forStockholm Water Company’s sewagetreatment, which will focus on bothwater and energy elements.
Development ProcessProject team leaders divided constructionplans for the treatment plants into twophases during a 5-year period, starting in2000. Phase I will consist of a pilot projectfor a small-scale sewage treatment plant.The plant will serve approximately 1,000people, using best available technologies.After Phase I is successfully completed, theproject team will commence plans for con-struction of a larger plant (Phase II). Theestimated investment budget for this watermanagement program is 21.5 millionSwedish kronor (US$1.95 million).102
The management structure for coordi-nating the efforts of the water and energycomponents of the local sewage treatmentplant is divided into two principal groups.The first team, the Sewage Treatment PlantSteering Committee, comprises a projectleader from Stockholm Water Companyand a large network of professionals. Suchprofessionals include technical expertsfrom research institutions, consultants, andtechnical contractors, who review process-specific, monitoring, and information tech-nology subprojects. Since March 2001, this
committee has been meeting on a monthlybasis to review its progress toward meetingthe project’s goals. The second team com-prises vice-presidents of the three technicalorganizations working on the project,namely Birka Energi, Stockholm WaterCompany, and the City of StockholmWaste Management Administration. Thisteam is responsible for general implemen-tation of the Hammarby Model regardingsewage treatment, energy supply, and han-dling of solid waste. The team meets everytwo months to review recommendationsset forth by the Sewage Treatment PlantSteering Committee.103
Monitoring and Verification of SavingsThroughout the life of the project, moni-toring and verification systems will beestablished on several levels to evaluate thesuccess of the project. Due to the impor-tance of Life Cycle Analysis for the devel-opment and evaluation phase of theHammarby Sjöstad Project, managementteams have devised a unique metric to helpevaluate all activities. The EnvironmentalLoad Profile will allow the team to evaluatedifferent scenarios regarding design oftechnical infrastructure (water, heating,cooling, sewerage, and waste) as well asthe lifestyles of the residents. The SewageTreatment Plant Steering Committee hastaken steps to build a monitoring station tomeasure the composition of the wastewaterat the local sewage treatment plant. Inaddition, teams will monitor the residents’consumption patterns for energy and waterby using an individual measuring systemfor each apartment.
Watergy
66

Case Study Compendium
67
BackgroundOwned by the New South WalesGovernment, Sydney Water Corporation(Sydney Water) is the sole provider ofwater, wastewater, and some storm waterservices to more than 3.8 million peoplewithin the Sydney region. Sydney Water isalso one of the largest energy users in itsregion, using approximately 350 millionkWh of electricity per year. Sydney Water’soperations include 10 water filtrationplants, 135 water-pumping stations, 656sewage-pumping stations, and 31 sewagetreatment plants.
GoalWhere costs are feasible, Sydney Water’sgoal is to reduce energy consumption of itsbuildings by 25 percent of the 1995 levelby 2005. Sydney Water sets energy man-agement targets in line with the New SouthWales Government’s Energy ManagementPolicy targets.
MotivationIncreases in environmental, drinking water,and effluent quality standards have aug-mented Sydney Water’s need for an energymanagement program. In addition, newlyconstructed water filtration and sewagetreatment facilities have increased theutility’s energy demand.
MethodologySydney Water has created WaterPlan21and the 2000–05 Environmental Plan104 asa holistic approach to water management.WaterPlan 21 identifies the major projectsthat will be delivered in the next 20 years.As part of this overall effort, Sydney Waterestablished an energy management policy,which set the framework for a corporateenergy management program (CEMP).
About the Plan
Basic ThemeWaterPlan 21 outlines the vision for sus-tainable water and wastewater managementfor the Sydney, Illawarra, and BlueMountains regions. WaterPlan 21 includesprojects to capture sewage overflows, han-dle biosolids, and install advanced sewagetreatment processes, such as ultraviolet dis-infection. The plan was designed to meetwater demand reduction targets for years2004–05 and 2010–11, as mandated by theutility’s operating license (364 and 329liters per person, per day respectively).
Key Results• Developed a comprehensive supply-side
and demand-side water efficiency plan• Provide $269 worth of vouchers to con-
sumers help pay for water efficiency• Developed water efficiency standards
and labels for appliances
III. SYDNEY, AUSTRALIA: WATERGY EFFICIENCY
Key Topics• Team building• Water and energy audits• Educational campaigns• Water demand-side, residential
Sydney Water CorporationJohn Petre, Corporate Energy Planning
Manager(+61) 2 9350 6720Website: <www.sydneywater.com.au/>

Sydney Water is presently evaluating theestablishment of additional energy mini-mization, efficiency, and generation targets.
The TeamSydney Water established a CorporateEnergy Management Steering Committeeto develop a sustainable energy-use strate-gy and implement its energy plan. Thesteering committee meets on a monthlybasis to evaluate energy efficiency strate-gies and projects and comprises membersfrom engineering, financial, and environ-mental units. Committee members repre-sent the various backgrounds of SydneyWater staff, which lends all team membersand company units a sense of ownershipin the strategy.
The Plan’s Development ProcessThe plan’s overall water management pro-gram addresses both supply and demandefficiencies by addressing both:
� Strategies for encouraging efficient useof water by the community
� Water efficiency initiatives for Sydney’ssewage treatment and water supplyoperations.
Demand-Side
Sydney Water’s community managementstrategy was developed using a least-costplanning approach. The most cost-effectiveprograms to achieve the utility’s licensetargets are being implemented. Theseinclude activities that cover residential,commercial, and industrial customers.The range of measures includes:
� Indoor residential retrofits for leakrepair, showerheads, and flow regulators
� “Every Drop Counts” consumer educa-tion campaign and website
� Voucher books worth $500 (US$260)to provide incentives for water saving
� Water audits for industrial, commercial,and government sectors
� Smart Showerheads Rebate Program(rebates for low-flow showerheadinstallation)
� Mt. Victoria facility customer retrofitand monitoring project to reducewastewater flows
� Participation in national water efficiencyregulation, such as:— Minimum performance standards
for major water-using appliances— Local planning regulations and
building codes— A water conservation rating and
labeling scheme— Voluntary outdoor water-use
restrictions.
Supply-Side
In 1996–97 Sydney Water Corporationreleased its Energy Management Policy*and initiated a formal energy managementprogram. This policy sets the frameworkfor a corporate energy management pro-gram (CEMP), which covers facility effi-ciency measures to control both cost andquantity of energy used. CEMP energymanagement objectives include:
� Increases in the efficiency of SydneyWater’s energy use
� Reductions in the utility’s per capitaconsumption of energy for the sameenvironmental outcome
� Increases in the percentage of energyobtained from renewable sources
� Increases in recovery and reuse of energy� Reduction in the combined environ-
mental impact of the per capita amountof energy and water used by the corpo-
Watergy
68
* The Energy Management Policy was revised in 1999 to adopt several key principles of New South WalesGovernment’s Energy Management Policy of 1998.

ration and other materials and sub-stances discharged by the corporation
� Concerted efforts to meet best practicesin energy management within the waterand wastewater industry.To help identify potential projects,
Sydney Water hired independent auditorsto perform a corporation-wide audit ofenergy use as well as detailed engineeringand process audits of the largest energy-consuming facilities. The steering commit-tee and the external auditor jointly reviewproject selections. The committee has theauthority to implement a broad range ofprograms, such as energy procurement,that is, contracting for electricity, purchas-ing petroleum, implementing energy effi-ciency conservation strategies, anddeveloping opportunities for renewableelectricity generation (hydroelectric andcogeneration).
In the past couple of years, the majorityof Sydney Water’s projects focused onwater-pumping stations and sewage treat-ment plants, which account for 82 percentof total electricity consumption. To havesenior management’s support, the projectsmust meet a number of requirements,including environmental and financialcriteria. Excellent short-term opportunityprojects implemented to date have hadrelatively high commercial returns. Thechallenge for Sydney Water lies in upcom-
ing years when certain projects may bemore difficult to justify on purely econom-ic grounds.
Sydney Water also held its first EnergyManagement Exhibition (Energy Expo) onMarch 7, 2001 with the goal of providingstaff with information on the latest tech-nologies and products from energy serviceproviders. Energy Expo showcased anumber of energy management projectsand initiatives that have already beenimplemented within Sydney Water.
Monitoring and Evaluation of SavingsMonitoring of the demand-side water andenergy management programs is ongoingat Sydney Water. As results become avail-able, the measures are modified to helpensure achievement of water and energydemand reductions at the lowest cost.Some of the indicators for monitoringprogress in facility energy consumptionare:
� Per capita electricity consumption byoperation
� Electricity consumed per unit of servicedelivered
� Greenhouse gases generated both directlyand indirectly from consumption ofenergy.The Sydney Water Towards Sustainability
and Sydney Water Annual Report 2001reported on progress on these indicators.105
Case Study Compendium
69

Watergy
70
GoalToronto hopes to achieve a peak waterdemand and wastewater treatment reduc-tion of 15 percent by 2015 (as adopted bythe City Council). This translates into areduction of 220 million liters per day orthe same amount of water used daily by525,000 people.
MotivationIncreased demand due to populationgrowth will outstrip current infrastructurecapabilities at the current rate of consump-tion in the next 10–15 years. Reducing percapita water needs through supply- anddemand-side efficiencies will postpone oreliminate the need to invest large amountsof money in new water facilities.
MethodologyToronto ‘s mantra for its water efficiencyprograms is to create and implement awater efficiency management plan toaddress water goals in a cost-effective,socially acceptable, and easy-to-implementmanner.
About the Program
Basic ThemeThe proposed water utility efficiencyplan is, first and foremost, a demand-side program, but it does include some
supply-side efficiency improvements thatare recommended as best practices. Theseinclude a major leak reduction effort thatis targeted to reduce 30 million liters ofthe 220-million-liter goal. In addition,the plan is linked to a separate program(known as the “Works Best PracticesProgram”) that focuses on supply-sideefficiencies.
Development and Management TeamA consulting firm working in conjunctionwith staff from the Toronto Works andEmergency Department began by conduct-ing an analysis of efficiency opportunities.To facilitate this process, Toronto Workscreated a project team made up of staff fromseveral department branches: QualityControl and Systems Planning, WaterSupply, and Water Pollution Control andEnvironmental Services. Other brancheshave also been consulted in developingthe plan and will be a part of the reviewprocess. These groups include the PlanningDepartment, Energy Efficiency Office, Parksand Recreation Department, and Economic
Key Results• Pilot program installed 16,000 ultralow
flush toilets and tracked savings of3.6 million liters per day
• Created a cross-sectional waterefficiency team.
IV. TORONTO, CANADA: WATERGY EFFICIENCY
Key Topics• Team building• Water metering and monitoring• Leak reduction pilot projects
Toronto Water Utility ContactsJoe Boccia, (+1 416) 397-0952, supply sideE-mail: [email protected] Lipp, supply side: automation system
[email protected] Kaszczij, (+1 416) 392-4967,
demand sideE-mail: [email protected] Korovesi, (+1 416) 392-8834,
demand sideE-mail: [email protected]
.on.caWebsite: <www.city.toronto.on.ca/water>

Development Office. Both a Water EfficiencyPublic Review Committee, made up ofpublic interest groups, and a Peer ReviewCommittee, made up of water efficiencyspecialists working in surrounding munici-palities, will be established during thereview process.
Development ProcessSeventy measures from other cities wereoriginally considered for inclusion in theplan. After an initial review that screenedthe measures for relevance to Toronto ‘sconditions and to the scope of the plan, 23remained for further consideration. A pro-file on each measure was developed to doc-ument the effects of its implementation inthe other cities. In addition, the reviewteam selected seven measures based on thecriteria of technical feasibility, applicability,and social acceptability. The seven selectedefficiency measures cost only an estimatedone-third the cost of building comparableadditional capacity. Pilot projects have test-ed some of these measures; this process iscritical in verifying program costs, results,and social acceptability. Some critical solu-tions under consideration for residentialareas include low-flow toilet rebates, pro-motion of horizontal clothes washers, andsummer peak-load lawn watering reduc-tions. In addition, the utility is looking atdeveloping a capacity buyback programwith the industrial sector. This would pro-vide companies a US$0.20-per-liter incen-tive to reengineer industrial processes toreduce water demand.
Monitoring and Evaluation of SavingsTracking savings is seen as critical to theultimate success of the program. In thepilot phase, data collection and trackingmethodologies were developed and fine-tuned to provide an accurate look at sav-ings. Looking at water bills and reading
meters on a regular basis in project imple-mentation areas will identify initial savingsof the project. This information will, it ishoped, encourage bill payers and con-sumers to continue saving water, whileretaining the desired benefit; for example,one pilot program installed 16,000ultralow-flush toilets and tracked savingsof 3.6 million liters per day. The trackingof savings will continue for the long termto encourage the city to maintain itsinvestment.
Best Management PracticesIn addition, the plan recommends a sepa-rate group of best management practices,which include:
� Automatic meter reading� Meter calibration� Universal metering� Water main rehabilitation� Public education and outreach.
Works Best Practices ProgramThe City of Toronto is actively attemptingto improve operational efficiency in itssupply operations. A comprehensive systemaudit in the early 1990s prompted waterutility management to recognize majoropportunities for efficiency improvementsand initiate the “Works Best PracticesProgram.”
Management StructureTo take advantage of these opportunities,the utility revamped its management struc-ture to empower line workers to maximizeefficiency in operations. Facilities havebeen divided into distinct geographic areasthat are managed in a business unit fashionby a team of line staff. The teams meet ona daily basis to discuss operational andmaintenance strategies. Team supervisorsprovide oversight and regularly meetamong themselves to discuss interteam
Case Study Compendium
71

collaboration on efficiency projects. Thisteam structure has helped optimize opera-tional performance and provide a morerapid response to redressing inefficiencies.Staff training currently is intended to helporganize team meetings and identify criti-cal information needs.
Automated Data SystemAs part of the process to empower workersto improve efficiency, the water utility hasinvested in an integrated metering andprocess control software system.* Amongother things, the system helps analyzeoperations, identify efficiency opportuni-ties, provide critical information for linestaff to optimize the systems’ performance,and maintain an inventory for equipmentand spare parts. When it is fully functional,this system will allow equipment operatorsto optimize equipment performance bycomparing operational efficiencies overtime under a variety of conditions to deter-mine the ideal operational specifications.
In many cases, operators are currentlyusing their intuition to set up equipment.
With the new system, data analysts will beable to give line staff key information on adaily basis to improve operational perform-ance. In addition, the software system willhelp maintenance staff identify problemareas and schedule repairs or replacementmore efficiently. The “Works Management”piece of the software package will alsoidentify problem equipment and comparedifferent technology solutions to improveperformance.
Empowered by the new managementstructure and data tools, the Toronto WaterUtility is undertaking a comprehensive sys-tems analysis to discover additional waterand energy resource-efficiency opportuni-ties. For example, the utility has analyzedthe electricity cost savings from pumpingmore water to gravity-fed reservoirs atnight and turning off equipment for main-tenance during the day to cut peak elec-tricity load. In the future, the utility islooking to enhance its submetering to pro-vide even better data on the performanceof various systems and equipment.
Watergy
72
* For a listing of water pumping optimization tools, please refer to appendix B.
Case Study Compendium
73
BackgroundEmpresas Públicas de Medellín (EEPPM)provides water services to more than630,000 consumers in the city of Medellín,Colombia. EEPPM produces close to 9.1 m3
of water per second through ten drinkingwater plants and 25 water treatment plants.
MotivationEEPPM developed a program designed todelay investment in expansion projects,prevent future inadequate water supplies,improve the corporate image, and reducesubsidized water sales at different socio-economic levels. Some legal requirementsto provide public water efficiency educationand to reduce water waste are also associat-ed with the utility’s water concession.
About the ProgramSince the 1980s, EEPPM has been imple-menting demand-side water activities forresidential and industrial programs, suchas education campaigns and water leakageprevention programs. In July 1995 theysignificantly expanded their educationalprogram to promote rational water andenergy use. The program was intended tocontrol and minimize losses in industrial,commercial, and residential sectors inMedellín. EEPPM targeted its residentialprograms to children, adolescents, house-wives, and heads of households.
ObjectivesThe main objective of the educational pro-gram is to bring necessary knowledge andappreciation for the proper use of waterand energy resources to all water users.The program was also intended to promoteactions that will lead to changes in habits,facility maintenance, energy substitutions,improved efficiency of equipment, and lossreductions.
Work PlanThe work plan for demand-side reductionsfocused on three groups: children and ado-lescents, housewives and heads of house-holds, and the industrial and water sectors.
Children and Adolescents
EEPPM initiated a pilot project targeted at2,500 fourth grade students in 50 schools.The general objective of the formal educa-tion programs was to promote:
� Rational use of water� Prudent use of public services� Maintenance of services� Accurate valuation of services� Legal water use.
Key Results• Reduced average residential water use by
3 percent per year in a ten-year period• Developed a metering and monitoring
system to help prioritize upgrades• Created an energy management team
V. MEDELLÍN, COLOMBIA: DEMAND-SIDE MANAGEMENT
Key Topics• Educational campaigns• Water demand-side, residential• Water demand-side, industrial• Energy and water equipment upgrades
Empresas Públicas de MedellínJuan Carlos Herrera Arciniegas,
Planning Specialist(+57) 4 380 4215,E-mail: [email protected]: <www.eeppm.com/>

Activities included field trips to water-sheds, workshops with parents, take-homeprojects, and development of an efficiencymanual for water consumers. Teachingmaterials, such as education videos andgames, were also developed to help guidethe teachers. EEPPM went so far as todevelop a 12-segment television miniseriestargeting school children to reinforceconcepts and goals laid out in the schoolprograms further. In multiple half-hoursessions held in different EEPPM locations,children received instruction on environ-mental values and company investmentsin producing and distributing water andenergy.
Homemakers and Heads of Households
EEPPM instituted various media and pub-lic information campaigns to help changeconsumption habits and reduce water loss-es. The publicity campaign focused onindividual and collective economic prob-lems related to water and energy waste. Itprovided specific instructions for rationaluse of water and energy. The campaignincluded TV and radio spots, advertise-ments in subway stations, and printingof pamphlets highlighting the benefits ofrational use of water and energy and out-lining the legal pitfalls facing water thieves.
Industrial and Commercial Sector
EEPPM communicated with the industrialsector on the issue of water loss reductionand efficient use of water through a seriesof training workshops. These workshopswere designed to educate the industrialsector on the value of reducing water wasteand to provide strategies for seekingimprovements.
Educational Program Results
As seen in figure 3, the past decadeaverage residential consumption levelshave decreased at a rate of 3 percent peryear, due in part to the public awarenesscampaigns developed by EEPPM. Thesecampaigns helped convince consumers topay for water consumed and not waterwasted—“pagar por el servicio, no por eldesperdicio.” The reduction in water con-sumption demand has positively affectedthe utility’s income related to potable watersales. Water-loss prevention programsimplemented on a continual basis haveresulted in reduced noninvoiced water usefrom 42.15 percent in 1985 to 32.95 per-cent in 1996. Such programs have alsoconfirmed that water theft, internal waterleaks, and the poor state of faucets andaccessories contribute significantly to thetotal amount of noninvoiced water use.
Watergy
74
Figure 3: Empresas Públicas de Medellín Average Residential Consumption Levels

Based on these results, EEPPM hasdecided to focus new educational cam-paigns on normalizing service and mainte-nance of internal facilities. These newcampaigns will address quality service andpreventive maintenance as the principalmotivators for efficient use of water.
Energy Management Team106
EEPPM has also invested funds to reduceenergy demand for its water operations.In 1999 the company set up a team totrack its water-related energy use. Anoperational manager directs a team ofcivil, electrical, and mechanical engineers,technicians, and operators familiar withenergy and equipment operation issues.The team is responsible for analyzingand prioritizing opportunities for energyefficiency activities in several of its waterand wastewater facilities, which consumeup to 146 GWh/year.
The company has installed a computer-ized data-monitoring system (the SCADASystem, that is, sistema de telemetria y tele-control del acueducto) to help them manageall the operational data. The team reviewsmonthly reports, which contain informationon several criteria, including “energy con-sumed” and “fluctuation of kWh/m3 perperiod of time.” After analyzing the data,the team identifies the most inefficientplants and recommends corrective meas-ures. Actions taken to date have rangedfrom installing capacitors for reducingpower factor penalties to establishing man-agement systems to reduce the level ofmotor operation during peak hours. Theyhave also taken measures to ensure ade-quate sizing of pipes and accuracy of meas-urement equipment. These activities,financed in part with company resources orthrough multilateral bank loans have allresulted in significant energy savings for thecompany.
Case Study Compendium
75

Watergy
76
BackgroundRand Water, based in Gauteng,Johannesburg, is a nonprofit NGO thatsupplies potable water in bulk to localauthorities. On average, Rand Watersupplies more than 2,800 million litersof water daily to more than nine millionpeople in an 18,000 km2 supply area.The local authorities are responsiblefor installing and maintaining watermeters in the individual households.
Motivation/DriversIn an environment where demand is highand water is scarce, Rand Water wants toreduce water waste by educating and rais-ing awareness of more than ten millionindustrial, commercial, and residentialconsumers regarding the value of waterand empowering them to use it wisely.South Africa has less than 1,700 m3 ofwater for each person per year, whichclassifies it as a water-stressed country.
About the Program
ConceptMore than 3 years ago, Rand Water beganinvesting in a water conservation programcalled “Water Wise” to address waterscarcity issues. Rand Water has investedmillions of South African Rands in the
Water Wise program, and, after 3 years,managers have seen a noticeable growth inawareness in the community about waterissues. Under the Water Wise banner, RandWater has focused on the financial andrecreational benefits consumers can achieveby becoming “Water Wise” citizens.
Program AreasSome of the water initiatives that RandWater has carried out with the support oflocal councils and communities include:
� Community awareness and educationalprograms, which assist local govern-ments and consumers to reduce watercosts by fixing leaks and promotingwater-saving devices, such as dual-flushtoilets and aerated showerheads
� Community discussion forums, whicheducate consumers on environment,gardening, living, and water cyclemanagement topics
� A school conservation program, whichprovides teachers with lesson plans and
Key Results• Saved 195 million liters of water and
$250,000 a year as a result of four-monthwater audit project
• Developed a water efficiency technologydemo project that saved more than 25million liters of water and $22,000.
VI. JOHANNESBURG, SOUTH AFRICA: DEMAND-SIDE MANAGEMENT
Key Topics• Educational campaigns• Consumer programs• Demand-side, residential
Rand WaterKarin Louwrens, Brand Marketing Manager,
Water WiseE-mail: [email protected] Pearson, Water Quality Education Office(+27) 11 682 0289Website: <www.waterwise.co.za/>

wastewater kits* containing educationalcartoon-style maps, hand-on activities,and a wastewater measurement tool
� An educational water conservationwebsite designed to help consumerssave water in homes and gardens andreport leaks to local councils.
Methodology and Programmatic ResultsAll aspects of the Water Wise campaign havereceived widespread and favorable mediacoverage. They have helped strengthenRand Water’s image as an accessible organi-zation active in suburbs. The campaign haswon many advertising and exhibitionindustry awards. Furthermore, communitymembers view the Water Wise program asa leading example and source of expertisein the water conservation field. Projectsto fix leaking taps and pipes with the helpof residents has saved Rand Water vastamounts of water in the past few years andhas resulted in big cost savings to residents.
Details of three recent Water Wise proj-ects follow:1. In its highest profile Water Wise proj-
ect to date, Rand Water cooperatedwith Eskom (the sole electricityprovider in South Africa) to turn theAll-Africa Games Village in Alexandra,Johannesburg, into a showcase of waterand energy efficiency. This involvedinstallation of features such as dual-flush toilets, high efficiency shower-heads, and low-flow basin taps andstrategic positioning of water heatersto reduce water waste, while waitingfor tap water to heat up. As a result,total residential water savings amountedto about 175,000 South African Rands(US$22,000) a year; this is the equiva-
lent of conserving close to 25 millionliters of water. Water Wise trainers vis-ited the homes to identify and explainwater efficiency designs and features.Occupants were also informed on howto start a Water Wise garden that wouldimprove their lifestyles, save themmoney, and increase the value of theirproperty.
2. A four-month water audit pilot project inThokoza (township) resulted in savingsof 195 million liters of water and two mil-lion South African Rands (US$250,000)a year for about 2,000 homeowners.During this time, 24 township entrepre-neurs received training in basic plumb-ing skills, enabling them to continuewith their own small businesses.
3. Seven Water Wise Garden Centers havebeen established in partnership withnurseries. All the centers’ frontlineemployees received training in theWater Wise way of gardening andhelped to create demonstration gardensto show customers.“Conveying the importance of water
conservation to consumers in the mostappealing and motivational way is whatthe Water Wise project is all about. Insteadof warning consumers that the devastatingdroughts experienced in the past will cer-tainly come again, Rand Water is encourag-ing experiential learning through its WaterWise gardening project. By showing peoplehow to establish water-efficient gardens,while at the same time enhancing thebeauty and appeal of their gardens withthe use of indigenous flora, the projecthas gone from strength to strength.”107
Case Study Compendium
77
* The Water Wise “Wastewater: The Untold Story” Educator Kit includes two educational posters titled “H20: Heights to Homes to Oceans” and “How Is Wastewater Cleaned?”

Watergy
78
GoalThe San Diego Metropolitan WastewaterDepartment (MWWD) has put together an11-year strategic plan to prepare for futureenergy situations in California. One of thegoals of the plan is to reduce the energyconsumed at wastewater department facili-ties by at least 7 percent.
MotivationMany of the city’s major wastewater treat-ment facilities and transmission pipelines,constructed in the early 1960s, need reha-bilitation and replacement after more than35 years of use. To improve and strengthenthe system to meet growing demand, thecity of San Diego undertook a major con-struction program. San Diego currentlyimports approximately 90 percent of itswater from Northern California and theColorado River, which also supplies otherstates. Increasing political pressure fromother states has meant reducing theamount of water imported.
MethodologySan Diego has established a variety of sup-ply-side measures to help improve energyefficiency and maintain facility systems tosave local ecology and improve customerservice. In addition, MWWD has begun aseries of demand-side measures, such aswater reuse, to help reduce water imports.
About the Program
Basic ThemeMWWD is attempting to maximize itswater and energy efficiency through:
� Facility upgrades� Water reclamation for landscape
irrigation and industrial processes� Biosolids production� Cogeneration.
Demand-Side ActivitiesTo reduce its dependence on water import-ed from other states and reduce the amountof sewage discharged into the ocean,MWWD is implementing a strong demand-side water program. First, the city has builtwater reclamation plants to treat and disin-fect wastewater to a high degree for use innonpotable purposes. One of their plantstreats up to 30 million gal of wastewaterper day. MWWD then sells low-cost waterto customers for use in landscaping, irriga-tion, industrial, and agricultural purposes.Pipelines and equipment used in the
Key Results• Established an energy committee• Developed a strategic plan, which sets
a 7 percent energy reduction goal atwastewater facilities
• Began water reclamation programs forlandscape irrigation and industrialprocesses
VII. SAN DIEGO, UNITED STATES: DEMAND-SIDE MANAGEMENT
Key Topics• Water and energy equipment upgrades• Alternative energy sources• Team building• Water and energy metering and
monitoring
San Diego Metropolitan WastewaterDepartmentMichael Scahill, Public Information Officer(+1 858) 292 6415Jesse Pagliaro, Chair of Energy Committee(+1 619) 221 8728E-mail: [email protected]: <www.sannet.gov/mwwd/>

reclaimed water process are speciallymarked or color-coded in purple to distin-guish reclaimed water pipes from drinkingwater pipes. Second, MWWD has installeda flow-metering alarm system with 96detection mechanisms to minimize unde-tected sewage spills.
Supply-Side ActivitiesMWWD has completed a comprehensiveenergy conservation plan and made astrong commitment to reducing powerconsumption. On-site power generationsystems are an important element forachieving the goals of the plan. MWWDhas installed cogeneration systems in sev-eral plants where it uses methane from on-site production and nearby landfills to fuelgenerators for its operations. These energyself-sufficient plants are then able to sellexcess electricity back to the electric utili-ties. For example, during fiscal year 2000,one wastewater plant saved the city morethan US$500,000 in energy costs to runthe facility, while earning US$400,000from selling excess power back to theenergy grid.108
Management and Development TeamMWWD has established the EnergyCommittee to focus on reducing energy
costs and helping to protect SouthernCalifornia’s ecology by participating in theCanyon Sewer Maintenance Task Force.This task force is developing a citywidepolicy for operating, maintaining, andaccessing San Diego’s sewer collectionsystem.
The Energy Committee’s core groupmeets on a bimonthly basis to discussand strategize implementation of variouselements of the energy plan. The groupincludes engineers, program managers,operating facilities, and other facility par-ticipants. The separate, citywide CanyonSewer Maintenance Task Force has beenmeeting since June 2000. The task forcecomprises representatives from the City ofSan Diego, other governmental agencies,environmental and community organiza-tions, and community groups throughoutthe city.
The Energy Committee developsmonthly reports and conducts targetedenergy audits. After discussion of theplans, the committee must come to a con-sensus about energy projects, grants, andpriorities. Facility managers can authorizeprojects within their budgets, and projectcosts beyond the facility managers’ budgetsare forwarded to the deputy director.
Case Study Compendium
79
Watergy
80
BackgroundThe Public Utilities Board (PUB), the nation-al water authority in Singapore, is responsi-ble for providing an adequate and reliablesupply of potable water. The water supplysystem that PUB manages comprises 14 rawwater reservoirs, six water treatment plants,14 storage reservoirs, and about 4,800 kilo-meters of pipelines. In 2000, PUB servicedmore than four million people and averagedsales of 1.24 million m3 of water per day.
MotivationBecause Singapore, a small island nation, haslimited natural resources, including water,the nation has made water management oneof its top priorities. The rapid industrial, eco-nomic, and social developments in Singaporehave resulted in a sharp increase in waterdemand. In 1950, when the population wasa little more than a million, the demand forpotable water was 142,000 m3 per day. By1995 the population had gone up by aboutthree times, but water demand increased bymore than eight times to 1.19 million m3 aday. In 1989–95, Singapore’s water demandgrew at about 3.5 percent a year. PUB recog-nizes that development of new water sourcesand water demand management must becarried out simultaneously to use waterefficiently and achieve long-term solutions.
MethodologyTo address concerns about increasing waterconsumption, in the past 20 years, PUB hasdeveloped a comprehensive water demandmanagement plan. The plan has adopted atwo-pronged approach—first, efficientmanagement of its water supplies from thesource through to its distribution systemand, second, implementation of water con-servation measures.
About the Program
OverviewSome of the water utility efficiency initia-tives focused on decreasing the percentageof unaccounted-for water (UFW),* imple-menting public education and publicityprograms on water conservation, andencouraging water recycling and the use ofnonpotable water, such as industrial waterand seawater, where applicable, as a substi-tute for potable water.109
Key Results• Developed water conservation plan and
established water conservation unit• Achieved a significant drop in
unaccounted-for water—from 10.6percent to 6.2 percent in six years
VIII. SINGAPORE: DEMAND-SIDE MANAGEMENT
Key Topics• Water and energy metering and
monitoring• Leakage control programs• Water demand-side educational campaigns• Energy and water equipment upgrades
Public Utilities Board ContactsNg Han Tong, Senior Engineer, Conservation
and InspectorateE-mail: [email protected]: <www.pub.gov.sg/ce.html>
* Unaccounted-for water is the difference between the amount of water supplied from the waterworks as measuredthrough its meters and the total amount of water accounted for (which includes water consumption as recorded bycustomers’ meters, water stored in service reservoirs, and water used for flushing and sterilization of mains, routinecleaning of service reservoirs, and so on).

A. Unaccounted-For Water
In the 1980s, to reduce the percentage ofUFW, PUB began intensifying its efforts byimplementing various measures, which arebroadly categorized as leakage control, fulland accurate metering policy, properaccounting of water used, and legalenforcement to prevent illegal draw-offs.
Under the leakage control program,PUB promoted the use of better qualitypipes and fittings, pipe renewal, intensivedetection of leaks, and minimizing responsetime to repair leaks in the water distribu-tion system. The pipe renewal programinvolved replacing 181 km of old, unlinedcast iron mains and 68,400 galvanized iron-connecting pipes between 1984 and 1993.In a 10-year period (1985–95), this effortreduced pipe leaks from 18,085 to 4,543.110
PUB has continued its program to renewmains. PUB has recently embarked on a5-year program to replace old pipelinesbeyond 50 years of age. The program, tobe completed in 2004, will replace a totalof 280 km of old pipelines. For more com-prehensive and accurate detection of leaklocations, PUB acquired high-quality devices,such as stethoscopes, geophones, electronicleak detectors, and leak noise correlators.PUB was able to carry out approximately620 day inspections and 280 leak detectionnight tests covering the entire distributionsystem in the course of 1 year. Since thebeginning of 2001, PUB has introduced leaknoise localizers, which are able to identifysuspected leak zones without carrying outtedious step tests.
All water supplied from the waterworksand all the water consumed by customersis 100 percent metered. To ensure accuratereadings of large customers’ water con-sumption, PUB invested in high-qualitymetering equipment, such as compoundmeters. This comprehensive metering effort
has helped PUB to bill customers andlower UFW accurately.
Significant quantities of water are usedin the commissioning and filling of newmains, connections, and service reservoirs;for cleaning and flushing during mainte-nance of the water distribution system;and for fire fighting. To avoid improperaccounting of water used for such pur-poses, PUB has put in place a monthlyreporting system that ensures the correctdesignation of water used.
In addition, due to legislation andstringent enforcement measure, Singaporehas few cases of illegal draw-offs. A would-be offender would face a fine of $50,000(US$27,600) or imprisonment for up to3 years.
B. Water Conservation Measures
A water conservation plan has also beenin place since 1981 to check Singapore’sgrowing water demand and ensure thatwater is being used efficiently. The variousmeasures implemented under the planare continually being reviewed and newmeasures introduced. Aspects coveredunder the plan include:
� Public education and publicity programs� Mandatory installation of water-saving
devices� Water audits for and encouragement of
water-recycling practices by customers� Use of nonpotable water, such as indus-
trial water and seawater, as a substitutefor potable water to the extent possible.The public education and publicity
program is an ongoing activity to educatethe public on the importance of waterconservation and the need to save water.The program covers a range of activitiestargeted at various groups of customers,such as households, industries, and schools.Activities include visits to waterworks,
Case Study Compendium
81

conducting water conservation talks atschools, holding “save water” exhibitionsin community centers, and distributing“Save Water” leaflets to all households. Inaddition, the education system has beenidentified as a useful platform to educatethe young on the importance of savingwater, especially during their impression-able years. The program invited teachersto attend seminars on water conservationso that they can disseminate the waterconservation message to their pupils andfellow teachers. Teachers received detectivekits and booklets that explain the impor-tance of using water wisely; these willassist teachers in the education processand, more important, help convey themessage that saving water must be a life-long habit for everyone. Save WaterCampaigns were also organized whennecessary to remind the public ofthe need to save water. The latest campaignin 1998 focused on effecting behavioralchange in water use.
Management and Development TeamThe Water Conservation Unit is taskedwith implementing the various measuresof the water conservation plan. Since theunit was set up in 1979, it has workedclosely with the Public Relations Divisionunder the guidance of senior managementto promote water conservation in all sec-tors of the economy. Besides the unit’sstaff, other PUB staff also help spreadthe water conservation message whendealing with the general public.
Outcome
A. Reduction of Unaccounted-For Water
PUB uses UFW as a measure of the effi-ciency of its water supply system and, con-sequently, its water demand programs. In1989–95, UFW dropped from 10.6 to 6.2
percent, generating an estimated savings ofabout $47 million (US$26 million). Thisotherwise lost revenue offset any program-matic investment costs and deferred invest-ment in new capital projects.
B. Effectiveness of Save Water Campaignsand Sustained Publicity Program
In 1996 PUB conducted a survey to gatherfeedback from the public. More than 90percent of the people interviewed wereaware of the need to save water. Such sur-veys serve as a useful channel for feedbackascertaining the effectiveness of the cam-paigns and helping to determine the focusof subsequent campaigns. Based on infor-mation gathered in the 1996 survey, thefocus of the Save Water Campaign held in1998 shifted from creating awareness aboutthe need to save water to effecting behav-ioral change in water use. The results of afollow-up survey carried out in 1999showed that 93 percent of the people sur-veyed have to various degrees been encour-aged to conserve water. In addition, 84percent of the people surveyed had actuallymade an effort to conserve water. The cam-paigns and publicity programs carried outhave proved successful in both creatingawareness of the need to save water andeffecting behavioral change.111
Watergy
82
Reducing demand for water isas important as developing
new sources of supply. ProvidedSingaporeans conserve water,
these long-term measureswill ensure that we will
always have enough waterfor our essential needs.112

Case Study Compendium
83
GoalAccess to clean, affordable water is a basicneed for Ghana’s population and a centralgoal of Ghana’s development plans.
BackgroundThe Ghana Water Company (GWC) is apublicly held company responsible forwater distribution throughout Ghana.GWC maintains and operates more than103 headworks (see glossary) and pumpingstations in Ghana’s ten regions; most of thestations serve urban populations in thesouthern part of the country. Monthly vol-ume through all stations ranges from 14.7to 16.3 million m3; more than half (7.7 to9.6 million m3) of that volume serves theGreater Accra Metropolitan Area. TheGovernment of Ghana has announcedplans to partially privatize the water distri-bution utility; GWC would remain as aholding company and overseer of the waterdelivery system. Private sector firms will beawarded franchises with an obligation toserve particular districts of the country.Water pumping accounts for a significantportion of the total energy demand inGhana at a time when Ghana is facingpower shortages brought on by periodicand prolonged drought. Much of the coun-try remains unserved by piped water.
MotivationIn 1997 the chief executive officer of GWC,faced with high and rising costs of energy,commissioned an energy survey to establish
usage and load requirements. Extendingservice to larger sections of the country willrequire a massive infrastructure investment.In addition, the price of electricity, includ-ing demand charges, power factor penalties,and other tariff elements, drives the cost ofproviding service to those already connect-ed to GWC lines. Reducing the cost of pro-duction frees up financial resources withinGWC to extend or improve existing service.It also frees up power on the national gridfor other productive purposes.
MethodologyGWC’s energy program, although stillsomewhat informal, uses its staff engineersto analyze operations reports from thefield. GWC has also relied on consultantsand NGOs for assistance and guidance,including the Ghana Energy Foundation.
About the Program
OverviewPumping is the primary cost driver forGWC, so data analysis has focused on totalenergy consumption, hours of operation,and electric utility bills. Project implementa-tion decisions are currently made on a case-by-case basis; one exception is for purchase
Key Results• Set up metering and monitoring system
to analyze data for energy-saving projects• Installed capacitors to improve power
factor and saved more than $25,000with less than a 2-year payback
IX. ACCRA, GHANA: SUPPLY-SIDE MANAGEMENT
Key Topics• Energy survey• Energy efficient equipment upgrades• Metering and monitoring
Ghana Water Company, Ltd.c/o The Energy Foundation of GhanaA.K. Ofosu-Ahenkorah, Executive DirectorPhone (+23) 3 21 771507E-mail: [email protected]

of efficient capacitors for power factorcorrection at several large headworks.Procurement is directed at the most cost-effective, efficient technology available toreplace obsolete or faulty equipment.Procurement remains at the discretion ofthe CEO, contingent on the availability offunds and minimization of payback periods.Any new projects are required to take effi-ciency into account in the planning stage.
The GWC Energy Efficiency Programis currently using in-house staff as neededto collect data, analyze opportunities, andimplement projects. Current data collec-tion includes kilowatt-hour (kWh) usage,kilovolt-ampere (kVA)* demand, motor/pump efficiency, downtime/lost operationhours, and energy bills. GWC has recentlybegun to track the kWh/m3 for each ofits pumping stations, as was suggestedduring a meeting with the Ghana EnergyFoundation.
ObservationsThe results of the initial survey in 1997 anda follow-up survey to look at power factorsat selected headworks showed significantopportunities for efficiency improvements.GWC was paying high penalties for lowpower factors caused by inefficient capaci-tors as well as oversized and fixed speedmotors and drives. Much of the equipmentwas old, and controls were inadequate.Monitoring of individual pieces of equip-ment was also inadequate. In one station,for example, part of the load was discov-ered to come from a useless, unidentifiedpump submerged in the reservoir.
Results to DateBased on the power factor survey of itsheadworks, GWC initiated installation ofefficient capacitors at 13 stations. Thelargest station in the GWC system, Kpong,had an existing demand of 12,000 kVAwith a power factor of 0.89. In a typicalmonth, Kpong pumps more than 5 millionm3 into homes and businesses in Accra.The installation of two 300 kVAR† capaci-tors reduced the maximum demand to11,736 kVA and improved the power factorto 0.91, avoiding any power factor penalty.The capacitors cost approximatelyUS$7,000, but will save more thanUS$5,000/year with a payback period ofabout 1.37 years.
Overall, the capacitor installations willsave more than US$25,000 per year andthe investment will pay off in less than2 years.
The efficiency of each pumping stationvaries dramatically: from as low as 4kWh/m3 to around 1 kWh/m3 for thelargest station at Kpong and to as high as0.5 kWh/m3 for many of the small- andmedium-sized stations. Average efficiencyappears to be around 0.8 kWh/m3 for thewhole country, with only a slight seasonalvariation.
GWC is examining the feasibility ofinstalling additional capacitors, as well asresizing motors and installing variablespeed drives on their pumps. Managementhas taken note of the considerable savingsto be generated from efficiency gains andis directing resources toward improvingsystem efficiency.
Watergy
84
* This measure (kVA) equals one thousand volt-amperes and is used to measure total power—active power, whichdoes work (watts), and reactive power, which creates an electromagnetic field (VAR) (kVA2 = kwatts2 + kVAR2).Capacitors can help reduce the total power required by supplying magnetic requirements on sight.† One VAR is equal to one volt-ampere of reactive power. A kVAR is one thousand VARs.

Case Study Compendium
85
GoalThe city has set a goal of establishing anenergy management cell within theAhmedabad Municipal Corporation (AMC)and develop a comprehensive energy man-agement plan that will enable the city tosave energy used in pumping water.
MotivationAhmedabad is a major commercial centerlocated in the western Indian state ofGujarat with limited water resources.About 75 percent of the AhmedabadMunicipal Corporation’s electricity con-sumption is used for pumping water, main-ly because the city’s water-pumping systemis antiquated and inefficient. Also, becauseAhmedabad is located close to a desert,much of its water must be pumped fromunderground wells, an extremely energy-intensive process. AMC has developed acomprehensive energy management systemto reduce energy waste, improve environ-mental quality, and save money that couldbe used for other urban improvements.
In Ahmedabad, overharvesting ofgroundwater has caused the city’s watertable to drop an average of 7 ft per year inthe past 20 years. The local power compa-ny estimates that it requires an additional0.04723 W/gal to pump water to the sur-face with every 7 ft drop in the water table.This translates into an additional 1 millionkWh every year to bring the same amountof water to the surface at an added annualcost of more than US$60,000.113
MethodologyTo institutionalize the energy managementprocess in the city, AMC has created anenergy management cell. This cell providesin-house capability for monitoring and eval-uating energy management initiatives. Theenergy management cell brings togetherstaff from various other divisions, such aswater, drainage, and electricity, to imple-ment specific energy efficiency investments.
About the Program
OverviewAs with all Indian municipalities, AMC hasseveral functions, including pumping anddistributing water, collecting and disposingof solid waste, and maintaining city infra-structure such as roads; however, becausethe costs of pumping and distributingwater are so high, they make up most ofthe city’s energy bill.
AMC collects water from two sources:surface (or river) water and groundwater.It draws the river water from the nearbySabarmati River from shallow wells calledJack or French wells. The groundwater isusually drawn from deeper wells, calledbore wells, which are located in manyplaces around the city.
Key Results• Created water efficiency team• Replaced pipes in jack-wells to reduce
friction losses• Installed capacitors saving $62,000
X. AHMEDABAD, INDIA: SUPPLY-SIDE MANAGEMENT
Key Topics• Team building• Energy-efficient equipment upgrades
ContactKevin James, Alliance to Save Energy(+1 202) 530-2249E-mail: [email protected]: <www.ase.org>

The water pumping authorities collectwater from both of these sources in under-ground reservoirs, called sumps, and distrib-ute it using two types of water pumps:intake pumps that collect water and supplypumps that distribute water. Although theintake pumps run continuously 24 hours aday, the quantity of water they collect is notsufficient to meet the demand for water. As aresult, AMC restricts water supply to two orthree hours a day, creating a peak demandfor water ranging from 35 MW to 40 MW inthe early morning and evening hours.During the rest of the time, the power usedfor pumping water is only about 15 MW.
Due to the inefficient and costly use ofpower to operate the city’s pumps, AMCfocused on improving the efficiency of thewater-pumping infrastructure. In the first 2years, these water-utility efficiency inter-ventions saved about US$209,000 inreduced energy bills. If AMC follows theserecommendations, it can expect to havecontinued annual savings of US$430,000.Examples of savings are detailed in thefollowing categories:
� Energy demand management. AMCused to operate its intake pumps 24hours a day, a practice that consumedan enormous amount of energy. To saveenergy, AMC shut off these intakepumps during peak electricity demandhours, which occurred in the earlymorning and evening. To meet con-sumer demand for water during thesetimes, water was stored in nearby reser-voirs or sumps. AMC found out itcould only use this strategy to meetmorning water demand. These meas-ures, if continued, will lead to approxi-mate annual savings of US$38,000.
� Loss reduction from water pumps.Many water pumps consume electricityvery inefficiently; this problem can be
solved by installing a device called acapacitor. AMC has installed severalcapacitors on its bore wells and drain-ing pumps and estimates annual powersavings of 1.07 million kWh, which isworth US$62,000. AMC also installedadditional capacitors on water anddrainage pumps and on transformers.The annual savings from this newmeasure are estimated at US$75,000.
� New pipes in water-pumping stations.AMC replaced the steel piping in someof its French wells with a wider, durableplastic pipe to prevent friction loss. Dueto the excellent results seen in the firstfew French wells, AMC managementdecided to replace pipes in the remain-ing French wells, saving an estimatedUS$102,000 each year.
� Transformers. AMC replaced oversizedand inefficient transformers in severallocations, saving an estimatedUS$25,000.
AMC’s energy management plan hasbeen a tremendous success. As mentionedearlier, if AMC continues to implementenergy efficiency initiatives, it could saveup to US$430,000 per year.
Long-Term ImpactLong-term institutional changes, such asestablishing the energy management cell,have also been successful. AMC has drawnAhmedabad’s other stakeholders in energymanagement, such as the local utility aswell as various NGOs, into a united dia-logue on how to help the city save energy.In addition, the city’s pioneering energymanagement work has served as a modelfor municipalities all around India. Severalcities, including Vadodara, Pune, Faridabad,and Indore, are now embarking on theirown energy management programs.
Watergy
86
Case Study Compendium
87
BackgroundBulawayo is a city of approximately onemillion people in Southwest Zimbabwe.Rainfall has historically been erratic, andstringent rationing has been in force formost of the past two decades. Losses fromthe system have amounted to an estimated22 million liters per day, about 25 percentof the ration-restricted supply. The losseshave significantly affected energy use,which currently accounts for about 50percent of total delivery costs.
GoalThe city set a goal of reducing systemwater losses to 6–7.5 million liters/day(about 8 percent of rationed supply).
MotivationWater utility efficiency efforts in Bulawayobegan in 1998 at the height of a seriousdrought.
MethodologyTo prevent leaks and improve efficiencyof the water distribution system, the cityhas focused on improved operations andmaintenance.
About the Program
The Plan’s Development ProcessA water management study for Bulawayo,funded by the Government of the UnitedKingdom in 1992, provided the basis forthe city’s actions. Later, the Bulawayo CityCouncil approached the NorwegianEmbassy for assistance in relieving pressureon water resources. Norwegian governmentassistance supported the design of a watermanagement system through technicalassistance that increased the capacity of thecity to set up systems for water loss control.
Technical assistance began in June1999, with significant work mapping thewater and sewer utility using computer-assisted drafting, because the previouslyavailable maps were very inaccurate andout of date. Calibration of a water networkcomputer model was also undertaken andawaits additional resources for completion.
Key Results• Established leak detection team• Installed metering systems• Improved pressure management
XI. BULAWAYO, ZIMBABWE: SUPPLY-SIDE MANAGEMENT
Key Topics• Water leak detection division• Water metering and monitoring• Water supply audit
Bulawayo City CouncilJeff Broome, Project CoordinatorE-mail: [email protected]

Management and Development TeamThe City Council is responsible for provid-ing water and sewerage services. To meetthe technical needs of leak and breakrepair, which was identified as the mainsystem management bottleneck, the cityestablished a Leak Detection Division with-in the Engineering Services Department.One goal has been to coordinate the iden-tification of leaks and breaks better withthe team of repair people to solve prob-lems quickly.
Management StructureFor continuity and institutionalizationof management efforts, project managersdocument their actions, submit project
policy documents, and construct proceduremanuals. To ensure that the City Councilallocates adequate resources, project man-agers who best understand water and sew-erage needs and constraints are responsiblefor submitting operations and maintenancebudget requests.
Monitoring and Verification of SavingsRecognizing the need to measure bulkwater flow and distribution, the city hasbeen divided into about 50 metered zones,equipped with management meters to beread monthly. As missing and faulty metershave created problems in measuring thebulk flow into the city, Bulawayo has alsobegun replacing meters. Recorded flow willbe compared with predicted average flowand billed consumption. Minimum night-flow measurements will also be taken atleast once a year.
The city government plans to undertakewater supply audits at the city level in addi-tion to the meter zone level. Introductionof 20 or so new pressure zones to controlstatic pressures within the range of 30 to60 meters will also control pressures moreaccurately.114
Watergy
88

Case Study Compendium
89
GoalThe city set the goal of reducing operatingcosts by improving energy efficiency at thewaterworks.
MotivationColumbus Water Works is a municipallyowned water and wastewater utility serving186,000 people in Columbus, Georgia. Inlooking for initiatives that would savemoney, Columbus found that energy costsare the utility’s largest single expenditure.
MethodologyThe staff at Columbus makes recommen-dations to upper management for efficiency-improvement projects, which weighpotential project savings against theavailable investment capital.
About the Program
Basic ThemeCreate an energy management program toreduce operating costs.
Development ProcessIn the planning process, Columbus stafflooked for initiatives that would save theutility money. It took the leadership ofColumbus’ president and senior vicepresident of operations to make theswitch to an energy-efficient operation.
Management and Development TeamSimilar to a private business, the utilityoperates with a five-member Board of WaterCommissioners. Project proposals are firstscreened by the senior vice-president andthen forwarded to the president forapproval.
Key Results• Completed automated system controls• Installed automated motor operators,
which saved $200,000
XII. COLUMBUS, UNITED STATES: SUPPLY-SIDE MANAGEMENT
Key Topics• Energy metering and monitoring• Energy team building• Equipment upgrades
Columbus Water WorksCliff Arnett, Senior Vice President of
Operations(+1 706) 649-3458E-mail: [email protected]: <www.cwwga.org/>

Management StructureOperators, team leaders, or any other staffmember can propose changes in the plantsto increase efficiency. Staff members areencouraged to present their ideas, andmanagers and team leaders have biannualseminars on energy efficiency. The utilityhas also reorganized its management struc-ture to take advantage of additional oppor-tunities to lower its energy expenditures.
Efficiency ActivitiesColumbus has:
� Reengineered its wastewater treatmentand drinking water treatment plants tobe fully automated
� Retrofitted older equipment� Automated aeration blowers� Installed adjustable speed drive motors
and automated controls for chemicalfeed pumps.
Most of the new equipment invest-ments Columbus has made have focusedon replacing old motors with more energy-efficient upgrades. For example, automatedmotor operators installed on four com-
pressed air blowers saved the utilityUS$250,000 by reducing energy costs by25 percent. This project had less than a1-year payback period and was awardedthe Governor of Georgia’s Award forPollution Prevention.
In addition, Columbus has hired anenergy consultant to perform quarterlyreviews of the facility’s energy use. In a5-year period, the utility has saved morethan US$1 million by changing its ratestructure, optimizing processes, and addingefficient technologies to blowers, motors,and pumps at wastewater treatment plants.
Columbus has been experiencing addi-tional gains through a pilot project beingdeveloped in concert with their powerprovider. This project provides the utilitya direct tie-in between demand meteringand the utility’s SCADA system, allowingthem to set benchmark points beyondwhich additional kW load cannot beadded without a manual override of thesystem. This system has resulted in signifi-cant kilowatt-hour savings during summermonths.
Watergy
90

Case Study Compendium
91
MotivationFairfield Wastewater Treatment Facilityin Ohio covers a region of approximately45,000 people. In 1986 a new superintend-ent decided to investigate options to reducepeak electrical demand and prevent costlypower factor penalties. After assessing thepotential opportunities, the utility decidedto move to an automated system and updateits operational equipment. The resultscovered in this case study focus on oneplant and did not include system wideefforts.
MethodologyWeekly operations meetings serve as aforum to discuss new technologies andenergy efficiency ideas for the plant.Potential projects discussed at thesemeetings can then be sent to the super-intendent for funding authorization.
About the Program
Development and Management TeamFairfield’s efficiency actions began withmotivation and support from top-levelmanagers. In addition, 21 operations staffmembers on an ad hoc team regularly dis-cuss new technology and energy efficiencyideas. In addition to the ad hoc team’s input,Fairfield Wastewater also conducts weeklyoperations meetings, at which anyone onstaff may discuss new technology andenergy efficiency ideas.
Management StructureFairfield’s superintendent makes the ultimatedecision to invest in efficiency projects,using a general set of guidelines for makingfunding decisions. Fairfield Wastewateruses a 3- to 5-year payback for projectinvestments. A policy project is authorized
Key Results• Fund projects under $15,000 with less
than a 5-year payback• Defer 35–40 percent peak load to
off-peak periods through automatedoperations system
XIII. FAIRFIELD, UNITED STATES: SUPPLY-SIDE MANAGEMENT
Key Topics• Team building• Real-time energy rate pricing and
energy payback schemes• Energy metering and monitoring
Fairfield Wastewater TreatmentFacilityDrew Young, (+1 513) 867-5369E-mail: [email protected]

if it falls within this range and the overallcosts are less than US$15,000. This processgives project managers more flexibility toplan their budgets with less micromanage-ment from company executives.
Automated Data SystemIn 1999 the Wastewater Division beganutilizing a real-time rate-pricing programbeing offered by its energy provider,Cinergy. This program calculates an energyusage baseline from the previous year’susage pattern. Usage above or below thispredetermined baseline, which varies daily,results in the buying or selling back ofpower at daily market rates. When electric-ity prices peak, the facility can use its auto-mated system to shut down for three tofour hours and save money. With Fairfield’sautomated operations system and an ability
to postpone energy loads, 35–40 percentof peak loads was deferred to off-peakperiods; this has resulted in energy billreductions of up to 17 percent.
Monitoring and Evaluation of SavingsComputer spreadsheets are used to helpmonitor trends of monthly cost, totalusage (kWh), maximum/minimum power(kW), power factor, and so on to see ifoperating trends fall within a reasonableband of operation. Initial equipment testsdetermine reasonable operating condi-tions. When operating trends fall outsideof expected performance or cannot bejustified (for example, aeration systemsare down for repairs), staff conducts fur-ther investigations to maintain optimalperformance.
Watergy
92

Case Study Compendium
93
BackgroundFortaleza, capital of the northeasternBrazilian state of Ceará, is a city of morethan two million inhabitants. CAGECE,the state of Ceará’s water and wastewatercompany, is the third largest energy user inthe state. Ceará’s water supply comprisesmostly surface water that is stored anddistributed by means of more than 8,000reservoirs with a capacity of more than10 million m3. The reservoirs providemultiyear storage and about 90 percentof the state’s water supply.
MotivationDue to an estimated 20 percent electricpower shortfall in 2001, Fortaleza facedpotential blackouts. In an effort to reducethe impact of the electricity shortage, thestate identified CAGECE as a major poten-tial source of electricity demand reductions.
GoalCAGECE intends to reduce total energycosts by 15 percent between 2000 and 2001.
MethodologyCAGECE has developed a proactive train-ing and efficiency program to improveoperations and reduce costs. The programis designed with two purposes in mind:instructing employees on how to identifyand implement savings opportunities and
helping to implement approximately 50companywide projects to improve efficien-cy. The projects focus on people and energyefficiency, which represent respectively thefirst and second major expenses of thecompany.
The electromechanical team providesthe bulk of the day-to-day support forthese projects. For example, the team man-ages a variety of tasks, such as developingelectrical and automation projects, check-ing electromechanical equipment, andtraining staff.
CAGECE is also implementing a waterwaste reduction outreach campaign focusedon educating school-aged children. Theprogram uses two water efficiency mascots,Pingo and Gota d’Agua, to convey to eventhe youngest school children the benefits ofusing water efficiently. Lesson plans, color-ful posters, coloring books, and T-shirtshighlighting these two water drop–shaped,energy-saving heroes are made available toschools. As part of this effort, CAGECE per-sonnel participate regularly in community
Key Results• Established energy efficiency team• Installed an automated metering and
monitoring system• Achieved a 7.9 percent energy reduction
in the first year of the program• Instituted water-use educational
outreach campaign
XIV. FORTALEZA, BRAZIL: SUPPLY-SIDE MANAGEMENT
Key Topics• Energy metering and monitoring• Team building• Educational campaigns
Companhia de Água e Esgotodo Ceará (CAGECE)Edinardo Rodrigues, President(+55) 85 433-5601Renato Rolim, Water Efficiency Manager(+55) 85 433-5703E-mail: [email protected]: <www.cagece.com.br>

events, speaking about ways the public canbecome more efficient in their daily wateruse. Some of the specific groups includedin this outreach are industry, hotels, privatefirms, housing complexes, and so on. GivenCAGECE’s statewide focus, this message istaken well beyond Fortaleza, reachingCAGECE customers throughout the stateof Ceará. These ongoing public educationprograms help CAGECE to increase generalawareness on the need to become moreefficient in daily water and energy use.
About the Program
MonitoringAn automated energy management systemgathers all necessary electricity billinginformation for identifying energy efficien-cy opportunities. This system receivestechnical and commercial data directlyfrom the main database of the ElectricalCompany of Ceará. Analyzing these datagarners useful facts and figures that can beimmensely helpful to managers in deci-sions on energy efficiency investments. Theinformation is monitored and compared,based on the efficiency index of kWh/m3.
From this automated data collectionsystem, CAGECE developed a data bankwith historical information on severalparameters, which it is currently integrat-ing with its electromechanical managementsystem. The electromechanical manage-
ment system monitors CAGECE’s majorequipment and incorporates real-time data(e.g., pressure, flow, system demand, andenergy consumption), which are processedthrough the Operational Control Center.
InnovationAfter studying the energy managementsystems in other water companies in Brazil,CAGECE concluded that no Brazilianmodel exists for comprehensively address-ing energy efficiency in municipal waterutilities. Most water companies had fewif any controls or procedures in place totrack and minimize energy costs. Energywas not used as a criterion in making tech-nical decisions or taking actions to modifythe pumping operational system. As aresult, old and inefficient equipment hadbecome the norm.
CAGECE is undertaking several meas-ures as part of the energy efficiency project,such as:
� Disseminating critical energy datathroughout its internal network
� Creating a manual focused on energysaving in motor and pump startupto highlight the potential benefits oftechnologies such as variable speeddrives and capacitors
� Developing specifications for efficientequipment that meet reasonable pay-back period requirements
� Establishing procurement practicesto promote uniformity in equipmentspecifications
� Conducting studies on the use ofcogeneration to reduce peak purchasesof electricity.
TeamIn the past, little cross-fertilizationoccurred among different departments,especially those based in different loca-tions. CAGECE employed an energy
Watergy
94

efficiency manager who promoted severalsignificant programs. The manager con-tributed substantially to promoting andestablishing a goal for energy efficiencyin the municipal authority’s strategicplan for improvement; however, he hadto battle numerous obstacles while tryingto achieve his goals. This led CAGECEto move toward a “water utility efficiencyteam” approach. The managers of eachdepartment—with considerable leadershipfrom engineering staff, who are knowl-edgeable on energy efficiency—worktogether to provide new procedures forthe company. For example, some of the
parameters used in identifying energyefficiency projects have come from thefinancial department, which now analyzesthe energy cost for water production. Inaddition, CAGECE’s training efforts aretargeted to reach staff outside of the capitalof Fortaleza.
OutcomesThrough system redesigns and equipmentupgrades, CAGECE has already reduced itstotal energy use by 7.9 percent from 2000levels and saved 90,000 Brazilian Reais(US$45,000) per month.
Case Study Compendium
95

Watergy
96
BackgroundIndore is a town of almost two million peo-ple in the state of Madhya Pradesh. It hasabout 110,000 residential connections, 750commercial connections, and 1,100 indus-trial connections. It spends about 70 per-cent of its budget on electricity; labor andgeneral maintenance split the remaining30 percent. Indore currently averages awater supply of about 210 million litersper day in a normal season.
MotivationThe city of Indore is currently facing asevere water shortage. In the late 1970s,a water plan was developed for the regionbased on projected population growth;consequently, a major water main morethan 70 km long with almost a 700 mhead was constructed to provide waterservice to meet the growing demand.
Population growth, however, has farexceeded expectations for this region.Existing water resources are proving inade-quate to meet the current population’sneeds. In addition, costs are far outweigh-ing revenues, creating many financialand other maintenance burdens for themunicipal corporation.
The Indore Municipal Corporation (IMC)is understandably eager to defer investmentin new water lines, reduce current costs, andimprove services. To do so, IMC partneredwith the Alliance to Save Energy and
Key Results• Revealed through a data collection
analysis system a consistent overchargeby the electrical utility
• Identified and implemented more than$35,000 in saving for no-cost operationalimprovements
XV. INDORE, INDIA: SUPPLY-SIDE MANAGEMENT
Key Topics• Team building• Energy equipment upgrades• Energy and water metering and
monitoring
Indore Municipal Corporation (IMC)Sanjay Shukla, Commissioner, IMC(+91) 731-431610R. K. Kushwah, Chief Engineer, IMC(+91) 731-543776

USAID through the Sustainable CitiesProgram to develop and implement a com-prehensive water efficiency plan. To date,savings of more than 1.6 million rupees(US$35,000) through systems optimizationfor no investment cost have been identified.Additionally, improvements in monitoringand tracking of energy usage allowed IMCto identify more than 3.1 million rupees(US$70,000) in additional savings due tooverbilling from the electricity company.
MethodologyThe Indore Municipal Corporation hasfocused on three major areas in its efforts toimprove water efficiency. With the help ofthe Alliance to Save Energy, IMC has begunan analysis of its basic operation to identifyimmediate opportunities for savings byminimizing water and energy waste, there-by giving the entire effort momentum andcredibility. The second part of IMC’s workhas focused on developing a well-fundedand -staffed water efficiency managementteam within the structure of the corpora-tion. The third area of activity has beendevelopment of an energy and water meter-ing and monitoring infrastructure.
About the Program
Management and Development TeamThe initial work in Indore concentrated onbuilding the physical infrastructure andpersonnel of a management team to coor-dinate all water utility efficiency activitiesfor IMC. One of the first actions of the
IMC’s Commissioner was to dedicate officespace, computers, and staff to the effort.Staff includes both senior and support per-sonnel. During the initial planning process,it became clear that improving IMC’s datacollection system was the top priority forthe newly formed team. Because some dataexisted, but were scattered in many differ-ent places, the first step of the process wasto develop a database system to collect andmanage data. A data manager was one ofthe first full-time staff members assigned tothe team.
OutcomesThe data’s value became apparent immedi-ately after collection and initial analyses bythe team. It turned out that the powercompany had been charging the utility formany more hours of operation than wereactually occurring. In just one water intakestation, this overcharge amounted to morethan 1.5 million rupees (US$33,000) peryear for at least 2 years.
The data collection activity led to manymore discoveries. For example, it becameclear that a particular retrofit that was doneto expand one water intake station had notbeen completed in an optimal way. In fact,the pumps that were chosen for this retro-fit were not compatible with the existingsystem and, consequently, added no waterpressure to the system. Simply by turningoff these new pumps, IMC achieved sub-stantial savings. With the appropriate sys-tem data in hand, IMC is now redesigningthis particular intake station to optimizeefficiency.
Case Study Compendium
97

Watergy
98
GoalVodokanal, the City of Lviv’s water utility,set a goal of reducing energy costs andreplacing outdated plant infrastructure.
MotivationEnergy prices have gone up considerablyin recent years. Vodokanal has limitedfinances and is often in debt to the energycompany. Reducing energy use and waterwaste can significantly improve their finan-cial situation.
MethodologyVodokanal is in the process of gaugingefficiency by gathering data on electricityused in pump stations to compare with thewater pumped. It is using this informationto prioritize projects for any availablefunding.
About the Plan
Development ProcessAfter a 5-year development phase, Lvivwill receive funding from internationalorganizations to modernize its water supplysystem. The largest percentage of theUS$40 million project will come from aUS$24 million World Bank loan approvedin June 2001. The remaining funds willcome from a US$6 million grant from theSwedish International Development Agencyand a US$10 million contribution fromlocal authorities, once the Government ofUkraine has approved the World Bankcredit agreement.
A large portion of the World Bank proj-ect will focus on promoting energy savingsby replacing inappropriate pumps, buildingpressure zones for stability, and repairingwater lines that have high rates of leakage.
Key Results• Secured $40 million to upgrade water
system efficiency• Developed a metering and monitoring
system that will help prioritize upgrades
XVI. LVIV, UKRAINE: SUPPLY-SIDE MANAGEMENT
Key Topics• Water and energy equipment upgrades• Energy metering and monitoring• Team building
Vodokanal Contacts:Kris Buros, CH2M Hill,E-mail: [email protected]

Up-to-date management principles and apolicy of adequate tariffs for water willalso be introduced. In addition, Lviv hasobtained equipment on a grant fromUSAID to upgrade pumps and motors.
Management and Development TeamLviv’s chief engineer manages the waterutility efficiency of the system. Staff mem-bers in charge of pump stations and wellfields, along with the chief electrical engi-neers, have primary responsibility foridentifying projects and seeking fundingopportunities. Because the pipelines areold, the maintenance staff frequentlymakes pipeline repairs. With the recentlyacquired funding, Lviv plans to correct theleak and pumping problems associatedwith old equipment.
Monitoring and Verification of SavingsVodokanal has installed domestic customermeters to measure the amount of waterthey use with the goal of driving downwater demand. Meter unreliability, andtampering and limited ability to penalizethe customer for nonpayment, however,pose barriers to the utility’s efforts.Vodokanal is in the process of quantifyingthe benefits of improvements. It is alreadyclear that improvement actions have result-ed in pump efficiency improvement at wellfields in pump stations where Vodokanalincurs most of its major costs.
Case Study Compendium
99

Watergy
100
BackgroundPune is a town of 2.5 million people in thestate of Maharashtra. It has about 1,000 kmof water pipes in its distribution system. Itconsumes 105 MWh each year in electricity,costing about 450 million rupees (US$10million). Water pumping and street lightingincur the vast majority of municipal elec-tricity expenditures. The Alliance to SaveEnergy with support from the USAID andthe U.S. Asian Environmental Partnershipidentified numerous energy saving opportu-nities worth approximately 7 million rupees(US$150,000) in the water plants of thePune Municipal Corporation (PMC). Punehas already made system changes based onthese recommendations, saving more than1.5 million rupees (US$33,000) annuallywith no investment costs.
MotivationPMC currently spends a huge proportionof its annual budget on electricity to pumpwater. The financial and environmentalcosts of both electricity and water continueto rise as water availability declines anddemand increases.
GoalPMC is currently in the process of estab-lishing short-term and long-term goalsto tap these savings.
MethodologyThe efforts of PMC are intended to achievethe following:
� Support and institutionalize energymanagement cells at PMC
� Establish and achieve short-term andlong-term goals for energy and watersavings based on systemwide energyaudits
� Implement periodic systemwide energyaudits of PMC systems
� Prioritize and implement systemimprovement projects and programs
� Test new energy-efficient technology(pilot projects)
� Develop and evaluate water and energyefficiency benchmarks for future expan-sions of facilities
� Study potential improvements in ratestructures and collection mechanismsfor water
� Design and implement a public aware-ness campaign to educate municipalwater consumers about the costs tothem and to society of water wasteand how they can save water.
Key Results• Created an energy management team• Identified more than US$150,000 in
annual energy-saving opportunities• Achieved savings of more than
US$33,000 through system operationimprovements
XVII. PUNE, INDIA: SUPPLY-SIDE MANAGEMENT
Key Topics• Team building• Energy and water metering and monitoring• Energy and water audits• Energy efficient equipment upgrades
Pune Municipal CorporationAshok Deshpande, Additional Commissioner(+91) 20 553-4365Ramesh Juvekar, Prima(+91) 20 541-1208

About the Program
Development ProcessIn collaboration with the Alliance to SaveEnergy, the PMC water and energy efficien-cy team is working to identify energy- andwater-saving opportunities. The team isanalyzing system data, carrying out sitetrials and measurements, and conductingperiodic energy and water audits to deter-mine where opportunities for improve-ments exist. The team is tasked withidentifying potential solutions to theseproblems and offering the most cost-effective solutions.
Management and Development TeamPMC is providing staff and budget for theoperation of its water efficiency and energymanagement cell (EMC), which it createdto help incorporate energy efficiency intothe operations of the municipal corpora-tion. The cell’s current staff (including topmanagers, field experts, and a data manag-er) has been valuable in gathering data andhas already identified some additionalenergy- and water-saving opportunities.
Monitoring and Verification of SavingsPart of PMC’s current process of gatheringand verifying energy and water use data isdetermining baselines for consumption.Using these baselines as benchmarks, theEMC will set goals for energy efficiencyand water loss reduction. It will be theEMC senior staff’s and director’s job totrack progress toward these goals andcreate a strategy to attain them.
Automated Data SystemThe EMC has been tasked with the job ofinstitutionalizing the collection and analy-sis of energy and water use data. This auto-mated data system required the purchaseof monitoring equipment and training forfield staff on its use. The EMC managesand updates its database and reports regu-larly to the Municipal Commissioner andothers concerned.
OutcomeThe anticipated results of these effortsinclude:
� Implementing almost 7 million rupees(US$150,000) worth of savings oppor-tunities already identified a year (1.5million rupees [US$33,000] in savingshave already been implemented)
� Identifying additional opportunities toreduce energy and related expendituresassociated with water pumping andother municipal services
� Increasing awareness of local con-sumers about measures they can taketo reduce water losses and waste andotherwise reduce their energy use
� Creating greater awareness in the localpopulation about efforts PMC is takingto reduce costs and operate efficiently.
Case Study Compendium
101

103
ACT Future Water Supply StrategyAustralian Capital Authority Energy and Water, June 1994. A strategic plandeveloped by the water authority of Canberra, Australia, in concert with thecommunity to manage water resources sus-tainably. It contains 137 tasks in educationand awareness, water pricing, water conser-vation practices and appliances, supply secu-rity, alternative water supply sources, andefficient water supply system for integratedwater management.
Phone: (+61 2) 6248 3111/ 6209 6899Website: <www.actewagl.com.au>E-mail: [email protected]
Commercial and Institutional End Uses of WaterAwwa Research Foundation (AwwaRF), Aquacraft, Inc., Planning andManagement Consultants, and Water Resources Management. Summarizesand interprets the existing knowledge base on commercial and institutionaluses of utility-supplied potable water in urban areas. Presents the results offield studies in a sample of 25 establishments in five urban areas. Providesa set of efficiency benchmarks for restaurants, hotels, motels, supermarkets,office buildings, and schools. Research partner: U.S. Bureau of Reclamation.Published in 2000.
Awwa Research Foundation6666 West Quincy Avenue, Denver, CO 80235-3098 USAPhone: (+1 303) 347 6100Website: <www.awwarf.com/>
Community Co-Management of Urban Environmental Quality: Water,Sanitation, and Water Pollution ControlWorld Bank Urban Development Series, December 2000. A study designed todetermine the best decision-making procedure for coordinating the municipalgovernment, community, and private sector in designing water and sanitation,solid waste management, and water pollution control systems.
Phone: (+1 800) 645 7247Website: <www.worldbank.org/resources>
Effective Energy Management GuideUnited Kingdom Government Office for the South West and Energy Efficiency,Best Practice Programme, Bristol, United Kingdom.
Phone: (+01 17) 900 1800Website: <www.oursouthwest.com/SusBus/susbus9/eemguide.htm>
Appendix A
WATER RESOURCE MANAGEMENT
Key Topics Covered• Drought strategy• Environmental management• Alternative sources• Pricing models

Impacts of Demand Reduction on Water UtilitiesAwwa Research Foundation (AwwaRF), Montgomery Watson. Provides utilitymanagers with data to quantify accurately the impacts of reduced flows result-ing from conservation measures and evaluate the impacts on operating costs.Also assists water planners in implementing a least-cost-facility expansion orupgrade policy and in integrating conservation measures during the masterplanning process. Published in 1996.
Awwa Research Foundation6666 West Quincy Avenue, Denver, CO 80235-3098 USAPhone: (+1 303) 347 6100Website: <www.awwarf.com/>
Long-Term Effects of Conservation RatesAwwa Research Foundation (AwwaRF), Wade Miller Associates, Inc. Providesguidance on an overview analysis of the long-term effects of conservationpricing strategies. Includes a computer-based spreadsheet-forecasting modelfor evaluating conservation rates. Published in 1997.
Awwa Research Foundation6666 West Quincy Avenue, Denver, CO 80235-3098 USAPhone: (+1 303) 347 6100Website: <www.awwarf.com/>
Water Conservation and Peak DemandManagement PlanTown of Cary, North Carolina. The least-costplan for water management in 2000–10 forthe Town of Cary.
Phone: (+1 919) 469 4000Website: <www.townofcary.org>E-mail: [email protected]
WaterPlan 21Sydney Water (1997). A vision of sustainablewater use for the area around Sydney,Australia, including action items to improvewater efficiency and attain sustainablewater use.
Phone: (+61 2) 9350 6969Website: <www.sydneywater.com.au>E-mail: [email protected]
Watergy
104
Key Topics Covered• Wastewater/storm water
plan• Biosolids management• Overflow abatement• Environment management
Key Topics Covered• Water-use analysis• Reclaimed water system• Benefit cost analysis• Rate structure

105
Appendix B
General
Water Wiser: The Water Efficiency ClearinghouseProvides a clearinghouse on water service companies, water efficiency references,and publications, such as Water Audits and Leak Detection and many others, forsupply-side actions.
Phone: (+1 800) 559 9855Website: <www.waterwiser.org>E-mail: [email protected]
American Water Works Association (AWWA) Conservation DivisionPart of the conservation division mission is to develop urban water conserva-tion measures, implementation strategies, and analysis procedures to helpaddress water supply issues.
Phone: (+1 303) 794 7711Website: <www.awwa.org>
Water Engineering and ManagementMagazine that contains products, technologydemonstration case studies, and systemmanagement tips.
Phone: (+1 847) 298 6622Website: <www.waterinfocenter.com>
World Bank Web-Based Tool toBenchmark Utility PerformanceShows a compilation of water and wastewaterperformance indicators and analysis drawnfrom Baltic region utilities.
Website: <www.water.hut.fi/BUBI>E-mail: [email protected]
Publications
Water Efficiency: A Resource for UtilityManagers, Community Planners, andOther Decision MakersResource Management Institute, 1991. RockyMountain Institute, The Water Program,Snowmass, CO. Suggests several options andconsiderations for systemwide planning andwater management, including metering.
Phone: (+1 970) 927 3851Website: <www.rmi.org>
RESOURCES FOR AUDITS AND BENCHMARKS
Key Topics Covered• News, information, and
products in water/waste-water industries
• System management
Key Topics Covered• Benchmarking• Performance indicators• Water quality• Environmental indicators
Key Topics Covered• Integrated resource planning• Gray water use• Rainwater collection systems• Water banking• Reclamation and reuse
Watergy
106
Tap into Savings: How to Save Energy inWater and Wastewater Systems ManualIowa Association of Municipal Utilities,August 1998.
Phone: (+1 515) 289 1999Website: <www.iamu.org>
Energy Audit Manual for Water-Wastewater FacilitiesElectric Power Research Institute, Report. CR-104300, 1994.Phone: (+1 650) 855 2000Website: <www.epri.com>
“Selecting Liquid Flowmeters”Plant Engineering, Dec. 1999. Cahners, Inc.Website: <www.plantengineering.com>E-mail: [email protected]
Water Engineering and ManagementMarch 2001. Issue focuses on controls systems.Phone: (+1 847) 298 6622Website: <www.waterinfocenter.com>
Pumping Systems Field Monitoring andApplication of the Pumping SystemAssessment ToolDon Casada, U.S. Department of Energy.Specifically for pumping system monitoringand measurement.Phone: (+1 800) 862 2086Website: <www.oit.doe.gov/bestpractices>
Water Pumping Optimization Tools
Cities Cut Water System Energy CostsWebsite: <www.eren.doe.gov/cities_counties/watersy.html>
Water Resources Consulting Services, The Premiere Spot for LocatingHydrology and Hydraulics Modeling ToolsWebsite: <www.waterengr.com/>Website: <www.derceto.com/projects.html>Website: <www.ex.ac.uk/WaterSystems/about_us.html>
Key Topics Covered• Water energy audit• Fine-bubble diffusers• Variable speed pumps/drives• High efficiency motors• Load management
Key Topics Covered• Pump efficiency• Life cycle cost analysis• Optimization• Modernization

107
Appendix C
Alliance to Save EnergyThe Alliance to Save Energy regularly receives requests to provide informationon energy efficiency financing tools, as well as advice on how to create loanfunds for financing energy efficiency projects. In response to these requests, theAlliance is creating a database that documents debt/equity funds and partialguarantees.
Phone: (+1 202) 857 0666Website: <www.ase.org>
American Water Works Association (AWWA)AWWA has contacts for municipal and regional water companies around theworld.
Phone: (+1 303) 794 7711Website: <www.awwa.org>
Best Practices Study for Energy ManagementAwwa Research Foundation (AwwaRF), EMA Services, Inc., Rose Enterprises,Inc., and Treefarm Center Consultants, Inc. Will develop a documented consor-tium benchmarking process for water utility application. Will test application ofthe process in an energy management benchmarking study. Research partner:Irvine Ranch Water District (to be completed in 2002).
Awwa Research Foundation6666 West Quincy Avenue, Denver, CO 80235-3098 USAPhone: (+1 303) 347 6100Website: <www.awwarf.com/>
Energy and Water Quality Management SystemAwwa Research Foundation (AwwaRF), EMA Services, Inc., and East BayMunicipal Utility District (Oakland, Calif.). Based on a pilot project, provides amethodology and guidelines for evaluating various designs for energy manage-ment systems that will be part of a utility SCADA system. Determines the bene-fits of a water quality–constrained energy management system. Bases benefitson a variety of alternative future scenarios for energy management, includingelectric utility deregulation. Research partner: EPRI CEC. Published in 1997.
EPRI AMP Customer Assistance Center at 800-432-0267.Awwa Research Foundation6666 West Quincy Avenue, Denver, CO 80235-3098 USAPhone: (+1 303) 347 6100Website: <www.awwarf.com/>
DATA ANALYSIS: KEY PLAYERS AND RESOURCES

Watergy
108
Handbook of Energy AuditsFourth Edition, Albert Thumann, 1995, Fairmont Press, Lilburn, Georgia, USA,444 pp. Handbook describes the audit process and suggests improvements for avariety of systems.
Implementing a Prototype Energy and Water Quality Management SystemAwwa Research Foundation (AwwaRF), EMA Services, Inc. Will quantify theprojected benefits of an energy and water quality management system(EWQMS) at a major water utility. Will design, model, implement, measureresults, and document the Operations Planner and Scheduler (OPS) functionmodeled in previous EWQMS phases. Will develop site-specific specificationsof OPS software, with a requirement that the system can be made operationalwithin six months and yield a positive return on investment within 1 year.Will document performance of OPS software following installation and start-up.Research partner: Colorado Springs Utilities. (To be completed in 2002)
Awwa Research Foundation6666 West Quincy Avenue, Denver, CO 80235-3098 USAPhone: (+1 303) 347 6100Website: <www.awwarf.com/>
Ozone System Energy Optimization HandbookAwwa Research Foundation (AwwaRF), Process Applications, Inc. Providesan energy efficiency protocol for ozone systems used in drinking water plants.Documents a series of one-week plant audits focused on the ozone system.Quantifies the improvements that were implemented. Research partner:EPRI CEC. Published in 1996. EPRIAMP Customer Assistance Center at800-432-0267.
Awwa Research Foundation6666 West Quincy Avenue, Denver, CO 80235-3098 USAPhone: (+1 303) 347 6100Website: <www.awwarf.com/>
Practical Energy Audit Manual: Pumping SystemsIndo-German Energy Efficiency Project, August 1999. Tata Energy ResearchInstitute, Bangalore, INDIA, 95 pp. Provides some engineering equations andaudit guidance.
Phone: (+91 11) 468 2100Website: <www.teriin.org>

Appendix C
109
Quality Energy Efficiency Retrofits for Water SystemsAwwa Research Foundation (AwwaRF), HDR Engineering, Inc. Providespragmatic information to increase the likelihood of high quality, reliable,and persistent energy management retrofits. Includes information on how toavoid common pitfalls and problems, suggestions for selecting contractors,and how to evaluate completed projects. Research partners: California EnergyCommission and EPRI CEC. Published in 1997.
EPRIAMP Customer Assistance Center at 800-432-0267.Awwa Research Foundation6666 West Quincy Avenue, Denver, CO 80235-3098 USAPhone: (+1 303) 347 6100Website: <www.awwarf.com/>
A Total Energy and Water Quality Management SystemAwwa Research Foundation (AwwaRF), Westin Engineering, Inc. Presents ageneric model for an energy and water quality management software systemfor the water community. Based on the generic model, develops standardspecifications for the software applications required to minimize energy costswithin the constraints of water quality and operations goals. Research partner:EPRI CEC. Published in 1999.
Awwa Research Foundation6666 West Quincy Avenue, Denver, CO 80235-3098 USAPhone: (+1 303) 347 6100Website: <www.awwarf.com/>
Water Conservation Plan GuidelinesThe U.S. Environmental Protection Agency, August 1998, Document832/D-98-001. This manual was put together by USEPA to help water utilitysystem planners incorporate customer water efficiency into facility planning.It offers guidelines on water accounting, source metering, user metering, andwater loss control worksheets and customer water use benchmarks.
Phone: (+1 202) 260 7786Website: <www.epa.gov/owm>

111
Appendix D
Case Studies in Residual Use and Energy Conservationat Wastewater Treatment PlantsU.S. Environmental Protection Agency,June 1995. Includes actual projects to reduceenergy use, and produce energy with biogasand biosolids.
Phone: (+1 202) 260 7786Website: <www.epa.gov/owm>
Plant Engineers and Managers Guide to Energy ConservationAlbert Thumann, 1996. Association of Energy Engineers, Fairmont Press,Lilburn, Georgia, USA, 390 pp. Covers lighting, electrical, heat transfer, heatrecovery, ventilation, and utility process systems, such as pumps.
The following technical resources are available to helpspecifically capture opportunities in pump and motorsystems:
Practical Energy Audit Manual:Pumping SystemsIndo-German Energy Efficiency Project,August 1999. Tata Energy Research Institute,Bangalore, INDIA, 95 pp.
Phone: (+91 11) 468 2100Website: <www.teriin.org>
Manual on Energy Efficiency in PumpingSystemsConfederation of Indian Industry EnergyManagement Cell, Energy ManagementCentre, Indian Ministry of Power, September1998, 173 pp.
Phone: (+91 44) 466 0571E-mail: [email protected]
Improving Pump System Performance:A Sourcebook for IndustryU.S. Department of Energy, Office ofIndustrial Technologies, January 1999.
Phone: (+1 800) 862 2086Website: <www.oit.doe.gov/bestpractices>
ADDITIONAL RESOURCES FOR EQUIPMENT UPGRADES
Key Topics Covered• Biogas generation• Central power generation• Waste heat recovery• Dewatering/drying bed
Key Topics Covered• Centrifugal pumps• Positive displacement pumps• Capacity regulation• Series/parallel operation• Energy management
programs
Key Topics Covered• Equipment upgrades: pumps• Impellers• Capacity regulation• Standards/design
Key Topics Covered• Pump system components• Pump system principles• Piping configurations• Types of pumps

Watergy
112
Pump Life Cycle Costs: A Guide to LCC Analysis for Pumping SystemsEuropump and Hydraulic Institute, Parsippany, New Jersey, Frenning, Lars andothers, 2001. First edition.
Website: <www.pumps.org>.
Pumping System Assessment ToolThe Pumping System Assessment Tool (PSAT) is a software program offered bythe U.S. Department of Energy. Given motor and pump data, PSAT calculatesefficiencies, power factors, and estimated costs for the existing pump and anoptimal pump. PSAT uses achievable pump performance data and motor per-formance data to calculate potential energy and associated cost savings.
Phone: (+1 800) 862 2086Website: <www.oit.doe.gov/bestpractices>
For Leak and Loss Reduction:
Water Wiser, American Water Works,Association:� Water Audits and Leak Detection, 1999,
96 pp. Provides guidance on conductingsystemwide water audits with worksheets
� Leaks in Water Distribution Systems, 1987,48 pp. Specific guidance on leak detectionand repair
Phone: (+1 800) 559 9855Website: <www.waterwiser.org>E-mail: [email protected]
Using Water Efficiently: Technological OptionsMei Xie, Ulrich Kuffner, and Guy LeMoigne, 1993, World Bank Technical PaperNumber 205. Gives an overview of system losses and ways to improve systemperformance.
Water Conservation Plan GuidelinesAugust 1998, Document 832/D-98-001.
The U.S. Environmental ProtectionAgency put this manual together to helpwater utility system planners incorporatecustomer water efficiency into facilityplanning. It offers:
� Guidelines on water accounting� Source metering, user metering, and water loss control worksheets
Phone: (+1 202) 260 7786Website: <www.epa.gov/owm>
Key Topics Covered• Products directory• Service companies’ directory• Leak detection & repair• Water management
principles
Key Topics Covered• Flow reduction• Accounting• Metering• Loss control• System profiling

Appendix D
113
Information Resources on Industrial Pollution Prevention, CD-ROM, Hagler Bailly Inc., Environmental Export Council USAID, Summer 2000 (Spanish and English).This CD-ROM provides information onindustrial pollution prevention and cleanerproduction approaches, methods, andtechnologies to government agencies,clean production centers, and other NGOs,industry and trade associations, individualenterprises, academic institutions, and con-sultants in Latin America and the Caribbean.
A Guidebook for Reducing Unaccounted-for WaterTexas Water Development Board, RevisedAugust 1999. This guidebook providespractical information on how to set up acomprehensive water accounting system,including metering, billing, and leakdetection.
Website: <www.twdb.state.tx.us/assistance/conservation/guidebook.htm>
Water Distribution Optimization Tools/Hydraulic Analysis Software:The following lists links to software tools and other organizations that offerinformation. These types of tools have helped municipal water managers tomonitor their water distribution systems, optimize system performance andcut water system energy costs.
Derceto: Water Distribution Optimization Software for WindowsA software tool that works online and in real-time to optimize water distribu-tion costs by setting pump schedules and selecting lowest-cost water sources.
Website: <www.derceto.com/projects.html>
Supervisory Control and Data Acquisition (SCADA) SystemsSCADA systems help municipalities to manage water treatment and distributionas well as wastewater collection and treatment.
Website: <www.eren.doe.gov/cities_counties/watersy.html>
For a list of additional hydrology software packages visit:The University of Kassel Irrisoft Database:
Website: <www.wiz.uni-kassel.de/kww/irrisoft/pipe/pipe_i.html>
Centre for Water Systems at the University of Exeter
Website: <www.ex.ac.uk/WaterSystems/about_us.html>
Key Topics CoveredIndustrial pollution prevention in:• Food industry• Metal finishing industry• Leather tanning industry• Other sectors
Key Topics Covered• Metering• Leak detection• Water accounting worksheet• Unaccounted-for water
checklist

Watergy
114
Organizations:
U.S. Department of Energy, Best PracticesBest Practices offers several guides for motor and pump system optimization,including:
� Energy Management for Motor-Driven Systems Handbook� Improving Pump Systems Sourcebook� MotorMaster+ Software� Pumping System Assessment Tool (PSAT) Software
Phone: (+1 800) 862 2086Website: <www.oit.doe.gov/bestpractices>
Water Resources Consulting ServicesThis consulting group based in San Francisco, California, provides links tohydrology and hydraulics modeling tools on their website, including links toCorps of Engineers modeling systems.
Website: <www.waterengr.com/>

115
Appendix E
Useful References from the American Water Works Association� Water Conservation Guidebook for Small and Medium-Sized Utilities, Pacific
Northwest Section, 1993. A report that includes chapters on how to esti-mate water savings; examples of residential, commercial, and industrialconservation measures; how to estimate benefits and costs; and how toimplement conservation programs.
� A Guide to Water Utility PublicInformation Practices, 1993
� Public Involvement Strategies:A Manager’s Handbook, 1995
� AWWA Journal, November 1993.Includes information on public involvement and education
� “Conservation-Oriented Water Rates,” AWWA Journal, November 1996.AWWA has a conservation division and extensive resources for demand-side
water management. It is a “must-see” resource for all water professionals.
Phone: (+1 303) 794 7711Website: <www.awwa.org>
Water Conservation Plan GuidelinesU.S. Environmental Protection Agency (USEPA), August 1998,Document 832/D-98-001.
USEPA put this manual together to help water utility system plannersincorporate customer water efficiency into facility planning. It offers:
� Guidelines on water accounting� Source metering, user metering, and water loss control worksheets� Customer water-use benchmarks.
Phone: (+1 202) 260 7786Website: <www.epa.gov/owm>
Water Efficiency Manual for Commercial,Industrial, and Institutional FacilitiesNorth Carolina Department of Environmentand Natural Resources, August 1998. A man-ual for large water utility customers to planand manage water use comprehensively.
Phone: (+1 800) 763 0136Website: <www.p2pays.org>
DSM/POLICY OPTIONS AND OTHER RESOURCES
Key Topics Covered• Integrated resources planning• Conservation techniques• AWWA water efficiency study• System viability analysis
Key Topics Covered• Principles of water
management• Industry-specific processes• Efficiency compared with
conservation• Water balance• Reuse

Watergy
116
Facility Manager’s Guide to WaterManagementArizona Municipal Water User’s Association,August 2000. A manual for large water utili-ty customers to plan and manage water use.
Phone: (+1 602) 248-8482Website: <www.amwua.org>
Water Efficiency: A Resource for Utility Managers, Community Planners,and Other Decision MakersResource Management Institute, 1991. Rocky Mountain Institute, The WaterProgram, Snowmass, CO. Suggests several options for demand-side watermanagement.
Phone: (+1 970) 927 3851Website: <www.rmi.org>
A Water Harvesting Manual for Urban Areas: Case Studies from DelhiCenter for Science and the Environment. The manual describes the conceptand process involved in rainwater collection.
Website: <www.cseindia.org>
Key Topics Covered• Inventory• Water balance analysis• Monitoring

117
Appendix F
SAVING WATER AND ENERGY: INDUSTRY
Build a Water Efficiency Program 1. Create a water efficiency team and designate a water efficiency coordinator.2. Identify and introduce a proper measurement system.
• Develop a baseline and metrics• Benchmark progress internally and externally.
3. Carry out facility assessments.• Identify potential water-efficiency improvement at the target facility.• Calculate the expected water savings and the estimated costs associated
with the implementation of water efficiency projects.
4. Establish a program of maintenance, inspection and evaluation of productionpractices.
5. Increase management and employee awareness of the need to use waterefficiently. Involve employees in water efficiency efforts.• Develop best practices training.• Check with peers to verify technological results of similar projects and to
get advice.
Optimize the Water Distribution System1. Check for leaks.
• Inspect for leaks in pipes, fittings, pumps and gauges in mechanicalrooms and headers throughout the building. Repair will prevent collateraldamage to wood surfaces and furnishings, ceiling tiles and electricalequipment. The savings will occur in the water bill and through a lowersewer disposal fees as well.
• Leaks occurring in closed systems can be even more expensive. Water cir-culating in the chiller, the condenser and the steam loops is usually chem-ically treated for corrosion and high hardness. Here the total loss coverswater as well as very costly chemicals and some of the energy needed toheat or cool the circulating fluid.
• Inspect and repair damaged insulation systems. Sagging or missing sec-tions of insulation indicate possible leaks.
2. Cooling systems and cooling towers• Meter and record water use.• Never use once-through water cooling. If there is no other choice, reuse
the water elsewhere in the facility.• Use air cooling, as opposed to water cooling, where feasible.• Establish performance-based specifications when contracting with a cool-
ing tower vendor.
SAMPLE WATERGY FACT SHEETS

Watergy
118
• Investigate side-stream treatment.• Investigate the potential of wet-dry cooling towers.• Reuse treated wastewater or other sources of water for cooling tower
make-up.
3. Boilers and hot water• Insulate boilers, storage tank(s), and pipes.• Use instantaneous heaters at remote locations.• Establish performance-based specifications when contracting with a boiler
vendor-operator.• Check stream traps regularly - faulty steam traps waste water and heat.• Reuse steam condensate water and boiler blow-down water where feasi-
ble.• Feed used water back into systems where possible.• Record water use and check for leaks.
4. Other water using equipment and operations• Use automatic valves that shut off the water when equipment is off.• Consider minimizing water use when purchasing new equipment.• Use mechanical/oil seals instead of water packing glands on pumps where
possible.• Capture reject water from reverse osmosis units and reuse it where feasi-
ble.• Use automated computer control technology to regulate water use.
5. Reuse wastewater• Try to close the manufacturing loop by reusing water.• Treat used water only if necessary.• Identify discharges that can be reused and implement reuse practices.

Appendix F
119
SAVING WATER AND ENERGY AT HOMEFor the average household, a 35 percent reduction or more in water use is feasi-ble, just by following the steps outlined below. The bathroom is a key area onwhich to focus as nearly 65 percent of all indoor water use occurs there.
Saving Water Indoors1. Toilets: Toilets consume the most water inside the home.
• Check for leaks. Put a few drops of food coloring or leak identificationtablets in your toilet tank. If the coloring appears within 30 minutes with-out flushing you have a leak that may waste up to 200,000 liters (52,800gallons) a year. Often fixing a leak can be as simple as tightening looseconnections, reconnecting joints after wrapping Teflon-Tape around thethreads, or replacing a worn out float cup, rubber tank ball or flapper(which seals the opening between tank and toilet bowl).
• Flush toilets less often. Do not use them as ashtrays or wastebaskets.• Toilet dams/displacement devices. Place plastic bottles filled with water
in your toilet tank or use an inexpensive toilet dam to block part of thetoilet tank. This can save 40 or more liters (11 gal) of water per day.Avoid bricks that can damage the tank.
• Ultra-low flush toilets. Installing an ultra-low flush toilet can save morethan 20 liters (5 gal) per flush.
2. Use less water.• Turn off faucets completely and reduce the amount of water used for
hand washing, brushing teeth, shaving, and showering.• Replace old faucet aerators and showerheads. Newer models tend to use
less water and provide more water pressure. Where possible, purchaseinexpensive flow restrictors on showers and faucets
• Water-saving shower heads, saving up to 20 liters (5 gal) a minute.• Faucet aerators saving between 12 and 65 liters (3 and 17 gal) per day.• When washing dishes by hand, don’t leave the rinse water running.• Fully load your washing machine and dishwasher.• Purchase more efficient washing machines. Where possible, purchase
Energy Star approved machines. Otherwise, front-loading washingmachines tend to be more efficient. Comparing product specificationscan also help to find the most efficient model.
3. Check for leaks.Check for leaks in pipes, hoses, faucets and couplings. Leaks can be costly.A leak of only one drop per second wastes about 10,000 (2,643 gal) liters ofwater per year. Read your water meter before and after a two- hour periodwhen no water is being used. If the meter does not read exactly the same,there is a leak. Fixing leaks is usually less expensive than paying for wastedwater (up to 75 liters or 20 gal a day per leak).

Watergy
120
4. Hot water heater.• Purchase an efficient water heater. (234 therms per year for a 152 liter or
40 gal gas water heater or 4,671 kWh per year for a 152 liter or 40 galelectric unit)
• Insulate hot water pipes and water heater using foam pipe insulation,water heater jackets, or other approved insulation materials.
5. Reuse wastewater.• Never let water go down the drain when there may be another use for it
such as watering a plant or cleaning. For example, when washing off fruitor vegetables, place a bucket under the faucet. Use the water collected inthe bucket to water plants.
Saving Water Outdoors1. Cleaning.
• Use a sweeper or broom to clean the garage, driveway, floors or sidewalkinstead of a hose. Unnecessary use of a hose wastes 1000 liters (264 gal)of water per hour.
• When using a hose, outfit it with a shut-off nuzzle and when finished,“turn it off” at the faucet instead of at the nozzle to avoid leads.
• Wash your car on the lawn with a bucket of water and a sponge.
2. Garden.• Don’t overwater your lawn, and plant low maintenance landscape with
native species adapted to live in your climate conditions (xeriscaping).• Water the roots of plants, not the leaves.• Water lawns early or late in the day when temperature and wind are the
lowest to reduce losses from evaporation (early morning is usually recom-mended to minimize mildew, etc.).
• Adjust sprinklers to water lawns and not pavement.• Use drip hoses where possible instead of sprinklers, which can lose water
to evaporation and inaccurate targeting of water.• Do not leave sprinklers or hoses unattended. Outdoor faucets can flow at
rate of more than 1000 liters or 264 gal per hour.• Use irrigation timers.

Appendix F
121
3. Capturing water.• 1000 square feet of roof or pavement can collect 1500 liters (396 gal) of
water from 1 inch of rain. A cistern or rain-barrels that capture and storerainwater can be used as a source for irrigation or washing. Also, connectinggutter downspouts to collection systems can also help supply the cistern.
4. Installations.• Avoid the installation of ornamental water features (such as fountains)
unless the water is recycled.• If you have a swimming pool consider a new water-saving pool filter.
Cover the pool when not in use; up to 200 liters (53 gal) of water per daycan be lost because of evaporation. An average sized pool can lose morethan 3,500 liters (925 gallons) per month through evaporation if leftuncovered.

Watergy
122
SAVING WATER AND ENERGY:MUNICIPALITIES AND WATER UTILITIES
Build the Infrastructure to Address Water EfficiencyBring together the human and financial resources needed to address efficiency.• Designate a water efficiency coordinator and build a water efficiency team.
Set goals and develop a water-efficiency strategy.• Educate and involve employees in water efficiency efforts.• Create a targeted budget for water efficiency.
Analyze the Current SystemBuild the institutional capacity to analyze systems and locate efficiencyopportunities.• Create a metering and monitoring system.• Develop a baseline of energy and water use.• Benchmark progress internally and externally.
Encourage Demand-Side ReductionsWork with consumers to reduce waste and get more benefit from each liter ofwater used. Demand-side reductions can cost as little as one third the expendi-ture for comparable new capacity.
Price• Develop a price structure that reflects the true cost of water. Ensure that the
utility rate structure encourages water efficiency, or at least does not encour-age water waste.
Residential end-user• Promote/distribute efficient water saving technologies, such as:
— Ultra low-flow toilets (6 liters per flush instead of up to 30 liters)— Low-flow faucet aerators (reduce water flow by up to 50 percent while
maintaining water pressure)— High efficiency showerheads (using less than 10 liters a minute instead of
30 liters)— Leak detection tablets (a leak of just one drop per second can waste
10,000 liters per year)— Replacement valves.
• Offer rebates and installation programs to customers who buy high-efficiencyproducts like low-flow showerheads, ultra low-flow toilets, clothes-washers,water heaters, etc.
• Educational outreach is essential. Include water tips in billing statements,provide water saving curriculum materials for schools, and so on.
• Enact and enforce water-efficiency building codes and equipment standards.• Perform free water audits for customers, especially large users.

Appendix F
123
Industrial and business end-user• Encourage industries to reduce water use by offering incentives.• Promote wastewater reuse.• Enact and enforce energy-efficiency building codes and equipment standards.• Introduce tax breaks for major efficiency projects.• Offer rebates for the installed cost of equipment that improves water efficiency
such as retrofitting cooling towers, and replacing water-cooled with air-cooledequipment.
• Offer audits and surveys of water use.
Take Supply-Side Actions• Improve operation and maintenance practices to increase efficiency.• Implement a water-loss management program. Focus on pumps, pipe and
valve leaks, and theft (water losses should be brought under 10 percent).• Carry out facility assessments identifying water saving opportunities.• Purchase appropriately sized energy-efficient equipment:
— Pumps— Energy efficient motors— Adjustable speed drives— Impellers— Lower friction pipes and coatings— Valves— Capacitors
• Introduce and enforce universal metering.• Try reclaimed wastewater distribution for non-potable uses

Ad hoc management. A managementapproach in which no comprehensiveeffort is made to promote water efficien-cy. Efficiency actions that are imple-mented are likely to have been madewithout considering the effect on effi-ciencies in other parts of the system.
Adjustable speed drive (ASD). Devices thatallow pumps and motors to adjustspeeds to match varying load require-ments.
Aeration control systems. Control systemsthat help optimize water treatment per-formance by controlling and adjustingthe amount of air put into wastewaterbasins.
Air drying. The final stage in the primarytreatment process of sludge in whichdigested sludge is placed on sand bedsfor air drying. Air drying requires dry,relatively warm weather for greatest effi-ciency; some plants have a greenhouse-like structure to shelter the sand beds.
Anaerobic digestion. An option of sludgeprocessing that produces methane thatcan be burned as a fuel.
Aquifers. One or more geologic formationscontaining sufficient saturated porousand permeable material to transmitwater at a rate sufficient to feed a springor for economic extraction by a well.
Baseline. An analysis of the efficiency of awater utilities operation at a given pointof time that can be used to comparewith future efficiency.
Benchmark. Something that serves as astandard by which others may be meas-ured or judged.
Bubble diffusers. In wastewater treatment,devices used to provide oxygen and agi-tation in biological treatment.
Bundling. Inclusion of many smaller proj-ects together in a larger project.
Buyback. Offering industries money if theysucceed in reducing certain levels ofwater everyday.
Bypass valve. Valve that allows flow to goaround a system component by increas-ing or decreasing the flow resistance ina bypass line.
C-value. A factor of value used to indicatethe smoothness of the interior of a pipe.The higher the c-value, the smootherthe pipe, the greater the carrying capaci-ty, and the smaller the friction or energylosses from water flowing in the pipe.To calculate the c-value, measure theflow, pipe diameter, distance betweentwo pressure gauges, and the friction orenergy loss of the water between them.
Capacitors. Devices that store electricalenergy and are used to correct lowpower factor. Capacitors improve powerfactor and reduce the total power (kVA)that equipment consumes by supplyingmagnetic needs and locally reducing thereactive power (kVAR).
Centrifuge. A type of equipment used fordewatering. Centrifuge use rapid rota-tion of a fluid mixture inside a rigidvessel. The many designs of centrifugesinclude solid bowl, basket, and disc-stack.
Champion. A strong advocate for waterefficiency in a water utility.
Chlorination. A major disinfection processfor wastewater.
Climate change. A phenomenon causedby increased concentrations of CO2,methane, and other greenhouse gasesthat has begun to affect municipalitiesadversely around the world throughmore extreme weather events, such asdroughts, heat waves, floods, andstorms.
125
Glossary

Cogeneration. The production of electricityusing waste heat (as in steam) from anindustrial process or the use of steamfrom electric power generation as asource of heat.
Comminutor. Equipment that grinds updebris into finer particles.
Computerized control systems. Managingenergy use by controlling pump opera-tion, monitoring pump efficiencies,shifting loads to off-peak times, andcontrolling variable speed drives orpumps.
Cross-fertilization. In this report, theexchange of ideas and informationamong departments and people ofdifferent backgrounds.
Demand-side. Actions that reduce theamount of water consumed. Thiscreates more system capacity, possiblyavoiding investments in new facilitiesand equipment.
Dewatering. Sludge typically has a watercontent of greater than 90 percent, caus-ing expensive recycling or disposal ofpretreated sludge. Dewatering separatesthe liquids from the solids, therebyreducing recycling or disposal costs.
Digester gas. In anaerobic digestion, thesludge is fed into an air-free vessel.The digestion produces a gas, whichis mostly a mixture of methane andcarbon dioxide. The gas has a fuelvalue and can be burned to provideheat to the digester tank and even torun electric generators. This gas iscalled digester gas.
Digestion. A method of biological sludgetreatment. Digestion can be eitheraerobic or anaerobic.
Disinfection. Destroying harmful microor-ganisms, thereby freeing from infection.
Efficiency kits. These contain inexpensivewater-saving devices; supplied bymunicipalities to induce customers toconserve water.
Energy management system. A managementstructure designed to identify, imple-ment, and verify savings from energyefficiency opportunities.
Energy performance contract (EPC). A wayto finance and implement a capitalimprovement project by using a client’scost savings to cover project costs.An energy services company (ESCO)provides this service.
Energy services company (ESCO). A com-pany that offers to reduce a client’senergy costs, often splitting the costsavings with the client through anenergy performance contract (EPC)or a shared savings agreement.
Facility assessment. A review of all equip-ment and devices involved with theprocessing, delivery, and treatmentof water to identify efficiency oppor-tunities. Also referred to as facilityenergy audits.
Filter press. A method of sludge dewatering.
Financial hurdle rate. A rate of return oninvestment that a proposed project mustreach to be implemented.
Friction. The force that resists relativemotion between two bodies in contact.
Frictional head. The head componentattributable to friction.
Gray water. Processed wastewater not fitfor drinking, but that can be usedeffectively in the industrial sector andfor toilets or certain agricultural uses.
Grit removal. A wastewater treatmentprocess to remove solids from waste-water.
Watergy
126

Head. The measure of pressure indicatingthe height of a column of system fluidthat has an equivalent amount of poten-tial energy.
Headworks. A device or structure at thefront or diversion point of a waterwayto control the amount of water flowing.
Horizontal axis washing machine. A typeof washing machine that spins clothesalong a horizontal axis. They typicallyuse less water than vertical axismachines.
Impeller. The spinning component in acentrifugal-type pump that pushes fluidthrough the system.
Incineration. A method of sludge treatmentinvolving burning of the solid portion ofthe waste.
Infiltration.When water or other liquid per-meates into a sealed pipe.
Kilovolt-ampere (kVA). A measurement oftotal power—active power, which doeswork (watts), and reactive power, whichcreates an electromagnetic field (VAR)(kVA2 = kW2 + kVAR2). Capacitors canhelp reduce the total power required bysupplying magnetic requirements(kVAR) on site.
Kilovolt-ampere reactive power (kVAR). OneVAR is equal to a volt-ampere of reactivepower; a kVAR is one thousand VARs.Reactive power does not do work likeactive power (kilowatts), but insteadproduces an electromagnetic field.Installing a capacitor can generate therequired magnetic field on-site, reducingthe total power (kilovolt-amperes)required to run a piece of equipment.
Load profile. A set of data often in graphicform portraying the significant featuresof energy consumption and demand ofcustomers.
Metering. Measurement of water and elec-tricity flow and consumption.
Methane. A colorless odorless flammablegaseous hydrocarbon (CH4) producedby decomposition of organic matter andcarbonization of coal and is used as afuel and starting material in chemicalsynthesis.
Metrics. Measures of water efficiency. Bycreating a set of metrics to gaugeimprovements and identify inefficien-cies, water efficiency management teamswill be better able to prioritize opportu-nities and assess their progress.
Monitoring. Tracking water efficiency pro-grams. By developing comprehensivemonitoring systems, many potentialsupply-side and demand-side savingsopportunities can be identified, imple-mented, and verified.
Nomograph. A graph consisting of threecoplanar curves, each graduated for adifferent variable, so that a straight linecutting all three curves intersects therelated values of each variable.
Organochlorine. A by-product of the chlo-rine disinfection process for wastewater.
Outsourcing. The practice of subcontractinga function or most functions to outsidecompanies. See also “energy servicecontracts.”
Overdesign. Systems designers occasionallyoverestimate the needed capacity tomeet highest flow conditions. This canlead to operational problems andincreases in costs.
Overharvesting. Removing more water fromthe ground, lakes, and rivers than isnaturally replaced. This is an environ-mentally threatening endeavor.
Glossary
127

Oxidation ditch. A ditch that holds partiallytreated wastewater to allow algae, aquaticplants, and microorganisms in decom-position process of the organic waste.
Ozonation. A disinfection process forwastewater using ozone.
Payback. The rate at which the savingsfrom the project covers the initial costsof the project.
Pilot project. A small-scale version of alarge project. Many utilities like to testideas and potential actions on a smallpilot level before they commit to a largeinvestment.
Pipe relining. Recoating the interior ofpipes with a low friction material toreduce friction losses.
Power factor. The ratio of active power(kW) to total power (kVA). A low powerfactor indicates a high level of reactivepower (kVAR) that can waste electricity.Many utilities charge a penalty for low-power factors. Installing capacitors cancorrect low-power factors.
Pressure gauges. Instruments to measurepressure within a water system.
Price structure. A system that charges dif-ferent prices for different customers andlevels of consumption. To determine anappropriate price structure, utilities usu-ally ascertain the price elasticity of waterdemand.
Primary treatment. The key method for pol-lutant removal from sewage by means ofsedimentation.
Programmable logic controls. Computerizedcontrol systems applied to electricallycontrolled equipment, such as pumpvariable frequency drives.
Proportional, integral, and derivative control(PID). Used to moderate wastewaterflows rather than allow wastewater tosurge and then stop.
Pump efficiency. A measure of the ability ofa pump to transfer energy efficientlyinto pumping action.
Real-time rate pricing. The cost of buyingor selling power based on the actualrates at specific times during the day.
Recalibration. Reformulating the set ofgraduations to indicate values or posi-tions on a meter gauge.
Reclaimed water use. Water that has beenused and would normally be disposedof, but is instead reused.
Renewable water. The amount of water thata watershed can replenish during agiven timeframe. This is the amount ofwater that can safely be extracted with-out the danger of overharvesting.
Return on investment (ROI). A financialmetric used to assess projects (ROI =profit/average capital*100).
Screening. A primary wastewater treatmentprocess to remove solids.
Secondary treatment. Also known as biolog-ical treatment, this process furtherreduces the amount of solids by helpingbacteria and other microorganisms con-sume the organic material in the sewage.
Sludge treatment. Stabilization or removalof hazardous waste constituents from awaste that is a mixture of both liquidsand solids.
Stabilization. A sludge treatment processthat chemically or physically immobi-lizes the hazardous constituents in thewaste by binding them into a solid mass.The resulting product has a low perme-ability that resists leaching.
Static head. The head component attributa-ble to the static pressure of the fluid.
Thickening. A sludge treatment process thatremoves as much water as possiblebefore final dewatering of the sludge.
Watergy
128

Throttle valves. A valve that regulates thesupply of a fluid by increasing ordecreasing the flow resistance across it.
Trickling filters. Used to reduce biologicaloxygen demand, pathogens, and nitro-gen levels, trickling filters are composedof a bed of porous material (rocks, slag,plastic media, or any other mediumwith a high surface area and high per-meability). Wastewater is first distrib-uted over the surface of the media,where it flows downward as a thinfilm over the media surface for aerobictreatment and is then collected at thebottom through drain systems.
Trihalomethanes. Chlorinated by-productsof wastewater disinfection processes.
Ultraviolet disinfection. A process using anultraviolet (UV) light source, which isenclosed in a transparent protectivesleeve. It is mounted so that water canpass through a flow chamber, and UVrays are admitted and absorbed intothe stream. These rays destroy bacteriaand deactivate many viruses.
Ultraviolet irradiation. UV irradiation is aphysical disinfection process and, thus,different from a chemical disinfectionprocess, such as chlorination. It hasbecome the most common alternative tochlorination for wastewater disinfectionin North America.
Unaccounted-for water. Loss in water sup-ply and treatment due to leaks, unau-thorized water usage, and poor waterdistribution and system maintenance.
Vacuum filter. A system of sludge dewater-ing.
Variable frequency drives. Drives used tomatch motors and pumps to varyingload requirements.
Water accounting. A system to account forwater brought in from a source anddelivered to end users, the customers.It should identify unmetered water,unauthorized water usage, leaks, losses,and so on.
Water audit. A methodical examination andreview of a customer’s water consump-tion. Water audits can point out savingsopportunities to the end user and, thus,act as a catalyst to induce implementa-tion of efficiency measures.
Water subsidy. Charging a low water rate toconsumers, even though the true cost ofusing water may be much higher. Thishas a distortionary effect and alsoencourages wasteful behavior.
Water-saving equipment. Equipment thathelps conserve water, for example, low-flow faucets, ultralow flush toilets, effi-cient washing machines, and so on.
Water-use categories. Different categoriesused to identify different types of waterusers, that is, residential, commercial,and so on. Targeting relevant efficiencyprograms at each category will be muchmore effective than having one genericprogram for all.
Watergy. Energy used in water systems.
Watergy efficiency. Optimizing energy useto cost effectively meet water needs.
Glossary
129

Alliance to Save Energy. 2000. “TheImpacts of Declining Water Tables inAhmedabad.” Unpublished report pre-pared with assistance from theAhmedabad Energy Corporation.Washington, D.C.
American Gas Association. 2000. “GainingControl Over Energy Costs.” NaturalGas Applications in Industry Vol. 13,Issue 4 (Winter). Washington, D.C.
Arora, H. and M. LeChevallier. 1998.“Energy Management Opportunities.”AWWA Journal (February).
Björlenius, Berndt. 2001. “Local SewageTreatment Plant for Hammarby Sjöstad,Phase 1 Outline.” City of Stockholm,Sweden. November.
Brown, Michael. 1999. “A ManagementSystem for Energy Proposed.” EnergyManager (July/August).
Casada, Don. 1999. Pumping Systems FieldMonitoring and Application of thePumping System Assessment Tool (OakRidge, TN. U.S. Department of Energy).
CEGESTI, CACIA, and the Government ofCosta Rica. 1995. 50 Sugerencias ParaUna Mejor Eficiencia Ambiental en laIndustria Alimentos. Produced with theassistance of the Embassy of Canada inCosta Rica. San José, Costa Rica.
City of Austin. 2000. “Water andWastewater Treatment Costs and thePotential of Conservation to ReduceThese Costs.” Austin Water Report.Austin, Texas.
City of Stockholm. 2000. “Welcome toHammarby Sjöstad.” Brochure.Hammarby Sjöstad Project, Real Estate,Streets, and Traffic AdministrationStockholm, Sweden. December.
Confederation of Indian Industry (CII).1998. Manual on Energy Efficiency inPumping Systems. Energy ManagementCell. New Delhi, India. September.
Gleick, Peter. 2001. “Making Every DropCount.” Scientific American (February).
Iowa Association of Municipal Utilities(IAMU). 1998. Tap into Savings: How toSave Energy in Water and WastewaterSystems. Ankeny, Iowa. <www.iamu.org/main/energy/water/waterport.htm>(accessed February 2001).
Jordão, E. P. 1995. “Tratamento de EsgotosDomésticos.” Associação Brasileira deEngenharia Sanitária e Ambiental. Riode Janeiro, Brazil.
Klein, Michael and Timothy Irwin.“Regulating Water Companies.” In TheWorld Bank Group, 1999, The PrivateSector in Water, Washington, D.C.
Lau, Peter J. 1997. “Applying DisinfectionAlternatives to Wastewater Treatment.”Pollution Engineering. September 1.<www.pollutionengineering.com/archives/1997/pol0901.97/09akc1f0.htm>.
Loh, David. “Promotion of PublicInformation on Water Conservation inSingapore.” Paper presented at theSeminar on the Promotion of PublicInformation on Water Conservation,organized by ESCAP in Bangkok, May23–25, 2000.
Ng, K. H., C. S. Foo, and Y. K. Chan. 1997.“Unaccounted-For Water: Singapore’sExperience.” Journal of Water SupplyResearch and Technology Vol. 46,Number 5 (October).
131
References

Norland, Doug and Laura Lind. 2000.“Corporate Energy Management: ASurvey of Large ManufacturingCompanies.” 22nd Industrial EnergyTechnology Conference Proceedings.Houston, Texas, April 2000.
North Carolina Department ofEnvironment and Natural Resources.1998. Water Efficiency Manual forCommercial, Industrial, and InstitutionalFacilities. Raleigh, NC. August.
Obmascik, Mark. 1993. “WaterConservation: Dozens of Ways to SaveWater, the Environment, and a Lot ofMoney.” (Denver, Col.: American WaterWorks Association). August.
Oliver, Julia and Cynthia Putnam. 1997.“How to Avoid Taking a Bath on EnergyCosts.” Opflow (May).
Population Action International. 1990.Water Stress Index, 1990: SustainingWater: An Update. Washington D.C.
Postel, Sandra. 2001. “Growing More Foodwith Less Water.” Scientific American(March).
Rached, Eglal, Eva Rathgeber, and David B.Brooks, eds. 1996. “Water Supply andManagement in Rural Ghana.” Chapter12 in International DevelopmentResearch Center. Water Management inAfrica and the Middle East: Challengesand Opportunities. Ottawa, Canada.
Rocky Mountain Institute. 1994. “WaterEfficiency.” Snowmass, CO. November.
Tata Energy Research Institute. 1999.Practical Energy Audit Manual: PumpingSystems. Indo-German Energy EfficiencyProject. Bangalore, India. August.
USAID. 2000a. Energy SavingsOpportunities in Kolhapur City WaterSupply. Prepared by InternationalResource Group and Prima Techno-Commercial Services. Washington, D.C.June.
USAID. 2000b. Water Practices in the HotelIndustry in Barbados. prepared by HaglerBailly Services Inc. Washington, D.C.March.
USAID. 2001. Apaterm Water DistributionSystem, Galati, Romania. EcolinksEnergy Efficiency Project. Prepared byThe Cadmus Group Inc. and Apaterm,SA. Arlington, Virginia.
USAID, Hagler Bailly, and EnvironmentalExport Council. 2000. “Prevencion de lacontaminacion en una fabrica textil delEcuador.” (July 1998). InformationResources on Industrial PollutionPrevention (CD-Rom, Summer).Corporation for Technological andScientific Management for the UrbanEnvironment – OIKOS, Quito, Ecuador.
U.S. Department of Energy (DOE). 1996.“Reducing Power FactorCost.”DOE/GO-10096-286. Washington,D.C.
———. 1999. Improving Pumping SystemPerformance: A Sourcebook for Industry.Office of Industrial Technologies.Washington, D.C. January.
———. 2000. International Energy Annual1999. Energy InformationAdministration.<http://www.eia.doe.gov/pub/international/ieapdf/te_01.pdf>(accessed December 2000). Washington,D.C.
Watergy
132
U.S. Environmental Protection Agency(USEPA). 1998. “Appendix A: WaterConservation Measures.” Guidelines forPreparing Water Conservation Plans.Washington, D.C. August.
Water Environment Federation. 1990.“Operation of Municipal WastewaterMunicipal Plants.” MOP 11.
Wong, A. K., L. Owens-Viani, and P.Gleick., eds. 1999. Sustainable Use ofWater: California Success Stories(Oakland, CA: Pacific Institute).January.
World Health Organization (WHO). 1989.Health Guidelines for the Use ofWastewater in Agriculture andAquaculture. Geneva, Switzerland.
———. 2000. Global Water Supply andSanitation Assessment 2000 Report.<www.who.int/water_sanitation_health/Globassessment/Global1.htm#1.1/>(accessed December 2001). Geneva,Switzerland.
Xie, Mei, Ulrich Kuffner, and GuyLeMoigne. 1993. Using Water Efficiently:Technological Options. World Bank.Technical Paper Number 205.Washington, D.C.
References
133

Accra (Ghana), 61, 83–84
Ad hoc (management style), 11, 12, 125
Aeration control, 125
Ahmedabad (India), 19, 36, 45, 49, 51, 61,85–86, 131
Air-drying, 125
American Gas Association, 14, 131, 138
American Water Works Association, 27,105, 107, 115, 132
Anaerobic digestion, 125
Aquifers, 125
Aral Sea, 10
Austin (Texas, USA), vii, 15, 30, 41, 54,55, 61, 62–63, 131, 139
Baltic Utilities, 27, 28, 105
Barbados, 49, 132
Baseline(s), 23, 25, 117, 125
Bubble diffusers, 125
Bulawayo (Zimbabwe), vii, 19, 61, 87, 140
Buyback, 63, 125
CAGECE, vii, x, 12, 13, 17, 93, 95
Capacitors, 35, 36, 84, 123, 125, 127
Cary (North Carolina, USA), 104
Centrifuges, 125
Chlorination, 40, 125
Climate change, 125
Cogeneration, 78, 126
Columbus (Georgia, USA), vii, 19, 61,89–90
Comminutors, 126
Computerized control systems, 37, 126,128
Corporate Energy Management Programs(CEMP), 14
Costa Rica, 55, 131
Council of Energy Efficiency Companies(CEEC), 44
Cross-fertilization, 126
Dewatering, 126
Digester gas, 126
Digestion, 126
Disinfection, 39, 126, 131
Ecuador, 54, 132
Efficiency kits, 54, 126
Efficiency manager, 12, 95
Electric Power Research Institute, x, 106
Energy management system, 126
Energy service contracts, 44
Fairfield (Ohio, USA), vii, 43, 61, 91–92
Filter presses, 126
Financial hurdle rate, 126
Fortaleza (Brazil), 1, 8, 17, 27, 61, 93–95
Ghana Water and Sewerage Corporation,57
Grit removal, 126
Horizontal axis washing machine, 127
Impeller, 127
Incineration, 39, 127
Indore (India), vii, 1, 7, 12, 20, 21, 61,96–97
Infiltration, 127
Johannesburg (South Africa), 61, 76, 77
Kolhapur (India), 37, 132
Lake Baiyangdian (China), 49
135
Index of Major Terms

Leak reduction, 30
Load profile, 127
Lviv (Ukraine), vii, 61, 98–99
Medellín (Columbia), vii, 61, 73
Methane, 127
Metrics, 25, 127
NAESCO, x, 44
Namibia, 41
Organochlorine, 127
Outsourcing, 19, 127
Overdesign, 34, 127
Overharvesting (water), 127
Oxidation ditch, 39, 128
Ozonation, 40, 128
Payback, 43, 128
Pilot projects, 42, 71, 128
Pipe relining, 128
Pollution, 70, 90, 103, 113, 131, 132
Portable instrumentation, 24
Pressure gauges, 128
Price structure, 128
Programmable logic controls, 128
Pump efficiency, 128
Pune (India), vii, x, 1, 21, 37, 61, 100–101
Real-time rate pricing, 128
Recalibration, 128
Reclaimed water use, 128
Return on investment, 128
Reuse (wastewater), 3, 41, 55
San Diego (California, USA), vii, 61, 78,79, 139
Secondary treatment, 38, 128
Singapore, vii, 53, 61, 80, 81, 131, 139
Sludge treatment, 128
Stabilization, 128
Stockholm (Sweden), vii, 1, 61, 65–67,131, 139
Sydney (Australia), vii, 1, 25, 47, 61,67–69, 139
Technical tools, 26
Texas (USA), 6, 30, 41, 54, 55, 64, 113,131, 132, 138
Toronto (Canada), vii, 1, 8, 19, 48, 49, 54,61, 70–72, 138
Trickling filters, 129
Trihalomethanes, 129
Ultraviolet disinfection, 129
Ultraviolet irradiation, 129
Unaccounted-for water, 28, 30, 80, 129,131
Vacuum filter, 129
Variable frequency drive, 129
Water accounting, 31, 129
Water audits, 53, 54, 68, 81, 129
Water losses, 7
Water subsidy, 129
Water Wise, 76, 77, 105, 112
WaterPlan21, 139
Works Best Practices Program 70, 71
World Bank, 27, 31, 98, 103, 105, 112,131, 133, 138
Watergy
136

1 Based on the following data and assump-tions:
1. 1000 cubic miles (or 4.2 quadrillionliters) of total annual world consumption(Gleick 2001).
2. 6 kWh per 10,000 liters of water pumped(estimated by Alliance to Save Energy).
3. An estimated 30 percent of water is usedby urban areas (Postel 2001).
4. 381.9 Quads total annual world energyconsumption (DOE 2000).
5. [(4.2 quadrillion liters�.0006kWh/liter)�10600 Btus/kWh]�26.7Quads and 26.7 Quads/381.9Quads�7%.
2 CII 1998. In addition the Alliance toSave Energy estimated a 30 percent savingspotential for municipal water utilities, basedon average unaccounted-for water levels,estimates of pump efficiency improvementopportunities, and other demand-sidereduction technology.3 Based on the following data and assump-tions:
1. An estimated 30 percent of water is usedby urban areas (Postel 2001).
2. 30 percent savings potential for munici-pal water utilities (estimated by theAlliance to Save Energy, based on aver-age unaccounted-for water levels, esti-mates of pump efficiency improvementopportunities, and other demand-sidereduction technology).
3. Thailand 2.47 Quads in 1999 (DOE2000).
4 United Nations (UN), “WorldUrbanization Prospects: The 1999Revision,” <http://www.un.org/esa/population/publications/wup1999/urbanization.pdf> (accessed on January2002).5 Based on the following data and assump-tions:
1. 1000 cubic miles of total world consump-tion (Gleick 2001).
2. 6 kWh per 10,000 liters of water pumped(estimated by Alliance to Save Energy).
3. Japan 21.71 Quads and Taiwan 3.25Quads in 1999 (DOE 2000).
6 Oliver and Putnam 1997. 7 Based on an analysis done by Laura Lindof the Alliance to Save Energy, using Model
Energy Code Links (MECS), 1991. See alsoArora and LeChevallier 1998.8 “Section 2: The Water Crisis: Where WeAre Today and How We Got There,”(<watervision.cdinet.com/pdfs/commission/cchpt2.pdf>), “Human Appropriation ofthe World’s Fresh Water Supply,”(<www.sprl.umich.edu/GCL/Notes-1999-Winter/freshwater.html>) in report by theWorld Commission on Water, <watervision.cdinet.com/commreport.htm> (accessedDecember 2001).9 WRI, “Table FW.1,” <www.wri.org/wr-00-01/pdf/fw1n_2000.pdf> (accessedDecember 2001).10 Population Action International 1990.11 UN Habitat, “Global Urban Indicators,”<http://www.unchs.org/guo/gui/index.html>(accessed January 2002). An average of theover 230 cities documented in this study.12 WHO, “Global Water Supply,” Section5.2. <www.who.int/water_sanitation_health/Globassessment/Global5-2.htm> (accessedDecember 2001).13 World Health Organization (WHO),“Global Water Supply and SanitationAssessment 2000 Report,”<www.who.int/water_sanitation_health/Globassessment/Global1.htm#1.1>(accessed December 2001).14 Klein and Irwin 1999.15 US Department of Energy, InternationalTotal Primary Energy Consumption(Demand) Forecasts <http://www.eia.doe.gov/oiaf/ieo/pdf/append_a.pdf> (accessedJanuary 2002)16 Mukami Kariuki, “WSS Services for theUrban Poor,” <www.wsscc.org/vision21/docs/doc16.html> (accessed December2001).17 Based on an analysis done by Laura Lindof the Alliance to Save Energy, using ModelEnergy Code Links (MECS), 1991. See alsoArora and LeChevallier 1998.18 WRI, October 27, 2000, “Water Quantity,Conditions, and Trends” and “Water:Critical Shortages Ahead?” <www.wri.org/trends/water.html> (accessed December2001).
137
Endnotes

19 WRI, “Freshwater Systems, WaterQuantity,” <www.wri.org/trends/water.html> (accessed December 2001).20 Based on the following data and assump-tions:
4. An estimated 30 percent of water is usedby urban areas (Postel 2001).
5. 30 percent savings potential for munici-pal water utilities (estimated by theAlliance to Save Energy, based on aver-age unaccounted-for water levels, esti-mates of pump efficiency improvementopportunities, and other demand-sidereduction technology).
6. Thailand 2.47 Quads in 1999 (DOE2000).
21 Water Supply and Sanitation Collabora-tive Council, “Water Demand Managementand Conservation,” <www.wsscc.org/activities/vision21/docs/doc26.html> and<www.who.int/water_sanitation_health/wss/sustoptim.html> (accessed December2001).22 WRI, “Table FW.1, <www.wri.org/wr-00-01/pdf/fw1n_2000.pdf> (accessedDecember 2001).23 Population Action International 1990.24 Kariuki, “WSS Services,”<www.wsscc.org/vision21/docs/doc16.html>(accessed December 2001).25 CII 1998. 26 UNICEF,<www.unicef.org/pon97/water4.htm>(accessed December 2001).27 United States Department of Energy,“Tomorrow’s Energy Today for Cities andCounties,” <www.eren.doe.gov/cities_counties/watersy.html> (accessedDecember 2001).28 Personal communications with Mr. JoeBoccia, Mr. Roman Kaszczij, and Ms. TracyKorovesi of the Toronto Water Utility.29 United States Department of Energy,<www.eren.doe.gov/cities_counties/watersy.html> (accessed December 2001).30 Based on an analysis done by theAlliance to Save Energy in conjunctionwith the Indore Municipal Corporation’sEnergy Management Cell.31 Norland Lind 2000, pp. 220–27.
32 American Gas Association, 2000, pp.A10–A11.33 Brown 1999.34 Norland and Lind 2000, pp. 220–27.35 Tata Energy Research Institute 1999.36 IAMU 1998. 37 Tata Energy Research Institute 1999. 38 Casada 1999.39 Casada 1999.40 CII 1998. 41 Tata Energy Research Institute 1999.42 Personal communication withAmarquaye Armar, Principal EnergySpecialist, World Bank, February 26, 2001.43 Helsinki University of Technology, WaterUtility Benchmarking, <www.water.hut.fi/BUBI/> (accessed December 2001).44 USEPA 1998.45 IAMU 1998.46 USEPA 1998.47 Xie, Kuffner, and LeMoigne 1993, p.25.48 Adapted from Xie, Kuffner, andLeMoigne 1993.49 IAMU 1998. 50 USEPA 1998.51 Xie, Kuffner, and LeMoigne 1993, p.19.52 Texas Water Development Board,August 1999, “A Guidebook forReducing Unaccounted-for Water,”<www.twdb.state.tx.us/assistance/conservation/guidebook.htm> (accessedDecember 2001).53 USAID 2001.54 CII 1998, pp.55–58. 55 CII 1998, pp. 56–57.56 CII 1998, pp. 57 and 99. 57 DOE 1999, pp.1–8.58 DOE 1999, pp. F10–3.59 CII 1998. 60 DOE 1999, pp.1–7.61 DOE 1996.62 DOE 1999.63 USAID 2000a.64 IAMU 1998. 65 Water Environment Federation 1990.66 IAMU 1998.
Watergy
138

67 IAMU 1998.68 IAMU 1998.69 Jord ~ao 1995.70 Lau 1997, <www.pollutionengineering.com/archives/1997/pol0901.97/09akc1f0.htm> (accessed December 2001). 71 Soroushian, Fred, senior project managerand technology lead for UV disinfection atCH2MHill, e-mail: [email protected] IAMU 1998.73 IAMU 1998. 74 Xie, Kuffner, and LeMoigne 1993), p.25.75 Gleick 2001. 76 WHO 1989.77 National Association of EnergyService Companies, “Trade Missions toMexico, Japan/Thailand, and Brazil,”<www.naesco.org> (accessed December2001).78 Alliance to Save Energy 2000.79 Sydney Water, 2000, “Using Water:Encouraging Efficient Use of Water by theCommunity,” <www.sydneywater.com.au/html/AER2000> (accessed December2001).80 Gleick 2001.81 Reuters, “Major Chinese LakeDisappearing in Water Crisis,”<asia.cnn.com/2000/NATURE/12/20/china.lake.reut/>. Posted: 2:33 PM EST(1933 GMT) December 20, 2000.82 Alliance to Save Energy 2000.83 USAID 2000b.84 Obmascik 1993.85 Rocky Mountain Institute 1994.86 Obmascik 1993, table 4–2.87 Obmascik 1993, table 4–3.88 Singapore Public Utility Board Website,<www.pub.gov.sg/ce.html> (accessedDecember 2001).89 Rand Water Homepage,<www.waterwise.co.za>. 90 USAID, Hagler Bailly, and EnvironmentalExport Council 2000.91 North Carolina Department ofEnvironment and Natural Resources 1998,120 pp. 92 CEGESTI, CACIA, and the Governmentof Costa Rica 1995.
93 North Carolina Department ofEnvironment and Natural Resources 1998. 94 Wong, Owens-Viani, and Gleick 1999.95 Rached, Rathgeber, and Brooks 1996.96 Kariuki, “WSS Services,”<www.wsscc.org/vision21/docs/doc16.html>(accessed December 2001).97 WHO, “Global Water Supply,”<www.who.int/water_sanitation_health/Globassessment/Global3.4.htm.>98 Water Supply and SanitationCollaborative Council, “Water DemandManagement and Conservation,”<www.wsscc.org/activities/vision21/docs/doc26.html> and <www.who.int/water_sanitation_health/wss/sustoptim.html> (accessed December 2001).99 City of Austin 2000.100City of Stockholm 2000.101City of Stockholm 2000.102Björlenius 2001.103Personal communication with BerndtBjörlenius, project leader for the LocalSewage Treatment Plant for HammarbySjöstad, July 2001.104Sydney Water Corporation, WaterPlan21,(<www.sydneywater.com.au/html/Environment/waterplan21.cfm>) and2000–05 Environmental Plan(<http://www.sydneywater.com.au/html/Environment/enviro_plan_2000.cfm>)(both accessed January 2002).105Sydney Water Corporation, Sydney WaterAnnual Report 2001(<www.sydneywater.com.au/html/about_us/report_2001/index.html>) and SydneyWater Towards Sustainability (<www.sydneywater.com.au/html/tsr/about/about.html >) (both accessed January 2002).106Personal communication with JuanCarlos Herrera Arciniegas, EEPPMplanning specialist, March 2001.107Rand Water Homepage, <www.waterwise.co.za> (accessed December 2001).108City of San Diego Website, October2001, “News,” <www.sannet.gov/mwwd/news/index.shtml> (accessed December2001).109Ng, Foo, and Chan 1997.110Ng, Foo, and Chan 1997.
Endnotes
139

Watergy
140
111Loh 2000.112As seen on the Singapore Public UtilityBoard Web page (<www.pub.gov.sg/ce.html>) on May 2001.113Alliance to Save Energy 2000.114Personal communication with JeffBroome, Project Coordinator of theBulawayo Water Conservation and SectorServices Upgrading Project, February 2001.

Alliance to Save Energy1200 18th Street, NW • Washington, DC 20036
(202) 857-0666 • fax: (202) 331-9588 email: [email protected] • Website: www.ase.org


![Case Compendium Update 3 - Sentencing Council€¦ · Guideline Judgments Case Compendium – Update 3: April 2007 Imprisonment for public protection R v Johnson and others [2006]](https://static.fdocuments.us/doc/165x107/5f05f8237e708231d415a25c/case-compendium-update-3-sentencing-council-guideline-judgments-case-compendium.jpg)