Waterbirds in the UK 2019/20 - BTO
40
1 in association with Waterbirds in the UK 2019/20 The annual report of the Wetland Bird Survey
Transcript of Waterbirds in the UK 2019/20 - BTO

1
in associationwith
Waterbirds in the UK 2019/20
The annual report of the Wetland Bird Survey
2
WATERBIRDS IN THE UK 2019/20The Wetland Bird Survey (WeBS) is the principal scheme for monitoring the UK’s wintering waterbird populations, providing an important indicator of their status and the health of wetlands.Waterbirds in the UK 2019/20 is the 39th WeBS annual report and comprises this summary report and data at: www.bto.org/webs-reporting
British Trust for Ornithology The Nunnery Thetford Norfolk IP24 2PU www.bto.org
Joint Nature Conservation Committee Monkstone House City Road Peterborough PE1 1JY www.jncc.gov.uk
Royal Society for the Protection of Birds The Lodge Sandy Bedfordshire SG19 2DL www.rspb.org.uk
The painting of the Scaup used on the cover of
this report is by Kirsty Yeomans (Crow Artist). For
more of Kirsty's work, see https://crowartist.co.uk.
All other artists and photographers are
acknowledged on the pages of this report.
THE WeBS PARTNERSHIPThe Wetland Bird Survey (WeBS) is a partnership jointly funded by BTO, RSPB and JNCC, in association with WWT, with fieldwork conducted by volunteers.
The permanent members of the WeBS Steering Committee in 2019/20 were Teresa Frost (BTO), Dawn Balmer (BTO), James Pearce-Higgins (BTO), Anna Robinson (JNCC), Kirsi Peck (JNCC), Simon Wotton (RSPB), Richard Hearn (WWT), Colette Hall (WWT) and Eileen Rees (WWT).
THE WeBS TEAM AT BTOTeresa Frost – WeBS ManagerGillian Birtles – Counter Network OrganiserNeil Calbrade – WeBS OfficerGraham Austin – Database ManagerSteve Pritchard – Database DeveloperMatthew Baxter – Web Software DeveloperMark Hammond – Web Software DeveloperDawn Balmer – Head of Surveys Email: [email protected]
General enquiries to WeBS: WeBS, BTO, The Nunnery, Thetford, Norfolk IP24 2PUEmail: [email protected] Tel: 01842 750050
WeBS website: www.bto.org/webs
Other contacts:Goose & Swan Monitoring Programme (GSMP) – organised and funded by WWT, JNCC and NatureScot. Email: [email protected]
Other national waterbird surveys – details of (and contacts for) other waterbird surveys can be obtained via the websites of the WeBS partner organisations.
invaluable help in 2019/20: GSMP, Deborah
Newman, Jane Herridge, Kirsi Peck, Royal Air
Force Ornithological Society (RAFOS), Shetland
Oil Terminal Environmental Advisory Group
(SOTEAG) and Chris Waltho. Grateful thanks
to all and apologies to anyone who has been
inadvertently missed.
Report content and production was by Teresa
Frost, Dawn Balmer, Gillian Birtles and Neil
Calbrade. The article on the Goose and
Swan Monitoring Programme (GSMP) was by
Colette Hall (WWT), Icelandic Greylag Goose
by Kane Brides (WWT), Bewick's Swan was
by Eileen Rees (WWT) and the article on
Taiga Bean Geese was by Angus Maciver and
Brian Minshull (Bean Goose Action Group).
ACKNOWLEDGEMENTS
We are indebted to the time and skills of the
thousands of WeBS Counters who collected the
data used in this report and to the invaluable
efforts of the WeBS Local Organisers who are
listed on the back cover.
The WeBS Local Organiser Advisory Committee
(LOAC) (members listed on page 39) provided
advice on behalf of Counters and Local
Organisers. The BTO Information Systems team
delivered essential technical assistance and
continues to develop and provide assistance for
WeBS Online and WeBS Report Online.
We are also grateful to the following for
providing supplementary information, data
inputting, proof-reading and particularly
Wildfowl & Wetlands TrustSlimbridge Slimbridge Gloucestershire Gloucestershire GL2 7BT GL2 7BT www.wwt.org.uk
Waterbirds in the UK 2019/20
Maps in this report contain Ordnance Survey data © Crown Copyright and database right 2021.This report was printed by Swallowtail Print, Norwich.

3
Waterbird Headlines.................... 4Species in the news in 2019/20.
The WeBS Year .............................5Coverage and weather in 2019/20.
Population Trends..................... 10National trends for waterbirds wintering in the UK in 2019/20.
Country Trends..........................12Country trends for waterbirds wintering in the UK in 2019/20.
Principal Sites..............................14Sites with the largest aggregations of wintering waterbirds.
Goose & Swan Monitoring Programme................................ 16An overview of goose and swan monitoring in the UK.
CONTENTS...
Drones and Waterbirds..............24Impacts of drones on waterbirds.
Climate Impacts.........................25How international protected area networks can advance range shifts of wintering waterbirds.
NEWS.........................................26Analysing densities of waders during NEWS III.
Species Focus – Scaup..................28A detailed look at Scaup in the UK.
Species Focus – Spoonbill...........30A detailed look at Spoonbill in the UK.
Species Focus – Lesser Black-backed Gull..................................32A detailed look at Lesser Black-backed Gull in the UK.
Species Focus – Jack Snipe.........33A detailed look at Jack Snipe in the UK.
Low Tide Counts........................34A summary of Low Tide Counts on the Ythan Estuary in 2019/20.
WeBS Objectives, Aims and Methods .................................... 36
WeBS Report Online .................37An overview of the online WeBS reporting interface.
Uses of WeBS Data.....................38Review of how WeBS data were utilised in 2019/20.
WeBS Local Organisers..............39A list of WeBS Local Organisers and members of the WeBS LOAC.
Special Thanks ...........back cover
p.16 p.20p.10
Online Resources
More information, including site tables and trends for all regular WeBS species, is available online at: www.bto.org/webs-reporting This summary report can be downloaded from the WeBS website at: www.bto.org/webs-publications
The online and summary outputs in conjunction constitute the report Waterbirds in the UK 2019/20.
p.30
KNO
T BY
DAV
E KI
NG
; PIN
K-FO
OTE
D G
OO
SE B
Y TO
M C
ADW
ALLE
ND
ER/B
TO; B
EWIC
K'S
SWAN
BY
CH
RIS
KNIG
HTS
/BTO
AN
D S
POO
NBI
LL B
Y ED
MU
ND
FEL
LOW
ES/B
TOWaterbirds in the UK 2019/20
CITATIONFrost, T.M., Calbrade, N.A., Birtles, G.A., Hall, C., Robinson, A.E., Wotton, S.R., Balmer, D.E. & Austin, G.E. 2021. Waterbirds in the UK 2019/20: The Wetland Bird Survey. BTO, RSPB and JNCC, in association with WWT. British Trust for Ornithology, Thetford.
Published by the British Trust for Ornithology, Royal Society Published by the British Trust for Ornithology, Royal Society for the Protection of Birds and Joint Nature Conservation for the Protection of Birds and Joint Nature Conservation Committee, in association with Wildfowl & Wetlands Trust,Committee, in association with Wildfowl & Wetlands Trust, April 2021.April 2021.
© British Trust for Ornithology, Royal Society for the Protection of © British Trust for Ornithology, Royal Society for the Protection of Birds and Joint Nature Conservation Committee, in association Birds and Joint Nature Conservation Committee, in association with Wildfowl & Wetlands Trust, 2021.with Wildfowl & Wetlands Trust, 2021.
ISBN 978-1-912642-25-0ISSN 1755-6384

4
Waterbird headlines from the WeBS year
Waterbird range shifts have been the subject of much research activity using WeBS data and data from other countries in recent years. One such study looked at Scaup and found that far fewer are now wintering in the UK due to a range shift; however, the species has declined across northwest Europe, and is threatened by intensive fishing in the Baltic Sea (pages 28–29). Another study found that protected areas helped waterbirds shift their ranges in response to climate change (page 25). Range changes may be one driver affecting wader populations on the non-estuarine coast. A recent paper on the 2015/16 Non-estuarine Waterbird Study (NEWS III) revealed density declines for many species on stretches of the coast where repeat surveys were carried out (pages 26–27).
Just a small selection of notable stories from 2019/20.
Waterbird Headlines
Daytime surveys of waterbodies and coastal sites at high tide that comprise WeBS Core Counts gather excellent monitoring data for many waterbirds. However, the method is less suitable for some species, either due to their cryptic nature or because they feed in terrestrial habitats during the day. Jack Snipe (page 33) is extremely challenging to detect – could new technology help? Gulls, including Lesser Black-backed Gull (page 32) are best surveyed at their roosts; but the Winter Gull Survey (WinGS) has not been carried out recently due to lack of funding. Many goose and swan species are similarly best surveyed at their roosts, the long-standing WWT/JNCC/NatureScot Goose & Swan Monitoring Programme (GSMP) organises tailored surveys for these species (pages 16–23).
LOC
H A
N E
ILEA
N B
Y TO
NI C
ROSS
; BAR
NAC
LE G
EESE
BY
NEI
L C
ALBR
ADE;
PU
RPLE
SAN
DPI
PER
BY S
COTT
MAY
SON
/BTO
The 2019/20 WeBS year was a challenging one, with counting affected by Storm Ciara in February and COVID-19 pandemic restrictions limiting surveying from March. Despite these challenges in the latter half of the WeBS year, a record number of count sectors and sites were covered at least once during the year by dedicated WeBS volunteers, with 5,287 sectors covered at least once, and over 4,000 were counted in each of the mid-winter months of November, December and January. Low Tide Counts were carried out on 18 estuaries, including the Ythan Estuary (pages 34–35). Many migratory species were present in low numbers, especially those wildfowl species that could take advantage of a record warm winter for Europe and mild temperatures in the Baltic Sea (page 8) to avoid a longer migration to the UK.
See all the numbers and trends at: www.bto.org/webs-reporting
3,450registered WeBS volunteers

5The WeBS Year
The status of some of the UK’s native goose populations are reported through the WWT/JNCC/NatureScot Goose & Swan Monitoring Programme (GSMP) (see article on pages 16–17).
Counts of Taiga Bean Goose are provided by the Bean Goose Action Group (Slamannan Plateau) and RSPB (Middle Yare Marshes). The Icelandic-breeding Goose Census,
Goose Censuses
organised by WWT, covers Pink-footed and Icelandic Greylag Goose. Counts of British Greylag are carried out at a few key sites in Scotland by NatureScot, RSPB and local management groups.
A census of the Greenland White-fronted Goose population is organised by the Greenland White-fronted Goose Study. Greenland Barnacle Goose are counted at
Core Counts were carried out at 5,287 WeBS sectors (countunits) at 2,946 sites from July 2019 to June 2020.
Not all Core Counts are linked to individual Counters in the WeBS Online database, but some are; 2,358 Counters named as the lead counter were associated with WeBS Core Count visits made in 2019/20. Including additional team members, the number of registered WeBS volunteers was 3,450.
There were 34,988 count visits, 79% in the core September–March period (green bars on lower graph). The number of visits was lower than usual due to Storm Ciara in February (see page 8) and due to COVID-19 pandemic restrictions from April to June.
WeBS Core Counts 2019/20 – in numbers
201620061996198619761966
5,000
4,000
3,000
2,000
1,000
0
Number of WeBS count sectors (green squares) and sites (gold circles) covered annually 1966/67–2019/20.
Number of WeBS Core Count visits in 2019/20 by month during the core winter period (green bars) and the rest of the year (gold bars).
key locations in Scotland by NatureScot, RSPB and volunteers, and a census of the Svalbard Barnacle Goose population is organised by WWT.
Results from goose surveys are described in more detail on the GSMP website at: https://monitoring.wwt.org.uk/our-work/goose-swan-monitoring-programme/species-accounts
4,000
3,000
2,000
1,000
0AprMarFebJanDecNovOctSepAugJul May Jun
Core Count dates in 2019/20
2019 20207 July 12 January4 August 9 February15 September 8 March13 October 12 April17 November 10 May15 December 7 June
WeBS launch
WeBS Onlinelaunch

6
WeBS coverage in 2019/20Counts were carried out at 2,946 wetlands in 2019/20.
Areas shown in black were counted at least once by WeBS Core Counts – providing a picture of the excellent geographical coverage achieved.
For sites
covered by I-WeBSinIreland, please see
the I-WeBS pages at
birdwatchireland.ie
The WeBS Year

7
UK Low Tide Counts 2019/20Seventeen UK estuaries were counted at low tide, generating important data about feeding areas.
The WeBS Low Tide Count scheme facilitates the collection of information about use of the UK’s estuaries by waterbirds at low tide. The scheme has flourished since its inception in the winter of 1992/93, with all the major estuaries in the UK having been counted at least once since then. The scheme aims to monitor, assess and regularly update information on the relative importance of intertidal feeding areas of UK estuaries for wintering waterbirds, and in doing so complements information gathered on populations through the WeBS Core Counts.
Information collected at low tide represents an important contribution to the conservation of waterbirds, by providing supporting information for the management of UK Ramsar Sites and Special Protection Areas (SPAs), other site designations, and whole estuary conservation plans. Numbers of waterbirds present in predefined sectors are counted. Most individual estuaries are counted at low tide once every six years, although on some sites more frequent counts are undertaken.
Further information about WeBS Low Tide Counts is available online via www.bto.org/websreporting-lowtide including data summaries and dot density distribution maps for different estuaries and species. Dot density maps are now available for all species and years, including the facility to show any combination of site, species and year side by side for comparison. Presentation of WeBS low tide information typically takes two forms: (i) tabulated statistics of peak numbers and mean densities, and (ii) dot density maps to give a visual representation of species’ foraging densities across a site. Dots do not represent the precise positions of
The WeBS Year
!
!
!
!
!
!
! !
!
!!
! !!
!
! !
!
1
2
4
3
5
67
89
10
11
12
1314
1516
17
Estuaries counted as part of the WeBS Low Tide Count scheme in 2019/20.
1 – Ythan Estuary 2 – Breydon Water 3 – Deben Estuary 4 – Adur Estuary 5 – Southampton Water (partial) 6 – Poole Harbour 7 – Kingsbridge Estuary 8 – Tamar Complex 9 – Fowey Estuary10 – Helford Estuary11 – Hayle Estuary12 – Taw-Torridge Estuary13 – Severn Estuary (partial)14 – Swansea Bay15 – Solway Estuary16 – Auchencairn Bay17 – Strangford Lough18 – Belfast Lough
birds; they are assigned to habitat components proportionally and placed randomly within those areas. No information about distribution of birds at a finer scale than the count sector level should be inferred. For all maps on the online reporting interface, one dot is equivalent to one bird.
During 2019/20, complete WeBS Low Tide Counts were
carried out at 16 estuaries, and on selected sectors on a further two estuaries. On several sites – Poole Harbour, Kingsbridge Estuary, Tamar Complex and Helford Estuary – Core Counts are carried out annually at low tide and data feed into both schemes, allowing assessment of distributional changes. Results from the counts on the Ythan Estuary are presented on pages 34–35 of this report.
18

8
2019/20: Warm winter and a stormy February
The WeBS Year
SOURCES
Climate summaries from: metoffice.gov.uk anden.ilmatieteenlaitos.fi
Hydrological summaries from: nrfa.ceh.ac.uk
Arctic breeding from: www.arcticbirds.net
Weather and migration context for 2019/20.
Average WeBS sector ice cover for 2015/16–2019/20, as reported by Counters for the months November –March.
WeBS sites counted between 14 and 20 November 2019 with recorded ice cover of 5% or more.
July and August 2019 saw above average temperatures and rainfall. The autumn weather was unsettled with slightly below average temperatures.
The winter was milder than average with very few cold periods. This was reflected in ice cover reported by WeBS Counters, with no months seeing significant ice reported. The highest proportion was, unusually, around the Core Count on 17 November, at a national average of 3.3%. The majority of sites affected were in central Scotland.
Rainfall totals were average from November to January, but it was the wettest February for at least 150 years. There were three named storms in February, with Storm Ciara coinciding with the Core Count on the 9 February. Only a third of the normal number of visits were able to be made on the Sunday, with another third moved to a day earlier and the remaining third missed. Winter river flows were normal or higher than normal across the whole country. The unsettled weather continued to mid-March but was followed by a dry, settled warm and sunny spring.
Winter temperatures were much milder than normal in the Baltic, and for Europe as a whole the winter was the warmest on record. This could be contributing to lower populations in winter of species such as Coot, Smew and Gadwall. The 2019 arctic breeding season was reported to be average or good at most research stations.
Nov Dec Jan Feb Mar
Aver
age
repo
rted
ice
cove
r (%
)
0
5
10
15
2018/192015/16 2016/17 2017/18 2019/20
20
N D J F M N D J F M N D J F M N D J F M N D J F M
9
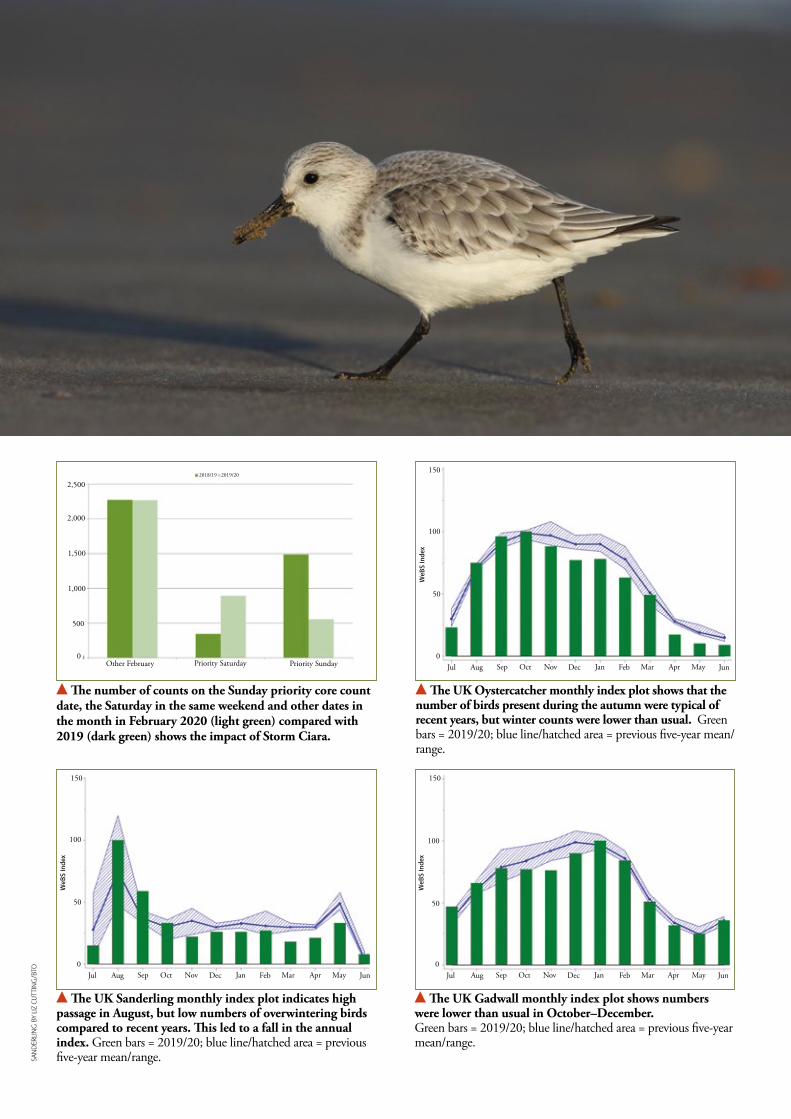
The UK Oystercatcher monthly index plot shows that the number of birds present during the autumn were typical of recent years, but winter counts were lower than usual. Green bars = 2019/20; blue line/hatched area = previous five-year mean/range.
Jul Aug Sep Oct Nov Dec Jan Feb Mar Apr May Jun
50
0
100
150
WeB
S In
dex
SAN
DER
LIN
G B
Y LI
Z CU
TTIN
G/B
TO
The UK Gadwall monthly index plot shows numbers were lower than usual in October–December. Green bars = 2019/20; blue line/hatched area = previous five-year mean/range.
Jul Aug Sep Oct Nov Dec Jan Feb Mar Apr May Jun
50
0
100
150
WeB
S In
dex
The UK Sanderling monthly index plot indicates high passage in August, but low numbers of overwintering birds compared to recent years. This led to a fall in the annual index. Green bars = 2019/20; blue line/hatched area = previous five-year mean/range.
Jul Aug Sep Oct Nov Dec Jan Feb Mar Apr May Jun
50
0
100
150
WeB
S In
dex
The number of counts on the Sunday priority core count date, the Saturday in the same weekend and other dates in the month in February 2020 (light green) compared with 2019 (dark green) shows the impact of Storm Ciara.
Other February Priority Saturday Priority Sunday
500
0
1,000
2,500
2,000
1,500
2018/19 2019/20
10
National trends
Indices and smoothed indices are plotted in the WeBS Report Online for all waterbird species with sufficient data for the UK, Great Britain, Wales, Scotland, England and Northern Ireland. Annual species indices, smoothed indices, and 25- and 10- year trends are available under an Open Government Licence from www.bto.org/webs-annual-report as a spreadsheet download. Table 1 contains 25- and 10-year trends for the most abundant waterbird species for the UK and Table 2 contains the equivalent trends for Scotland, Northern Ireland, England and Wales. For further detail, please refer to the WeBS Report Online and spreadsheet download.
For the first time, 25-year trends are given for Egyptian Goose (+818%), Mandarin Duck (+336%) and Little Egret (+1400%).
GEESE & SWANS Bewick’s Swan (see pages 20–21), Taiga Bean Goose (see pages 22–23) and Icelandic Greylag Goose (see pages 18–19) all declined year-on-year as well as having 10-year and 25-year declining trends. European White-fronted Goose numbers were slightly up on the previous year but have declined by 70% since 1993/94.
Resident geese continue to do well with Canada Goose, Naturalised Barnacle Goose, British/Irish Greylag Goose and Egyptian Goose all stable or increasing. DUCKS Species that migrate from the east, including Mallard, Teal, Pochard, Goosander and Scaup (see pages 28–29), were down compared with the previous winter, likely related to the exceptionally mild weather across Europe (see page 8). Eider (excluding Shetland birds) and Mallard both had their lowest ever indices, and Scaup (10-year trend -60%) and Red-breasted Merganser (10-year trend -23%) their lowest index values since the 1980s.
WADERS Many of the common wintering wader species are declining, with only Avocet, Black-tailed Godwit and Sanderling having long-term increases. The latest index values were lower than 2018/19 for declining species Oystercatcher (lowest index value except first year of series), Lapwing, Grey Plover, Bar-tailed Godwit (record low), Dunlin (record low), Purple Sandpiper (record low) and Redshank. Sanderling had a notably low index value after two years of high numbers.
Golden Plover, Ringed Plover, Curlew, Turnstone and Knot all saw higher numbers present during winter than the previous year, notwithstanding negative 10-year and 25-year trends. Knot counts were particularly noteworthy compared with the trend, with the highest index value since 2000/01 and the monthly index being higher than the previous five-year mean in every winter month except March.
GULLS 10-year and 25-year trends were negative for Black-headed Gull, Great Black-backed Gull, Lesser Black-backed Gull (see page 32) and Common Gull. Herring Gull is stable, with a 10-year trend of +1%.
Caution is advised when interpreting gull results as WeBS Core Count methodology is not ideal for this group so trends, whilst available online, are not included in Table 1.
OTHER WATERBIRDSDeclines continued for Moorhen (10-year trend -26%) and Coot (10-year trend -24%) which both saw record low index values. Most grebe and diver species have negative 10-year trends and had index values for 2019/20 lower than 2018/19 with the exceptions of Great Northern Diver (10-year trend +32%) which had a similar index to the previous year, and Red-throated Diver (10-year trend -24% and Red-necked Grebe (10-year trend -18%) which were slightly up on 2018/19. Uncertainty due to low numbers and incomplete coverage means most of these species are not included in Table 1.
There were record index values for Spoonbill (see pages 30–31) as well as Cattle Egret and Great White Egret both of which continue year-on-year increases; more Cattle Egrets were observed on WeBS counts than Great White Egret for the first time. Little Egret populations appear to be stabilising in Wales and England, but are increasing rapidly in Scotland and Northern Ireland (see page 13).
A concise summary of how the UK’s most familiar waterbirds fared in 2019/20.
Population Trends
GRE
AT C
REST
ED G
REBE
BY
NEI
L C
ALBR
ADE
For all trend graphs see the online report:
www.bto.org/webs-reporting

11
Great Crested Grebe down 14% since 2008/09.
Trends are % changes of smoothed population index values for the most abundant waterbirds in the UK. *Eider trends exclude birds on Shetland (of faeroeensis race).
The longer term smoothed trend refers to the 25-year period 1993/94 to 2018/19. The shorter term smoothed trend refers to the 10-year period 2008/09 to 2018/19.Note, it is customary to truncate the final year when reporting smoothed trends, so whilst data from 2018/19 have been used in creating the smoothed index values, the trend period assessed and reported is until 2018/19.
Preceding each species is an indication of flyway population trend, based on: Nagy, S. & Langendoen, T. 2018. Seventh AEWA Report on the Conservation Status of Migratory Waterbirds in the Agreement Area. Wetlands Int., NL. increasing, decreasing, stable, n/a not applicable as population is non-native (Canada Goose, Egyptian Goose, Mandarin) or non-migratory (Mute Swan, British/Irish Greylag Goose, Naturalised Barnacle Goose and Eider*).
Trends use WeBS data except for Pink-footed Goose, Greenland White-fronted Goose, Icelandic Greylag Goose, Greenland Barnacle Goose, Svalbard Barnacle Goose and Canadian Light-bellied Brent Goose, for which dedicated censuses are undertaken (see page 5).
Population Trends
Table 1 Population trends of non-breeding waterbirds in the UK.
Species/population25-year trend
(1993/94–2018/19)
10-year trend
(2008/09– 2018/19)
Species/population25-year trend
(1993/94–2018/19)
10-year trend
(2008/09– 2018/19)
Dark-bellied Brent Goose -23 11 Scaup -47 -60
Svalbard Light-b. Brent Goose 54 -27 n/a Eider* -27 -17
Canadian Light-b. Brent Goose 85 10 Goldeneye -58 -26
n/a Canada Goose 68 14 Goosander -6 14
n/a Naturalised Barnacle Goose 348 81 Red-breasted Merganser -47 -23
Greenland Barnacle Goose 115 23 Little Grebe 71 -3
Svalbard Barnacle Goose 164 32 Great Crested Grebe -8 -14
n/a British/Irish Greylag Goose 165 21 Little Egret 1,400 36
Icelandic Greylag Goose -6 -6 Cormorant 54 30
Pink-footed Goose 111 47 Moorhen n/a -26
Greenland White-fronted Goose -34 -10 Coot -15 -24
European White-fronted Goose -70 -16 Oystercatcher -24 -16
n/a Mute Swan 25 -4 Avocet 255 20
Bewick’s Swan -88 -81 Lapwing -40 -9
Whooper Swan 239 36 Golden Plover -6 -14
n/a Egyptian Goose 818 102 Grey Plover -44 -24
Shelduck -28 -11 Ringed Plover -50 -19
n/a Mandarin 336 45 Curlew -33 -18
Shoveler 62 17 Bar-tailed Godwit -21 -5
Gadwall 120 10 Black-tailed Godwit 188 26
Wigeon -1 -6 Turnstone -42 -21
Mallard -35 -15 Knot -13 -3
Pintail -25 -22 Sanderling 22 -15
Teal 24 7 Dunlin -45 -7
Pochard -69 -39 Purple Sandpiper -52 -16
Tufted Duck -6 -3 Redshank -21 -9

12
Table 2 Population trends of non-breeding waterbirds in the constituent countries.
Scotland Northern Ireland England Wales
Species/population25-year trend
(1993/94–2018/19)
10-year trend
(2008/09– 2018/19)
25-year trend
(1993/94–2018/19)
10-year trend
(2008/09– 2018/19)
25-year trend
(1993/94–2018/19)
10-year trend
(2008/09– 2018/19)
25-year trend
(1993/94–2018/19)
10-year trend
(2008/09– 2018/19)
Dark-bellied Brent Goose -22 11 -70 -58
Svalbard Light-bellied Brent Goose 600 -38 52 -28
Canadian Light-bellied Brent Goose 1,540 165 71 6 16,400 114 2,000 58
Canada Goose 767 100 1 22 48 10 500 23
Naturalised Barnacle Goose 152 -9 293 77 10,700 440
Greenland Barnacle Goose 66 -6
Svalbard Barnacle Goose 164 32
British/Irish Greylag Goose 4,100 50 165 24 126 -13
Icelandic Greylag Goose -7 -6
Pink-footed Goose 92 61 179 3
Greenland White-fronted Goose -32 -7 -48
European White-fronted Goose -70 -15 227 10
Mute Swan 23 8 -24 28 29 -9 126 -12
Bewick’s Swan -100 -100 -88 -81 -90 -93
Whooper Swan 76 24 94 25 429 41 79 -35
Egyptian Goose 818 102
Shelduck 16 10 6 -26 -35 -13 -2 -9
Mandarin 340 43
Shoveler -48 19 -31 10 68 17 51 -19
Gadwall 169 61 -18 55 116 6 514 177
Wigeon -11 2 -37 12 1 -9 36 0
Mallard -45 -15 -17 -6 -34 -16 -29 -10
Pintail 60 36 162 19 -38 -27 9 -50
Teal 54 26 50 20 18 2 26 13
Pochard -79 -63 -75 -28 -63 -37 -78 -63
Tufted Duck -2 4 -71 -1 23 -5 32 11
Scaup -22 -26 -60 -77 -88 -54 -77 65
Eider * -29 -23 179 -6 -48 -3 40 48
Goldeneye -38 4 -89 -71 -38 -22 -43 -18
Goosander -9 41 -10 -1 184 44
Red-breasted Merganser -51 -7 -37 -23 -47 -33 -45 -43
Little Grebe 181 19 20 34 66 -10 80 -5
Great Crested Grebe -38 -17 -51 -48 2 -7 95 -7
Little Egret 4,150 276 1,650 35 5,350 7
Cormorant -25 -2 21 -15 79 41 62 22
Moorhen 4 3 -28 5
Coot -38 6 -27 111 -12 -29 -29 -29
Oystercatcher -37 -16 -21 -26 -24 -13 -13 -21
Avocet 255 20
Lapwing -58 -24 -59 -31 -39 -7 -17 -8
Golden Plover -40 -11 -48 -36 5 -12 -38 -19
Grey Plover -69 -57 -60 -37 -42 -21 -51 -47
Ringed Plover -23 21 -51 -12 -57 -30 -54 -10
Curlew -26 -12 -27 -17 -34 -21 -43 -14
Bar-tailed Godwit -54 -16 27 47 -17 -7 -46 -24
Black-tailed Godwit 693 250 660 153 169 21 188 7
Turnstone -47 -25 -55 -44 -38 -18 -15 35
Knot -32 6 -55 -38 -10 -2 44 -26
Sanderling 261 51 1,569 52 7 -16 -1 -51
Dunlin -37 26 -53 -7 -46 -7 -45 -23
Purple Sandpiper 15 -25 -62 -59 -65 5
Redshank -21 3 -29 -32 -22 -10 6 8
Country Trends
Trends are % changes of smoothed population index values for the most abundant waterbirds in the UK; note these may only be present in small numbers in some countries.*Eider trends exclude birds on Shetland (of faeroeensis race).
The longer term smoothed trend refers to the 25-year period 1993/94 to 2018/19. The shorter term smoothed trend refers to the 10-year period 2008/09 to 2018/19.Note, it is customary to truncate the final year when reporting smoothed trends, so whilst data from 2019/20 have been used in creating the smoothed index values, the trend period assessed and reported is until 2018/19.
Trends use WeBS data except for Pink-footed Goose, Greenland White-fronted Goose, Icelandic Greylag Goose, Greenland Barnacle Goose, Svalbard Barnacle Goose and Canadian Light-bellied Brent Goose, for which dedicated censuses are undertaken (see page 5).

13
WeBS trend for Little Egret in Wales. Green dots = annual index; blue line = smoothed trend.
WeBS trend for Little Egret in Scotland. Green dots = annual index; blue line = smoothed trend.
WeBS trend for Little Egret in Northern Ireland. Green dots = annual index; blue line = smoothed trend.
WeB
S In
dex
20
0
100
94/95 99/00 04/05 09/10 14/15 19/20
40
60
80
WeBS trend for Little Egret in England. Green dots = annual index; blue line = smoothed trend.
Little Egret is becoming regular across the UK, with the index species beginning to increase in the mid 2000s in Northern Ireland and about five years later in Scotland.
LITT
LE E
GRE
T BY
NEI
L C
ALBR
ADE
WeB
S In
dex
20
0
100
94/95 99/00 04/05 09/10 14/15 19/20
40
60
80
WeB
S In
dex
0
150
94/95 99/00 04/05 09/10 14/15 19/20
50
100
WeB
S In
dex
0
150
94/95 99/00 04/05 09/10 14/15 19/20
50
100

14
Largest waterbird aggregationsThe UK’s wetlands support millions of waterbirds each winter.
WeBS site totals indicate which sites support the largest aggregations of waterbirds each year. Understanding precisely how many individual birds use a site is clearly very difficult to ascertain from counts alone, as many sites are used by migrants on passage and consequently there can be high turnover rates.
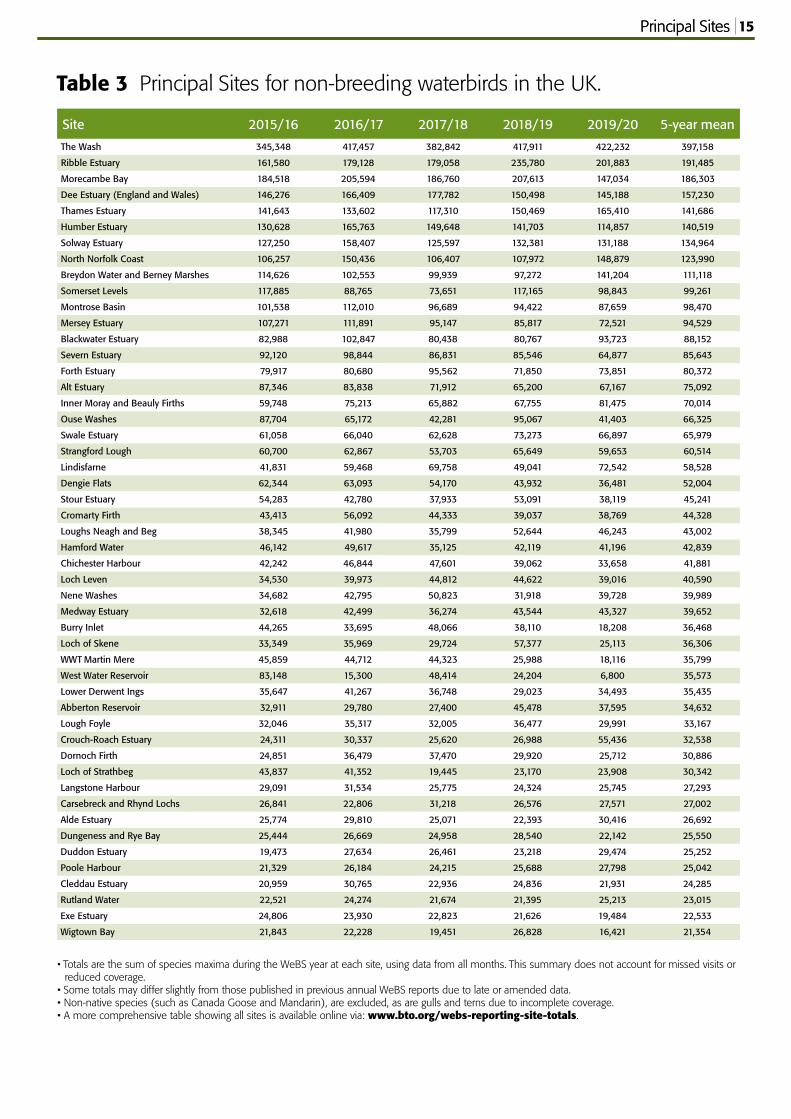
Table 3 lists the Principal Sites for non-breeding waterbirds. The totals are the summed counted maxima for each species during the course of the WeBS year (missing counts are not imputed; supplementary counts are included). Sites with a five-year average of 20,000+ waterbirds are listed. Non-native species (e.g. Canada Goose and Mandarin) have been excluded from the totals. Although an important component of a site’s waterbird fauna, gulls and terns are also excluded, since the recording of them during WeBS Counts is optional.
In addition to Table 3, it is possible to view the totals for all WeBS sites via the WeBS Online Report ‘Site Totals’ tab. In the interactive table of sites, non-native species, gulls and terns and supplementary counts can be included or omitted as desired by the user. By default only the major sites with over 1,000 birds are listed, but the filter can be changed to all sites in a county or country. Selecting a site will show the species for which that site holds more than the national or international importance thresholds.
SITE FOCUSThe number of sites with a five-year average in excess of 100,000 birds fell to nine, two fewer than in 2018/19. Meanwhile, 51 sites had a five-year average in excess of 20,000 birds, which is three fewer than in 2018/19 with the Orwell Estuary, Carmarthen Bay and the Colne Estuary no longer appearing in the table opposite. The Ribble Estuary reclaimed second place in the principal sites table from Morecambe Bay.
Principal Sites
Top – Screenshot of Sites Totals page from the WeBS Online Report.Bottom – Sites with the largest waterbird aggregations in the UK.
12
3
4
5
68
7
9
10
11
12
1314
15
1 – The Wash 2 – Ribble Estuary 3 – Morecambe Bay 4 – Dee Estuary 5 – Thames Estuary 6 – Humber Estuary 7 – Solway Estuary 8 – North Norfolk Coast 9 – Breydon Water & Berney Marshes 10 – Somerset Levels11 – Montrose Basin12 – Mersey Estuary13 – Blackwater Estuary14 – Severn Estuary15 – Forth Estuary16 – Alt Estuary
116
30,000–50,000
50,000–75,000
75,000–100,000
>100,000
20,000–30,000
15
Table 3 Principal Sites for non-breeding waterbirds in the UK.
• Totals are the sum of species maxima during the WeBS year at each site, using data from all months. This summary does not account for missed visits or reduced coverage.
• Some totals may differ slightly from those published in previous annual WeBS reports due to late or amended data. • Non-native species (such as Canada Goose and Mandarin), are excluded, as are gulls and terns due to incomplete coverage.• A more comprehensive table showing all sites is available online via:www.bto.org/webs-reporting-site-totals.
Principal SitesPrincipal Sites
Site 2015/16 2016/17 2017/18 2018/19 2019/20 5-year mean
The Wash 345,348 417,457 382,842 417,911 422,232 397,158
Ribble Estuary 161,580 179,128 179,058 235,780 201,883 191,485
Morecambe Bay 184,518 205,594 186,760 207,613 147,034 186,303
Dee Estuary (England and Wales) 146,276 166,409 177,782 150,498 145,188 157,230
Thames Estuary 141,643 133,602 117,310 150,469 165,410 141,686
Humber Estuary 130,628 165,763 149,648 141,703 114,857 140,519
Solway Estuary 127,250 158,407 125,597 132,381 131,188 134,964
North Norfolk Coast 106,257 150,436 106,407 107,972 148,879 123,990
Breydon Water and Berney Marshes 114,626 102,553 99,939 97,272 141,204 111,118
Somerset Levels 117,885 88,765 73,651 117,165 98,843 99,261
Montrose Basin 101,538 112,010 96,689 94,422 87,659 98,470
Mersey Estuary 107,271 111,891 95,147 85,817 72,521 94,529
Blackwater Estuary 82,988 102,847 80,438 80,767 93,723 88,152
Severn Estuary 92,120 98,844 86,831 85,546 64,877 85,643
Forth Estuary 79,917 80,680 95,562 71,850 73,851 80,372
Alt Estuary 87,346 83,838 71,912 65,200 67,167 75,092
Inner Moray and Beauly Firths 59,748 75,213 65,882 67,755 81,475 70,014
Ouse Washes 87,704 65,172 42,281 95,067 41,403 66,325
Swale Estuary 61,058 66,040 62,628 73,273 66,897 65,979
Strangford Lough 60,700 62,867 53,703 65,649 59,653 60,514
Lindisfarne 41,831 59,468 69,758 49,041 72,542 58,528
Dengie Flats 62,344 63,093 54,170 43,932 36,481 52,004
Stour Estuary 54,283 42,780 37,933 53,091 38,119 45,241
Cromarty Firth 43,413 56,092 44,333 39,037 38,769 44,328
Loughs Neagh and Beg 38,345 41,980 35,799 52,644 46,243 43,002
Hamford Water 46,142 49,617 35,125 42,119 41,196 42,839
Chichester Harbour 42,242 46,844 47,601 39,062 33,658 41,881
Loch Leven 34,530 39,973 44,812 44,622 39,016 40,590
Nene Washes 34,682 42,795 50,823 31,918 39,728 39,989
Medway Estuary 32,618 42,499 36,274 43,544 43,327 39,652
Burry Inlet 44,265 33,695 48,066 38,110 18,208 36,468
Loch of Skene 33,349 35,969 29,724 57,377 25,113 36,306
WWT Martin Mere 45,859 44,712 44,323 25,988 18,116 35,799
West Water Reservoir 83,148 15,300 48,414 24,204 6,800 35,573
Lower Derwent Ings 35,647 41,267 36,748 29,023 34,493 35,435
Abberton Reservoir 32,911 29,780 27,400 45,478 37,595 34,632
Lough Foyle 32,046 35,317 32,005 36,477 29,991 33,167
Crouch-Roach Estuary 24,311 30,337 25,620 26,988 55,436 32,538
Dornoch Firth 24,851 36,479 37,470 29,920 25,712 30,886
Loch of Strathbeg 43,837 41,352 19,445 23,170 23,908 30,342
Langstone Harbour 29,091 31,534 25,775 24,324 25,745 27,293
Carsebreck and Rhynd Lochs 26,841 22,806 31,218 26,576 27,571 27,002
Alde Estuary 25,774 29,810 25,071 22,393 30,416 26,692
Dungeness and Rye Bay 25,444 26,669 24,958 28,540 22,142 25,550
Duddon Estuary 19,473 27,634 26,461 23,218 29,474 25,252
Poole Harbour 21,329 26,184 24,215 25,688 27,798 25,042
Cleddau Estuary 20,959 30,765 22,936 24,836 21,931 24,285
Rutland Water 22,521 24,274 21,674 21,395 25,213 23,015
Exe Estuary 24,806 23,930 22,823 21,626 19,484 22,533
Wigtown Bay 21,843 22,228 19,451 26,828 16,421 21,354

16
Every year, thousands of geese and swans migrate to Britain and Ireland from their arctic breeding grounds to winter in various wetland habitats, such as inland waters, coastal grazing marshes and estuaries, as well as agricultural habitats that are predominately utilized as feeding areas. The countries support eleven native goose and two migratory swan populations, with almost the entire population of eight of these wintering there.
It was recognised during the early decades of wildfowl monitoring that standard daytime counts at wetland sites (like the WeBS counts) only picked up a fraction of the total number of geese and swans present due to birds leaving their roosts early in the day to feed on e.g. farmland: though there are a few exceptions. Hence, separate censuses were gradually developed and in due course the Goose & Swan Monitoring Programme (GSMP) was established (see Table 4).
The GSMP monitors the abundance and breeding success of the UK’s native geese and migratory swans during the non-breeding season. It is a partnership between WWT, JNCC and NatureScot, with the Secretariat currently held at WWT. While WWT coordinates the GSMP, a number of the censuses are run by other organisations, often with separate funding. Although the GSMP is a UK-based programme, through collaboration with colleagues elsewhere in Europe, the programme reports on the status of each population at a flyway scale.
Unlike the WeBS counts, the goose and swan surveys aim to assess the overall size of the wintering populations. The difference in ranges and population sizes necessitates a different census
for each and in some cases an internationally coordinated survey is required to cover the whole population. The varying resources and costs needed to monitor each population also affects how often a complete census can be undertaken.
As well as monitoring abundance, the GSMP also collates data on annual reproductive success. Age assessments are mainly carried out at wintering and autumn stop-over sites and comprise two measures: the proportion of young (first-winter) birds in non-breeding flocks and the average brood size. As the timing of migration and post-juvenile moult differs between species, the time period in which breeding success data can be collected varies between species.
Data from the goose and swan censuses are used for many of the same purposes as WeBS data, such as, conservation and policy (e.g. designation of important sites, meeting commitments of international conventions), UK
indicators and assessments (e.g. APEP population estimates, Birds of Conservation Concern status assessments) and environmental impact assessments (e.g. for developments). Data are also used for other conservation purposes throughout Europe, for example, by the AEWA European Goose Management Platform, which addresses the conservation and management of goose populations in Europe.
In some circumstances, the level of skill needed and the coverage required to monitor a particular goose or swan population means it is necessary to involve trained staff or contract individuals to carry out the fieldwork. However, the vast majority of surveys are carried out by networks of volunteers, without whom many of these surveys would not be possible. For further details see the GSMP website at: https://monitoring.wwt.org.uk/our-work/goose-swan-monitoring-programme
Goose & Swan Monitoring ProgrammeAn overview of goose and swan monitoring in the UK.
By Colette Hall WWT
Goose & Swan Monitoring Programme
PIN
K-FO
OTE
D G
OO
SE B
Y C
HRI
S KN
IGH
TS/B
TO

17
Population Abundance Breeding success
Icelandic Whooper Swan
NW European Bewick’s Swan
Monitored annually by WeBS and I-WeBS (partial coverage of populations).
International Swan Census. Complete census every five years in January. Coordinated across
Europe. Surveys involve ground and aerial counts (latter in Iceland and Ireland). Next
census in 2025.
Annual surveys in Britain and Ireland, once a month from November to January:
includes a coordinated survey with the rest of Europe.
Greenland/Iceland Pink-footed GooseIcelandic-breeding Goose Census. Annual coordinated census in each of October and November, with a three-yearly coordinated
survey in spring. Covers Iceland, Faeroes, South Norway, Ireland and Britain. Surveys involve
ground counts and aerial surveys (latter in Iceland).
Annual survey in autumn at sites in England and Scotland.
Icelandic Greylag Goose
Annual survey in autumn at sites in Caithness, Scotland, only: few sites known to predominately hold Icelandic Greylags
during the winter.
British/Irish Greylag Goose
The UK trend for the population is monitored through WeBS.
Annual counts and age assessments at key sites in Scotland where Greylags are actively managed. Surveys usually carried out in late summer.
Taiga Bean GooseSurveys at the two key sites. Slamannan Plateau, Falkirk: annual counts and age assessments
organised by the Bean Goose Action Group. Yare Marshes, Norfolk: annual counts carried out by RSPB.
European White-fronted GooseThe UK trend for the population is
monitored through WeBS.
Annual survey at sites in England, usually in January to synchronise with the
International Waterbird Census (IWC) counts when age assessments take place
elsewhere in Europe.
Greenland White-fronted GooseComplete census and age assessments undertaken annually. Organised by the Greenland
White-fronted Goose Study. Covers Britain and Ireland. One coordinated count in autumn and one in spring, plus counts from any month November–February.
Greenland Barnacle Goose
Annual counts at key sites in Scotland during the winter.
International Greenland Barnacle Goose Census. Complete census every 3–5 years,
usually in spring, covering all sites in Ireland and Scotland. Surveys involve ground and aerial
counts.
Annual surveys at key sites in Scotland during the autumn/winter.
Svalbard Barnacle GooseAnnual census carried out at the Solway
Estuary, with counts each month from October to May.
Annual surveys at the Solway Estuary in autumn.
Dark-bellied Brent Goose The UK trend for the population is monitored through WeBS.
Annual surveys at sites in England, from September to March.
Canadian Light-bellied Brent GooseComplete census and age assessments undertaken annually. Organised by the Irish Light-bellied
Brent Goose Research Group. Covers Britain, Ireland, Iceland and France. One coordinated count in autumn and one in spring.
East Atlantic Light-bellied Brent Goose The UK trend for the population is monitored through WeBS.
Annual surveys at Lindisfarne, Northumberland, with adhoc age
assessments at other sites in England if birds are present.
Goose & Swan Monitoring Programme
Table 4 The GSMP monitors the abundance and breeding success of the UK’s native goose and migratory swans by collating data from a variety of sources.

18
Monitoring goose populations of the same species in Britain and Ireland is relatively straightforward thanks, in part, to the almost distinct separation in sites frequented by each: such as the Solway Firth and the west coast of Scotland being home to the Svalbard and Greenland populations of Barnacle Goose, respectively. Unfortunately, however, this is not the case for the Iceland Greylag Goose population. As their name suggests, Iceland is probably the only location where these Greylags can be identified and classified to population level in the field, without the need to use telemetry, colour-marking or isotope analysis. However, somewhere over the Atlantic once autumn migration is underway, the population crosses an invisible line and as the geese arrive in Britain and Ireland to winter, with no difference in plumage, the Icelandic birds blend in beautifully with the British/Irish population.
So what now? Some may ask why counts are not undertaken in Iceland before autumn migration commences: count them when they are separate to their British/Irish counterparts. A number of things either prevent this from happening or make it difficult to achieve, such as the population’s wide distribution throughout Iceland, often in difficult and inaccessible locations. What about trying to count them as they gather on the southern lowlands of Iceland just prior to migration? Again, this is not easy. The vast flocks consisting of thousands of birds can often hide themselves away in tall crops of Barley fields, twinned with the Greylags merging with feeding flocks of Greenland White-fronted and Pink-footed Geese prior to migration, makes separation of the species during aerial surveys difficult. Finally, Iceland’s waterbird monitoring network is not as geared up to undertake population estimate counts at such scale, as we are in Britain and Ireland.
Therefore, the majority of data used to assess the population size of the Iceland Greylag Goose is collected in Britain and Ireland, thanks to the sterling efforts of the GSMP volunteers. Whilst WeBS covers many wetland sites in Britain, the dispersal of Greylag Geese to non-wetland habitats (usually farmland) during the day to feed means that large numbers of geese can often go undetected during WeBS counts. Therefore, specially designed surveys are used and the Icelandic-breeding Goose Census (IGC) has been assessing the population of Icelandic Greylag Geese annually since 1960.
Counts are undertaken during November when the bulk of the Icelandic population have arrived in Britain and Ireland. In order to produce an updated population estimate each year, the GSMP team must take in to account several things. It is vital that we have the most up to date estimate of the number of British/Irish birds in the key areas where the Icelandic birds winter. However, this information is lacking for many areas and we mainly rely on local knowledge and information sent in by Local Organisers and counters: with the exception of Orkney, the main stronghold for the Icelandic birds, where a summer survey of British Greylags has been undertaken. Being a quarry species, we also need to take in to account any birds from the British/Irish population that have been harvested prior to the Icelandic birds arriving. Such information is hard to come by, as it is not routinely collected in Britain and Ireland. However, it is available for Orkney and the number of shot birds between a certain period is deducted from the total count of British Greylags for the site. Estimates of the number of British/Irish birds present are then deducted from the winter counts to produce the overall Icelandic population estimate.
Due to the overlap between the two populations, it has also become increasingly difficult to undertake age assessments of the Icelandic Greylags, and there are now very few sites where the wintering geese present are thought to be predominately from the Icelandic population. There is only one area – Caithness, Scotland – where breeding success is now assessed, and even these surveys have become more difficult in recent years, with very small sample sizes monitored. As per the abundance counts, carrying out age assessments in Iceland could be an alternative; however, this also brings with it similar issues to those mentioned above.
The fortunes of Icelandic Greylag Geese over the 60 years of the IGC have shown both increases and decreases in population size over time (Figure 1). From 1960, the population showed a steady increase to an all-time high of 114,393 in 1990. Between 1991 and 2004, the population showed signs of decline and fluctuated between 71,000–98,000 birds. The birds’ accessibility to hunting in Iceland has led to over 30,000 being harvested annually and during the 1990s there were fears that that level of hunting was unsustainable. However, with a shift in winter distribution during the 2000s, which now sees 50–60% of the entire population on Orkney and a reduction in the number being shot during the winter, the
Monitoring mayhem – when two populations of the same species merge! The difficulties in monitoring the population of Icelandic Greylag Geese.
By Kane Brides WWT
Goose & Swan Monitoring Programme

19
population appeared to stabilise, climbing back up to over 100,000 birds between 2009–12, although there are signs that the population has started to decline again in very recent years.
Population estimates derived from monitoring Icelandic-breeding geese have largely been gathered by volunteer counters and their efforts have been rewarded with a far better understanding of the distribution and abundance of geese in Britain. However, as we look towards the future, challenges still do lie ahead. Given the recent possible declines, the trajectory of the Icelandic Greylag Goose population needs carefully monitoring and countries across the flyway need to continue working together to explore options that could help better monitor this population.
Goose and Swan Monitoring Programme
Figure 1. The population estimate (line) and percentage of young (columns) for Icelandic Greylag Goose, 1960–2019.
GRE
YLAG
GO
OSE
BY
TOM
STR
EETE
R/BT
O
WeBS trend for Icelandic Greylag Goose in the UK. Green dots = annual index; blue line = smoothed trend.
WeB
S In
dex
50
069/70 79/80 99/00 19/20
100
150
Monthly indices for Icelandic Greylag Goose in the UK. Green bars = 2019/20; blue line/hatched area = previous five-year mean/range.
Jul Aug Sep Oct Nov Dec Jan Feb Mar Apr May Jun
50
0
100
WeB
S In
dex
150
89/90 09/10
Num
ber o
f gee
se
1994 1999 2004 2009 2014 2019
140,000
120,000
100,000
80,000
60,000
40,000
20,000
0
70
60
50
40
30
20
10
0
Percentage young
198919841979197419691964

20
The Bewick’s Swan Cygnus columbianus bewickii, the Palearctic subspecies of the Tundra Swan, is one of the most iconic migratory waterbirds to visit our shores. It breeds across the Russian arctic tundra but follows geographically separate migration routes to the wintering grounds, resulting in three populations currently described based on its winter distribution: the NW European, Caspian and Eastern populations (Rees 2006). Recent tracking studies have found additional separation within the Eastern population, with two subpopulations identified, which follow the ‘East Asian continental flyway’ to China and the ‘West Pacific flyway’ to Japan respectively (Fang et al. 2020).
Of the three main populations, the NW European Bewick’s Swan population is certainly the best known. Detailed observations of individual birds wintering at WWT Slimbridge in SW England, identifiable by their natural bill markings, were famously initiated by Peter Scott and his family in winter 1963/64, and a ringing programme commenced in 1967 to gain information on the birds during migration or if they changed wintering sites. Since then, interest in the species has expanded into a population-level study, with a network of ornithologists identifying colour-marked birds sighted throughout the range. Over the years, WWT and other research groups have caught and marked the swans with leg rings and neck collars at different sites during winter (in the UK, Netherlands and Belgium), on the staging grounds (in Estonia) and in the breeding and moulting areas (in Russia). Tracking individuals fitted with GPS loggers, following technological advances in the 21st century, has also confirmed migration routes and site use at different times of year, including emphasising the importance of areas within European arctic Russia for the species during the summer months.
Population estimates have been made for the Eastern population only relatively recently (Fang et al. 2020), and the size and distribution of the Caspian population remains far from clear. Numbers in the NW European conversely have been monitored closely for over 50 years. Initially population size and trends were determined from the International Waterbird Censuses (the IWCs), which synthesises the systematic surveys of waterbirds at wetland sites undertaken by national count programmes across Europe. From the mid-1970s onwards, however, Bewick’s Swans increasingly flew to arable land to feed during the day, and it was felt that total population size estimates derived from the IWCs were not sufficiently
accurate, for instance for determining sites of international importance for the species. Coordinated International Swan Censuses (the ISCs) therefore were introduced for Bewick’s Swans across Europe in the mid-1980s, undertaken under the auspices of the Wetlands International/IUCN-SSC Swan Specialist Group. The ISCs extended to include the Icelandic and NW Mainland European Whooper Swans in 1986 and 1990 respectively, and these have been made at five-year intervals since then. Collation and publication of census results for the Icelandic Whooper Swan population is now undertaken within the GSMP, with the GSMP also collating and contributing the UK component of the international Bewick’s Swan census results.
During the early years of monitoring Bewick’s Swans across Europe, the IWCs put the population size at c.6,000–7,000 birds in the late 1960s, rising to to 9,000–10,000 by the mid-1970s, and both the IWCs and the ISCs estimated 17,000–18,000 birds by the mid-1980s (Rees 2006, Beekman et al. 2019). Numbers increased further in the late 1980s and early 1990s to a peak of 29,780 birds in January 1995, followed by a rapid (39%) decline to 18,057 birds recorded in January 2010 (Beekman et al. 2019, Figure 2). The scale and the rate of change gave great cause for concern, and an International Single Species Action Plan (ISSAP) developed for the NW European population was adopted by AEWA in May 2012. The initial remit was to halt the ongoing decline and the overall goal is to hold the population minimally at its 2000 level (i.e. 23,000 birds; Nagy et al. 2012). The 2015 census encouragingly showed a partial recovery to 20,149 birds, and changes in distribution across the wintering range were also recorded.
Northwest European Bewick’s Swans: a national and flyway perspective Analysing the decline of Bewick’s Swan across Europe.
By Eileen Rees WWT
Goose & Swan Monitoring Programme
BEW
ICK’
S SW
AN B
Y JO
HN
HAR
DIN
G/B
TO

21Goose & Swan Monitoring Programme
In addition to the population decline, a shift in winter distribution has also occurred in recent years, with a higher proportion of the population now remaining in more easterly countries (notably Germany) in mid-winter. Only a handful of birds now migrate as far west as Ireland, whereas >1,000 reached there during the 1980s. The proportion of birds wintering in Britain held up well until 2010, but by 2015 there was a marked increase in the proportion of the population wintering in Germany and a concomitant drop in the proportion recorded wintering in Britain and Ireland (Beekman et al. 2019, Figure. 2). This finding was supported by analysis of colour-mark sightings, which showed that individuals have decreased their migratory distances with warmer winters, and now remain further east (Nuijten et al. 2020a).
In addition to taking forward active conservation measures, the Action Plan includes requirements to
FIND OUT MOREBeekman, J., Koffijberg, K., Hornman, M., Wahl, J., Kowallik, C., Hall, C., Devos, K., Clausen, P., Laubek, B., Luigujõe, L., Wieloch, M., Boland, H., Švažas, S., Nilsson, L., Stipniece, A., Keller, V., Degen, A., Shimmings, P., Larsen, B-H., Portolou, D., Langendoen, T., Wood, K. & Rees, E.C. 2019. Long-term population trends and shifts in distribution of Bewick’s Swans wintering in northwest Europe. Wildfowl (Special Issue No. 5): 73–102.
Fang, L., Zhang, J., Zhao, Q., Solovyeva, D., Vangeluwe, D., Rozenfeld, S.B., Lameris, T., Xu, Z., Bysykatova, I., Batbayar, N., Konishi, K., Moon, O.-K., He, B., Koyama, K., Moriguchi, S., Shimada, T., Park, J.-Y., Kim, H., Liu, G., Hu, B., Gao, D., Ruan, L., Natsagdorj, T., Davaasuren, B., Antonov, A., Mylnikova, A., Stepanov, A., Kirtaev, G., Zamyatin, D., Kazantzidis, S., Sekijima, T., Damba, I., Lee, H., Zhang, B., Xie, Y., Rees, E.C., Cao, L. & A.D. Fox, A.D. 2020. Two distinctive flyways with different population trends of Bewick’s Swan Cygnus columbianus bewickii in East Asia. Wildfowl (Special Issue No. 6): 13–42.
Nagy, S., Petkov, N., Rees, E.C., Solokha, A., Hilton, G., Beekman, J. & Nolet, B. 2012. International Single Species Action Plan for the Northwest European Population of Bewick’s Swan (Cygnus columbianus bewickii). AEWA Technical Series No. 44. Bonn, Germany.
Nuijten, R.J.M., Wood, K.A., Haitjema, T., Rees, E.C. & Nolet, B.A. 2020a. Concurrent shifts in wintering distribution and phenology in migratory swans: individual and generational effects. Global Change Biology 26: 4263–4275.
Nuijten, R.J.M., Vriend, S.J.G., Wood, K.A., Haitjema, T., Rees, E.C., Jongejans, E. & Nolet, B.A. 2020b. Apparent breeding success drives long-term population dynamics of a migratory swan. Journal Avian Biology 51: e02574.doi 10.1111/jav.02574.
Rees, E. 2006. Bewick’s Swan. T & A.D. Poyser, London, UK.
Tijsen, W. & Koffijberg, K. 2020. Call for international Bewick’s Swan age count 12–13 December 2020 and results of the international age count: 14–15 December 2019. Available online at the IUCN-SSC Swan Specialist Group website: https://swansg.org.
Wood, K.A., Nuitjen, R.J.M., Newth, J.L., Haitjema, T., Vangeluwe, D., Ioannidis, P., Harrison, A.L., Mackenzie, C., Hilton, G.M., Nolet, B.A. & Rees, E.C. 2018. Apparent survival of an arctic-breeding migratory bird over 44 years of fluctuating population size. Ibis 160: 413–430.
continue monitoring the status of the population and to determine the drivers of population change. Population modelling indicates that low productivity has been a main reason underlying the population trends over the years (Nuijten et al. 2020b). Moreover, an average of 9.1% juvenile birds recorded during annual age assessments in the Netherlands and the UK during winters 2010/11–2019/20 inclusive (Tijsen & Koffijberg 2020) is insufficient to offset adult mortality of c.13–23% per annum (Wood et al. 2018). The results of the January 2020 census, currently being compiled, will inform the 10-year review of the ISSAP scheduled for 2022, including assessing whether a new ISSAP is required for the species. The 2020 census has also been extended to include countries that provide wintering haunts for the Caspian population, to provide better information into the future of potential population-level shifts in distribution between wintering areas.
WeBS trend for Bewick’s Swan in the UK. Green dots = annual index; blue line = smoothed trend.
WeB
S In
dex
069/70 79/80 99/00 19/20
1,000
2,000
89/90 09/10
Figure 2. Total number of Bewick’s Swans recorded in each range country during the International Swan Censuses (ISC), from Beekman et al. (2019).
Num
ber o
f sw
ans
1990 1995 2000 2005 2010 2015
35,000
30,000
25,000
20,000
15,000
10,000
5,000
019871984
Nths GB Ire Ger Dk Other

22
There are just two wintering populations of Taiga Bean Geese in the UK: one associated with the Yare Valley in East Anglia, which has dwindled to just a few individuals present for a relatively brief period each winter, as a result of ‘short-stopping’ caused by climate change; and a second, larger, population on the Slamannan Plateau in Central Scotland.
The Taiga Bean Geese which winter on the Slamannan Plateau have been intensively monitored by keen amateur ornithologists since they were first discovered to be using fields there for feeding purposes in the late 1980s (at which time they were roosting at Carron Valley Reservoir some 12 kilometres to the northwest).
Data relating to field usage patterns (number of birds in individually denoted fields) have been collected on a regular basis throughout each of the subsequent wintering periods following broadly the same methodology that was established by John Simpson during winter 1989/90. This invariably has involved several visits to locate feeding or loafing flocks of birds each week, from when the birds first appear in early autumn until when the last birds disappear in early spring. Other visits are also made to undertake roost counts at the various waterbodies on the Plateau the geese now use for roosting purposes.
For much of this time, this routine monitoring has been conducted under the auspices of the Bean Goose Action Group (BGAG). This is a group of people representing various statutory and non-statutory bodies (including NatureScot, two unitary authorities, RSPB, etc.) together with various local ornithologists. BGAG is committed to delivering the Local Biodiversity Action Plans (LBAPs) of the two unitary authorities involved (Falkirk and North Lanarkshire), and so
furthering the conservation and protection of this unique wintering population of Taiga Bean Geese.
The monitoring involved has generated a wealth of data, and is a very good example of the value of ‘citizen science’. For example, an SPA was devised and designated in the mid-2000s to provide for better protection of the geese, and this process was facilitated by the robust dataset already available. Throughout the vast majority of this time, the routine monitoring has been led by Angus Maciver, who is referred to as the Bean Goose Monitoring Officer, and is very much central in the small team of volunteers who undertake this key work.
However, nowadays, the traditional monitoring is complemented by modern technology. A long-held aspiration of the LBAPs was to achieve
the catching and marking of some of the Taiga Bean Geese.
Eventually, (after several false starts when others suggested it wasn’t going to be possible) Carl Mitchell and Larry Griffin of the WWT attempted a catch in October 2011. After three days, 15 birds were successfully cannon-netted and marked. At this time only five Bean Geese had previously been ringed in Britain and Ireland.
Subsequently, a further 32 birds have also been captured and marked. Some of those captured have been fitted with tracking devices which have revealed huge amounts about these birds. The tracking has added greatly to our understanding of movements of birds whilst they are wintering on the plateau, complementing what was already known from monitoring using conventional approaches.
Taiga Bean Goose 7T during processing in October 2013.
Eye of the TaigaStudying the Slamannan Plateau population of Taiga Bean Geese.
By Angus Maciver and Brian Minshull Bean Goose Action Group
Goose & Swan Monitoring Programme
TAIG
A BE
AN G
OO
SE B
Y BE
AN G
OO
SE A
CTI
ON
GRO
UP

23
The tracking has been revelatory about the lives of the birds when they are not on the Plateau. Whilst it was always suspected that they originated from breeding grounds somewhere in Scandinavia, we know now precisely where the sub-population involved breeds, and further, we know about ‘stepping stones’ or staging areas the birds use between the breeding grounds and the Slamannan Plateau or vice versa during the autumn and spring migrations.
Although the first batch of tracking devices fitted to birds captured in October 2011 failed to work, within months of this huge disappointment we were thrilled to hear that some of ‘our’ neck-collared birds had been reported on staging grounds north of Oslo by Simon Rix (aka the ‘Oslo Birder’). This relates to what is one of the most rewarding aspects of working on these birds; Simon is very much part of an ever-increasing international network of committed individuals all working in the same sub-population of taiga bean geese wherever they are in the flyway, be it Scotland, or Denmark, or Norway, or Sweden. The tracking data have already provided for a series of papers relating to these fascinating birds.
We very much hope we can continue to improve the conservation status of the Scottish wintering population of Taiga Bean Geese.
However, as ever, in such situations, resources are a significant issue. We are entirely dependent on voluntary effort; although some mileage expenses are funded, the volunteers give up their time purely for the privilege of working with these birds. Further, recently we were very sorry to learn that Carl Mitchell and Larry Griffin have left WWT but we very much hope that they can continue to be a crucial part of our team all the same. Lastly, just as we are really beginning to understand more and more about ‘our’ birds we have initial indications that in the next few decades we may lose them.
Some marked birds are known to have been short-stopping in Denmark in the past couple of winters, and initial analysis of the first and last known dates the birds are present on the plateau each winter indicates that the wintering period is getting shorter and shorter; when monitoring began in the late 1980s birds were present on the plateau until as late as mid-March, nowadays they are all leaving by early February.
This is a dramatic pace of change, showing how adaptive the birds are.As we often say, “the more we know, the less we know”.
Tracking data have been extremely useful in relation to monitoring of roosting activity, as this image indicates.
FIND OUT MORE
Bean Goose Action Group. 2021. Scotland’s Bean Geese. https://sites.google.com/view/scotlands-bean-geese/home
Mitchell, C., Griffin, L., Maciver, A., Minshull, B. & Makan, N. 2016. Migration routes, stop-over locations and breeding area of Taiga Bean Geese Anser fabalis fabalis wintering in central Scotland. Bird Study 63: 437–446.
Mitchell, C., Griffin, L., Maciver, A., & Minshull, B. 2017. Scotland’s Bean Geese and the spring 2017 migration. Scottish Birds 37: 221–224.
Tracking data have been revelatory in relation to what the birds do when not on the Slamannan Plateau; this image indicates the migration route of the bird referred to as Tag 7T in spring 2015.
Goose & Swan Monitoring Programme

24
Drones and wintering waterbirdsThe use of drones for monitoring waterbirds has been put forward as a possible tool, but the disturbance they cause may limit their use.
Waterbird Research
Drone use has increased sharply in recent years, facilitated by mass production and much-reduced retail prices. To research impacts, and possible use of drones for monitoring outside the breeding season, BTO scientists flew a commercially available quadcopter drone towards waterbird flocks in coastal, freshwater and arable farmland habitats around the Firth of Forth. While one researcher flew the drone at a standardised speed and height, another observed the flocks through a telescope to record any responses to the drone as it approached, including alarm calls, signs of heightened alert levels and taking flight.
The results showed that larger flocks were more likely to take flight than smaller flocks, and large flocks also took flight at a greater distance from the drone than smaller flocks. This is probably because the larger the flock, the more likely there is to be a sensitive individual present – in almost all cases, once one bird had responded to the drone, the rest of the flock followed. Habitat type also had a strong effect on birds’ responses to drones. Birds at inland lochs, which were already subject to lots of human activity, were found to be very unlikely to respond to drone presence, while birds at coastal sites were more likely to respond. Birds in arable farmland were particularly sensitive – flocks feeding in this habitat are probably more susceptible to disturbance because of the need to be vigilant to potential predators.
This research suggests that off-the-shelf quadcopter drones are unlikely to be a useful aide for WeBS and other non-breeding waterbird monitoring. It has been suggested that images from drones for counting large flocks could be useful, especially at sites where viewing is difficult, but this study suggests that large flocks are likely to flush at coastal and arable sites as a drone approaches. Disturbance caused by such monitoring would have to be carefully evaluated.
The mass proliferation of drones and the likelihood of commercial and recreational drone use taking place in proximity to wildlife creates a new and potentially significant source of disturbance to wild birds. Such disturbance causes birds to waste energy and reduces their feeding time. In extreme cases, birds might stop using an area altogether and be forced to feed elsewhere, where feeding opportunities may be poorer or the risk of predation higher. This could be particularly harmful during the cold winter months. If recreational drone use were to become more frequent at important sites for our wintering waterbirds, and birds did not become accustomed to this novel form of disturbance, then the resulting increases in energy expenditure and stress may negatively affect their populations.
FIND OUT MORE
The Drone and Model Aircraft Code. https://dronesafe.uk/drone-code
Jarrett, D., Calladine, J., Cotton, A., Wilson, M.W. & Humphreys, E. 2020. Behavioural responses of non-breeding waterbirds to drone approach are associated with flock size and habitat. Bird Study 67: 1–7.
The study found larger flocks and waterbirds in arable farmland were most likely to respond to drones.
Inland lochs – few flocks flushed
Coastal sites >50% flocks flushed
Stubble fields – all flocks flushed
FORT
H E
STU
ARY
BY A
NN
E CO
TTO
N/B
TO; S
TUBB
LE F
IELD
DIS
TURB
ANC
E BY
AN
NE
BURG
ESS;
LO
CH
BY
TERE
SA F
ROST

25 Waterbird Research
Helping waterbirds adjust to a changing worldNew research suggests that international protected area networks can advance range shifts of wintering waterbirds.
Climate change has tended to move the suitable climate window for waterbirds northwards, but species may have a so‐called climatic debt, where shifts in species ranges lag behind shifts in temperature isoclines. A recent study investigated the impact of protected areas on range shifts of wintering waterbirds in Europe and North Africa.
The research used a ‘community temperature index’ (CTI) to track change in species communities over time at a continental scale. The CTI indicates the extent to which species at a location tend to be associated with warm or cold temperatures. Waterbird communities were found to be changing 40% faster inside protected areas, shifting by an average of 90-km in 25 years, compared to 50-km outside protected areas.
Protected areas not only aid the colonisation in the northern areas, but also act against local extinctions on the southern range of species, compared to non-protected areas. Protected areas can thus expand the overall range of species, assessed in the study by CTISD, a measure of the variation in CTI.
The protected network as a whole influenced the spread of waterbird species. Shifts in species communities were faster in areas which had a dense protected area network compared to areas where the network was sparse. In common with previous research by BTO and others,
the findings highlight that protected areas networks, historically established to protect established habitats and species, are now also important to mitigate the negative effects of climate warming on biodiversity.
In the UK, a negative CTI trend suggests that waterbird populations have failed to respond to warming, leading to an increasing climatic debt and reduced climatic breadth. This is probably due to increases in some of the geese populations (associated with cold temperatures) and decreases in wader populations (associated with warm temperatures) which may mask other climate-driven changes.
The research was based on data from the International Waterbird Census (IWC) and utilised tens of thousands of waterbird surveys covering 97 species from 39 countries during 25 years, including WeBS counts.
Models of the four theoretical scenarios of species colonisation or extirpation relative to species thermal affinities (triangles = species). Community changes in response to climate warming are revealed by trends of community temperature index (CTI) (i.e. thermal average) and CTI standard deviation (CTISD) over time. The CTI slopes depend on both rate of colonisation or extirpation and on the species temperature index values.
Spatiotemporal trends from 1993 to 2017 of (a) temperature, (b) community temperature index (CTI), (c) climatic debt, and (d) thermal heterogeneity (CTISD). Red = positive trend, p < 0.05; blue = negative trend, p < 0.05; grey = not significant; colour gradient, the darker the colour, the greater the intensity.
FIND OUT MOREGaget, E., Pavón-Jordán, D., Frost ,T. & 47 co-authors. 2020. Benefits of protected areas for nonbreeding waterbirds adjusting their distributions under climate warming. Conservation Biology. doi:10.1111/cobi.13648.

26
Densities of waders on the non-estuarine coast Analysing the densities of different wader species from NEWS III.
Waterbird Research
The Non-Estuarine Waterbird Survey (NEWS III) in the winter of 2015/16 extended coverage of the coast by regular WeBS counts across the UK’s entire non-estuarine coastline. The initial results, including population estimates for the open coast, were reported in Waterbirds in the UK 2015/16. Now a further analysis has been carried out on the data to assess the changes in densities of 11 wader species since the three previous surveys, Winter Shorebird Count (WSC) in 1984/85, NEWS I in 1997/98 and NEWS II in 2006/07.
PAIRED COMPARISONSThe new analysis used only those count stretches that had been covered in multiple surveys. Coverage of these was good in NEWS III, as volunteer counters were asked to prioritise certain coastal stretches, before signing up for additional stretches.
cases. The only increases recorded were for Sanderling in Scotland and Purple Sandpiper in England over the medium-term.
COUNTRY COMPARISONSThe study revealed density differences between the countries. Curlew densities were highest in Scotland and Wales, whereas for Redshank densities were highest in Scotland and England. Dunlin densities showed smaller differences between countries.
TRACKING DECLINESThe four non-estuarine surveys have tracked declines in the majority of the wader species using these habitats over the past 30 years. However, the UK coast still supports significant numbers of these species. Planned further work on the NEWS III data will look at how tidal wrack deposits influence wader distributions.
Focusing on the percentage changes in densities (birds per km) at the count stretch level provided the best comparison between the surveys, overcoming potential biases resulting from geographical and habitat coverage in the surveys. These comparisons were done for the intertidal habitat and the all-habitat data (i.e. intertidal, landward and seaward habitats).
CHANGE IN BIRD DENSITYTo evaluate recent trends, the change in density from NEWS I (medium-term, 18 years) and NEWS II (short-term, nine years) with NEWS III was modelled for England, Scotland and Wales. Unfortunately there was too much uncertainty in model results for Northern Ireland for conclusions to be drawn. Significant declines in ‘all-habitat’ densities at the country-level were recorded over the short- and medium-term in 27 of 66 possible
Maps in the NEWS section of the WeBS Report Online show coverage by whether all (dark blue) or some (light blue) of the relevant intertidal, landward, and seaward habitats were counted, together with counts for each species (yellow dots), here for Purple Sandpiper (PS). Maps are available for all waterbird species (including non-wader waterbirds) for NEWS III and the three historic surveys, so change can be explored at a regional level.
FIND OUT MORE
Humphreys, E.M., Austin, G.E., Frost, T.M., Mellan, H.J., Boersch-Supan, P., Burton, N.H.K & Balmer, D.E. 2021. Wader populations on the United Kingdom’s open coast: results of the 2015/16 Non-Estuarine Waterbird Survey (NEWS III) and a review of population trends. Bird Study 67 (3): 371–384.
Austin, G.E., Frost, T.M., Mellan, H.J. & Balmer, D.E. 2017. Results of the third Non-Estuarine Waterbird Survey, including population estimates for key waterbird species. BTO Research Report 697. BTO, Thetford.
Detailed maps showing counts along the non-estuarine coast in all regions for all four surveys are available through the WeBS Report Online at: www.bto.org/webs-reporting-news

27 Waterbird Research
Species that that showed significant changes in all-habitat densities in Scotland, England and Wales. MT: Medium-term, NEWS I NEWS III. ST: Short-term, NEWS II NEWS III. Medium-term declining species are pictured in the relevant country. Insets are density plots over all four surveys for Redshank, Curlew and Dunlin showing birds per km per country per survey.
BAR-
TAIL
ED G
OD
WIT
BY
NEI
L C
ALBR
ADE;
CU
RLEW
AN
D S
AND
ERLI
NG
BY
LIZ
CUTT
ING
/BTO
; DU
NLI
N A
ND
PU
RPLE
SAN
DPI
PER
BY G
EORG
WIE
TSC
HO
RKE;
GRE
Y PL
OVE
R BY
PH
ILIP
CRO
FT/B
TO;
RIN
GED
PLO
VER
BY E
DM
UN
D F
ELLO
WES
/BTO
; RED
SHAN
K BY
ALL
AN D
REW
ITT/
BTO
AN
D T
URN
STO
NE
BY S
ARAH
KEL
MAN
/BTO
MT -77%
MT -48%
ST -50%
MT -28%
MT -50%ST -25%
MT +462%
MT -84%
MT +380%
MT -72%
MT -94%
MT -87%
MT -64%
ST -45%
MT -94%
MT -64%
MT -90%
Additional Wales short-term declines:Oystercatcher ST -35%Lapwing ST -95%Redshank ST -52%
Turnstone ST -66%
Redshank
Eng
Wal
Sco
1
0.5
1984/85 1997/98 2006/07 2015/16
1.5
Eng
Wal
Sco3
2
1
1984/85 1997/98 2006/07 2015/16
Curlew
Eng
Wal
Sco
3
2
1
1984/85 1997/98 2006/07 2015/16
Dunlin
4
5
0
Bird
s per
km
Bird
s per
km
2
0
Bird
s per
km
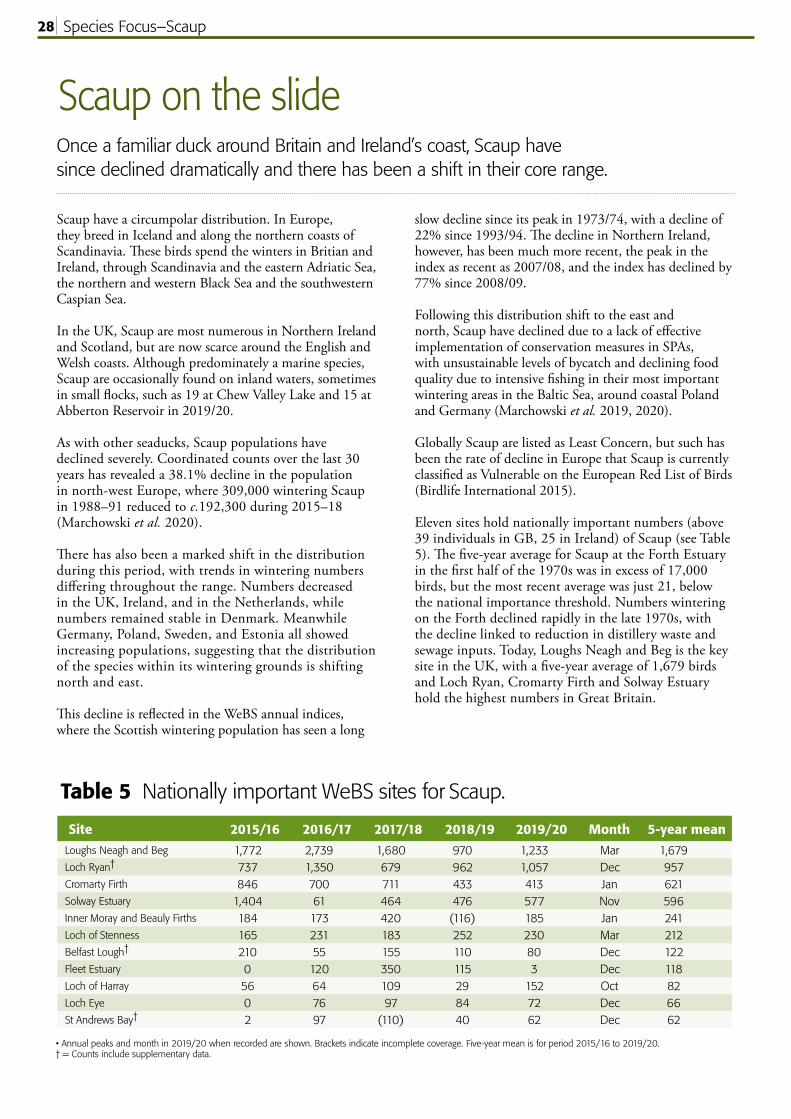
28
Scaup on the slideOnce a familiar duck around Britain and Ireland’s coast, Scaup have since declined dramatically and there has been a shift in their core range.
Species Focus–Scaup
Scaup have a circumpolar distribution. In Europe, they breed in Iceland and along the northern coasts of Scandinavia. These birds spend the winters in Britian and Ireland, through Scandinavia and the eastern Adriatic Sea, the northern and western Black Sea and the southwestern Caspian Sea.
In the UK, Scaup are most numerous in Northern Ireland and Scotland, but are now scarce around the English and Welsh coasts. Although predominately a marine species, Scaup are occasionally found on inland waters, sometimes in small flocks, such as 19 at Chew Valley Lake and 15 at Abberton Reservoir in 2019/20.
As with other seaducks, Scaup populations have declined severely. Coordinated counts over the last 30 years has revealed a 38.1% decline in the population in north-west Europe, where 309,000 wintering Scaup in 1988–91 reduced to c.192,300 during 2015–18 (Marchowski et al. 2020).
There has also been a marked shift in the distribution during this period, with trends in wintering numbers differing throughout the range. Numbers decreased in the UK, Ireland, and in the Netherlands, while numbers remained stable in Denmark. Meanwhile Germany, Poland, Sweden, and Estonia all showed increasing populations, suggesting that the distribution of the species within its wintering grounds is shifting north and east.
This decline is reflected in the WeBS annual indices, where the Scottish wintering population has seen a long
slow decline since its peak in 1973/74, with a decline of 22% since 1993/94. The decline in Northern Ireland, however, has been much more recent, the peak in the index as recent as 2007/08, and the index has declined by 77% since 2008/09.
Following this distribution shift to the east and north, Scaup have declined due to a lack of effective implementation of conservation measures in SPAs, with unsustainable levels of bycatch and declining food quality due to intensive fishing in their most important wintering areas in the Baltic Sea, around coastal Poland and Germany (Marchowski et al. 2019, 2020).
Globally Scaup are listed as Least Concern, but such has been the rate of decline in Europe that Scaup is currently classified as Vulnerable on the European Red List of Birds (Birdlife International 2015).
Eleven sites hold nationally important numbers (above 39 individuals in GB, 25 in Ireland) of Scaup (see Table 5). The five-year average for Scaup at the Forth Estuary in the first half of the 1970s was in excess of 17,000 birds, but the most recent average was just 21, below the national importance threshold. Numbers wintering on the Forth declined rapidly in the late 1970s, with the decline linked to reduction in distillery waste and sewage inputs. Today, Loughs Neagh and Beg is the key site in the UK, with a five-year average of 1,679 birds and Loch Ryan, Cromarty Firth and Solway Estuary hold the highest numbers in Great Britain.
Table 5 Nationally important WeBS sites for Scaup.
• Annual peaks and month in 2019/20 when recorded are shown. Brackets indicate incomplete coverage. Five-year mean is for period 2015/16 to 2019/20.† = Counts include supplementary data.
Site 2015/16 2016/17 2017/18 2018/19 2019/20 Month 5-year meanLoughs Neagh and Beg 1,772 2,739 1,680 970 1,233 Mar 1,679Loch Ryan† 737 1,350 679 962 1,057 Dec 957Cromarty Firth 846 700 711 433 413 Jan 621Solway Estuary 1,404 61 464 476 577 Nov 596Inner Moray and Beauly Firths 184 173 420 (116) 185 Jan 241Loch of Stenness 165 231 183 252 230 Mar 212Belfast Lough† 210 55 155 110 80 Dec 122Fleet Estuary 0 120 350 115 3 Dec 118Loch of Harray 56 64 109 29 152 Oct 82Loch Eye 0 76 97 84 72 Dec 66St Andrews Bay† 2 97 (110) 40 62 Dec 62

29
FIND OUT MORE
BirdLife International. 2015. Aythya marila. The IUCN Red List of Threatened Species 2015: e.T22680398A59969832.
Marchowski, D., Jankowiak, Ł., Ławicki, Ł., Wysocki, D., Calbrade, N.A. & 15 others. 2020. Effectiveness of the European Natura 2000 network to sustain a specialist wintering waterbird population in the face of climate change. Scientific Reports 10: 20286 (2020).
Marchowski, D., Jankowiak, Ł., Ławicki, Ł., Wysocki, D., & Chylarecki, P. 2019. Fishery bycatch is among the most important threats to the European population of Greater Scaup Aythya marila. Bird Conservation International 30:1–18.
SCAU
P BY
GRA
HAM
CAT
LEY
WeBS trend for Scaup in Scotland. Green dots = annual index; blue line = smoothed trend.
WeB
S In
dex
500
0
2,000
1,000
1,500
94/95 99/00 04/05 09/10 14/15 19/2089/9084/8579/8074/7569/70
WeB
S In
dex
100
0
700
94/95 99/00 04/05 09/10 14/15 19/20
200
400
500
300
600
89/90
WeBS trend for Scaup in the Northern Ireland. Green dots = annual index; blue line = smoothed trend.
WeBS trend for Scaup in the UK. Green dots = annual index; blue line = smoothed trend.
WeB
S In
dex
200
0
700
400
500
600
300
100
94/95 99/00 04/05 09/10 14/15 19/2089/9084/8579/8074/7569/70

30
Spoonbill on the riseAnother recent colonist in the UK, the Spoonbill are becoming established at several sites and in increasingly large numbers.
Species Focus–Spoonbill
Full of character with their unique, distinctive shaped bill, Spoonbills are always a delight to see as they march through wetlands with long, slow strides, sweeping their open bill through the water, collecting invertebrates. In flight, they are swan-like while much smaller and faster, with neck outstretched and long legs trailing. But of course, with a bill like a large wooden spoon, they are unlikely to be mistaken.
The Spoonbill population has always been stable and high in Continental Europe, but they are a rarer sight in the UK. As such, they are classed as an Amber-listed species in the UK (Eaton et al. 2015), but in the rest of Europe and the world, they are classed as Least Concern (BirdLife Datazone).
Despite this, it is now possible to see flocks of individuals feeding together when once it would have been a rare treat to see one Spoonbill. The maximum WeBS tally in 2019/20 was 198 individuals in September, a record number compared with 15 years ago when the maximum tally was 18 individuals. The 10-year WeBS trend is an increase of 309% and there is no indication that this growth might slow down in the near future. However, research into the Spoonbill population at the Wadden Sea in the Netherlands (where 1,529 breeding pairs were counted in 2015) has found that food availability in the feeding areas surrounding colonies limits and regulates population size (Oudman et al. 2017). This may potentially be a major factor that affects the Spoonbill population in the UK in the coming years.
In 2019/20, Spoonbills were recorded on 45 WeBS sites, with double figure counts at eight of these – North Norfolk Coast, where due to successful breeding since
2010, the peak count was 133 birds, and also at Poole Harbour, The Wash, Humber Estuary, Beaulieu Estuary, North West Solent, Swale Estuary and Burry Inlet.
This large range in the UK is partly due to the fact that Spoonbills can inhabit and feed in a large variety of wetland habitats from extensive shallow wetlands with mud, clay or fine sand substrates (del Hoto et al. 1992) to either fresh, brackish or saline marshes, rivers, lakes and flooded areas (Hancock et al. 1992, Snow & Perrins 1998). They also frequent sheltered marine habitats during the winter such as deltas, estuaries, tidal creeks and coastal lagoons (Hancock et al. 1992, del Hoyo et al. 1992).
Globally, Spoonbills have an incredibly large range, stretching from eastern China to the northwest African coast. There is a variety in the migration habits between populations, with some populations fully migrating (del Hoyo et al. 1992), while others only travel a short distance from breeding and wintering grounds (Snow & Perrins 1998) and other populations are resident and nomadic or only partially migratory (del Hoyo et al. 1992). In the UK, we are now able to see Spoonbills all year round, with a spike in June, July and August (shown through WeBS data) as birds travel to the UK from their breeding grounds in southern Europe, central and Southern Asia and North Africa.
Spoonbills are a rare breeder in the UK, but there have been several success stories in recent years, with successful nests reported on the North Norfolk Coast, RSPB Havergate Island, Suffolk and RSPB Fairburn Ings, West Yorkshire. There has also been an amazing record from 2018, where one pair bred, fledging two or three young from a nest among a gull colony in Orkney.
WeBS trend for Spoonbill in the UK. Green dots = annual index; blue line = smoothed trend.
WeB
S In
dex
20
0
100
94/95 99/00 04/05 09/10 14/15 19/20
40
60
80
Monthly indices for Spoonbill in the UK. Green bars = 2019/20; blue line/hatched area = previous five-year mean/range.
Jul Aug Sep Oct Nov Dec Jan Feb Mar Apr May Jun
50
0
100
150
WeB
S In
dex

31SP
OO
NBI
LL B
Y ED
MU
ND
FEL
LOW
ES/B
TO
FIND OUT MOREBirdlife Datazone http://datazone.birdlife.org/species/factsheet/eurasian-spoonbill-platalea-leucorodia
del Hoyo, J., Elliot, A. & Sargatal, J. 1992. Handbook of the Birds of the World, Vol. 1: Ostrich to Ducks. Lynx Edicions, Barcelona, Spain.
Eaton, M.A., Aebischer, N.J., Brown, A.F., Hearn, R.D., Lock, L., Musgrove, A.J., Noble, D.G., Stroud, D.A. & Gregory, R.D. 2015. Birdsof Conservation Concern 4: the population status of birds in the United Kingdom, Channel Islands and Isle of Man. British Birds 108: 708–746.
Hancock, J.A., Kushlan, J.A. & Kahl, M.P. 1992. Storks, ibises and spoonbills of the world. Academic Press, London.
Oudman T., de Goeij P., Piersma T. & Lok T. 2017. Colony-breeding Eurasian Spoonbills in The Netherlands: local limits to population growth with expansion into new areas. Ardea 105: 113–124.
Snow, D.W. & Perrins, C.M. 1998. The Birds of the Western Palearctic. Volume 1: Non-Passerines. Oxford University Press, Oxford.
Table 6 Key WeBS sites for Spoonbill.
• Annual peaks and month in 2019/20 when recorded are shown. Brackets indicate incomplete coverage. Five-year mean is for period 2015/16 to 2019/20.† = Counts include supplementary data.
Site 2015/16 2016/17 2017/18 2018/19 2019/20 Month 5-year meanNorth Norfolk Coast 48 86 104 122 133 Sep 99Poole Harbour 46 38 58 71 56 Oct 54The Wash 16 16 24 14 22 Sep 18Humber Estuary 7 20 23 14 19 Aug 17Beaulieu Estuary 15 12 15 15 18 Feb 15North West Solent 5 14 8 12 10 Jan 10Swale Estuary 1 7 0 (6) 24 Oct 8Breydon Water & Berney Marshes† 6 9 6 8 2 Jul 6Taw-Torridge Estuary 6 10 7 3 5 Dec 6Dee Estuary (England and Wales) 3 12 0 4 7 Sep 5Burry Inlet 0 3 3 5 10 Mar 4Fairburn Ings 0 4 3 5 9 Jun 4Newtown Estuary 0 (0) 4 8 4 Feb 4Thames Estuary 5 0 6 0 7 Sep 4Tamar Complex (3) 4 3 1 2 Nov 3

32
LESS
ER B
LAC
K-BA
CKE
D G
ULL
BY
ANN
E CO
TTO
N
In winter, Lesser Black-backed Gull is a widespread species across much of the UK, though absent from upland areas and scarce in northeast Scotland. This hasn’t always been the case, and Bird Atlas 2007–11 showed a remarkable change in the status of this species with increases in range in both the winter and the breeding season. The increase in winter range since the 1981–84 Winter Atlas is particularly notable in Ireland, Wales, southwest England, East Anglia and in Scotland. Much of the expansion has been inland where the ability to exploit a wide range of feeding opportunities and safe places to roost could be among the reasons for the increased tendency to remain to winter in the UK.
The increasing range of Lesser Black-backed Gulls over the last 40 years is not the whole story though. Our wintering populations
comprises breeding birds from the UK, Iceland, the Faeroes and northwest Europe graellsii subspecies and passage migrants of the intermedius subspecies from Denmark, southern Sweden and Atlantic coast of Norway. Small numbers of the Baltic fuscus population also occur.
Through tagging studies and field sightings of colour-marked birds, we have learnt more about the remarkable movements of this species. Whilst many UK breeding birds remain to winter here, others migrate southwards along the western seaboard of continental Europe, most wintering in Iberia, with smaller numbers in western North Africa and West Africa. The UK monthly graph from WeBS shows spring and autumn peaks, highlighting the passage of Lesser Black-backed Gulls through the UK to breeding grounds further north.
The breeding population is being assessed through the ongoing ‘Seabirds Count’ national seabird census, with counts at both coastal and inland sites. The breeding population is also monitored annually at sample sites through the Seabird Monitoring Partnership.
The UK wintering population, as measured through WeBS, shows a 9% decline over the 10 year period 2008/09–2018/19, and a 33% decline over the 25-year period 1993/94–2018/19. Lesser Black-backed Gull is currently Amber-listed in the Birds of Conservation Concern, based on breeding localism and breeding international importance. A winter roost survey is long overdue, the last Winter Gull Roost Survey was in 2003/04–2005/06.
Species Focus–Lesser Black-backed Gull
Focus on... Lesser Black-backed Gull
WeBS trend for Lesser Black-backed Gull in the UK. Green dots = annual index; blue line = smoothed trend.
WeB
S In
dex
0
300
94/95 99/00 04/05 09/10 14/15 19/20
100
200
Monthly indices for Lesser Black-backed Gull in the UK. Green bars = 2019/20; blue line/hatched area = previous five-year mean/range.
Jul Aug Sep Oct Nov Dec Jan Feb Mar Apr May Jun
50
0
100
WeB
S In
dex
150
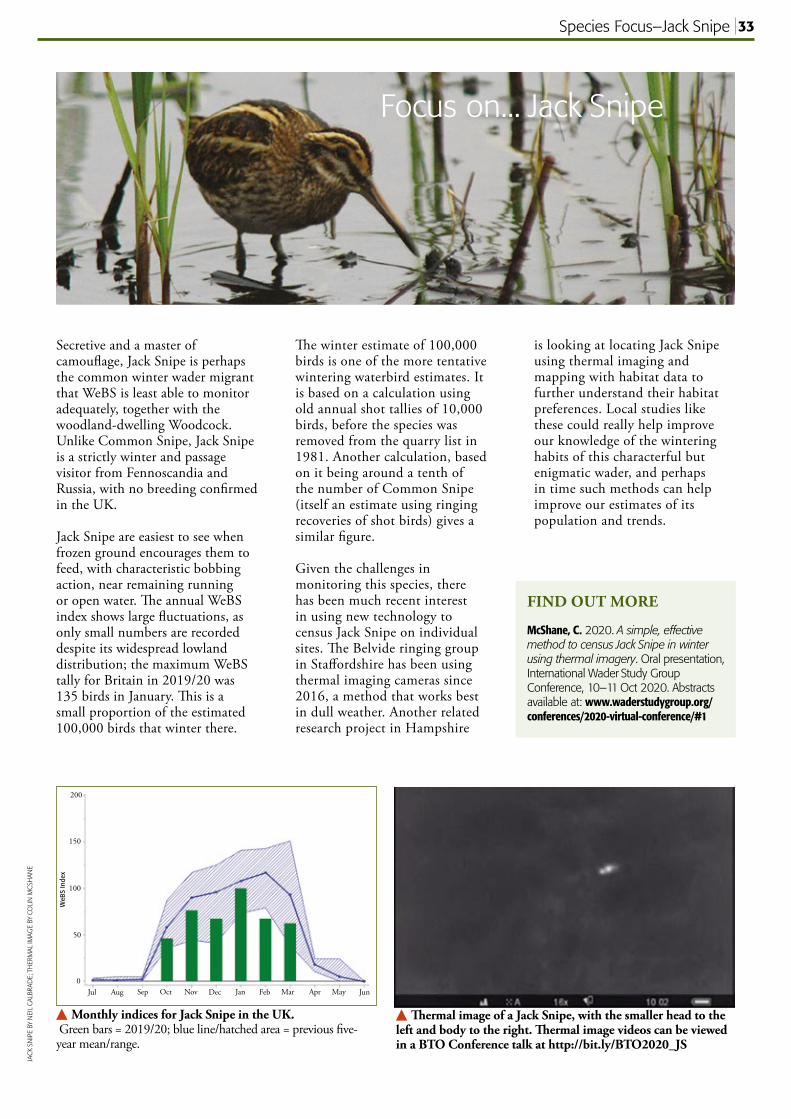
33JA
CK
SNIP
E BY
NEI
L C
ALBR
ADE;
TH
ERM
AL IM
AGE
BY C
OLI
N M
CSH
ANE
Secretive and a master of camouflage, Jack Snipe is perhaps the common winter wader migrant that WeBS is least able to monitor adequately, together with the woodland-dwelling Woodcock. Unlike Common Snipe, Jack Snipe is a strictly winter and passage visitor from Fennoscandia and Russia, with no breeding confirmed in the UK.
Jack Snipe are easiest to see when frozen ground encourages them to feed, with characteristic bobbing action, near remaining running or open water. The annual WeBS index shows large fluctuations, as only small numbers are recorded despite its widespread lowland distribution; the maximum WeBS tally for Britain in 2019/20 was 135 birds in January. This is a small proportion of the estimated 100,000 birds that winter there.
The winter estimate of 100,000 birds is one of the more tentative wintering waterbird estimates. It is based on a calculation using old annual shot tallies of 10,000 birds, before the species was removed from the quarry list in 1981. Another calculation, based on it being around a tenth of the number of Common Snipe (itself an estimate using ringing recoveries of shot birds) gives a similar figure.
Given the challenges in monitoring this species, there has been much recent interest in using new technology to census Jack Snipe on individual sites. The Belvide ringing group in Staffordshire has been using thermal imaging cameras since 2016, a method that works best in dull weather. Another related research project in Hampshire
is looking at locating Jack Snipe using thermal imaging and mapping with habitat data to further understand their habitat preferences. Local studies like these could really help improve our knowledge of the wintering habits of this characterful but enigmatic wader, and perhaps in time such methods can help improve our estimates of its population and trends.
Species Focus–Jack Snipe
Focus on... Jack Snipe
FIND OUT MORE
McShane, C. 2020. A simple, effective method to census Jack Snipe in winter using thermal imagery. Oral presentation, International Wader Study Group Conference, 10–11 Oct 2020. Abstracts available at: www.waderstudygroup.org/conferences/2020-virtual-conference/#1
Monthly indices for Jack Snipe in the UK. Green bars = 2019/20; blue line/hatched area = previous five-year mean/range.
Jul Aug Sep Oct Nov Dec Jan Feb Mar Apr May Jun
50
0
100
200
WeB
S In
dex
150
Thermal image of a Jack Snipe, with the smaller head to the left and body to the right. Thermal image videos can be viewed in a BTO Conference talk at http://bit.ly/BTO2020_JS
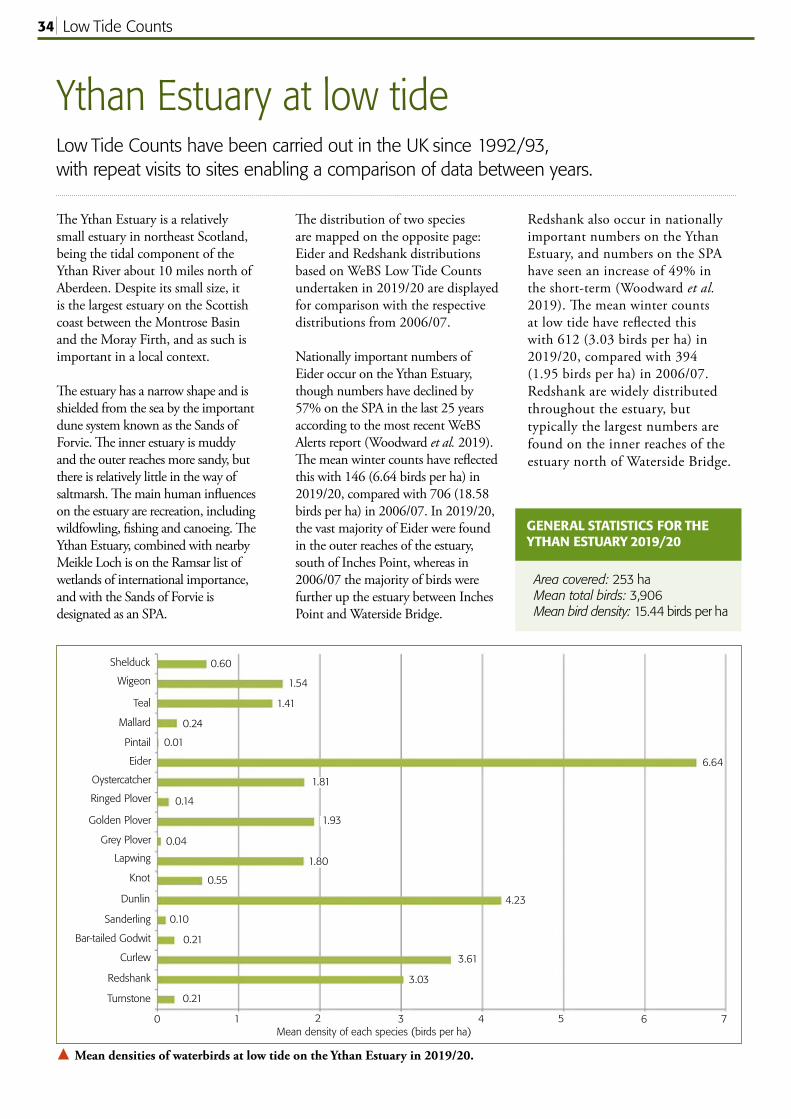
34
Ythan Estuary at low tideLow Tide Counts have been carried out in the UK since 1992/93,with repeat visits to sites enabling a comparison of data between years.
The distribution of two species are mapped on the opposite page: Eider and Redshank distributions based on WeBS Low Tide Counts undertaken in 2019/20 are displayed for comparison with the respective distributions from 2006/07.
Nationally important numbers of Eider occur on the Ythan Estuary, though numbers have declined by 57% on the SPA in the last 25 years according to the most recent WeBS Alerts report (Woodward et al. 2019). The mean winter counts have reflected this with 146 (6.64 birds per ha) in 2019/20, compared with 706 (18.58 birds per ha) in 2006/07. In 2019/20, the vast majority of Eider were found in the outer reaches of the estuary, south of Inches Point, whereas in 2006/07 the majority of birds were further up the estuary between Inches Point and Waterside Bridge.
The Ythan Estuary is a relatively small estuary in northeast Scotland, being the tidal component of the Ythan River about 10 miles north of Aberdeen. Despite its small size, it is the largest estuary on the Scottish coast between the Montrose Basin and the Moray Firth, and as such is important in a local context.
The estuary has a narrow shape and is shielded from the sea by the important dune system known as the Sands of Forvie. The inner estuary is muddy and the outer reaches more sandy, but there is relatively little in the way of saltmarsh. The main human influences on the estuary are recreation, including wildfowling, fishing and canoeing. The Ythan Estuary, combined with nearby Meikle Loch is on the Ramsar list of wetlands of international importance, and with the Sands of Forvie is designated as an SPA.
Mean densities of waterbirds at low tide on the Ythan Estuary in 2019/20.
Area covered: 253 ha Mean total birds: 3,906 Mean bird density: 15.44 birds per ha
GENERAL STATISTICS FOR THE YTHAN ESTUARY 2019/20
Redshank also occur in nationally important numbers on the Ythan Estuary, and numbers on the SPA have seen an increase of 49% in the short-term (Woodward et al. 2019). The mean winter counts at low tide have reflected this with 612 (3.03 birds per ha) in 2019/20, compared with 394 (1.95 birds per ha) in 2006/07. Redshank are widely distributed throughout the estuary, but typically the largest numbers are found on the inner reaches of the estuary north of Waterside Bridge.
Low Tide Counts
Mean density of each species (birds per ha)
Shelduck
Wigeon
Teal
Mallard
Pintail
Oystercatcher
Golden Plover
Grey Plover
Lapwing
Dunlin
Bar-tailed Godwit
Turnstone
Curlew
Redshank
0 2 4 6
0.60
1.54
1.41
0.24
0.01
6.64
1.81
1.93
0.04
1.80
4.23
0.10
3.61
3.03
0.21
Ringed Plover 0.14
Knot 0.55
Sanderling
0.21
7531
Eider

35
Low tide distribution of Eider and Redshank on the Ythan Estuary, for the winters of 2019/20 (red) and 2006/07 (blue).
Eider
EID
ER A
ND
RED
SHAN
K BY
ED
MU
ND
FEL
LOW
ES/B
TOLow Tide Counts
Redshank

36
The Wetland Bird Survey (WeBS) monitors non-breeding waterbirds in the UK in order to provide the principal data on which the conservation of their populations is based. To this end, WeBS has three main objectives:
• to assess the size of non-breeding waterbird populations in the UK;
• to assess trends in their numbers and distribution; and
• to assess the importance of individual sites for waterbirds.
These results also form the basis for informed decision-making by conservation bodies, planners and developers, and contribute to the sustainable use and management of wetlands and their dependent waterbirds. The data and this annual WeBS report also fulfil some of the objectives of relevant international Conventions and Directives to which the UK is a signatory. WeBS also provides data to Wetlands International to assist their function of coordinating and reporting upon waterbird status at an international flyway scale.
WeBS continues the traditions of two long-running count schemes which formed the mainstay of UK waterbird monitoring since 1947.
WeBS Core Counts are carried out at a wide variety of wetlands. Coordinated, synchronous counts are advocated to prevent double-counting or birds being missed. Priority dates are recommended nationally, but due to differences in tidal regimes around the UK, counts take place at some estuaries on other
dates in order to match the most suitable local conditions. Weather and counter availability also sometimes result in counts being undertaken on alternative dates.
In addition, WeBS Low Tide Counts are undertaken on selected estuaries with the aim of identifying key areas used during the low tide period, principally by feeding birds. It also identifies areas not otherwise noted for their importance from data collected during Core Counts which are normally conducted at, or close to, high tide.The success and growth of these count schemes reflects the enthusiasm and dedication of the several thousands of participating volunteer ornithologists. It is largely due to their efforts that waterbird monitoring in the UK is held in such high regard internationally.
Full details of WeBS field and analytical methodologies are available via the WeBS website: www.bto.org/webs
Waterbirds in the UK 2019/20 (comprising this summary report together with numbers and trends available from WeBS Report Online atwww.bto.org/webs-reporting) presents the results of WeBS in 2019/20. Data from other national and local waterbird monitoring schemes, notably the WWT/JNCC/NatureScot Goose & Swan Monitoring Programme, are included where WeBS data alone are insufficient to fulfil specified aims. The annual WeBS report therefore provides a single, comprehensive source of information on waterbird status and distribution in the UK.
WeBS objectives, aims and methods
General Background
DU
NLI
N B
Y SA
RAH
KEL
MAN
/BTO

37
FIND OUT MUCH MORE
Access WeBS Report Online at: www.bto.org/webs-reporting
The Numbers & Trends section features species trends (for the UK and constituent countries) and site tables for all species (with facility to filter by country, county and habitat), alongside sections on NEWS, Low Tide Counts, Site Totals and WeBS Alerts. There is also a Help section containing tutorials, to help you make the most of the resource.
This annual report, Waterbirds in the UK 2019/20, combines an extensive online data resource, WeBS Report Online, with this summarised written report.
The WeBS Report Online interface provides access to the latest tables of WeBS Core Count data at site and species level via the ‘Numbers and Trends’ and ‘Site Totals’ tabs, together with low tide summaries and distribution density maps for estuaries via the ‘Low Tide Counts’ tab. Results from the Non-Estuarine Waterbird Survey (NEWS) are in the ‘NEWS’ tab and WeBS Alerts in the ‘Alerts’ tab.
Improvements were made to the interface in October 2020 to speed up page loading, improve navigation and filtering and to enable downloading of data tables and plots in the ‘Numbers and Trends’ section.
In the ‘Low Tide’ section, up to four interactive distribution density maps can be viewed simultaneously (see page 7) and maps can be viewed for all waterbird species recorded during the survey. Estuaries can be chosen from the ‘Location’ menu and the survey year from the ‘Low Tide Count year’ menu. Selecting a species will display a map with count sectors separated into intertidal, subtidal and non-tidal habitats and random dots indicating the count of birds in the sector.
In the ‘Numbers and Trends’ section, searching for a site of interest from the menu allows users to explore which species have ever been recorded at the site. Users can view and download the peak numbers of each species recorded at the site throughout the year, the five-year mean peak count and the month in which the peak count was recorded. The table can be sorted alphabetically or taxonomically by species or by the peak counts. By scrolling back through the years, contemporary counts and associated five-year averages can be compared with historical counts at the site.
The ‘Site Totals’ tab summarises waterbird aggregations at WeBS sites. The default view shows a table of sites with 1,000 or more birds and includes supplementary counts but excludes gulls and terns and non-native species, as is standard in the Principal Sites table (see page 14–15). Users can choose to view all sites, including those with fewer than 1,000 birds, for a county or country and optionally include gulls/terns, non-native species and supplementary counts. Selecting a site name brings up a list in the right-hand panel of species at the site where counts exceed national or international importance thresholds.
For those looking for information on a particular species (or biogeographic population) of waterbird, every species ever recorded by WeBS features on its own page, with every site where the species has been recorded listed. As well as offering the functionality to sort sites in tables either alphabetically, by annual peak, or by five-year average, the interface also allows the user to filter sites by country, county and/or habitat. Annual and monthly trend plots for the UK and constituent countries are shown (where applicable) and the data and plots downloaded. There are also links to other sources of web-based information. Supplementary counts can be included or excluded in the tables. For reference purposes, data from reports for previous years can be accessed by choosing the appropriate WeBS year from the ‘Waterbirds in the UK’ drop-down menu.
In the ‘NEWS’ section, users can view maps of counts and coverage for a selected species occurring in a selected region. Tables of regional counts from NEWS and estimates for non-estuarine coastal habitats within the region are given for each species. Results are available for the Winter Shorebird Count and all three NEWS surveys.
WeBS Report Online
Explore species trends, peak counts and more at www.bto.org/webs-reporting
Online Reporting Interface

38
208WeBS Data Requests in 2019/20
Uses of WeBS data 2019/20
More information about the WeBS Data Request Service is available fromwww.bto.org/webs-data where you can see coverage by WeBS of different sites, check data request charges, and view examples of the data that can be provided.
With the UK host to internationally important numbers of over-wintering waterbirds, one of the principal aims of WeBS is to provide data to facilitate their conservation. Indeed, there have been many high-profile examples over the years in which WeBS data have proved to be fundamental in securing the protection of important wetland sites.
A summary of site-based WeBS information is presented on the WeBS Report Online and available for use with an Open Government Licence. Data at a finer level (both spatial and temporal) are available in a user-friendly format through a bespoke WeBS Data Request. We recommend that WeBS-based information that is to be incorporated into site evaluation work, such as Environmental Impact Assessments (EIAs), should be sourced through a WeBS Data Request.
The graph shows the number of Data Requests processed by the WeBS office each year since 2009/10. These are from a range of stakeholder groups, including country conservation agencies, environmental consultancies, academic researchers and bird clubs. Summarised WeBS data are also provided to several online environmental data portals.
January WeBS data are supplied to Wetlands International for inclusion in the International Waterbird Census, and summaries are used in outputs such as waterbird population estimates, and AEWA Conservation Status reports.
The WeBS Partnership is keen to encourage WeBS data use within environmental research. A number of scientific papers and reports that have used WeBS data in recent years are referenced within the pages of this annual report, and there is of course an extensive
suite of other research questions relating to waterbird ecology and wider wetland management issues to which WeBS data would lend themselves, at both national and international scales.
Academic researchers, students and potential collaborators interested in using WeBS data can email the WeBS office at [email protected] for more information.
WeBS Data Requests 2009/10 to 2019/20.
250
200
150
100
50
0
Num
ber o
f req
uest
s
2019/20
Commercial Counter/Research/EducationWeBS Partner
WeBS Data Requests
WeBS DATA REQUESTS
2010/11 2015/16 2016/17 2017/182011/12 2013/142009/10 2012/13 2014/15 2018/19

39
Selected further reading Recent studies that have used WeBS data
Frost, T.M., Calbrade, N.A., Birtles, G.A., Mellan, H.J., Hall, C., Robinson, A.E., Wotton, S.R., Balmer, D.E. & Austin, G.E. 2020. Waterbirds in the UK 2018/19: The Wetland Bird Survey. BTO/RSPB/JNCC. Thetford.
Burke, B., Lewis, L.J., Fitzgerald, N., Frost, T., Austin, G. & Tierney, T.D. 2018. Estimates of waterbird numbers wintering in Ireland, 2011/12–2015/16. Irish Birds 41: 1–12.
Burns, F., Eaton, M.A., Balmer, D.E., Banks, A., Caldow, R., Donelan, J.L., Douse, A., Duigan, C., Foster, S., Frost, T., Grice, P.V., Hall, C., Hanmer, H.J., Harris, S.J., Johnstone, I., Lindley, P., McCulloch, N., Noble, D.G., Risely, K., Robinson, R.A. & Wotton, S. 2020. The State of the UK's Birds 2020. RSPB, BTO, WWT, DAERA, JNCC, NatureScot, NE and NRW.
Eaton, M.A., Aebischer, N.J., Brown, A.F., Hearn, R.D., Lock, L., Musgrove, A.J., Noble, D.G., Stroud, D.A. & Gregory, R.D. 2015. Birds of Conservation Concern 4: the population status of birds in the UK, Channel Islands and Isle of Man. British Birds 108: 708–746.
Frost, T.M., Austin, G.E., Hearn, R.D., McAvoy, S.G., Robinson, A.E., Stroud, D.A., Woodward, I.D. & Wotton, S.R. 2019. Population estimates of wintering waterbirds in Great Britain. British Birds 112: 130–145.
Gaget, E., Pavón-Jordán, D., Frost ,T. & 47 co-authors. 2020. Benefits of protected areas for nonbreeding waterbirds adjusting their distributions under climate warming. Conservation Biology. doi:10.1111/cobi.13648.
Humphreys, E.M., Austin, G.E., Frost, T.M., Mellan, H.J., Boersch-Supan, P., Burton, N.H.K & Balmer, D.E. 2021. Wader populations on the United Kingdom’s open coast: results of the 2015/16 Non-Estuarine Waterbird Survey (NEWS III) and a review of population trends. Bird Study 67 (3): 371–384.
Marchowski, D, Jankowiak, Ł, Ławicki, Ł, Wysocki, D, Calbrade, N.A. & 15 others. 2020. Effectiveness of the European Natura 2000 network to sustain a specialist wintering waterbird population in the face of climate change. Scientific Reports 10: 20286 (2020).
van Roomen, M., Agblonon, G., Langendoen, T., Citegetse, G., Diallo, A. Y., Gueye, K., van Winden, E. & Luerssen, G. (eds.). 2020. Simultaneous January 2020 waterbird census along the East Atlantic Flyway: National Reports. Wadden Sea Flyway Initiative p/a Common Wadden Sea Secretariat, Wilhelmshaven, Germany, Wetlands International, Wageningen, The Netherlands, BirdLife International, Cambridge, United Kingdom.
Stroud, D.A., Bainbridge, I.P., Maddock, A., Anthony, S., Baker, H., Buxton, N., Chambers, D., Enlander, I., Hearn, R.D., Jennings, K.R, Mavor, R., Whitehead, S. & Wilson, J.D. (eds). 2016. The status of UK SPAs in the 2000s: the third network review. JNCC, Peterborough.
Woodward, I., Aebischer, N., Burnell, D., Eaton, M., Frost, T., Hall, C., Stroud, D. & Noble, D. 2020. Population estimates of birds in Great Britain and the United Kingdom. British Birds 113: 69–104.
Woodward, I.D., Frost, T.M., Hammond, M.J., & Austin, G.E. 2019. Wetland Bird Survey Alerts 2016/2017: Changes in numbers of wintering waterbirds in the Constituent Countries of the United Kingdom, Special Protection Areas (SPAs), Sites of Special Scientific Interest (SSSIs) and Areas of Special Scientific Interest (ASSIs). BTO Research Report 721. BTO, Thetford.
Woodward, I.D., Massimino, D., Hammond, M.J., Barber, L., Barimore, C., Harris, S.J., Leech, D.I., Noble, D.G., Walker, R.H., Baillie, S.R. & Robinson, R.A. (2020). BirdTrends 2020: trends in numbers, breeding success and survival for UK breeding birds. Research Report 732. BTO, Thetford. www.bto.org/birdtrends
WALESAnglesey Ian SimsBreconshire Andrew KingBurry Inlet Lyndon JefferyCaernarfonshire Rhion PritchardCaernarfonshire (Foryd Bay) Simon Hugheston-RobertsCarmarthenshire VACANT (now Alan Seago)Ceredigion (incl Dyfi Estuary) Russell JonesClwyd (coastal) Henry Cook (now VACANT)Clwyd (inland) VACANTEast Glamorgan Daniel Jenkins-JonesGwent (excl Severn Estuary) Al VenablesMerioneth (estuaries) Jim DustowMerioneth (other sites) Jim DustowMontgomeryshire Jane KelsallPembrokeshire Annie HaycockRadnorshire Peter JenningsSevern Estuary (Wales) Al VenablesWest Glamorgan Lyndon Jeffery
NORTHERN IRELANDAntrim (Larne Lough) Doreen HilditchAntrim (other sites) Adam McClureArmagh (excl Loughs Neagh and Beg) Stephen HewittBelfast Lough Shane WolseyDown (Carlingford Lough) Jenny Lynch (now Aiobheann Morrison)Down (Dundrum Bay) Patrick Lynch (now Andrew Crory)Down (other sites) Shane Wolsey (now Kez Armstrong)Down (Outer Ards) NIEADown (South Down Coast) Shane Wolsey (now Kez Armstrong)Down (Strangford Lough) Kerry MackieFermanagh Michael StinsonLondonderry (Bann Estuary) Hill Dick (now John Clarke)Londonderry (Lough Foyle) Matthew TicknerLondonderry (other sites) Shane Wolsey (now Stephen Hewitt)Loughs Neagh and Beg NIEATyrone (excl Loughs Neagh and Beg) Michael Stinson (now Ciara Laverty)
CHANNEL ISLANDSAlderney Alderney Wildlife Trust EcologistGuernsey Coast Mary SimmonsJersey (inland) VACANTJersey Coast Roger Noel
ISLE OF MAN
Isle of Man David Kennett
We would be grateful for help organising WeBS in areas currently without a Local Organiser (marked VACANT). If you live in one of these areas and would be interested in taking on the role, please let us know. Email: [email protected]
In 2019/20, the WeBS Local Organiser Advisory Committee (WeBS LOAC) comprised Allan Brown, Eve Tigwell, Andrew King, Chris Gunn, Brian Moore, Colin Wells, Bob Swann and Kerry Mackie. Many thanks to them for representing the wider LO network. Further information about the WeBS LOAC can be found at: www.bto.org/webs/loac
Continued from back page
WeBS Local Organisers in 2019/20
Further information, including site tables and trends for all the regular WeBS species, is available in the online report at: www.bto.org/webs-reporting
WeBS ONLINE REPORT
WeBS Local Organisers

We wish to thank all surveyors and Local Organisers for making WeBS the success it is today. Unfortunately space does not permit all observers to be acknowledged individually, but we would especially like to credit the Local Organisers for their efforts.
SPECIAL THANKS
British Trust for OrnithologyThe NunneryThetfordNorfolkIP24 2PU
01842 [email protected]/webs
WeBS Local Organisers in 2019/20
ISBN 978-1-912642-25-0 ISSN 1755-6384
ENGLANDAvon (excl Severn Estuary) Rupert HigginsBedfordshire Richard BashfordBerkshire Sean Murphy
Buckinghamshire (North) Martin Routledge
Buckinghamshire (South) VACANTCambridgeshire (incl Huntingdonshire) Bruce MartinCambridgeshire (Nene Washes) Charlie KitchinCambridgeshire (Ouse Washes) Paul HarringtonCheshire (North) Phil HampsonCheshire (South) Paul MillerCleveland (excl Tees Estuary) Chris SharpCleveland (Tees Estuary) Adam JonesCornwall (excl Tamar Complex) Derek JulianCornwall (Tamar Complex) Charles NodderCotswold Water Park Ben Welbourn (now VACANT)Cumbria (Duddon Estuary) Colin GayCumbria (excl estuaries) Dave ShackletonCumbria (Irt/Mite/Esk Estuary) Peter Jones (now Dave Shackleton)Dee Estuary Colin WellsDerbyshire VACANT (now Phil Hampson)Devon (other sites) Pete ReayDevon (Exe Estuary)Devon (Taw/Torridge Estuary)
Penny Avant (now Martin Overy)Tim Davis (now Chris Dee)
Dorset (excl estuaries) Malcolm BalmerDorset (Poole Harbour) Paul MortonDorset (Radipole and Lodmoor) Stephen HalesDorset (The Fleet and Portland Harbour) Steve GrovesDurham VACANT (now Anne Donnelly)Essex (Crouch/Roach Estuaries and South Dengie)
Stephen Spicer
Essex (Hamford Water) Leon WoodrowEssex (North Blackwater) John Thorogood (now John Fell)Essex (other sites) Anthony HarbottEssex (South Blackwater & North Dengie) Anthony HarbottGloucestershire Michael SmartGreater London (excl Thames Estuary) Andrew Moon (now Rob Innes)Greater Manchester Tim WilcoxHampshire (Avon Valley) John ClarkHampshire (estuaries/coastal) John ShillitoeHampshire (excl Avon Valley) Keith WillsHerefordshire Chris RobinsonHertfordshire Jim TerryHumber Estuary (inner South) Keith ParkerHumber Estuary (mid South) Barbara MooreHumber Estuary (North) Nick CuttsHumber Estuary (outer South) John WalkerIsle of Wight Jim BaldwinKent (Dungeness area) David WalkerKent (East) VACANTKent (Medway Estuary)) Bob KnightKent (Pegwell Bay) Steffan WaltonKent (Swale Estuary) Brian Watmough
Kent (Thames Estuary – Hoo) Murray OrchardKent (West) VACANTLancashire (East Lancs and Fylde) Stephen DunstanLancashire (North inland) Peter MarshLancashire (Ribble Estuary) Ken AbramLancashire (River Lune) Jean RobertsLancashire (West inland) VACANT (now Phil Hampson)Lee Valley Cath PatrickLeicestershire and Rutland (excl Rutland Water)
Brian Moore
Leicestershire and Rutland (Rutland Water) Tim AppletonLincolnshire (North inland) Chris GunnLincolnshire (South inland) Bob TitmanMerseyside (Alt Estuary) Steve WhiteMerseyside (inland) VACANT (now Phil Hampson)Merseyside (Mersey Estuary) Dermot SmithMorecambe Bay (North) Peter Hearn (now Mike Douglas)Morecambe Bay (South) Jean RobertsNorfolk (Breydon Water) Jim RoweNorfolk (excl estuaries) Tim Strudwick (now Mark Clay)Norfolk (North Nofolk Coast) Neil Lawton
Northamptonshire (excl Nene Valley) Barrie GalpinNorthamptonshire (Nene Valley) Steve BrayshawNorthumberland (coastal) Kathy EvansNorthumberland (inland) Tim DaleyNorthumberland (Lindisfarne) Andrew CraggsNottinghamshire David ParkinOxfordshire (North) Sandra BletchlyOxfordshire (South) Ben CarpenterSevern Estuary (England) Harvey Rose
Shropshire Michael WallaceSolway Estuary (inner South) David BlackledgeSolway Estuary (outer South) Dave ShackletonSomerset (other sites) Eve TigwellSomerset (Somerset Levels) Eve TigwellStaffordshire Scott PetrekSuffolk (Alde Complex) Ian CastleSuffolk (Alton Water) John GlazebrookSuffolk (Blyth Estuary) Will RussellSuffolk (Deben Estuary) Nick MasonSuffolk (Orwell Estuary) Mick WrightSuffolk (other sites) Alan MillerSuffolk (Stour Estuary) Rick VonkSurrey Penny WilliamsSussex (Chichester Harbour) Peter HughesSussex (other sites) Helen Crabtree & Dave
BoddingtonThames Estuary (Foulness) Chris LewisThe Wash Jim ScottWarwickshire Matthew GriffithsWest Midlands Nick LewisWiltshire Claire Young (now Jenny Stunnell)Worcestershire Andrew Warr (now Chris North)Yorkshire (East and Scarborough) Jim MorganYorkshire (Harrogate and Yorkshire Dales) VACANTYorkshire (Huddersfield/Halifax area) VACANTYorkshire (Leeds area) Paul MorrisYorkshire (South) Grant BiggYorkshire (Wakefield area) Peter Smith
SCOTLANDAberdeenshire Moray SouterAngus (excl Montrose Basin) VACANT (now Jonathan Pattullo)Angus (Montrose Basin) Anna CowieArgyll Mainland Nigel ScrivenArran Jim CasselsAyrshire Dave GrantBadenoch and Strathspey Keith Duncan (now VACANT)Borders Andrew BramhallBute Ian HopkinsCaithness Sinclair Manson
Central (excl Forth Estuary) Neil BielbyClyde Estuary John ClarkDumfries and Galloway (Auchencairn and Orchardtown Bays)
Euan MacAlpine
Dumfries and Galloway (Fleet Bay) David HawkerDumfries and Galloway (Loch Ryan) Paul CollinDumfries and Galloway (other sites) Andy RichesDumfries and Galloway (Rough Firth) Andy RichesDumfries and Galloway (Wigtown Bay) Paul CollinFife (excl estuaries) Allan BrownFife (Tay and Eden Estuaries) Norman ElkinsForth Estuary (inner) Michael BellForth Estuary (outer North) Alastair Inglis (now VACANT)Forth (outer South) Duncan PriddleGlasgow/Renfrewshire/Lanarkshire John ClarkHarris and Lewis Yvonne BentingIslay, Jura and Colonsay David WoodIsle of Cumbrae VACANTLochaber Kirstie & Callum RossLothian (excl estuaries) Allan BrownLothian (Tyninghame Estuary) Tara SykesMoray and Nairn (inland) David LawMoray and Nairn (Lossie Estuary) Bob ProctorMoray Basin Coast Bob SwannMull Nigel ScrivenOrkney Sarah MoneyPerth and Kinross (excl Loch Leven) Michael BellPerth and Kinross (Loch Leven) Jeremy Squire (now Simon
Ritchie)Shetland Paul HarveySkye and Lochalsh Jonathan JonesSolway Estuary (North) Andy RichesSutherland (excl Moray Basin) VACANTTiree and Coll John BowlerUists and Benbecula Yvonne BentingWest Inverness/Wester Ross Andy Douse
in associationwith