Water vapor depletion in the DMT Continuous Flow CCN...
36
Water vapor depletion in the DMT Continuous Flow CCN Chamber: effects on supersaturation and droplet growth. Journal: Aerosol Science & Technology Manuscript ID: AST-MS-2010-183.R1 Manuscript Type: Original Manuscript Date Submitted by the Author: n/a Complete List of Authors: Lathem, Terry; Georgia Inst of Technology, School of Earth and Atmos Sciences Nenes, Athanasios; Georgia Inst of Technology, School of Earth and Atmos Sciences Keywords: aerosol-cloud interactions, cloud condensation nuclei (CCN), measurement Editorial Office phone: 612-827-2421 http://mc.manuscriptcentral.com/tandf/ast Aerosol Science & Technology
Transcript of Water vapor depletion in the DMT Continuous Flow CCN...

Water vapor depletion in the DMT Continuous Flow CCN
Chamber: effects on supersaturation and droplet growth.
Journal: Aerosol Science & Technology
Manuscript ID: AST-MS-2010-183.R1
Manuscript Type: Original Manuscript
Date Submitted by the Author:
n/a
Complete List of Authors: Lathem, Terry; Georgia Inst of Technology, School of Earth and Atmos Sciences Nenes, Athanasios; Georgia Inst of Technology, School of Earth and Atmos Sciences
Keywords: aerosol-cloud interactions, cloud condensation nuclei (CCN), measurement
Editorial Office phone: 612-827-2421 http://mc.manuscriptcentral.com/tandf/ast
Aerosol Science & Technology

1
Water vapor depletion in the DMT Continuous Flow CCN
Chamber: effects on supersaturation and droplet growth.
Terry L. Lathem
School of Earth & Atmospheric Sciences, Georgia Institute of Technology, Atlanta, GA
30332 ([email protected])
Athanasios Nenes*
Schools of Earth & Atmospheric Sciences and Chemical & Biomolecular Engineering,
Georgia Institute of Technology, Atlanta, GA 30332 ([email protected])
Short title: SUPERSATURATION DEPLETION IN THE CFSTGC
*corresponding author
Page 1 of 35
Editorial Office phone: 612-827-2421 http://mc.manuscriptcentral.com/tandf/ast
Aerosol Science & Technology
123456789101112131415161718192021222324252627282930313233343536373839404142434445464748495051525354555657585960
2
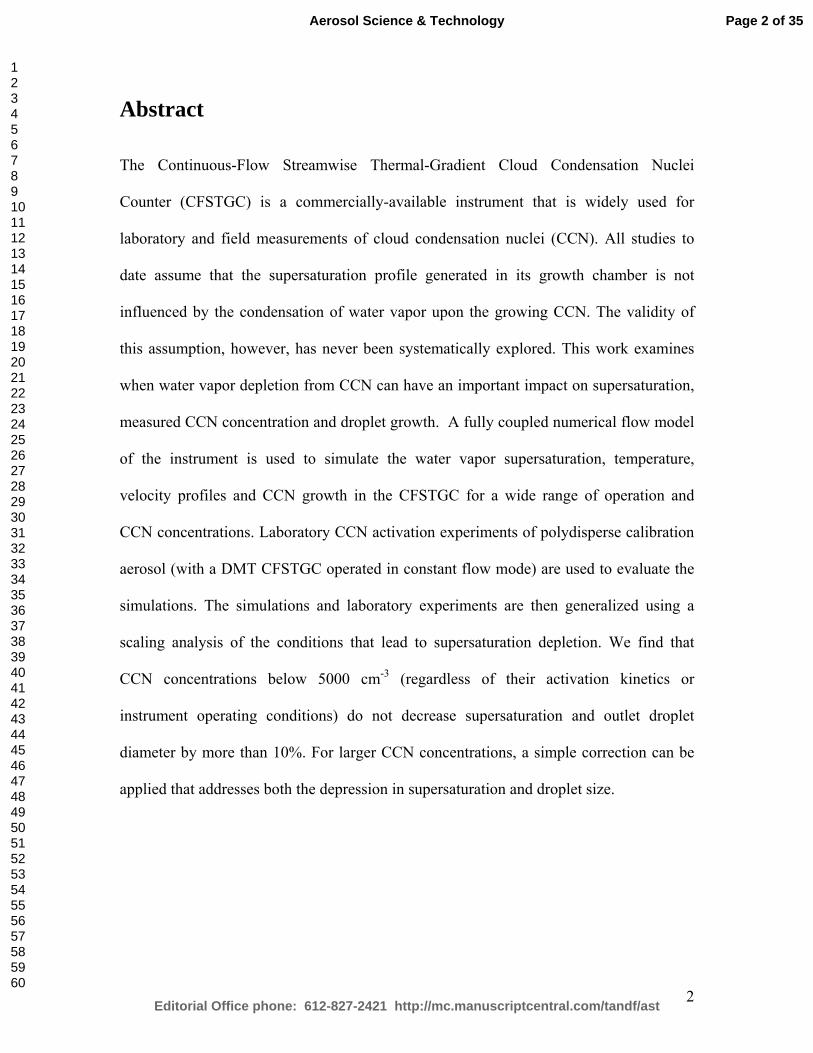
Abstract
The Continuous-Flow Streamwise Thermal-Gradient Cloud Condensation Nuclei
Counter (CFSTGC) is a commercially-available instrument that is widely used for
laboratory and field measurements of cloud condensation nuclei (CCN). All studies to
date assume that the supersaturation profile generated in its growth chamber is not
influenced by the condensation of water vapor upon the growing CCN. The validity of
this assumption, however, has never been systematically explored. This work examines
when water vapor depletion from CCN can have an important impact on supersaturation,
measured CCN concentration and droplet growth. A fully coupled numerical flow model
of the instrument is used to simulate the water vapor supersaturation, temperature,
velocity profiles and CCN growth in the CFSTGC for a wide range of operation and
CCN concentrations. Laboratory CCN activation experiments of polydisperse calibration
aerosol (with a DMT CFSTGC operated in constant flow mode) are used to evaluate the
simulations. The simulations and laboratory experiments are then generalized using a
scaling analysis of the conditions that lead to supersaturation depletion. We find that
CCN concentrations below 5000 cm-3 (regardless of their activation kinetics or
instrument operating conditions) do not decrease supersaturation and outlet droplet
diameter by more than 10%. For larger CCN concentrations, a simple correction can be
applied that addresses both the depression in supersaturation and droplet size.
Page 2 of 35
Editorial Office phone: 612-827-2421 http://mc.manuscriptcentral.com/tandf/ast
Aerosol Science & Technology
123456789101112131415161718192021222324252627282930313233343536373839404142434445464748495051525354555657585960

3
1. Introduction The Continuous-Flow Streamwise Thermal Gradient Cloud Condensation Nuclei (CCN)
Chamber [CFSTGC; Roberts and Nenes, 2005] and its commercialization by Droplet
Measurement Technologies [Lance et al., 2006; Rose et al., 2008] has enabled large
strides in understanding and parameterizing the CCN activity of atmospheric aerosol.
This is in large part due to the flexibility and fast time response of the instrument, which
allows its use in a number of configurations to complement aerosol and cloud studies.
Used as a “counter” in constant flow mode [e.g., Roberts and Nenes, 2005; Lance et al.,
2006; Rose et al., 2008] or as a “spectrometer” in scanning flow mode [Moore et al.,
2009], it provides the total concentration of CCN as a function of supersaturation. When
coupled with a differential mobility analyzer (DMA) operated in voltage-stepping [e.g.,
Lance, 2007; Petters et al., 2009; Rose et al., 2010] or voltage-scanning mode [Moore et
al., 2010], size-resolved CCN measurements enables the parameterization of composition
impacts on cloud droplet formation [Rose et al., 2010; Petters et al., 2009; Petters and
Kreidenweis, 2007; Wex et al., 2007; Padró et al., 2007; Lance, 2007; Asa-Awuku et al.,
2010], the characterization of chemical ageing and mixing state of aerosol [Roberts et al,
2010; Cubison et al., 2008; Kuwata et al., 2008; Lance, 2007], and provide insight on the
molar volume and surfactant characteristics of the water-soluble carbonaceous aerosol
fraction [e.g., Padró et al., 2007; Engelhart et al., 2008; Asa-Awuku et al., 2009, 2010].
The CFSTGC has also been used to study the activation kinetics of ambient CCN, using
the final activated CCN drop size at the end of the growth column as the metric of CCN
growth rate. One approach, Threshold Droplet Growth Analysis [TDGA; Engelhart et al.,
2008; Sorooshian et al., 2008; Bougiatioti et al., 2009; Asa-Awuku et al., 2009; Lance et
Page 3 of 35
Editorial Office phone: 612-827-2421 http://mc.manuscriptcentral.com/tandf/ast
Aerosol Science & Technology
123456789101112131415161718192021222324252627282930313233343536373839404142434445464748495051525354555657585960

4
al., 2009, Murphy et al., 2009] uses a “reference” critical supersaturation - droplet size
curve to define the minimum size of droplets that are produced from rapidly-activating
CCN (such as (NH4)2SO4 and NaCl). If ambient CCN produce droplets that lie below the
reference curve (i.e., produce smaller droplets than the reference at a given
supersaturation), the ambient CCN are then said to exhibit slower activation kinetics than
the reference. If kinetic delays are detected, then knowledge of the aerosol size
distribution and hygroscopicity can then be combined with a numerical model of the
instrument to parameterize the slow activation kinetics in terms of a water-vapor uptake
coefficient [e.g., Asa-Awuku et al., 2009] or a dissolution timescale [e.g., Chuang et al.,
2006]. When size-resolved CCN measurements are carried out, the observed droplet
distribution at the exit of the chamber can be inverted (using an instrument model) to
provide distributions of kinetic parameters [Ruehl et al., 2008, 2009] which provides
particularly powerful insight on the kinetic heterogeneity of atmospheric CCN.
A basic assumption in all studies using the CFSTGC is that the water vapor field in the
growth chamber is not affected by the condensation of water onto the growing CCN.
While this is generally a good assumption when the concentration of CCN is low (e.g.,
when size-resolved CCN experiments using a DMA are carried out), the extent of these
depletion effects at higher CCN concentrations have not been systematically quantified to
date. This is especially important for CCN studies in polluted environments (or other
conditions of high CCN). Water vapor depletion effects can also affect the final activated
droplet size, which can bias studies of activation kinetics carried out with the CFSTGC.
This study aims at understanding and quantifying water vapor depletion effects on
Page 4 of 35
Editorial Office phone: 612-827-2421 http://mc.manuscriptcentral.com/tandf/ast
Aerosol Science & Technology
123456789101112131415161718192021222324252627282930313233343536373839404142434445464748495051525354555657585960

5
supersaturation and droplet growth in the CFSTGC using a comprehensive combination
of instrument theoretical analysis and laboratory activation experiments.
2. Theory of water vapor depletion effects We first proceed with a simple scaling analysis to determine when water vapor depletion
in the instrument can impact supersaturation and droplet size at the exit of the chamber.
For this, we first determine the “zero CCN” limit of supersaturation and droplet growth
(corresponding to very small CCN concentrations flowing through the instrument). The
perturbation about the “zero CCN” limit is then determined as a function of chamber
CCN concentration (and other relevant variables, such as flow rate and streamwise
temperature gradient) to express depletion effects. In the analysis, we assume that air
flows with a total rate Q through the growth chamber of radius R and wall temperature
gradient G. We also assume that supersaturation depletion is primarily from
condensational loss of water vapor to the CCN; the release of latent heat has a second
order impact on supersaturation (numerical simulations in section 3 confirm this).
Depletion effects on supersaturation
The saturation ratio, s
PSP
= , of a fluid “material point” flowing along the centerline of
the chamber (P, Ps are the partial and saturation pressure of water, respectively) can
change over time as follows:
2
1 1s s
s s s s
dP dPdS d P dP P dP Sdt dt P P dt P dt P dt dt
⎛ ⎞ ⎡ ⎤= = − = −⎜ ⎟ ⎢ ⎥⎣ ⎦⎝ ⎠ (1)
where ddt denotes the material (or Lagrangian) derivative of a material point property.
Equation (1) expresses the change in saturation ratio from fluctuations in water vapor
Page 5 of 35
Editorial Office phone: 612-827-2421 http://mc.manuscriptcentral.com/tandf/ast
Aerosol Science & Technology
123456789101112131415161718192021222324252627282930313233343536373839404142434445464748495051525354555657585960

6
concentration (P) and temperature (Ps). From the chain rule, s sdP dP dT dzdt dT dz dt
= ; assuming
dT Gdz
= , dzdt
is the average flow velocity 2~ QRπ
[Roberts and Nenes, 2005], and,
2s v s
g
dP H PdT R T
∆= from the Clausius-Clapeyron Equation (where T is the temperature and
vH∆ , Rg are the enthalpy of evaporation and specific gas constant for water, respectively)
we obtain:
2 2s v s
g
dP H P QGdt R T Rπ
∆= (2)
Substitution of Eq. (2) into Eq. (1) gives:
2 2
1 v s
s g
H PdS dP QG Sdt P dt R T Rπ
⎡ ⎤∆= −⎢ ⎥
⎢ ⎥⎣ ⎦ (3)
dPdt
can be expressed as the sum of water vapor supply from transport, S , and
condensational loss, C , from the activated CCN:
2 2
1 v s
s g
H PdS QS C G Sdt P R T Rπ
⎡ ⎤∆= − −⎢ ⎥
⎢ ⎥⎣ ⎦ (4)
When the concentration of CCN, N , approaches zero, then 0C → ; assuming the flow
field is also developed, 0dSdt
and Equation (4) becomes:
2 2v s
og
H P QS G SR T Rπ∆
= (5)
Page 6 of 35
Editorial Office phone: 612-827-2421 http://mc.manuscriptcentral.com/tandf/ast
Aerosol Science & Technology
123456789101112131415161718192021222324252627282930313233343536373839404142434445464748495051525354555657585960

7
where So denotes the maximum (or “effective”) saturation ratio in the instrument for
“zero CCN” conditions (determined from instrument calibration; Section 4).
S is controlled by the transport of water vapor from the chamber walls, and should not
depend on N . Hence, Equation (5) can be substituted into (4) to give the general
supersaturation depletion equation:
( )2 2v
og s
H GQdS CS Sdt R R T Pπ
∆= − − (6)
If S along a streamline is assumed to be in a dynamical steady-state, 0dSdt
. With this
and expressing the saturation ratio in terms of supersaturation (S = s+1 and So = so+1),
Equation (6) becomes:
2 2
go
v s
R R Ts s C
H GQPπ
= −∆
(7)
Equation (7) expresses the supersaturation depletion (in the developed flow region of the
chamber) from the condensational growth of activated CCN.
Depletion effects on droplet size at the exit of the growth chamber
The average size of activated CCN, Dp, at the exit of the growth chamber (which
experimentally is measured in the optical particle counter of the CFSTGC) is taken as the
characteristic diameter for expressing droplet size reduction in our analysis. Dp can be
obtained from the integration of the droplet growth equation [Seinfeld and Pandis, 2006]
over the particle residence time in the instrument [Roberts and Nenes, 2005]:
2 2 2 ( )p cD D s t dtτ
= + Γ∫ (8)
Page 7 of 35
Editorial Office phone: 612-827-2421 http://mc.manuscriptcentral.com/tandf/ast
Aerosol Science & Technology
123456789101112131415161718192021222324252627282930313233343536373839404142434445464748495051525354555657585960

8
where cD , τ are the characteristic critical wet diameter and the residence time of the
CCN in the instrument, respectively. s(t) denotes the streamwise supersaturation profile
that particles are exposed to while flowing in the growth chamber. Γ is a growth
parameter that depends on droplet size and the water vapor mass transfer coefficient [e.g.,
Seinfeld and Pandis, 2006; Nenes and Seinfeld, 2003].
Assuming Equation (7) applies at every point in the axial direction, it can be introduced
into (8) to give:
2 2
2 2 2 ( ) 2 gp c o
v s
R R TD D s t dt Cdt
H GQPτ τ
π= + Γ − Γ
∆∫ ∫ (9)
where so(t) denotes the supersaturation profile at “zero CCN” concentration
(corresponding to the instrument “steady-state” supersaturation; Roberts and Nenes,
2005; Lance et al., 2006).
The average droplet size at “zero CCN” concentration, 1/2
2 2po c oD D s dtτ
⎛ ⎞= + Γ⎜ ⎟⎝ ⎠
∫ , is given
by Equation (9) for 0C → . When higher concentrations of CCN flow in the chamber,
water vapor depletion leads to a lower s, hence lower Dp than Dpo:
2 2
2 2 2 gp po
v s
R R TD D Cdt
H GQPτ
π= − Γ
∆∫ (10)
Simplified expressions for condensation effects on s, Dp
Equations (7) and (10) give the impact of CCN growth on supersaturation and droplet
size at the exit of the growth chamber; more convenient forms can be derived if C is
explicitly written in terms of Dp, N and Γ . Assuming that the droplets formed can be
Page 8 of 35
Editorial Office phone: 612-827-2421 http://mc.manuscriptcentral.com/tandf/ast
Aerosol Science & Technology
123456789101112131415161718192021222324252627282930313233343536373839404142434445464748495051525354555657585960

9
divided into n classes of concentration Ni and wet diameter Dpi (that increases in the
streamwise direction), C can be expressed at a given point in the flow chamber as
* *
3 2
6 2piw w
i pi i pin nw w
dDR T R TdP dC N D N Ddt M dt M dt
ρ ρπ π⎡ ⎤= = =⎢ ⎥
⎣ ⎦∑ ∑ (11)
where R*, Mw, ρw are the universal gas constant, the molar mass and density of liquid
water, respectively. From the droplet growth equation [Roberts and Nenes, 2005],
pi
pi
dD sdt D
Γ= ; with this and the definition of average droplet size 1
p i pin
D N DN
= ∑ ,
Equation (11) becomes
*
2w
pw
R TC ND sMρπ
= Γ (12)
Combination of Equations (12) and (7) eventually gives
1
12
op
ss ND=
Φ+ Γ
(13)
where 2 2 * 3
g w
v s w
R R R TH GQP M
π ρΦ =
∆. Applying the binomial expansion up to first order,
1(1 ) 1x x−+ − , Equation (13) is approximated by:
12 p
o
s NDs
Φ− Γ (14)
To express the depression in instrument (i.e., maximum) supersaturation, Equation (14)
should be applied in the vicinity of the supersaturation entry length [Lance et al., 2006],
where all the CCN have activated but experienced the least amount of growth. Further
Page 9 of 35
Editorial Office phone: 612-827-2421 http://mc.manuscriptcentral.com/tandf/ast
Aerosol Science & Technology
123456789101112131415161718192021222324252627282930313233343536373839404142434445464748495051525354555657585960

10
downwind in the chamber, Equation (14) still applies but predicts increasingly larger
supersaturation depletion because pD increases by condensation of water vapor. In fact,
Equation (14) suggests that supersaturation decreases downwind of its maximum value as
2p
o
dDds s Ndz dz
ΦΓ .
Simplification of the droplet size depression equation results from combination of
Equations (12) and (10):
2 2 2 2 2p po p po pD D ND sdt D N D sdt
τ τ
= − ΦΓ = −ΦΓ∫ ∫ (15)
Defining the column-average droplet size,p
p
D sdtD
sdtτ
τ
=∫
∫, then p pD sdt D sdt
τ τ
=∫ ∫ and
Equation (15) becomes:
2 2 2 2 2
2p po p po p pD D ND sdt D ND Dτ
Φ= −ΦΓ − Γ∫ (16)
where 2 2pD sdtτ
Γ∫ (a valid approximation for CCN that exhibit considerable growth
beyond their critical wet diameter, i.e., 2 2cD sdtτ
Γ∫ ; Nenes and Seinfeld, 2003).
Manipulation of Equation (16) gives
1/2
1 12 4
pp p
po
DND ND
D
−Φ Φ⎛ ⎞= + Γ − Γ⎜ ⎟⎝ ⎠
(17)
where the truncated expansion ( ) 1/21 12xx −+ − is used.
Page 10 of 35
Editorial Office phone: 612-827-2421 http://mc.manuscriptcentral.com/tandf/ast
Aerosol Science & Technology
123456789101112131415161718192021222324252627282930313233343536373839404142434445464748495051525354555657585960
11
Equations (14) and (17) are remarkably similar. Both expressions would exhibit identical
dependence on N, Φ and Γ (hence imply that p
o po
Dss D
) if 2p pD D . Numerical
simulations (Section 3) and experimental observations (Section 4) suggest this is often
the case.
3. Instrument and Droplet Growth Models The CFSTGC instrument model [Roberts and Nenes 2005; Lance et al., 2006]
numerically integrates the Navier-Stokes equations and the heat and water vapor
conservation equations to predict the velocity, pressure, water vapor supersaturation, and
temperature fields in the instrument. The model has been shown to successfully simulate
instrument behavior over a wide range of operating conditions [Lance et al. 2006; Rose et
al. 2008]. Inputs to the model are total volumetric flow rate (Q), sheath-to-aerosol flow
ratio (SAR), pressure (P), and the inner wall streamwise temperature gradient (G)
between the exit and entrance of the column. The simulated supersaturation, velocity, and
temperature profiles are used to compute the activation and growth of CCN (with a user-
defined size distribution and composition) as they flow through the chamber. Integration
of the CCN growth equations is accomplished with the LSODE (Livermore Solver for
ODEs) solver [Hindmarsh 1983]. The loss of water vapor from the gas phase onto the
growing CCN and associated latent heat are then allowed to affect the gas phase water
vapor and heat balances [Nenes et al. 2001; Roberts and Nenes 2005]. For more details
about the modeling framework, the solution algorithm and the instrument characteristics,
refer to Roberts and Nenes [2005] and Lance et al., [2006].
Page 11 of 35
Editorial Office phone: 612-827-2421 http://mc.manuscriptcentral.com/tandf/ast
Aerosol Science & Technology
123456789101112131415161718192021222324252627282930313233343536373839404142434445464748495051525354555657585960

12
To study supersaturation depletion effects, we vary the temperature gradient, total flow
rate, pressure, aerosol concentration, size distribution characteristics, and, the water vapor
uptake coefficient for the combinations of these parameters given in Table 1. The flow
field in the growth chamber is discretized onto 100 grid points in the streamwise direction
and 100 grid points in the radial direction. The temperature of the air (both sheath and
aerosol flows) entering the column is 293 K and the sheath-to-aerosol ratio in the growth
chamber is 10:1. Aerosol flows through the instrument that follows a single lognormal
mode of ammonium sulfate aerosol with a geometric mean dry diameter, Dg, of 0.04-0.1
µm, geometric standard deviation, σg, of 1.6, and number concentration, Na, between 1
and 2×104 cm−3. The size distribution is discretized onto 50 bins equally spaced in log-
size between 20 nm and 1 µm. The water vapor uptake coefficient, αc, (used in Γ to
express differences in activation kinetics of the CCN) was varied between 0.01 and 1.0,
which represents the range of activation kinetics observed to date in carbonaceous and
atmospheric aerosol [e.g., Ruehl et al., 2008, 2009; Asa-Awuku et al., 2009]. A total of
over 1100 simulations were completed.
Figure 1 presents a typical example of the effects of CCN on instrument supersaturation
and temperature. Shown are predicted centerline supersaturation and temperature profiles
in the CFSTGC for different levels of aerosol concentration. Chamber conditions
correspond to Q = 0.5 L min-1, wall temperature gradient 16 Km-1 (i.e., a 8K difference
between the entry and exit of the growth chamber) and 1000 mb chamber pressure.
Aerosol is assumed to be composed of (NH4)2SO4, with Dg = 100nm, σg = 0.16 and αc =
1. The thickness of the temperature profile line represents the variability of the quantity
across simulations, arising from latent heat released by the water vapor condensing upon
Page 12 of 35
Editorial Office phone: 612-827-2421 http://mc.manuscriptcentral.com/tandf/ast
Aerosol Science & Technology
123456789101112131415161718192021222324252627282930313233343536373839404142434445464748495051525354555657585960

13
the growing droplets. The temperature profile is largely unaffected by the aerosol up to
concentrations of 104 cm-3 (maximum temperature increase of 0.07K), with a negligible
impact on the streamwise temperature gradient and supersaturation (less than 2% relative
change compared to “zero CCN” conditions). The supersaturation profile for the lowest
aerosol concentration (1 cm−3) corresponds to the “zero CCN” solution; supersaturation
develops after passing of its characteristic entry length [Lance et al., 2006], reaches a
maximum value (~ 0.33%) and slowly decays from the effects of increasing the absolute
temperature in the streamwise direction [Roberts and Nenes, 2005]. Increasing the CCN
concentration above 1000 cm-3 begins to impact the supersaturation profile. Consistent
with the scaling analysis of Section 2, both maximum supersaturation and its decay are
equally affected. However, the location of the maximum in the instrument is not affected,
so that the length of chamber available for growth is unaffected by the CCN
concentration level.
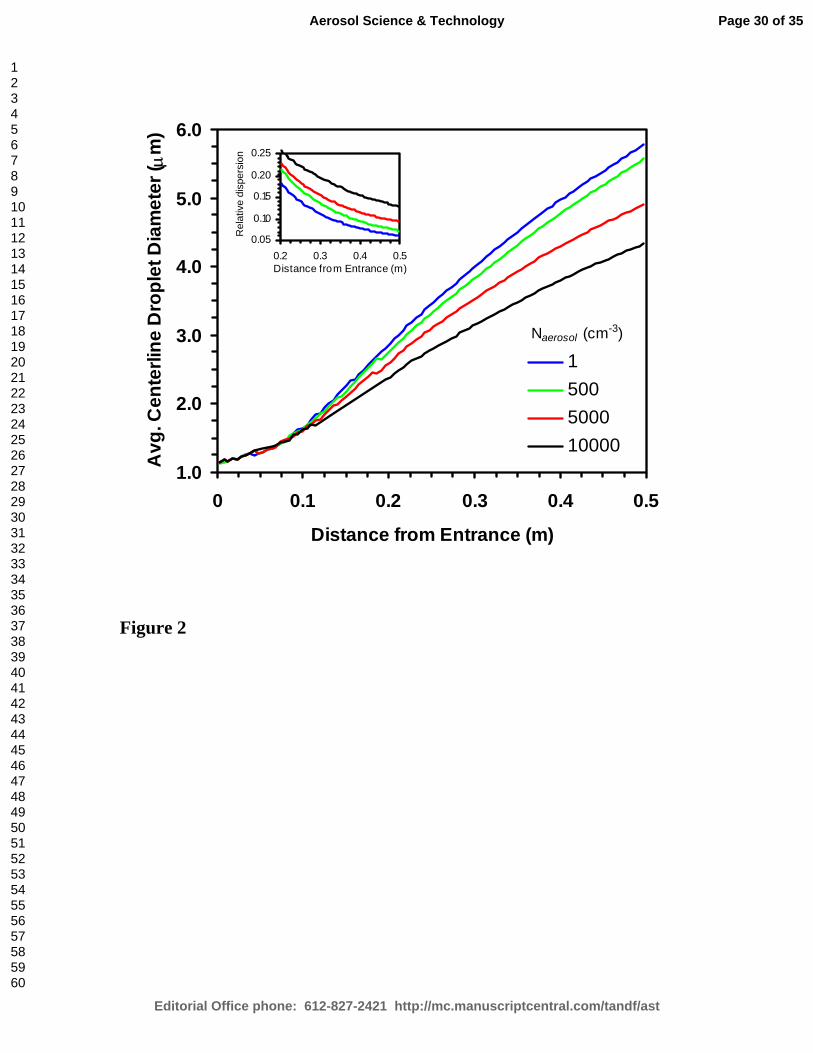
A change in supersaturation is expected to induce a change in the size of droplets exiting
the column. This is shown in Figure 2, which presents the predicted centerline droplet
diameter as a function of distance from the chamber inlet for the simulations of Figure 1.
Clearly, the “zero CCN” simulation provides the largest droplet sizes; increasing CCN
concentrations depresses droplet size by more than 30% at the exit of the chamber. Also
shown in the inset graph is the droplet relative dispersion (defined as the width of the
droplet distribution normalized by the average diameter); it decreases in the flow
direction, consistent with the diffusional narrowing expected for the droplets during their
residence in the chamber. Despite the variation of average droplet diameter and relative
dispersion with CCN concentration, the former tend to be uniquely correlated. This
Page 13 of 35
Editorial Office phone: 612-827-2421 http://mc.manuscriptcentral.com/tandf/ast
Aerosol Science & Technology
123456789101112131415161718192021222324252627282930313233343536373839404142434445464748495051525354555657585960

14
suggests that the droplet size distribution is strongly linked to the level of supersaturation
that eventually develops in the CFSTGC (regardless if depletion effects are important).
Figure 3 presents the predicted supersaturation depletion (left panels) and droplet size
depression ratios (right panels) as a function of CCN concentration (defined as the
droplet concentration exiting the flow chamber in each simulation). Each panel shows
simulations for Q = 0.5 L min-1, wall temperature gradient 8, 16 K m-1, chamber pressure
500, 750, 1000 mb and (NH4)2SO4 aerosol with Dg = 40,100nm, σg=0.19 and Na from 1
to 2×104 cm-3. Results are shown for αc=1 (Panels a, b), αc=0.06 (Panels c, d), and
αc=0.01 (Panels e, f). The behavior seen in all these plots are consistent with the analysis
of Section 2, as both s/so and Dp/Dpo scale linearly with N, with remarkably similar slopes.
The diverse set of instrument operating conditions and aerosol characteristics considered
in the simulations introduce a relatively small variability in s/so and Dp/Dpo; this implies
that changes in G, Q induce responses in pD , pD so that .pD constΦ (Equation 17).
The sensitivity to αc however is important; a lower value of the parameter tends to reduce
the intensity of supersaturation depletion effects. This is expected because reduction of αc
reduces Γ, hence s/so and Dp/Dpo at constant N (Equations 14,17). Based on Figure 3, a
10% reduction in s and Dp is predicted for N ~ 4×10³ for rapidly activating aerosol (αc=1),
N ~ 104 for intermediate (αc=0.06), and N ~ 3.5×10⁴ for slowly activating aerosol
(αc=0.01).
Given that the “supply” rate of water vapor in the instrument is constrained by the
operation conditions (G, transport timescale of water vapor), condensational effects can
only act to reduce the s profile in the flow chamber. This means that if condensational
Page 14 of 35
Editorial Office phone: 612-827-2421 http://mc.manuscriptcentral.com/tandf/ast
Aerosol Science & Technology
123456789101112131415161718192021222324252627282930313233343536373839404142434445464748495051525354555657585960
15
depletion of supersaturation notably affects outlet droplet sizes, it will also affect the
maximum (hence effective) supersaturation in the instrument. The simulations (Figure 3)
and theoretical analysis strongly supports this. Furthermore, while the presence of water
vapor depletion may affect the shape of the supersaturation profile somewhat (Figure 1),
the strongest effect on outlet droplet size arises from the reduction in effective
supersaturation (i.e., the magnitude of the maximum). This is clearly shown in Figure 4,
which shows the average droplet diameter predicted at the exit of growth chamber vs.
supersaturation (with depletion effects considered) for the range of Q, αc, Na and Dg
presented in Table 1. If water vapor depletion significantly affected the shape of the
supersaturation profile in the instrument, it would also change the relationship between s
and Dp (keeping Q, ac and Dg constant). This however is not the case, as simulations
corresponding to “zero CCN” conditions (Na < 500 cm-3; filled triangles) follow the same
s vs. Dp relationship as for simulations with high Na.
4. Experimental Determination of Depletion Effects To experimentally determine supersaturation depletion and outlet droplet size depression,
we carry out two types of experiments: a “standard” instrument calibration (such as those
described in Lance et al., 2006; Rose et al., 2008) to determine the supersaturation. We
then proceed with polydisperse CCN activation experiments to quantify the effects of
water vapor depletion on supersaturation and droplet size. In all experiments we use
(NH4)2SO4 aerosol, generated by atomization of an aqueous solution of the salt.
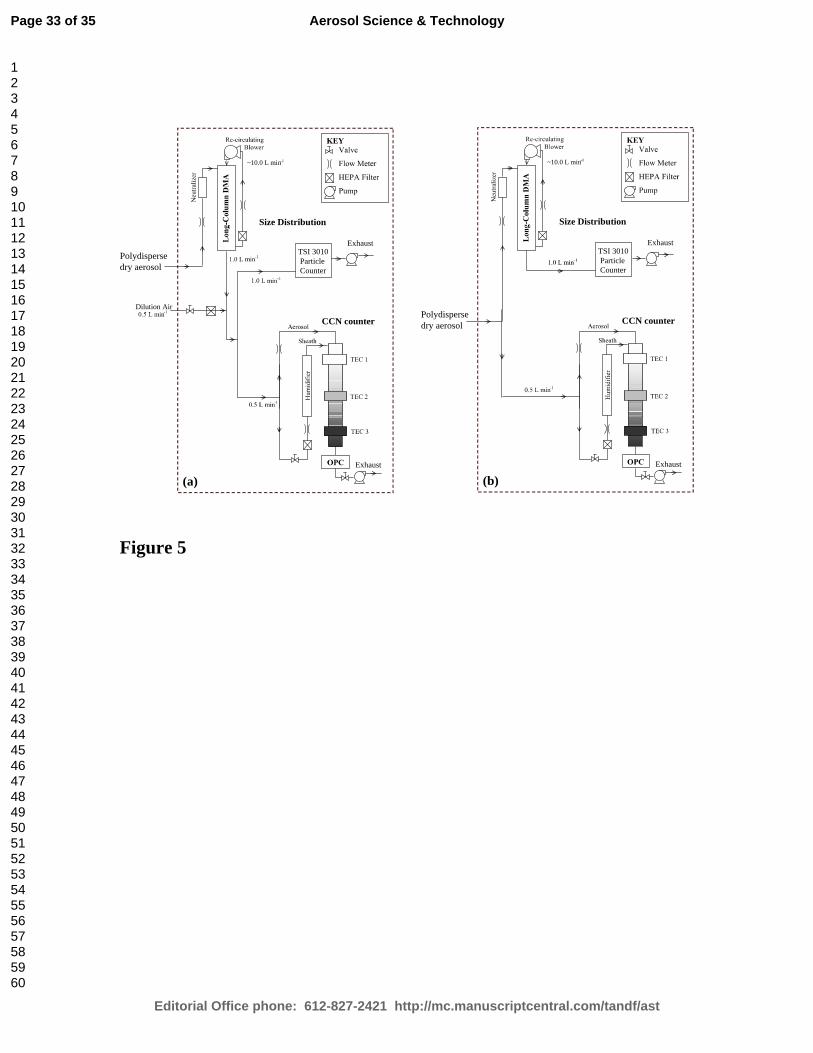
The instrumentation setup used to determine the “zero CCN” supersaturation level in the
instrument is shown in Figure 5a. Polydisperse dry aerosol is charge-neutralized using a
Po-210 neutralizer and introduced into a differential mobility analyzer (DMA, TSI
Page 15 of 35
Editorial Office phone: 612-827-2421 http://mc.manuscriptcentral.com/tandf/ast
Aerosol Science & Technology
123456789101112131415161718192021222324252627282930313233343536373839404142434445464748495051525354555657585960
16
3081L) for size classification by electrical mobility. The classified aerosol is then split
between a condensation particle counter (CPC, TSI 3010) for measurement of total
aerosol (condensation nuclei, CN) concentration, and a Droplet Measurement
Technologies Continuous-Flow CFSTGC (serial number 002) to measure CCN
concentrations. In order to maintain a sample flow rate of 1 LPM through the DMA,
filtered air is supplied to the classified aerosol stream or to the CPC stream (the latter
being preferable in cases where low aerosol concentrations limit the counting statistics in
the CFSTGC). In this study, the aerosol classification is operated as in a Scanning
Mobility Particle Sizer [SMPS; Wang and Flagan, 1989], where the voltage applied to the
DMA is exponentially scanned over time. The TSI Aerosol Instrument Manager control
software is used to scan the voltage, manage data acquisition in the CPC and carry out the
inversion to provide the aerosol number size distribution. The timeseries of CN and CCN
counts obtained during a voltage ramp is then inverted into a “CCN activation curve”
using SMCA [Moore et al., 2010] which provides the ratio of particles that are CCN-
active as a function of their dry mobility diameter. The critical supersaturation (using
Köhler theory) of the particle with dry diameter, d50 (at which 50% of the classified
aerosol act as CCN) is then used to characterize the instrument supersaturation:
1 23427c
AsB
/⎛ ⎞
= ⎜ ⎟⎝ ⎠ (18)
where *4 w
w
MR T
A σρ
= ,3
s s s s
w w
dMB ϕ ν ρ
ρ= , σ is the droplet-air surface tension at the point of activation,
and, sϕ , sν , and sρ are the osmotic coefficient, stoichiometric van’t Hoff factor, and
density of the solute, respectively. sϕ accounts for the incomplete solute dissociation and
Page 16 of 35
Editorial Office phone: 612-827-2421 http://mc.manuscriptcentral.com/tandf/ast
Aerosol Science & Technology
123456789101112131415161718192021222324252627282930313233343536373839404142434445464748495051525354555657585960

17
was calculated for (NH4)2SO4 using the ion-interaction approach of Pitzer and Mayorga
[1973] with parameters taken from Clegg and Brimblecombe [1988]. This
supersaturation calibration procedure is repeated for a range of instrument operating
conditions (column temperature gradient, flow rate and column pressure). The particle
concentration in the CFSTGC during SMCA (generally less than 500 cm-3) is low enough
for water vapor depletion effects to be negligible; hence the calibrated supersaturation
corresponds to the “zero CCN” supersaturation levels.
The polydisperse activation experiments are completed using the experimental setup
shown in Figure 5b; polydisperse aerosol is generated with an atomizer and dried by a
series of diffusional dryers. The aerosol stream is then sampled by a SMPS and the
CFSTGC. The flow rate in the instrument was kept at Q = 0.5 L min-1, ambient pressure
980 mb, and several temperature gradients corresponding to a “zero CCN”
supersaturation range between 0.23% and 0.62%. The concentration and size distribution
of the aerosol is varied by changing the atomizer pressure and concentration of salt
solution placed in the atomizer. A single-mode aerosol is typically generated that is well-
described with a lognormal distribution, with σg = 0.16, Dg varying between 40nm and
70nm, and, Na ranging from ~5×10² to 5×104 cm-3. Supersaturation depletion effects in
the CFSTGC are quantified by determining the effective supersaturation in the instrument
for each CCN concentration level measured. This is done by determining the
characteristic dry size, d*, for which integration of the SMPS size distribution (from d* to
the highest resolved diameter, ~300nm) matches the average CCN concentration
observed during the SMPS scan. d* is then used to characterize the instrument
supersaturation, s, (through application of Equation 18) from which s/so is calculated.
Page 17 of 35
Editorial Office phone: 612-827-2421 http://mc.manuscriptcentral.com/tandf/ast
Aerosol Science & Technology
123456789101112131415161718192021222324252627282930313233343536373839404142434445464748495051525354555657585960

18
Droplet growth depletion is quantified by calculating the average droplet size measured
by the instrument OPC as a function of the total CCN concentration, normalized with the
“zero CCN” droplet size (also determined from polydisperse activation experiments,
under conditions of low particle concentration, less than 500 cm-3).
Results of the polydisperse activation experiments are presented in Figure 6. Panel a
presents measured droplet size depression ratios, Dp/Dpo, as a function of CCN
concentration. All the activation experiments conducted collapse onto a narrow band that
follows a linear trend; the slope of Dp/Dpo vs. N (-2.53×10⁻⁵ cm3) is close to the numerical
predictions for aerosol with αc=1.0 (-1.90×10⁻⁵ cm3; Figure 3b). When measured droplet
depression ratio is placed against predictions (Figure 6b), an excellent agreement can be
obtained; even extrapolation of the simulations to higher CCN concentrations fits the
experimental data well.
Figure 6c presents the supersaturation depletion as a function of CCN concentration in
the instrument. Consistent with simulations, the activation experiments collapse onto a
narrow band that follows a linear trend; the slope of s/so vs. N (-1.94×10⁻⁵ cm3) is close to
the numerical predictions for aerosol with αc=1.0 (-2.01×10⁻⁵ cm3; Figure 3a). Finally,
the average droplet diameter measured by the instrument OPC vs. supersaturation (with
depletion effects considered) is shown in Figure 6d. In agreement with simulations
(Figure 4), the relationship between s and Dp is not affected by the level of CCN in the
instrument, as “zero CCN” observations (i.e., Na < 500 cm-3; filled triangles) follow the
same curve as for measurements at high CCN concentration.
All the evidence presented above strongly suggests that the theoretical analysis presented
in sections 2 and 3 is a realistic representation of water vapor depletion effects in the
Page 18 of 35
Editorial Office phone: 612-827-2421 http://mc.manuscriptcentral.com/tandf/ast
Aerosol Science & Technology
123456789101112131415161718192021222324252627282930313233343536373839404142434445464748495051525354555657585960

19
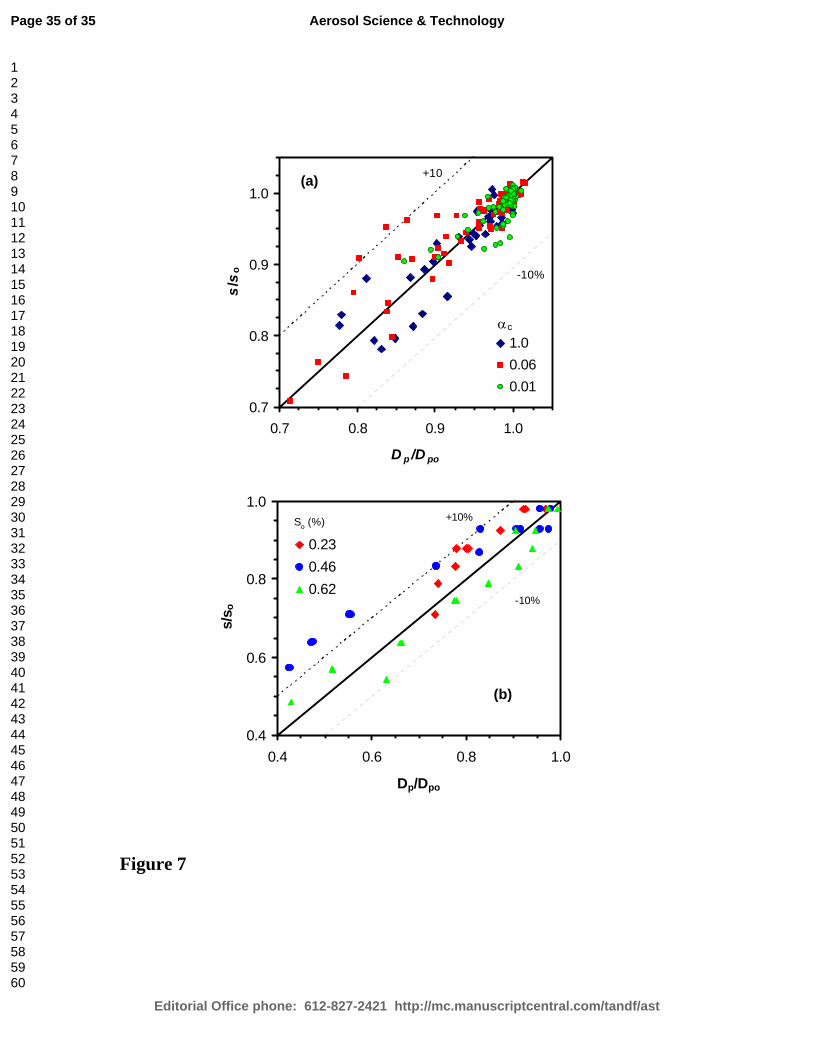
CFSTGC. Against initial expectations, the coupling of supersaturation, CCN number and
outlet droplet size gives rise to a remarkably simple relationship between supersaturation
and droplet size depletion. This is shown in Figure 7, which presents s/so vs Dp/Dpo from
the simulations (panel a) and the observations (panel b). For the wide range of conditions
considered, p
o po
Dss D
to within 10%.
The analysis presented does not consider the effect of coincidence errors for
measurements of CCN at high concentrations; for the instrumentation used, a maximum
coincidence error of 10% can occur for concentrations up to 6000 cm-3 [DMT, 2005]. The
consistency between the theoretical analysis and instrument observations suggests that
coincidence errors, if present, constitute a secondary effect on the observed instrument
response.
6. Summary and Implications. All published studies with the Continuous-Flow Streamwise Thermal Gradient Chamber
assume that the supersaturation generated in the instrument is not influenced by the
condensation of water vapor upon the growing CCN. This study evaluates this
assumption and examines the conditions for which depletion effects become important
for supersaturation, measured CCN concentration and droplet growth. An analysis is
carried out with a fully coupled numerical model and laboratory CCN activation
experiments using a commercial instrument.
We find that condensational depletion of water vapor does not impact supersaturation and
droplet size by more than 10% (which is comparable to the supersaturation uncertainty
quoted for the CFSTGC [e.g., Rose et al., 2008]) if the CCN are present at concentrations
Page 19 of 35
Editorial Office phone: 612-827-2421 http://mc.manuscriptcentral.com/tandf/ast
Aerosol Science & Technology
123456789101112131415161718192021222324252627282930313233343536373839404142434445464748495051525354555657585960

20
below 5000 cm-3. If the CCN exhibit slower activation kinetics than (NH4)2SO4 aerosol,
higher concentrations can be present in the instrument before depletion effects become
important. Remarkably, depletion effects do not significantly alter the shape of the
supersaturation distribution in the instrument growth chamber, so that the relationship
between instrument supersaturation and outlet droplet size does not change (regardless of
the extent of supersaturation depletion). The above suggests that the majority of
atmospherically-relevant CCN measurements with the DMT CFSTGC may not be
substantially affected by supersaturation depletion. However, high CCN concentrations
can occur with enough frequency (especially if sampling polydisperse CCN in polluted
environments, or in laboratory experiments with high particulate loads) that a
methodology needs to be developed to address the issue.
There are a number of approaches that can be used to eliminate biases from
supersaturation depletion. One approach is to avoid depletion effects all together by
maintaining a low concentration of CCN in the instrument during laboratory calibrations
and atmospheric sampling. Low concentrations of CCN can be achieved in-situ by either
performing size-resolved CCN measurements (e.g. SMCA) or through controlled dilution
of the sample stream with filtered air before entering the CFSTGC. Another approach is
to account for depletion biases using the relationship of s/so versus CCN presented in this
manuscript; the effective supersaturation then corresponds to the measured CCN level
and droplet size – and is equivalent to measurements carried out under “zero CCN
conditions”. The degree of correction is sensitive to the activation kinetics of the ambient
aerosol, but an analysis with the instrument model (such as carried out in this manuscript)
can largely account for this uncertainty. Supported by the available body of evidence [e.g.,
Page 20 of 35
Editorial Office phone: 612-827-2421 http://mc.manuscriptcentral.com/tandf/ast
Aerosol Science & Technology
123456789101112131415161718192021222324252627282930313233343536373839404142434445464748495051525354555657585960
21
Bougiatioti et al., 2009; Lance et al., 2009; Ruehl et al., 2008, 2009], rapid activation
kinetics (i.e., αc comparable to that of (NH4)2SO4 aerosol ~ 0.1) can be assumed a priori
when the aerosol is aged, sampled from a humid environment or contains large amounts
of soluble material.
The analysis carried out here can be extended to the different operation modes and
implementations of the CFSTGC design [e.g., Ruehl et al., 2008, Moore et al., 2010] or
any other CCN instrument design (such as those analyzed in Nenes et al., 2001).
Regardless of the method used to measure CCN concentrations, this study shows that
depletion effects need to be carefully understood for unambiguous measurements of CCN
activity and droplet activation kinetics.
Acknowledgments We would like to thank R. Moore for comments that improved the manuscript. We
acknowledge funding from NSF CAREER, NOAA, an NSF Graduate Student Fellowship
and a Georgia Institute of Technology Presidential Scholarship.
References
Asa-Awuku, A., G. Engelhart, B. Lee, S. Pandis, and A. Nenes (2009) Relating CCN
activity, volatility, and droplet growth kinetics of β -caryophyllene secondary organic
aerosol, Atmos. Chem. Phys., 9, 795–812.
Asa-Awuku, A., A. Nenes, S. Gao, R. Flagan, and J. Seinfeld (2010) Water-soluble SOA
from Alkene ozonolysis: composition and droplet activation kinetics inferences from
analysis of CCN activity, Atmos. Chem. Phys., 10, 1585-1597.
Page 21 of 35
Editorial Office phone: 612-827-2421 http://mc.manuscriptcentral.com/tandf/ast
Aerosol Science & Technology
123456789101112131415161718192021222324252627282930313233343536373839404142434445464748495051525354555657585960
22
Bougiatioti, A., C. Fountoukis, N. Kalivitis, S. Pandis, A. Nenes, and N. Mihalopoulos
(2009) Cloud condensation nuclei measurements in the marine boundary layer of the
Eastern Mediterranean: CCN closure and droplet growth kinetics, Atmos. Chem. Phys., 9,
7053–7066.
Clegg, S. L., and P. Brimblecombe (1988) Equilibrium partial pressures of strong acids
over concentrated saline solutions - I. HNO 3 , Atmos. Environ., 22, 91–100.
Chuang, P.Y. (2006) Sensitivity of cloud condensation nuclei activation processes to
kinetic parameters, J. Geoph. Res., 111, D09201.
Cubison, M., B. Ervens, G. Feingold, K. Docherty, I. Ulbrich, L. Shields, K. Prather, S.
Hering, and J. Jimenez (2008) The influence of chemical composition and mixing state of
Los Angeles urban aerosol on CCN number and cloud properties, Atmos. Chem. Phys., 8,
5649–5667.
Droplet Measurement Technologies (DMT), Cloud Condensation Nuclei Counter
Operator Manual, Rev. A, March 2005.
Engelhart, G., A. Asa-Awuku, A. Nenes, and S. N. Pandis (2008) CCN activity and
droplet growth kinetics of fresh and aged monoterpene secondary organic aerosol, Atmos.
Chem. Phys., 8, 3937–3949.
Hindmarsh, A. (1983) ODEPACK: A systematized collection of ODE solvers, in
Scientific Computing, edited by Stepleman et al., and North-Holland, New York, 55–64.
Kuwata, M., Y. Kondo, Y. Miyazaki, Y. Komazaki, J. H. Kim, S. S. Yum, H. Tanimoto,
and H. Matsueda (2008) Cloud condensation nuclei activity at Jeju Island, Korea in
spring 2005, Atmos. Chem. Phys., 8, 2933–2948.
Lance, S. (2007) Quantifying compositional impacts of ambient aerosol on cloud droplet
formation, Ph.D. thesis, Georgia Institute of Technology, Atlanta, GA.
Lance, S., J. Medina, J. Smith, and A. Nenes (2006) Mapping the operation of the DMT
continuous flow CCN counter, Aerosol Sci. Technol., 40, 242–254.
Lance, S., A. Nenes, C. Mazzoleni, M. Dubey, H. Gates, V. Varutbangkul, T. A. Rissman,
S. M. Murphy, A. Sorooshian, F. Brechtel, R. Flagan, J. Seinfeld, G. Feingold, and H.
Page 22 of 35
Editorial Office phone: 612-827-2421 http://mc.manuscriptcentral.com/tandf/ast
Aerosol Science & Technology
123456789101112131415161718192021222324252627282930313233343536373839404142434445464748495051525354555657585960

23
Jonsson (2009) CCN activity, closure and droplet growth kinetics of Houston aerosol
during the Gulf of Mexico Atmospheric Composition and Climate Study (GoMACCS), J.
Geophys. Res., (D00F15), 114.
Moore, R., and A. Nenes (2009) Scanning flow CCN analysis - a method for fast
measurements of CCN spectra, Aerosol Sci. Technol., 43, 1192–1207.
Moore., R., Nenes, A., and Medina, J. (2010) Scanning Mobility CCN Analysis - A
method for fast measurements of size resolved CCN distributions and activation kinetics,
Aeros.Sci.Technol., 44, 861-871.
Murphy, S.M., Agrawal, H., Sorooshian, A., Padro, L.T., Gates, H., Hersey, S., Welch,
W.A., Jung, H., Miller, J.W., Cocker, D.R., Nenes, A., Jonsson, H., Flagan, R.C., and
Seinfeld, J.H. (2009) Comprehensive Simultaneous Shipboard and Airborne
Characterization of Exhaust from a Modern Container Ship at Sea, Env.Sci.Tech., 43,
4626-4640.
Nenes, A., and J. H. Seinfeld (2003) Parameterization of cloud droplet formation in
global climate models, J. Geophys. Res., (D7), doi: 10.1029/2002JD002, 911.
Nenes, A., P. Chuang, R. Flagan, and J. Seinfeld (2001) A theoretical analysis of cloud
condensation nucleus (CCN) instruments, J. Geophys. Res., 106, 3449–3474.
Padró, L., A. Asa-Awuku, R. Morrison, and A. Nenes (2007) Inferring thermodynamic
properties from CCN activation experiments: Single-component and binary aerosols,
Atmos. Chem. Phys., 7, 5263–5274.
Petters, M., and S. Kreidenweis (2007) A single parameter representation of hygroscopic
growth and CCN activity, Atmos. Chem. Phys., 7, 1961–1971.
Petters, M., C. Carrico, S. Kreidenweis, A. Prenni, P. DeMott, J. C. Jr., and H.
Moosmuller (2009) Cloud condensation nucleation activity of biomass burning aerosol, J.
Geophys. Res., 114, D22,205.
Pitzer, K., and G. Mayorga (1973) Thermodynamics of electrolytes. II. activity and
osmotic coefficients for strong electrolytes with one or both ions univalent, J. Phys.
Chem., 77, 2300–2308.
Page 23 of 35
Editorial Office phone: 612-827-2421 http://mc.manuscriptcentral.com/tandf/ast
Aerosol Science & Technology
123456789101112131415161718192021222324252627282930313233343536373839404142434445464748495051525354555657585960

24
Roberts, G., and A. Nenes (2005) A continuous-flow streamwise thermal-gradient CCN
chamber for atmospheric measurements, Aerosol Sci. Technol., 39, 206–221.
Roberts, G.C., Day, D.A., Russell, L.M., Dunlea, E.J., Jimenez, J.L., Tomlinson, J.M.,
Collins, D.R., Shinozuka, Y., and Clarke, A.D. (2010) Characterization of particle cloud
droplet activity and composition in the free troposphere and the boundary layer during
INTEX-B, Atmos. Chem. Phys., 10, 6627–6644
Rose, D., S. Gunthe, E. Mikhailov, G. Frank, U. Dusek, M. Andreae, and U. Pöschl
(2008) Calibration and measurement uncertainties of a continuous-flow cloud
condensation nuclei counter (DMT-CCNC): CCN activation of ammonium sulfate and
sodium chloride aerosol particles in theory and experiment, Atmos. Chem. Phys., 8,
1153–1179.
Rose, D., A. Nowak, P. Achtert, A. Wiedensohler, M. Hu, M. Shao, Y. Zhang, M.
Andreae, and U. Pöschl (2010) Cloud condensation nuclei in polluted air and biomass
burning smoke near the mega-city Guangzhou, China - Part 1: Size-resolved
measurements and implications for the modeling of aerosol particle hygroscopicity and
CCN activity, Atmos. Chem. Phys., 10, 3365–3383.
Ruehl, C. P., C.R., and A. Nenes (2008) How quickly do cloud droplets form on
atmospheric particles?, Atmos. Chem. Phys., 8, 1043–1055.
Ruehl, C., P. Chuang, and A. Nenes (2009) Distinct CCN activation kinetics above the
marine boundary layer along the California coast, Geophys. Res. Lett., 36 :L15814.
Seinfeld, J., and S. Pandis (2006) Atmospheric chemistry and physics: from air pollution
to climate change, 2nd ed., John Wiley, New York.
Sorooshian, A., Murphy, S.M., Hersey, S., Gates, H., Padro, L.T., Nenes, A., Brechtel,
F.J., Jonsson, H., Flagan, R.C. and Seinfeld, J.H. (2008) Comprehensive airborne
characterization of aerosol from a major bovine source, Atmos. Chem. Phys., 8, 3937-
3949
Wang, S., and Flagan, R. (1989) Scanning Electrical Mobility Spectrometer, J.
Aerosol Sci., 20, 1485–1488
Page 24 of 35
Editorial Office phone: 612-827-2421 http://mc.manuscriptcentral.com/tandf/ast
Aerosol Science & Technology
123456789101112131415161718192021222324252627282930313233343536373839404142434445464748495051525354555657585960

25
Wex, H., T. Hennig, I. Salma, R. Ocskay, A. Kiselev, S. Henning, A. Massling, A.
Wiedensohler, and F. Stratmann (2007) Hygroscopic growth and measured and modeled
critical supersaturations of an atmospheric HULIS sample, Geophys. Res. Lett., doi:
10.102/2006GL028, 260.
Page 25 of 35
Editorial Office phone: 612-827-2421 http://mc.manuscriptcentral.com/tandf/ast
Aerosol Science & Technology
123456789101112131415161718192021222324252627282930313233343536373839404142434445464748495051525354555657585960
26
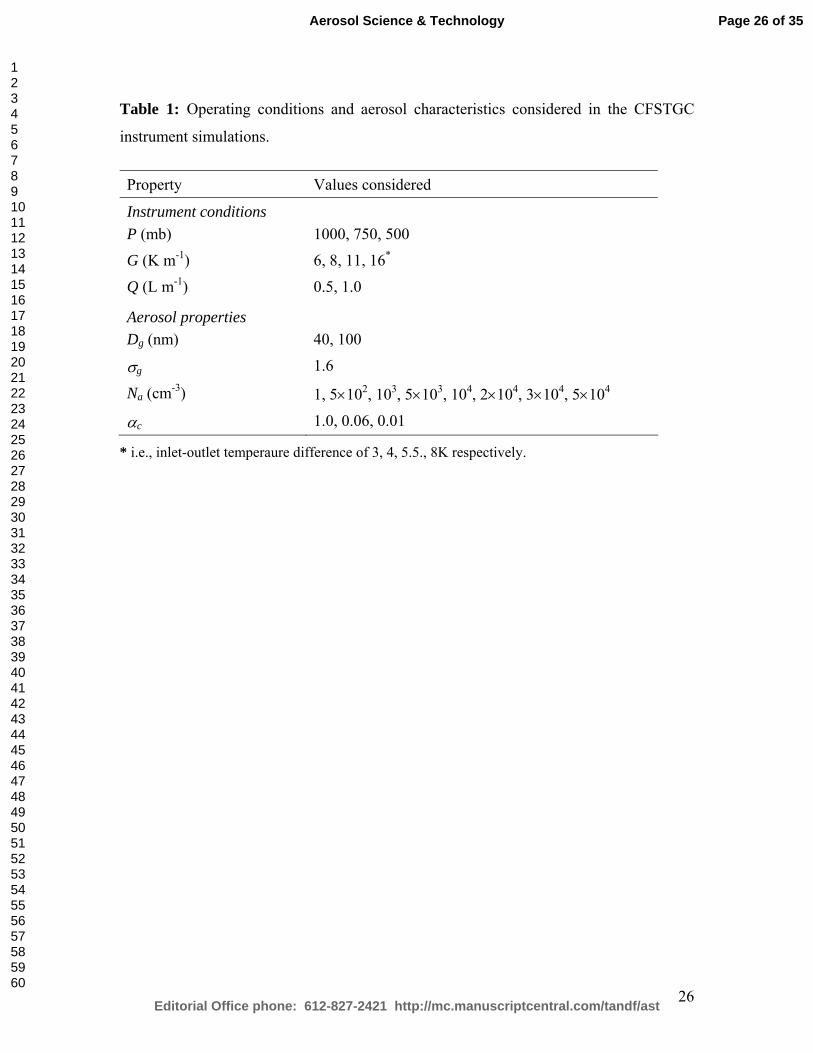
Table 1: Operating conditions and aerosol characteristics considered in the CFSTGC
instrument simulations.
Property Values considered
Instrument conditions P (mb) 1000, 750, 500
G (K m-1) 6, 8, 11, 16*
Q (L m-1) 0.5, 1.0
Aerosol properties Dg (nm) 40, 100
σg 1.6
Na (cm-3) 1, 5×10², 103, 5×10³, 104, 2×10⁴, 3×10⁴, 5×10⁴
αc 1.0, 0.06, 0.01
* i.e., inlet-outlet temperaure difference of 3, 4, 5.5., 8K respectively.
Page 26 of 35
Editorial Office phone: 612-827-2421 http://mc.manuscriptcentral.com/tandf/ast
Aerosol Science & Technology
123456789101112131415161718192021222324252627282930313233343536373839404142434445464748495051525354555657585960

27
Figure Captions
Figure 1: Predicted centerline temperature (black line) and supersaturation (symbols)
profiles in the CFSTGC for different levels of aerosol flowing through the instrument.
Chamber conditions correspond to Q = 0.5 L min-1, wall temperature gradient 16 Km-1
and 1000 mb chamber pressure. Aerosol is composed of (NH4)2SO4, and follows a
lognormal distribution with 100 nm modal diameter and 0.16 geometric standard
deviation. αc is assumed unity. The thickness of the temperature profile line represents
the variability across all simulations.
Figure 2: Predicted centerline droplet diameter and relative dispersion (inset graph) in
the CFSTGC for different levels of aerosol flowing through the instrument. Chamber and
aerosol characteristics are identical to those of Figure 1.
Figure 3: Predicted supersaturation depletion (left panels) and droplet size depression
ratios (right panels) as a function of CCN concentration (defined as the droplet
concentration exiting the flow chamber). Results shown for αc=1 (Panels a, b), αc=0.06
(Panels c, d), and αc=0.01 (Panels e, f). Each panel shows simulations for Q = 0.5 L min-
1, wall temperature gradient 8, 16 K m-1, chamber pressure 500, 750, 1000 mb and
(NH4)2SO4 aerosol following a lognormal distribution with 40, 100 nm modal diameter,
0.19 geometric standard deviation and total concentration from 1 to 2×104 cm-3.
Figure 4: Predicted average droplet diameter at the exit of growth chamber vs.
supersaturation (with depletion effects considered) for Q=0.5 L min-1, αc=1 (Panel a),
Q=0.5 L min-1, αc=0.06 (Panel b), Q=1.0 L min-1, αc=0.06 (Panel c), and Q=0.5 L min-1,
αc=0.01 (Panel d). Triangles denote simulations that correspond to “zero CCN”
conditions (defined as aerosol concentration below 500 cm-3).
Figure 5: Instrument setup for (a) “zero CCN” instrument supersaturation calibration,
and, (b) polydisperse CCN activation experiments.
Figure 6: Measured CFSTGC responses to increasing levels of CCN in the flow chamber.
Instrument operation was kept at Q = 0.5 L min-1, chamber pressure 980 mb and
Page 27 of 35
Editorial Office phone: 612-827-2421 http://mc.manuscriptcentral.com/tandf/ast
Aerosol Science & Technology
123456789101112131415161718192021222324252627282930313233343536373839404142434445464748495051525354555657585960

28
(NH4)2SO4 aerosol following a lognormal distribution with 40, 70 nm modal diameter,
0.2 geometric standard deviation and total concentration from 1 to ~ 3×104 cm-3. (a)
droplet size depression ratios as a function of CCN concentration (b) Predicted vs.
measured droplet size depression ratios as a function of CCN concentration, for Q = 0.5 L
min-1, P= 980 mb and so = 0.62% (αc=1.0 is assumed in the simulations). (c) Measured
supersaturation depletion as a function of CCN concentration. (d) average droplet size
measured at the optical particle counter vs. instrument supersaturation (considering
depletion effects). Triangles denote simulations that correspond to “zero CCN”
conditions (defined as CCN concentration below 500 cm-3).
Figure 7: o
ss
vs p
po
DD
for (a) all the simulations presented in Figure 3, and, (b) the
experiments presented in Figure 6a. Dashed lines correspond to ±10% deviation from the
diagonal.
Page 28 of 35
Editorial Office phone: 612-827-2421 http://mc.manuscriptcentral.com/tandf/ast
Aerosol Science & Technology
123456789101112131415161718192021222324252627282930313233343536373839404142434445464748495051525354555657585960

N aerosol (cm-3)
0.00
0.05
0.10
0.15
0.20
0.25
0.30
0.35
0.00 0.10 0.20 0.30 0.40 0.50
Distance from Entrance (m)
Cen
terli
ne S
uper
satu
ratio
n (%
)
292
293
294
295
296
297
298
299
300
301
Cen
terli
ne T
empe
ratu
re (K
)
1 500 1000 5000 10000
Figure 1
Page 29 of 35
Editorial Office phone: 612-827-2421 http://mc.manuscriptcentral.com/tandf/ast
Aerosol Science & Technology
123456789101112131415161718192021222324252627282930313233343536373839404142434445464748495051525354555657585960
Naerosol (cm-3)
1.0
2.0
3.0
4.0
5.0
6.0
0 0.1 0.2 0.3 0.4 0.5
Distance from Entrance (m)
Avg
. Cen
terli
ne D
ropl
et D
iam
eter
( µm
)
1500500010000
0.05
0.10
0.15
0.20
0.25
0.2 0.3 0.4 0.5Distance from Entrance (m)
Rel
ativ
e di
sper
sion
Naerosol (cm-3)
1.0
2.0
3.0
4.0
5.0
6.0
0 0.1 0.2 0.3 0.4 0.5
Distance from Entrance (m)
Avg
. Cen
terli
ne D
ropl
et D
iam
eter
( µm
)
1500500010000
0.05
0.10
0.15
0.20
0.25
0.2 0.3 0.4 0.5Distance from Entrance (m)
Rel
ativ
e di
sper
sion
Figure 2
Page 30 of 35
Editorial Office phone: 612-827-2421 http://mc.manuscriptcentral.com/tandf/ast
Aerosol Science & Technology
123456789101112131415161718192021222324252627282930313233343536373839404142434445464748495051525354555657585960

y = -3.03E-06x + 9.95E-01R2 = 7.46E-01
0.7
0.8
0.9
1
1.1
10 100 1000 10000 100000
CCN (cm-3)
Sm
ax[C
CN]
/Sm
ax[0
]s/
s o
(e)
y = -3.03E-06x + 9.95E-01R2 = 7.46E-01
0.7
0.8
0.9
1
1.1
10 100 1000 10000 100000
CCN (cm-3)
Sm
ax[C
CN]
/Sm
ax[0
]s/
s o
(e)
y = -1.12E-05x + 1.00E+00R2 = 8.98E-01
0.7
0.8
0.9
1
1.1
10 100 1000 10000 100000
CCN (cm-3)
Smax
[CC
N]/S
max
[0]
s/s o
(c)
y = -1.12E-05x + 1.00E+00R2 = 8.98E-01
0.7
0.8
0.9
1
1.1
10 100 1000 10000 100000
CCN (cm-3)
Smax
[CC
N]/S
max
[0]
s/s o
(c)
y = -2.01E-05x + 9.82E-01R2 = 8.58E-01
0.6
0.7
0.8
0.9
1
1.1
10 100 1000 10000 100000
CCN (cm-3)
Smax
[CC
N]/S
max
[0]
s/s o
(a)
y = -2.01E-05x + 9.82E-01R2 = 8.58E-01
0.6
0.7
0.8
0.9
1
1.1
10 100 1000 10000 100000
CCN (cm-3)
Smax
[CC
N]/S
max
[0]
s/s o
(a)
y = -1.90E-05x + 9.88E-01R2 = 8.14E-01
0.6
0.7
0.8
0.9
1
1.1
10 100 1000 10000 100000
CCN (cm-3)
Dp[
CCN
]/Dp[
0]D
p/D
po
(b)
y = -1.90E-05x + 9.88E-01R2 = 8.14E-01
0.6
0.7
0.8
0.9
1
1.1
10 100 1000 10000 100000
CCN (cm-3)
Dp[
CCN
]/Dp[
0]D
p/D
po
(b)
y = -1.21E-05x + 9.98E-01R2 = 9.00E-01
0.7
0.8
0.9
1
1.1
10 100 1000 10000 100000
CCN (cm-3)
Dp[C
CN]/D
p[0]
Dp/
Dpo
(d)
y = -1.21E-05x + 9.98E-01R2 = 9.00E-01
0.7
0.8
0.9
1
1.1
10 100 1000 10000 100000
CCN (cm-3)
Dp[C
CN]/D
p[0]
Dp/
Dpo
(d)
y = -3.28E-06x + 1.00E+00R2 = 7.53E-01
0.7
0.8
0.9
1
1.1
10 100 1000 10000 100000
CCN (cm-3)
Dp[
CC
N]/D
p[0]
Dp/D
po
(f)
y = -3.28E-06x + 1.00E+00R2 = 7.53E-01
0.7
0.8
0.9
1
1.1
10 100 1000 10000 100000
CCN (cm-3)
Dp[
CC
N]/D
p[0]
Dp/D
po
(f)
Figure 3
Page 31 of 35
Editorial Office phone: 612-827-2421 http://mc.manuscriptcentral.com/tandf/ast
Aerosol Science & Technology
123456789101112131415161718192021222324252627282930313233343536373839404142434445464748495051525354555657585960

Aerosol Dg
R2 = 0.989
R2 = 0.985
1.0
2.0
3.0
4.0
5.0
6.0
7.0
8.0
0.1 0.2 0.3 0.4 0.5 0.6
S (%)
Avg
. Out
let D
ropl
et D
iam
eter
(µm
)
40 nm100 nm
Aerosol Dg
R2 = 0.983
R2 = 0.962
1.0
2.0
3.0
4.0
5.0
6.0
7.0
0.1 0.2 0.3 0.4 0.5 0.6
S (%)
Avg
. Out
let D
ropl
et D
iam
eter
(µm
)
40 nm100 nm
(b)
Aerosol Dg
R2 = 0.983
R2 = 0.962
1.0
2.0
3.0
4.0
5.0
6.0
7.0
0.1 0.2 0.3 0.4 0.5 0.6
S (%)
Avg
. Out
let D
ropl
et D
iam
eter
(µm
)
40 nm100 nm
(b)(a)
Aerosol Dg
R2 = 0.962
R2 = 0.978
1.0
2.0
3.0
4.0
5.0
6.0
7.0
0.1 0.3 0.5 0.7 0.9 1.1S (%)
Avg
. Out
let D
ropl
et D
iam
eter
(µm
)
40 nm100 nm
(c)
Aerosol Dg
R2 = 0.988
R2 = 0.991
1.0
1.5
2.0
2.5
3.0
3.5
0.1 0.2 0.3 0.4 0.5 0.6 0.7
S (%)
Avg
. Out
let D
ropl
et D
iam
eter
(µm
)
40 nm100 nm
(d)
Aerosol Dg
R2 = 0.988
R2 = 0.991
1.0
1.5
2.0
2.5
3.0
3.5
0.1 0.2 0.3 0.4 0.5 0.6 0.7
S (%)
Avg
. Out
let D
ropl
et D
iam
eter
(µm
)
40 nm100 nm
(d)
Figure 4
Page 32 of 35
Editorial Office phone: 612-827-2421 http://mc.manuscriptcentral.com/tandf/ast
Aerosol Science & Technology
123456789101112131415161718192021222324252627282930313233343536373839404142434445464748495051525354555657585960
TSI 3010 Particle Counter
Exhaust
Size Distribution
Exhaust
Polydispersedry aerosol
~10.0 L min
(a)
CCN counter
Dilution Air
TSI 3010 Particle Counter
Exhaust
Size Distribution
Exhaust
Polydispersedry aerosol
~10.0 L min
(b)
CCN counter
Figure 5
Page 33 of 35
Editorial Office phone: 612-827-2421 http://mc.manuscriptcentral.com/tandf/ast
Aerosol Science & Technology
123456789101112131415161718192021222324252627282930313233343536373839404142434445464748495051525354555657585960

y = -2.53E-05x + 9.60E-01R2 = 8.99E-01
0.2
0.3
0.4
0.5
0.6
0.7
0.8
0.9
1
100 1000 10000 100000
CCN (cm-3)
Dp[
CCN]
/Dp[
0]
40nm, 0.62%
70nm, 0.62%
40 nm, 0.46%
70 nm, 0.46%
40 nm, 0.23%
70 nm, 0.23%
Dp/
Dpo
(a)
y = -2.53E-05x + 9.60E-01R2 = 8.99E-01
0.2
0.3
0.4
0.5
0.6
0.7
0.8
0.9
1
100 1000 10000 100000
CCN (cm-3)
Dp[
CCN]
/Dp[
0]
40nm, 0.62%
70nm, 0.62%
40 nm, 0.46%
70 nm, 0.46%
40 nm, 0.23%
70 nm, 0.23%
Dp/
Dpo
(a)
0.4
0.5
0.6
0.7
0.8
0.9
1
10 100 1000 10000 100000
CCN (cm-3)
Dp[C
CN]
/Dp[
0]
Experiments (40nm)
Simulations (40 nm)
Experiments (70nm)Simulations (100nm)
(b)
Dp/
Dpo
0.4
0.5
0.6
0.7
0.8
0.9
1
10 100 1000 10000 100000
CCN (cm-3)
Dp[C
CN]
/Dp[
0]
Experiments (40nm)
Simulations (40 nm)
Experiments (70nm)Simulations (100nm)
(b)
Dp/
Dpo
R2 = 0.951
1.0
2.0
3.0
4.0
5.0
6.0
7.0
0.1 0.2 0.3 0.4 0.5 0.6 0.7S (%)
Avg.
Out
let D
ropl
et D
iam
eter
(µ
m)
40 nm
(d)
y = -1.94E-05x + 9.47E-01R2 = 8.18E-01
0.2
0.3
0.4
0.5
0.6
0.7
0.8
0.9
1
100 1000 10000 100000CCN (cm-3)
S[CC
N]/S
[0]
40nm, 0.62%
70nm, 0.62%
40 nm, 0.23%
s/s o
(c)
s/s o
y = -1.94E-05x + 9.47E-01R2 = 8.18E-01
0.2
0.3
0.4
0.5
0.6
0.7
0.8
0.9
1
100 1000 10000 100000CCN (cm-3)
S[CC
N]/S
[0]
40nm, 0.62%
70nm, 0.62%
40 nm, 0.23%
s/s o
(c)
s/s o
Avg
.Out
letD
ropl
et D
iam
ter(µm
)
CCN (cm-3)
CCN (cm-3) CCN (cm-3)
s (%)
Figure 6
Page 34 of 35
Editorial Office phone: 612-827-2421 http://mc.manuscriptcentral.com/tandf/ast
Aerosol Science & Technology
123456789101112131415161718192021222324252627282930313233343536373839404142434445464748495051525354555657585960
+10
-10%
αc
0.7
0.8
0.9
1.0
0.7 0.8 0.9 1.0
D p /D po
s/s o
1.00.060.01
So (%) +10%
-10%
0.4
0.6
0.8
1.0
0.4 0.6 0.8 1.0
Dp/Dpo
s/s o
0.230.460.62
(b)
(a)
Figure 7
Page 35 of 35
Editorial Office phone: 612-827-2421 http://mc.manuscriptcentral.com/tandf/ast
Aerosol Science & Technology
123456789101112131415161718192021222324252627282930313233343536373839404142434445464748495051525354555657585960