Benchmarking regulatory burdens Roundtable 11-12 December 2006.

WATER UTILITY REGULATORY BENCHMARKING PERFORMANCE
ASSESSMENT AND IMPROVEMENT:
Prepared by Sanford V. Berg and Michelle Phillips
Public Utility Research Center, University of Florida
Pristina, Kosovo February 23-27, 2015
DANUBE WATER PROGRAM | WB & IAWD |
Water Utility Regulatory Benchmarking | Performance Assessment and Improvement | 2
Monday, 23 February 2015 BENCHMARKING BASICS
8:15 Registration
9:00 Opening Session: Overview of Regulatory Process for Benchmarking
11:00 Designing Processes: Data Definitions, Selection, Collection, and Authentication
12:30 Lunch
13:30 Collecting Data: Benchmarking Experience in Portugal
15:15 Case 1: Selecting Key Performance Indicators
16:45 Optional Review of Microsoft Excel
17:30 End of day
Tuesday, 24 February 2015 COMPARISONS WITH LIMITED DATA
9:00 Case 2: Validating Data and Considering Sample Size: Confidence in Performance Comparisons
11:00 Addressing Data Quality and Alternative Quantitative Methodologies for Measuring Performance
12:30 Lunch
13:30 Designing Information Systems for Regulators
15:00 Danubis Steering Group Meeting and Discussion
17:15 End of day
Wednesday, 25 February 2015 TOOLS FOR PERFORMANCE ASSESSMENT
9:00 Case 3: Utilizing Available Software: Statistical Analysis
11:00 Case 3 Continued – Group Work
12:30 Lunch
13:30 Case 4: Utilizing Available Software – DEA
15:15 Case 4 Continued – Group Work
17:00 End of day

DANUBE WATER PROGRAM | WB & IAWD |
Water Utility Regulatory Benchmarking | Performance Assessment and Improvement | 3
Thursday, 26 February 2015 STEPS FOR ENHANCING UTILITY PERFORMANCE
9:00 Disseminating Benchmarking Results: Performance Assessment and Performance Improvement
11:00 Performance Assessment using Large Databases
12:30 Lunch
13:30 Evaluating Benchmarking Studies: Formats, Figures, and Narrative
15:15 Using Benchmarking Results: Designing Incentives
17:00 End of day
Friday, 27 February 2015 DATA FOUNDATIONS AND ACTION PLANS
9:00 Monitoring and Publicizing Performance Over Time
11:00 Action Plans and Key Lessons
12:30 Awarding of Certificates

DANUBE WATER PROGRAM | WB & IAWD |
Water Utility Regulatory Benchmarking | Performance Assessment and Improvement | 4

DANUBE WATER PROGRAM | WB & IAWD |
Water Utility Regulatory Benchmarking | Performance Assessment and Improvement | 5
Opening sessions: Overview of the Benchmarking Process Monday, 23 February 2015
9:00 – 12:30 Time Content Speaker(s)
9:00 1. Overview of Regulatory Processes for Benchmarking
Design, collection, validation, analysis, and publication processes. How can studies be used and misused, sources of conflict and sector performance, the role of evidence, use for rate-making, use for incentives.
Sanford Berg, PURC and Michelle Phillips, PURC
10:45 Coffee break
11:00 2. Designing Processes: Data Definitions, Selection, Collection, and Authentication
Review of Basic Information Needs, KPIs currently collected in each country, IBNET Definitions, Legal Authority for Data Collection.
Sanford Berg, PURC and Michelle Phillips, PURC
11:45 Participant Presentations and Discussion of Current Practice
Sanford (Sandy) Berg is Professor Emeritus of Economics and Director of Water Studies of the Public Utility Research Center at the University of Florida. Sandy has a B.A. from the University of Washington and a Ph.D. in Economics from Yale University. He served as Director of the Public Utility Research Center from 1980 to 2004, publishing two books and ninety articles on infrastructure, including incentives and pricing. He was chosen to be University Teacher/Scholar for 1998. As Co-Director of the PURC/World Bank International Training Program on Utility Regulation and Strategy, he has trained over 2,800 regulators and managers from 151 nations. Recently, he published Water Utility Benchmarking: Measurement, Methodologies, and Performance Incentives (International Water Association Publishing, 2010). That book integrated results from several projects—for the World Bank (IBNET) and the Inter-American Development Bank. Performance assessment represents a challenge for managers, regulators, and policy-makers. He also wrote Best Practices in Regulating State-Owned and Municipal Water Utilities (2013, for the UN’s Economic Commission for Latin America and the Caribbean). In addition, he has helped develop www.regulationbodyofknowledge.org.
Michelle Phillips is a Junior Economist in the Public Utility Research Center (PURC) at the University of Florida. She has a B.S. in Economics from the University of Central Florida and received her Ph.D. in Economics from the University of Florida in 2012. Her areas of expertise include regulatory policy, utility benchmarking and efficiency analysis, governance, and institutions. She is currently responsible for conducting research in solar energy policy and teaching an Energy Sustainability course. Dr. Phillips’ research topics include water utility efficiency, solar power, mergers, meta-analysis, and regulation. Prior to arriving at PURC, Dr. Phillips was an Assistant Teaching Professor at the Missouri University of Science and Technology and a Short Term Consultant at the Private Public Infrastructure Advisory Facility in the World Bank. She has been a referee for several Economics journals and is a member of the American Economic Association. Dr. Phillips has published papers in the Journal of Regulatory Economics (on Japanese water utility benchmarking) and Public Choice. In addition to giving presentations at various scholarly conferences, she has led sessions at the PURC/World Bank International Training Program on Utility Regulation and Strategy and the PURC Advanced Program on Utility Benchmarking. She is an outstanding instructor in two languages: English and Spanish.
DANUBE WATER PROGRAM | WB & IAWD |
Water Utility Regulatory Benchmarking | Performance Assessment and Improvement | 6
Benchmarking in the Danube Region Monday, 23 February 2015
13:30 – 17:30
Time Content Speaker(s)
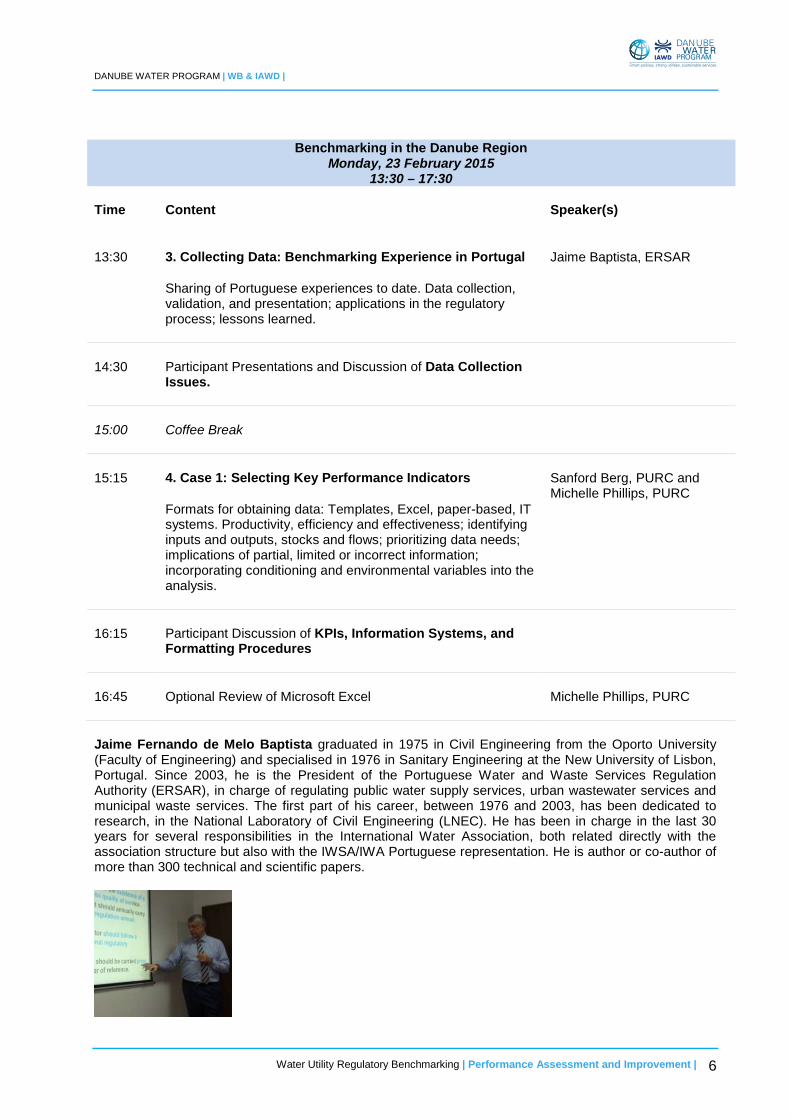
13:30 3. Collecting Data: Benchmarking Experience in Portugal
Sharing of Portuguese experiences to date. Data collection, validation, and presentation; applications in the regulatory process; lessons learned.
Jaime Baptista, ERSAR
14:30 Participant Presentations and Discussion of Data Collection Issues.
15:00 Coffee Break
15:15 4. Case 1: Selecting Key Performance Indicators
Formats for obtaining data: Templates, Excel, paper-based, IT systems. Productivity, efficiency and effectiveness; identifying inputs and outputs, stocks and flows; prioritizing data needs; implications of partial, limited or incorrect information; incorporating conditioning and environmental variables into the analysis.
Sanford Berg, PURC and Michelle Phillips, PURC
16:15 Participant Discussion of KPIs, Information Systems, and Formatting Procedures
16:45 Optional Review of Microsoft Excel Michelle Phillips, PURC
Jaime Fernando de Melo Baptista graduated in 1975 in Civil Engineering from the Oporto University (Faculty of Engineering) and specialised in 1976 in Sanitary Engineering at the New University of Lisbon, Portugal. Since 2003, he is the President of the Portuguese Water and Waste Services Regulation Authority (ERSAR), in charge of regulating public water supply services, urban wastewater services and municipal waste services. The first part of his career, between 1976 and 2003, has been dedicated to research, in the National Laboratory of Civil Engineering (LNEC). He has been in charge in the last 30 years for several responsibilities in the International Water Association, both related directly with the association structure but also with the IWSA/IWA Portuguese representation. He is author or co-author of more than 300 technical and scientific papers.
DANUBE WATER PROGRAM | WB & IAWD |
Water Utility Regulatory Benchmarking | Performance Assessment and Improvement | 7
SUMMARY DAY 1
1. Overview of the Benchmarking Process (Berg & Phillips)
Day 1 provided an overview of benchmarking processes used around the world, with special emphasis on the Danube region.
The Chairman of the Inter-Ministerial Council for Waters and Prime Minister of Kosovo, Isa Mustafa, welcomed participants to the event. During the first session, participants introduced themselves and shared their objectives for the week. Their focus was on the following: collecting useful data, promoting cooperation between the regulator (or oversight group) and water/wastewater utilities, determining data quality, developing data verification procedures, selecting Key Performance Indicators (KPIs), creating Overall Performance Indicators (OPIs), identifying other methodologies for assessing utility performance, involving stakeholders in the benchmarking process, and drawing upon the experiences of others. Each nation has a specific context: no one size fits all. In addition, everyone is starting at a different point—some already use KPIs to set targets and create incentives while others are just beginning the collection process.
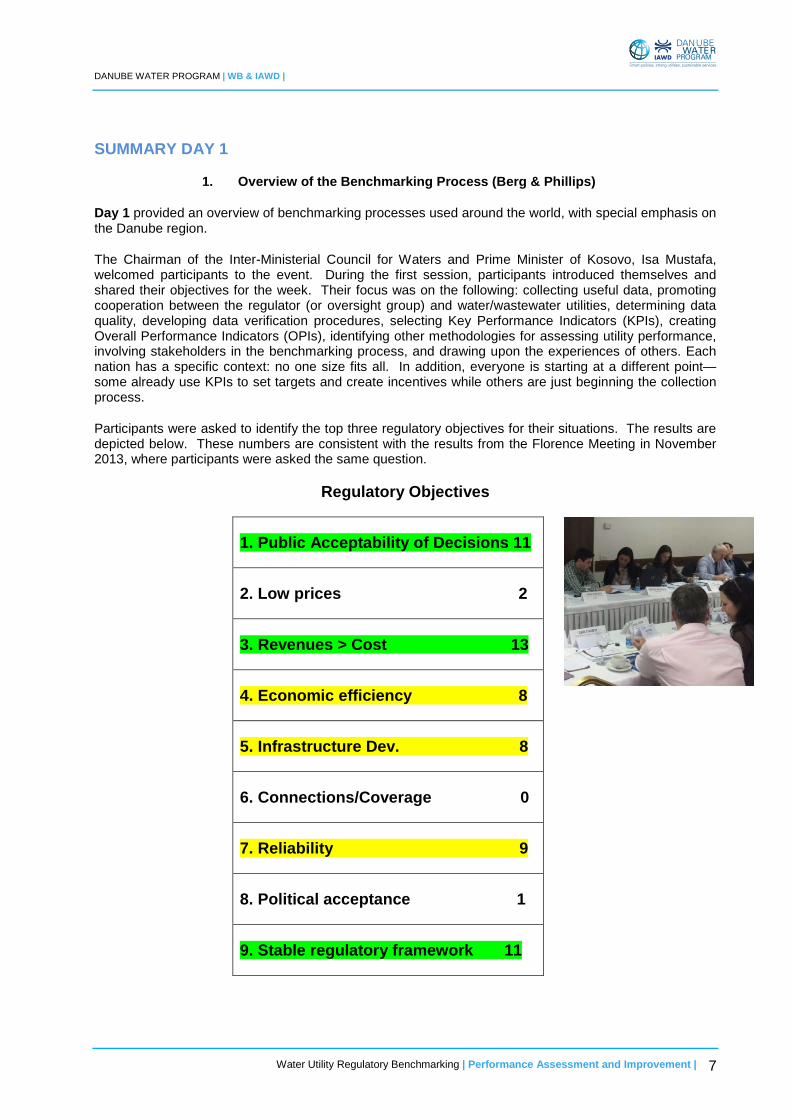
Participants were asked to identify the top three regulatory objectives for their situations. The results are depicted below. These numbers are consistent with the results from the Florence Meeting in November 2013, where participants were asked the same question.
Regulatory Objectives
1. Public Acceptability of Decisions 11
2. Low prices 2
3. Revenues > Cost 13
4. Economic efficiency 8
5. Infrastructure Dev. 8
6. Connections/Coverage 0
7. Reliability 9
8. Political acceptance 1
9. Stable regulatory framework 11

DANUBE WATER PROGRAM | WB & IAWD |
Water Utility Regulatory Benchmarking | Performance Assessment and Improvement | 8
10. Robust competition 1
The lack of “votes” for some regulatory objectives was explained by the objective being embedded in or consistent with objectives. Furthermore, the weights given each objective depends on the context. If some objectives are already met, then going forward, the objective is not central to national goals. In addition, since water utilities are natural monopolies, the one vote for robust competition was defined in terms of “yardstick competition” where benchmarking identifies strong and weak performers. Benchmarking is central to each of the ten typical regulatory functions, where agencies do the following:
1. Issue licenses: certificates of use, siting approval, contractual arrangements
2. Set performance standards: service quality has implications for cost, price, & health
3. Monitor the performance of regulated firms: collect and analyze data on costs, revenues, and performance (benchmarking)
4. Establish the price level and the structure of tariffs: enable recovery of prudently incurred costs via a transparent process that yields coherent prices (that are “just and reasonable”)
5. Establish a Uniform Accounting System: income statements, balance sheets, statements of cash flows, and operating statistics
6. Arbitrate disputes among stakeholders: ensure that facts are well documented and that different interests are well represented.
7. Perform management audits and/or Evaluate Business Plans (often via independent consultancy): Are goals being met? Can targets be met with current prices and financial conditions?
8. Develop human resources: staff training and competitive compensation policy for recruitment and retention of infrastructure professionals.
9. Coordinate Activities with Other Agencies: Water often involves multiple authorities, including water resource agency and environmental protection agency. Agencies are in a position to make recommendations to the Legislature:
10. Report sector performance and commission activities to appropriate government authorities:
• providing clarity in regulatory priorities,
• transparency for sector stakeholders, and
• accountability to political structures (via clear appeals procedures and inter-governmental coordination)
The concluding observation related to the six “I” elements that are foundations for high performance:
We work within institutions
We gather information
We develop & respond to incentives
We listen to & create ideas

DANUBE WATER PROGRAM | WB & IAWD |
Water Utility Regulatory Benchmarking | Performance Assessment and Improvement | 9
We articulate & honor our ideals
We try to become individuals who make a difference—we become Leaders.
2. Designing Processes: Data Definitions, Selection, Collection and Authentication (Berg & Phillips)
This session focused on Key Performance Indicators (KPIs) and their use in performance assessment and performance improvement. These partial indicators represent a starting point for benchmarking. The process involves both technical and adaptive work where research, dialogue, and negotiation can address the concerns of different stakeholders. Two Lessons:
1. “Utilities and regulators manage what they measure.”
2. “Make what’s important measurable, not what’s measurable important.”
The IWA Water Balance Table was used to illustrate one systematic approach to a KPI, in this case, Non-Revenue Water. The Exercise for this session involved assigning weights to eight different KPIs—to create an Overall Performance Indicator (OPI).
1. OPEX / Total Revenue (as a measure of cost recovery)
2. Staff efficiency = # of staff / 1000 connections
3. Collection rate = Collected income / amount invoiced to customers
4. Non-Revenue Water = Portion of produced water not invoiced to consumers
5. Drinking water quality = Portion of water passing water quality tests to meet bacteriological standards
6. Hours per day of service = Average hours of service per day for water supply
7. Coverage ratio = Population with access to water services / total population under the utility’s nominal responsibility.
8. Reliability of service = Interruptions / customer
Participants then discussed why particular indicators were assigned greater weight given their circumstances. Sami Hasani (WWRO) gave a PowerPoint presentation on the KPIs used in Kosovo and on how targets are established. The weights given various regulatory objectives are applied to KPIs. The WWRO has developed three tools for tariff reviews: regulatory accounting guidelines, monitoring and assessing service performance levels, and benchmarking using statistical analysis. He also presented the incentive formula used for rewarding utilities that came closest to achieving technical, financial, and investment targets.
3. Collecting Data: Benchmarking Experience in Portugal (Baptista)
ERSAR is the water regulator for Portugal; a key actor among the institutions responsible for performance in the sector. The IWA Lisbon Charter provides Guidelines for public policy and regulation of drinking water supply, sanitation, and wastewater management services. The emphasis is on dialogue, information sharing, and transparency. ERSAR regulates all utilities, regardless of the governance model (State-owned, municipal-owned and private). It has adopted a collaborative and pedagogic (educational)
DANUBE WATER PROGRAM | WB & IAWD |
Water Utility Regulatory Benchmarking | Performance Assessment and Improvement | 10
approach to regulation. The framework includes both structural regulation (providing input into legislation and public information) and the regulation of operator behavior (legal and contractual regulation, economic regulation, drinking water quality regulation, and user interface regulation). Participants learned about the specific types of data collected and reported. In addition, targets for KPIs were presented (with brackets setting good, average, and unsatisfactory ranges). Awards are given to best performing utilities. Detailed information is available from www.ersar.pt .
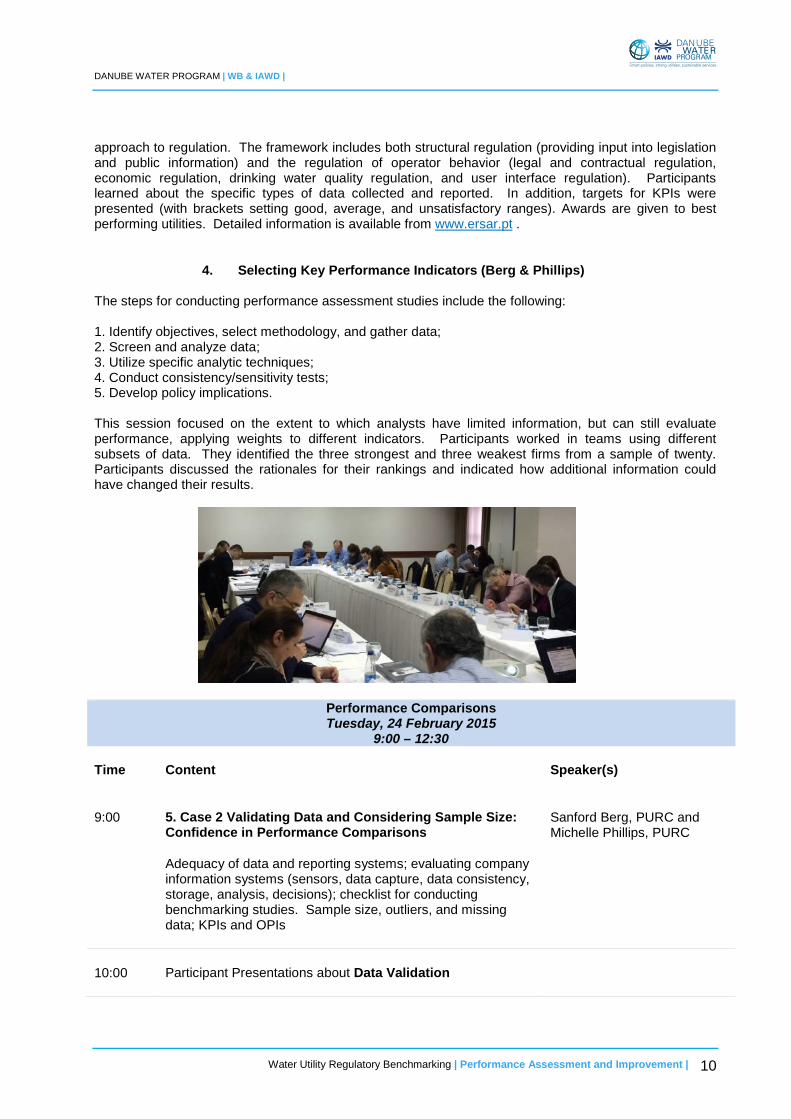
4. Selecting Key Performance Indicators (Berg & Phillips)
The steps for conducting performance assessment studies include the following: 1. Identify objectives, select methodology, and gather data; 2. Screen and analyze data; 3. Utilize specific analytic techniques; 4. Conduct consistency/sensitivity tests; 5. Develop policy implications. This session focused on the extent to which analysts have limited information, but can still evaluate performance, applying weights to different indicators. Participants worked in teams using different subsets of data. They identified the three strongest and three weakest firms from a sample of twenty. Participants discussed the rationales for their rankings and indicated how additional information could have changed their results.
Performance Comparisons Tuesday, 24 February 2015
9:00 – 12:30
Time Content Speaker(s)
9:00 5. Case 2 Validating Data and Considering Sample Size: Confidence in Performance Comparisons
Adequacy of data and reporting systems; evaluating company information systems (sensors, data capture, data consistency, storage, analysis, decisions); checklist for conducting benchmarking studies. Sample size, outliers, and missing data; KPIs and OPIs
Sanford Berg, PURC and Michelle Phillips, PURC
10:00 Participant Presentations about Data Validation

DANUBE WATER PROGRAM | WB & IAWD |
Water Utility Regulatory Benchmarking | Performance Assessment and Improvement | 11
10:45 Coffee Break
11:00 6. Addressing Data Quality and Alternative Quantitative Methodologies for Measuring Performance
Incorporating data quality into analyses; Functional forms for input/output relationships; Overview of methodologies used by regulators; Strengths and limitations of data envelopment analysis (DEA) and statistical analysis; Scores and Rankings using Metric Methodologies. Sensitivity to specifications, Additional inputs and outputs; additional years (trends and panel analysis); context and governance variables; introduction to robust comparisons
Sanford Berg, PURC and Michelle Phillips, PURC
11:45 Participant Discussion of Procedures for dealing with Data Problems and Alternative Methodologies
Experience with Different Methodologies Tuesday, 24 February 2015
13:30 – 3:00
Time Content Speaker(s)
13:30 7. Designing Information Systems for Regulators
How to define information requirements. The importance of the regulatory framework and its objectives. The need to take into account the regulator’s capacity to process and use the information. What is to be defined? Accounting for ring-fencing, boundaries, content, format, and periodicity of information requirements. Examples of several information systems will be described.
Richard Schlirf, Macroconsulting
14:15 Participant Presentations and Discussion of Current Approaches to Quantitative Performance Assessment
14:45 Coffee Break

DANUBE WATER PROGRAM | WB & IAWD |
Water Utility Regulatory Benchmarking | Performance Assessment and Improvement | 12
Danubis Steering Group Meeting Tuesday, 24 February 2015
15:00-17:15
Time Content Speaker(s)
15:00 8. Danubis Steering Group Meeting and Discussion
The DANUBIS.org steering group will meet for the third time to take opportunity of the presence of many group members at the workshop. The Platform’s latest developments will be presented and discussions will take place on possible future developments.
David Michaud, World Bank
David Michaud obtained his Master in Environmental and Sanitary Engineering at the Ecole Polytechnique Fédérale de Lausanne in Switzerland in 1998. He then worked as an engineer and project manager in the private and non-profit sectors, mostly on water, sanitation and water resources management projects in the Middle East and West Africa. Following a second Master in Engineering and Management at the Massachusetts Institute of Technology in Cambridge, USA, David joined the World Bank in 2005. After spending a year in the Water and Sanitation Program (www.wsp.org) working on corporate priorities, he moved to the World Bank's Operational Unit for water and sanitation in Latin America. During his time in the region, he worked most extensively Mexico, Central America and the Andean countries, gradually moving the focus of his activities from infrastructure and projects development to utility strengthening and efficiency improvements programs, and has also conducted analytical work and provided policy advice to national governments on issues such as sector financing, public policies for utility reform, and sector performance and sustainability monitoring. In November 2012, Mr. Michaud was appointed to lead the implementation of the Danube Water Program's policy component out of the World Bank office in Vienna.
SUMMARY DAY 2
5. Validating Data and Considering Sample Size: Confidence in Performance Comparisons (Berg & Phillips)
Day 2 emphasized that “Decision-makers manage what they measure.” Measurement requires information systems that provide data: Sensors and meters for Data capture, records (and appropriate Audit procedures), methods for determining data consistency, data storage systems, and software for analysis. The group discussed current approaches to data collection, and best practice.
There are four complementary metric methodologies, summarized below.
Key & Core Overall Performance Indicators: KPIs as individual indicators; OPIs combine partial indicators of operating or financial performance; OPIs are summary indices;

DANUBE WATER PROGRAM | WB & IAWD |
Water Utility Regulatory Benchmarking | Performance Assessment and Improvement | 13
Total Factor Productivity Indices: an index number approach using output per unit input—multiple inputs are taken into consideration to gauge efficiency levels and changes;
Relative Performance using Statistical Techniques: parametric approaches that involve assumptions about functional relationships;
Relative Performance using Data Envelopment Analysis (DEA): (a non-parametric technique that makes no assumptions about the functional form of production or cost functions),
Before moving into statistical techniques and DEA, participants were given the complete dataset of thirteen variables for the twenty utilities analysed the previous day. The information included operational and financial data. Again, they were asked to identify the strongest and weakest performers—without using spreadsheets or quantitative analysis. The basic approach was involved creating an OPI from the set of KPIs in the sample dataset. Ivaylo Kastchiev (Bulgaria) gave a short presentation on measuring and reducing Non-revenue water. Later he described an alternative measurement: m3/km/day, so the volume of NRW is related to the pipe length. Number of customers and age of the network both affect NRW.
6. Addressing Data Quality and Alternative Methodologies for Measuring Performance (Berg & Phillips)
Analysts must have clear data definitions and be able to incorporate into their analyses conditioning or other environmental factors (customer density, customer mix, water source, etc.) that affect costs and production relationships. In addition, the International Water Association suggests that analysts include reliability as a factor; confidence regarding how the data was gathered is one determinant of data quality. Accuracy is a number indicating the likely range of error for reported financial and operational data. Together, reliability and accuracy factors can be used to create a standardized confidence indicator. The participant Exercise asked
them to review the weights assigned KPIs in an earlier exercise—when they discover that the “most important indicator” had a huge measurement error (+ or – 30%) instead of the + or – 5% originally believed. In general, the weight assigned this KPI (for creating an OPI) was reduced as confidence in the indicator fell.
Five benchmarking methodologies were surveyed:
• Core Indicators and a Summary or Overall Performance Indicator (partial metric method) • Performance Scores based on Production or Cost Estimates (“total” methods) • Performance Relative to a Model Company (engineering approach) • Process Benchmarking (involving detailed analysis of operating characteristics) • Customer Survey Benchmarking (identifying customer perceptions)
Much of the Workshop focuses on the first two methodologies listed above. KPIs and OPIs have already received attention. Production function studies (requiring data on inputs and outputs) show how inputs affect utility outputs (such as volume of water delivered, number of customers, and service quality). Utilities that produce far less output than other utilities (who are using the same input levels) are deemed to be relatively inefficient. Cost functions show how outputs, inputs and input prices affect costs; such models have heavy data requirements. Excessively high costs would trigger more in-depth studies to determine the source of poor performance. Participants were introduced to statistical models, Data Envelopment Analysis, and other quantitative methodologies.
Any benchmarking study will have limitations, but sound studies can be used to place the burden of proof on other parties who might argue that the analysis is incomplete or

DANUBE WATER PROGRAM | WB & IAWD |
Water Utility Regulatory Benchmarking | Performance Assessment and Improvement | 14
incorrect. Kasam Zekjiri (Macedonia) noted that over time, data availability will improve and studies will be strengthened as professionals gain experience with these quantitative techniques. Any benchmarking study will have limitations, but sound studies can be used to place the burden of proof on other parties who might argue that the analysis is incomplete or incorrect.
Mirela Hahn (Croatia) described the institutional arrangements in Croatia in her PowerPoint presentation. She showed how a number of stakeholders affected the development and implementation of water policy. As a full member of the EU (since July 2013), the nation is moving forward with a new Water Services Act. She presented basic principles for the provision of water services, and indicated that currently there were about 180 water service providers, with only 2% of them distributing more than 10 million m3/year. A reporting form is used to collect data on financial and operational elements.
7. Regulatory Information Systems an Overview (Richard Schlirf Rapti)
There is a global need of data from the operators for: • Tariff determination (revenue requirements); • Incentivizing operators to achieve different types of efficiency (long term financial and resource
sustainability, productive efficiency, allocative efficiency, and equity (or fairness); • Verifying the existence of anti-competitive/discriminatory behaviors; • Verifying compliance with public service obligations and service technical norms/standards.
Information requirements include defining boundaries (regulated vs. unregulated), clarifying content, preparing templates for formats, and determining the appropriate periodicity for collecting data (monthly, quarterly, annual). Since data collection and reporting costs, performance assessment systems need to be cost-effective in the procedures and requirements imposed on utilities in the jurisdiction. Case studies from Peru and Brazil illustrated the value of comprehensive data collection efforts.
Zsolt Kerti (Hungary) gave a PowerPoint report on benchmarking as a tool for promoting cost efficiency, as a methodology that could incorporate quality of service into comparisons, and as a cross-section approach to yardstick comparisons. Topology, customer density, and other factors affect the cost of meeting performance standards. Furthermore, when comparing large cities (national capitals), analysts need to be particularly careful with regards to exchange rates and controlling for unique conditions.
8. Danubis Steering Group Meeting The Steering Group heard reports from several groups regarding additions to the web-based Platform. Possible future developments were explored, and participants were asked to propose ways the systems could be more useful to decision-makers in the region. The web address is http://www.danubis.net/ .
DANUBE WATER PROGRAM | WB & IAWD |
Water Utility Regulatory Benchmarking | Performance Assessment and Improvement | 15
Statistical Analysis as a Tool Wednesday, 25 February 2015
09:00 – 12:30
Time Content Speaker(s)
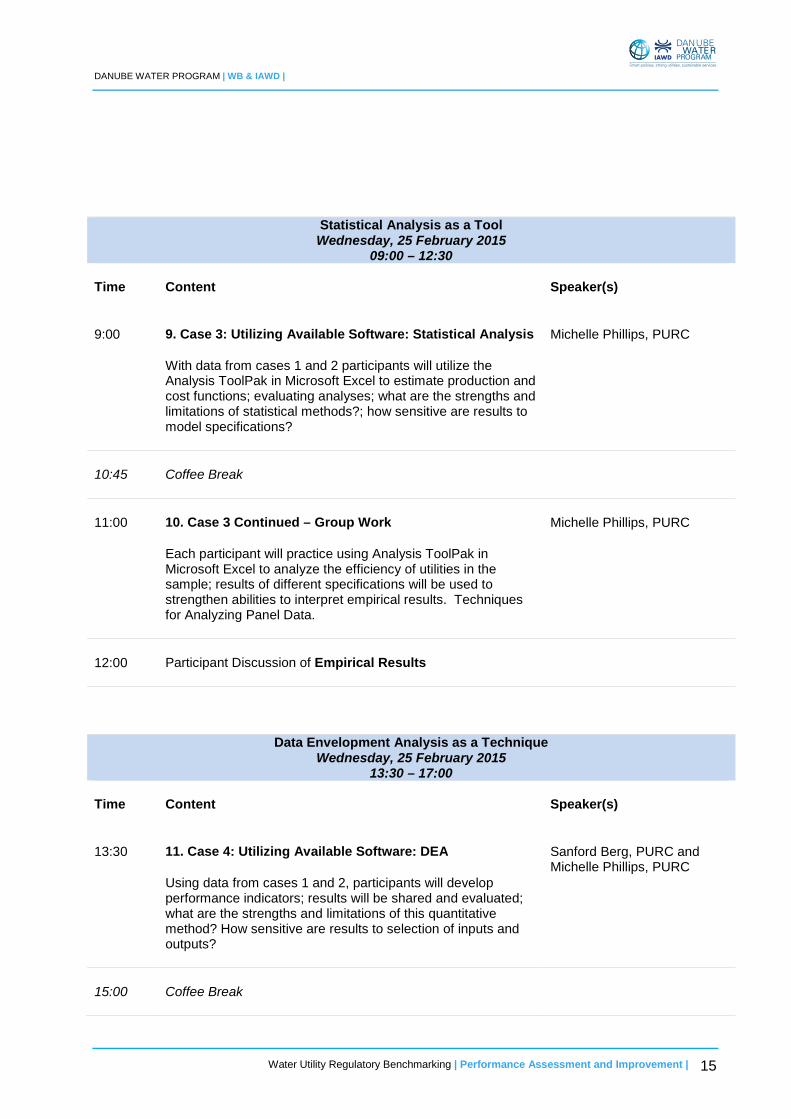
9:00 9. Case 3: Utilizing Available Software: Statistical Analysis
With data from cases 1 and 2 participants will utilize the Analysis ToolPak in Microsoft Excel to estimate production and cost functions; evaluating analyses; what are the strengths and limitations of statistical methods?; how sensitive are results to model specifications?
Michelle Phillips, PURC
10:45 Coffee Break
11:00 10. Case 3 Continued – Group Work
Each participant will practice using Analysis ToolPak in Microsoft Excel to analyze the efficiency of utilities in the sample; results of different specifications will be used to strengthen abilities to interpret empirical results. Techniques for Analyzing Panel Data.
Michelle Phillips, PURC
12:00 Participant Discussion of Empirical Results
Data Envelopment Analysis as a Technique Wednesday, 25 February 2015
13:30 – 17:00
Time Content Speaker(s)
13:30 11. Case 4: Utilizing Available Software: DEA
Using data from cases 1 and 2, participants will develop performance indicators; results will be shared and evaluated; what are the strengths and limitations of this quantitative method? How sensitive are results to selection of inputs and outputs?
Sanford Berg, PURC and Michelle Phillips, PURC
15:00 Coffee Break

DANUBE WATER PROGRAM | WB & IAWD |
Water Utility Regulatory Benchmarking | Performance Assessment and Improvement | 16
15:15 12. Case 4 Continued – Group Work
Participants will utilize DEA software to compute performance scores for the sample utilities; specifications of cost and production relationships will be evaluated. Comparisons of performance scores and rankings using different specifications.
Sanford Berg, PURC and Michelle Phillips, PURC
16:30 Participant Discussion of Empirical Results
SUMMARY DAY 3
9. Utilizing Available Software: Statistical Analysis (M. Phillips)
Day 3 of the Workshop was the most technically challenging, since participants were asked to run statistical regressions and to compute the performance scores for some utilities using both statistical and DEA approaches. This session identified the strengths and limitations of statistical analyses, and introduced issues associated with model specification and the inclusion of different types of variables. Using Cost Functions and Production Functions, Dr. Phillips described how linear and non-linear relationships could be estimated, including an introduction to dummy variables and to panel analysis. A variety of technical issues were discussed—to enable participants to interact more effectively with specialists.
Participants then utilized the Regression package in Excel to estimate key relationships using the full dataset for the twenty utilities analyzed in less rigorous ways earlier in the week. Valerii Tsaplin (Ukraine) presented quantitative results for a sample of about 150 Ukraine water utilities, using statistical and DEA models. He showed how the performance scores depended on model specification (and the methodology used). He also presented results from a more sophisticated regression analysis: Stochastic Frontier Analysis (SFA), where assumptions about statistical error terms are incorporated into the model.

DANUBE WATER PROGRAM | WB & IAWD |
Water Utility Regulatory Benchmarking | Performance Assessment and Improvement | 17
10. Statistical Analysis Continued (Phillips)
Teams of participants continued the group work, exploring the implications of different model specifications and identifying the highest performing utilities. After discussing these results, Dr. Phillips provided an overview of issues associated with economies of scale, economies of density, and panel data (the same set of firms over several years). She also distinguished between “statistical significance” and “economic significance”—when interpreting model coefficients. It is important to note that scores and rankings will depend on the criteria used to develop them as well as assumptions and the inclusion of all the relevant facts (variables) affecting the dependent variable. In addition, analysts need to use criteria that are important for the question being addressed, not just what ‘fits’ the data. Finally, if performance scores (and rankings) are consistent over several different model specifications, it indicates a robust ranking system.
11. Utilizing Available Software: DEA (Phillips and Berg)
The purpose of this session was to provide an introduction to Data Envelopment Analysis (DEA) and indicate how it has been used to derive efficiency scores—from both production and cost relationships. Participants built a simple DEA model using Microsoft Excel’s Solver Add-in. The methodology involves searching for two peer decision-making units (DMUs--utilities) whose performance dominates the utility being evaluated. This process enables the analyst to derive a performance (or efficiency) score for each DMU. The group used an input orientation, comparing the input levels required to produce that output. The strengths and limitations of DEA were described, and
software options identified.
12. DEA Continued (Phillips and Berg) The concluding session for Day 3 continued the application of DEA to performance assessment. One advantage of DEA is that multiple outputs can be considered; however, as more inputs and outputs are included in the analysis, more utilities tend to be “on the frontier”: it becomes more difficult to discriminate between firms, as more get rated as efficient. This non-statistical (non-parametric) methodology assumes that all variation in inputs and outputs is due to inefficiency, which suggests that the assumption regarding comparability among utilities is particularly important. It is possible to control for other external factors affecting performance (like density, customer mix, or network age). In addition, DEA can handle both constant and variable returns to scale.

DANUBE WATER PROGRAM | WB & IAWD |
Water Utility Regulatory Benchmarking | Performance Assessment and Improvement | 18
Milorad Rosic (Serbia) described data collection developments in Serbia, particularly the role of Association for Water Technology and Sanitary Engineering in promoting improved utility performance.
Dissemination of Data for Incentivizing Performance Improvement Thursday, 26 February 2015
9:00 – 12:30
Time Content Speaker(s)
9:00 13. Disseminating Benchmarking Results: Performance Assessment and Performance Improvement
Legal constraints on publishing data, best practice examples; pre-analysis (clustering, sensitivity analysis, KPIs); tables, scatter diagrams, figures; studies with data from participants. Implications for different stakeholders. Service quality and cost. Awards: top performers, most improved utilities.
Sanford Berg, PURC and Michelle Phillips, PURC
9:45 Panel Discussion of Best Practice Dissemination
10:45 Coffee Break
11:00 14. Performance Assessment Using Large Data Bases
Danubis and IBNET enable analysts to compare performance across and within regions. Sample size as a determinant of robustness. Empirical assessment of overall productivity patterns; indicators of governance and other features of the institutional environment.
Michael Klien, Austrian Institute of Economic Research (WIFO)
12:00 Participant Discussion of Multi-year Datasets

DANUBE WATER PROGRAM | WB & IAWD |
Water Utility Regulatory Benchmarking | Performance Assessment and Improvement | 19
Michael Klien is a Researcher at the Austrian Institute of Economic Research (WIFO). He is working on questions of political economics, public procurement and the provision of public services. From 2008 to 2012 he completed his Doctorate in Economics at the WU Vienna University of Economics and Business followed by a post doctoral research position at the IAE de Paris, Sorbonne Business School. His thesis ‘Institutional and Political Aspects of Public Infrastructure Provision’ focuses on tariff setting by water utilities with empirical applications to Austria. Apart from his academic experience Michael Klien has been consulting in a range of related areas such as benchmarking for power grids (Austrian Energy Regulator; Thüga AG), public budgets from a growth and sustainability perspective (Austrian Industry Association) and local public enterprises (OECD).
Standards for Benchmarking Studies Thursday, 26 February 2015
13:30 – 17:00
Time Content Speaker(s)
13:30 15. Evaluating Benchmarking Studies: Formats, Figures and Narrative
Critiques of reports; comparing financial results with operating conditions; operations, financial sustainability, water resource sustainability, trends); lessons for operators, regulators and stakeholders. Best practice in preparing press releases; Legal constraints to revealing utility-specific information.
Sanford Berg, PURC and Michelle Phillips, PURC
14:30 Discussion of Report Preparation and Dissemination
15:00 Coffee Break
15:15 16. Using Benchmarking Results: Designing Incentives
Sensitivity Tests. Public awareness (transparency and public acceptance/legitimacy); internal incentives (efficiency); regulatory incentives (effectiveness); price reviews (X-factors); baselines, trends and targets. Review of business plans (with associated incentives). Regulatory responses to firms not meeting Targets established in Business Plans.
Sanford Berg, PURC and Michelle Phillips, PURC
16:30 Participant Presentations and Discussion: Examples of Current Incentives
SUMMARY DAY 4
DANUBE WATER PROGRAM | WB & IAWD |
Water Utility Regulatory Benchmarking | Performance Assessment and Improvement | 20
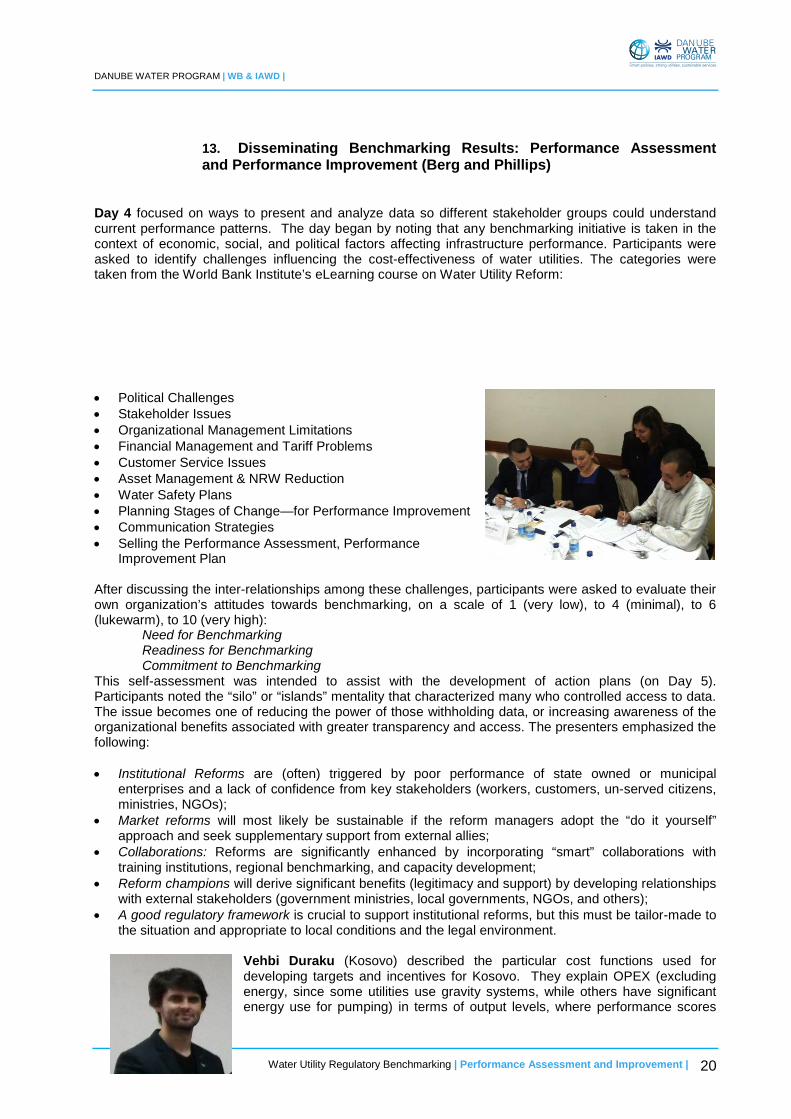
13. Disseminating Benchmarking Results: Performance Assessment and Performance Improvement (Berg and Phillips)
Day 4 focused on ways to present and analyze data so different stakeholder groups could understand current performance patterns. The day began by noting that any benchmarking initiative is taken in the context of economic, social, and political factors affecting infrastructure performance. Participants were asked to identify challenges influencing the cost-effectiveness of water utilities. The categories were taken from the World Bank Institute’s eLearning course on Water Utility Reform:
• Political Challenges • Stakeholder Issues • Organizational Management Limitations • Financial Management and Tariff Problems • Customer Service Issues • Asset Management & NRW Reduction • Water Safety Plans • Planning Stages of Change—for Performance Improvement • Communication Strategies • Selling the Performance Assessment, Performance
Improvement Plan
After discussing the inter-relationships among these challenges, participants were asked to evaluate their own organization’s attitudes towards benchmarking, on a scale of 1 (very low), to 4 (minimal), to 6 (lukewarm), to 10 (very high):
Need for Benchmarking Readiness for Benchmarking Commitment to Benchmarking This self-assessment was intended to assist with the development of action plans (on Day 5). Participants noted the “silo” or “islands” mentality that characterized many who controlled access to data. The issue becomes one of reducing the power of those withholding data, or increasing awareness of the organizational benefits associated with greater transparency and access. The presenters emphasized the following: • Institutional Reforms are (often) triggered by poor performance of state owned or municipal
enterprises and a lack of confidence from key stakeholders (workers, customers, un-served citizens, ministries, NGOs);
• Market reforms will most likely be sustainable if the reform managers adopt the “do it yourself” approach and seek supplementary support from external allies;
• Collaborations: Reforms are significantly enhanced by incorporating “smart” collaborations with training institutions, regional benchmarking, and capacity development;
• Reform champions will derive significant benefits (legitimacy and support) by developing relationships with external stakeholders (government ministries, local governments, NGOs, and others);
• A good regulatory framework is crucial to support institutional reforms, but this must be tailor-made to the situation and appropriate to local conditions and the legal environment.
Vehbi Duraku (Kosovo) described the particular cost functions used for developing targets and incentives for Kosovo. They explain OPEX (excluding energy, since some utilities use gravity systems, while others have significant energy use for pumping) in terms of output levels, where performance scores
DANUBE WATER PROGRAM | WB & IAWD |
Water Utility Regulatory Benchmarking | Performance Assessment and Improvement | 21
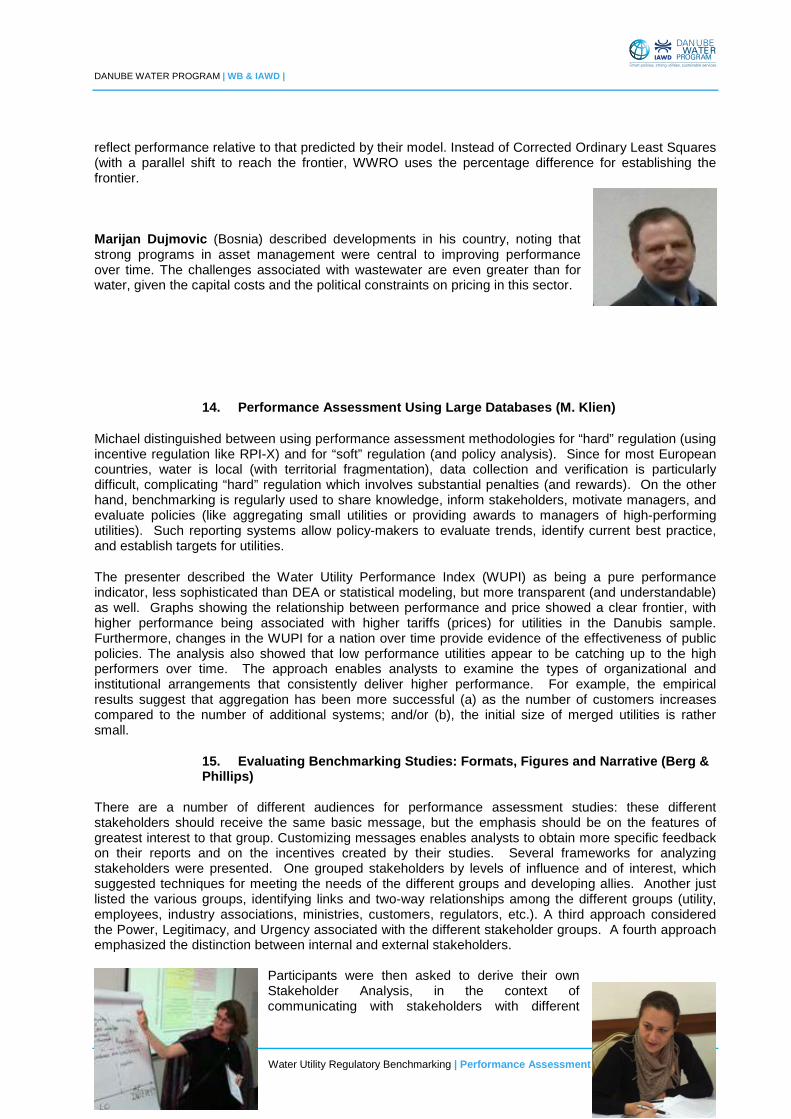
reflect performance relative to that predicted by their model. Instead of Corrected Ordinary Least Squares (with a parallel shift to reach the frontier, WWRO uses the percentage difference for establishing the frontier. Marijan Dujmovic (Bosnia) described developments in his country, noting that strong programs in asset management were central to improving performance over time. The challenges associated with wastewater are even greater than for water, given the capital costs and the political constraints on pricing in this sector.
14. Performance Assessment Using Large Databases (M. Klien)
Michael distinguished between using performance assessment methodologies for “hard” regulation (using incentive regulation like RPI-X) and for “soft” regulation (and policy analysis). Since for most European countries, water is local (with territorial fragmentation), data collection and verification is particularly difficult, complicating “hard” regulation which involves substantial penalties (and rewards). On the other hand, benchmarking is regularly used to share knowledge, inform stakeholders, motivate managers, and evaluate policies (like aggregating small utilities or providing awards to managers of high-performing utilities). Such reporting systems allow policy-makers to evaluate trends, identify current best practice, and establish targets for utilities.
The presenter described the Water Utility Performance Index (WUPI) as being a pure performance indicator, less sophisticated than DEA or statistical modeling, but more transparent (and understandable) as well. Graphs showing the relationship between performance and price showed a clear frontier, with higher performance being associated with higher tariffs (prices) for utilities in the Danubis sample. Furthermore, changes in the WUPI for a nation over time provide evidence of the effectiveness of public policies. The analysis also showed that low performance utilities appear to be catching up to the high performers over time. The approach enables analysts to examine the types of organizational and institutional arrangements that consistently deliver higher performance. For example, the empirical results suggest that aggregation has been more successful (a) as the number of customers increases compared to the number of additional systems; and/or (b), the initial size of merged utilities is rather small.
15. Evaluating Benchmarking Studies: Formats, Figures and Narrative (Berg & Phillips)
There are a number of different audiences for performance assessment studies: these different stakeholders should receive the same basic message, but the emphasis should be on the features of greatest interest to that group. Customizing messages enables analysts to obtain more specific feedback on their reports and on the incentives created by their studies. Several frameworks for analyzing stakeholders were presented. One grouped stakeholders by levels of influence and of interest, which suggested techniques for meeting the needs of the different groups and developing allies. Another just listed the various groups, identifying links and two-way relationships among the different groups (utility, employees, industry associations, ministries, customers, regulators, etc.). A third approach considered the Power, Legitimacy, and Urgency associated with the different stakeholder groups. A fourth approach emphasized the distinction between internal and external stakeholders.
Participants were then asked to derive their own Stakeholder Analysis, in the context of communicating with stakeholders with different

DANUBE WATER PROGRAM | WB & IAWD |
Water Utility Regulatory Benchmarking | Performance Assessment and Improvement | 22
levels of influence and interest. Daniela Stoilova (Bulgaria) shared the Diagram she developed, indicating allies and potential opponents of data collection and dissemination. In addition, Ina Haxhimusai (Albania) described the roles of different stakeholders in the Albanian context. The group then discussed strategies for helping political leaders understand ways performance might be improved via more comprehensive performance assessment initiatives.
16. Using Benchmarking Results: Designing Incentives (Berg & Phillips) Yardstick comparisons can be used for developing internal incentives (such as staff bonuses for cost-containment and quality improvements), for establishing regulatory incentives (targets and rewards), for identifying important patterns of performance (historical trends, current baselines, and best practice), for price reviews (to determine stretch factors for management), and for promoting public understanding of water system performance (where transparency contributes to public awareness).
After completing an Exercise where participants designed an incentive scheme for a utility in a particular situation, the group discussed how rankings and scores gave different types of information. Then different formats for presenting results were shown via PowerPoint. Finally, limitations of performance assessment indicators were discussed, including the difficulty of capturing complexity in a single index. Some key lessons were presented from Silver Mugisha’s International Water Association book on Utility Benchmarking and Regulation in Developing Countries: Practical Application of Performance Monitoring and Incentives. Behaviors, processes, and outcomes all warrant attention for reliable data bases.
Data Foundations and Action Plans Friday, 27 February 2015
9:00 – 13:30
Time Content Speaker(s)
9:00 17. Monitoring and Publicizing Performance Over Time
Identifying fundamental trends in cost and productivity; Examples of successful strategies for disseminating results. Incorporating Trend Analysis into Incentives. Evaluating Business Plans.
Sanford Berg, PURC and Michelle Phillips, PURC
9:45 Participant Presentations and Discussion
10:45 Coffee Break
11:00 18. Action Plans and Key Lessons
Developing strategic plans for engaging allies, opposition and other stakeholders; prerequisites to successful benchmarking;
Next steps for your organization; planning the next study; Developing individual Action Plans; Need for Technical skills and Leadership—organizational (internal) and strategic (external).
Sanford Berg, PURC

DANUBE WATER PROGRAM | WB & IAWD |
Water Utility Regulatory Benchmarking | Performance Assessment and Improvement | 23
12:15 Participants share Key Lessons from the course.
12:30 Awarding of Certificates
SUMMARY DAY 5
17. Monitoring and Publicizing Performance Over Time (Berg & Phillips) Day 5 provided an opportunity for underscoring the foundations for performance monitoring and for developing action plans for the weeks and months ahead. Particular attention was given to the range of stakeholders whose interests and roles must be taken into account by each element of the regulatory system. • Regulatory Commission (responsible for policy implementation in the sector) • Government Sector Ministry (charged with policy development) • Government Treasury (addressing fiscal issues) • International Investors (bond, equity, and strategic management teams) • Incumbent Service Providers &Potential Entrants (state-owned enterprise or privately owned) • Un-served Citizens (rural and urban poor) • Current and Future Customers (consider potential conflicts among groups) • Multilaterals and donors (as potential infrastructure project donor/funding agencies) Each group has its own set of objectives and its concerns. None can be omitted when designing a performance enhancement initiative. Ultimately, unless efficiency is not enhanced, those delivering service and those monitoring that delivery lose legitimacy in the eyes of other stakeholders. The exercise for this session required participants to evaluate their own agency or organization in terms of nine principles (developed by the Australian Competition and Consumer Commission): Communication Consultation (participation) Consistency Predictability (reflecting precedents) Flexibility (in response to changing conditions) Independence (autonomy) Effectiveness & Efficiency Accountability (clear procedures & appeals process) Transparency (openness of the process) These principles were then given weights (appropriate for each organization’s situation) and an overall grade (or indicator) was calculated. These scores were not shared, since they were meant for personal review and reflection—as part of the process of developing an Action Plan. Nevertheless, participants commented on the usefulness of such exercises—including an additional task: evaluating the scores and weights that might be given by other stakeholders. A benchmarking initiative cannot be established in isolation of current features of the groups collecting and analyzing data.

DANUBE WATER PROGRAM | WB & IAWD |
Water Utility Regulatory Benchmarking | Performance Assessment and Improvement | 24
Participants were then introduced to a Five Step “Answer” (based on work by Intermedia Associated) when someone raised a question about benchmarking or any other regulatory activity:
(1) Begin with an honest direct answer; (2) Position your message (“our role or goal”); (3) Provide evidence through a specific example, story, analogy, or facts; (4) Connect to the audience – recognize concerns or interests of listeners/readers; (5) Conclude with a summary or memorable image.
Marijan Dujmović (Bosnia and Herzegovina) noted that sometimes professionals act as though a Report or Incentive Scheme is clear when the jargon blurs the message. So clear communication is a very important aspect of the performance assessment and enhancement process.
18. Action Plans and Key Lessons (Berg) Throughout the week, leadership and the creation of effective teams were highlighted as key components for effective performance improvement initiatives. As scholars have noted, “The organization that prospers is not the most technically competent, but the most adaptable.” In particular, “Leadership mobilizes people to tackle difficult and often ambiguous problems and circumstances.” (R. Heifetz) The statement suggests that identifying potential conflicts is an important activity for those trying to change current procedures, including those associated with data collection, validation, analysis, and communication. Both technical and adaptive work are necessary for progress. Neither, by itself, is sufficient for progress. Participants then identified their own specific challenge to be addressed in the near future. They identified action steps, selecting a timeline, the stakeholders involved in the process, success indicators, and specific strategies to meet the challenge. The Key Lessons identified by participants were the following:
1. Collecting and evaluating data is a very complex process, involving a number of procedures and requiring a variety of skills (quantitative, analytical, communication, and collaborative).
2. Nothing is impossible. If others could do it, so can we. With support from programs like Danube, we can do benchmarking.
3. There is a significant difference between benchmarking for operators (internal) and regulatory benchmarking (external); however the processes are complementary.
4. Benchmarking requires a clearly defined goal. Decision-makers must know the purpose of the information. It is useless to collect data just for the sake of collecting data. Benchmarking can be used to establish rewards for high performance.
5. “Water is not electricity.” Analysts from multi-sector agencies need to adapt their experience in electricity to unique features of the water sector.

DANUBE WATER PROGRAM | WB & IAWD |
Water Utility Regulatory Benchmarking | Performance Assessment and Improvement | 25
6. There is no perfect method for making comparisons across utilities or over time. There are a number of benchmarking methodologies available to analysts.
7. Transparency goes hand in hand with benchmarking: citizens have access to more information about the utilities that affect their daily lives.
8. There are substantial benefits from networking with professionals—within and between countries. Exchanging practices between countries is particularly important.
9. Communication should not be left to the end of the process: stakeholders need to be made aware of what is happening and why it is happening. The Final Reports and implications for rate-making and incentives will be accepted by affected groups only if they have been involved in the process.
10. Stakeholder participation in the process can promote the view that the process is not a zero-sum game. Utilities, policy-makers, and consumers can all benefit from improved information systems—with the sector regulator (or responsible Ministry) serving as a catalyst for improving performance.
11. Stakeholder collaboration is one way to motivate the provision of useful (accurate and reliable) information. Regulators and utilities have the same objective: improving sector performance.
12. Data accuracy is important: the key is to take steps for improving accuracy over time.
13. Ultimately, incentives can be created using information on historical trends, current patterns of KPIs, and best practice.
14. From Sandy and Michelle: The water utility operators and regulators in the region are true professionals—dedicated to strengthening operational performance, resource sustainability, financial sustainability, and citizen awareness of the importance of water systems, for today and decades to come.
Evaluation Results
1-Strongly disagree; 2-Disagree; 3-Neutral; 4-Agree; 5-Strongly agree
I. Q1 Q2 Q3 Q4 Q5 Q6 Q7 Q8 Q9 Q10
Strongly Agree 5 8 9 5 6 4 5 4 5 5
Agree 8 6 5 7 7 9 8 10 7 9
Neutral 1 0 0 2 1 1 1 0 2 0
Disagree 0 0 0 0 0 0 0 0 0 0
Strongly Disagree 0 0 0 0 0 0 0 0 0 0
4.29 4.57 4.64 4.21 4.36 4.21 4.29 4.29 4.21 4.36

DANUBE WATER PROGRAM | WB & IAWD |
Water Utility Regulatory Benchmarking | Performance Assessment and Improvement | 26
Q1 Topics covered in the workshop were important and relevant to my agency 4.29
Q2 I learned something new or deepened my understanding of a familiar subject at the workshop 4.57
Q3 The workshop allowed me to freely express my opinion on regulatory challenges as well as successes 4.64
Q4 The workshop inspired and motivated me to implement further regulatory improvements 4.21
Q5 The workshop stimulated my thinking on the ways to address remaining regulatory challenges in my country 4.36
Q6 The structure and methodology of the workshop were conducive to my learning 4.21
Q7 The format of the workshop was the right combination of presentations and interactive, hands-on learning 4.29
Q8 The workshop presented examples and good practices that were relevant to my country and the Danube region 4.29
Q9 The workshop met my professional expectations 4.21
Q10 Overall evaluation of the workshop 4.36
II. What was the key benefit of the workshop for you?
*Exchange of experiences between different stakeholders
*The sharing of experiences of countries in the region.
*The experience of other countries regarding benchmarking also the Excel applications demonstrated during the workshop
*Water Utility Regulatory Benchmarking: Performance Assessment and Improvement issues, *Specific methods; key performance indicators, water company’s performance matrix exercises, regression analysis, data envelopment analysis, OPEX analysis etc.
*Meetings of DANUBIS Steering Group for coordinating future activities and approach to benchmarking regional activities etc.
DANUBE WATER PROGRAM | WB & IAWD |
Water Utility Regulatory Benchmarking | Performance Assessment and Improvement | 27
*The workshop presentations and inter-discussions on different experiences in the countries participating stimulated my thinking on the ways to address regulatory challenges.
*Now, I am clearly that is not choice for bench-marking but each agency can use the way that look appropriate.
*I learned about different between utility and regulatory benchmarking. Benchmarking is not just tool for comparison between utilities; it is important tool for decision makers (about tariffs, investments, institutional support etc.) *People I met during the workshop are also key benefit for all of us who work in same sector.
*Methodological approach regarding involvement of key stakeholders in the regulation process.
*Meeting other professionals and new ideas.
*To meet other colleagues from neighbor countries, to discuss matters with them and to learn on their experience; to learn some additional analysis methods and their implementation in the daily work
*Opportunity to establish good professional relationships, which is a good basis for cooperation
*Sheering different experiences from Regulatory from other countries.
*Practical materials provided.
*Data analysis and regression methods
III. What would you have liked to see improved?
*A little more specific exercises and more practical examples.
*Everything was very good; it would be good to have some participants from other countries
*In general course fulfilled my expectations
*Overall workshop meet my expectations, but I would suggest that the statistical information on data analysis shared during the presentation to have more general (economic or technical) interpretation of the data results in order to be understandable for all participants.
*I would like to see improved the development of performance indicators with the DEA software, because for my opinion participants need more explanation of the results after using this software during the workshop.
*I would like to apply mathematics methods we learned during the course in the benchmarking analyses of my company.
*Chapter: Owner - process of assigning responsibility through the Regulatory Body.
*Maybe, present into more details the analysis in Excel.
*More open analyses, more complexity (case studies)
*Better cooperation in order to achieve the unique method of ranking and benchmarking
*It was organized in excellent manner all topics were covered

DANUBE WATER PROGRAM | WB & IAWD |
Water Utility Regulatory Benchmarking | Performance Assessment and Improvement | 28
*More practical cases
IV. Which regulatory topics would you like future workshops to cover?
*Ensuring implementation, incentives and penalties, subsidies.
*Topics regarding tariff calculation and water losses
*Some of issues that have been presented on line with DEA, OPEX analyses and presenting the way of their implementations.
*Data collection & accuracy evaluation, best practices and experiences from the region
*The workshop had o lot of topics, but it would be better, if you will add more deeply analyses of data and verification of their accuracy.
*Tariffing and public relations.
*Governance
*Involvement public in regulation
*New methods on challenging the firms.
*Rate of return of water utilities; market aggregation; regulation through license procedure
*Asset management and investments within an efficiency perspective
*Best practices of Tariff setting for water and waste water, including water treatment plants.
*Practical benchmarking cases
V. Additional comments and/or suggestions:
*Compliments to the lecturers.
*Having the opportunity to more courses like this one that we have had.
*All the professors were great and made the workshop interactive for us. I would like that next time giving more hours to the software analyze.
*I will recommend that participants spend one all day preparing their own analyses, using excel tools (working in few groups) and to present their conclusions.
*It was my first workshop of this sort. I do not have additional comments.
*It was a pleasure meeting the Danube water professionals.
*Info about soft regulatory skills were also very beneficial
*It was a very useful workshop and hope that we are going to use the experiences from workshop on our daily work in order to improve our Regulatory practices.

DANUBE WATER PROGRAM | WB & IAWD |
Water Utility Regulatory Benchmarking | Performance Assessment and Improvement | 29

DANUBE WATER PROGRAM | WB & IAWD |
Water Utility Regulatory Benchmarking | Performance Assessment and Improvement | 30
Name Organization Country Berg Sanford University of Florida United States Demiri Etleva Water Regulatory Authority Albania Didanovic Snezana Ministry of Sustainable Development and
Tourism Montenegro
Dujmović Marijan Association for Water and Environmental Protection Sector “Aquasan Network in B&H”
Bosnia and Herzegovina
Duraku Vehbi WWRO of Kosovo, Pristine Republic of Kosovo
Feka Hysni WWRO of Kosovo, Pristine Republic of Kosovo
Gabric Stjepan World Bank Croatia Hahn Mirela Ministry of Agriculture Croatia Hasani Sami WWRO of Kosovo, Pristine Republic of
Kosovo Haxhimusai Ina Water Regulatory Authority Albania Horváth Márk Hungarian Energy and Public Utility Regulatory
Authority Hungary
Kastchiev Ivaylo State Energy and Water Regulatory Commission Bulgaria Kerti Zsolt Hungarian Energy and Public utility Regulatory
Authority Hungary
Klien Michael Austrian Institute of Economic Research (WIFO) Austria Kolev Ivaylo The World Bank Bulgaria Lozan Olga National Energy Regulatory Agency Republic of
Moldova Melo Baptista
Jaime The Water and Waste Services Regulation Authority
Portugal
Michaud David World Bank Austria Mija Alexandru National Energy Regulatory Agency Republic of
Moldova Petrovic Milica Vodacom Montenegro Phillips Michelle University of Florida United States Preteni Raif WWRO Kosovo, Pristine Republic of
Kosovo Rosic Milorad Association for Water Technology and Sanitary
Engineering Serbia
Schlirf Richard MacroConsulting Argentina Stoilova Daniela State Energy and Water Regulatory Commission Bulgaria Tsaplin Valerii National Energy and Utilities Regulatory
Commission Ukraine
Yatsevyuk Oleksiy National Energy and Utility Regulatory Commission
Ukraine
Zekjiri Kasam Ministry of environment and physical planning Macedonia

DANUBE WATER PROGRAM | WB & IAWD |
Water Utility Regulatory Benchmarking | Performance Assessment and Improvement | 31

DANUBE WATER PROGRAM | WB & IAWD |
Water Utility Regulatory Benchmarking | Performance Assessment and Improvement | 32
Hotel Sirius
R Agim Ramadani Pristina 10000 Kosovo Tel: +381(0)38 22 22 80 Web: http://hotelsirius.net/web/?lang=en
Hotel Sirius is located in the heart of Pristina. The Parliament Building, the National Theatre and the Mother Theresa Square are within a 3-minute walk.

DANUBE WATER PROGRAM | WB & IAWD |
Water Utility Regulatory Benchmarking | Performance Assessment and Improvement | 33
World Bank / IAWD Danube Water Program supports smart policies, strong utilities, and sustainable water and wastewater services in the Danube Region by partnering with regional, national and local stakeholders, promoting an informed policy dialogue around the sector’s challenges and strengthening the technical and managerial capacity of the sector’s utilities and institutions.
www.danube-water-program.org [email protected]
David Michaud World Bank program leader c/o World Bank A – 1020 Vienna, Praterstrasse 31/20 ++ 43 1 217 07 38 [email protected]
Philip Weller IAWD program coordinator c/o World Bank Office A – 1020 Vienna, Praterstrasse 31/20 ++ 43 1 217 07 48 [email protected]