Water use and yield response of tomato as influenced by...
12
July 2010 International Agricultural Engineering Journal Vol. 19, No. 1 19 Water use and yield response of tomato as influenced by drip and furrow irrigation B. Panigrahi 1 , D.P. Roy 2 , S. N. Panda 3 (1. Orissa University of Agriculture and Technology, Bhubaneswar-751003, Orissa, India; 2. Department of Agriculture and Food Engineering, Indian Institute of Technology, Kharagpur, 721 302, India) Abstract: Field experiments were conducted for three years (2002, 2003 and 2004) on sandy loam soil at the Regional Research and Technology Transfer Station, Chiplima, Orissa, India to study the effects of furrow irrigation and variable water supply by drip irrigation on yield and water use of tomato crop. The study was conducted in randomized block design with four treatments having five replications each. The treatments were (i) T 1 = drip irrigation at 100% crop evapotranspiration (ET c ) replenishment, (ii) T 2 = drip irrigation at 80% ET c replenishment, (iii) T 3 = drip irrigation at 60% ET c replenishment and (iv) T 4 = furrow irrigation at 1.2 IW: CPE (IW = irrigation water of depth 5 cm and CPE = cumulative pan evaporation). Tomato variety Arjun was planted in all the treatments with 90 cm spacing from row to row and 75 cm spacing from plant to plant. In drip irrigation, crops were irrigated at 2-day intervals. Studies on soil moisture distribution revealed that the vertical movement of soil moisture was higher than the horizontal one for different time intervals after application of irrigation for all the drip treatments. However, the moisture distribution pattern indicated that there was maximum extraction of soil moisture from 15-30 cm depth that resulted in obtaining higher values of ET c for said profile layer than for all other layers for all the treatments. Treatment T 1 was observed to maintain higher values of moisture content both horizontally and vertically throughout the crop growth period than all other treatments. Because of this reason, the yield of crop was found to be maximal (180.97 q/ha) for the treatment T 1 (drip irrigation at 100% ET c replenishment) whereas those for treatments T 2 , T 3 and T 4 were 162.77, 145.12 and 156.86 q/ha, respectively. The study reveals that drip irrigation at 100% ET c replenishment in tomato can increase the yield by 15.4%, besides saving 17.9% more costly irrigation water than the conventional furrow irrigation practiced by most of the farmers. Keywords: drip, furrow, irrigation schedule, evapotranspiration, treatment, moisture content Citation: Panigrahi B., D.P. Roy, and S. N. Panda. 2010. Water use and yeld response of tomato as influenced by drip and furrow irrigation. International Agricultural Engineering Journal, 19(1): 19-30. 1 Introduction Water is the most limiting natural resource hindering the economic development of any developing country, Received date: 2009-09-12 Accepted date: 2010-05-20 Biographies: B. Panigrahi, Professor and Vice Chancellor. D.P. Roy, Professor and Vice Chancellor, Orissa University of Agriculture & Technology, Bhubaneswar-751003, Orissa, India. S.N. Panda, Professor, Department of Agriculture & Food Engineering, Indian Institute of Technology, Kharagpur, India-721 302 Corresponding author, Professor, Orissa University of Agriculture & Technology, Bhubaneswar-751003, Orissa, India. Email: [email protected] including India. India is blessed with abundant water resources; however, due to various physiographic constraints, legal constraints and the present method of utilization, the utilizable water for irrigation is being exhausted. Further, the increasing demand of water for expanding urbanization and industrialization will make the situation more critical because the share of water designated for irrigation will dwindle in near future. It is therefore essential to formulate an efficient and economically viable irrigation management strategy in order to irrigate more land area with the existing water resources. Improper irrigation management practices not only waste scarce and expensive water resources but
Transcript of Water use and yield response of tomato as influenced by...

July 2010 International Agricultural Engineering Journal Vol. 19, No. 1 19
Water use and yield response of tomato as influenced by drip and
furrow irrigation
B. Panigrahi1, D.P. Roy2, S. N. Panda3 (1. Orissa University of Agriculture and Technology, Bhubaneswar-751003, Orissa, India;
2. Department of Agriculture and Food Engineering, Indian Institute of Technology, Kharagpur, 721 302, India)
Abstract: Field experiments were conducted for three years (2002, 2003 and 2004) on sandy loam soil at the Regional
Research and Technology Transfer Station, Chiplima, Orissa, India to study the effects of furrow irrigation and variable water
supply by drip irrigation on yield and water use of tomato crop. The study was conducted in randomized block design with
four treatments having five replications each. The treatments were (i) T1 = drip irrigation at 100% crop evapotranspiration
(ETc) replenishment, (ii) T2 = drip irrigation at 80% ETc replenishment, (iii) T3 = drip irrigation at 60% ETc replenishment and
(iv) T4 = furrow irrigation at 1.2 IW: CPE (IW = irrigation water of depth 5 cm and CPE = cumulative pan evaporation).
Tomato variety Arjun was planted in all the treatments with 90 cm spacing from row to row and 75 cm spacing from plant to
plant. In drip irrigation, crops were irrigated at 2-day intervals. Studies on soil moisture distribution revealed that the
vertical movement of soil moisture was higher than the horizontal one for different time intervals after application of irrigation
for all the drip treatments. However, the moisture distribution pattern indicated that there was maximum extraction of soil
moisture from 15-30 cm depth that resulted in obtaining higher values of ETc for said profile layer than for all other layers for
all the treatments. Treatment T1 was observed to maintain higher values of moisture content both horizontally and vertically
throughout the crop growth period than all other treatments. Because of this reason, the yield of crop was found to be
maximal (180.97 q/ha) for the treatment T1 (drip irrigation at 100% ETc replenishment) whereas those for treatments T2, T3 and
T4 were 162.77, 145.12 and 156.86 q/ha, respectively. The study reveals that drip irrigation at 100% ETc replenishment in
tomato can increase the yield by 15.4%, besides saving 17.9% more costly irrigation water than the conventional furrow
irrigation practiced by most of the farmers.
Keywords: drip, furrow, irrigation schedule, evapotranspiration, treatment, moisture content
Citation: Panigrahi B., D.P. Roy, and S. N. Panda. 2010. Water use and yeld response of tomato as influenced by drip and
furrow irrigation. International Agricultural Engineering Journal, 19(1): 19-30.
1 Introduction
Water is the most limiting natural resource hindering
the economic development of any developing country,
Received date: 2009-09-12 Accepted date: 2010-05-20
Biographies: B. Panigrahi, Professor and Vice Chancellor. D.P.
Roy, Professor and Vice Chancellor, Orissa University of
Agriculture & Technology, Bhubaneswar-751003, Orissa, India.
S.N. Panda, Professor, Department of Agriculture & Food
Engineering, Indian Institute of Technology, Kharagpur, India-721
302
Corresponding author, Professor, Orissa University of
Agriculture & Technology, Bhubaneswar-751003, Orissa, India.
Email: [email protected]
including India. India is blessed with abundant water
resources; however, due to various physiographic
constraints, legal constraints and the present method of
utilization, the utilizable water for irrigation is being
exhausted. Further, the increasing demand of water for
expanding urbanization and industrialization will make
the situation more critical because the share of water
designated for irrigation will dwindle in near future. It
is therefore essential to formulate an efficient and
economically viable irrigation management strategy in
order to irrigate more land area with the existing water
resources. Improper irrigation management practices
not only waste scarce and expensive water resources but

20 July 2010 International Agricultural Engineering Journal Vol. 19, No. 1
also decrease crop yield (Imtiyaz et al. 2000; Tiwari et al,
1998). In the present-day context, improvement in
irrigation practices, including schedules and methods, is
needed to increase crop production and to sustain
productivity levels.
Furrow irrigation is the conventional method widely
used to irrigate most of the vegetable crops grown in
Orissa, India. However, this method uses more water
compared to other high-tech water-saving irrigation
methods such as sprinkler, drip etc. Many researchers
have reported the higher application efficiency of drip
irrigation systems over the conventional furrow irrigation
systems (Tiwari et al., 1998; Bhandari, 1995; Hanson et
al., 1997; Fekadu and Teshome, 1998). Sivanappan and
Padmakumari (1980) compared drip and furrow irrigation
systems in vegetables and found that there was savings of
67% to 80% more irrigation water than surface irrigation
methods. Based on a study conducted at Rahuri, India,
Khade (1987) reported 60% higher yield of okra with
water savings of 40% under drip irrigation as compared
to furrow irrigation. Tiwari et al. (1998) reported that
100% irrigation requirement met through drip irrigation
along with black plastic mulch gave the highest yield of
okra (14.51 t/ha) with 72% yield increase as compared to
furrow irrigation.
In drip irrigation systems, water in small amounts but
at frequent intervals is applied to the crop. Generally,
water is applied in the root zone of the crop, because of
which the surface runoff and deep percolation below the
effective root zone are avoided. This increases
application efficiency, making the system more
water-efficient. The distribution of moisture in the root
zone is basically influenced by the type of the soil,
discharge rate of the emitter and duration of irrigation.
Efficiency of water application depends on the hydraulics
of the moisture advancement pattern under the drip
emitter. The flow phenomenon in a drip irrigation
system can be analyzed on the basis of moisture spread in
an unsaturated zone from a point source of water
application (Bhandari, 1995).
Tomato is an important vegetable crop grown in
almost all parts of India and is one of the most preferred
vegetable crops in Orissa (eastern state of India). Due to
lack of information on irrigation management techniques,
the average yield of the crop in Orissa is very low
because of either excess or deficit soil moisture. The
crop is generally grown with furrow irrigation, which has
low application efficiency. Many farmers in the state
are now becoming interested in growing the crop with
drip irrigation. The government is also offering
financial assistance to farmers who use this technique,
especially for fruit and vegetable crops. However, some
farmers in the state are reluctant to adopt drip technology
due to lack of information on irrigation scheduling
techniques. Also, not much information on seasonal
water requirements of tomato by drip irrigation is
available. Hence, the present study was undertaken to
examine the soil moisture distribution pattern under
different irrigation schedules by drip irrigation and
suggest the most efficient irrigation schedule that would
attain the highest yield and water-use efficiency of the
crop. Another objective of the study was to find out the
water requirement and yield of the crop grown by the
conventional furrow irrigation method, which is now
practiced by the farmers in the region, and compare it
with that grown by the drip system.
2 Materials and method
Field experiments were conducted at the Regional
Research and Technology Transfer Station in Chiplima,
Orissa, India for three consecutive years in winters 2002,
2003 and 2004 to study the soil moisture distribution
pattern and ultimately its impacts on yield and water use
efficiency of tomato crop which was irrigated by drip as
well as furrow irrigation methods. The latitude,
longitude and altitude of the study area are 20°21′N.
80°55′E and 178.8 m above mean sea level, respectively.
The area falls under the sub-humid climatic condition in
the eastern part of the country. The total rainfall in the
study area during crop growing season (8th January to 3rd
April) was 32.0 mm, 29.0 mm, and 38.0 mm in 2002,
2003 and 2004, respectively. The mean daily air
temperature during the study period ranged from 15.4℃
to 30.3℃, 16.8℃ to 29.9℃ and 16.1℃ to 30.5℃, and
mean daily relative humidity raged from 42.5% to 68.7%,
45.2% to 70.3%, and 44.4% to 71.7% in 2002, 2003 and

July 2010 Water use and yeld response of tomato as influenced by drip and furrow irrigation Vol. 19, No. 1 21
2004, respectively.
The soil texture of the study area is sandy loam.
Average values for bulk density, volumetric moisture
content at field capacity and permanent wilting point, and
final steady state infiltration rate are 1.52 gm/cm3, 26 %,
10 %, and 10 mm/h, respectively. Average pH, EC, and
organic carbon were 6.3, 0.09 dS/m, and 0.513%,
respectively.
The experimental technique followed four treatments
having five replications each, and the design followed
was randomised block design. The four treatments were
(i) T1 = drip irrigation at 100% crop evapotranspiration
(ETc) replenishment, (ii) T2 = drip irrigation at 80% ETc
replenishment (iii) T3 = drip irrigation at 60% ETc
replenishment and (iv) T4 = furrow irrigation at 1.2 IW:
CPE (IW = irrigation water of depth 5 cm and CPE =
cumulative pan evaporation). Irrigation scheduling
based on the ratio of irrigation water to cumulative pan
evaporation (IW: CPE) is one of the simplest methods for
which no sophisticated instrument is required. Only a
class A pan evaporimeter is required to find out daily pan
evaporation value, and for any chosen IW: CPE value,
5 cm irrigation is applied irrespective of plant growth
stage when the desired cumulative pan evaporation (CPE)
value is reached. Because of its simplicity in use,
farmers of India popularly adopt the method, and
therefore it is the recommendation of the Directorate of
All India Co-ordinate Projects for Research on Water
Management and various State Agricultural Universities
to use the IW: CPE approach for irrigation scheduling of
various crops, including tomato. Earlier studies were
undertaken by many authors to find out the water
requirement of tomato by the IW: CPE approach (Cripps
George, and Oakley, 1982, Singh, Joshi, and Singh.,
1988). In the present experimental study, the furrow
irrigation schedule of 1.2 IW: CPE, which is
recommended to the farmers for use in tomato
(Anonymous, 2004), was taken as a control to compare
the water requirement and water-use efficiency of tomato
by drip and furrow irrigation systems.
Tomato variety Arjun was planted in all the
treatments with 90 cm spacing from row to row and
75 cm spacing from plant to plant. In furrow treatment,
irrigation was applied to each furrow. Furrows were laid
at 0.25% bed slope. Seedlings of 25 days duration were
planted in plots with both drip and furrow treatments. In
the case of drip irrigation, lateral spacing of the drip
laterals were 1.8 m and emitter/dripper spacing was
0.75 m. There were two crop rows per each lateral and
one emitter/dripper per plant. Figure 1 represents the
layout plan of the drip irrigation system. Figure 2
represents the individual plot-drip system design along
with the planting geometry. The net plot area of all
treatments was 5.5 m×4.5 m. Buffer spaces of 1 m
width were left in between each two plots to minimize the
chances of moisture movement from one treatment to the
other or from one replication to the other. Irrigation
interval to drip was once in 2 days. Irrigation was
supplied from a bore well by a 1 HP submersible pump.
The furrows had dikes at the downstream end to
prevent runoff. Polyethylene sheeting was inserted to a
depth of 60 cm in the inner side of dikes of all the plots to
prevent lateral seepage. In furrow treatments, 5 cm
irrigation (IW = 5 cm) was applied to the crop irrespective
of crop growth stage when CPE was 42 mm (IW: CPE =
1.2). CPE was taken as the sum of daily pan
evaporation after deducting the rainfall received
subsequent to the previous irrigation. Tomato (var.-
Arjun) of 86 days duration was planted on 8th January and
harvested on 3rd April of each year.
Application of N, P, and K fertilizers were 150, 100,
and 100 kg/ha, respectively. Nitrogen was applied 50%
as pre-planting and 50% as top-dressing one month after
planting. Phosphate and potash applied were 100%
pre-planting each. All pre-planting fertilizers were
applied in pits whereas top dressing fertilizer was applied
as ring placement in all drip and furrow treatments.
Drip irrigation was scheduled once in two days based
on the two previous days’ crop evapotranspiration data at
100, 80 and 60% level. Irrigation water applied by drip to
each plant every two days (V) was computed as
(Anonymous, 2002):
V = Two days CPE×Kp×Kc×A×Wp (1)
Where: V is volume of water in lit; CPE is cumulative
pan evaporation, mm; Kp is pan coefficient; Kc is crop
coefficient; A is area around each plant served by the

22 July 2010 International Agricultural Engineering Journal Vol. 19, No. 1
emitter for irrigation, m2; and Wp is wetted percentage.
Figure 1 Layout plan of experimental setup
Value of Kp for the study area was assumed as 0.8
(Michael, 1981). Based on the field experiment, the
values of Kc of tomato for crop establishment, crop
development, mid season and maturity stages were taken
as 0.45, 0.75, 1.10 and 0.65, respectively. The value Wp
was assumed as 0.5 during crop establishment stage and
0.75 during other stages (Anonymous, 2002). Since,
during the establishment stage, crop coverage was smaller,
requiring less irrigation, Wp was assumed as a low value
(0.5) compared to other stages. The area around each
plant served by the emitter for irrigation was estimated as
A = 0.90×0.75 = 0.675 m2.
Operating duration of each emitter was estimated as:
Operating duration = V / (Number of emitters/plant x
emitter discharge rate) (2)
Where: operating duration is in hours, V is volume in lit
July 2010 Water use and yeld response of tomato as influenced by drip and furrow irrigation Vol. 19, No. 1 23
and emitter discharge rate is in L/h.
Volume of irrigation water and hence the operating
duration of each irrigation thus varied according to
evaporation rate, crop growth stage as well as treatment
irrigation schedules (i.e., percentage level of crop
evapotranspiration replenishment--100%, 80% and 60%
level). In the experiment, the number of emitters per
plant was kept at 1 and the emitter discharge rate, which
was 3 L/h, was kept fixed for all treatments.
2.1 Design and layout of drip system
The design and layout plan of the drip irrigation
system is shown in Figure 1. From the water source
(bore well), the irrigation water was pumped with a
submersible 1 HP pump and was supplied to the plots
through a PVC main pipe (63 mm diameter) fitted with a
gate valve. Water was supplied to the drip treatments
through the PVC main pipe after passing through a screen
filter. From the main line, sub-mains of PVC pipes
(40 mm diameter) were taken off. From the sub-mains,
laterals of 12 mm diameter were taken at 1.8 m apart.
Drippers/emitters were connected to laterals through
small-size inbuilt PVC pipes. Laterals were laid at the
center of two rows and there was one emitter/dripper per
plant (Figure 2). Flush valves were provided at the end
of sub-mains. Lateral tapes (12 mm) were fixed in each
lateral to control irrigation as per treatments. The
discharge rate of each emitter was kept fixed for all
treatments and was 3 L/h. There were 12 emitters per
lateral and so the total discharge rate of each lateral was
36 L/h. There were nine laterals connected to each
sub-main, and the discharge rate of each sub-main was
324 L/h. The discharge rate of each main line having
five sub-mains was 1,620 L/h. Water was supplied to
furrow treatments through separate mains and sub-mains
of the same size PVC pipes along with gate and flush
valve as used in drip system. A Y joint with rubber
tubes connected at one end to the delivery pipe of the
pump and the other two ends connected to the main pipes
used to deliver irrigation to the drip and furrow
treatments was used in the experiment (Figure 1).
Further, a Parshall flume was used to measure the
irrigation water supplied to all plots in the furrow
treatments.
Figure 2 Individual plot-Drip system design and planting
geometry in tomato
The water requirement of the crop was computed as
the sum of the irrigation water, effective rainfall, and soil
moisture contribution from the effective root zone depth
of the crop. The effective root zone depth of the crop is
assumed as 60 cm. Soil moisture contribution from the
effective root zone was measured and the crop
evapotranspiration (ETc) was estimated (Ahmed and
Mishra, 1987) as follows:
ETc = P-R + Ir S-D (3)
Where: P is precipitation; Ir is irrigation; R is surface
runoff; S is change in profile soil moisture storage; and
D is downward flux below the crop root zone (deep
percolation). In the above equation, groundwater
contribution to crop root zone was neglected because the
groundwater table was at more than 1.5 m below crop
effective root zone.
The component (P-R) may be termed as effective
rainfall. In all the three years of the experiments,
average seasonal rainfall during the crop growth period
was only 3.3 cm. There was no day having rainfall
more than even 1 cm. Further, the potential
evapotranspiration during the cropping season was higher
and so it was therefore assumed that rainfall was 100%

24 July 2010 International Agricultural Engineering Journal Vol. 19, No. 1
effective (Michael, 1981).
Deep percolation was estimated (Ahmed and Mishra,
1987) as:
D = Kh/z (4)
Where: D is deep percolation, mm/d; h/z is water
potential gradient between 60 cm and 75 cm depth below
soil surface; and K is unsaturated hydraulic conductivity,
mm/d; which is a function of volumetric soil moisture, .
During the crop growing period, gravimetric soil
moisture contents on percent basis were determined from
0-15 cm, 15-30 cm, 30-45 cm and 45-60 cm layers of
each plot on every second day. These values were
converted to percent volumetric basis () by multiplying
the respective values with bulk density of soil of each
respective layer. Soil water content (SWC) in each layer
was calculated by multiplying the soil layer thickness
(15 cm) with . Finally, total SWC in the effective root
zone depth of the crop was calculated by adding the
values of SWC from the four layers. Soil moisture
characteristic curves and saturated hydraulic conductivity
were measured by standard laboratory methods for the
experimental site. The functional relation between K
and was estimated using the method of Green and
Corey (1971). Tensiometers were placed at 60 cm and
75 cm depths in each plot for determination of water
potential gradient.
The moisture distribution patterns for drip irrigated
plots were also studied by recording moisture content at
different depths and at different radial distance around the
emitter/plant over three hours at 30 minute intervals.
Data on crop yield was recorded for all treatments.
Water-use efficiency (WUE) of the crop for each
treatment was computed from yield and water
requirement data.
3 Results and discussion
3.1 Irrigation requirement and water use
Water requirement including irrigation requirement of
the crop for all the treatments in all three years of the
study period is given in Table 1. Irrigation requirement
of furrow treatment was found to be higher than the drip
treatments in all years. The irrigation requirement in the
case of furrow treatments was found to range from 25 to
30 cm in different years, with a mean value of 26.8 cm.
In case of drip irrigation, the treatment with 100% ETc
was observed to require the highest irrigation (irrigation
ranging from 20.0 to 24.4 cm) whereas the treatment with
60% ETc was found to require the lowest irrigation
(ranging from 16.3 to 17.4 cm) in all the three years.
The mean irrigation requirements of drip treatments with
100, 80 and 60% levels of ETc were obtained as 22.0,
19.2 and 17.0 cm, respectively (Table 1). Irrigation
requirement for 100% levels of ETc treatment was
observed to be the higher than all other drip treatments
because more irrigation water was required by the plant at
this level. Total mean seasonal irrigation requirement of
crop at 100% levels of ETc was 29.4% more than that at
60% level of ETc and 14.6% more than that at 80% level
of ETc. However, compared to the furrow treatment, all
the drip treatments needed less irrigation; mean seasonal
values of savings of irrigation water in drip treatments
ranged from 17.9% to 36.6% as compared to furrow
treatment.
Table 1 Irrigation and water requirement of tomato as influenced by irrigation schedules and methods
Irrigation Year
Methods Schedules
Irrigation requirement /cm
Effective rain /cm
Soil moisture contribution /cm
Deep percolation /cm
Water requirement/cm
100% ETc 24.4 3.2 -2.0 0 25.6
80% ETc 20.0 3.2 1.3 0 24.5 Drip
60% ETc 17.4 3.2 3.0 0 23.6 2002
Furrow 1.2 IW:CPE 30.0 3.2 -3.5 4.4 29.7
100% ETc 21.6 2.9 -0.7 0.3 23.8
80% ETc 19.3 2.9 0.4 0 22.6 Drip
60% ETc 17.2 2.9 1.8 0 21.9 2003
Furrow 1.2 IW:CPE 25.0 2.9 -2.2 3.8 26.5

July 2010 Water use and yeld response of tomato as influenced by drip and furrow irrigation Vol. 19, No. 1 25
100% ETc 20.0 3.8 -0.4 0 23.4
80% ETc 18.3 3.8 0.2 0 22.3 Drip
60% ETc 16.3 3.8 0.9 0 21.0 2004
Furrow 1.2 IW:CPE 25.0 3.8 -1.8 4.1 27.0
100% ETc 22.0 3.3 -1.0 0.1 24.3
80% ETc 19.2 3.3 0.6 0 23.1 Drip
60% ETc 17.0 3.3 1.9 0 22.2 Mean
Furrow 1.2 IW:CPE 26.8 3.3 -2.4 4.1 27.7
The water requirement of the crop with the furrow
treatment was also found to be highest compared to any
drip treatments in all three years of study. The water
requirement for the furrow treatment was found to range
from 26.5 to 29.7 cm with a mean value of 27.7 cm.
The mean water requirement of tomato (variety Arjun) by
furrow irrigation schedules at 1.2 IW: CPE method for
sandy loam soil in the same study area was earlier
reported to be 28.4 cm (Panigrahi, 2006). Water
requirement for the furrow treatment was observed to be
maximal because of higher need of irrigation water.
However, drip treatments required less water, with
mean values of 24.3, 23.1 and 22.2 cm for 100%, 80%
and 60% levels of ETc treatments, respectively (Table 2).
There was a significant saving of 20% water in drip
irrigation with 60% level of ETc as compared to
conventional furrow irrigation. On average, there was
16.2% reduction in water requirement in the crop when
the furrow irrigation method was substituted by drip.
Table 2 Water requirement of tomato as affected by
irrigation schedules and methods (pooled over 2002,
2003 and 2004) with statistical test parameters
Irrigation
Methods Schedules
Water requirement /cm
Statistical parameters
100% ETc 24.3 SEm(±) = 0.11
80% ETc 23.1 CD (0.05) = 0.30 Drip
60% ETc 22.2 C.V. = 3.51%
Furrow 1.2 IW: CPE 27.7
The study reveals that furrow irrigation is not a water
efficient method of irrigation because there is undesired
percolation loss which in no way helps in plant water
uptake and hence in the growth and yield of the crop.
On an average, there is 4.1 cm percolation loss in the case
of furrow treatments, whereas drip treatments result in no
percolation (Table 1). The occurrence of percolation
loss in the case of furrow irrigation may be due to a
higher amount of irrigation (5 cm) applied to the field at
one time irrespective of crop growth stage. This makes
the irrigation method less efficient and hence
uneconomical, especially for vegetable crops. Similar
conclusions on disadvantages of furrow irrigation have
been reported by other authors (Imtiyaz et al., 2000,
Panigrahi, 2006).
3.2 Seasonal crop evapotranspiration
Seasonal crop evapotranspiration (ETc) of tomato is
found to range from 4.0 to 8.0 cm, 3.6 to 7.7 cm, 3.5 cm
to 7.3 cm and 4.2 cm to 7.6 cm for drip irrigation at 100%,
80% and 60% level of ETc and furrow irrigation,
respectively, for various soil profile layers (Table 3).
The extraction of soil moisture for different treatments is
found to be at maximum for profile layer of 15-30 cm,
indicating that root density is highest in this layer
compared to other layers, because of which plants uptake
more soil moisture, resulting higher values of ETc. The
study also reveals that drip treatment with 100% ETc level
gives higher values of seasonal ETc for all the profile
layers compared to all other treatments. The mean
seasonal ETc value of tomato for drip with 100% ETc
level was 24.2 cm, which is the highest amongst all the
drip treatments and even 2.5% more than the furrow
treatment (Table 3). The reason for obtaining higher
ETc values for drip treatments may be due to low but
frequent irrigation, which avoids percolation and runoff
losses but meets the water uptake demand of the crop in
due time.
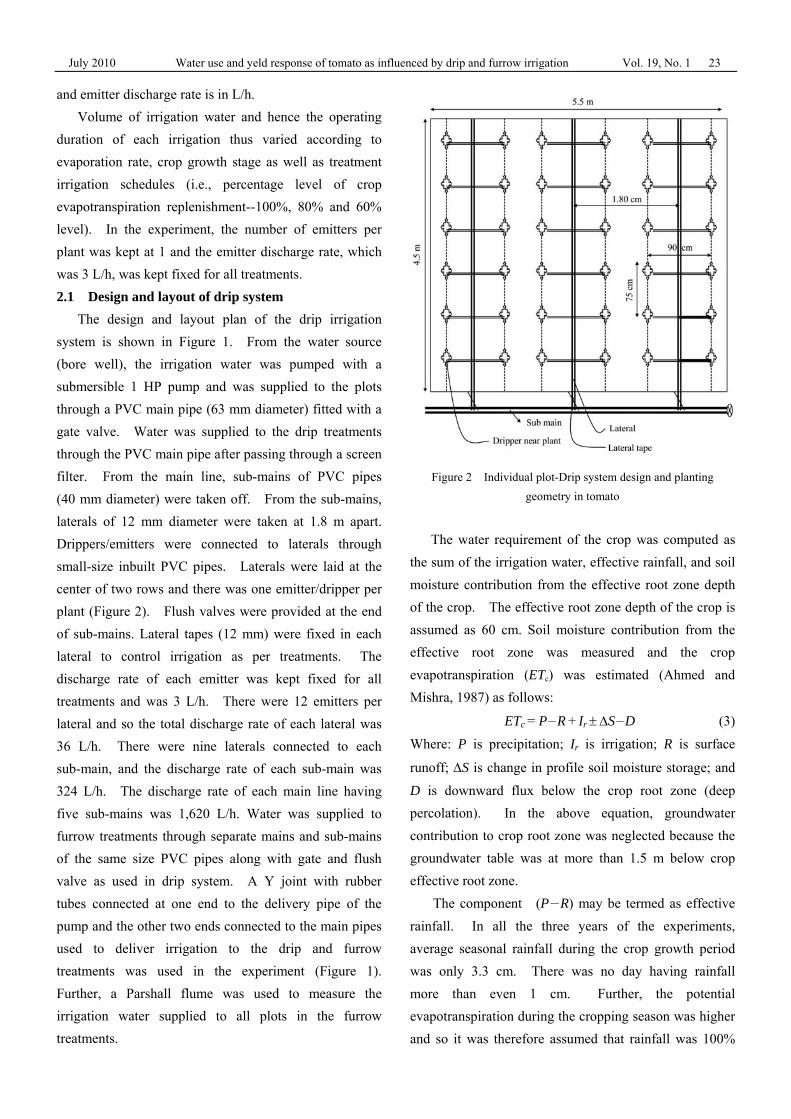
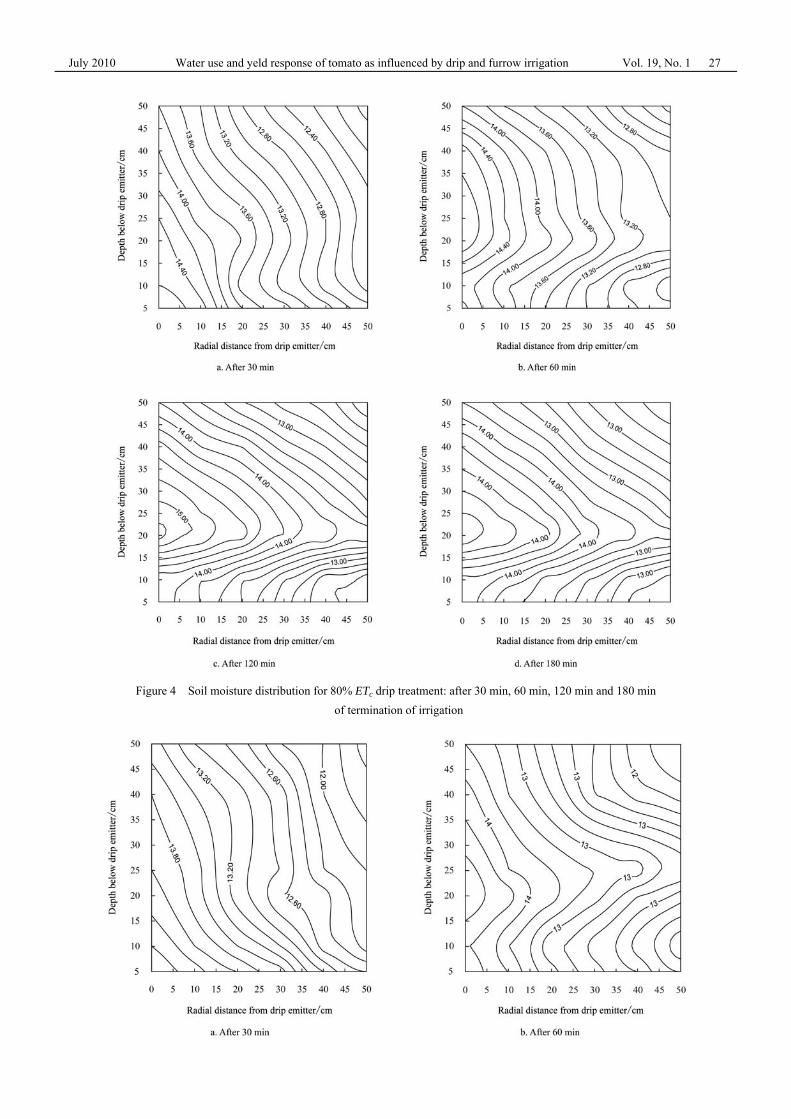
Variation of soil moisture in terms of lateral and
vertical movement below the drip emitters as well as at
different radial distances from the drip emmiters after 30,
60, 120 and 180 min of termination of irrigation for
treatments T1, T2 and T3 is presented in Figures 3, 4 and 5,

26 July 2010 International Agricultural Engineering Journal Vol. 19, No. 1
respectively. It was observed that the soil moisture
contour lines are denser for drip with 100% level of ETc
treatments than for all other drip treatments, indicating
that the plant water uptake is maximal for this treatment.
The vertical movement of soil moisture was found to be
higher than the horizontal one for different time intervals
after application of irrigation for all the drip treatments.
However, the moisture distribution pattern indicates that
there is more extraction of soil moisture from 15-30 cm
depth than from all other profile depths. This has
resulted in obtaining higher values of ETc for the 15-
30 cm profile layers than all other layers for all the
treatments (Table 3).
Table 3 Mean seasonal actual evapotranspiration (ETc) of
tomato as related to different soil profile layers
Irrigation Soil profile layers/cm
Methods Schedules 0-15 15-30 30-45 45-60
Total seasonal ETc /cm
100% ETc 5.9 8.0 6.3 4.0 24.2
80% ETc 5.7 7.7 6.1 3.6 23.1 Drip
60% ETc 5.4 7.3 6.0 3.5 22.2
Furrow 1.2 IW: CPE 5.8 7.6 6.0 4.2 23.6
Figure 3 Soil moisture distribution for 100% ETc drip treatment: after 30 min, 60 min, 120 min amd 180 min. of termination of irrigation
July 2010 Water use and yeld response of tomato as influenced by drip and furrow irrigation Vol. 19, No. 1 27
Figure 4 Soil moisture distribution for 80% ETc drip treatment: after 30 min, 60 min, 120 min and 180 min
of termination of irrigation

28 July 2010 International Agricultural Engineering Journal Vol. 19, No. 1
Figure 5 Soil moisture distribution for 60% ETc drip treatment: after 30 min, 60 min, 120 min and 180 min of termination of irrigation
3.3 Effect of irrigation treatments on yield and
water-use-efficiency
Effects of irrigation schedules and methods on yield
and water-use efficiency of tomato in different years
along with the mean values are shown in Table 4. The
study reveals that in all years, irrigation schedules and
methods significantly influenced the yield of the crop.
In all years, the highest yield of the crop (173.46 to
191.36 q/ha) was observed when irrigation during the
crop-growing season was performed at 100% ETc
replenishment by drip irrigation method (T1). Even the
mean data reveals that the highest yield of 180.97 q/ha is
obtained for treatment T1; that is, 11.2%, 24.7%, and
15.4% more than treatments T2, T3 and T4, respectively.
Yield of the crop is found to depend on both irrigation
schedules and methods of irrigation. Compared to
different irrigation schedules in the drip method, the
treatment T1 is found to require more irrigation water,
which results in achieving higher values of crop
evapotranspiration, thus favouring good growth and yield
of the crop. However, when the irrigation methods are
compared, it is observed that drip irrigation (except
treatment T3) gives more yield than the furrow method.
In case of furrow irrigation, although more water is
applied to the crop, the water uptake by the crop is not
efficient, and there are some unnecessary losses of the
applied water in the form of deep percolation. This is
the reason why yield is not commensurate with the water
requirement of the crop, indicating the response of the
crop to irrigation methods.
Table 4 Effect of irrigation schedules and methods on tomato
yield and water-use efficiency along with statistical parameters
Irrigation Year
Methods Schedules
Yield /q·ha-1
Water-use efficiency
/kg·ha-1 cm
100% ETc 178.10a 695.70
80% ETc 160.55b 655.31 Drip
60% ETc 148.34c 628.56
Furrow 1.2 IW: CPE 155.61d 523.94
SEm(±) 2.85 5.55
CD (0.05) 7.48 10.12
2002
C.V. (%) 5.14 8.10
100% ETc 191.36 804.03
80% ETc 171.60 759.29 Drip
60% ETc 151.23 690.55
Furrow 1.2 IW: CPE 163.12 615.55
SEm(±) 2.03 4.78
CD (0.05) 7.04 9.65
2003
C.V. (%) 5.96 7.66
100% ETc 173.46 741.28
80% ETc 156.17 700.31 Drip
60% ETc 135.80 646.67
Furrow 1.2 IW: CPE 151.85 562.41
SEm(±) 3.27 5.16
CD (0.05) 10.80 9.05
2004
C.V. (%) 4.80 8.33
100% ETc 180.97 744.73
80% ETc 162.77 704.63 Drip
60% ETc 145.12 653.69
Furrow 1.2 IW: CPE 156.86 566.28
SEm(±)a1 3.05 5.02
CD (0.05)b1 8.92 9.60
Mean of three years
C.V. (%)c1 5.10 7.85
N.B. a1 = standard error (SE) between the mean values (mean of 3 years) among
the treatments; b1 = Coefficient of deviation (CD) showing significant differences
between the mean values among the treatments; c1 = Coefficient of variation
(CV) between the mean values among the treatments

July 2010 Water use and yeld response of tomato as influenced by drip and furrow irrigation Vol. 19, No. 1 29
There was significant increase in water-use efficiency
(WUE) in response to drip irrigation treatments at all the
levels of irrigation schedules in comparison to furrow
irrigation in all the years. Values of WUE for treatment
T1 are found to be the highest, varying from 695.70 to
804.03 kg/ha cm over the years with a mean value of
744.73 kg/ha, whereas the mean values of WUE for
treatments T2, T3 and T4 are 704.63, 653.69 and
566.28 kg/ha cm, respectively (Table 4). The values of
WUE decreased significantly with decrease of irrigation
water supply due to 80% and 60% ETc replenishment.
The study reveals that there is 5.7%, 13.9% and 27.3%
increase in values of WUE of the crop when treatment T1
is imposed over treatments T2, T3 and T4, respectively.
Furthermore, irrigation by the furrow method produces
the lowest value of WUE because it requires considerable
seasonal water application without a significant
improvement in yield of the crop. Similar conclusions
have been reported by earlier studies (Anonymous, 2004,
Tiwari et al., 1998, Bhandari, 1995) for various crops,
such as tomato, potato, carrot, etc., in which the furrow
method of irrigation has been compared with drip
irrigation systems. Thus the study reveals that drip
irrigation at 100% ETc level has significant influence on
fruit yield and water-use efficiency compared to the two
other irrigation schedules under drip (i.e., 80% and 60%
ETc level), and also over the conventional furrow
irrigation method.
4 Conclusions
The experimental results from all the three years
showed that furrow irrigation is not a water saving
method of irrigation in tomato. The conventional
furrow irrigation as adopted by most of the farmers
increases the seasonal water application considerably
without a significant improvement in yield and hence in
water-use efficiency. On the other hand, drip irrigation
supplied low-amount but frequent irrigation that
maintained higher values of soil moisture in the root zone
and hence resulted in higher yield and water-use
efficiency. The study revealed that there was 17.9% to
36.6% savings of irrigation water in various drip
treatments as compared to furrow treatment. Drip
irrigation at 100% ETc replenishment resulted in
significantly higher yield of the crop at 180.97 q/ha; that
is, 11.2%, 24.7%, and 15.4% more than drip irrigation at
80% and 60% ETc replenishment and furrow irrigation
treatments, respectively. Furthermore, said treatment
also increased the water-use efficiency by 5.7%, 13.9%
and 27.3% over the treatments of drip irrigation at 80%
and 60% ETc replenishment and furrow irrigation
treatments, respectively. Thus, the overall results
suggest that in order to obtain optimum yield and
water-use efficiency of tomato in the sub-humid climatic
condition of Orissa, India, the crop during the winter
season should be irrigated by drip irrigation at 100% ETc
replenishment.
[References]
[1] Ahmed, M., and R D. Mishra. 1987. Mannual on Irrigation
Agronomy, 134-136. New Delhi: Oxford and IBH Publishing.
[2] Anonymous, 2002. Annual Report of All India Co-ordinated
Research Project on Water Management, Chiplima Centre,
Orissa, India, 110.
[3] Anonymous, 2004. Annual Report of All India Co-ordinated
Research Project on Water Management, Chiplima Centre,
Orissa, India, 112.
[4] Bhandari, V. 1995. Soil moisture distribution under point
source in black clay soil. Unpublished M. Tech. Thesis,
Indian Institute of Technology, Kharagpur, India, 79.
[5] Cripps, J. E. L., P. R. George, and A. E. Oakley. 1982.
Scheduling irrigation of cabbages using pan evaporation.
Irrigation Science 3: 185-195.
[6] Fekadu, Y., and T. Teshome. 1998. Effect of drip and furrow
irrigation and plant spacing on yield of tomato at Dire Dawa,
Ethiopia. Agricultural Water Management 35 (3): 201-207.
[7] Green, R. E., and J. C. Corey. 1971. Calculation of hydraulic
conductivity: a further evaluation of some predictive methods.
Soil Science Society of America Proceedings, 35: 3-9.
[8] Hanson, B. R., I. J. Schwanki, K. F. Schulbach, and G. S.
Pettygrove. 1997. A comparison of furrow, surface drip and
subsurface drip irrigation on lettuce yield and applied water.
Agricultural Water Management 33 (2): 139-157.
[9] Imtiyaz, M., N. P. Mgadia, S. K. Manase, K. Chendo and E.
O. Mothobi. 2000. Yield and economic return of vegetable
crops under variable irrigation. Irrigation Science 19(2):
87-93.
[10] Khade, K. K. 1987. Highlights of research on drip irrigation.
Mahatma Phule Agricultural University, India,. 55:. 20-21.

30 July 2010 International Agricultural Engineering Journal Vol. 19, No. 1
[11] Michael, A. M. 1981. Irrigation Theory and Practice,
539-542. New Delhi: Vikas Publishing House.
[12] Panigrahi, B. 2006. Yield and water-use efficiency of tomato
under furrow irrigation. Souvenir of Orissa Engineering
Congress, 39: 130.
[13] Singh, P. N., B. P. Joshi, and G. Singh. 1988. Water use and
yield response of potato as influenced by mulch and irrigation.
Indian J. of Soil Conservation 16: 29-34.
[14] Sivanappan, R. K., and O. Padmakumari. 1980. Drip
irrigation. Tamil Nadu Agricultural University, Coimbatore,
India, SVNP Report, 15.
[15] Tiwari, K. N., P. K. Mal, R. M. Singh, and A. Chattopadhyay.
1998. Response of okra (Abelmoschus esculentus (L.)
Moench.) to drip irrigation under mulch and non-mulch
conditions. Agricultural Water Management 38 (2): 91-102.