April 20061 Columbia River Treaty Overview of Columbia River Treaty.
Upload
trinhtuongCategory
view
216download
0
WATER TEMPERATURES IN THE LOWER COLUMBIA RIVER


Water Temperatures in the
Lower Columbia River
----------------------------~ GEOLOGICAL SURVEY CIRCULAR 551
Washington 196
United States Department of the Interior STEWART L. UDALL, Secretary
Geological Survey William T. Pecora, Director
Free on application to the U.S. Geological Survey, Washington, D.C. 20242
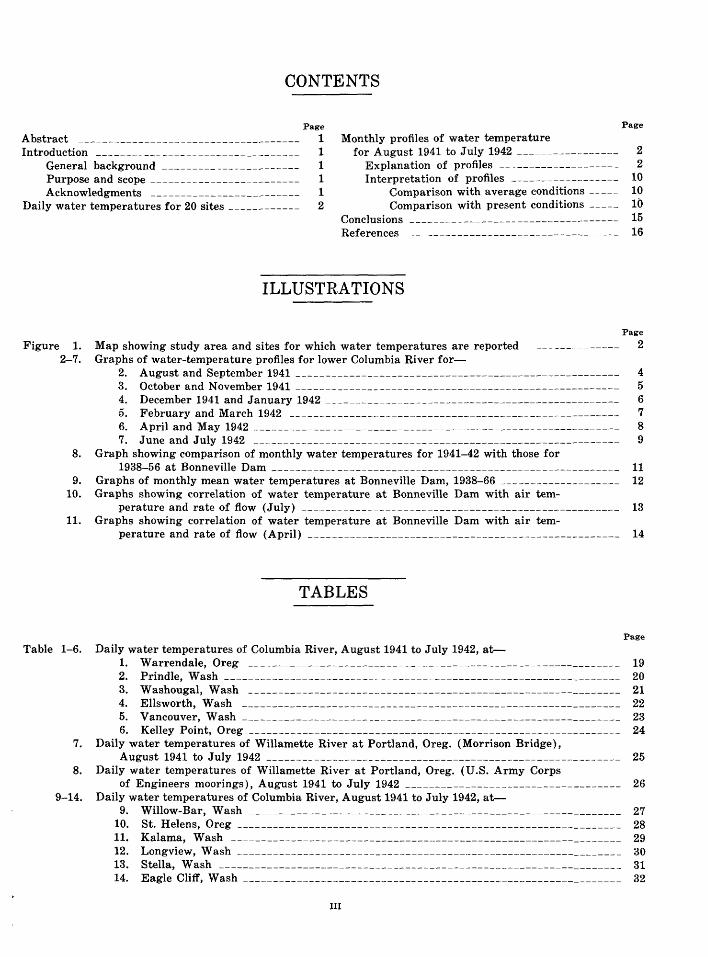
CONTENTS
Page Page
Abstract Monthly profiles of water temperature Introduction __________________________________ _
1 1 1 1 1 2
for August 1941 to July 1942 ------------------ 2 General background _______________________ _ Explanation of profiles --------------------- 2 Purpose and scope ------------------------Acknowledgments --------------------------
Interpretation of profiles ___________________ 10 Comparison with average conditions ----- 10 Comparison with present conditions ----- 10 Daily water temperatures for 20 sites ____________ _
Figure 1. 2-7.
8.
9. 10.
11.
Conclusions ----------------------------------- 15 References ------------------------------------ 16
ILLUSTRATIONS
Page
Map showing study area and sites for which water temperatures are reported ________________ 2 Graphs of water-temperature profiles for lower Columbia River for-
2. August and September 1941 ------------------------------------------------------ 4 3. October and November 1941 ------------------------------------------------------- 5 4. December 1941 and January 1942 ------------------------------------------------- 6 5. February and March 1942 --------------------------------------------------------- 7 6. April and May 1942 ------------------------------------------------------------- 8 7. June and July 1942 -------------------------------------------------------------- 9
Graph showing comparison of monthly water temperatures for 1941-42 with those for 1938-56 at Bonneville Dam ___________ ----------------------------------------------- 11
Graphs of monthly mean water temperatures at Bonneville Dam, 1938-66 ____________________ 12 Graphs showing correlation of water temperature at Bonneville Dam with air tem-
perature and rate of flow (July) ------------------------------------------------------ 13 Graphs showing correlation of water temperature at Bonneville Dam with air tem-
perature and rate of flow (April) ----------------------------------------------------- 14
TABLES
Page
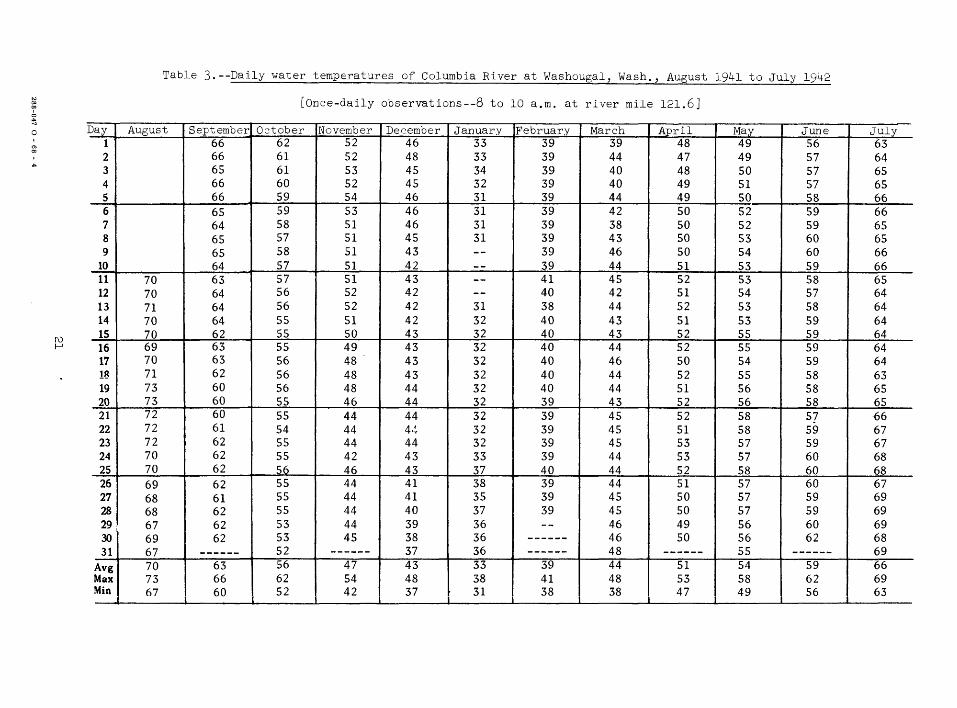
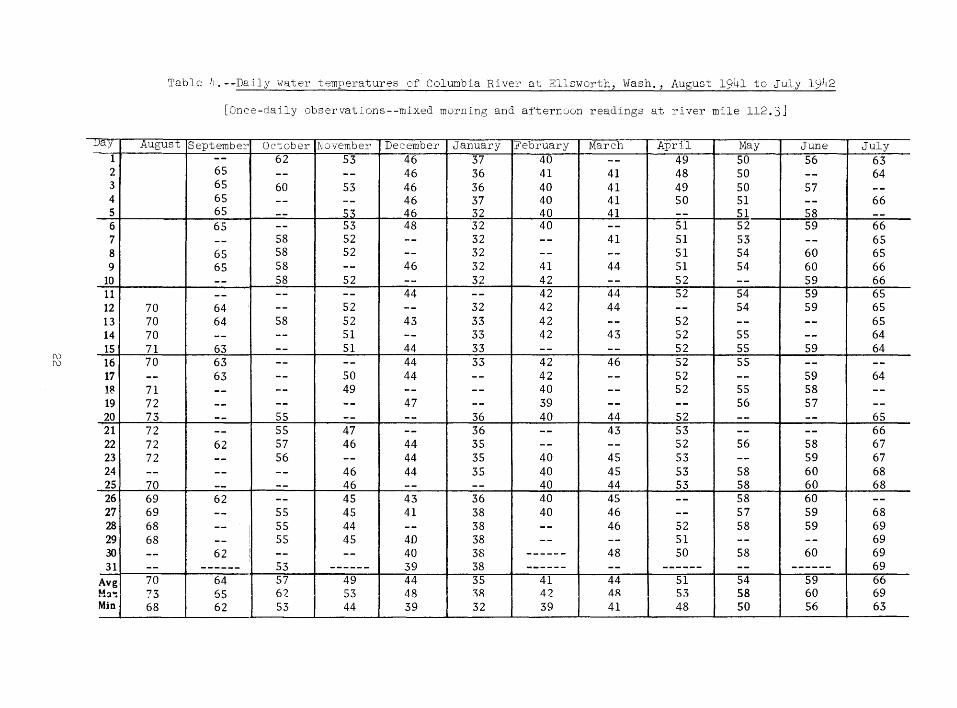
Table 1-6. Daily water temperatures of Columbia River, August 1941 to July 1942, at--1. VVarrendale, Oreg -------------------------------------------------------------- 19 2. Prindle, VVash ------------------------------------------------------------------ 20 3. VVashougal, Wash --------------------------------------------------------------- 21 4. Ellsworth, Wash --------------------------------------------------------------- 22 5. Vancouver, VV ash ---------------------------------------------------------------- 23 6. Kelley Point, Oreg --------------------------------------------------------------- 24
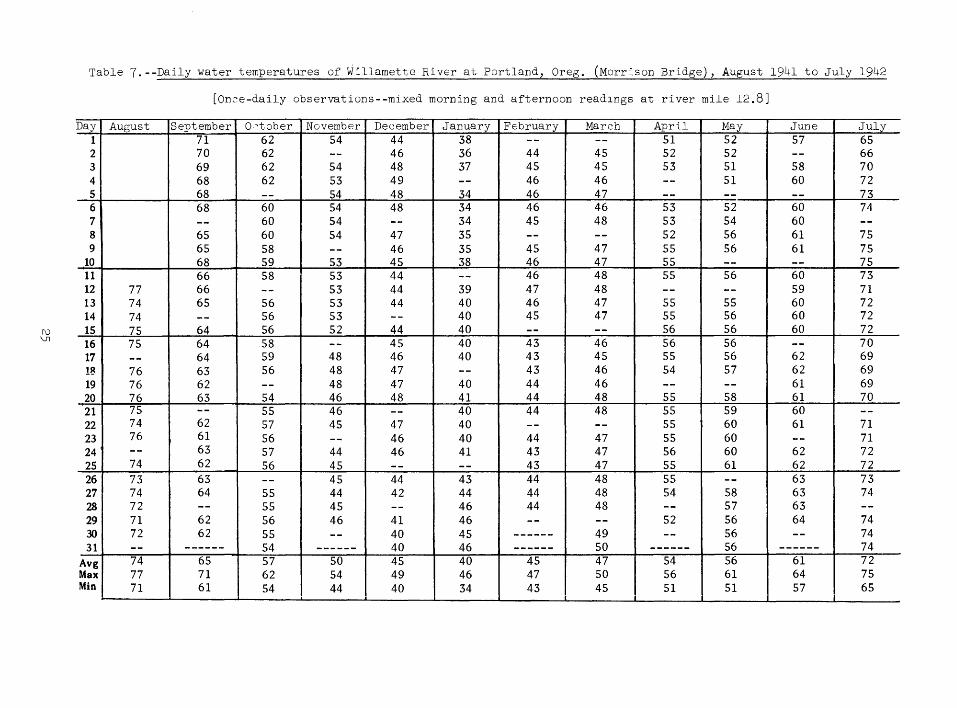
7. Daily water temperatures of Willamette River at Portland, Oreg. (Morrison Bridge), August 1941 to July 1942 ------------------------------------------------------------ 25
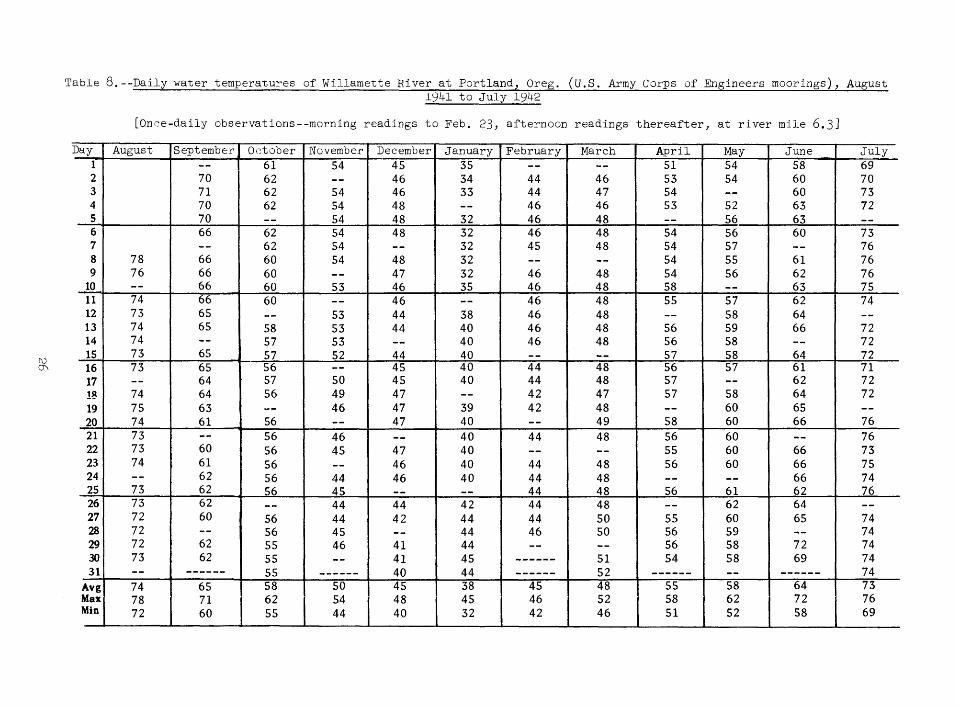
8. Daily water temperatures of Willamette River at Portland, Oreg. (U.S. Army Corps of Engineers moorings), August 1941 to July 1942 ------------------------------------ 26
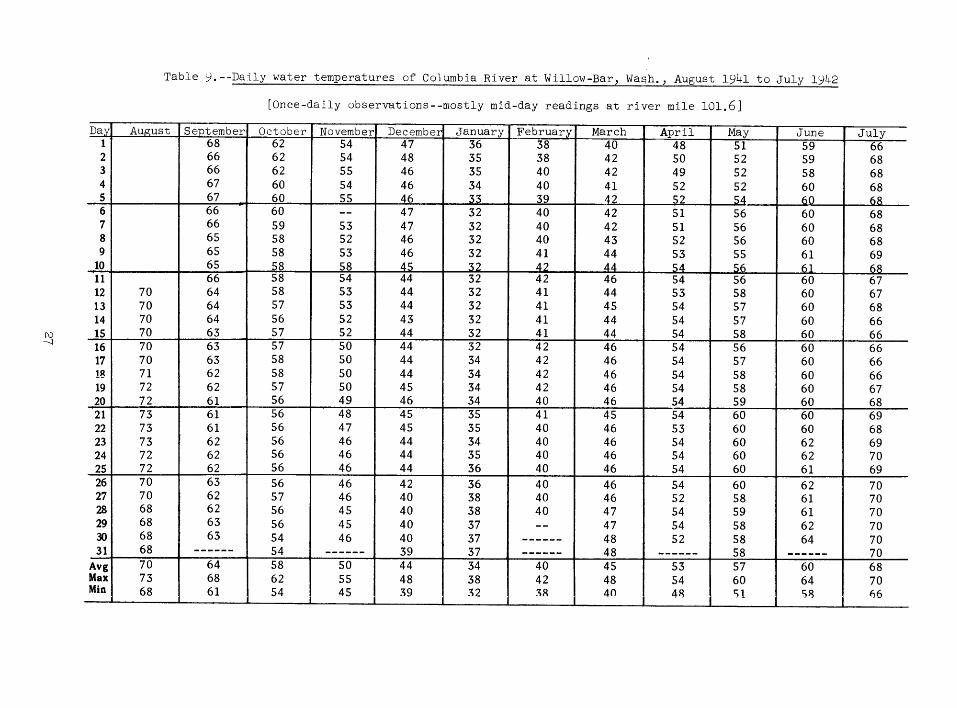
9-14. Daily water temperatures of Columbia River, August 1941 to July 1942, at--9. VVillow-Bar, Wash -------------------------------------------------------------- 27
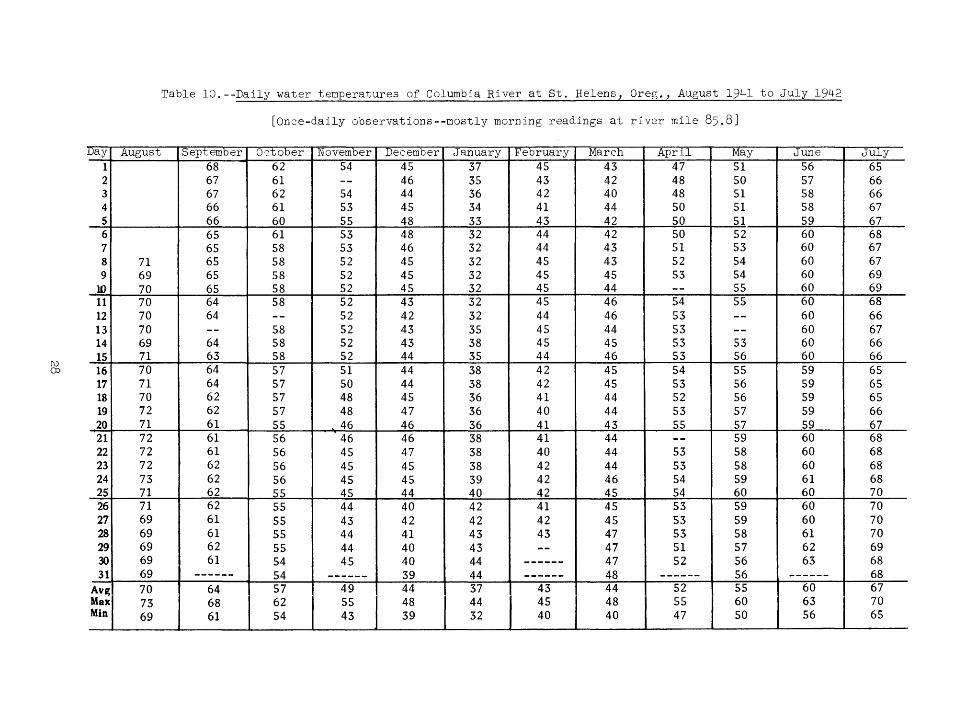
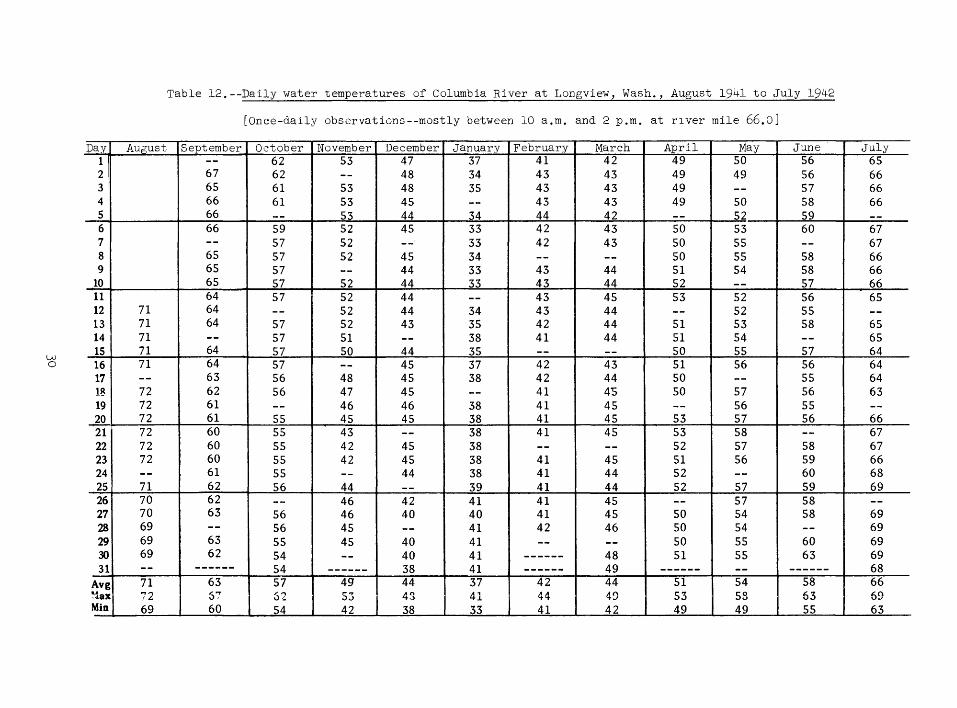
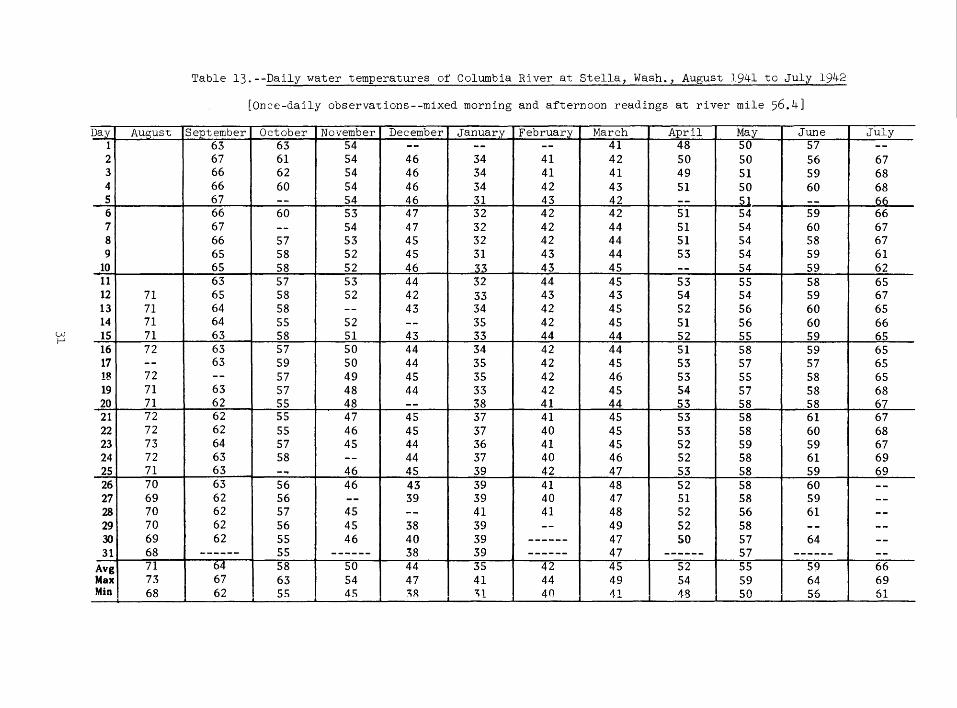
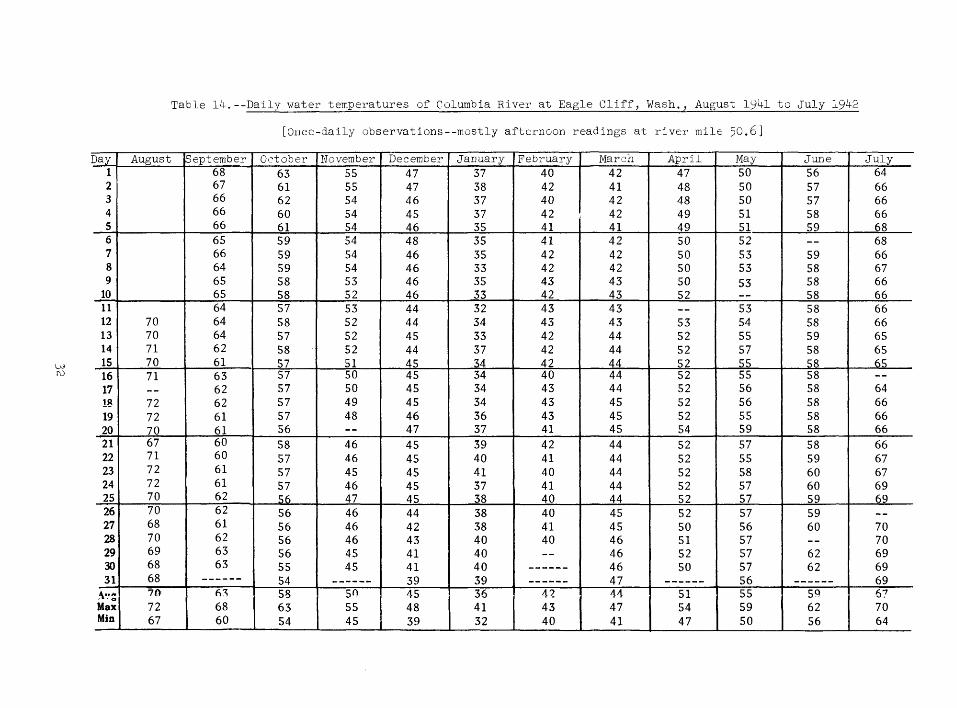
10. St. Helens, Oreg ---------------------------------------------------------------- 28 11. Kalama, VVash ------------------------------------------------------------------ 29 12. Longview, VV ash ----------------------------------------------------------------- 30 13. Stella, VVash ------------------------------------------------------------------- 31 14. Eagle Cliff, Wash --------------------------------------------------------------- 32
III

Table 15.
16.
17.
18.
19.
20.
21.
Page
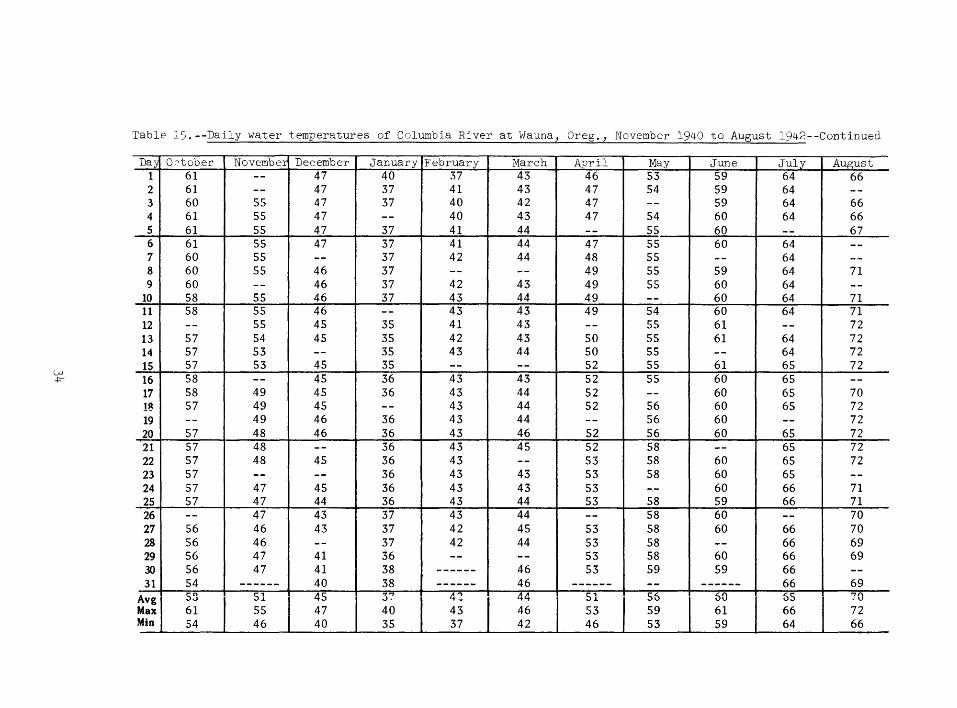
Daily water temperatures of Columbia River at Wauna, Oreg., November 1940 to August 1942 ----------------------------------------------------------------------- 33
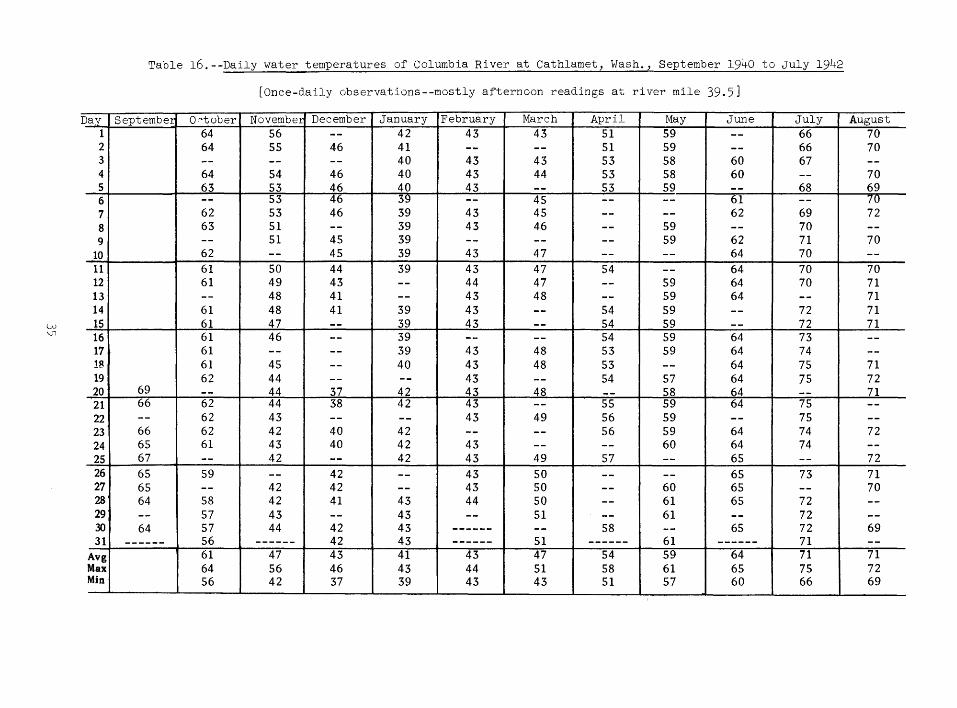
Daily water temperatures of Columbia River at Cathlamet, Wash., September 1940 to July 1942 -------------------------------------------------------------------------- 35
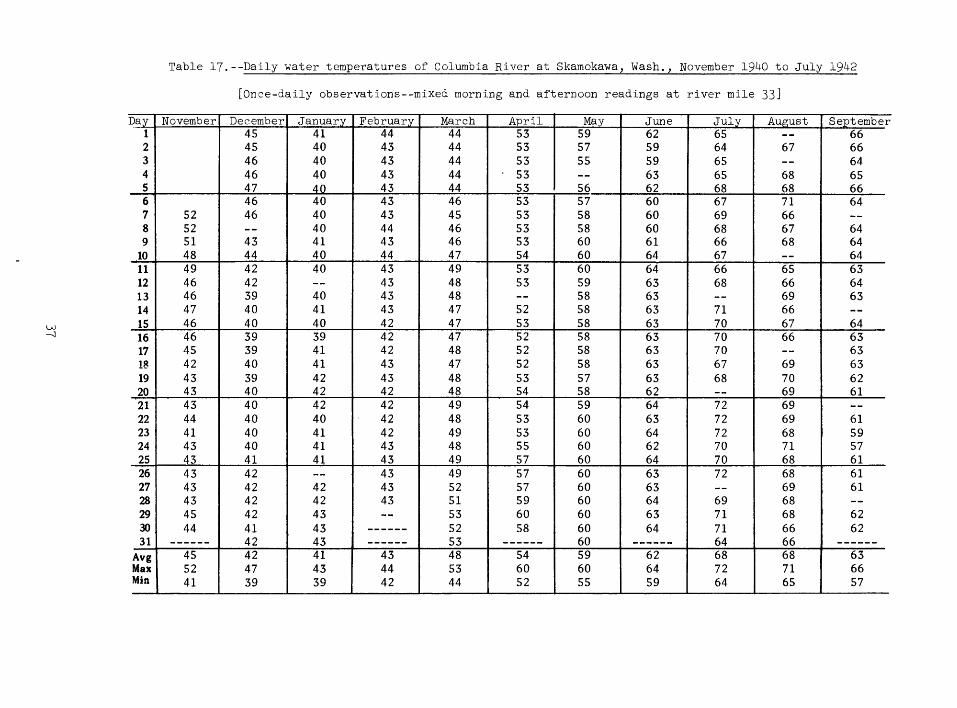
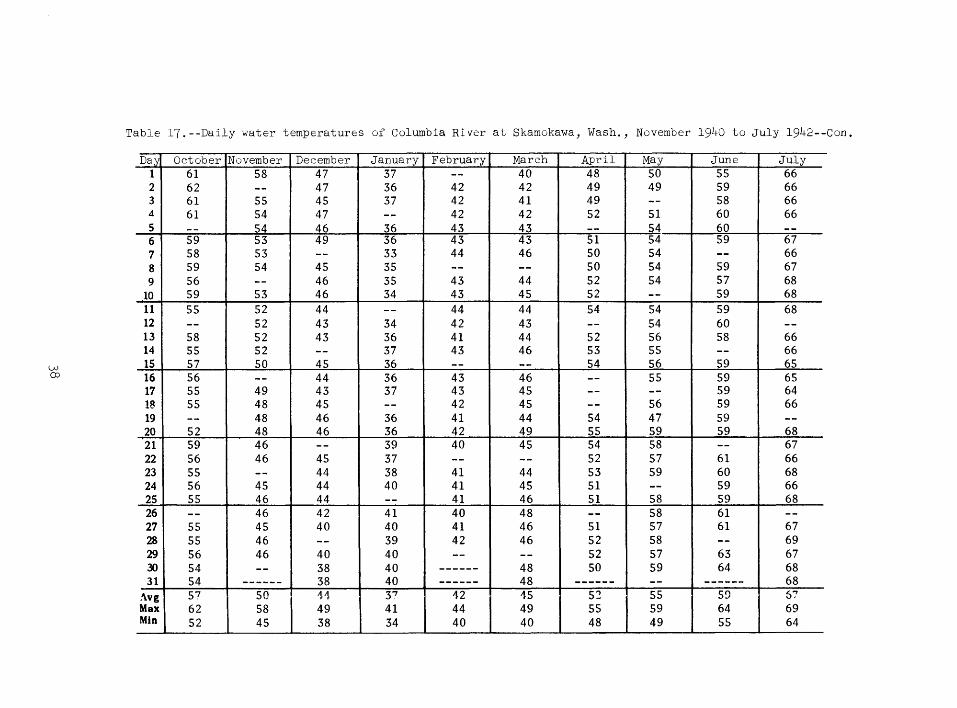
Daily water temperatures of Columbia River at Skamokawa, Wash., November 1940 to July 1942 ----------------------------------------------------------------------- 37
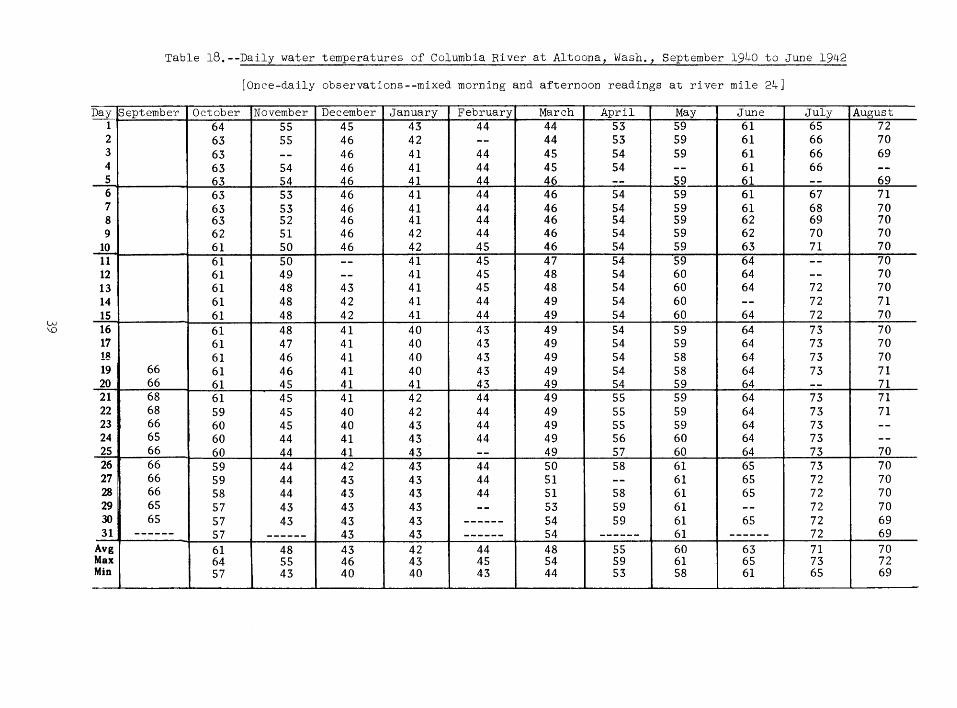
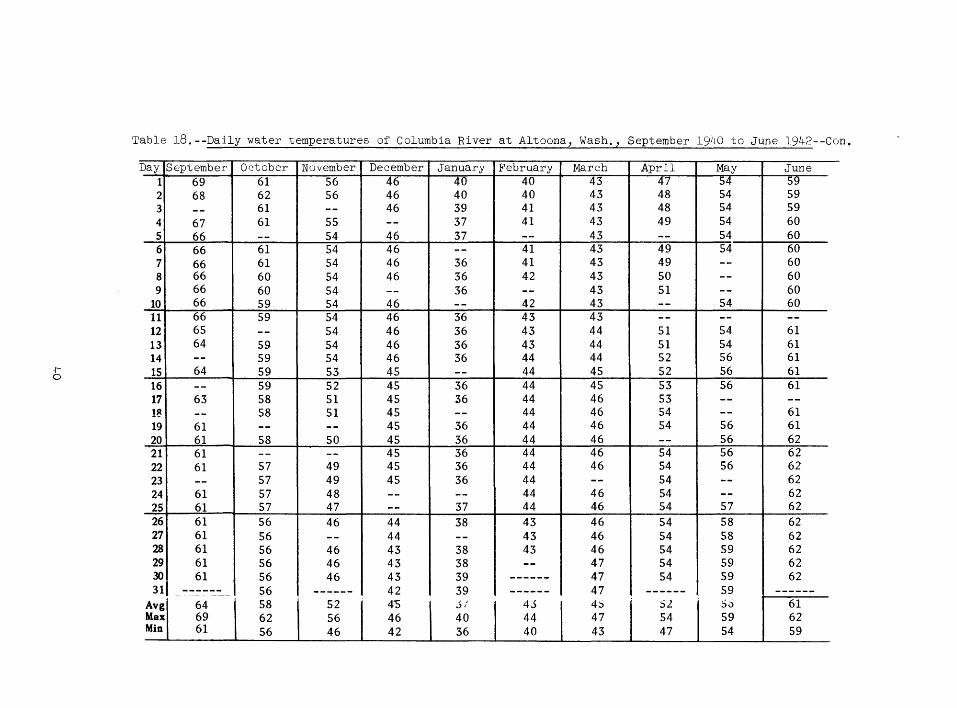
Daily water temperatures of Columbia River at Altoona, Wash., September 1940 to June 1942 ----------------------------------------------------------- ______________ 39
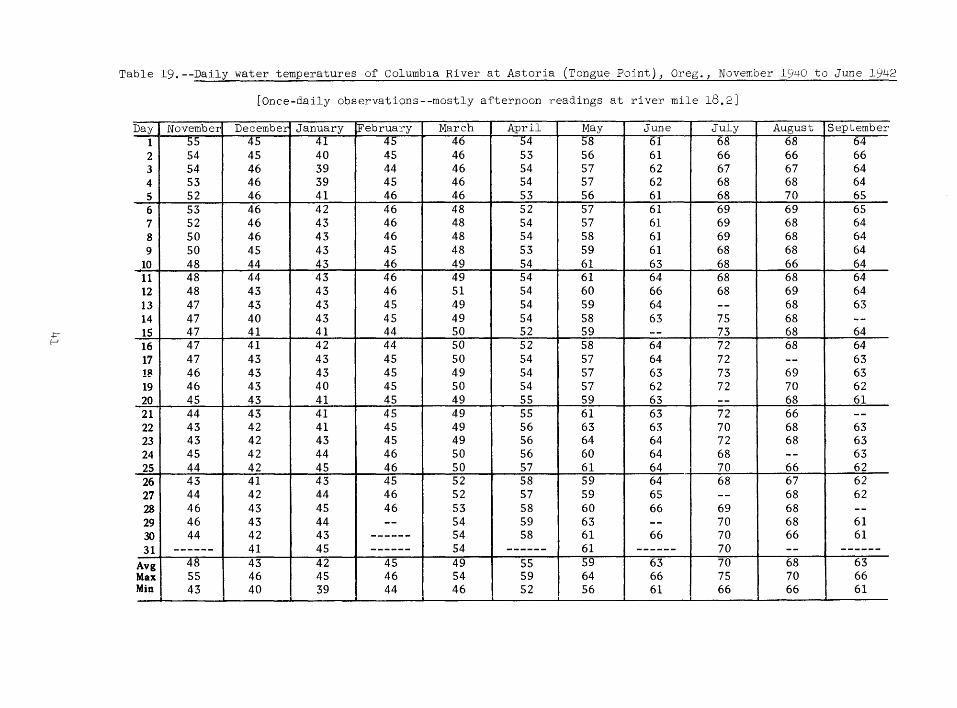
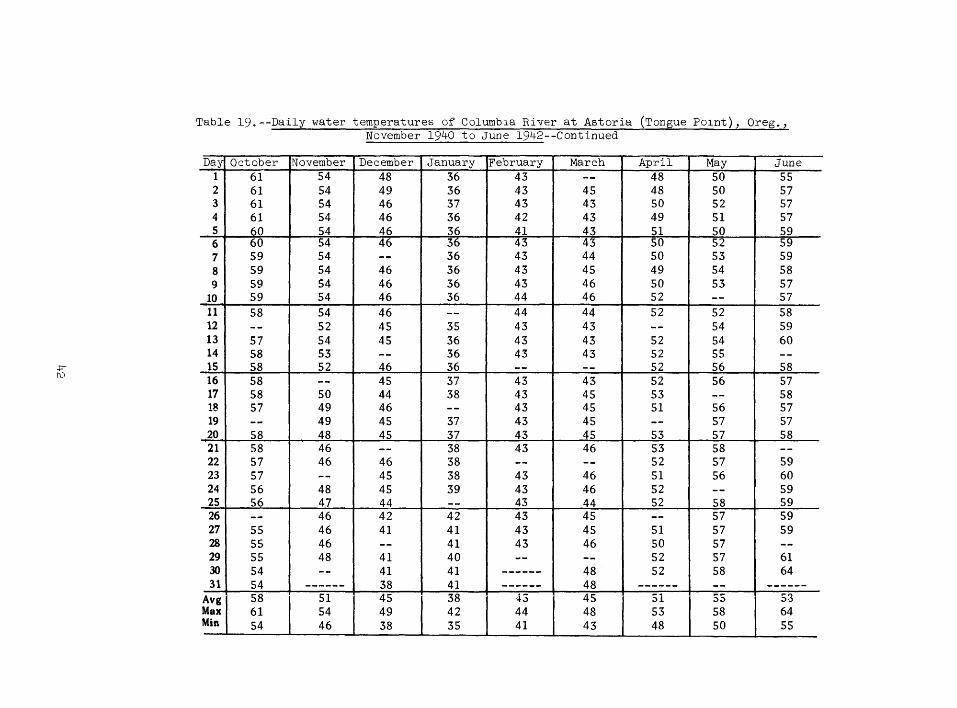
Daily water temperatures of Columbia River at Astoria (Tongue Point), Oreg., November 1940 to June 1942 __ ______ _____________ _______________ _____________________ 41
Daily water temperatures of Columbia River at Fort Stevens, Oreg., August 1941 tc January 1942 and June, July 1942 ---------------------------------------------------- 43
Monthly maximum, minimum, and mean water temperatures of Columbia River at Bonneville Dam forebay ------------------------------------------------------------ 44
IV

WATER TEMPERATURES IN THE LOWER COLUMBIA RIVER
By A. M. MOORE
Abstract
Daily observations of water temperature for 20 sites in the lower Columbia River are presented in tabular form and in profile form by months for the period August 1941 to July 1942. The profiles show minimum, mean (average), and maximum water temperatures for those months from river mile 142 to river mile 6.7. The data indicate that water temperature in the lower river trends upward from October to March and has no marked trend, or trends downward, during April to September.
Analysis of the water-temperature records at Bonneville Dam (river mile 146.1) for the 1938-66 period of record shows that the months from August 1941 to July 1942 are fairly representative of average conditions except for August and January, which are about 3oF above and 4°F below average, respectively. Analysis of the Bonneville Dam records also indicates that in the mid-1950's a man-caused change in watertemperature regimen occuned that resulted in higher temperatures at Bonneville Dam for 10 months of the year but no change in March and April. The changes for the other months ranged from +0.5° to +2.0°F. This means that average temperatures for the lower river are now somewhat warmer for most months than temperatures shown in the profiles.
INTRODUCTION
GENERAL BACKGROUND
Water temperatures in the Columbia River are becoming a matter of increasing interest and concern for several reasons. Water-quality standards are being drafted by the various States in the Columbia River basin, and a knowledge of water-temperature regimen throughout the basin is necessary in considering this phase of water quality. Furthermore, increasing use of the river by industry for cooling purposes can affect the water-temperature regimen as can the many reservoirs that have been or are being constructed. Proposed nuclear powerplants can affect water temperatures if river water is used as the coolant. Admittedly, a plant with a capacity of a million kilowatts will raise the temperature of the Columbia River by only a fraction of 1 oF but
1
several plants could have a significant cumulative effect.
Water-temperature records have he~n collected at hundreds of sites throughout the basin but very few in the tidal reach of th~ river below Bonneville Dam. In July 1966, the Northwest Water Resources Data Center began releasing weekly and monthly profiles of maximum and minimum water temperature for the main-stem Columbia and Snake Rivers to supply current information on water temperature. The Columbia River profile includes irformation for one site below Bonneville Dam, namely Beaver Army Terminal at river mile 53.5. The Corps of Engineers, U.S. Army, has in their files daily observations of water temp?.rature at 18 sites in the main-stem Columbia Rjver below Bonneville Dam and at two sites in the extreme lower Willamette River. The-"'8 records, collected jointly by the Corps of Engineers and the U.S. Coast and Geodetic Survey, cover a period of a year or more in th~ early 1940's.
PURPOSE AND SCOPE
Water-temperature records collected at 20 sites in the lower Columbia River basin (fig. 1) by the Corps of Engineers and the Coast and Geodetic Survey are presented in both tabular and profile form. The profiles show C
1ata by months for the period August 1941 to Jul~r 1942. The report includes an analysis of the watertemperature records at Bonneville Dam for the period 1938-66 to determine the relationship of the profiles for 1941-42 to average corditions and whether there has been any change in temperature regimen in the lower river since 1942.
ACKNOWLEDGMENTS
The courtesy and cooperation of the Corps of Engineers and the Coast and Geodetic Survey in making these records availal~le are gratefully acknowledged.
WASHINGTON
OREGON
.A Water-temperature observation site
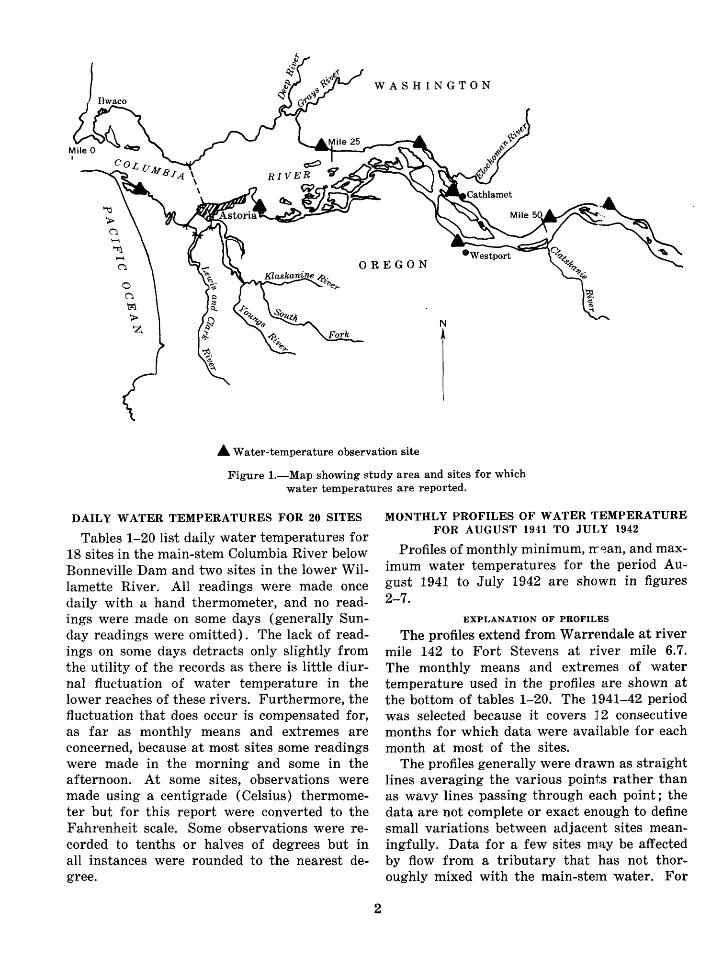
Figure 1.-Map showing study area and sites for which water temperatures are reported.
DAILY WATER TEMPERATURES FOR 20 SITES
Tables 1-20 list daily water temperatures for 18 sites in the main-stem Columbia River below Bonneville Dam and two sites in the lower Willamette River. All readings were made once daily with a hand thermometer, and no readings were made on some days (generally Sunday readings were omitted). The lack of readings on some days detracts only slightly from the utility of the records as there is little diurnal fluctuation of water temperature in the lower reaches of these rivers. Furthermore, the fluctuation that does occur is compensated for, as far as monthly means and extremes are concerned, because at most sites some readings were made in the morning and some in the afternoon. At some sites, observations were made using a centigrade (Celsius) thermometer but for this report were converted to the Fahrenheit scale. Some observations were recorded to tenths or halves of degrees but in all instances were rounded to the nearest degree.
2
MONTHLY PROFILES OF WATER TEMPERATURE FOR AUGUST 1941 TO JULY 1942
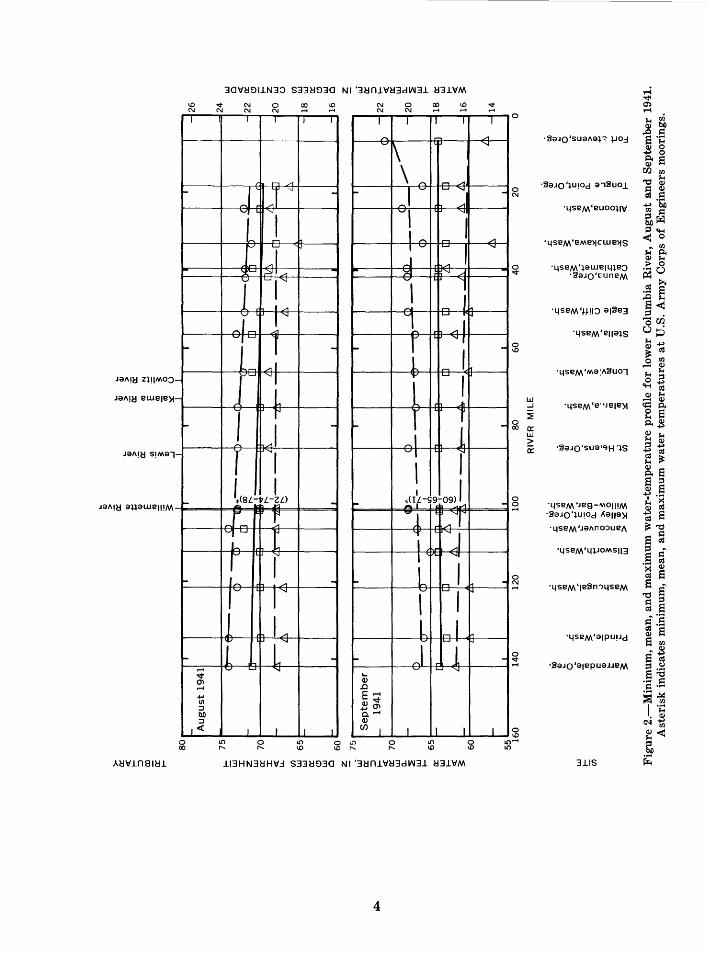
Profiles of monthly minimum, rr~an, and maximum water temperatures for the period August 1941 to July 1942 are shown in figures 2-7.
EXPLANATION OF PROFILES
The profiles extend from Warrendale at river mile 142 to Fort Stevens at river mile 6.7. The monthly means and extre1nes of water temperature used in the profiles are shown at the bottom of tables 1-20. The 1941-42 period was selected because it covers J 2 consecutive months for which data were available for each month at most of the sites.
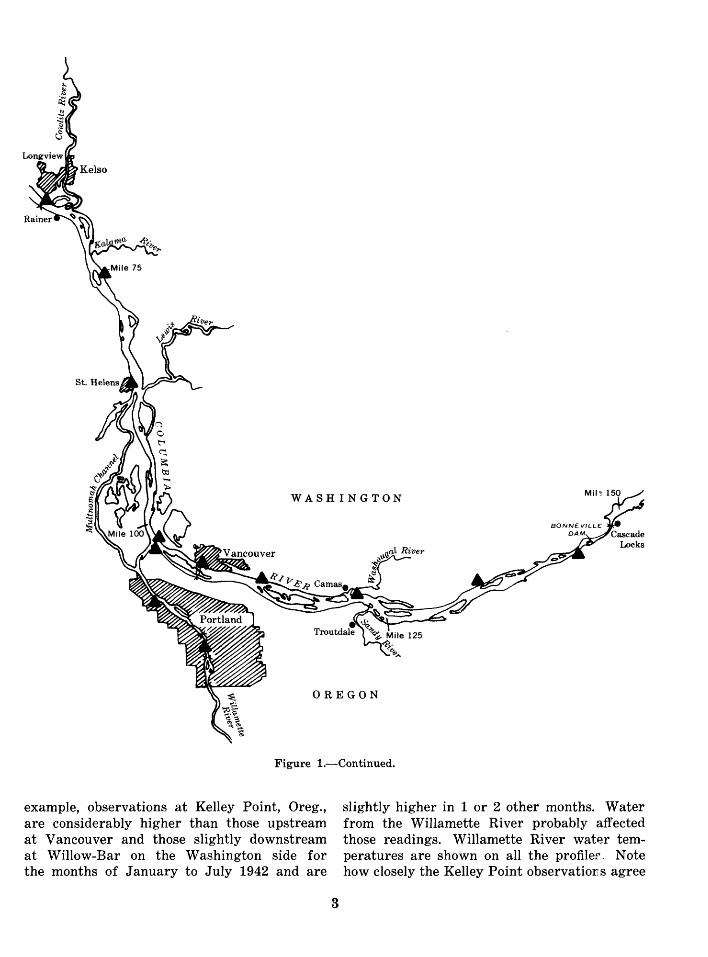
The profiles generally were drawn as straight lines averaging the various points rather than as wavy lines passing through each point; the data are not complete or exact enough to define small variations between adjacent sites meaningfully. Data for a few sites may be affected by flow from a tributary that has not thoroughly mixed with the main-stein ·water. For
WASHINGTON
OREGON
Figure !.-Continued.
example, observations at Kelley Point, Oreg., are considerably higher than those upstream at Vancouver and those slightly downstream at Willow-Bar on the Washington side for the months of January to July 1942 and are
3
slightly higher in 1 or 2 other months. Water from the Willamette River probably affected those readings. Willamette River water temperatures are shown on all the profiler. Note how closely the Kelley Point observations agree
1-
1-
1-
1.0 C\J
I
1-
~
1-
1-
1-
t-
1-~
'Ot 0'\ ~
..... (/)
::J ll.O ::J
,< 0 00
3G'V~~I.lN3~ S33~~3G Nl '3~nJ.'V~3dii\I3J. ~3J.'VM
C\J C\J
I
J ......,
L 1'-"
l.-. V'-'
~
,... ,...., "-' --=
·~ t-'L.J
,..J
1 "
T
0 C\J
I
.--.
/1
~,
......
_j
/1
"'-!
~~· ..... IL.JI""-J
I _,., ,~
A
l ......,,
~I
L r
AI ~,
I I tsL-vL-~0
J ...... '1L.J
~ r '" ,~
1 I "-' L.J
I 0 ......
f
r r
.......
I~
'A L~ ~
I
00 ......
I
tJ
LO 1.0
I
I
- t-
- t-
- t-
- t-
- 1-
- 1-
I 0 10 1.0 ......
C\J C\J
I .,.... '-'
~
OJ .0 E~ OJ'Ot
....,0"1 c.~ OJ en I
~
0 C\J
I
\
~' ~,
.,.... '-'
I .... I~
..J )(I
--=
' ~
~
:.... ......
L ,..,
.... I '""'l
I I
1.-. A
1'-' ~
..... I ~I
1.-. I ........
I A
:'-~ A
,,...., 1 1'-' r1-1
A I ""1
!,...., I IL-l
I ....
1 1 T
\ ~~~L-99-09) l
0 ......
--....
'f
I I
L ~
\ L
"' -'-'
I
AT IL
~....~ kr 1''- ~·
I~
' , ......
I ....... I IL-l
l "" 'f
LO 1.0
I I
~ 1-1
0 1.0
J.I3HN3~H'V.:I S33~~3G Nl '3~nJ.'V~3dii\I3J. ~3J.'VM
4
I
A
~
A
~
I
-
-
-
-
-
-
-
0
0 C\J
0 '<t
0 1.0
0 00
0 ;::
0 C\J ......
0 1.0 "' ...... LO
LLI ...J
~ c:: LLI ~ c::
·~aJo'sua/\a:j.~ :j.JO.:I
·~aJQ':j.U!Od an~UOJ_
'4SBM 'eUOO:j.J'If
'4SBM'BMB>tC'WB>tS
'4SBM':j.aWBI4:j.B~ ·5aJQ'e:uneM
'4SBM 'U!I~ a1~e3
'4SBM'eua:j.s
'4SBM 'Ma:/\~UOl
'4SBM'e'•Jele>l
·5aJQ'SU9'~H 'lS
'4SBM 'Jeg-MOIJ!M ·5aJQ':j.U!Od ,-l;a11a>1
'4SBM'Ja/\nOOUBt\
'4SBM'4:j.JOMSIJ3
3J.IS

N 00 00
0 ..,. ..., 0
"' 00
01
>-a:: <( 1-:::)
CD 0:: 1-
70
1- October 1941
1-65
f-Ui :I: z ~ 60
~
:I: <( ~ ~
~ 55 l.iJ a:: ~
" LIJ 0
50 z - 60 uj a::
I November
:::) 1-
1- 1941
~ 55 l.iJ a.. ~
~ LIJ
1- 50 a:: l.iJ 1-C(
~ 45 1-1....
1-
40 160
LIJ 1-u;
I I
-·( lr-""'( !r~ ~
r Ib I
IP ""lu l~
... Ql > 0:: Ql
t: Ql
E ~ ~
I
... Ql > 0:: en 'i Ql ...J "j
~~--.., tr-I
00 ll)
ll.A e [J
0; > 0:: 1'0
E 1'0 iii ::.::: I
1
qJ
(~l
... Ql > 0:: ~ "i 0 u I
I I I
-
-<r_j ~...! IL- lh (p 1--( ([)'
<D I>
( b -rh rh
I h
ID lD 'I.J -L~
L~t. ~---~ r- '.i.:l.- -I. ~ --""'~· ~t ~- - ~-1 ~~---·-z~ - -tr- L~-z
I I I I I I
I I I I I Jl
(
( .,.._..- ( ~-D-, ~ ( * () ~ D '(h
~ 0
IP [ ll) I
rh 0
-I ll) ID I I ""' [] ~
L::.
L~- -· __.....!> ___ ,___--+- --t~-- _,___.!. ~~
I ~~ ~~ ~~ -~ ....lJ__ I 4~ 140
bil Ql
0 ai iii "0 c:
~ 1'0
~
.r. en 1'0 ~ ai :0 ·= a:
120
.r. en 1'0
~ iii -~ 0 .c: en 1'0 ~
.r. en 1'0 ~ £ t:: ~ .!!! Ui
100
0 t!.O.r. .c: cu en en ... IV 1'0 0~ ~ ..; .: .: .!:: 1'0 Cll 0 CD ~ 0.. I 0 >.;: 0 Ql 0 c: == ro cu·-> ::.:::~
I ...L.J 80
RIVER MILE
11.0 Ql
0 vi c: Ql
Qj :I:
en
.c: en 1'0 ~ ai E 1'0 iii ::.:::
.c: en 1'0 ~ ~ Ql
-~ c: 0
...J
60
.r. en 1'0 ~ .!2 Qj
en
.r. en 1'0 ~ ;E C3 Ql
"So 1'0
LIJ
~
40
s.: en
.IV 1:10~ Ql -
0~ -E
~~~~~~ c:-:::I.C: 1'0 .....
~B
L~
¢
s.: ~ ai ;: 1'0
..:.:: 0 E 1'0
..:.:: (f)
I
'I
~ D <D ---<b
~~ -.b
L~ ..J. ~-_:. ~ -
.r. en 1'0 ~ ai c: 0 .s <
I
20
11.0 Ql
0 .: c: ·a a.. Ql :I tiO c: 0 .....
bil Ql
0 vi c: Ql > Ql m t:: 0 ~
.....
0
20
18 LIJ 0 <( a::
16 " i= z l.iJ
14 u (/) LIJ
12 LIJ a:: G LIJ
10 0
!: uj a::
14 :::) ..... <( a::
12 LIJ a.. ~ LIJ
10 1-
a:: LIJ 1-
8 <(
~
6
Figure 3.-Minimum,'mean, and maximum water-temperature profile for lower Columbia River, October and November 1941. Asterisk indicates minimum, mean, and maximum water temperatures at Corps of Engineers moorings.
0')
>-0::: <( 1-::::> m a:: 1-
1-i:ij J: z LLI 0::: J: <( LL.
(/) LLI LLI 0::: (!! LLI 0
z -LJ 0::: ::::> 1-<( 0::: LLI a.. :::?; LLI 1-
0::: LLI t-<(
~
LLI l-en
.... Q)
>
55
0: Q;
~ > Q) 0: E 1/J
~ ·~
~ Q)
...J
.... ... Q) Q)
> > 0: 0: Ill N E ~
..!!! ~ ~ u
T I T T 'j
J T I I
1- December - 12
50
1941 ,)D b __ c ~
1-1-j il.~-~ ~- 1- ----E ~-- tr-( H j)/
10 LLI 0 <( ,..._ ___J ~---,: - 0 ( D ~ ( ) R
I ( ) ( _/J (~ 8 0:::
(!! 45
-40 -
35 ~
50
45
40
35
30 160
January 1942
I
140
tlO Q)
0 ai iij ~ s::
~ Ill 3:
l.Cl rti 'o::t
rb I 0 ::!:
"~-1- __1. 1}---ol! ~L ~ L ~
I I
120 100
..r: llil..i ..r: 1/J ..r: Q) 1/J 1/J .... Ill
.i Ill
1/J Ill 0~ 1/J
~ Ill ~ ..... -..: Ill ro 3: a;· ·= Ill 3: tiD £ ~ ~If ai ::J -e 0 0 0 » ~ 15 .s::
~ ~ ~ .2 1/J (1;1 41
~ ~~ Q: ~ i:ij
Lp 1~ Lll LJ [J
I L1 6
~~---1---~l r---~"-f--- ~---- "':
L ~ L ~ L -
~ L ~ L ~ 4
I I I I - 2
10
8
6
4
2
0
80 60 40 20 0
RIVER MILE
.i tlO bO .i .i 1/J
Q) Q)
tlO ..r: Ill 0 0 1/J 1/J Q) ..r: 1/J Ill bO~ ~ ..r: ~
0 1/J Ill ..r: 3: cO 1/J s:: li Ill 3: 1/J ; Q) -
~ Ill '(5 s::
1/J- ~ ........ 3: Q)
't Ill ow Ill a.. > s:: cO Q) ~ u -E .;:,:. tO Q) Q) Q)
Qj E ·~ .!§ «Jill 0 s:: ::J U5 Q) S::- E 0 tiD "'C Ill Qj ~ ::J.S:: n 5 ~ ,g s::
g~ ~ +' 0 0 c;; '" ~ < ~ ...J LLI (/) 1- LL.
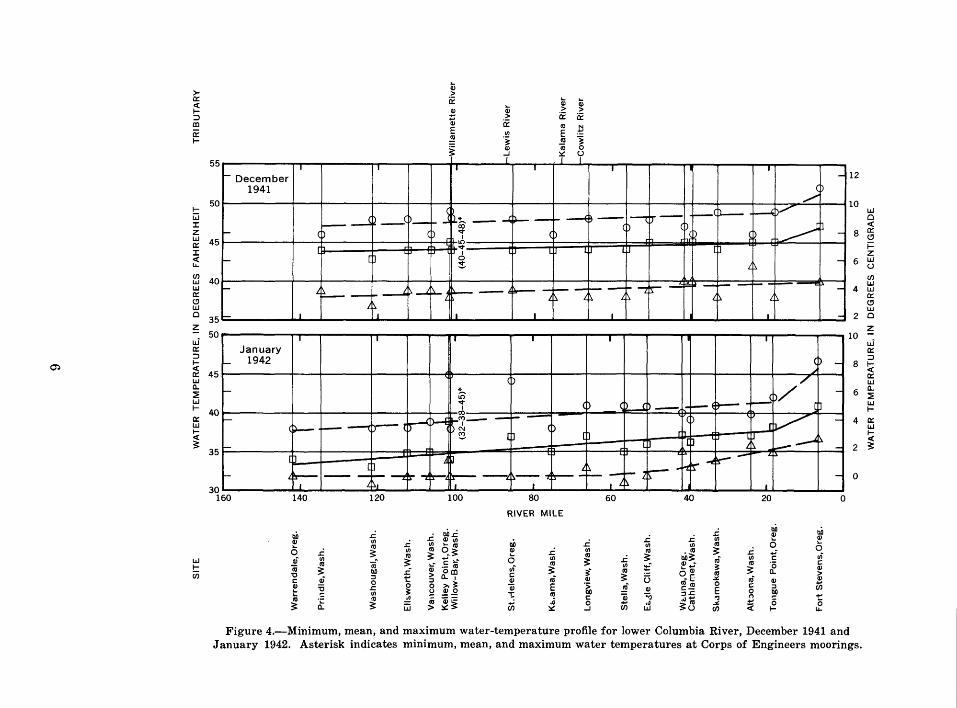
Figure 4.-Minimum, mean, and maximum water-temperature profile for lower Columbia River, December 1941 and January 1942. Asterisk indicates minimum, mean, and maximum water temperatures at Corps of Engineers moorings.
i= z LLI u (/) LLI LLI 0::: (!! LLI 0
z -LJ 0::: ::::> 1-<( 0::: LLI a.. :::?; LLI 1-
0::: LLI 1-<(
3:

-l
>-a:: < 1-::::> Ill 0: 1-
1-Lij :I: z w a:: :I: < 1..1..
(/) w w a:: (.!) w 0
~ w a:: ::::> 1-< a:: w a. ::2: w 1-
a:: w 1-< ~
w 1-(j)
50
February
f.- 1942
45
-40 -
35 f.-
f.-
30
55 ......
March 1942
50
f--
45
-40 -
= 35 160
,_ Q)
> ~
,_ ii Q)
~ > > ~ > ii ii Q) ii tQ
~ E 1/) E ~ 'i tQ j
~ Q) Cii 0 ..J :::.::: (.) I I T
I I I I I I
(
L ~.J L_j <b.. t'l. - - )'< )--: ,~- ----f b-- --: r-< b<r< ~1 H~
( D i <:t b h
I L "L plf.J ~
~ ~~ JT :J'~ L
~
~ ""'2 ~ I-
F>_ =---~ ~- lr----" .l.
~~
f" L F> p
I. ~ L~
I I I I I I 1
I I (~' I I I
I I I I
--{) -'i (
~---" ~~ H ~ --E) -f- .5 L__J C\1
;..... ~~ ...5: )
1.0 ()
--I
( ;......_ -~D
( ) (
r
l] L ~
\0 l.:
] "1
~
[ [l
~ _...!. ~-. ----- r : r-~ !!'~-1-
L ~
;_L ----- ~ L. L...l-
~).
I I I I I I I I I
140 120 100 80 60 40 20
RIVER MILE
• D.O..c:: ..c:: oD oD ..c:: Q)
J: Cll 1/) ..c:: ..c:: 1/)
0 Q) 1/) ..c:: 1/) ,_ tQ oD ..c:: 1/) 1/) tQ
0 ..c:: tQ 1/) ~ ~~ Q) ..c:: 1/) tQ tQ ~ ..c:: .... ~ tQ 0 1/) tQ
..c:: ~ D.O~ ai 1/) c ai 1/) ~ ~ ,"g ~ ~ tQ (ii tQ 1/) -· Cll • 3: tQ ·c;
Cii en ~ o"Q; ~ ~ ill) £ > om c ~ ~ tQ a. "0
ai ::::1 +" ::::1 a_ I Q) ai Q) <3 -E .::.: ai Cll c 0 0 0 :>. 3: Qj E ·:;: ai (Q(Q 0 c ::::1
~ '6 J: 3: Cll c- E 0 ill) u <llO tQ ill) ::JJ: .= 1/) 1/) c == :I: c Qj no tQ .s c tQ tQ Cii co+' a: tQ <ll'- u5 0 iii ell ~~ ..:.:: 0
~ ~ Lij > :::.:::~ :::.::: ..J w (/) <( 1-
10
8
_, 6
- 4
- 2
- 0
-12
10
8
6
- - 4
-' 2
0
oD Q)
0 en c Cll > Q)
iii ~ 1..1..
Figure 5.-Minimum, mean, and maximum water-temperature profile for lower Columbia River, February and March 1942. Asterisk indicates minimum, mean, and maximum water temperatures at Corps of Engineers moorings.
w 0 < a:: (.!)
~ z w (.)
(/) w w a:: (.!) w 0
~ w a:: ::::> 1-< a:: w a. ::2: w 1-
a:: w 1-
~

00
>-a:: <( 1-::> ID
0: 1-
60
April - 1942 55
1-jjj -J: z ~ 50 J: <( u...
~ 45 r-
w a:: (.') r-w c 40 ------
z - 65 w a:: ::> 1-
~ 60 w c.. :::?; w 1-
a:: w 1-<(
~
w 1-u;
55
50
45 160
Qj >
Qj Qj 0:: Q) Qj > >
:::: > 0:: 0:: Q) 0:: Rl ~ E (/) E ~ ·~ Rl j
~ Q) «i 0 ...I ~ (..)
1 1 I I I I I I I I
( -
.(~ - p( )--E tr-i ~- ---1----1-- ~ ,_~ r--c ~~-~---~ ~~ -()
rh (
~ r h ( ( D r 1 'ltl r h r h [] lp lJ lp I ro ID lp Lp [p
LO LO
L:::. I ___ L :::._._L Lr ~·---~ --t ~"'2 ~ l;!;---- ~ ~-- '- L~~ L ~ ._, L :::.
:::. ~ L :::. -L
-I J I 1 I I I
140 120 100 80 60 40 20 0
RIVER MILE
tiD .s::. . an .s::. .s::. an tliJ .s::. .s::.
Q)
Q) (/) .s::. ~ ~ :g an .c (/) 0 Q)
0 Rl (/) (/) Rl 0 .c ~ (/) ~ 3~ Q) .c (/) Rl
an~ ~ .c .... a) (/) Rl 0 (/) Rl r. ~ Rl~ (/) 1: vi
Rl «i ~ ..: -= :0~ Rl ~ Q) ~ Rl '(5 1: «i ~
(/)~ ~
(/) ,._~
0-a; 3: ~ Q)
"0 bO .r! dl 0 ID 1: 'j Rl '+-
Rl c.. > 1: a) :I t: ~ C.. I Q) nf Q) ~ C3 ~E ~ nf Q)
Q)
~ ::;; 0 0 0 ;;;- 3: Qj E ·:;: _II:!~ Rlro 0 1: :I U5 ..c: dl 1:- E 1: (/) 3: g ;;;:g Rl ~ Qj .jo _J.._: '.:> b:l
Rl ;t Rl .!!! Rl Q) ·- tii «i 1: RJ+' Rl .s 1: t: ~ ~ > ~~ 0 U5 Rl ~J ~ 0 0 jjj ~ ...I w (/) < 1- u...
Figure 6.-Minimum, mean, and maximum water-temperature profile for lower Columbia River, April and May 1942. Asterisk indicates minimum, mean, and maximum water temperatures at Corps of Engineers moorings.
14
12 ~ <( a:: (.')
10 f= z w
8 (..) (/) w w
6 a:: (.') w c ~
18 w a:: ::>
16 !;;( a:: w c..
14 :::?; w 1-
12 a:: w 1-<(
10 ~
8

"%j
&Q" s::: '"'l (t)
>-1 1t .I :::t a= Ul ..... ~::l ..... §" S.s::: ;:;· 8 $1:1 ~
~8 Ul (t)
8 ~ §:~ 8 ::l s::: ~ 8 8 ~ $1:1
8 ~(t) 8 $1:1 s::: .? 8 ~ ~ ~$1:1
8 ~ $1:1 '"'l ~ ~ ..... (t)
8 8 s::: 'd 8 ~ ~ $1:1 $1:1 M-~ ~ '"'l (t)
M-'d (t) '"'l 8 0 'd ~ (t) (t)
~ ~ 8" '"'l
'"'l -(t) 0 Ul ~ ~ (t) M- '"'l
00 0 0 '"'l -'d s::: Ul 8 0 C"' ,.... .....
$1:1
~~ (JQ .....
s· ~ (t) ~'"'l (t) ~ ~ s::: 8 ~ 0 $1:1
~ ::l s· ~ (JQ ~ Ul s::: "-<'
....... eo ~
~
SITE
Warrendale, Oreg.
Prindle, Wash.
Washougal, Wash.
Ellsworth, Wash.
Vancouver, Wash.
Kelley Point,Oreg. Willow-Bar, Wash.
St. Helens, Oreg.
Kalama, Wash.
Longview, Wash.
Stella, Wash.
Eagle Cliff, Wash.
Wauna, Oreg. Cathlamet, Wash.
Skamokawa, Wash.
Altoona, Wash.
Tongue Point,Oreg.
Fort Stevens,Oreg.
::0
< ITI ::0
~ r ITI
(.}1 ._.(.}1
Cl'l 0
... ~ 0
... 1\) 0
§
00 0
0'1 0
~ 0
1\) 0
-
~
-
-
....
-
I
6
WATER TEMPERATURE. IN DEGREES FAHRENHEIT
Cl'l 0
I
1 .... rv
"
"r .. , J 1 r-l
1
I
Cl'l (.}1
I I' I ~ """' ~
I
-....)
0
J '-"'
r
'""
.......,t
(~9-/3-iG)~r
I I I ...... l,. I ~ ~ r
J _.._I VI ~,
J J VI '-1
J I
~~ ...... l. r ~ I
I lr-. IK ·,...... IV ~
l ...... ,...
r- ~ "'
I I I
I
I I
-....) (.}1
U1 0
I
>-'(...
\Oc ~-N'<
- r
- r
r"\ - r
- r
- r
- -
I
(.}1 U1
I
_b L .. IV
lJ 11 ll 11 ..1 " 1 v
Cl'l 0
I
.......
': ,~
1 '""
' ' I
~I
I
Cl'l U1
i <58-64-72\•-
ll l j1 r u~ ,....,.,
'] : ...., I
l - ...,
J \ ....... j ,..,.I" 11 ~·
I ~ ' _ .... ~ .......
_t lv '""L ... '
~~I l ~ ... ~~I
_!: _b 1 ... r T
\
I
-....)
0
..... (...
\OC ~::J NOl
-
-
TRIBUTARY
,....,. Willamette River -
t- Lewis River
-t- Kalama River
t- Cowlitz River
-
-
J h 1 \ I\, 1\r"\
0 __ _L_ __ I
~ ... 0'1
v
I
00
-' '-'
I 1\) 0
I 1\) 1\)
-- ... 0
I ... 1\)
I ... ~
v 1~
I
~
I ... 00
WATER TEMPERATURE, IN DEGREES CENTIGRADE
~
I 1\) 0

with Willamette River temperatures, especially during the winter months when Willamette River flows are high and Columbia River flows are low. For this reason the observations at Kelley Point were given no weight in drawing the profiles for most months.
INTERPRETATION OF PROFILES
The profiles indicate an upward trend in a downstream direction for October through March, and no pronounced trend or an upward trend during April through September. Meager data for the Fort Stevens site during the 12-month period seem to indicate a rise in temperature in the last 15 miles above the mouth during winter and spring. Observations at that site may not represent true river-water temperatures because at high tide during the fall and winter, when the Columbia River is low, there probably is thorough mixing of fresh water with sea water which, at that time of the year, is ·warmer than the fresh water. Another possibility is that the observations at Fort Stevens were probably made in the smallboat basin where some water may remain for long periods before being flushed out, thereby providing a longer time for warming.
Questions that present themselves are: (1) How do these profiles compare with average conditions, and (2) are they representative of present conditions-that is, has there been a change in water-temperature regimen since 1942?
Comparison With Average Conditions
Because of the scarcity of long-term watertemperature data in the lower Columbia River, those obtained at Bonneville Dam, shown in table 21, provide the best available means of comparing the 1941-42 data with average conditions. However, to make the comparison more meaningful, average maximum and minimum monthly temperatures rather than absolute maximum and minimum temperatures are used for 1938-56. The reason for using records for 1938-56 rather than 1938-66 is that there appears to have been a change in the water-temperature regimen about 1956. The data presented in figure 8 show that August 1941 was about 3°F above average and January 1942 was 4 oF below average but the other months are within about 1 oF of average conditions. Therefore, assuming that water-tempera-
ture variations at Bonneville Dam are representative of those existing in the lower river, the profiles shown for the lower river are closely representative of average conditions for the period 1938-56 except for August 1941 and January 1942.
Comparison With Present Conditi'i'ns
Because there are no longtime records at any of the sites used in the 1941-42 profiles, Bonneville Dam records also must be used to determine whether there has been any change in regimen since 1942. Figure 9 s]'<JWS monthly mean water temperatures plotted against time for the 12 months of the year. Py inspection there appears to be an upward shift in water temperature after 1956 in all rronths except March and April, for which no shift is evident. The shift ranges from about 0.5 oF in September to about 2°F in winter. The pc~sibility that these shifts might be caused by natural phenomena such as a change in meteorologic conditions or deviations from average rates of flow was considered. To investigate these possibilities, water temperature was correlated with both air temperature and rate of flow.
There is a close correlation of nonthly mean water temperature ·with monthly mean air temperature not only because air temperature affects water temperature but, more importantly, because both are affected by solar radiation. The correlation of water temperature with rate of flow is not so close, and for many months of the year the variatior in flow was so small that no correlation was found.
10
Although the multiple correlations were performed for each month of the year, only those for July and April (figs. 10 and 11) are shown here to illustrate methods used.
Air temperatures used were tl'a. average of the monthly mean air temperatures at Wenatchee, Kennewick, Lewiston-Clr.rkston, and Bonneville. On figure lOA the points representing July in the years 1938-56 are shown as circles, and those for 1957-66 are shown as triangles to provide easy visual identification of the data for each period. The fact that the points for 1957-66 define a curve about 1 oF to the right of the curve for 1938-56 indicates that the shift in mean water terrperature was not caused by a change in meteorologic conditions. This still did not preclude the possibility

75
70
65
1- 60 u:; I z LLJ 0:: I c( IL.
(/) LLJ LLJ 55 0:: t!) LLJ c ~ u.i 0:: :::1 1-~ 50 I.IJ a.. ~ LLJ 1-
0:: LLJ 1-
~ 45
40
35
30
-
~
'---
f---
r-
f---
'---
f-
t-
T'""""
:.:
:· :·
:.;....;..:..
=·· .. f--
~ s ::·
f--:{ ::
±-; ..
=·:->
f-- ::·=i:: 2
li: LLJ (/)
,____
r--
1-u 0
::
!--'-
.L
" • : :}·::
r--2
> 0 z
I I I I I EXPLANATION
1.0 N LO -.t
I I 00 ;; ('t)
~ en Max
....
Mean~ Min
Bar graph for water years 1938-56 depicts for each month of the year average maximum, average minimum, and mean monthly water temperature
Bar graph for period August 1941 to July 1942 depicts maximum, minimum, and mean water temperature for each month of that period
t---;-
D {:
~ ::,:: :.
,___
'---L
u LLJ c
-
r--
1--
z c( ""\
r--
·::.,
r--r:;
1::: [
r-L
[0 LLJ IL.
r--
---
:.·.
::.,:
0:: c(
~
...._
0:: a.. c(
·::: f--
1----
~
1-
f.--
LLJ z :::1 •
-
f.--.-.:::::~
1--
ii
1-- -
-
-
-
-
-
Figure 8.-Comparison of monthly water temperatures for 1941-42 with those for 1938-56 at Bonneville Dam.
11

1-i:ij I
65
60
55
50
55
50
45
50
t5 45 a:: I <( LL.
~ 40 LLI a:: (.!) LLI
c 35 z -. 45 LLI a:: ::> 1-<(
ffi 40 a. ::E LLI 1-
ffi 35 1-<(
3:
30
45
40
35
30
50
45
40
r-• • •
1--
- • ••
1--
• • r-
•
f- • •
-
- •
-
• f- •
1940
I
October
• • • • • 4 . . -• • • • ... • • • • • • • -
• I I L
I I
November • • • • • • • • • •• • -• •• • • • •• •
I I
I I I
December
• • • • -• • • • •• • • • • • •• • -
I I I
I I I
January • • • • • • • • • •• •• • • • • • • • -
• 4
I I
• I I
February • • • ~
• ••• • •• -
• • -
• •
I I I
I
March
• • • • • -• • • • • • • • • • • • • • • • • I
1950 1960
55
50
45
40
60
55
50
65
60
55
50
70
65
60
55
75
70
65
60
70
65
60
-
-
f-
r-
r-
-
-
-
-
1--
• 4
•
• •
•
•
• •
• • •
• 4
• •
1940
April
• • •• • •• • •
I
I
May
• • • • • • ••
I
June
•• • • • • • 4
_l
July
•• • • • • • •
•
I
I
August
• • • • 4
• • • • •
I
September
• • I
1950
I
•• •• • • •
I
I
• • .
• • I
• • •
• •• •
I
I • • • • •
• •
I
I
•
•• •• •
•
• • • • •
I
Figure 9.-Monthly mean water temperatures at Bonneville Dam, 1938-66.
12
• • • -• •••
-
L
I
• • . -
•• • • I
• • -• • • • •
-
I
• •• • -
• • •
-
1
I
• • -••
• • • -
I
• • • • -
• • •
1960

288-047 0 - 68 - 3
u.t 0::1-:::J_ 75 1-LLJ c(J: O::z LLJLLJ a.. a:: ~J: LLJc( 1-u.. 0::(1) <C:!J
70 oo:: LLJ<!' f-LIJ :r:o 5:2z LLJ-~
65
WATER
+4
+3
ui z +2 0 i=t-c(-_LLJ
Gj~ OLLJ
+1
LLJO:: a:: I :::Jc( 1-u.. 0 c((/) O::LLJ LIJLLJ a.. a:: ~<.!' LLJLLJ -1 1-0
O::z LLJ-1-c( -2 ~
-3
-4 100
LLJ.
~!:: 75 t-LLJ c(:I: o::z LIJLLJ a.. a:: ~I LLJc( 1-U.. 0::(/) <C:!j 0 0:: 70 LLJ<!' 1-LLJ :r:O
~~ ~
55 60 65 70 TEMPERATURE, IN DEGREES FAHRENHEIT, AT BONNEVILLE DAM
B EXPLANATION
• 57 • e40 •63 1938-56
• 1957-66
e47 55
Calendar year
e52 e44
&6~.46 e53 e55
e39 ,PO 6
~8 e54
e42 51
.65 e49
e48
Approx1mat1on 1
150 200 250 300 350 400 450 500 FLOW OF. COLUMBIA RIVER AT THE DALLES, OREGON,
IN THOUSANDS OF CUBIC FEET PER SECOND
c
e49
65~--~~----~~~~----~----~----~----~----~ 65
WATER TEMPERATURE, IN DEGREES FAHRENHEIT, AT BONNEVILLE DAM
Figure 10.--Correlation of water temperature at Bonneville Dam with air temperature and rate of flow (July).
13

45 50 55 WATER TEMPERATURE, IN DEGREES FAHRENHEIT, AT BONNEVILLE DAM
u; z +1 0 i=f~w >I Wz Cw IJ.Ja:: a:: I
~~ <en O::IJ.J IJ.JIJ.J a.. a:: :::!!:<!' IJ.J IJ.J -2 f--0
a::z IJ.J-f-<( ~
-3
-4
e44 e55
e49
• 1939-56
• 1957-66
40 Calendar year
Approximation l
FLOW OF COLUMBIA RIVER AT THE DALLES. OREGON, IN THOUSANDS OF CUBIC FEET PER SECOND
w· a::f:::Jf-IJ.J <(::C a::z IJ.JIJ.J a.. a:: ::!!:I IJ.J<( f-LI..
a:: en -IJ.J <Cw ca:: we.!' f-IJ.J :cO
~z w-~
4~·~0----~---L~----~----~----~--~55
WATER TEMPERATURE, IN DEGREES FAHRENHEIT, AT BONNEVILLE DAM
Figure 11.-Correlation of water temperature at Bonneville Dam with air temperature and 1·ate of flow (April).
14
that rate of flow was causing the shift. Therefore, in figure lOB, flow was introduced as a second parameter by using the accepted graphic method of multiple correlation (Ezekiel and Fox, 1959, p. 254-277). Figure lOG indicates that, after taking both air temperature and flow into account, the points for 1957-66 still define a curve about 1 oF to the right of that for 1938-56. This means that the 1 oF upward shift in mean temperature shown by the July plot on figure 9 is not caused by a change in meteorologic conditions nor a change in the flow regimen and, therefore, represents a mancaused change in water-temperature regimen.
In figure lOG, the final plotting of points for 1952-56 might be taken to indicate that the shift in water temperature occurred as early as 1952. If the graphical correlation in figure 10 had been accomplished, assuming that the shift did occur in 1952, probably a shift of about + 1.5°F would have been found rather than + 1 °F. However, many of the multiple correlations for other months and the plotting in figure 9 for all the months of the year seem to indicate that the shift in temperature regimen occurred after 1956.
Figure 11 is similar to figure 10 but is for the month of April. The plot for April in figure 9 shows no change in water-temperature regimen. The graphical correlation in figure 11 checks figure 9 in this regard and further shows that meteorologic conditions and rate of flow were not masking a man-caused change in water temperature.
Results obtained from the graphical multiple correlations can be summarized as follows : 1. Shifts in water-temperature regimen, as shown by months in figure 9, are closely checked by the correlations. 2. These shifts, occurring in the middle 1950's probably are man caused, as the correlations indicate that they are not the result of changes in meteorologic conditions or flow regimen.
3. April through July were the only months where monthly flows varied enough from year to year to significantly affect the correlation between water and air temperatures.
15
CONCLUSIONS
First, the monthly profiles of water temperature for August 1941 to July 1942 indicate that, during the fall and winter, water temr~rature of the Columbia River below Bonneville Dam trends upward in a downstream direction but during the spring and summer there is no pronounced trend or a downward trend. This regimen is probably attributable to the fact that above Bonneville Dam the Columbia River is exposed to a continental climate w~th cold winters and hot summers and that th~ lower river is exposed to a marine climate with moderate winters and summers.
Second, the profiles probably represent conditions that are within about 1 oF of average for the period 1938-56 except those profiles for August 1941 and January 1942, which may be about 3°F higher and 4°F lower, resp(lctively, than their 1938-56 averages.
Third, in the middle 1950's a change in water-temperature regimen occurred wl'ich apparently was man caused. The change resulted in an increase in water temperature at Bonneville Dam for all months except March and April, which were unchanged. The change was greatest, 1.5° to 2°F, during October through February. During the critically warm months of July to September the increase was only about 1 °F. It is understood that dur!ng the period 1954-61 operations of the Eanford Atomic Energy Plant at Richland, Was}~., were increased considerably. This probably is the major cause of the change in water-tfmperature regimen at Bonneville Dam. However, concurrently with increased Hanford operations, interagency arrangements were n.ade to provide for releases of cooler water from Lake Roosevelt to offset, at least in part, the warming effect of the atomic plant. Also, beginning with the 1959 water year, releases from thE. newly constructed Brownlee Reservoir supplied a cooling effect during summer, which amounted to as much as 2°F at Clarkston, Wash., 145 miles downstream (Moore, 1967, p. 36). Both Brownlee Reservoir and Lake Roosevelt supply a warming effect in fall and winter and a cooling effect in spring and summer. Lake Roose-

velt had supplied this effect throughout practically the entire period of water-temperature record at Bonneville Dam, but in the middle 1950's the cooling effect was intentionally increased as explained above. Therefore, the Hanford operations are believed to be the principal cause of the increase in water temperature at Bonneville Dam, but the temperature of releases from Lake Roosevelt and Brownlee Reservoir probably explain why the increase is only about 1 °F in summer and is about 2°F in fall and winter. Construction of some "run-ofriver" reservoirs such as those above The Dalles and McNary Dams also may have had some effect on the temperature regimen, but this is believed to be relatively minor.
Fourth, the change in water-temperature regimen occurring in the middle 1950's at Bonneville Dam undoubtedly extends to the lower river, but probably the magnitude of the change diminishes in a downstream direction. The changes at Bonneville Dam, therefore, as shown in figure 9, cannot be used directly in determining how the 1941-42 prC'files of water temperature compare with the 19f7-66 monthly averages at Bonneville Dam. However, as far as the critical summer months are concerned, the July 1942 and September 1941 profiles probably are within about 1 oF of the 1957-66 averages, and the profile for August 1941 should be somewhat less than 3°F above the 1957-66 average.
REFERENCES
Ezekiel, Mordecai, and Fox, Karl A., 1959, Methods of correlation and regression analysis: New York, John Wiley & Sons, 548 p.
16
Moore, A. M., 1967, Correlation and aralysis of watertemperature data for Oregon streams: U.S. Geol. Survey Water-Supply Paper 1819-K, 53 p.
TABLES 1-21


I-" 1..(,
Da:\ 1 2 3 4 5 6 7 8 9
10 11 12 13 14 15 16 17 18 19 20 21 22 23 24 25 26 27 28 29 30 31
Avg Max Min
Table 1.--Daily water temperatures of Columbia River at Warrendale, Oreg., August 1941 to July 1942
[Once-daily observations--mixed morning and afternoon readings at river mile 142]
August ~eptember Ortober November Der·ember January February March April May June July §7 62 54 38 38 40 47 49 58 64 66 62 -- 35 38 40 48 so 58 64 -- 60 53 33 38 40 49 so 58 64 66 60 53 32 38 40 so so 58 67 66 I 60 53 32 40 40 50 52 58 67 65 58 52 32 39 41 so 53 59 66 65 58 52 -- 40 42 51 54 58 66 65 58 52 32 40 42 52 54 60 66 65 58 52 32 41 43 52 54 59 66 66 58 52 32 41 43 52 54 59 66
69 -- 57 52 32 41 43 -- 54 58 65 70 64 57 51 32 41 44 53 55 59 64 70 64 57 so 32 42 44 52 54 60 64 72 64 57 so 32 41 45 52 55 59 64 70 63 57 so 32 41 -- 52 54 59 64 70 63 57 so 32 41 45 52 54 58 64 72 63 57 so 32 40 44 51 54 58 64 74 62 56 so 32 40 44 51 55 58 65 74 62 56 48 33 40 44 52 56 58 66 74 62 56 48 34 40 44 52 56 59 66 73 62 56 46 34 40 44 52 -- 60 68 72 62 56 46 34 39 44 52 57 60 68 72 62 56 46 33 39 44 52 58 60 69 72 62 56 44 34 38 44 53 58 60 69 70 62 56 46 36 39 44 52 58 60 69 70 62 56 44 36 38 45 52 58 60 69 69 63 S5 44 36 40 45 51 57 60 --68 63 56 44 36 40 46 so 56 60 70 68 63 54 44 37 -- 46 50 56 60 69 68 62 54 43 37 ------ 46 50 56 63 69 68 ------ 54 ------ 37 ------ 46 ------ 56 ------ 69 71 64 57 49 34 40 43 51 55 59 66 74 67 62 54 38 42 46 53 58 63 7·0 68 62 54 43 32 38 40 47 49 58 64
----

1\) 0
Day 1 2 3 4 5 6 7 8 9
10 11 12 13 14 15 16 17 18 19 20 21 22 23 24 25 26 27 28 29 30 31
Avg Max Min
Table 2.--Daily water temperatures of Columbia River at Prindle, Wash., August 1941 to July 1942
[Once-daily observations--mixed morning and afternoon readings at river mile 134.5]
August September October November December January February March April May June July 66 62 54 46 36 39 41 48 so 57 64 66 61 52 -- -- -- 40 -- 51 57 66 66 60 54 45 34 38 42 so -- 58 66 66 60 53 46 38 40 so so 59 66 66 59 54 46 -- 42 so -- -- 66 65 58 55 46 40 41 so 54 59 65 65 58 -- 46 Q)
() 40 44 51 52 60 --66 58 52 45 ·r-i 40 44 52 54 60 66 64 -- 53 44 '\j 41 43 52 54 59 65
~
-- 58 52 44 ct! 41 44 -- 54 58 65
70 65 57 52 44 ~ 41 44 52 54 58 65 70 64 58 52 44 ~ 42 44 52 55 60 --VI
69 64 58 -- -- tH 42 44 52 55 60 65 72 63 56 so -- 0 42 -- 52 56 60 65 69 62 58 so -- Q) 41 45 53 55 58 64 VI
71 62 -- so 44 ~ 41 45 52 55 59 64 70 62 58 so 43 () -- 44 52 -- 58 64 Q)
72 61 57 49 41 ,.0 -- 44 53 56 -- 63 74 60 56 so 44 Q) 40 44 52 56 59 65 ~
72 61 56 -- 44 ~ 40 46 54 58 60 65 72 62 57 47 44 VI 40 45 53 -- 60 68 VI
70 63 57 45 -- Q) 40 45 52 57 61 68 ()
72 61 56 45 44 u 39 44 53 56 60 69 ct!
70 62 -- 46 44 s:: -- -- 53 58 60 70 ·r-i
70 64 56 46 -- s:: 39 44 52 58 60 70 70 -- 56 46 -- -~ 40 -- 52 57 -- --68 62 56 44 -- +J 38 47 -- 57 59 68 ct!
69 63 -- 41 -- +J 41 47 so 58 60 68 Cl)
68 64 54 -- -- -- 46 so 56 62 68 68 62 54 46 39 ------ 48 -- 56 63 68 67 ------ 53 --.---- -- ------ -- ------ 56 ------ 68 70 63 57 49 44 40 44 52 55 59 66 74 66 62 55 46 42 48 I 54 58 63 70 67 60 53 41 39 38 40 48 50 57 63
~-
"' "' "' ' 0 ... ..., 0
"' "'
1\) 1-'
Day_ 1 2 3 4 5 6 7 8 9
10 11 12 13 14 15 16 17 18 19 20 21 22 23 24 25 26 27 28 29' 30 31
Avg Max Min
Table 3.--Daily water temperatures of Columbia River at Washougal, Wash., August 1941 to July 1942
[Once-daily observations--8 to 10 a.m. at river mile 121.6]
August September October November December January February March April May June July 66 62 52 46 33 39 39 48 49 56 63 66 61 52 48 33 39 44 47 49 57 64 65 61 53 45 34 39 40 48 so 57 65 66 60 52 45 32 39 40 49 51 57 65 66 59 54 46 31 39 44 49 so 58 66 65 59 53 46 31 39 42 so 52 59 66 64 58 51 46 31 39 38 so 52 59 65 65 57 51 45 31 39 43 so 53 60 65 65 58 51 43 -- 39 46 so 54 60 66 64 57 51 42 -- 39 44 51 53 59 66
70 63 57 51 43 -- 41 45 52 53 58 65 70 64 56 52 42 -- 40 42 51 54 57 64 71 64 56 52 42 31 38 44 52 53 58 64 70 64 55 51 42 32 40 43 51 53 59 64 70 62 55 so 43 32 40 43 52 55 59 64 69 63 55 49 43 32 40 44 52 55 59 64 70 63 56 48 43 32 40 46 so 54 59 64 71 62 56 48 43 32 40 44 52 55 58 63 73 60 56 48 44 32 40 44 51 56 58 65 73 60 55 46 44 32 39 43 52 56 58 65 72 60 55 44 44 32 39 45 52 58 57 ·66 72 61 54 44 4·~ 32 39 45 51 58 59 67 72 62 55 44 44 32 39 45 53 57 59 67 70 62 55 42 43 33 39 44 53 57 60 68 70 62 56 46 43 37 40 44 52 58 60 68 69 62 55 44 41 38 39 44 51 57 60 67 68 61 55 44 41 35 39 45 so 57 59 69 68 62 55 44 40 37 39 45 so 57 59 69 67 62 53 44 39 36 -- 46 49 56 60 69 69 62 53 45 38 36 ------ 46 so 56 62 68 67 ------ 52 ------ 37 36 ------ 48 ------ 55 ------ 69 70 63 56 47 43 33 39 44 51 54 59 66 73 66 62 54 48 38 41 48 53 58 62 69 67 60 52 42 37 31 38 38 47 49 56 63
[\) [\)
Day 1 2 3 4 5 6 7 8 9
10 11 12 13 14 15 16 17 18 19 20 21 22 23 24 25 26 27 28 29 30 31
Avg Ma~ Min
'Table 4. --Daily water tem:peratures of Columbia River at Ellsworth, Wash., August 1941 to July 1)142
[Once-daily observations--mixed morning and afternoon readings at river mile 112.3]
August Se:ptember October November December January February March A:pril May June July -- 62 53 46 37 40 -- 49 so 56 63 65 -- -- 46 36 41 41 48 so -- 64 65 60 53 46 36 40 41 49 so 57 --65 -- -- 46 37 40 41 so 51 -- 66 65 -- 53 46 32 40 41 -- 51 58 --65 -- 53 48 32 40 -- 51 52 59 66
-- 58 52 -- 32 -- 41 51 53 -- 65 65 58 52 -- 32 -- -- 51 54 60 65 65
I
58 -- 46 32 41 44 51 54 60 66 -- 58 52 -- 32 42 -- 52 -- 59 66 -- -- -- 44 -- 42 44 52 54 59 65
70 64 -- 52 -- 32 42 44 -- 54 59 65 70 64 58 52 43 33 42 -- 52 -- -- 65 70 -- -- 51 -- 33 42 43 52 55 -- 64 71 63 -- 51 44 33 -- -- 52 55 59 64 70 63 -- -- 44 33 42 46 52 55 -- ---- 63 -- so 44 -- 42 -- 52 -- 59 64 71 -- -- 49 -- -- 40 -- 52 55 58 --72 -- -- -- 47 -- 39 -- -- 56 57 --73 -- 55 -- -- 36 40 44 52 -- -- 65 72 -- 55 47 -- 36 -- 43 53 -- -- 66 72 62 57 46 44 35 -- -- 52 56 58 67 72 -- 56 -- 44 35 40 45 53 -- 59 67 -- -- -- 46 44 35 40 45 53 58 60 68 70 -- -- 46 -- -- 40 44 53 58 60 68 69 62 -- 45 43 36 40 45 -- 58 60 --69 -- 55 45 41 38 40 46 -- 57 59 68 68 -- 55 44 -- 38 -- 46 52 58 59 69 68 -- 55 45 40 38 -- -- 51 -- -- 69
-- 62 -- -- 40 38 ------ 48 so 58 60 69 -- ------ 53 ------ 39 38 ------ -- ------ -- ------ 69 70 64 57 49 44 35 41 44 51 54 59 66 73 55 6?. 53 48 1 :;;~ 42 4R 53 58 60 69 68 62 53 44 39 ---- 32 39 41 48 50 56 63 --- -- ----

[\_) w
Day ~1
2 3 4 5 6 7 8 9
10 11 12 13 14 15 16 17 18 19 20 21 22 23 24 25 26 27 28 29 30 31
Avg Max Min
Augw=t
71 72 72 ------73 74 74 74 74 --72 ----69 69 ----68 72 74 e8
Table 5.--Daily water temperatures of Columbia River at Vancouver, Wash., August 1941 to July 1942
[Once-daily observations--mostly afternoon readings at river mile 106.5]
September October November December January February March April May June July -- 62 -- -- -- 38 40 48 so 58 --67 -- 54 -- 37 -- -- 49 -- 58 ---- -- 54 46 -- 38 41 49 -- -- --66 61 54 46 36 -- -- -- 51 58 ---- 60 -- 46 -- 39 41 so -- -- 67 -- 60 54 -- 32 -- 41 -- -- 59 ---- -- -- -- -- 41 42 51 54 -- --66 -- -- 46 -- -- -- 51 54 58 --66 -- 52 46 -- 42 42 -- 54 -- 67 65 58 52 -- 33 -- -- 52 -- 58 ---- 58 52 44 33 -- 45 52 54 58 --65 -- 52 -- 33 -- 44 -- 55 58 66 -- 57 -- -- 33 42 -- 53 56 58 ---- 58 -- -- 33 -- -- 54 56 -- 65 63 -- -- 44 33 42 -- -- -- -- 65 64 -- so 44 34 -- 46 53 -- 58 65 -- 58 -- 44 34 -- 44 52 56 -- 65 -- -- so 44 34 41 -- 52 -- 58 ---- -- so -- -- 41 45 -- -- -- --63 58 -- -- 36 40 -- 52 55 -- 67 -- 58 -- 44 36 40 45 -- -- 59 67 63 57 -- 44 -- -- -- 53 56 --63 57 46 -- 36 40 -- -- -- 59 -- 57 46 45 36 40 45 53 58 59 64 -- -- -- -- 40 45 53 58 59 63 -- -- 42 37 40 45 -- -- ---- 56 -- 41 -- -- 46 52 58 59 63 -- -- 42 39 40 -- 52 58 ---- -- -- 42 39 -- -- -- 58 60 63 -- -- 40 38 ------ 46 so 58 60
------ -- ------ 39 38 ------ 48 ------ 58 ------64 58 51 44 35 40 44 51 56 59 66 67 62 54 46 39 42 48 54 58 60 67 63 56 46 39 32 38 40 48 so 58 65

I\) +
Day 1 2 3 4 5 6 7 8 9
10 11 12 13 14 15 16 17 18 19 20 21 22 23 24 25 26 27 28 29 30 31
Av~ Max Min
Table 6.--Daily water temperatures of Columbia River at Kelley Point, Oreg., August 1941 to July 1942
[Once-daily observations--mixed morning and afternoon reauings at river mile 101.8]
August September October November December January February March April May June July 66 62 54 47 36 -- -- 50 50 59 72 68 62 -- 48 34 45 47 52 54 60 71 68 62 55 48 39 47 47 54 -- 60 72 66 60 54 48 -- 47 46 53 54 61 71 66 -- 55 47 34 46 49 -- 57 63 --65 59 56 46 35 44 50 53 60 62 68 -- 60 56 -- 34 46 47 54 58 -- 68 66 60 55 45 36 -- -- 51 56 60 69 66 59 -- 44 36 46 49 55 56 60 70 64 61 55 45 36 46 49 54 -- 60 69
70 63 59 54 44 -- 47 48 56 56 60 68 70 64 -- 54 43 38 46 48 -- 55 61 --70 63 57 54 44 40 46 48 53 54 62 68 70 -- 55 52 -- 38 45 44 S8 57 -- 68 70 64 58 53 46 39 -- -- 54 58 60 66 70 64 57 -- 46 39 45 50 54 54 60 66 -- 64 58 50 48 40 45 48 54 -- 60 66 71 62 56 48 49 -- 46 49 56 58 60 67 72 62 -- 48 48 38 46 48 -- 56 60 --73 62 58 48 46 43 44 50 58 59 61 69 71 -- 59 45 -- 44 44 51 57 58 -- 71 73 64 58 45 48 42 -- -- 57 58 62 71 72 64 58 -- 46 40 44 49 55 58 62 71 71 62 58 46 46 40 44 48 57 -- 62 71 -- 62 58 47 -- -- 45 48 54 60 62 70 69 62 -- 45 42 44 44 49 -- 60 62 --69 62 58 46 41 44 44 47 52 59 62 71 68 -- 56 46 -- 43 46 49 53 58 -- 69 68 62 53 47 42 43 -- -- 54 58 66 70 68 62 55 -- 39 45 ------ 54 52 58 67 70 -- ------ 54 ------ 38 -- ------ 54 ------ -- ------ --70 64 58 51 45 39 45 49 54 57 61 69 73 68 62 56 49 45 47 54 58 60 67 72 68 62 53 45 38 34 44 44 so so 59 66
----·-
[\) \Jl
Table 7.--Daily water temperatures of Willamette River at Portland, Oreg. (Morrison Bridge), August 1941 to July 1942
[Once-daily observations--mixed morning and afternoon read1ngs at river mile 12.8]
Day August September 0 ~tober November December January February March April May June July 1 71 62 54 44 38 -- -- 51 52 57 65 2 70 62 -- 46 36 44 45 52 52 -- 66 3 69 62 54 48 37 45 45 53 51 58 70 4 68 62 53 49 -- 46 46 -- 51 60 72 5 68 -- 54 48 34 46 47 -- -- -- 73 6 68 60 54 48 34 46 46 53 52 60 74 7 -- 60 54 -- 34 45 48 53 54 60 --8 65 60 54 47 35 -- -- 52 56 61 75 9 65 58 -- 46 35 45 47 55 56 61 75
10 68 59 53 45 38 46 47 55 -- -- 75 11 66 58 53 44 -- 46 48 55 56 60 73 12 77 66 -- 53 44 39 47 48 -- -- 59 71 13 74 65 56 53 44 40 46 47 55 55 60 72 14 74 -- 56 53 -- 40 45 47 55 56 60 72 15 75 64 56 52 44 40 -- -- 56 56 60 72 16 75 64 58 -- 45 40 43 46 56 56 -- 70 17 -- 64 59 48 46 40 43 45 55 56 62 69 18 76 63 56 48 47 -- 43 46 54 57 62 69 19 76 62 -- 48 47 40 44 46 -- -- 61 69 20 76 63 54 46 48 41 44 48 55 58 61 70 21 75 -- 55 46 -- 40 44 48 55 59 60 --22 74 62 57 45 47 40 -- -- 55 60 61 71 23 76 61 56 -- 46 40 44 47 55 60 -- 71 24 -- 63 57 44 46 41 43 47 56 60 62 72 25 74 62 56 45 -- -- 43 47 55 61 62 72 26 73 63 -- 45 44 43 44 48 55 -- 63 73 27 74 64 55 44 42 44 44 48 54 58 63 74 28 72 -- 55 45 -- 46 44 48 -- 57 63 --29 71 62 56 46 41 46 -- -- 52 56 64 74 30 72 62 55 -- 40 45 ------ 49 -- 56 -- 74 31 -- ------ 54 ------ 40 46 ------ 50 ------ 56 ------ 74
Avg 74 65 57 50 45 40 45 47 54 56 61 72 Max 77 71 62 54 49 46 47 50 56 61 64 75 Min 71 61 54 44 40 34 43 45 51 51 57 65
1\) 0\
Table 8.--Daily water tempera~ures of Willame~te River at Portland, Oreg. (U.S. Army Corps of Engineers moorings), August 1941 to July 1942
[Once-daily observations--morning readings to Feb. 23, afternoon readings thereafter, at river mile 6.3]
Day August September October November December January February March April May June July 1 -- 61 54 45 35 -- -- 51 54 58 69 2 70 62 -- 46 34 44 46 53 54 60 70 3 71 62 54 46 33 44 47 54 -- 60 73 4 70 62 54 48 -- 46 46 53 52 63 72 5 70 -- 54 48 32 46 48 -- 56 63 --6 66 62 54 48 32 46 48 54 56 60 73 7 -- 62 54 -- 32 45 48 54 57 -- 76 8 78 66 60 54 48 32 -- -- 54 55 61 76 9 76 66 60 -- 47 32 46 48 54 56 62 76
10 -- 66 60 53 46 35 46 48 58 -- 63 75 11 74 66 60 -- 46 -- 46 48 55 57 62 74 12 73 65 -- 53 44 38 46 48 -- 58 64 --13 74 65 58 53 44 40 46 48 56 59 66 72 14 74 -- 57 53 -- 40 46 48 56 58 -- 72 15 73 65 57 52 44 40 -- -- 57 58 64 72 16 73 65 56 -- 45 40 44 48 56 57 61 71 17 -- 64 57 so 45 40 44 48 57 -- 62 72 18 74 64 56 49 47 -- 42 47 57 58 64 72 19 75 63 -- 46 47 39 42 48 -- 60 65 --20 74 61 56 -- 47 40 -- 49 58 60 66 76 21 73 -- 56 46 -- 40 44 48 56 60 -- 76 22 73 60 56 45 47 40 -- -- 55 60 66 73 23 74 61 56 -- 46 40 44 48 56 60 66 75 24 -- 62 56 44 46 40 44 48 -- -- 66 74 25 73 62 56 45 -- -- 44 48 56 61 62 76 26 73 62 -- 44 44 42 44 48 -- 62 64 --27 72 60 56 44 42 44 44 50 55 60 65 74 28 72 -- 56 45 -- 44 46 so 56 59 -- 74 29 72 62 55 46 41 44 -- -- 56 58 72 74 30 73 62 55 -- 41 45 ------ 51 54 58 69 74 31 -- ------ 55 ------ 40 44 ------ 52 ------ -- ------ 74
Avg 74 65 58 50 45 38 45 48 55 58 64 73 Max 78 71 62 54 48 45 46 52 58 62 72 76 Min 72 60 55 44 40 32 42 46 51 52 58 69
!\) -..:J
Day 1 2 3 4 5 6 7 8 9
10 11 12 13 14 15 16 17 18 19 20 21 22 23 24 25 26 27 28 29 30 31
Avg Max Min
Table ~.--Daily water temperatures of Columbia River at Willow-Bar, Waqh., August 1941 to July 1942
[Once-daily observations--mostly mid-day readings a~ river mile 101.6]
Augus~ SEfl2_tember October November December January February March April May June July 68 62 54 47 36 38 40 48 51 59 66 66 62 54 48 35 38 42 so 52 59 68 66 62 55 46 35 40 42 49 52 58 68 67 60 54 46 34 40 41 52 52 60 68 67 60 55 46 33 39 ;t2 52 _54 60 68_ 66 60 -- 47 32 40 42 51 56 60 68 66 59 53 47 32 40 42 51 56 60 68 65 58 52 46 32 40 43 52 56 60 68 65 58 53 46 32 41 44 53 55 61 69 65 58 58 45 32 42 4_4_ 54 56 61 68 66 58 54 44 32 42 46 54 56 60 67
70 64 58 53 44 32 41 44 53 58 60 67 70 64 57 53 44 32 41 45 54 57 60 68 70 64 56 52 43 32 41 44 54 57 60 66 70 63 57 52 44 32 41 44 54 58 60 66 70 63 57 so 44 32 42 46 54 56 60 66 70 63 58 so 44 34 42 46 54 57 60 66 71 62 58 so 44 34 42 46 54 58 60 66 72 62 57 so 45 34 42 46 54 58 60 67 72 61 56 49 46 34 40 46 54 59 60 68 73 61 56 48 45 35 41 45 54 60 60 69 73 61 56 47 45 35 40 46 53 60 60 68 73 62 56 46 44 34 40 46 54 60 62 69 72 62 56 46 44 35 40 46 54 60 62 70 72 62 56 46 44 36 40 46 54 60 61 69 70 63 56 46 42 36 40 46 54 60 62 70 70 62 57 46 40 38 40 46 52 58 61 70 68 62 56 45 40 38 40 47 54 59 61 70 68 63 56 45 40 37 -- 47 54 58 62 70 68 63 54 46 40 37 ------ 48 52 58 64 70 68 ------ 54 ------ 39 37 ------ 48 ------ 58 ------ 70 70 64 58 so 44 34 40 45 53 57 60 68 73 68 62 55 48 38 42 48 54 60 64 70 68 61 54 45 39 32 3R 40 4~ Sl r;~
l __ *16
[\) CP
JJay 1 2 3 4 5 6 7 8 9
11)
11 12 13 14 15 16 17 18 19 20 21 22 23 24 25 26 27 28 29 30 31
~=:1 Min
August
71 69 70 70 70 70 69 71 70 71 70 72 71 72 72 72 73 71 71 69 69 69 69 69 70 73 69
Table 10.--Daily water temperatures of Columbia River at St. Helens, Oreg., August 1941 to July 1942
[Once-daily observations--mostly morning readings at river mile 85.8]
September O,:tober November December January February March April May June July 68 62 54 45 37 45 43 47 51 56 65 67 61 -- 46 35 43 42 48 so 57 66 67 62 54 44 36 42 40 48 51 58 66 66 61 53 45 34 41 44 so 51 58 67 66 60 55 48 33 43 42 so 51 59 67 65 61 53 48 32 44 42 so 52 60 68 65 58 53 46 32 44 43 51 53 60 67 65 58 52 45 32 45 43 52 54 60 67 65 58 52 45 32 45 45 53 54 60 69 65 58 52 45 32 45 44 -- 55 60 69 64 58 52 43 32 45 46 54 55 60 68 64 -- 52 42 32 44 46 53 -- 60 66 -- 58 52 43 35 45 44 53 -- 60 67 64 58 52 43 38 45 45 53 53 60 66 63 58 52 44 35 44 46 53 56 60 66 64 57 51 44 38 42 45 54 55 59 65 64 57 so 44 38 42 45 53 56 59 65 62 57 48 45 36 41 44 52 56 59 65 62 57 48 47 36 40 44 53 57 59 66 61 55 46 46 36 41 43 55 57 59 67 61 56 46 46 38 41 44 -- 59 60 68 61 56 45 47 38 40 44 53 58 60 68 62 56 45 45 38 42 44 53 58 60 68 62 56 45 45 39 42 46 54 59 61 68 62 55 45 44 40 42 45 54 60 60 70 62 55 44 40 42 41 45 53 59 60 70 61 55 43 42 42 42 45 53 59 60 70 61 55 44 41 43 43 47 53 58 61 70 62 55 44 40 43 -- 47 51 57 62 69 61 54 45 40 44 ------ 47 52 56 63 68
------ 54 ------ 39 44 ------ 48 ------ 56 ------ 68 64 57 49 44 37 43 44 52 55 60 67 68 62
I 55 48 44 45 48 55 60 63 70
61 54 43 39 32 40 40 47 so 56 65 ------ -

rv \C
Day 1 2 3 4 5 6 7 8 9
10 11 12 13 14 15 16 17 18 19 20 21 22 23 24 25 26 27 28 29 30 31
Avg Max Min
August
70 71 70 70 70 70 72 71 72 73 72 72 72 71 70 70 69 68 68 68 70 73 68
Table 11.--Daily water temperatures of Columbia River at Kalama, Wash., August 1941 to July 1942
[Once-daily observations--mostly morning readings at river mile 75.1]
September October November December January February March April May June July o7 62 54 45 38 38 40 46 so 56 63 66 62 54 46 36 39 40 47 49 56 64 66 62 54 46 36 40 40 47 -- 57 65 66 61 54 46 35 40 40 48 so 57 66 66 60 53 46 34 40 40 so 51 58 66 66 60 53 46 32 40 40 so 52 58 66 65 59 52 46 32 40 41 so 53 59 66 65 59 52 46 32 40 42 so 54 59 66 64 58 52 46 32 41 43 so 54 59 66 64 57 52 45 32 42 43 51 54 59 66 64 57 52 44 32 42 43 52 53 58 65 64 57 52 44 32 42 43 52 54 58 65 64 56 52 43 32 42 43 52 54 58 65 64 56 52 43 32 42 43 51 55 58 65 64 56 51 44 32 42 -- 52 54 58 65 63 56 51 44 35 42 -- 52 55 58 64 63 56 so 44 34 41 45 51 55 -- 64 63 57 so 44 34 41 45 51 54 58 64 62 56 49 44 34 40 44 52 -- 58 64 62 56 48 45 34 40 44 52 55 58 65 61 56 48 44 35 40 44 52 56 58 66 61 56 47 44 35 40 44 52 57 58 66 62 56 46 44 35 40 44 52 56 59 66 62 56 46 44 35 40 45 52 58 60 67 62 56 46 -- 36 39 44 52 58 59 68 62 56 46 43 37 40 44 52 58 60 68 62 56 44 42 38 40 44 51 56 59 68 62 56 45 40 38 40 46 51 56 59 68 62 55 44 40 38 -- 46 so 56 59 68 62 54 45 40 37 ------ 46 so 56 61 68
------ 54 ------ 38 38 ------ 47 ------ 56 ------ 68 64 57 so 44 35 40 43 51 54 58 66 67 62 54 46 38 42 47 52 58 61 68 61 54 44 38 32 38 40 46 49 56 63
w 0
pay
;\ 31 4 5 6 7 8 9
10 11 12 13 14 15 16 17 18 19 20
21 22 23 24 25 26 27 28 29 30 31
Avg ~1ax Min
August
71 71 71 71 71 --72 72 72 72 72 72 --71 70 70 69 69 69 --71 '72 69
Table 12.--Daily water temperatures of Columbia River at Longview, Wash., August 1941 to July 1942
[Once-daily observations--mostly between 10 a.m. and 2 p.m. at rlver mile 66.0]
September October November December January February March April May June July -- 62 53 47 37 41 42 49 so 56 65 67 62 -- 48 34 43 43 49 49 56 66 65 61 53 48 35 43 43 49 -- 57 66 66 61 53 45 -- 43 43 49 so 58 66 66 -- 53 44 34 44 42 -- 52 59 --66 59 52 45 33 42 43 so 53 60 67 -- 57 52 -- 33 42 43 so 55 -- 67 65 57 52 45 34 -- -- so 55 58 66 65 57 -- 44 33 43 44 51 54 58 66 65 57 52 44 33 43 44 52 -- 57 66 64 57 52 44 -- 43 45 53 52 56 65 64 -- 52 44 34 43 44 -- 52 55 --64 57 52 43 35 42 44 51 53 58 65 -- 57 51 -- 38 41 44 51 54 -- 65 64 57 so 44 35 -- -- so 55 57 64 64 57 -- 45 37 42 43 51 56 56 64 63 56 48 45 38 42 44 so -- 55 64 62 56 47 45 -- 41 4'5 so 57 56 63 61 -- 46 46 38 41 45 -- 56 55 --61 55 45 45 38 41 45 53 57 56 66 60 55 43 -- 38 41 45 53 58 -- 67 60 55 42 45 38 -- -- 52 57 58 67 60 55 42 45 38 41 45 51 56 59 66 61 55 -- 44 38 41 44 52 -- 60 68 62 56 44 -- 39 41 44 52 57 59 69 62 -- 46 42 41 41 45 -- 57 58 --63 56 46 40 40 41 45 so 54 58 69 -- 56 45 -- 41 42 46 so 54 -- 69 63 55 45 40 41 -- -- so 55 60 69 62 54 -- 40 41 ------ 48 51 55 63 69
------ 54 ------ 38 41 ------ 49 ------ -- ------ 68 63 57 49 44 37 42 44 51 54 58 66 s: S'2 53 43 41 44 49 53 ss 63 69 60 54 42 38 33 41 42 49 49 55 63
w 1-'
Day 1 2 3 4 5 6 7 8 9
10 11 12 13 14 15 16 17 18 19 20 21 22 23 24 25 26 27 28 29 30 31
Avg Max Min
August
71 71 71 71 72 --72 71 71 72 72 73 72 71 70 69 70 70 69 68 71 73 68
Table 13. --Daily water temperatures ot' Columbia River at Stella, Wash., August 1941 to July 1942
[Once-daily observations--mixed morning and afternoon readings at river mile 56.4]
September October November December January February March April May June July 63 63 54 -- -- -- 41 48 so 57 --67 61 54 46 34 41 42 so so 56 67 66 62 54 46 34 41 41 49 51 59 68 66 60 54 46 34 42 43 51 so 60 68 67 -- 54 46 31 43 42 -- 51 -- 66 66 60 53 47 32 42 42 51 54 59 66 67 -- 54 47 32 42 44 51 54 60 67 66 57 53 45 32 42 44 51 54 58 67 65 58 52 45 31 43 44 53 54 59 61 65 58 52 46 33 43 45 -- 54 59 62 63 57 53 44 32 44 45 53 55 58 65 65 58 52 42 33 43 43 54 54 59 67 64 58 -- 43 34 42 45 52 56 60 65 64 55 52 -- 35 42 45 51 56 60 66 63 58 51 43 33 44 44 52 55 59 65 63 57 so 44 34 42 44 51 58 59 65 63 59 so 44 35 42 45 53 57 57 65 -- 57 49 45 35 42 46 53 55 58 65 63 57 48 44 33 42 45 54 57 58 68 62 55 48 -- 38 41 44 53 58 58 67 62 55 47 45 37 41 45 53 58 61 67 62 55 46 45 37 40 45 53 58 60 68 64 57 45 44 36 41 45 52 59 59 67 63 58 -- 44 37 40 46 52 58 61 69 63 -.. 46 45 39 42 47 53 58 59 69 63 56 46 43 39 41 48 52 58 60 --62 56 -- 39 39 40 47 51 58 59 --62 57 45 -- 41 41 48 52 56 61 --62 56 45 38 39 -- 49 52 58 -- --62 55 46 40 39 ------ 47 50 57 64 --
------ 55 ------ 38 39 ------ 47 ------ 57 ------ --64 58 so 44 35 42 45 52 55 59 66 67 63 54 47 41 44 49 54 59 64 69 62 55 45 ~R
L__ __ __l!__ - 40 41 18 so 56 61 . -· ---·- -- -
w [\)
Da_y_ 1 2 3 4 5 6 7 8 9
10 11 12 13 14 15 16 17 18 19 20 21 22 23 24 25 26 27 28 29 30 31
:'.··"" . / ... Max Min
August
70 70 71 70 71 --72 72 70 67 71 72 72 70 70 68 70 69 68 68 7(}
72 67
Table 14.--Daily water temperatures of Columbia River at Eagle Cliff, Wash., August lY4l to July 1942
[Once-daily observations--mostly afternoon readings at river mile 50.6]
September October November December January February March April May June July 68 63 55 47 37 40 42 47 50 56 64 67 61 55 47 38 42 41 48 so 57 66 66 62 54 46 37 40 42 48 so 57 66 66 60 54 45 37 42 I 42 49 51 58 66 66 61 54 46 35 41 41 49 51 59 68 65 59 54 48 35 41 42 so 52 -- 68 66 59 54 46 35 42 42 so 53 59 66 64 59 54 46 33 42 42 so 53 58 67 65 58 53 46 35 43 43 50 53 58 66 65 58 52 46 33 42 43 52 -- 58 66 64 57 53 44 32 43 43 -- 53 58 66 64 58 52 44 34 43 43 53 54 58 66 64 57 52 45 33 42 44 52 55 59 65 62 58 52 44 37 42 44 52 57 58 65 61 57 51 45 34 42 44 52 55 58 65 63 57 50 45 34 40 44 52 55 58 --62 57 50 45 34 43 44 52 56 58 64 62 57 49 45 34 43 45 52 56 58 66 61 57 48 46 36 43 45 52 55 58 66 61 56 -- 47 37 41 45 54 59 58 66 60 58 46 45 39 42 44 52 57 58 66 60 57 46 45 40 41 44 52 55 59 67 61 57 45 45 41 40 44 52 58 60 67 61 57 46 45 37 41 44 52 57 60 69 62 56 47 45 38 40 44 52 57 59 69 62 56 46 44 38 40 45 52 57 59 --61 56 46 42 38 41 45 so 56 60 70 62 56 46 43 40 40 46 51 57 -- 70 63 56 45 41 40 -- 46 52 57 62 69 63 55 45 41 40 ------ 46 so 57 62 69
------ 54 ------ 39 39 ------ 47 ------ 56 ------ 69 n~ 58 50 45 36 4?. 41 51 55 sq 57 68 63 55 48 41 43 47 54 59 62 70 60 54 45 39 32 40 41 47 so 56 64
~-------

w w
Day 1 2 3 4 5 6 7 8 9
10 11 12 13 14 15 16 17 18 19 20 21 22 23 24 25 26 27 28 29 30 31
Avg Max Min
Table 15.--Daily water temperatures of Columbia River at Wauna, Oreg., November 1940 to August 1942
[Once-daily observations--mixed morning and afternoon readings at river mile 41.8)
November Dee?ember January February March April May June July August September
-- 48 39 43 46 so 56 61 64 72 68 -- 46 39 43 46 54 56 60 64 72 67 -- 46 40 46 46 52 57 60 64 72 67 -- 46 40 44 46 52 -- 60 -- 68 67 53 46 40 44 45 53 57 59 67 70 67 53 47 39 44 47 52 57 59 66 71 .67 53 46 39 44 46 53 57 60 67 71 --49 46 39 44 46 53 58 -- 67 71 65 so 41 39 44 46 54 58 60 67 70 65 so 41 39 44 46 54 57 64 67 -- 64 49 39 40 44 49 54 -- 63 68 68 65 47 39 40 44 49 54 58 63 69 69 65 45 40 40 43 48 54 58 63 -- 68 65 46 39 40 41 49 54 57 62 74 68 --45 38 40 41 49 54 57 -- 73 68 63 44 39 40 43 -- 54 57 63 73 68 64 so 40 42 45 48 54 57 63 73 67 63 51 40 41 41 48 54 57 63 72 67 63 44 40 41 43 49 54 56 63 72 71 63 45 41 44 41 49 -- 57 63 72 70 61 41 40 43 45 49 54 58 63 72 71 --44 41 42 42 so 54 61 -- 73 69 62 43 39 41 43 -- 54 59 63 73 69 63 42 41 42 43 49 55 59 63 73 -- 62 43 41 42 43 so 56 -- 64 73 68 62 41 41 41 43 so 55 59 64 73 69 62 42 42 44 44 so -- 59 64 -- 69 61 45 41 44 44 so 56 60 63 72 69 --44 41 43 -- so 55 61 64 73 69 61 44 41 43 ------ 49 55 62 64 72 68 61
------ 41 43 ------ so ------ 61 ------ 72 -- ------46 42 41 43 48 54 58 62 70 69 64 53 48 44 46 50 56 62 64 74 72 68 41 38 39 41 45 so 56 59 64 67 61
lA.J +
Table 15.--Daily water temperatures of Columbia River at Wauna, Oreg., November 1940 to August 1942--Continued
DB.)l October November December January February March April May June July August 1 61 -- 47 40 37 43 46 53 59 64 66 2 61 -- 47 37 41 43 47 54 59 64 --3 60 55 47 37 40 42 47 -- 59 64 66 4 61 55 47 -- 40 43 47 54 60 64 66 5 61 55 47 37 41 44 -- 55 60 -- 67 6 61 55 47 37 41 44 47 55 60 64 --7 60 55 -- 37 42 44 48 55 -- 64 --8 60 55 46 37 -- -- 49 55 59 64 71 9 60 -- 46 37 42 43 49 55 60 64 --
10 58 55 46 37 43 44 49 -- 60 64 71 11 58 55 46 -- 43 43 49 54 60 64 71 12 -- 55 45 35 41 43 -- 55 61 -- 72 13 57 54 45 35 42 43 so 55 61 64 72 14 57 53 -- 35 43 44 50 55 -- 64 72 15 57 53 45 35 -- -- 52 55 61 65 72 16 58 -- 45 36 43 43 52 55 60 65 --17 58 49 45 36 43 44 52 -- 60 65 70 18 57 49 45 -- 43 44 52 56 60 65 72 19 -- 49 46 36 43 44 -- 56 60 -- 72 20 57 48 46 36 43 46 52 56 60 65 72 21 57 48 -- 36 43 45 52 58 -- 65 72 22 57 48 45 36 43 -- 53 58 60 65 72 23 57 -- -- 36 43 43 53 58 60 65 --24 57 47 45 36 43 43 53 60 66 71 25 57 47 44 36 43 44 53 58 59 66 71 26 -- 47 43 37 43 44 -- 58 60 -- 70 27 56 46 43 37 42 45 53 58 60 66 70 28 56 46 -- 37 42 44 53 58 -- 66 69 29 56 47 41 36 -- -- 53 58 60 66 69 30 56 47 41 38 ------ 46 53 59 59 66 --31 54 ------ 40 38 ------ 46 ------ -- ------ 66 69
Avg 53 51 45 "?.., 4'2 44 51 56 60 65 70 .J-
Max 61 55 47 40 43 46 53 59 61 66 72 Min 54 46 40 35 37 42 46 53 59 64 66
LA.! \.Jl
Da_y 1 2 3 4 5 6 7 8 9
10 11 12 13 14 15 16 17 18 19 20 21 22 23 24 25 26 27 28 29 30 31
Avg Max Min
Table 16.--Daily water temperatures of Columbia River at Cathlamet, Wash., September 1940 to July 1942
[Once-daily observations--mostly afternoon readings at river mile 39.5]
September Qetober November December January February March April May June July August 64 56 -- 42 43 43 51 59 -- 66 70 64 55 46 41 -- -- 51 59 -- 66 70 -- -- -- 40 43 43 53 58 60 67 --64 54 46 40 43 44 53 58 60 -- 70 63 53 46 40 43 -- 53 59 -- 68 69 -- 53 46 39 -- 45 -- -- 61 -- 70 62 53 46 39 43 45 -- -- 62 69 72 63 51 -- 39 43 46 -- 59 -- 70 ---- 51 45 39 -- -- -- 59 62 71 70 62 -- 45 39 43 47 -- -- 64 70 --61 50 44 39 43 47 54 -- 64 70 70 61 49 43 -- 44 47 -- 59 64 70 71 -- 48 41 -- 43 48 -- 59 64 -- 71 61 48 41 39 43 -- 54 59 -- 72 71 61 47 -- 39 43 -- 54 59 -- 72 71 61 46 -- 39 -- -- 54 59 64 73 --61 -- -- 39 43 48 53 59 64 74 --61 45 -- 40 43 48 53 -- 64 75 71 62 44 -- -- 43 -- 54 57 64 75 72
69 -- 44 37 42 43 48 -- 58 64 -- 71 66 62 44 38 42 43 -- 55 59 64 75 ---- 62 43 -- -- 43 49 56 59 -- 75 --66 62 42 40 42 -- -- 56 59 64 74 72 65 61 43 40 42 43 -- -- 60 64 74 --67 -- 42 -- 42 43 49 57 -- 65 -- 72 65 59 -- 42 -- 43 50 -- -- 65 73 71 65 -- 42 42 -- 43 so -- 60 65 -- 70 64 58 42 41 43 44 so -- 61 65 72 ---- 57 43 -- 43 -- 51 -- 61 -- 72 --64 57 44 42 43 ------ -- 58 -- 65 72 69
------ 56 ------ 42 43 ------ 51 ------ 61 ------ 71 --61 47 43 41 43 47 54 59 64 71 71 64 56 46 43 44 51 58 61 65 75 72 56 42 37 39 43 43 51 57 60 66 69

w 0\
Table 16.--Daily water temperatures of Columbia River at Cathlamet, Wash., September 1940 to July 1942--Continued
Day September Or-·tober November December January February March April May June July 1 68 63 -- 46 39 -- 42 49 51 57 64 2 67 63 -- 46 38 40 42 49 51 57 65 3 66 -- 54 46 37 41 41 49 so -- 66 4 66 62 54 46 -- 41 42 so 52 58 --5 66 -- 54 46 37 -- -- -- 52 59 67 6 66 61 54 46 36 -- 42 51 53 59 67 7 -- 61 54 -- 34 -- -- 51 54 -- 67 8 66 60 53 46 34 42 43 51 -- 59 --9 -- 59 -- 46 33 42 44 51 54 59 67
10 -- 58 52 -- 33 -- 44 53 -- 60 67 11 -- 58 52 45 -- 42 44 53 56 59 67 12 -- -- 52 45 34 -- 44 -- 55 59 66 13 -- 57 52 45 35 43 45 53 57 60 --14 -- 57 52 -- 35 43 45 53 56 59 66 15 -- 57 51 44 35 -- -- -- -- 59 65 16 64 57 -- 44 35 43 45 53 56 59 65 17 64 57 -- -- -- 42 46 53 -- 58 65 18 63 57 so 45 -- 42 46 53 56 -- 65 19 63 -- 49 46 36 -- 46 53 56 59 66 20 63 57 -- 46 36 -- 47 54 57 59 66 21 -- 57 48 -- 36 41 45 53 57 -- 66 22 63 -- 47 45 36 41 -- 53 57 60 67 23 63 57 -- 45 36 41 46 53 58 -- 68 24 63 56 46 45 36 41 46 53 -- 60 68 25 63 56 46 44 -- -- 46 53 58 60 69 26 63 56 46 44 -- 41 46 -- 58 60 --27 63 56 46 42 38 41 46 52 57 60 69 28 -- 55 46 -- 39 41 46 52 58 61 69 29 63 -- 46 41 39 -- -- 52 58 62 69 30 63 55 -- 41 39 ------ 48 51 57 62 69 31 ------ 55 ------ 40 39 ------ 48 ------ 57 ------ 69
Avg 04 so ~J 4~ J0 42
I 4~ ~2 ,~ I ~9 67
Max 68 63 54 46 39 43 48 54 ~~ - -
62 69 Min 63 55 46 40 33 40 41 49 57 64
-- --
LA.l ---..:]
Day 1 2 3 4 5 6 7 8 9
10 11 12 13 14 15 16 17 18 19 20 21 22 23 24 25 26 27 28 29 30 31
Avg Max Min --·--
Table 17.--Daily water temperatures of Columbia River at Skamokawa, Wash., November 1940 to July 1942
[Once-daily observations--mixed morning and afternoon readings at river mile 33]
November December January February March April May June July August September 45 41 44 44 53 59 62 65 -- 66 45 40 43 44 53 57 59 64 67 66 46 40 43 44 53 55 59 65 -- 64 46 40 43 44 53 -- 63 65 68 65 47 40 43 44 53 56 62 68 68 66 46 40 43 46 53 57 60 67 71 64
52 46 40 43 45 53 58 60 69 66 --52 -- 40 44 46 53 58 60 68 67 64 51 43 41 43 46 53 60 61 66 68 64 48 44 40 44 47 54 60 64 67 -- 64 49 42 40 43 49 53 60 64 66 65 63 46 42 -- 43 48 53 59 63 68 66 64 46 39 40 43 48 -- 58 63 -- 69 63 47 40 41 43 47 52 58 63 71 66 --46 40 40 42 47 53 58 63 70 67 64 46 39 39 42 47 52 58 63 70 66 63 45 39 41 42 48 52 58 63 70 -- 63 42 40 41 43 47 52 58 63 67 69 63 43 39 42 43 48 53 57 63 68 70 62 43 40 42 42 48 54 58 62 -- 69 61 43 40 42 42 49 54 59 64 72 69 --44 40 40 42 48 53 60 63 72 69 61 41 40 41 42 49 53 60 64 72 68 59 43 40 41 43 48 55 60 62 70 71 57 43 41 41 43 49 57 60 64 70 68 61 43 42 -- 43 49 57 60 63 72 68 61 43 42 42 43 52 57 60 63 -- 69 61 43 42 42 43 51 59 60 64 69 68 --45 42 43 -- 53 60 60 63 71 68 62 44 41 43 ------ 52 58 60 64 71 66 62
------ 42 43 ------ 53 ------ 60 ------ 64 66 ------45 42 41 43 48 54 59 62 68 68 63 52 47 43 44 53 60 60 64 72 71 66 41 39 39 42 44 52 55 59 64 65 57
--- - - _L__ __
VJ CD
Table 17.--Daily water temperatures of Columbia River at Skamokawa, Wash., November 1940 to July 1942--Con.
Day October November December January February March April May June July 1 61 58 47 37 -- 40 48 so 55 66 2 62 -- 47 36 42 42 49 49 59 66 3 61 55 45 37 42 41 49 -- 58 66 .a 61 54 47 -- 42 42 52 51 60 66 5 -- 54 46 36 43 43 -- 54 60 --6 59 53 49 36 43 43 51 54 59 67 7 58 53 -- 33 44 46 so 54 -- 66 8 59 54 45 35 -- -- so 54 59 67 9 56 -- 46 35 43 44 52 54 57 68
10 59 53 46 34 43 45 52 -- 59 68 11 55 52 44 -- 44 44 54 54 59 68 12 -- 52 43 34 42 43 -- 54 60 --13 58 52 43 36 41 44 52 56 58 66 14 55 52 -- 37 43 46 53 55 -- 66 15 57 so 45 36 -- -- 54 56 59 65 16 56 -- 44 36 43 46 -- 55 59 65 17 55 49 43 37 43 45 -- -- 59 64 18 55 48 45 -- 42 45 -- 56 59 66 19 -- 48 46 36 41 44 54 47 59 --20 52 48 46 36 42 49 55 59 59 68 21 59 46 -- 39 40 45 54 58 -- 67 22 56 46 45 37 -- -- 52 57 61 66 23 55 -- 44 38 41 44 53 59 60 68 24 56 45 44 40 41 45 51 -- 59 66 25 55 46 44 -- 41 46 51 58 59 68 26 -- 46 42 41 40 48 -- 58 61 --27 55 45 40 40 41 46 51 57 61 67 28 55 46 -- 39 42 46 52 58 -- 69 29 56 46 40 40 -- -- 52 57 63 67 30 54 -- 38 40 ------ 48 so 59 64 68 31 54 ------ 38 40 ------ 48 ------ -- ------ 68
:\vg 57 so 11 37 12 15 5:2 55 59 6'7 Max 62 58 49 41 44 49 55 59 64 69 Min 52 45 38 34 40 40 48 49 55 64
w \.0
Day_ 1 2 3 4 5 6 7 8 9
10 11 12 13 14 15 16 17 18 19 20 21 22 23 24 25 26 27 28 29 30 31
Avg Max Min
Table 18.--Daily water temperatures of Columbia River at Altoona, Wash., September 1940 to June 1942
[Once-daily observations--mixed morning and afternoon readings at river mile 24]
September October November December January February March April May June July August 64 55 45 43 44 44 53 59 61 65 72 63 55 46 42 -- 44 53 59 61 66 70 63 -- 46 41 44 45 54 59 61 66 69 63 54 46 41 44 45 54 -- 61 66 --63 54 46 41 44 46 -- 59 61 -- 69 63 53 46 41 44 46 54 59 61 67 71 63 53 46 41 44 46 54 59 61 68 70 63 52 46 41 44 46 54 59 62 69 70 62 51 46 42 44 46 54 59 62 70 70 61 so 46 42 45 46 54 59 63 71 70 61 so -- 41 45 47 54 59 64 -- 70 61 49 -- 41 45 48 54 60 64 -- 70 61 48 43 41 45 48 54 60 64 72 70 61 48 42 41 44 49 54 60 -- 72 71 61 48 42 41 44 49 54 60 64 72 70 61 48 41 40 43 49 54 59 64 73 70 61 47 41 40 43 49 54 59 64 73 70 61 46 41 40 43 49 54 58 64 73 70
66 61 46 41 40 43 49 54 58 64 73 71 66 61 45 41 41 43 49 54 59 64 -- 71 68 61 45 41 42 44 49 55 59 64 73 71 68 59 45 40 42 44 49 55 59 64 73 71 66 60 45 40 43 44 49 55 59 64 73 --65 60 44 41 43 44 49 56 60 64 73 --66 60 44 41 43 -- 49 57 60 64 73 70 66 59 44 42 43 44 so 58 61 65 73 70 66 59 44 43 43 44 51 -- 61 65 72 70 66 58 44 43 43 44 51 58 61 65 72 70 65 57 43 43 43 -- 53 59 61 -- 72 70 65 57 43 43 43 ------ 54 59 61 65 72 69
------ 57 ------ 43 43 ------ 54 ------ 61 ------ 72 69 61 48 43 42 44 48 55 60 63 71 70 64 55 46 43 45 54 59 61 65 73 72 57 43 40 40 43 44 53 58 61 65 69
+=-0
Table 18.--Daily water ~emperatures of Columbia River at Altoona, Wash., September 1940 to June 1942--Con,
Day September October November December January February March April May June 1 69 61 56 46 40 40 43 47 54 59 2 68 62 56 46 40 40 43 48 54 59 3 -- 61 -- 46 39 41 43 48 54 59 4 67 61 55 -- 37 41 43 49 54 60 5 66 -- 54 46 37 -- 43 -- 54 60 6 66 61 54 46 -- 41 43 49 54 60 7 66 61 54 46 36 41 43 49 -- 60 8 66 60 54 46 36 42 43 so -- 60 9 66 60 54 -- 36 -- 43 51 -- 60
10 66 59 54 46 -- 42 43 -- 54 60 11 66 59 54 46 36 43 43 -- -- --12 65 -- 54 46 36 43 44 51 54 61 13 64 59 54 46 36 43 44 51 54 61 14 -- 59 54 46 36 44 44 52 56 61 15 64 59 53 45 -- 44 45 52 56 61 16 -- 59 52 45 36 44 45 53 56 61 17 63 58 51 45 36 44 46 53 -- --18 -- 58 51 45 -- 44 46 54 -- 61 19 61 -- -- 45 36 44 46 54 56 61 20 61 58 50 45 36 44 46 -- 56 62 21 61 -- -- 45 36 44 46 54 56 62 22 61 57 49 45 36 44 46 54 56 62 23 -- 57 49 45 36 44 -- 54 -- 62 24 61 57 48 -- -- 44 46 54 -- 62 25 61 57 47 -- 37 44 46 54 57 62 26 61 56 46 44 38 43 46 54 58 62 27 61 56 -- 44 -- 43 46 54 58 62 28 61 56 46 43 38 43 46 54 59 62 29 61 56 46 43 38 -- 47 54 59 62 30 61 56 46 43 39 ------ 47 54 59 62 31 ------ 56 ------ 42 39 ------ 47 ------ 59 ---------
Avg 64 58
52 L :~ l / '
I 4.5
I 4S
I S2
I So 61 Jf
Max 69 62 56 46 40 44 47 54 59 62 Min 61 56 46 42 36 40 43 47 54 59
- -
.pI-'
Table 19.--Daily water temperatures of Columbia River at Astoria (Tongue Point), Oreg., November 1940 to June 1942
[Once-daily observations--mostly afternoon readings at river mile 18.2]
Day November December January February March April May June July August September 1 55 45 41 45 46 54 58 61 68 68 64 2 54 45 40 45 46 53 56 61 66 66 66 3 54 46 39 44 46 54 57 62 67 67 64 4 53 46 39 45 46 54 57 62 68 68 64 5 52 46 41 46 46 53 56 61 68 70 65 6 53 46 42 46 48 52 57 61 69 69 65 7 52 46 43 46 48 54 57 61 69 68 64 8 so 46 43 46 48 54 58 61 69 68 64 9 so 45 43 45 48 53 59 61 68 68 64
10 48 44 43 46 49 54 61 63 68 66 64 11 48 44 43 46 49 54 61 64 68 68 64 12 48 43 43 46 51 54 60 66 68 69 64 13 47 43 43 45 49 54 59 64 -- 68 63 14 47 40 43 45 49 54 58 63 75 68 --15 47 41 41 44 so 52 59 -- 73 68 64 16 47 41 42 44 so 52 58 64 72 68 64 17 47 43 43 45 so 54 57 64 72 -- 63 18 46 43 43 45 49 54 57 63 73 69 63 19 46 43 40 45 so 54 57 62 72 70 62 20 45 43 41 45 49 55 59 63 -- 68 61 21 44 43 41 45 49 55 61 63 72 66 --22 43 42 41 45 49 56 63 63 70 68 63 23 43 42 43 45 49 56 64 64 72 68 63 24 45 42 44 46 so 56 60 64 68 -- 63 25 44 42 45 46 so 57 61 64 70 66 62 26 43 41 43 45 52 58 59 64 68 67 62 27 44 42 44 46 52 57 59 65 -- 68 62 28 46 43 45 46 53 58 60 66 69 68 --29 46 43 44 -- 54 59 63 -- 70 68 61 30 44 42 43 ------ 54 58 61 66 70 66 61 31 ------ 41 45 ------ 54 ------ 61 ------ 70 -- ------
Avg 48 43 42 45 49 55 59 63 70 68 63 Max 55 46 45 46 54 59 64 66 75 70 66 Min 43 40 39 44 46 52 56 61 66 66 61
j j ---
+:I\)
Table 19.--Daily water temperatures of Columbla River at Astoria (Tongue Point), Oreg., November 1940 to June 1942--Continued
Da~ October November December January February March April May June 1 61 54 48 36 43 -- 48 so 55 2 61 54 49 36 43 45 48 so 57 3 61 54 46 37 43 43 so 52 57 4 61 54 46 36 42 43 49 51 57 5 60 54 46 36 41 43 51 so 59 6 60 54 46 36 43 43 so 52 59 7 59 54 -- 36 43 44 so 53 59 8 59 54 46 36 43 45 49 54 58 9 59 54 46 36 43 46 so 53 57
10 59 54 46 36 44 46 52 -- 57 11 58 54 46 -- 44 44 52 52 58 12 -- 52 45 35 43 43 -- 54 59 13 57 54 45 36 43 43 52 54 60 14 58 53 -- 36 43 43 52 55 --15 58 52 46 36 -- -- 52 56 58 16 58 -- 45 37 43 43 52 56 57 17 58 so 44 38 43 45 53 -- 58 18 57 49 46 -- 43 45 51 56 57 19 -- 49 45 37 43 45 -- 57 57 20 58 48 45 37 43 45 53 57 58 21 58 46 -- 38 43 46 53 58 --22 57 46 46 38 -- -- 52 57 59 23 57 -- 45 38 43 46 51 56 60 24 56 48 45 39 43 46 52 -- 59 25 56 4 7 44 -- 43 44 52 58 59 26 -- 46 42 42 43 45 -- 57 59 27 55 4 6 41 41 4 3 4 5 51 57 59 ~ 55 46 -- 41 43 46 50 57 --29 55 48 41 40 -- -- 52 57 61 30 54 -- 41 41 ------ 48 52 58 64 31 54 ------ 38 41 ------ 48 ------ -- ------
Avg I 58 I 51 I 45 l 38 I 43 I 45 I 51 I 55 I 53 Max 61 54 49 42 44 48 53 58 64 Min 54 46 38 35 41 43 48 50 55
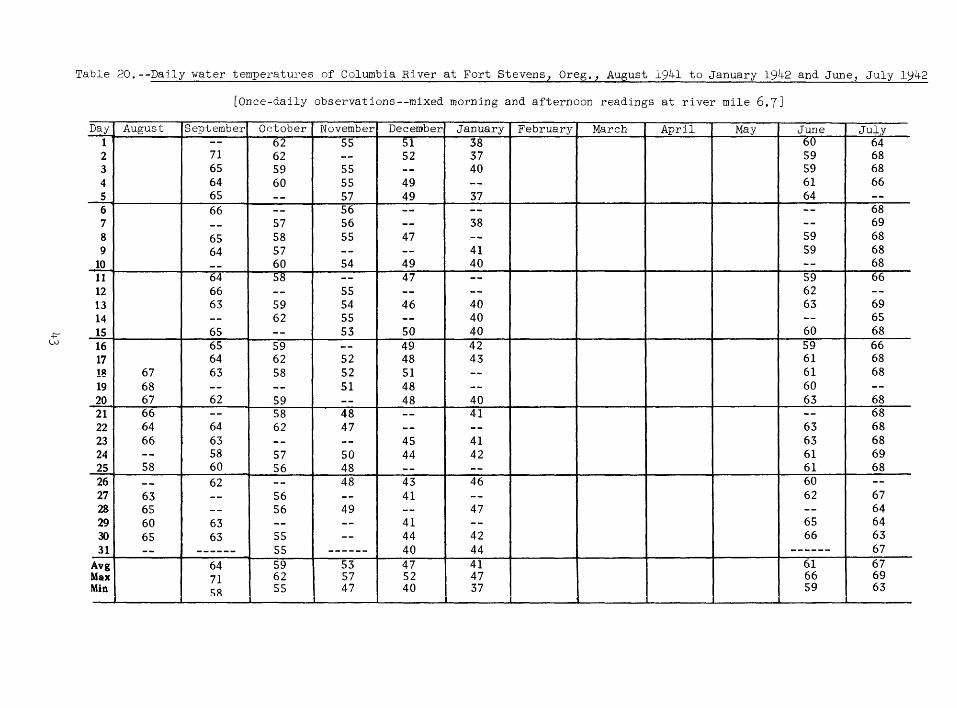
+:w
Table 20.--Daily water temperatures of Columbia River at Fort Stevens, Oreg., August 1941 to January 1942 and June, July lY42
[Once-daily observations--mixed morning and afternoon readings at river mile 6.7]
Day August September October November December January February March April May June July 1 -- 62 55 51 38 60 64 2 71 62 -- 52 37 59 68 3 65 59 55 -- 40 59 68 4 64 60 55 49 -- 61 66 5 65 -- 57 49 37 64 --6 66 -- 56 -- -- -- 68 7 -- 57 56 -- 38 -- 69 8 65 58 55 47 -- 59 68 9 64 57 -- -- 41 59 68
10 -- 60 54 49 40 -- 68 11 64 58 -- 47 -- 59 66 12 66 -- 55 -- -- 62 --13 63 59 54 46 40 63 69 14 -- 62 55 -- 40 -- 65 15 65 -- 53 so 40 60 68 16 65 59 -- 49 42 59 66 17 64 62 52 48 43 61 68 18 67 63 58 52 51 -- 61 68 19 68 -- -- 51 48 -- 60 --20 67 62 59 -- 48 40 63 68 21 66 -- 58 48 -- 41 -- 68 22 64 64 62 47 -- -- 63 68 23 66 63 -- -- 45 41 63 68 24 -- 58 57 50 44 42 61 69 25 58 60 56 48 -- -- 61 68 26 -- 62 -- 48 43 46 60 --27 63 -- 56 -- 41 -- 62 67 28 65 -- 56 49 -- 47 -- 64 29 60 63 -- -- 41 -- 65 64 30 65 63 55 -- 44 42 66 63 31 -- ------ 55 ------ 40 44 ------ 67
Avg 64 59 53 47 41 61 67 Max 71 62 57 52 47 66 69 Min SR 55 47 40 37 59 63
~~-~---~---
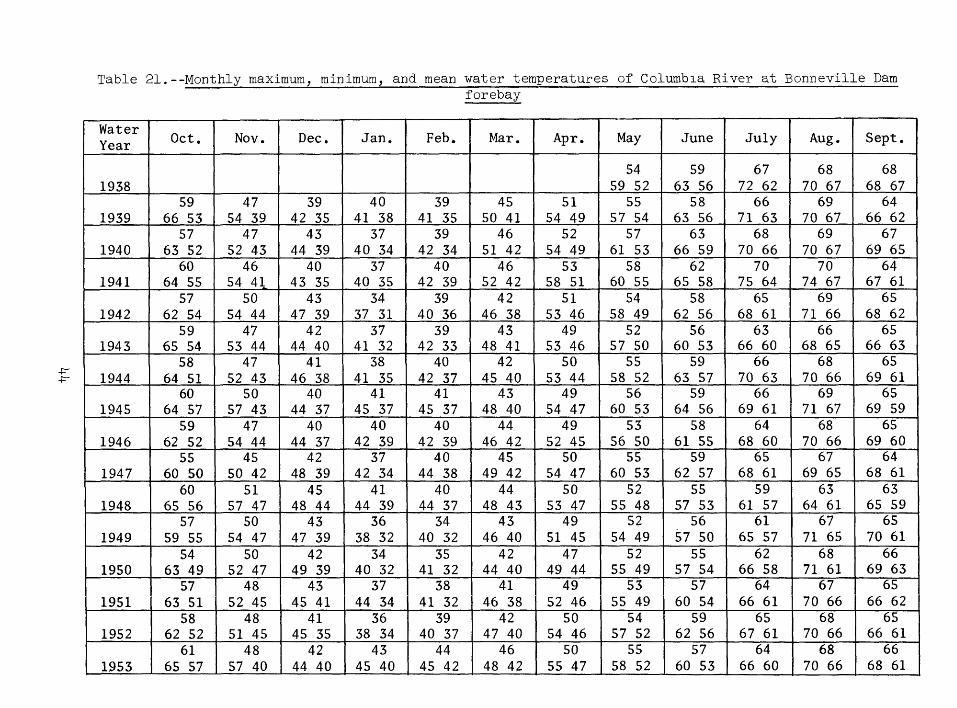
+ +
Table 21.--Monthly maximum, minimum, and mean water temperatures of Columbla River at Bonneville Dam fore bay
Water Oct. Nov. Dec. Jan. Feb. Mar. Apr. May June July Aug. Sept. Year
54 59 67 68 68 1938 59 52 63 56 72 62 70 67 68 67
59 47 39 40 39 45 51 55 58 66 69 64 1939 66 53 54 39 42 35 41 38 41 35 so 41 54 49 57 54 63 56 71 63 70 67 66 62
57 47 43 37 39 46 52 57 63 68 69 67 1940 63 52 52 43 44 39 40 34 42 34 51 42 54 49 61 53 66 59 70 66 70 67 69 65
60 46 40 37 40 46 53 58 62 70 70 64 1941 64 55 54 41 43 35 40 35 42 39 52 42 58 51 60 55 65 58 75 64 74 67 67 61
57 so 43 34 39 42 51 54 58 65 69 65 1942 62 54 54 44 47 39 37 31 40 36 46 38 53 46 58 49 62 56 68 61 71 66 68 62
59 47 42 37 39 43 49 52 56 63 66 65 1943 65 54 53 44 44 40 41 32 42 33 48 41 53 46 57 so 60 53 66 60 68 65 66 63
58 47 41 38 40 42 so 55 59 66 68 65 1944 64 51 52 43 46 38 41 35 42 37 45 40 53 44 58 52 63 57 70 63 70 66 69 61
60 so 40 41 41 43 49 56 59 66 69 65 1945 64 57 57 43 44 37 45 37 45 37 48 40 54 47 60 53 64 56 69 61 71 67 69 59
59 47 40 40 40 44 49 53 58 64 68 65 1946 62 52 54 44 44 37 42 39 42 39 46 42 52 45 56 so 61 55 68 60 70 66 69 60
55 45 42 37 40 45 so 55 59 65 67 64 1947 60 50 so 42 48 39 42 34 44 38 49 42 54 47 60 53 62 57 68 61 69 65 68 61 I
60 51 45 41 40 44 so 52 55 59 63 63 1948 65 56 57 47 48 44 44 39 44 37 48 43 53 47 55 48 57 53 61 57 64 61 65 59
57 so 43 36 34 43 49 52 56 61 67 65 1949 59 55 54 47 47 39 38 32 40 32 46 40 51 45 54 49 57 so 65 57 71 65 70 61
54 so 42 34 35 42 47 52 55 62 68 66 1950 63 49 52 47 49 39 40 32 41 32 44 40 49 44 55 49 57 54 66 58 71 61 69 63
57 48 43 37 38 41 49 53 57 64 67 65 1951 63 51 52 45 45 41 44 34 41 32 46 38 52 46 55 49 60 54 66 61 70 66 66 62
58 48 41 36 39 42 so 54 59 65 68 65 1952 62 52 51 45 45 35 38 34 40 37 47 40 54 46 57 52 62 56 67 61 70 66 66 61
61 48 42 43 44 46 so 55 57 64 68 66 1.953 65 57 57 40 44 40 45 40 45 42 48 42 55 4?_._5LSJ _ 60 53 66 60 70 66 68 61

5t$ 52 46 40 40 44 49 54 56 61 64 63 1954 61 56 56 49 49 43 43 36 44 37 45 42 52 44 56 50 59 54 64 58 66 63 65 60
56 51 42 39 39 40 46 52 ')( 61 66 65 1955 6o 52 55 46 46 39 41 38 41 39 42 37 47 43 56 49 59 54 64 57 68 64 69 60
57 45 40 39 34 42 4ts 53 57 64 6t$ 66 1956 6o 53 53 39 43 36 40 35 36 32 46 37 52 46 57 50 60 55 68 55 71 64 68 64
5t$ 4t$ 42 37 36 44 50 55 60 66 68 67 1957 63 52 52 42 44 40 40 32 36 32 47 40 54 47 58 52 63 58 68 62 69 67 69 65
59 51 44 41 45 45 50 57 63 69 72 66 1958 65 55 56 46 47 42 43 40 47 43 48 43 52 48 6o 52 68 6o 74 64 73 70 70 62
s bO 50 43 40 41 44 49 53 5t$ 64 67 64 .Ul
Cl 1959 63 55 55 42 45 41 44 38 42 39 45 41 52 46 56 50 6o 52 68 6o 68 65 66 60 0 + < 1?:1 Vl ::0 ~ E::: 1?:1 ~
58 48 43 37 40 41 4(:5 54 59 66 68 65 1960 6o 55 55 44 46 41 41 34 41 37 48 36 51 46 58 52 63 57 69 63 70 64 67 64!
60 51 42 41 43 45 50 55 60 67 71 65 ..., '"CJ ::0 S2 .-1 z 0
1961 66 56 56 46 48 40 42 38 44 41 48 42 52 48 58 52 63 55 70 61 72 69 70 6o 58 48 42 39 40 42 50 53 59 65 69 66
1962 61 52 53 44 44 40 44 34 42 37 46 38 53 46 56 50 63 55 70 62 71 66 68 64 0 "i "i n 1?:1
59 53 46 39 40 45 49 56 61 65 69 68 1963 64 56 56 47 48 44 44 34 43 35 46 43 51 47 6o 50 63 58 67 62 70 66 70 66
'"' "' co
0
"" co co
0 ... _,
62 52 43 42 42 44 49 54 57 64 66 63 1964 67 56 56 48 46 41 44 40 44 40 46 42 51 46 57 50 6o 55 67 6o 69 63 64 62
58 49 41 39 41 43 4Y 54 5Y 65 70 64 1965 63 50 55 43 47 35 42 37 43 40 44 41 53 44 57 50 61 57 69 61 72 65 66 62
60 53 45 41 41 44 51 56 5Y 64 67 66 1966 62 58 58 48 48 42 42 39 42 3)1 48 41 53 48 58 53 61 56 66 58 70 66 68 65