Water Supply Master Plan - Phase 2
362
City of Venice 200 N. Warfield Ave. Venice, FL 34285 Water Supply Master Plan - Phase 2 FINAL AUGUST 2013 Report Prepared By: ARCADIS-US, Inc. 14025 Riveredge Dr Tampa, FL 813-248-6900 5710010
Transcript of Water Supply Master Plan - Phase 2

City of Venice 200 N. Warfield Ave. ó Venice, FL 34285
Water Supply Master Plan - Phase 2 FINAL AUGUST 2013
Report Prepared By:
ARCADIS-US, Inc. 14025 Riveredge Dr Tampa, FL 813-248-6900
5710010

Table of Contents
City of Venice Water Supply Master Plan - Phase 2 5710010
i
Contents
1. Introduction 1-1
1.1. Project Objectives ......................................................................................................... 1-1 1.2. Report Organization ...................................................................................................... 1-2
2. Existing Water System 2-1
2.1. Introduction ................................................................................................................... 2-1 2.2. System Description ....................................................................................................... 2-1
2.2.1. Water Supply ................................................................................................. 2-1 2.2.1.1. Production Wells ................................................................................. 2-1 2.2.1.2. Intracoastal Wellfield ........................................................................... 2-3 2.2.1.3. Wellfield Park ...................................................................................... 2-3 2.2.1.4. Eastern Wellfield ................................................................................. 2-4 2.2.1.5. Irrigation Wells .................................................................................... 2-4
2.2.2. Wellfield Management, Monitoring, and Mitigation ....................................... 2-5 2.2.2.1. Wellfield Water Quality Monitoring ...................................................... 2-5 2.2.2.2. Wellfield Rotation ................................................................................ 2-6
2.2.3. Water Treatment Facility ............................................................................... 2-7 2.2.3.1. Treatment Process .............................................................................. 2-7 2.2.3.2. Treatment Capacity ............................................................................. 2-9 2.2.3.3. Pretreatment ....................................................................................... 2-9 2.2.3.4. Reverse Osmosis Treatment .............................................................. 2-9 2.2.3.5. Post Treatment ................................................................................. 2-11 2.2.3.6. Concentrate Treatment and Disposal ............................................... 2-11 2.2.3.7. Water Quality .................................................................................... 2-12 2.2.3.8. Security ............................................................................................. 2-12
2.2.4. Distribution System ..................................................................................... 2-13 2.2.4.1. Storage ............................................................................................. 2-13 2.2.4.2. Distribution Pumping Capacity .......................................................... 2-14 2.2.4.3. Distribution Piping ............................................................................. 2-15 2.2.4.4. Emergency Power ............................................................................. 2-17 2.2.4.5. Existing Interconnections .................................................................. 2-17
2.3. Existing Water Demands ............................................................................................ 2-17 2.3.1. Background ................................................................................................. 2-18 2.3.2. Historic and Current Water Treatment Plant Production ............................. 2-18 2.3.3. Historic Per Capita Demand ........................................................................ 2-19 2.3.4. Customer Billing Data and Demand Allocation ........................................... 2-22 2.3.5. Large Users ................................................................................................. 2-23
2.3.5.1. Eliminated or Reduced Demands ..................................................... 2-24 2.3.5.2. Venice Regional Medical Center ...................................................... 2-25 2.3.5.3. Other Large Uses .............................................................................. 2-25
2.3.6. Demand Patterns and Diurnal Demand Multiplier ....................................... 2-25 2.3.6.1. Residential/Commercial .................................................................... 2-25 2.3.6.2. Irrigation ............................................................................................ 2-26
3. Regulatory Assessment 3-1
3.1. Introduction ................................................................................................................... 3-1 3.2. Regulatory Organizational Structure ............................................................................. 3-1

Table of Contents
City of Venice Water Supply Master Plan - Phase 2 5710010
ii
3.3. Regulations ................................................................................................................... 3-2 3.3.1. Source Water Regulations ............................................................................ 3-4
3.3.1.1. Source Water Assessment and Protection Programs ........................ 3-5 3.3.1.2. Water Use Permit ................................................................................ 3-5 3.3.1.3. Water Conservation Legislation .......................................................... 3-6 3.3.1.4. Wellhead Protection Rule ................................................................... 3-7
3.3.2. Water Quality Regulations – Water Treatment and Distribution System ...... 3-8 3.3.2.1. Inorganic Chemicals ........................................................................... 3-9 3.3.2.2. Disinfectant Residuals and Disinfection By-products ....................... 3-11 3.3.2.3. Volatile Organic Chemicals ............................................................... 3-13 3.3.2.4. Synthetic Organic Chemicals ............................................................ 3-14 3.3.2.5. Microbial Contaminants .................................................................... 3-15 3.3.2.6. Radionuclides ................................................................................... 3-18 3.3.2.7. Secondary Drinking Water Standards .............................................. 3-19 3.3.2.8. Lead and Copper .............................................................................. 3-20 3.3.2.9. Consumer Confidence Reports Rule ................................................ 3-21
3.3.3. Other Regulations ....................................................................................... 3-21 3.3.3.1. Disposal Regulations ........................................................................ 3-21 3.3.3.2. Backflow Prevention/Cross-Connection Control Program ................ 3-23 3.3.3.3. Public Notification Rule ..................................................................... 3-23 3.3.3.4. Interconnections ................................................................................ 3-24
3.4. Emerging Issues ......................................................................................................... 3-24 3.4.1. Unregulated Contaminants Monitoring Rule ............................................... 3-24
Microbial ............................................................................................................................... 3-25 3.4.2. Methyl Tertiary-Butyl Ether .......................................................................... 3-26 3.4.3. Perchlorate .................................................................................................. 3-26 3.4.4. Endocrine Disrupting Compounds and Pharmaceuticals and Personal Care
Products ...................................................................................................... 3-27 3.4.5. Algal Toxins ................................................................................................. 3-27 3.4.6. N-nitrosodimethylamine ............................................................................... 3-27 3.4.7. Chromium (VI) ............................................................................................. 3-28 3.4.8. Groups of Contaminants ............................................................................. 3-28 3.4.9. SDWA Six-Year Review .............................................................................. 3-28
4. Population and Demand Projections 4-1
4.1. Introduction ................................................................................................................... 4-1 4.2. Population Projections .................................................................................................. 4-1
4.2.1. City Population Projections ........................................................................... 4-1 4.2.2. Potential Annexation Population Projections ................................................ 4-2 4.2.3. Total Population Projections ......................................................................... 4-5
4.3. Demand Projections ...................................................................................................... 4-5 4.3.1. Potable Water Level of Service ..................................................................... 4-5 4.3.2. Projected Water Demands ............................................................................ 4-6
5. Potential Sources 5-1
5.1. Introduction ................................................................................................................... 5-1 5.1.1. Southern Water Use Caution Area ................................................................ 5-2
5.2. District Hydrogeology .................................................................................................... 5-4 5.2.1. Regional Hydrogeologic Conditions .............................................................. 5-5 5.2.2. Local Hydrogeologic Conditions .................................................................... 5-7
5.2.2.1. Surficial Aquifer System ...................................................................... 5-7

Table of Contents
City of Venice Water Supply Master Plan - Phase 2 5710010
iii
5.2.2.2. Intermediate Aquifer System .............................................................. 5-7 5.2.2.3. Floridan Aquifer System...................................................................... 5-9
5.3. Future Well Sites and Potential Supply ........................................................................ 5-9 5.4. Regional Water Supply Plan – Southern Planning Region ......................................... 5-11
5.4.1. Water Sources within the Southern Planning Region ................................. 5-11 5.4.1.1. Brackish Groundwater Desalination ................................................. 5-11 5.4.1.2. Seawater Desalination ...................................................................... 5-12 5.4.1.3. Reuse System Expansion ................................................................. 5-13 5.4.1.4. Conservation ..................................................................................... 5-14
6. Interconnections 6-1
6.1. Existing Interconnections .............................................................................................. 6-1 6.1.1. Terms of Agreement ...................................................................................... 6-1 6.1.2. Historical Interconnect Utilization .................................................................. 6-1 6.1.3. Disinfectant Considerations........................................................................... 6-3
6.2. Future Interconnection Needs....................................................................................... 6-3 6.2.1. Potential Interconnection Entities .................................................................. 6-3
6.2.1.1. Sarasota County ................................................................................. 6-4 6.2.1.2. Peace River/Manasota Regional Water Supply Authority .................. 6-5
6.3. Potential Blending Effects ............................................................................................. 6-8 6.3.1. RTW Model ................................................................................................... 6-8 6.3.2. Possible Corrosion Control Blending Issues ................................................. 6-9 6.3.3. Possible Disinfection Blending Issues ......................................................... 6-10
7. Water Supply and Production Capacity Assessment and Recommendations 7-1
7.1. Introduction ................................................................................................................... 7-1 7.2. Alternative 1 - Increased Recovery – Add Second Stage RO Skids ............................ 7-1 7.3. Alternative 2 - Increased Recovery – Install Higher Quality Supply Wells ................... 7-3 7.4. Alternative 3 - Increased Capacity – Single Stage RO Plant Expansion ...................... 7-5 7.5. Concentrate Management Considerations ................................................................... 7-6
7.5.1. Concentrate Quality ....................................................................................... 7-7 7.5.2. Concentrate Quantity .................................................................................... 7-9
7.6. Alternative 4 - Interconnections for Long-Term Water Supply .................................... 7-10 7.6.1. Breakpoint Chlorination at Interconnection ................................................. 7-12 7.6.2. Conversion to Chloramines Disinfection at the Venice RO WTP................ 7-13 7.6.3. Estimated Interconnection Costs ................................................................ 7-15
7.7. Other Water Supply Options ....................................................................................... 7-15 7.7.1. Brackish Groundwater Desalination ............................................................ 7-16
7.7.1.1. Alternative 5: New 7.0 mgd Water Treatment Plant ......................... 7-16 7.7.1.2. Alternative 6: New 2.5 mgd Water Treatment Plant ......................... 7-16
7.7.2. Aquifer Storage and Recovery .................................................................... 7-16 7.7.3. Desalination ................................................................................................. 7-17
7.8. Recommended Water Supply Improvements ............................................................. 7-17 7.9. Summary of Recommended Water Supply Improvements ........................................ 7-20
8. Treatment System Assessment and Recommendations 8-1
8.1. Introduction ................................................................................................................... 8-1

Table of Contents
City of Venice Water Supply Master Plan - Phase 2 5710010
iv
8.2. Pretreatment ................................................................................................................. 8-3 8.2.1. Sand Separators and Cartridge Filters .......................................................... 8-3 8.2.2. Antiscalant Chemical Feed System .............................................................. 8-3 8.2.3. Acid Chemical Feed System ......................................................................... 8-4
8.3. Reverse Osmosis Treatment ........................................................................................ 8-4 8.3.1. Ongoing RO System Rehabilitation .............................................................. 8-5 8.3.2. RO Skids ....................................................................................................... 8-5 8.3.3. RO Feed Pumps ............................................................................................ 8-5 8.3.4. RO Cleaning Systems ................................................................................... 8-6
8.4. Post Treatment Chemical Systems .............................................................................. 8-7 8.4.1. Sodium Hypochlorite System ........................................................................ 8-7 8.4.2. Sodium Hydroxide System ............................................................................ 8-7 8.4.3. Zinc Orthophosphate System ........................................................................ 8-8 8.4.4. Carbon Dioxide System ................................................................................. 8-8
8.5. Degasifier/Odor Control Systems ................................................................................. 8-9 8.5.1. Hydrogen Sulfide Treatment Alternatives ................................................... 8-10
8.5.1.1. Alternative 1 - Packed Tower/Forced Draft Aeration ........................ 8-10 8.5.1.2. Alternative 2 – Biological Oxidation with Ultrafiltration (UF) ............. 8-13 8.5.1.3. Alternative 3 – Ozone Oxidation ....................................................... 8-14
8.5.2. Recommended Degasifier/Odor Control System Improvements ................ 8-15 8.6. Finished Water/High Service Pump Station (HSPS) .................................................. 8-15
8.6.1. Clearwell ...................................................................................................... 8-15 8.6.2. High Service Pump Station ......................................................................... 8-16
8.7. Concentrate Disposal System..................................................................................... 8-16 8.8. Electrical, Instrumentation and Controls (I&C), and Security ..................................... 8-17
8.8.1. Electrical Systems ....................................................................................... 8-17 8.8.2. Instrumentation and Controls ...................................................................... 8-18 8.8.3. Security and Fire Systems .......................................................................... 8-19
8.9. Summary of RO WTP System Recommendations ..................................................... 8-20
9. Distribution System Assessment and Recommendations 9-1
9.1. Introduction ................................................................................................................... 9-1 9.2. Existing System Evaluation/Improvements ................................................................... 9-1
9.2.1. Distribution System Storage Requirements .................................................. 9-2 9.2.2. Fire Flow Requirements ................................................................................ 9-2 9.2.3. Average Annual Day Demand – Water Age Results .................................... 9-6 9.2.4. Maximum Day Demand Scenario ................................................................. 9-8
9.2.4.1. Maximum Pipe Velocities .................................................................... 9-8 9.2.4.2. System Pressures ............................................................................... 9-8 9.2.4.3. High Service Pump Flows ................................................................... 9-8
9.2.5. Distribution System Storage Tanks ............................................................. 9-11 9.2.5.1. Tank Turnover ................................................................................... 9-11
9.2.6. Maximum Day Demand Using Emergency Interconnections Only ............. 9-13 9.2.7. Maximum Day Demand + Fire Flow ............................................................ 9-13
9.2.7.1. Residential Fire Flow Results ........................................................... 9-14 9.2.7.2. Commercial Fire Flow Results .......................................................... 9-14
9.2.8. Existing System Fire Flow Recommendations ............................................ 9-17 9.2.9. Distribution System Storage Tank Improvements ....................................... 9-19
9.2.9.1. Tank Mixing ....................................................................................... 9-19 9.2.9.2. Tank Operations ............................................................................... 9-20
9.2.10. WTP Relocation Alternatives ...................................................................... 9-20

Table of Contents
City of Venice Water Supply Master Plan - Phase 2 5710010
v
9.3. Future Conditions Evaluation and Improvements ....................................................... 9-21 9.3.1. Future Demand Projections and Locations ................................................. 9-21 9.3.2. Capacity Improvements ............................................................................... 9-24
9.3.2.1. Transmission Mains .......................................................................... 9-24 9.3.2.2. Proposed Elevated Storage Tank ..................................................... 9-27
9.3.3. Operational Improvements .......................................................................... 9-27 9.3.3.1. Fire Hydrant Spacing ........................................................................ 9-27 9.3.3.2. Rear Lot Easement Pipes ................................................................. 9-28 9.3.3.3. Interconnections ................................................................................ 9-33
9.3.4. Water Quality Improvements ....................................................................... 9-37 9.3.4.1. Water Age ......................................................................................... 9-37
9.4. Summary of Distribution System Recommendations ................................................. 9-39
10. Capital Improvement Plan 10-1
10.1. Introduction ................................................................................................................. 10-1 10.2. CIP Prioritization ......................................................................................................... 10-1
10.2.1. Prioritization Approach ................................................................................ 10-1 10.2.2. Cost Estimates ............................................................................................ 10-3 10.2.3. Recommended Studies ............................................................................... 10-4 10.2.4. Prioritization Results .................................................................................... 10-5
10.3. 20-Year CIP Schedule .............................................................................................. 10-13
List of Tables
Table 2-1: Intermediate Aquifer Brackish Supply wells ............................................................... 2-3 Table 2-2: Intracoastal Wellfield Wells ........................................................................................ 2-3 Table 2-3: East Wellfield Wells .................................................................................................... 2-4 Table 2-4: Venice Golf Association Irrigation Wells .................................................................... 2-5 Table 2-5: Monitoring Wells Sampling Requirements ................................................................. 2-5 Table 2-6: Production Wells Trigger Levels ................................................................................ 2-6 Table 2-7: Summary of Historic Annual Chemical Usage ......................................................... 2-12 Table 2-8: Annual Finished Water Quality ................................................................................. 2-12 Table 2-9: Finished Water Storage............................................................................................ 2-14 Table 2-10: Potable Water Distribution Pipe ............................................................................. 2-15 Table 2-11: Historic Finished Water Production Flows ............................................................. 2-18 Table 2-12: City of Venice Population Estimates ...................................................................... 2-20 Table 2-13: City of Venice Historic Water Production Rates and per Capita Demand ............. 2-20 Table 2-14: City of Venice Potable Water Use Distribution Based on Customer Billing Records ...................................................................................................................................... 2-22 Table 2-15: Users Consuming More Than 7.0 gpm .................................................................. 2-24 Table 3-1: Regulatory Agencies .................................................................................................. 3-1 Table 3-2: Summary of Regulations Governing the City of Venice ............................................. 3-3 Table 3-3: Primary Inorganic MCL Standards ............................................................................. 3-9 Table 3-4: Inorganic Chemical Concentrations in Distribution System (2010) .......................... 3-10 Table 3-5: Stage 1 DBPR Summary ......................................................................................... 3-11 Table 3-6: Stage 1 DBPR Results (2011) ................................................................................. 3-12 Table 3-7: Stage 2 DBPR Monitoring Location Requirements for Groundwater Systems ......... 3-12 Table 3-8: Volatile Organic Chemical MCLs ............................................................................. 3-14 Table 3-9: Synthetic Organic Chemical MCLs .......................................................................... 3-15 Table 3-10: Radionuclides MCLs and Monitoring Frequency ................................................... 3-18 Table 3-11: Radionuclides Monitoring Requirements ............................................................... 3-19

Table of Contents
City of Venice Water Supply Master Plan - Phase 2 5710010
vi
Table 3-12: 2011 Radiological Contaminants Levels ................................................................ 3-19 Table 3-13: Secondary Drinking Water Standards .................................................................... 3-19 Table 3-14: Lead and Copper Rule Monitoring Requirements .................................................. 3-20 Table 3-15: LCR Water Quality Parameter Monitoring Requirements for Large Groundwater Systems ...................................................................................................................................... 3-21 Table 3-16: Concentrate Discharge Permit Limits and Historical Discharge Data .................... 3-22 Table 3-17: Contaminant Candidate List 3 ................................................................................ 3-25 Table 4-1: City of Venice BEBR Population Projections ............................................................. 4-2 Table 4-2: JPA/LSBA Potential Residential Impact ..................................................................... 4-3 Table 4-3: Total Functional Population Projections ..................................................................... 4-5 Table 4-4: City of Venice Historic Water Production Rates and per Capita Demand ................. 4-6 Table 4-5: Total Projected Demand (mgd) .................................................................................. 4-6 Table 5-1: Conservation Projects .............................................................................................. 5-15 Table 6-1: Completed Interconnection Projects .......................................................................... 6-7 Table 6-2: Planned Interconnection Projects .............................................................................. 6-7 Table 6-3: Current Finished Water Characteristics ..................................................................... 6-8 Table 6-4: Estimate of Blended Water Characteristics (RTW Model) ......................................... 6-9 Table 7-1: Modeled Flow and Water Quality Values – Single RO Train Array ........................... 7-2 Table 7-2: Concentrate Discharge Limits and RO WTP Discharge ............................................ 7-6 Table 7-3: Concentrate Water Quality for Average TDS Conditions ........................................... 7-7 Table 7-4: Concentrate Water Quality for High TDS Conditions ................................................. 7-8 Table 7-5: Summary of Alternative Concentrate Considerations .............................................. 7-10 Table 7-6: Water Supply Alternative Summary ......................................................................... 7-18 Table 7-7: Summary of Recommended Water Supply Improvements ...................................... 7-20 Table 8-1: Existing Degasifier and Odor Control System ............................................................ 8-9 Table 8-2: Degasifier and Odor Control Systems Improvement Summary ............................... 8-15 Table 8-3: Summary of Recommended RO WTP Improvements ............................................. 8-20 Table 9-1: Summary of System Performance Criteria for Maximum Day Demand .................... 9-2 Table 9-2: City of Venice Minimum Fire Flowrate Required Prior to Sprinkler Installation ......... 9-3 Table 9-3: Tank Turnover Results ............................................................................................. 9-12 Table 9-4: Minimum Pipe Diameters Based on Fire Flow Rates .............................................. 9-13 Table 9-5: Summary of Improvements to Address Residential Fire Flow Needs ...................... 9-17 Table 9-6: Total Projected Demand (mgd) ................................................................................ 9-22 Table 9-7: City of Venice JPA/ILSBA Demand Projections ....................................................... 9-22 Table 9-8: Summary of Distribution System Recommendations ............................................... 9-39 Table 10-1: Recommended CIP Implementation Years by Priority ........................................... 10-2 Table 10-2: 20-Year CIP Cost Distribution ................................................................................ 10-3 Table 10-3: Table of Projects ..................................................................................................... 10-6 Table 10-4: Recommended Projects by Priority ...................................................................... 10-10 Table 10-5: 20-year CIP Schedule ........................................................................................... 10-14
List of Figures
Figure 2-1: Existing Water Supply, Treatment and Distribution Facilities ............................ 2-2 Figure 2-2: Existing Well Locations ...................................................................................... 2-4 Figure 2-3: Wellfield Park Well ............................................................................................ 2-5 Figure 2-4: Treatment Plant Process Flow Diagram ............................................................ 2-9 Figure 2-5: Phase II Membrane Skid .................................................................................. 2-11 Figure 2-6: Monitoring Instrumentation ............................................................................... 2-11 Figure 2-7: Concentrate Treatment Equipment .................................................................. 2-12 Figure 2-8: Covered Clearwell at the City of Venice Water Treatment Plant ..................... 2-14 Figure 2-9: Elevated Storage Tank at the Water Treatment Plant ..................................... 2-14

Table of Contents
City of Venice Water Supply Master Plan - Phase 2 5710010
vii
Figure 2-10: Pinebrook Facility Ground Storage Tank ......................................................... 2-15 Figure 2-11: Distribution System .......................................................................................... 2-17 Figure 2-12: Generator at Pinebrook Booster Facility .......................................................... 2-18 Figure 2-13: Historic Finished Water Production Flows ....................................................... 2-20 Figure 2-14: Historic per Capita Demand ............................................................................. 2-22 Figure 2-15: Customer Water Meter Data ........................................................................... 2-24 Figure 2-16: Residential and Commercial Diurnal Demand Patterns ................................... 2-27 Figure 2-17: Irrigation Diurnal Demand Patterns .................................................................. 2-28 Figure 4-1: JPA/ILSBA Locations ......................................................................................... 4-4 Figure 4-2: Projected Supply and Demand .......................................................................... 4-7 Figure 5-1: SWFWMD Planning Regions ............................................................................. 5-2 Figure 5-2: Southern Water Use Caution Area ..................................................................... 5-3 Figure 5-3: Generalized Location of the Freshwater/Saltwater Interface ............................. 5-5 Figure 5-4: Generalized Geologic Column of Venice Area .................................................. 5-6 Figure 5-5: Intracostal Wellfield Water Quality Trends ......................................................... 5-8 Figure 5-6: Eastern Wellfield Water Quality Trends ............................................................. 5-8 Figure 5-7: Venetian Golf and River Club Potential Well Sites .......................................... 5-10 Figure 5-8: Location of Existing and Potential Brackish and Seawater Desalination ......... 5-13 Figure 6-1: Existing Interconnection Locations ..................................................................... 6-2 Figure 6-2: Sarasota County Projected Demand and Supplies ............................................ 6-5 Figure 6-3: Iron Speciation as a Function of pH and ORP ................................................... 6-6 Figure 8-1: Treatment Plant Process Flow Diagram ............................................................ 8-2 Figure 9-1: Future Land Use Map......................................................................................... 9-4 Figure 9-2: Water Model Fire Flow Nodes ............................................................................ 9-5 Figure 9-3: Existing System Water Age Results ................................................................... 9-7 Figure 9-4: MDD Max Pipe Velocities ................................................................................... 9-9 Figure 9-5: MDD Min System Pressures ............................................................................ 9-10 Figure 9-6: Tank Levels – May 2011 .................................................................................. 9-11 Figure 9-7: Tank Levels – February 2012 .......................................................................... 9-12 Figure 9-8: Existing System Analysis Residential Fire Flow Results ................................. 9-15 Figure 9-9: Existing System Analysis Commercial Fire Flow Results ................................ 9-16 Figure 9-10: Proposed Residential Fire Flow Improvements ............................................... 9-18 Figure 9-11: Example Inlet/Outlet #1 .................................................................................... 9-20 Figure 9-12: Example Inlet/Outlet #2 .................................................................................... 9-20 Figure 9-13: JPA/ILSBA Locations ....................................................................................... 9-23 Figure 9-14: Proposed 2015/2030 Distribution System Capacity Improvements ................. 9-26 Figure 9-15: Proposed Fire Hydrant Spacing ....................................................................... 9-29 Figure 9-16: Proposed Rear Lot Easement Pipe Replacement ........................................... 9-30 Figure 9-17: Interstate Crossing Pipe Break ........................................................................ 9-33 Figure 9-18: Interstate Crossing Pipe Break with Peace River Interconnect ....................... 9-34 Figure 9-20: 2030 Water Age Results .................................................................................. 9-36 Figure 10-1: Total Costs by General Project Category......................................................... 10-9 Figure 10-2: Total Costs by Improvement Discipline ............................................................ 10-9 Figure 10-3: Total Costs by Project Type ........................................................................... 10-10 Figure 10-4: Proposed Supply and Treatment Projects ..................................................... 10-11 Figure 10-5: Proposed Distribution System Projects .......................................................... 10-12 Figure 10-6: Annual and Cumulative CIP Capital Expenditures ......................................... 10-13

Table of Contents
City of Venice Water Supply Master Plan - Phase 2 5710010
viii
Appendices
A. Model Development and Calibration Report (ARCADIS, July 2012) B. City of Venice Water Use Permit C. 2011 FDEP SWAPP Results D. City of Venice 10-year Water Supply Facilities Work Plan (April 2010) E. Potable Water Level of Service Memo (ARCADIS, March 2011)

Acronyms
City of Venice Water Supply Master Plan - Phase 2 5710010
ix
Acronyms Used in the Report
3-MADF 3 month average daily flow AAD annual average demand AADD annual average day demand AC asbestos-cement ACEE Association for the Advancement of Cost Engineering
Agreement Interlocal Agreement AL action level
Alliance Water Planning Alliance ARV air release valve ASR aquifer storage and recovery
AWWA American Water Works Association BEBR Bureau of Economic and Business Research
BG billion gallons bls below land surface BODR Basis of Design Report BOR Basis of Review CaCO3 calcium carbonate CAR capacity analysis report caustic sodium hydroxide CCL Contaminant Candidate List
CCPP calcium carbonate precipitation potential CCR Consumer Confidence Report CFD computational fluid dynamics CI cast iron
CIP Capital Improvement Plan City City of Venice CM commercial
CO2 carbon dioxide Contract Master Water Supply Contract
County Sarasota County CWS Community Water System DBP disinfection byproduct DBPR Disinfectant and Disinfection Byproduct Rule
DHRS Department of Health and Rehabilitative Services DIC dissolved inorganic carbonate

Acronyms
City of Venice Water Supply Master Plan - Phase 2 5710010
x
DIP ductile iron pipe District SWFWMD’s District EAWRF Eastside Advanced Wastewater Reclamation Facility
EDC endocrine-disrupting compounds EDR electrodialysis reversal
EPA Environmental Protection Agency EPS extended period simulation
ERD energy recovery device ERU equivalent residential unit EST elevated storage tank FAC Florida Administrative Code
FAS Floridan Aquifer System FDA packed tower/forced draft aeration
FDEP Florida Department of Environmental Protection FF fire flow
FGS Florida Geological Survey FLUM Future Land Use Map fps feet per second ft feet
FY fiscal year GE General Electric
gpcd gallons per capita per day gpd gallon per day gph gallons per hour gpm gallon per minute GST ground storage tank GWR Groundwater Rule GWUDI groundwater under direct influence
HDPE high density polyethylene HET high efficiency toilet hp horsepower
HSP high service pump HSPS high service pump station hypo sodium hypochlorite IAS Intermediate Aquifer System
ICWW Intercoastal Waterway IDSE Initial Distribution System Evaluation
in inch IR irrigation
Acronyms
City of Venice Water Supply Master Plan - Phase 2 5710010
xi
ISO Insurance Service Office JPA/ILSBA Joint Planning Area / Interlocal Service Boundary Agreement Area
kV kilovolts kW kilowatt LCR Lead and Copper Rule
LCRMR Lead and Copper Rule Minor Revisions LOS level of service
LRAA locational running annual average M million
MCC motor control center MCL Maximum Contaminant Level
MCLG Maximum Contaminant Level Goals MDD maximum day demand
MFL
minimum flow and levels or million fibers per liter greater than 10 microns
MG million gallons mg/L milligram per liter mgd million gallons per day MHz megahertz
mi mile MIA Most Impacted Areas
MMD maximum month demand MOV motor operated valve MRDL Maximum Residual Disinfectant Levels
MRDLG Maximum Residual Disinfectant Level Goals MTBE methyl tertiary-butyl ether
NPDES National Pollutant Discharge Elimination System NPDWR National Primary Drinking Water Regulation O&M operation and maintenance
OEL Operational Evaluation Levels ORP oxidation reduction potential OWQP Optimal Water Quality Parameters PCB polychlorinated biphenyls
pCi/L picoCuries per liter PF peaking factor PFC perflurocarbons PLC programmable logic controller
PNR Public Notification Rule ppb parts per billion

Acronyms
City of Venice Water Supply Master Plan - Phase 2 5710010
xii
PPCP pharmaceuticals and personal care products ppm parts per million
PR/MRWSA Peace River/Manasota Regional Water Supply Authority
PRF Peace River Facility PRI1 Peace River Interconnect 1 psi pounds per square inch PVC polyvinyl chloride PWS public water system PZ production zone R/A reclaim/augmentation RAA running annual average REP Regional Expansion Project RM residential
RO reverse osmosis RO WTP reverse osmosis water treatment plant
RTS Regional Transmission System RTW Rothberg, Tamburini, and Winsor Model RWSP Regional Water Supply Plan SAS Surficial Aquifer System
SCADA Supervisory Control and Data Acquisition scfm standard cubic feet per minute SCHD Sarasota County Health Department SCWTP Sarasota County Water Treatment Plant SDWA Safe Drinking Water Act
SOC Synthetic Organic Chemicals SWAPP source water assessment and protection program
SWCFGWB Southern West-Central Florida Groundwater Basin SWFWMD Southwest Florida Water Management District SWTR Surface Water Treatment Rule
SWUCA Southern Water Use Caution Area TCR Total Coliform Rule
TDS total dissolved solids TM technical memorandum TTHM total trihalomethane UCMR Unregulated Contaminants Monitoring Rule
UF ultrafiltration ULV ultra low volume
USEPA United States Environmental Protection Agency

Acronyms
City of Venice Water Supply Master Plan - Phase 2 5710010
xiii
USGS US Geological Survey V volt
VFD variable frequency drive VOCs volatile organic concentrations
WA water WHPA Wellhead Protection Areas
WQP water quality parameter WRF water reclamation facility WSMP Water Supply Master Plan WTF water treatment facility WTP water treatment plant WUCA Water Use Caution Area WUP water use permit yrs years

City of Venice Water Supply Master Plan - Phase 2 5710010
1-1
1. Introduction
The City of Venice (City) operates a 4.48 million gallon per day (mgd) water treatment plant (WTP) that utilizes reverse osmosis (RO) to treat brackish groundwater from the Intermediate Aquifer. The capacity of the RO skids is 4.32 mgd. Raw water is currently produced by 14 wells with a permitted average day capacity of 6.86 million gallons. The distribution system includes one booster pumping station, two elevated storage tanks and about 185 miles of distribution piping. The RO WTP was one of the first water treatment facilities in Florida to utilize RO to treat brackish water and has been providing safe and reliable water to its customers throughout the City of Venice. In this type of WTP, the RO membranes are the core and critical process in the treatment and production of potable water. The facility was constructed in two phases – Phase I was originally built in 1975 and included RO modules to produce approximately 2 mgd of drinking water. In 1989 Phase I was upgraded and a second phase was added. As a result of those improvements, both the original Phase I facility and the new Phase II facility are each able to produce approximately 2.16 mgd for a total capacity of 4.32 mgd. The membrane elements in both phases were last replaced in approximately 1999. The treatment plant and distribution system have grown and continue to expand and evolve to meet the increasing needs of the Venice area while maintaining the necessary high quality standards for drinking water. To ensure continued reliable service and a high quality water, the City’s water supply, treatment and distributions systems require capital improvements to keep pace with increasingly stringent regulatory requirements, address redundancy needs, and provide for the rehabilitation or replacement of equipment that has or will exceed it expected useful service life.
1.1. Project Objectives In light of the above considerations, the City has retained ARCADIS, Inc. to prepare a comprehensive Water Master Plan and 20-year capital improvements program for the City’s water system. The main objective of this Water System Master Plan is to provide the City with a comprehensive planning document that describes the features of each system, establishes system projections, evaluates treatment performance with respect to water quality goals and regulatory requirements, and reviews the infrastructure necessary to support the current and future needs of the City of Venice. The Water Master Plan identifies and analyzes the City’s major infrastructure needs and provides a list of projects and actions that address these needs in the form of a Capital Improvements Program (CIP) that optimizes the use of the City’s resources and ensures financial feasibility. This Water Master Plan will serve as a guidance document for water improvements over the next twenty years. Key objectives of this Master Plan include:

Section 1
Introduction
City of Venice Water Supply Master Plan - Phase 2 5710010
1-2
n Providing the City with a planning document that can serve as a detailed roadmap
for implementation of short, medium and long-term improvements for the City’s supply, treatment and distribution systems.
n Providing the City with a true “living” document that can be updated as conditions change.
n Providing a framework to prioritize improvements that will continue to provide the highest quality of water to the City’s residents in a cost effective manner, while meeting the needs for future growth and maintaining system reliability.
n Providing one comprehensive source of reference for City growth projections, current infrastructure and regulatory compliance needs.
n Reducing problems encountered during system modification due to lack of accurate records and maps
n Providing a calibrated and current hydraulic model of the City’s distribution system and necessary training to ensure the City can continue to use this tool for future planning needs.
1.2. Report Organization The Water Master Plan is organized as follows:
n Section 2.0 Existing Water System – This section describes the City’s existing supply, treatment and distribution systems and presents the methodology used in establishing existing system populations and demands, which were subsequently used to develop and calibrate the distribution system hydraulic model.
n Section 3.0 Regulatory Assessment – This section evaluates current treatment performance at the City of Venice RO WTP with respect to meeting current and projected future regulatory requirements and the City’s water quality goals.
n Section 4.0 Population and Demand Projections – This section describes the approach and results of the future population and water demand projections, which are subsequently used in identifying supply, treatment and distribution system capacity needs for the master planning period.
n Section 5.0 Potential Sources - This section discusses the City’s local hydrogeology and supply water quality, and presents available water supply options available to the City.
n Section 6.0 Interconnections - This section describes the City’s existing interconnections with Sarasota County (County) and evaluates the needs and considerations for potential future interconnections with the Peace River Manasota Regional Water Supply Authority (PR/MRWSA) and/or Sarasota County.

Section 1
Introduction
City of Venice Water Supply Master Plan - Phase 2 5710010
1-3
n Section 7.0 Water Supply and Production Capacity Assessment and
Recommendations - This section presents the development of alternatives and recommendations to increase the City’s water supply capacity to address the projected long-term production needs identified in Section 4.0.
n Section 8.0 Treatment System Assessment and Recommendations – This section identifies needs and the City’s RO WTP and presents alternatives and recommendations to address improvements required at the plant to meet regulatory/water quality, capacity, equipment condition, maintenance and operational needs.
n Section 9.0 Distribution System Assessment and Recommendations - This section presents the assessment and recommended improvements required to meet City-projected growth, annexation, and acquisition from a distribution system perspective.
n Section 10.0 Capital Improvement Plan – This section discusses the approach
used to group and prioritize projects and develop the 20- CIP for the City of Venice’s water system, and presents the recommended list of prioritized projects and CIP implementation schedule. Opinions of probable construction costs for each recommended project are presented.

City of Venice Water Supply Master Plan - Phase 2 5710010
2-1
2
2. Existing Water System
2.1. Introduction The City of Venice’s (City) drinking water supply system consists of fifteen wells (14 operational, one additional permitted) drawing water from two brackish raw water wellfields, one reverse osmosis (RO) water treatment plant (WTP), one booster pump station, two elevated storage tanks and approximately 185 miles of distribution piping. Figure 2-1 shows the location of the WTP and two wellfields. The RO WTP was constructed in the 1970s and the distribution system was constructed between the 1900s and present. The existing RO plant has a treatment capacity of 4.32 million gallons per day (mgd) and the wellfields are limited to an average daily permitted withdrawal of 6.86 mgd and a peak monthly withdrawal of 8.24 mgd. This section describes the existing supply, treatment and distribution systems for the City of Venice potable water supply. This section also presents the methodology used to calculate existing system water demands which were used to build and calibrate the existing distribution system model (refer to Appendix A for the model calibration report). The model was subsequently used to identify distribution system needs and improvements (presented in Section 9).
2.2. System Description 2.2.1. Water Supply The City of Venice utilizes a series of groundwater wells to meet public water demands. The City is currently permitted (Permit # 20005393.009) by the Southwest Florida Water Management District (SWFWMD) for an average daily withdrawal of 6.86 mgd and a peak month withdrawal of 8.24 mgd. In accordance with the City’s Water Use Permit (WUP), attached as Appendix B, the withdrawal allocation is permitted from fifteen production wells. The wells provide brackish groundwater from the Intermediate Aquifer System (IAS), which is treated by RO technology at the City’s WTP.
2.2.1.1. Production Wells The City’s wellfields, existing production wells, and proposed future development sites are shown in Figure 2-1. Table 2-1: lists the diameter, depth, casing depth, and pump capacity of the existing and proposed wells within the IAS.

ARCADIS-US, INC.CITY OF VENICE200 N WARFIELD AVE, VENICE, FL 34285
WATER MASTER PLAN PHASE 2
WATER MASTER PLAN REPORTEXISTING WATER SUPPLY,
TREATMENT, ANDDISTRIBUTION FACILITIES
"M
"M
"M"M
"M
"M
"M
"M
"M
"M
"M
"M
"M"M
"M
[Ú
[Ú
³
Legend[Ú Pump Stations
"M Existing Production wells
"M Proposed Production Wells
UT Ground Storage Tanks"³³ Elevated Storage Tank
3Q WTP
Existing City Limits
AUGUST 2013
FIGURE 2-1
0 5,000 10,0002,500
Feet

Section 2
Existing Water System
City of Venice Water Supply Master Plan - Phase 2 5710010
2-3
Table 2-1: Intermediate Aquifer Brackish Supply wells SWFWMD Well ID No./
Permitee ID No. Diameter
(in) Well Depth
(ft) Case Depth
(ft) Maximum Permitted Withdrawal (GPD)
RO2W/33 10 385 230 604,800 RO3W/34 10 450 230 633,600 RO4W/35 10 450 230 648,000 RO2A/49 10 450 230 604,800 RO8W/50 12 450 230 936,000 RO7W/51 12 350 230 792,000 RO1E/52 12 405 269 720,000 RO2E/54 12 261 207 936,000 RO3E/55 12 360 197 936,000 RO4E/56 12 320 242 936,000 RO5E/57 12 320 228 936,000 RO1A/65 12 359 225 792,000 RO6E/77 12 320 220 936,000 RO7E/78 12 320 220 936,000
RO8E/79 (Proposed) 12 320 220 936,000
2.2.1.2. Intracoastal Wellfield The City’s Intracoastal Wellfield consists of seven production wells drilled in the 1970’s and 1980’s, along the Intracoastal Waterway. Details of these wells are listed in Table 2-2.
Table 2-2: Intracoastal Wellfield Wells SWFWMD Well ID No./
Permitee ID No. Diameter
(in) Well Depth
(ft) Case Depth
(ft) Maximum Permitted Withdrawal (GPD)
RO2W/33 10 385 230 604,800 RO3W/34 10 450 230 633,600 RO4W/35 10 450 230 648,000 RO2A/49 10 450 230 604,800 RO8W/50 12 450 230 936,000 RO7W/51 12 350 230 792,000 RO1A/65 12 359 225 792,000
2.2.1.3. Wellfield Park An old shallow wellfield at the City’s Wellfield Park (Venice Avenue and Pinebrook Road area) was previously used by the City. The wells ranged in depth from 110 to 190 feet (Production Zone 2 of the IAS) and supplied water that was treated by lime softening. SWFWMD records indicate that the wells have since been properly abandoned.

Section 2
Existing Water System
City of Venice Water Supply Master Plan - Phase 2 5710010
2-4
Figure 2-2: Well 1-E
2.2.1.4. Eastern Wellfield The City’s Eastern Wellfield is located in the Sawgrass Community (Venice Avenue and Auburn Road area). The production wells of the Eastern Wellfield are identified in Table 2-3. Wells RO1E, RO2E, RO3E, RO4E, and RO5E were drilled between 1988 and 1990. Wells RO6E and RO7E were drilled in 2002 and 2003, respectively; however, the wells did not become operational until 2005.
Table 2-3: East Wellfield Wells SWFWMD Well ID No./
Permitee ID No. Diameter
(in) Well Depth
(ft) Case Depth
(ft) Maximum Permitted Withdrawal (GPD)
RO1E/52 12 405 269 720,000 RO2E/54 12 261 207 936,000 RO3E/55 12 360 197 936,000 RO4E/56 12 320 242 936,000 RO5E/57 12 320 228 936,000 RO6E/77 12 320 220 936,000 RO7E/78 12 320 220 936,000
RO8E/79 (Proposed) 12 320 220 936,000 * Well 79/RO8E has not been installed.
2.2.1.5. Irrigation Wells The City of Venice is a joint permit holder (Permit # 011871) with the Venice Golf Association, Inc. for the three irrigation wells identified in Table 2-4. The wells withdraw water from Production Zone (PZ) 3 of the IAS and are used for augmentation of reuse water. The permitted allocation for the Lake Venice Golf Club is 0.20 mgd for average daily use and 0.96 mgd for peak month.

Section 2
Existing Water System
City of Venice Water Supply Master Plan - Phase 2 5710010
2-5
Table 2-4: Venice Golf Association Irrigation Wells
SWFWMD Well ID No./ Permitee ID No.
Diameter (in)
Well Depth (ft)
Case Depth (ft)
Use* Gallons Per Day (Average/Peak Monthly)
IW-1/1 12 460 301 R/A Capped IW-2/2 12 460 301 R/A 201,300/321,400 IW-3/3 12 460 301 R/A 201,300/321,400
*R/A= Reclaimed /Augmentation
2.2.2. Wellfield Management, Monitoring, and Mitigation In 1990, a wellfield monitoring system was initiated to monitor the pumpage, drawdown, and hours of operation of the production wells. The monitoring system allows for control and optimization of the production well withdrawals so that the Intermediate Aquifer does not experience the adverse impacts of saltwater intrusion. The City’s Wellfield Management, Monitoring, and Mitigation Plan was submitted to the SWFWMD in 1997. The wellfield monitoring and reporting requirements are discussed below.
2.2.2.1. Wellfield Water Quality Monitoring As required by the SWFWMD WUP, the City’s monitoring well network is sampled on a monthly basis for water quality. The samples are analyzed by a Department of Health and Rehabilitative Services (DHRS) certified laboratory. Reports of the analyses are submitted to the Permits Data Section on SWFWMD’s District (District) forms on or before the tenth day of the following month. The District ID numbers, parameters, and sampling frequencies are listed in Table 2-5 below.
Table 2-5: Monitoring Wells Sampling Requirements
District ID No.
Permittee ID No.
Water Quality Monitoring Parameter
Water Level Monitoring Aquifer
Frequency of Water Quality and Level Testing
37 RO6 Chlorides, Sulfates, TDS PZ-3/Intermediate Monthly 53 OBW-1 Chlorides, Sulfates, TDS PZ-3/Intermediate Monthly
58 OBW-2 Chlorides, Sulfates, TDS PZ-3/Intermediate/
Upper Floridan Monthly 60 IM-1 Chlorides, Sulfates, TDS PZ-3/Intermediate Monthly 61 SM-2 Chlorides, Sulfates, TDS Surficial Monthly 62 SM-1 Chlorides, Sulfates, TDS Surficial Monthly 63 SM-3 Chlorides, Sulfates, TDS Surficial Monthly 37* RO6-Fl Chlorides, Sulfates, TDS Floridan Monthly
100* USGS-1 Chlorides, Sulfates, TDS Intermediate Monthly 101* USGS-2 Chlorides, Sulfates, TDS PZ-2/Intermediate Monthly
102* Island-1 Chlorides, Sulfates, TDS PZ-2/Intermediate Monthly 103* Island-2 Chlorides, Sulfates, TDS PZ-2/Intermediate Monthly
104* Island-3-PZ-2 Chlorides, Sulfates, TDS PZ-2/Intermediate Monthly
105* Island-3-PZ-3 Chlorides, Sulfates, TDS PZ-3/Intermediate Monthly

Section 2
Existing Water System
City of Venice Water Supply Master Plan - Phase 2 5710010
2-6
District ID No.
Permittee ID No.
Water Quality Monitoring Parameter
Water Level Monitoring Aquifer
Frequency of Water Quality and Level Testing
106** AFR-PZ-2 Chlorides, Sulfates, TDS PZ-2/Intermediate Monthly 107** AFR-PZ-3 Chlorides, Sulfates, TDS PZ-3/Intermediate Monthly
108** EWF-N Chlorides, Sulfates, TDS PZ-2/Intermediate Monthly 109** EWF-E Chlorides, Sulfates, TDS PZ-2/Intermediate Monthly
* Stated in the Water Use Permit as "Existing wells to be converted to monitor well" **Stated in the current Water User Permit as "Proposed monitor wells Pursuant to the WUP conditions, all production wells are also monitored. The production wells are sampled monthly for chlorides, sulfates, and total dissolved solids (TDS).
2.2.2.2. Wellfield Rotation The City operates its wellfields in accordance with the City of Venice Wellfield Management Plan. Under the Wellfield Management Plan, two to three wells in the Eastern Wellfield are pumped at one time. After two weeks, one well is switched out with another well that was not in operation during the two previous weeks. When additional capacity is needed, withdrawals occur from the Intracoastal Wellfield. Wells in the Intracoastal Wellfield are rotated in a similar manner. During peak demand periods additional wells are brought into the on-line rotation. If chloride concentrations are sustained above the trigger levels (listed in Table 2-6, below) during any six month period, or if the average chloride samples over a three month period exceed the trigger level, the well is taken off line for 30 days. After 30 days, the well is re-sampled. If after 30 days the chloride levels have decreased below the trigger level, the well is brought back on-line. If the re-sampled chloride concentration remains above the trigger level, additional assessments of the well are required to be performed.
Table 2-6: Production Wells Trigger Levels
Permittee ID SWFWMD ID Chloride Trigger (mg/L) RO2 33 800 RO3 34 800 RO4 35 800
RO2A 49 800 RO8 50 450 RO7 51 500
RO1A 65 1400 RO1E 52 700 RO2E 54 200 RO3E 55 200 RO4E 56 200 RO5E 57 750 RO6E 77 NE RO7E 78 NE RO8E 79 NE
NE = Not Established

Section 2
Existing Water System
City of Venice Water Supply Master Plan - Phase 2 5710010
2-7
2.2.3. Water Treatment Facility
2.2.3.1. Treatment Process The brackish ground water requires reverse osmosis treatment for removal of TDS, degasification to remove dissolved gases, pH adjustment and disinfection prior to distribution. Water from the wells is sent via raw water mains to the RO WTP located on North Warfield Avenue. A schematic of the treatment process is provided in Figure 2-3.

FIGURE 2-3
AUGUST 2013
WATER MASTER PLAN REPORT
TREATMENT PLANT PROCESS FLOW DIAGRAM
Path: G:\GISDATA\Projects\5710\010\MXD\Master Plan Report\2-4 - Treatment Plant Process Flow Diagram.mxd
CITY OF VENICE200 N WARFIELD AVEVENICE, FL 34285

Section 2
Existing Water System
City of Venice Water Supply Master Plan - Phase 2 5710010
2-9
2.2.3.2. Treatment Capacity The existing RO WTP has a treatment capacity of 4.32 mgd. The total finished water plant capacity varies with the treatment efficiency of the RO membranes. Currently the plant has recovery rate of approximately 50 percent; therefore half of the raw water that is withdrawn is processed and distributed through the potable water distribution system, while the rest is disposed of as concentrate. In 2012, the City completed a study that investigated the feasibility of increasing the current RO permeate recovery of 50%. The desktop study was performed using RO membrane manufacturers’ modeling software to evaluate equipment and operational requirements needed to increase permeate recovery. The study concluded that up to a 75% permeate recovery may be achievable for a two-stage RO system using proper pretreatment (acid and scale inhibitor), appropriate membranes, and feed pumps. A permit modification will be required to increase the permeate recovery.
2.2.3.3. Pretreatment Raw water is pumped though a cyclone sand separator and five micron cartridge filters to separate sand and particulates from the process stream. An anti-scalant is then added at 4.5 parts per million to increase the dissolved mineral solubility limits prior to the high pressure RO feed pumps.
2.2.3.4. Reverse Osmosis Treatment After pretreatment, the water is pumped at high pressure across reverse osmosis membranes, which remove minerals from the water at a 50 percent recovery rate. The RO treatment is composed of two parallel pumping and membrane train buildings called Phase I and Phase II. Phase I was placed in service in 1989 and can produce up to 2.16 mgd of potable water. Phase I utilizes two 150-horsepower (hp) and two 125- hp vertical turbine high pressure pumps, which are operated by variable frequency drives (VFDs) to control the speed of the pump and maintain maximum efficiency. These pumps feed two RO trains. Each train contains 36 pressure vessels that are comprised of six Fluid Systems model TFC 8821-LP spiral wound membrane elements in a single pass configuration. Phase I operates at 50 percent recovery and averages between 150 and 160 pounds per square inch (psi) feed pressure, depending on water quality. In 1990, Phase II was put into service as a second spiral-wound membrane tract, bringing the total plant capacity to 4.32 mgd. Phase II utilizes two 250-hp, vertical turbine high pressure pumps that feed two RO trains. Each train holds 36 pressure vessels that are loaded with six Fluid Systems model TFC 8821-LP spiral wound membrane elements in a single pass configuration. Figure 2-4 shows one of the Phase II membrane skids. Phase II also operates at approximately 50 percent recovery with feed pressures averaging between 145 and 160 psi depending on water quality.

Section 2
Existing Water System
City of Venice Water Supply Master Plan - Phase 2 5710010
2-10
Figure 2-4: Phase II Membrane Skid
The SCADA system used to operate Phase II is Allen Bradley PLC Technology. The SCADA system is interfaced with a desktop computer, loaded with Allen Bradley “Wonder Ware” and a 900 MHz radio telemetry system. It allows plant personnel to monitor and adjust all plant operations parameters, raw water well control, distribution flows and pressure, as well as remote booster pumping control. The Phase I plant’s automation is currently limited to the high pressure pumps, which have been fitted with VFDs to control feed pressures for maximum efficiency. Figure 2-5 shows some of the process monitoring (flow and pressure) instrumentation.
Figure 2-5: Monitoring Instrumentation

Section 2
Existing Water System
City of Venice Water Supply Master Plan - Phase 2 5710010
2-11
2.2.3.5. Post Treatment The product water from both phases is combined and blended with approximately six percent raw well water that is bypassed around the RO process to recharge the finished water with mineral content. Carbon dioxide is added to reduce the pH which allows for the removal of dissolved gases. Caustic soda is added to adjust the pH to 8.0 and 4.5 ppm of sodium hypochlorite is added on average for disinfection. The final step is the addition of orthophosphate for corrosion control. The various streams of water are sampled several times per shift to ensure that the water quality meets regulatory standards.
2.2.3.6. Concentrate Treatment and Disposal The water that is rejected through the reverse osmosis process is treated with sodium hypochlorite and compressed air (to neutralize hydrogen sulfide gas). The treated concentrate is then discharged to a mixing zone in the Gulf Intracoastal Waterway, a salt water body, eventually flowing to the Gulf of Mexico. Figure 2-6 shows the apparatus where the sodium hypochlorite and compressed air are introduced to the concentrate stream. If the RO system recovery rate is increased, it would result in increased constituent concentrations in the reject water, which would directly affect the City’s discharge permit. To compensate for increased concentrations, the City would have to pursue less stringent discharge requirements, or develop other disposal mechanisms. This is discussed in greater detail in Section 7.5.
Figure 2-6: Concentrate Treatment Equipment

Section 2
Existing Water System
City of Venice Water Supply Master Plan - Phase 2 5710010
2-12
2.2.3.7. Water Quality The WTP uses an anti-scalant, as well as carbon dioxide, sodium hypochlorite, sodium hydroxide, and zinc orthophosphate in the RO process to produce high quality finished water that meets or exceeds state and federal regulations (refer to Section 3.0 for the regulatory assessment). Table 2-7 displays the annual chemical usage from City’s WTP from 2000 to 2011. Table 2-8 shows the resulting annual quality test results of the finished water, as well as the minimum, average, and maximum flow to the distribution system for 2000 through 2011.
Table 2-7: Summary of Historic Annual Chemical Usage
Chemical
Annual Chemical Use (lbs/yr)
2000 2001 2002 2003 2004 2005 2006 2007 2008 2009 2010 2011 Anti-Scalant 63,709 60,077 59,405 60,953 63,222 62,661 63,617 63,949 56,712 56,022 56,269 56,855
Carbon Dioxide N/A N/A 363,250 756,310 537,750 580,050 425,350 442,800 536,010 366,338 411,940 394,300 Sodium Hypochlorite 74,286 76,839 61,580 28,814 30,402 28,977 31,950 92,474 95,775 90,551 80,154 89,480 Sodium Hydroxide 128,763 76,146 75,403 71,066 57,456 53,108 56,365 162,314 140,480 86,404 48,884 46,277
Orthophosphate 32,199 28,800 29,592 29,291 28,968 37,040 40,646 38,775 34,126 34,799 34,498 35,988
Table 2-8: Annual Finished Water Quality
Year 2000 2001 2002 2003 2004 2005 2006 2007 2008 2009 2010 2011
TDS (mg/L)
min 175.0 120.0 130.0 90.0 100.0 135.0 100.0 154 156 160 135 111
avg 234.4 240.7 206.7 201.4 192.8 205.3 184.7 162 172 176 150 165
max 320.0 360.0 285.0 354.0 285.0 310.0 295.0 170 184 187 178 203
Chlorine Residual (lbs)
min 0.8 1.1 0.6 0.9 1.3 1.0 1.1 1.48 1.63 1.51 1.57 1.2
avg 1.4 1.4 1.5 1.5 1.5 1.6 1.5 1.55 1.66 1.53 1.64 1.6
max 1.7 4.5 1.6 1.6 1.7 1.9 1.9 1.63 1.68 1.56 1.76 1.8
pH
min 8.0 8.0 7.3 7.0 7.1 7.1 7.0 8.01 7.96 7.97 7.93 7.3
avg 8.3 8.3 8.1 7.9 8.0 8.0 8.0 8.01 7.99 8.01 8.04 8.0
max 8.5 8.4 8.5 8.2 8.2 8.1 8.2 8.01 8.03 8.05 8.1 8.3
Flow to System (mgd)
min 1.1 1.2 1.0 1.0 1.3 1.3 1.2 1.2 0.8 0.8 0.9 0.8
avg 2.2 2.2 2.3 2.2 2.3 2.3 2.3 2.1 2.0 2.0 2.0 2.0
max 3.3 3.4 3.4 3.2 3.2 3.3 3.5 3.2 3.4 3.1 3.0 3.0
2.2.3.8. Security Security is a high priority at the City of Venice RO WTP. The site is surrounded by a perimeter fence with a gated entrance that encompasses all critical equipment. Photo identification cards have been issued with embedded microchip circuitry and serve as pass keys to magnetic locks. Signs are posted restricting access. Authorized personnel and staff must escort visitors around the facility at all times. In addition to 24-hour staffing, there are nine video surveillance cameras that allow operations staff to monitor

Section 2
Existing Water System
City of Venice Water Supply Master Plan - Phase 2 5710010
2-13
the plant. Water production and distribution employees are supplied with two-way radios and cellular phones to communicate during emergencies.
2.2.4. Distribution System
2.2.4.1. Storage Finished water is stored in a 1-million gallon (MG) covered clearwell (Figure 2-7) prior to being pumped into the distribution system. A 300,000-gallon elevated steel storage tank (Figure 2-9) is also located at the treatment plant. These on-site storage facilities are routinely monitored for chlorine residual and pH and water levels.
Figure 2-7: Covered Clearwell at the City of Venice RO WTP
Figure 2-8: Elevated Storage Tank at the RO WTP

Section 2
Existing Water System
City of Venice Water Supply Master Plan - Phase 2 5710010
2-14
There are two other water storage tanks in the distribution system: a 300,000-gallon steel elevated storage tank at the Chuck Reiter ball field and a 1.5-MG concrete ground storage tank (GST) at the Pinebrook Booster Pump Facility. The Chuck Reiter ball field is located at the intersection of Field and Cooper Streets. This tank provides additional storage for peak demand and fire flow on the island in the western side of the distribution system. The Pinebrook Booster Pump Facility is located at Wellfield Park and includes the 1.5-MG concrete ground storage tank and booster pumping capacity (Figure 2-9). Table 2-9 lists the City of Venice storage volumes, which provide a total of 3.1 MG of finished storage.
Figure 2-9: Pinebrook Facility Ground Storage Tank
Table 2-9: Finished Water Storage
Storage Location Total Volume
(MG) Clear Well at Treatment Plant 1.0 Elevated Tank at Treatment Plant 0.3 Elevated Tank at Chuck Reiter Ball Field 0.3 Booster Pump Station Ground Storage Tank 1.5 Total Storage Capacity 3.1
2.2.4.2. Distribution Pumping Capacity Water is pumped from the on-site 1-MG clearwell to the distribution system using three 250-hp vertical turbine high service pumps that are fitted with VFDs. Typically, the distribution system pressure at the water treatment plant is maintained between 54 and 56 psi. Recently, the City has lowered system pressure to around 52 psi at night to increase elevated storage tank turnover.

Section 2
Existing Water System
City of Venice Water Supply Master Plan - Phase 2 5710010
2-15
The Pinebrook Booster Pump Facility utilizes a 100-hp booster pump and a 50-hp booster pump. A 16-inch (in) water main from the distribution system supplies the Pinebrook Booster Pump Facility. A 16-inch control valve regulates the flow into the Pinebrook storage tank at night, typically at a rate of 500 to 900 gpm. The valve can be opened remotely to allow the tank to fill at a faster rate. The 100-hp pump can also be remotely operated from the RO WTP to pump water from the Pinebrook Storage and Booster Pump Facility to the distribution system in order to boost pressure for peak demand and to maintain fire protection to the northeast portion of the service area. It should be noted that the tank cannot be filled and emptied at the same time.
2.2.4.3. Distribution Piping The distribution system includes approximately 14 miles of raw water mains, 185 miles of potable water mains, about 800 fire hydrants and over 2,400 main line valves. The water distribution system includes piping that dates back to the early 1900’s. The piping network supplies homes, businesses, irrigation meters and fire hydrants throughout the City. Table 2-10 shows the total length of the distribution network piping classified by diameter and type of piping. A map of the distribution piping network is provided in Figure 2-10.
Table 2-10: Potable Water Distribution Pipe
Pipe Material and Approximate Length of Pipe (ft) Pipe Diameter
(inches) AC CI Copper DIP HDPE PVC Unknown TOTAL (feet)
1 10 700 1,500 400 2,600
2 600 1,800 190 600 56,100 19,200 78,500
3 1,700 500 14,600 28,100 44,900
4 9,400 1,300 1,200 300 24,700 91,100 128,000
6 25,400 4,200 2,700 100 143,300 124,600 300,300
8 11,800 3,400 400 100 168,700 42,900 227,300
10 6,700 5,500 2,700 18,300 5,500 38,700
12 4,700 1,200 94,400 42,100 142,400
14 40 1,300 1,300
16 9,600 4,500 2,300 16,400
20 700 700
24 100 40 140
TOTAL (feet) 60,300 16,200 200 19,140 3,100 526,100 356,240 981,200
AC = Asbestos-Cement CI = Cast Iron DIP = Ductile Iron Pipe HDPE = High Density Polyethylene
PVC = Polyvinyl Chloride

ARCADIS-US, INC.CITY OF VENICE200 N WARFIELD AVE, VENICE, FL 34285
WATER MASTER PLAN PHASE 2
WATER MASTER PLAN REPORT
EXISTING DISTRIBUTIONSYSTEM PIPING
3QUT
UT
UT[Ú
[Ú
³
LegendWater Distribution Piping
1-inch
2-inch
3-inch
4-inch
6-inch
8-inch
9-inch
10-inch
12-inch
14-inch
16-inch
20-inch
24-inch
[Ú Pump Stations
UT Storage Tanks
3Q WTP
Existing City Limits
AUGUST 2013
FIGURE 2-10
0 5,000 10,0002,500
Feet
Section 2
Existing Water System
City of Venice Water Supply Master Plan - Phase 2 5710010
2-17
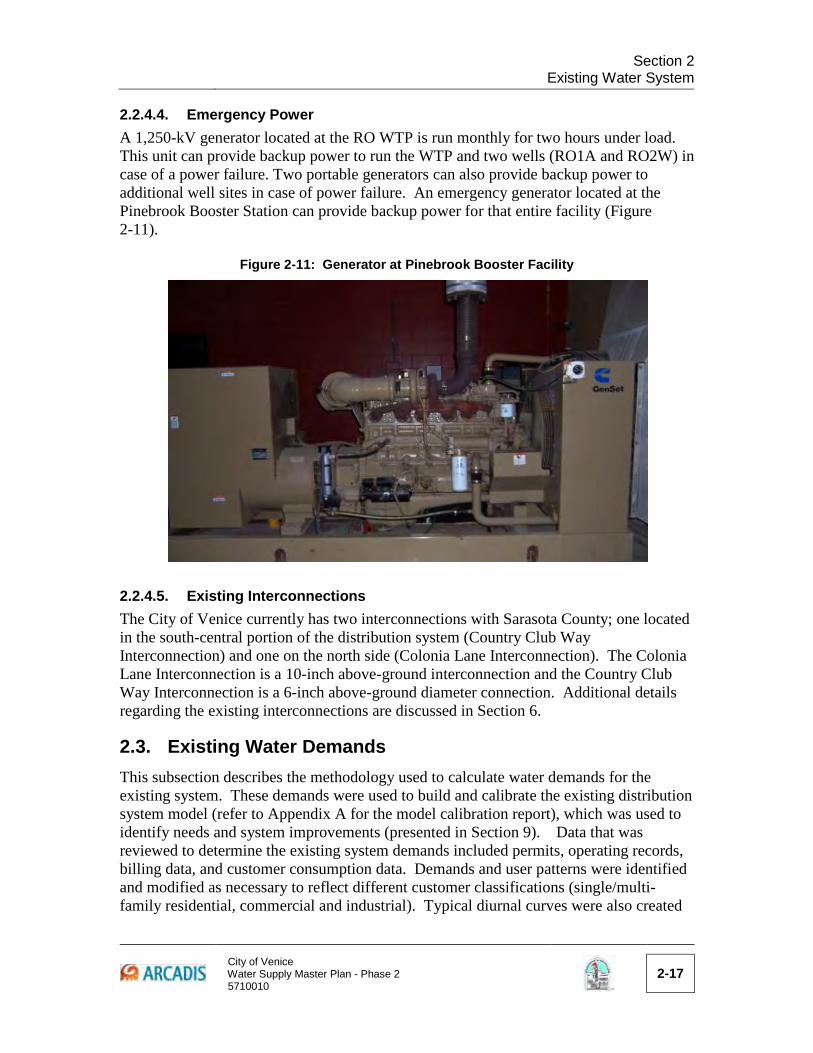
2.2.4.4. Emergency Power A 1,250-kV generator located at the RO WTP is run monthly for two hours under load. This unit can provide backup power to run the WTP and two wells (RO1A and RO2W) in case of a power failure. Two portable generators can also provide backup power to additional well sites in case of power failure. An emergency generator located at the Pinebrook Booster Station can provide backup power for that entire facility (Figure 2-11).
Figure 2-11: Generator at Pinebrook Booster Facility
2.2.4.5. Existing Interconnections The City of Venice currently has two interconnections with Sarasota County; one located in the south-central portion of the distribution system (Country Club Way Interconnection) and one on the north side (Colonia Lane Interconnection). The Colonia Lane Interconnection is a 10-inch above-ground interconnection and the Country Club Way Interconnection is a 6-inch above-ground diameter connection. Additional details regarding the existing interconnections are discussed in Section 6.
2.3. Existing Water Demands This subsection describes the methodology used to calculate water demands for the existing system. These demands were used to build and calibrate the existing distribution system model (refer to Appendix A for the model calibration report), which was used to identify needs and system improvements (presented in Section 9). Data that was reviewed to determine the existing system demands included permits, operating records, billing data, and customer consumption data. Demands and user patterns were identified and modified as necessary to reflect different customer classifications (single/multi-family residential, commercial and industrial). Typical diurnal curves were also created
Section 2
Existing Water System
City of Venice Water Supply Master Plan - Phase 2 5710010
2-18
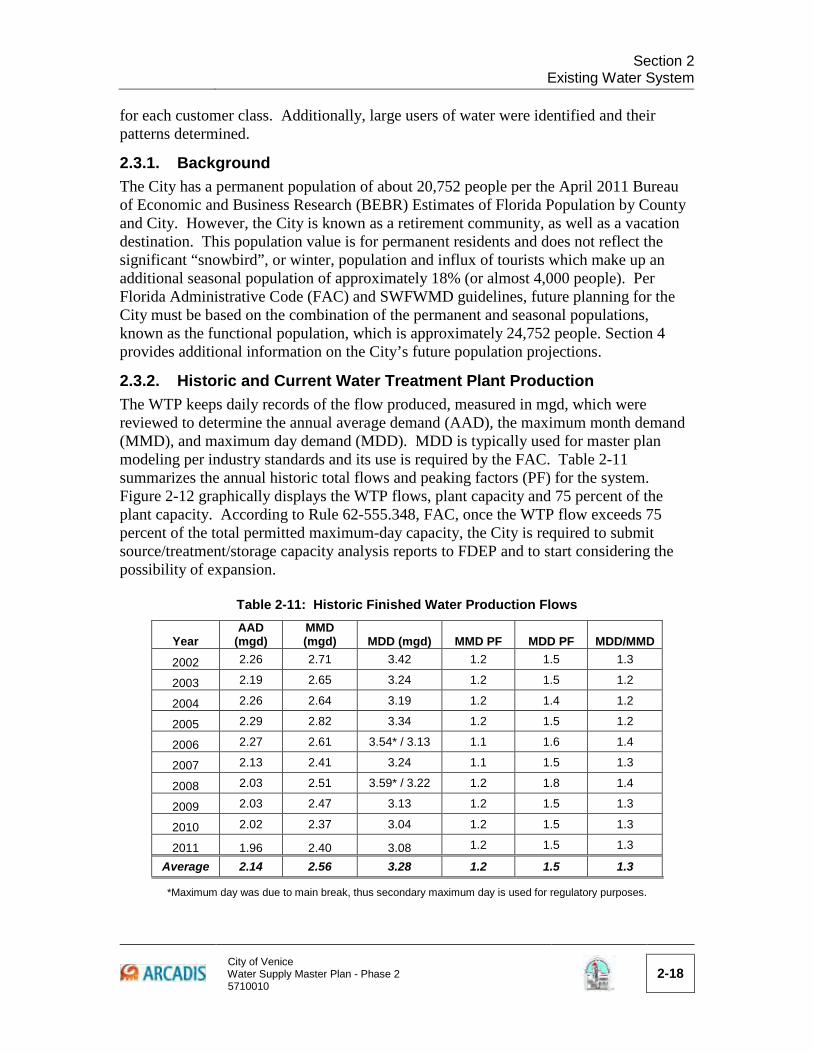
for each customer class. Additionally, large users of water were identified and their patterns determined.
2.3.1. Background The City has a permanent population of about 20,752 people per the April 2011 Bureau of Economic and Business Research (BEBR) Estimates of Florida Population by County and City. However, the City is known as a retirement community, as well as a vacation destination. This population value is for permanent residents and does not reflect the significant “snowbird”, or winter, population and influx of tourists which make up an additional seasonal population of approximately 18% (or almost 4,000 people). Per Florida Administrative Code (FAC) and SWFWMD guidelines, future planning for the City must be based on the combination of the permanent and seasonal populations, known as the functional population, which is approximately 24,752 people. Section 4 provides additional information on the City’s future population projections.
2.3.2. Historic and Current Water Treatment Plant Production The WTP keeps daily records of the flow produced, measured in mgd, which were reviewed to determine the annual average demand (AAD), the maximum month demand (MMD), and maximum day demand (MDD). MDD is typically used for master plan modeling per industry standards and its use is required by the FAC. Table 2-11 summarizes the annual historic total flows and peaking factors (PF) for the system. Figure 2-12 graphically displays the WTP flows, plant capacity and 75 percent of the plant capacity. According to Rule 62-555.348, FAC, once the WTP flow exceeds 75 percent of the total permitted maximum-day capacity, the City is required to submit source/treatment/storage capacity analysis reports to FDEP and to start considering the possibility of expansion.
Table 2-11: Historic Finished Water Production Flows
Year AAD
(mgd) MMD (mgd) MDD (mgd) MMD PF MDD PF MDD/MMD
2002 2.26 2.71 3.42 1.2 1.5 1.3
2003 2.19 2.65 3.24 1.2 1.5 1.2
2004 2.26 2.64 3.19 1.2 1.4 1.2
2005 2.29 2.82 3.34 1.2 1.5 1.2
2006 2.27 2.61 3.54* / 3.13 1.1 1.6 1.4
2007 2.13 2.41 3.24 1.1 1.5 1.3
2008 2.03 2.51 3.59* / 3.22 1.2 1.8 1.4
2009 2.03 2.47 3.13 1.2 1.5 1.3
2010 2.02 2.37 3.04 1.2 1.5 1.3
2011 1.96 2.40 3.08 1.2 1.5 1.3
Average 2.14 2.56 3.28 1.2 1.5 1.3 *Maximum day was due to main break, thus secondary maximum day is used for regulatory purposes.

Section 2
Existing Water System
City of Venice Water Supply Master Plan - Phase 2 5710010
2-19
Figure 2-12: Historic Finished Water Production Flows
2.3.3. Historic Per Capita Demand The historic per capita demand is based on the total production flow of the City’s WTP divided by the annual functional population. Table 2-12 summarizes the City’s population estimates from 2002 to 2011 based on the 2011 Florida City and County Population Report provided by BEBR and the 2010 Census. The City’s historic per capita demands in gallons per capita per day (gpcd) and maximum day peaking factors are summarized in Table 2-13. Figure 2-14 displays the historic per capita demand and shows the decline in per capita demand over time.
0.00
0.50
1.00
1.50
2.00
2.50
3.00
3.50
4.00
4.50
5.00
2000 2001 2002 2003 2004 2005 2006 2007 2008 2009 2010 2011
Fini
shed
Flo
w (m
gd)
Annual Average Maximum Month Maximum Day
Plant Capacity (4.48 mgd)
75% Plant Capacity (3.36 mgd)

Section 2
Existing Water System
City of Venice Water Supply Master Plan - Phase 2 5710010
2-20
Table 2-12: City of Venice Population Estimates
Year City of Venice Resident Population
City of Venice Seasonal Population
City of Venice Functional Population
2002 18,628 3,353 21,981 2003 19,290 3,472 22,762 2004 20,035 3,606 23,641 2005 20,800 3,744 24,544 2006 21,584 3,885 25,469 2007 22,149 3,986 26,136 2008 22,146 3,986 26,132 2009 21,845 3,932 25,777 2010* 20,748 3,735 24,483
2011 20,752 3,895 24,647
* Population provided by the US Census bureau
Table 2-13: City of Venice Historic Water Production Rates and per Capita Demand
Year City of Venice
Functional Population
Production Flows (mgd) Max Day Peaking Factor per Capita Demand (gpcd)
AAD MMD MDD MDD/AAD MDD/MMD AAD MMD MDD
2002 21,981 2.26 2.71 3.42 1.5 1.3 103 123 156
2003 22,762 2.19 2.65 3.24 1.5 1.2 96 117 142
2004 23,641 2.26 2.64 3.19 1.4 1.2 96 111 135
2005 24,544 2.29 2.82 3.34 1.5 1.2 93 115 136
2006 25,469 2.27 2.61 3.13* 1.4 1.2 89 102 123
2007 26,136 2.13 2.41 3.24 1.5 1.3 81 92 124
2008 26,132 2.03 2.51 3.22* 1.6 1.3 78 96 123
2009 25,777 2.03 2.47 3.13 1.5 1.3 79 96 121
2010 24,483 2.03 2.37 3.04 1.5 1.3 83 97 124
2011 24,647 1.96 2.40 3.08 1.6 1.3 79 97 125
10-Year Average 1.5 1.3 88 105 131
5-Year Average (2007 – 2011) 1.5 1.3 80 96 123
* Maximum day was due to main breaks, thus second maximum day data was used for the per capita demand estimates.

Section 2
Existing Water System
City of Venice Water Supply Master Plan - Phase 2 5710010
2-21
Figure 2-13: Historic per Capita Demand
The annual average per capita demand decreased from 88 to 80 gpcd and the max day demand decreased from 134 to 126 gpcd between the 10 and 5-year averages. The decline in demand per capita can mostly be attributed to conservation efforts by the City and its residents. Some of the City’s recent conservation efforts include: n Higher utilization of reclaimed water, which replaces the need for potable water
irrigation in locations where reclaimed water is available;
n SWFMWD-mandated watering restrictions, which were implemented in late 2006 and early 2007 and are still in use year-round;
n The City’s tiered billing rate for potable water, which encourages conservation by
increasing the gallonage charge for high consumption quantities. n Numerous conservation protocols incorporated in the City’s previous and existing
WUPs, ensuring that the conservation efforts will continue in the future. n Rebates offered by the City and other agencies in March of 2012, for low water
appliances and fixtures.
0
20
40
60
80
100
120
140
160
180
2002 2003 2004 2005 2006 2007 2008 2009 2010 2011
Per C
apita
Dem
and
(gpc
d)
Annual Average
Max Month
Max Day

Section 2
Existing Water System
City of Venice Water Supply Master Plan - Phase 2 5710010
2-22
n Measures undertaken by City staff to ensure accuracy in metering of water consumption (i.e. changing all of the residential and commercial potable water meters to AMR, completed in 2012).
2.3.4. Customer Billing Data and Demand Allocation The City classifies customer meters into several service types and class types combinations. There are two service types for potable water - Water (WA) and Irrigation (IR). Within the two service types are three class categories; commercial (CM), multi-unit (MM), and single-family detached residential (RM). Table 2-14 shows the historic water use by classification per the City’s customer billing records, the sum of which represents the entire billable water consumption within the City from 2005 through 2010. Over the past six years, residential consumption averages 64 percent of the total water use.
Table 2-14: City of Venice Potable Water Use Distribution Based on Customer Billing Records
Year Consumption (gallons) Percentage of Total Consumption
Total IR CM MM RM IR CM MM RM 2005 75,148,099 4,792,791 22,324,533 18,573,143 29,457,632 6.4% 29.7% 24.7% 39.2% 2006 74,742,010 5,777,489 22,276,601 18,340,312 28,347,608 7.7% 29.8% 24.5% 37.9% 2007 69,128,630 5,392,366 18,941,219 17,273,510 27,521,535 7.8% 27.4% 25.0% 39.8% 2008 66,769,943 4,218,440 20,749,774 15,490,865 26,310,864 6.3% 31.1% 23.2% 39.4% 2009 64,640,749 3,730,994 18,616,090 15,745,321 26,548,344 5.8% 28.8% 24.4% 41.1% 2010 64,719,069 4,152,715 19,050,669 15,227,478 26,288,207 6.4% 29.4% 23.5% 40.6%
Minimum 5.8% 27.4% 23.2% 37.9%
Average 6.6% 29.4% 24.2% 39.7%
Maximum 7.8% 31.1% 25.0% 41.1%
The City reads and records customer billing data on a monthly basis. The date and the total volume consumed, measured in gallons, are recorded for each reading. Using that information, a monthly average demand can be calculated. Figure 2-14 shows the average monthly demand based on customer billing data and illustrates that the maximum monthly demands occur in March while the irrigation demand remains fairly constant throughout the year.

Section 2
Existing Water System
City of Venice Water Supply Master Plan - Phase 2 5710010
2-23
Figure 2-14: Customer Water Meter Data
The increase in demand in February, March, and April is attributed to “snowbird” residency and increased tourism for spring break. It is assumed that a larger percentage of the system is active during the month of March due to the increased population. Therefore, the meter data for March 2010 was used as the basis for distribution system model demand allocation. A peaking factor (PF) of 1.3, per Table 2-11, was applied to the MMD demand to simulate the MDD scenario.
2.3.5. Large Users Typically, a large user is considered a customer that consumes more than 100 gpm, and since these users are typically much larger than the normal customer, they have the potential to significantly impact the system. Often a diurnal pattern specific to these users is provided to better mimic their impact on the distribution system. None of the current customers within the City consume near 100 gpm, however it is important to understand the top consumers. Table 2-15 summarizes the users within the City’s service area consuming more than 7.0 gpm per the 2009 and 2010 customer billing data.
0
500,000
1,000,000
1,500,000
2,000,000
2,500,000
3,000,000
May
-…
Jun-
09
Jul-0
9
Aug-
09
Sep-
09
Oct
-09
Nov
-09
Dec-
09
Jan-
10
Feb-
10
Mar
-10
Apr-
10
May
-…
Jun-
10
Jul-1
0
Aug-
10
Sep-
10
Oct
-10
Mon
thly
Flo
w (g
pd)
IR TotalWA TotalTotal

Section 2
Existing Water System
City of Venice Water Supply Master Plan - Phase 2 5710010
2-24
Table 2-15: Users Consuming More Than 7.0 gpm
Facility Address Rate Class
Demand (gpm)
City of Venice Utilities Department 200 N Warfield Ave CM 62.61 Bird Bay Condo * Bird Bay Wy MM 51.38 Venice Regional Medical Center * 540 The Rialto CM 39.35
- 37.77 gpm from one meter at VRMC - - - Mobile Home – Country Club Estates 700 N Waterway MM 31.01 Sunrise Senior Living * Aston Gardens & Ibis Wy CM / MM 21.44 Mobile Home Community – Ridgewood 449 Ixora Cr MM 19.02 The Venetian at Capri Isles (residential) * 1050 Capri Isles CM / MM 14.22 Bahia Vista Gulf (residential) * MM 12.92 PGT Industries * Technology Dr CM 12.74 Harbour Chase of Venice / Marriot Retirement Community 950 Pinebrook Rd CM 12.71 Pinebrook Rehabilitation & Nursing Center 1240 Pinebrook Rd CM 12.69 Holiday House - Hotel 455 N US 41 Bypass CM 11.82 Southwest Florida Retirement Home* 910 S. Tamiami Tr CM 11.82 Sarasota School Board * Venice High School CM 11.44 Bella Costa (residential) * 200 Santa Maria St MM 10.94 Southwest FL Retirement Center * 950 S. Tamiami Tr MM 9.8 Aldea Mar Retreats - Vacation rentals 500 S Park Blvd MM 9.7 Heritage Healthcare (nursing home) * 1026 Albee Farm CM 8.54 Estancias of Capri (residential) * Avenida Estancia CM / MM 8.45 Southwest Florida Retirement – Village on the Isles 930 S Tamiami Tr CM 8.05 Aston Gardens At Pelican Pointe - Independent Living 7000 Aston Gardens Dr MM 8.02 Colonial Manor Park (residential) 1200 Ridgewood Ave MM 7.8 MacArthur Beach (residential) * 704 Golden Beach Blvd MM 7.74 Manor Care of Boynton Beach (assisted living) 1450 E Venice Ave CM 7.66 Hampton Inn & Suites - Heartland Venice Properties Venetia Bay CM 7.66 Valencia Residences (residential) * 629 Alhambra Rd MM 7.61 KMB Financial Group * 1000 Knights Tr CM 7.51
* User has more than 1 meter contributing to the total demand consumed.
2.3.5.1. Eliminated or Reduced Demands During meetings with City Utilities Staff, it was determined that the demand for the City of Venice Utilities Department connection should be reduced in the future and the demand for the Holiday House Hotel be eliminated. The demand for the City of Venice Utilities Department connection was mainly due to the demand of the carbon dioxide injector at the WTP, which has been turned off/made inactive. The Holiday House Hotel burned down after the March 2010 meter reading and was not consuming water during the calibration period; however, plans for a new hotel at the location are underway. Therefore, the demand has been added back as part of the future system analysis (see Section 4.0 for future demand projections).

Section 2
Existing Water System
City of Venice Water Supply Master Plan - Phase 2 5710010
2-25
2.3.5.2. Venice Regional Medical Center The medical center acquires potable water from a large onsite storage tank, which is filled by the City’s distribution system with an 8-inch meter. The tank is filled based on the level within the tank and does not follow the typical residential or commercial diurnal pattern. This demand was modeled as a fixed demand pattern.
2.3.5.3. Other Large Uses The remaining users include mobile home communities, assisted living, retirement and independent living facilities, and a vacation rental compound. These users generally use water in the same pattern as a typical residence within the City, and the modeling assumes the same residential diurnal pattern as the rest of the system.
2.3.6. Demand Patterns and Diurnal Demand Multiplier
2.3.6.1. Residential/Commercial The customer billing data provided a basis to calculate a daily demand (base demand) per user. However, the demand for each user varies throughout the day. Diurnal demand patterns and peaking factors are used to adjust the base demands to match the actual hourly demand per user. These patterns consist of a series of multipliers that are applied to the base demand at each time increment (one hour, in this case). Diurnal demand patterns are calculated through a water balance at each time increment:
Water into System - Water stored = Water used (from pumps) (in tanks) (demand)
The diurnal demand pattern multiplier for each time increment is the ratio of water used during the time increment to the average usage for all time increments. The base demands must also be scaled to reflect the actual usage during the calibration period with a peaking factor. The peaking factor is the ratio of average demand during the calibration time to average base demand. Therefore the demand calculated by the model at each node is: Demand for each time
increment = Base
demand x Peaking
factor x Diurnal multiplier for the
time increment The diurnal demand patterns for both the average weekday and weekend days are illustrated in Figure 2-15. This pattern was used for both residential and commercial customers.

Section 2
Existing Water System
City of Venice Water Supply Master Plan - Phase 2 5710010
2-26
Figure 2-15: Residential and Commercial Diurnal Demand Patterns
2.3.6.2. Irrigation As conservation measures, the SWFWMD and the City manage the time allowed for lawn irrigation using potable water by restricting the day and time residents are allowed to water. The day of the week on which a resident is allowed to water depends upon the address of the residence; however, the time of day a resident can water is the same regardless of the day. Residents are limited to water between 7 pm and 7 am. Since customer meter data is collected on a monthly basis, it is impossible to determine the exact diurnal pattern for irrigation. Therefore, a pattern which limits the demands to between 7 pm and 7 am, but still allows for the full daily demand to be consumed, was created. Figure 2-16 shows the diurnal pattern for IR meters.
0.00
0.20
0.40
0.60
0.80
1.00
1.20
1.40
1.60
1.80
0:00
1:00
2:00
3:00
4:00
5:00
6:00
7:00
8:00
9:00
10:0
0
11:0
0
12:0
0
13:0
0
14:0
0
15:0
0
16:0
0
17:0
0
18:0
0
19:0
0
20:0
0
21:0
0
22:0
0
23:0
0
Dem
and
Mul
tiplie
r
Time
Weekday Average
Weekend Average

Section 2
Existing Water System
City of Venice Water Supply Master Plan - Phase 2 5710010
2-27
Figure 2-16: Irrigation Diurnal Demand Patterns
The existing demands discussed in the above subsections were used to evaluate and identify needs and improvements for the existing distribution system. The distribution system assessment is presented in Section 9.

City of Venice Water Supply Master Plan - Phase 2 5710010
3-1
3
3. Regulatory Assessment
3.1. Introduction This Section reviews and evaluates the regulatory issues affecting water planning for the City of Venice for the current and future planning period, and provides the City with an understanding of local, State, Federal, and regional regulatory requirements and trends that will influence the strategic decision making during the planning period.
3.2. Regulatory Organizational Structure The City of Venice is a public municipality and as such is regulated by a number of regulatory agencies. Table 3-1 summarizes the agencies that enact and enforce the regulations for the City’s water system which is inclusive of the raw water supply, water treatment, and potable water distribution.
Table 3-1: Regulatory Agencies
Level Name / Area of Regulatory Impact
Acronyms Agency Responsibilities
Federal United States Environmental Protection Agency - Regulates entire water
system
USEPA · Administers Clean Water Act nationally · Oversees Safe Drinking Water Act
nationally
State Florida Department of Environmental Protection - Regulates entire water
system
FDEP
· Administers drinking water quality regulations
· Regulates public water supplies and systems
· Manages all six FDEP regions · Supervises all five Water Management
Districts · Manages surface/groundwater
monitoring/protection · Conducts water resource planning · Directs drinking water quality regulation · Manages Source Water Assessment
Program · Administers the National Pollutant
Elimination Discharge Elimination System (NPDES) program

Section 3
Regulatory Assessment
City of Venice Water Supply Master Plan - Phase 2 5710010
3-2
Level Name / Area of Regulatory Impact
Acronyms Agency Responsibilities
Regional Southwest Florida Water Management District - Regulates Water Supply
SWFWMD · Oversees local Environmental Resource/Water Use/Well Construction Permitting
· Locally administers Surface Water/Groundwater Monitoring/Protection
· Conducts Regional Water Supply Planning and Resource Regulations
Regional Sarasota County Health Department - Regulates Water Quality - Regulates Treatment Plant
and Distribution Operations
SCHD · SCHD is one of six health departments recognized as an FDEP Approved County Health Department and assumes the responsibilities of FDEP for permitting and compliance and surveillance within Sarasota County
· Locally enforces Safe Drinking Water Act · Reviews applications and issues permits
for construction of potable water systems and clearance certification
The City’s public water system is governed nationally by the USEPA and locally by FDEP, which has given regulatory rights within Sarasota County to SCHD and SWFWMD. SCHD governs and regulates water treatment and water distribution system water quality. SWFWMD governs and regulates the City’s water supply including well construction and monitoring.
3.3. Regulations The Safe Drinking Water Act (SDWA) was passed by Congress in 1974 to protect public health by regulating the nation’s public drinking water supply. It was promulgated at the federal level in 1976, with requirements for reauthorization every 10 years. In both 1986 and 1996, amendments were made to the SDWA in response to increased concerns for the public regarding the safety and quality of its drinking water. USEPA is responsible for creating national water regulations under the SDWA. The individual states are responsible for adopting regulations that meet or exceed those adopted by USEPA. If a state does not adopt regulations acceptable to USEPA, USEPA can implement regulations for that particular state. All of the current national regulations have been adopted and are regulated in the Florida Statutes with the exception of the “Stage 2 Disinfectant and Disinfection Byproduct Rule” (DBPR). Florida has recently adopted the final Stage 2 DBPR rules, which will go into effect for the City in October, 2013. Table 3-2 summarizes the national and state regulations which apply to the City’s water system. The state regulations are those which truly govern the City’s water system. For regulatory purposes, the City’s water system is classified as a “community water system” (CWS) as it serves over 15 service connections used by year-round residents. Additionally, the City’s water source is ground water which is not under the influence of surface water.

Section 3
Regulatory Assessment
City of Venice Water Supply Master Plan - Phase 2 5710010
3-3
Table 3-2: Summary of Regulations Governing the City of Venice
Regulation Agency Responsible
Statute
National Regulations Safe Drinking Water Act USEPA
National Primary Drinking Water Regulations - Covered under FAC 62-550.310(1)&(4) Table 1, 4 &
5
USEPA
National Secondary Drinking Water Regulations - Covered under FAC 62-550.320 Table 6
USEPA
Arsenic Rule - Covered under FAC 62-550.310(1)(c)
USEPA 66 FR 6976
Lead and Copper Rule - Cover under FAC 62-550.800
USEPA 56 FR 26460-26564
Radionuclides Rule - Covered under FAC 62-550.310(6)
USEPA 66 FR 76708
Groundwater Rule - Covered under FAC 62-520 & 522
USEPA 65 FR 30194
Stage 1 Disinfectant and Disinfection Byproduct Rule - Covered under FAC 62-550.310 Table 2 & 3
USEPA 63 FR 69390 – 69476
Stage 2 Disinfectant and Disinfection Byproduct Rule - FDEP is not managing this requirement
USEPA 71 FR 388
Total Coliform Rule (1989) - New 2010 Proposed Changes which go into effect
August, 2012 - Covered in FAC 62-550.310(5)
USEPA 54 FR 27544-27568
Consumer Confidence Reports - Covered under FAC 62-550.824
USEPA 63 FR 44511
Public Notification - Covered under FAC 62-560
USEPA 65 FR 25982
Clean Water Act USEPA National Pollutant Discharge Elimination System § Covered under FAC 62-621
USEPA Title IV, Section 402
State – Source Water Regulations Source Water Assessment and Protection Programs (SWAPP) USPEA / FDEP
Consumptive Use of Water SWFWMD FAC 40D-2
Water Conservation Legislation SWFWMD Chapter 373 Florida Statutes
Regulation of Wells SWFWMD FAC 40D-3
Water Shortage Plan SWFWMD FAC 40D-21
Year-Round Water Conservation Measures SWFWMD FAC 40D-22

Section 3
Regulatory Assessment
City of Venice Water Supply Master Plan - Phase 2 5710010
3-4
Regulation Agency Responsible
Statute
Wellhead Protection SWFMWD FAC 62-521
Water Well Permitting and Construction Requirements SWFMWD FAC 62-532
State – Water Quality Regulations Drinking Water Standards, Monitoring and Reporting SCHD / FDEP FAC 62-550
- Inorganic Contaminants FAC 62-550.310(1) Table 1 FAC 62-550.513
- Disinfectant Residuals FAC 62-550.310(2) Table 2 FAC 62-550.514
- Disinfectant Byproducts FAC 62-550.310(3) Table 3 FAC 62-550.514
- Organics (Volatile Organic Concentrations (VOC) & Synthetic Organic Chemicals (SOC)
FAC 62-550.310(4) Table 4 & 5 FAC 62-550.515 & 516
- Microbiological Contaminants FAC 62-550.310(5) FAC 62-550.518
- Radionuclides FAC 62-550.310(6) FAC 62-550.519
- Secondary Drinking Water Standards FAC 62-550.320 FAC 62-550.520
- Asbestos Monitoring FAC 62-550.511
- Nitrate and Nitrite Monitoring FAC 65-550.512
- Lead and Copper Rule (LCR) FAC 62-550.800
- Consumer Confidence Reports FAC 62-550.824
Other Regulations Permitting, Construction, Operation and Maintenance of Public Water Systems SCHD / FDEP FAC 62-555
Disposal Regulations SCHD / FDEP 403.0882
Backflow Prevention/Cross-Connection Control Program SCHD / FDEP
Public Notification SCHD / FDEP FAC 62-560
Interconnection SCHD / FDEP 62-555.350
3.3.1. Source Water Regulations This section describes a few of the source water regulations governing the City. The City’s existing Water Use Permit (WUP), which does not expire until December 16, 2028, contains many of these source water requirements. The WUP is enclosed as Appendix B.

Section 3
Regulatory Assessment
City of Venice Water Supply Master Plan - Phase 2 5710010
3-5
3.3.1.1. Source Water Assessment and Protection Programs n Implementation Date: August 6, 1997
n Regulatory Statutes: Safe Drinking Water Act (1996 Amendment)
The SDWA requires that FDEP develop a USEPA-approved program to carry out assessments of all source waters in the state. A source water assessment is a study that defines the land area contributing water to each public water system, identifies the major potential sources of contamination that could affect the drinking water supply, and then determines how susceptible the public water supply is to this potential contamination. Public utilities and citizens can then use the publicly available study results to take actions to reduce potential sources of contamination and to protect drinking water. In 2011, FDEP completed a source water assessment and protection program (SWAPP) for the City’s water system and identified 44 unique potential sources of contamination. None of the potential sources of contamination identified for this system were categorized as a “high” susceptibility level source. There were a number of potential sources, primarily petroleum storage tanks, with a “moderate” susceptibility level, and four industrial wastewater sources with a “low” susceptibility level. The assessment results are available on the FDEP SWAPP website at www.dep.state.fl.us/swapp and are included as Appendix C.
3.3.1.2. Water Use Permit n Implementation Date: 1961
n Regulatory Statutes: FAC 40D-2
The SWFWMD was established in 1961 as a flood protection agency. Since then, its responsibilities have grown to include managing the water supply, protecting water quality and preserving natural systems that serve important water-related functions. Ensuring adequate water supplies for people, animals and the environment is central to SWFWMD’s mission. The SWFWMD issues water use permits to ensure withdrawals from water bodies will not harm existing users, the water resources or the environment. The SWFWMD also contributes funding and technical expertise to local governments for programs that conserve water and develop alternative water supplies. A WUP is a state license to use the ground or surface water natural resources. Specific and general conditions for the City’s water supply are outlined in the City’s WUP which is enclosed as Appendix B. The following is a list of the General and Specific Conditions titles included in the WUP.

Section 3
Regulatory Assessment
City of Venice Water Supply Master Plan - Phase 2 5710010
3-6
General Conditions:
§ Permitted Annual Average Flow (6,864,000 gallons per day (gpd))
§ Permitted Peak Month Flow (8,240,000 gpd)
§ Per Capita Water Demand and Type of Water Demand
§ Water Conservation Reports § Projected Reclaimed Water Use
Specific Conditions: § Submission of Reports § Metering and Pumpage Reporting § Water Quality Sampling at
Production Wells § Capping of Wells § Production Well Construction § Concentration Limits § Compliance with Permitted
Quantities § Compliance with Southern Water
Use Caution Area (SWUCA) Recovery Strategy
§ Per Capita Annual Report
§ Reuse Supplier Annual Report § Annual Billing and Meter Reading
Report § Service Area Map § Water Conservation Rate Structure § Wellfield Management Plan § Water Conservation Report § Wellfield Rotation § Domestic Monitor Well
Monitoring Network § Water Level Monitoring § Water Quality Sampling at
Monitor Wells § Water Quality Sampling During
Well Drilling § Production Well Water Quality
Report § Chloride Concentration Trigger
and Guidance Levels § Treatment Efficiency § Wellfield Annual Report § Five-Year Compliance Reports
3.3.1.3. Water Conservation Legislation n Implementation Date: 2003
n Regulatory Statutes: Chapter 373 Florida Statutes; Rule 40D-22
The SWFWMD has been mandated by the Florida Legislature, via FDEP, to create and implement water conservation regulations. In 2003, SWFWMD proposed updates to Rule 40D-22 (mandatory year-round conservation measures) went into effect. The updates were put in place to ensure that water conservation is a part of everyday life and not practiced only during a severe drought. The SWFWMD uses several ways to encourage the use of water conservation measures by utilities and the general public. For example, the SWFWMD includes conservation measures as part of the City’s WUP to induce utilities to adopt the conservation measures. Similarly, the SWFWMD uses irrigation watering restrictions and fines to compel the public to adopt conservation measures. The SWFWMD also uses financial incentives to encourage the use of water conservation measures. The SWFWMD can enact the water shortage plan during low water supply periods in addition to year-round conservation measures.

Section 3
Regulatory Assessment
City of Venice Water Supply Master Plan - Phase 2 5710010
3-7
The City’s WUP contains a requirement for the development of a report (by January 15th, 2019) addressing the feasibility of implementing several water conservation measures:
§ General Conservation Measures – Public education and awareness; alternative sources programs such as, but not limited to, reclaimed water, stormwater runoff, etc.; comprehensive plan goals, objectives, and/or policies; adoption and enforcement of water restrictions; building codes and/or ordinances promoting conservation; and water audits.
§ Indoor Conservation Measures – Residential water conserving retrofit kits which may include showerheads, toilet tank devices, leak detection programs, faucet aerators, installation instructions, and rebate programs.
§ Outdoor Conservation Measures – Irrigation audits or evaluations of significant irrigation water users, water-efficient landscape and xeriscape ordinances and rebate programs; automatic irrigation system shut-off device ordinance; and rebate programs.
Additionally, the City’s WUP encourages the City to “demonstrate that beneficial reuse of treated effluent is maximized so that 50% or more of the total annual treated effluent flow is beneficially reused. The calculation of the percentage beneficially reused will be based on the Permittee's wastewater treatment plants that have a capacity of 0.5 million gallons per day or greater. Beneficial reuse includes:
§ Landscape irrigation of golf courses, playing fields, cemeteries, parks, playgrounds, school yards, retail nurseries and commercial, industrial and residential properties.
§ Agricultural irrigation of food, fiber, fodder and seed crops, wholesale nurseries, "cut flowers," sod farms and improved pastures.
§ Groundwater recharge where such recharge results in environmental or water supply benefit.
§ Industrial uses for cooling water, process water and wash waters. § Wetlands restoration. § Fire protection. § Environmental enhancement, including discharges to surface waters to replace
withdrawals. § Other useful purposes.
3.3.1.4. Wellhead Protection Rule n Implementation Date: August 18, 1998
n Regulatory Statutes: FAC 62-521; Sarasota County Ordinance 92-079
The Wellhead Protection Program is a pollution prevention and management program used to protect underground based sources of drinking water. The federal SDWA, as

Section 3
Regulatory Assessment
City of Venice Water Supply Master Plan - Phase 2 5710010
3-8
amended in 1986, established a program for the States to delineate and manage Wellhead Protection Areas (WHPAs) for protection of ground water supplies from contamination. A Wellhead Protection Area is defined as the surface and subsurface area surrounding a public water supply well, through which contaminants are reasonably likely to move toward and reach the well. On August 18, 1998, USEPA approved Florida’s Wellhead Protection Program. The Florida Wellhead Protection Program coordinates and builds on existing programs and rules that protect Florida’s ground water resources. The program also enables local governments to expand on these rules by implementing their own strategies for protecting drinking water wells. The FDEP Wellhead Protection program incorporates the Wellhead Protection rule, Chapter 62-521, FAC., and the ground water protection measures administered by the FDEP regulatory programs. The Wellhead Protection Rule establishes a 500-foot radius circular Wellhead Protection Area around all wells which serve community and non-transient non-community public water systems. The rule prohibits certain new installations from locating in wellhead protection areas, and specifies additional performance standards for other new installations and activities. FDEP regulatory programs also implement specific performance, permitting, and monitoring criteria designed to protect ground water on a statewide basis. Sarasota County Ordinance 92-079, the “Wellhead Protection Ordinance,” also provides criteria for delineating wellhead protection areas; defines restrictions, including prohibition and regulation of certain substances, activities and facilities in wellhead protection areas; and establishes permitting requirements, compliance review inspections and enforcement procedures.
3.3.2. Water Quality Regulations – Water Treatment and Distribution System n Implementation Date: September 18, 2007
n Regulatory Statutes: FAC 62-550
FDEP primary drinking water regulations are based on the National Primary Drinking Water Regulations (40 CFR 141) and are codified in Section 65-550 of the Florida Administrative Code (FAC). The Sarasota County Health Department was delegated to enforce the SDWA and FAC water quality regulations within Sarasota County. The primary standards protect public health by limiting the levels of contaminants in drinking water. For regulatory purposes, the City is considered a large groundwater system, serving more than 10,000 people. The City’s current resident population is estimated to be 20,752 people and the 2030 projected resident population is 25,431 people. This determination affects the City’s regulatory requirements, including compliance dates, monitoring and reporting requirements.

Section 3
Regulatory Assessment
City of Venice Water Supply Master Plan - Phase 2 5710010
3-9
FDEP implemented a nine-year compliance cycle beginning January 1, 2002 and January 1, 2011, and every nine years thereafter. Each compliance cycle is broken down into three three-year compliance periods. For example the three compliance periods that make up the 2002 through 2010 compliance cycle begin January 1, 2002, January 1, 2005 and January 1, 2008. Monitoring frequencies are described with regards to the compliance cycle and periods. The City samples for all of the regulated contaminants at the beginning of the compliance period. Only contaminants detected in the samples are reported. The City’s sampling results can be found at: http://www.dep.state.fl.us/water/drinkingwater/chemdata.htm
3.3.2.1. Inorganic Chemicals Inorganic chemicals are required to be monitored at the entry point to the distribution system. Monitoring of the inorganic chemicals is required the first year of each compliance period for groundwater sources. Constituents such as nitrate, nitrite and asbestos have different monitoring schedules. Asbestos is required to be measured during the first year of each compliance cycle (once every nine years) unless the system is vulnerable to asbestos contamination. Nitrates and nitrites are required to be measured annually. The regulated inorganic chemical compounds and their respective State of Florida maximum contaminate levels (MCLs) are listed in Table 3-3.
Table 3-3: Primary Inorganic MCL Standards
Inorganic Chemicals Florida State MCL (mg/L) Antimony 0.006 Arsenic 0.010 Asbestos 7 MFL* Barium 2 Beryllium 0.004 Cadmium 0.005 Chromium 0.1 Cyanide (as free cyanide) 0.2 Fluoride 4.0 Lead 0.015 Mercury 0.002 Nickel 0.1 Nitrate 10 (as N) Nitrite 1 (as N) Total Nitrate and Nitrate 10 (as N) Selenium 0.05 Sodium 160 Thallium 0.002
*MFL = million fibers per liter greater than 10 microns

Section 3
Regulatory Assessment
City of Venice Water Supply Master Plan - Phase 2 5710010
3-10
The detected inorganic chemicals issued in the 2011 Annual Drinking Water Quality Report for the City are shown in Table 3-4. The remaining inorganic chemicals were not detected in the distribution system.
Table 3-4: Inorganic Chemical Concentrations in Distribution System (2010)
Contaminant Detected Level (ppm) MCL Violation (Yes/No) Mercury 0.0003 No
Fluoride 0.13 No Selenium 0.002 No
Sodium 27.8 No Arsenic Rule.
n Implementation Date: January 1, 2005
n Regulatory Statutes: FAC 62-550
In accordance with State regulations, the maximum contaminant level for arsenic is 10 µg/L per FAC 62-550.310.(1).(a). Systems in violation of the MCL are required to increase sampling from one sample per compliance period to one sample quarterly until the sample is reliably and consistently below the MCL. Violations would also require the City to include a statement on the health effects of arsenic in their annual Consumer Confidence Reports (CCR, a.k.a. the annual water quality report). The latest sampling for arsenic in the City’s distribution system was below detectable limits. Asbestos Monitoring Requirements.
n Implementation Date: September 18, 2007
n Regulatory Statutes: FAC 62-550
In accordance with State regulations, the maximum contaminant level for asbestos is 7 MFL per FAC 62-550.310.(1).(a). Each community water system that is susceptible to asbestos contamination (e.g., source water contaminated by asbestos or use of asbestos-cement pipe within the distribution system) shall monitor for asbestos. A system susceptible to asbestos contamination due solely to corrosion of asbestos-cement pipe shall take one sample at a tap served by asbestos-cement pipe and under conditions where asbestos contamination is mostly likely to occur. The City’s distribution system contains several miles of asbestos-cement pipe. During the year the City is scheduled to monitor for asbestos, the City sends SCHD an asbestos sampling plan detailing the location and the conditions under which the sample is to be taken. The last asbestos sample collected by the City was below the MCL for asbestos.

Section 3
Regulatory Assessment
City of Venice Water Supply Master Plan - Phase 2 5710010
3-11
3.3.2.2. Disinfectant Residuals and Disinfection By-products Stage 1 Disinfectants and Disinfection Byproducts Rule.
n Implementation Date: January 1, 2002
n Regulatory Statutes: FAC 62-550
The Stage 1 Disinfectants and Disinfection Byproducts Rule (DBPR) establishes MCLs, Maximum Contaminant Level Goals (MCLGs), Maximum Residual Disinfectant Levels (MRDLs) and Maximum Residual Disinfectant Level Goals (MRDLGs) for chemical disinfectants and the concentrations of disinfection byproducts (DBPs) in finished water and in drinking water distribution systems. Although the Stage 1 DBPR includes MCLs for both bromate and chlorite, these contaminants are generally only a concern in those systems that utilize ozone or chlorine dioxide, respectively, for primary disinfection. The primary water quality challenge facing the City is the control of two groups of disinfection byproducts: total trihalomethanes (TTHMs) and the sum of five haloacetic acid species (HAA5). DBPs, such as TTHM and HAA5, are regulated as shown in Table 3-5. Table 3-5 also presents MRDLs and MRDLGs for several disinfectants.
Table 3-5: Stage 1 DBPR Summary
MRDL MRDLG MCL MCLG Disinfectants Chlorine (mg/L as Cl2) 4.0 4.0 Chloramines (mg/L as Cl2) 4.0 4.0 Chlorine Dioxide (as ClO2) 0.8 0.8
Disinfection Byproducts TTHM1 (µg/L) 80 HAA52 (µg/L) 60 Bromate (µg/L) 10 0 Chlorite (mg/L) 1.0 0.8 1. Total trihalomethanes is the sum of the concentrations of chloroform, bromodichloromethane,
dibromochloromethane, and bromoform. 2. Haloacetic acids (five) is the sum of the concentrations of mono-, di-, and trichloroacetic acids and mono- and
dibromoacetic acids. Compliance with the TTHM and HAA5 MCLs are based on the running annual average (RAA) of quarterly averages of all samples taken in the distribution system. The City is eligible for reduced monitoring because all the samples during the initial compliance period were below the MCL. Therefore, the City is only required to collect one sample per treatment plant per year, for both TTHM and HAA5, at the maximum residence time location in the distribution system. TTHM and HAA5 samples must be collected at the same time and location in the distribution system unless otherwise approved by FDEP.

Section 3
Regulatory Assessment
City of Venice Water Supply Master Plan - Phase 2 5710010
3-12
The reported Chlorine, TTHM and HAA5 RAAs at the City for 2011 are summarized in Table 3-6.
Table 3-6: Stage 1 DBPR Results (2011)
2011 Level Detected MCL or MRDL Violation (Yes/No)
Chlorine (mg/L as Cl2) 1.46 No TTHM1 (µg/L) 11.0 No HAA52 (µg/L) 2.5 No
Stage 2 Disinfectants and Disinfection Byproducts Rule.
n Implementation Date: January 1, 2013
n Regulatory Statutes: FAC 62-550
The Stage 2 DBPR, which is in the process of being adopted by the FDEP, increases the compliance challenge facing most drinking water utilities. Although the Stage 2 DBPR does not change any of the previous MCLs, it does change the manner in which compliance with the TTHM and HAA5 standards is determined. Under the Stage 1 DBPR, compliance with the TTHM and HAA5 MCLs was determined based on a system-wide RAA of all DBP monitoring results. Under the Stage 2 DBPR, compliance is based on a locational running annual average (LRAA) in which the average concentration at each compliance monitoring location must be less than the MCL. This approach is intended to provide more equitable water quality to a utility’s customers relative to DBPs regardless of where they live in the distribution system. Again, the MCLs for TTHM and HAA5 will remain 80 ug/L and 60 ug/L, respectively, under the Stage 2 DBPR. Under the Stage 1 DBPR reduced monitoring, the City has been required to monitor at only one maximum residence time location in the distribution system for TTHM and HAA5. Under the Stage 2 DBPR, the number of monitoring locations depends on the service area population. Table 3-7 summarizes the number of monitoring locations required for groundwater systems. Based on the table the City will be required to monitor four locations on a quarterly basis.
Table 3-7: Stage 2 DBPR Monitoring Location Requirements for Groundwater Systems
Population Size Category Monitoring Frequency Total Distribution System Monitoring Locations per
Monitoring Period < 500 Per Year 2
500 – 9,999 Per Year 2
10,000 – 99,999 Per Quarter 4
100,000 – 499,999 Per Quarter 6
> 500,000 Per Quarter 8

Section 3
Regulatory Assessment
City of Venice Water Supply Master Plan - Phase 2 5710010
3-13
The additional Stage 2 DBPR compliance monitoring locations can be selected during an Initial Distribution System Evaluation (IDSE). The IDSE is intended to be used to select new compliance monitoring sites that more accurately reflect sites representing high TTHM and HAA5 levels. However, the City was approved for the 40/30 Certification option for the IDSE. Under this approach the City certified to FDEP that all of its compliance monitoring results for the previous two years were less than 40 µg/L and 30 µg/L for TTHM and HAA5, respectively. The Stage 2 rule also includes operational evaluation requirements. Operational evaluation levels (OELs) must be calculated each sampling period using the Stage 2 compliance monitoring results. If the TTHM or HAA5 OEL exceeds the Stage 2 MCL of 80 ug/L or 60 ug/L, respectively, an operational evaluation must be conducted to identify how the excursion(s) can be reduced. This evaluation must include the raw water supply, water treatment facilities, and the distribution system. OELs for each Stage 2 monitoring site area calculated as follows:
OEL = (Q1 + Q2 + 2Q3)/4
Where:
Q1 = Quarter before the previous quarter measurement Q2 = Previous quarter measurement Q3 = Current quarter measurement The City submitted a Stage 2 DBPR Compliance Monitoring Plan including the locations of four compliance monitoring locations (the current Stage 1 DBPR monitoring location plus three additional locations), and a compliance monitoring plan to FDEP. FDEP accepted the City’s monitoring locations and plan. The City must begin Stage 2 DBPR compliance monitoring on October 1, 2013.
3.3.2.3. Volatile Organic Chemicals The presence of volatile organic chemicals (VOCs) is generally a sign of industrial contamination. Four consecutive quarterly samples for VOC are required every three years for groundwater sources. When VOCs are detected above 0.0005 mg/L, more frequent monitoring is required. The VOCs regulated by the State of Florida as well as their respective State MCLs are listed in Table 3-8. There are no VOCs detected in the City’s distribution system.

Section 3
Regulatory Assessment
City of Venice Water Supply Master Plan - Phase 2 5710010
3-14
Table 3-8: Volatile Organic Chemical MCLs
VOCs Florida State MCL (mg/L) 1,1- Dichloroethylene 0.007 1,1,1-Trichloroethane 0.2 1,1,2-Trichloroethane 0.005 1,2-Dichloroethane 0.003 1,2-Dichloropropane 0.005 1,2,4-Trichlorobenzene 0.07 Benzene 0.001 Carbon Tetrachloride 0.003 cis-1,2-Dichloroethylene 0.07 Dichloromethane 0.005 Ethylbenzene 0.7 Monochlorobenzene 0.1 0-Dichlorobenzene 0.6 para-Dichlorobenzene 0.075 Styrene 0.1 Tetrachloroethylene 0.003 Toluene 1.0 trans-1,2-Dichloroethylene 0.1 Trichloroethylene 0.003 Vinyl Chloride 0.001 Xylenes (total) 10.0
3.3.2.4. Synthetic Organic Chemicals Synthetic organic chemicals (SOCs) are man-made compounds used for a variety of industrial and agricultural purposes. The State regulated MCLs for SOCs are listed in Table 3-9. Four consecutive quarterly samples for SOCs are required every three years for groundwater sources. When SOCs are detected at levels above the MCLs, more frequent monitoring is required. SOCs have not been detected in the City’s distribution system.

Section 3
Regulatory Assessment
City of Venice Water Supply Master Plan - Phase 2 5710010
3-15
Table 3-9: Synthetic Organic Chemical MCLs
Synthetic Organic Chemicals Florida State MCL (mg/L)
2,3,7,8-TCDD (Dioxin) 3 x 10⁻⁸ 2,4-D 0.07 2,4,5-TP (Silvex) 0.05 Alachlor 0.002 Atrazine 0.003 Benzo[a]pyrene 0.0002 Carbofuran 0.04 Chlordane 0.002 Dalapon 0.2 Di (2-ethylhexyl) adipate 0.4 Di (2-ethylhexyl) phthalate 0.006 Dibromochloropropane (DBCP) 0.0002 Dinoseb 0.007 Diquat 0.02 Endothall 0.1 Endrin 0.002 Ethylene dibromide (EDB) 0.00002 Glyphosate 0.7 Heptachlor 0.0004 Heptachlor epoxide 0.0002 Hexachlorobenzene 0.001 Hexachlorocyclopentadiene 0.05 Lindane 0.0002 Methoxychlor 0.04 Oxamyl (Vydate) 0.2 Pentachlorophenol 0.001 Picloram 0.5 Polychlorinated biphenyls (PCBs) 0.0005 Simazine 0.004 Toxaphene 0.003
3.3.2.5. Microbial Contaminants In accordance with State regulations, FAC 62-550.310, the maximum contaminant level for microbial contaminants is based on the presence or absence of total coliforms in a sample, rather than coliform density. For systems which collect fewer than 40 samples per month, which includes the City, if no more than one sample collected during a month is total coliform-positive, the system is in compliance with the MCL for total coliforms. State regulations are based on the USEPA Total Coliform Rule (TCR).

Section 3
Regulatory Assessment
City of Venice Water Supply Master Plan - Phase 2 5710010
3-16
1989 Total Coliform Rule.
n Implementation Date: 1989
The TCR requires water systems to sample monthly at representative sites throughout the distribution system and perform routine monitoring for the presence of total coliforms. Total coliforms include both fecal coliforms and E. coli. Monitoring frequency depends on the population served by the supply system. Based on the most recent population estimates, the City would be required to monitor a minimum of 20 locations in the distribution system per month. Based on population projections the City will be required to sample a minimum of 30 locations by 2030. The key components of the TCR are as follows:
n The maximum contaminant level goal for total coliform, fecal coliform, and E. coli is set as zero.
n For systems analyzing fewer than 40 samples per month, no more than one sample per month may be positive for total coliform.
n Every positive total coliform sample must be analyzed for fecal coliforms.
Either of the following two situations triggers immediate public notification:
n A routine sample tests positive for total coliform and for fecal coliform or E. coli and any repeat sample tests positive for total coliform;
n A routine sample tests positive for total coliform and negative for fecal coliform or E. coli and any repeat sample is positive for fecal coliform or E. coli.
The City samples monthly for bacteriological analyses. In 2011, there were no total coliform positive results, indicating the system was in compliance with the TCR. For positive total coliform samples, duplicate samples must be taken and analyzed to confirm results. Total Coliform Rule Revisions.
n Implementation Date: February 2013
The USEPA published revisions to the 1989 TCR on February 2013. The purpose of the TCR revisions is to protect public health by ensuring the integrity of the drinking water distribution system and monitoring for the presence of microbial contamination. USEPA anticipates greater public health protection under the revised requirements, which are based on recommendations by a federal advisory committee. The rule establishes a MCLG and an MCL for E. coli and eliminates the MCLG and MCL for total coliform, replacing it with a treatment technique for coliform that requires

Section 3
Regulatory Assessment
City of Venice Water Supply Master Plan - Phase 2 5710010
3-17
assessment and corrective action. E. coli is a more specific indicator of fecal contamination and potential harmful pathogens than total coliform as many of the organisms detected by total coliform methods are not of fecal origin and do not have any direct public health implication. However, under the proposed treatment technique for coliform, total coliform serves as an indicator of a potential pathway of contamination into the distribution system. A public water system (PWS) that exceeds a specified frequency of total coliform occurrence must conduct an assessment to determine if any sanitary defects exist and, if found, correct them. In addition, under the treatment technique requirements, a PWS that incurs an E. coli MCL violation must conduct an assessment and correct any sanitary defects found. The rule eliminates monthly public notification requirements based only on the presence of total coliforms. Total coliforms in the distribution system may indicate a potential pathway for contamination but in and of themselves do not indicate a health threat. Instead, the rule requires public notification when an E. coli MCL violation occurs, indicating a potential health threat, or when a PWS fails to conduct the required assessment and corrective action. Ground Water Rule.
n Implementation Date: November 2006 (updated in 2010)
The Ground Water Rule (GWR) was promulgated in November 2006 and updated in 2010 to provide increased protection against microbial pathogens, specifically viral and bacterial pathogens, in PWSs that use groundwater sources. The rule applies to all PWSs that use groundwater sources in whole or in part (including consecutive systems that receive finished groundwater from another PWS), except for PWSs that combine all of their groundwater with surface water or groundwater under the direct influence (GWUDI) of surface water prior to treatment under the Surface Water Treatment Rule (SWTR). The goal of the GWR is to identify and target groundwater systems that are susceptible to fecal contamination. The rule addresses risks through a risk-targeting approach that includes:
n Periodic sanitary surveys of groundwater systems that require the evaluation of eight critical elements and the identification of significant deficiencies.
n Source water monitoring to test for the presence of E. coli, enterococci, or coliphage in the sample
§ Triggered monitoring for systems that do not already provide treatment that achieves at least 99.99 percent (4-log) inactivation or removal of viruses and that have a total coliform-positive routine sample under Total Coliform Rule sampling in the distribution system.
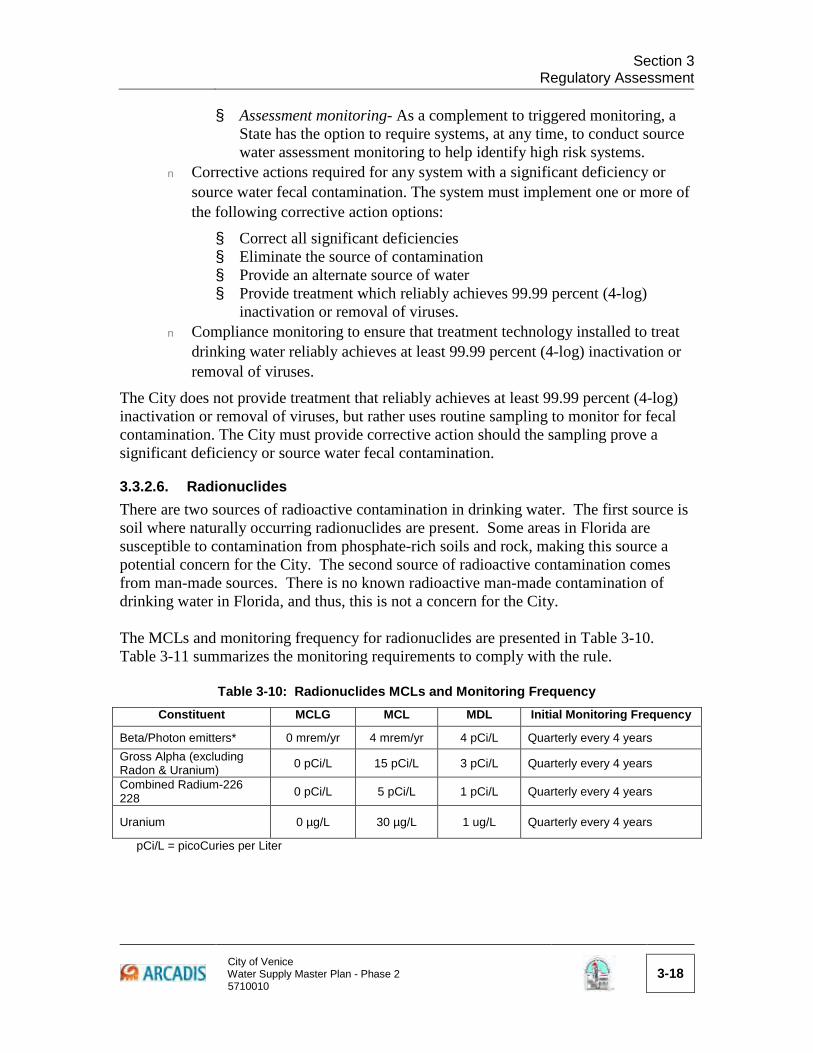
Section 3
Regulatory Assessment
City of Venice Water Supply Master Plan - Phase 2 5710010
3-18
§ Assessment monitoring- As a complement to triggered monitoring, a State has the option to require systems, at any time, to conduct source water assessment monitoring to help identify high risk systems.
n Corrective actions required for any system with a significant deficiency or source water fecal contamination. The system must implement one or more of the following corrective action options:
§ Correct all significant deficiencies § Eliminate the source of contamination § Provide an alternate source of water § Provide treatment which reliably achieves 99.99 percent (4-log)
inactivation or removal of viruses. n Compliance monitoring to ensure that treatment technology installed to treat
drinking water reliably achieves at least 99.99 percent (4-log) inactivation or removal of viruses.
The City does not provide treatment that reliably achieves at least 99.99 percent (4-log) inactivation or removal of viruses, but rather uses routine sampling to monitor for fecal contamination. The City must provide corrective action should the sampling prove a significant deficiency or source water fecal contamination.
3.3.2.6. Radionuclides There are two sources of radioactive contamination in drinking water. The first source is soil where naturally occurring radionuclides are present. Some areas in Florida are susceptible to contamination from phosphate-rich soils and rock, making this source a potential concern for the City. The second source of radioactive contamination comes from man-made sources. There is no known radioactive man-made contamination of drinking water in Florida, and thus, this is not a concern for the City. The MCLs and monitoring frequency for radionuclides are presented in Table 3-10. Table 3-11 summarizes the monitoring requirements to comply with the rule.
Table 3-10: Radionuclides MCLs and Monitoring Frequency Constituent MCLG MCL MDL Initial Monitoring Frequency
Beta/Photon emitters* 0 mrem/yr 4 mrem/yr 4 pCi/L Quarterly every 4 years Gross Alpha (excluding Radon & Uranium) 0 pCi/L 15 pCi/L 3 pCi/L Quarterly every 4 years
Combined Radium-226 228 0 pCi/L 5 pCi/L 1 pCi/L Quarterly every 4 years
Uranium 0 µg/L 30 µg/L 1 ug/L Quarterly every 4 years
pCi/L = picoCuries per Liter

Section 3
Regulatory Assessment
City of Venice Water Supply Master Plan - Phase 2 5710010
3-19
Table 3-11: Radionuclides Monitoring Requirements
Initial Monitoring Four consecutive quarters for gross alpha, combined radium-226/228, and uranium.
Reduced Monitoring One sample every 9 years, if the average of the initial monitoring results for each contaminant is below the detection limit. One sample every 6 years, if the average of the initial monitoring results for each contaminant is greater than or equal to the detection limit, but less than or equal to one-half the MCL. One sample every 3 years, if the average of the initial monitoring results for each contaminant is greater than one-half the MCL but less than or equal to the MCL.
Increased Monitoring Quarterly sampling until 4 consecutive quarterly samples is below the MCL.
The City’s radionuclide levels for 2011 are listed in Table 3-12. As seen, the detections have been below the MCLs.
Table 3-12: 2011 Radiological Contaminants Levels
Contaminant Level Detected MCL Violation (Yes/No)
Alpha Emitters (pCi/L) Emitters Reduced 0.6 No
Radium 226+228 or combined radium (pCi/L)50 0.5 No
3.3.2.7. Secondary Drinking Water Standards The Secondary Drinking Water Standard contaminates are required to be monitored at the entry point to the distribution system. Monitoring of the secondary chemicals is required the first year of each compliance period for groundwater sources. Table 3-13 summarizes the secondary contaminants, respective MCLs, and levels sampled from 2007 to 2011. As seen, the City meets all secondary maximum contaminate levels.
Table 3-13: Secondary Drinking Water Standards
Contaminant SMCL (mg/L) Detected Levels (mg/L)
SMCL Violation (Yes/No)
Aluminum 0.2 0 No
Chloride 250 52 No
Copper 1 0.007 No
Fluoride 2.0 0.171 No
Iron 0.3 0 No
Manganese 0.05 0 No
Silver 0.1 0.003 No

Section 3
Regulatory Assessment
City of Venice Water Supply Master Plan - Phase 2 5710010
3-20
Contaminant SMCL (mg/L) Detected Levels (mg/L)
SMCL Violation (Yes/No)
Sulfate 250 71 No
Zinc 5 0.385 No
Color 15 color units 0 No
Odor 3 (threshold odor number) 1 No
pH 6.5 – 8.5 8.0 No
Total Dissolved Solids 500 166 No
Foaming Agents 0.5 0 No
3.3.2.8. Lead and Copper The Lead and Copper Rule (LCR) was promulgated on June 7, 1991. Minor revisions, Lead and Copper Rule Minor Revisions (LCRMR), were added on April 11, 2000. Additional revisions, the Lead and Copper Short Term Revisions, have been adopted by FDEP and became effective October 1, 2010. The rule establishes an action level (AL) of 0.015 mg/L for Pb and 1.3 mg/L for Cu based on 90th percentile level of tap water samples. An AL exceedance is not a violation but can trigger other requirements that include water quality parameter (WQP) monitoring, corrosion control treatment, source water monitoring/treatment, public education, and lead service line replacement. According to the annual water quality report, the City is currently on the triennial reduced monitoring schedule. Annual or Triennial samples must be collected in June, July, August, or September. The system must revert to standard monitoring if its corrosion control WQPs are out of the State-prescribed range for nine or more days or if the AL is exceeded. Monitoring requirements for WQPs are presented in Table 3-14.
Table 3-14: Lead and Copper Rule Monitoring Requirements Type of Monitoring Frequency No. of
Sampling Sites Initiation Criteria
Initial Every 6 months for 1 year
100 Materials study completed.
Standard Every 6 months 100 Initial monitoring completed Annual Reduced Yearly 50 Optimal Water Quality Parameters
(OWQPs) met for 2 consecutive 6 month monitoring periods
Triennial reduced Once every 3 years 50 OWQPs met as in Annual Reduced, 90th percentile lead and copper levels are less than 5 µg/L and 0.65 mg/L, respectively.

Section 3
Regulatory Assessment
City of Venice Water Supply Master Plan - Phase 2 5710010
3-21
Table 3-15: LCR Water Quality Parameter Monitoring Requirements for Large Groundwater Systems
Type of Monitoring Location Parameters Number of Sites
Initiation Criteria
Routine EPTDSs pH, alkalinity (dosage and concentration)1, inhibitor (dosage and concentration)1
All EPTDSs
Initial monitoring complete. State has set OWQPs
Routine Taps pH, alkalinity, inhibitor1, calcium1 25 Same as above.
Annual reduced Taps pH, alkalinity, inhibitor1, calcium1 10 Three consecutive
years meeting OWQPs
Triennial reduced Taps pH, alkalinity, inhibitor1, calcium1 10
Three consecutive annual monitoring periods meeting OWQPs
Triennial reduced (accelerated) Taps pH, alkalinity, inhibitor1,
calcium1 10
Two consecutive six month periods meeting OWQPs and [Pb]<5µg/L and [Cu]<0.65mg/L
1. If used as part of corrosion control strategy The City monitors various sites in its distribution system for lead and copper according to the triennial reduced monitoring schedule as shown in Table 16. Results from monitoring conducted in 2011 revealed that the 90th percentile concentration was < 0.00067 mg/L for lead and 0.035 mg/L for copper; values well below USEPA’s ALs. The City has no lead water service lines in the distribution system. Consequently, any lead that is found in the system is the product of lead-bearing solder and/or brass fixtures in home plumbing systems.
3.3.2.9. Consumer Confidence Reports Rule The Consumer Confidence Reports (CCR) Rule requires water systems to prepare and provide to their consumers annual CCRs concerning the quality of the water delivered by the systems every July. The City’s annual CCR is synonymous with the water quality report. The annual CCR informs consumers what is in their water, where it comes from, and where they can obtain additional information. The CCR encourages consumer awareness and confidence in water supply. The CCR Rule became effective September 18, 1998. The City submits their CCR to the public with their utility bills annually.
3.3.3. Other Regulations
3.3.3.1. Disposal Regulations Disposal of RO concentrate is regulated by Rule 403.0882. This rule defines demineralization concentrate as the concentrated byproduct water, brine, or reject water, produced by ion exchange or membrane separation, including RO. The treatment of the RO concentrate discharge is provided through the addition of sodium hypochlorite and air injection, combined with in-line mixers, to oxidize the dissolved sulfides and raise the dissolved oxygen in the concentrate.

Section 3
Regulatory Assessment
City of Venice Water Supply Master Plan - Phase 2 5710010
3-22
Florida Legislature wants to protect water resources by promoting brackish water demineralization as an alternative source of drinking water. However, the concentrate from these processes must be categorized as a byproduct which must be treated and properly disposed of. If a demineralization concentrate discharger fails an effluent whole toxicity test due to the presence of constituents naturally occurring in the source water, the discharger's permit cannot be revoked or denied if the volume of water needed to achieve water quality standards is available within a minimum distance of two times the natural water depth at the discharge location. Disposal of the City’s concentrate is via an outfall with a 24-inch diameter pipe with a multiport diffuser system. This leads to a man-made canal connecting Roberts Bay and Lemon Bay. The sampling location is downstream of the intersection of the RO concentrate stream and reclaimed water stream. The City does not currently have an alternate means for concentrate disposal. The City’s RO concentrate discharge is permitted through an industrial wastewater facility permit which constitutes authorization to discharge to the Gulf Intracoastal Waterway under the National Pollutant Discharge Elimination System (NPDES). Permit No. FL0035335, which expires on November 24, 2013, sets forth the water quality limits and the conditions for monitoring and reporting of the RO concentrate.
Table 3-16: Concentrate Discharge Permit Limits and Historical Discharge Data
Parameter
Permit FL0035335 Discharge Limitations
Historical Concentrate Discharge(2)
Monthly Average
Daily Maximum
Daily Minimum
Daily Maximum
Daily Minimum
Flow (mgd) Report 3.56(1) - 2.9 -
Chlorine, Total Residual (mg/L) Report 0.01 - 0.01 -
Solids, Total Suspended (mg/L) Report 5 - 3 -
pH (s.u.) - 8.5 6.5 7.5 7.3
Fluoride, Total (mg/L) Report 5 - 3.5 -
Copper, Total Recoverable (mg/L) Report 0.0037 - 0.0026 -
Oxygen, Dissolved (mg/L) 5 - 4 - 5.1
Radium 226 + Radium 228, Total (pci/L) Report 17 - 15.4 -
Alpha, Gross (pci/L) Report 55 - 42.4 -
Specific Conductance (umohs/cm) Report Report - - 7,444
Chloride (mg/L) Report Report - 2,840 -
Whole Effluent Toxicity (Acute) Factor of Specific Permit Conditions - -
(1) Consecutive 7-day average (2) Data presented from RO Preliminary BODR (August 2012), gathered from DEP Form 62-
620.910(18) Part V and from DMR summary tables.
The plant is currently permitted for 3.56 million gallons per day (mgd) of RO concentrate disposal (seven day average). Any increase above the permitted disposal rate would require the City to do an anti-degradation analysis based on the increased flows. The City conducted this analysis when initially permitting the plant; however it may be

Section 3
Regulatory Assessment
City of Venice Water Supply Master Plan - Phase 2 5710010
3-23
required again if additional concentrate disposal is required. The anti-degradation analysis would depend on the history of the plant (past non-compliance issues), the existing conditions at the discharge point and quality of discharge. If there are any problems in these areas, the permit for expanded discharge may not be granted. If required, the City should set up a pre-application meeting with FDEP to discuss options for anti-degradation. In 2012, the City completed a study that investigated the feasibility of increasing the current RO permeate recovery of 50%. The desktop study was performed using RO manufacturer’s membrane modeling software to evaluate equipment and operational requirements needed to increase permeate recovery. The study concluded that up to a 75% permeate recovery may be achievable for a two-stage RO system using proper pretreatment (acid and scale inhibitor), appropriate membranes and feed pumps. Increased permeate recoveries, however, may cause the RO concentrate to exceed the current NPDES permit limits. The City will need to determine whether the existing permit can be modified or find an alternative means for concentrate disposal, such as deep well injection. Concentrate management considerations are discussed further in Section 7.5.
3.3.3.2. Backflow Prevention/Cross-Connection Control Program By Public Law 93-523, the Safe Drinking Water Act Amendments of 1986, FDEP requires that the potable water supply be protected from contamination by unapproved sources or any other substances by way of cross-connection or back-siphoning. The public water supply could become contaminated without the proper installation, testing, inspection, operation, maintenance and retrofitting of backflow prevention devices. The State requires that each utility have a backflow program to protect water quality. A backflow device reduces the risk of water contamination from untreated water or liquid chemicals from being drawn into or pushed into the City’s water mains. Proper installation of backflow prevention devices is important to the sanitary working of the water distribution system.
3.3.3.3. Public Notification Rule The Public Notification Rule (PNR) was promulgated in May 18, 2000 and became effective on May 6, 2002. The PNR requires public water systems to notify the people who drink their water if the level of a contaminant in the water exceeds USEPA and State drinking water regulations, if there is a waterborne disease outbreak or any other situation that may pose a risk to public health, if the water system fails to test its water as required, or if the system has a variance or exemption from the regulations. Depending on the severity of the situation, water suppliers have from 24 hours to one year to notify their customers. USEPA sets strict requirements on the form, manner, content, and frequency of public notices. Public notification has to be provided in addition to the annual water quality report (CCR).

Section 3
Regulatory Assessment
City of Venice Water Supply Master Plan - Phase 2 5710010
3-24
Boil Water Notices have sometimes been issued by the City based on main break/repair followed by bacteriological clearance to ensure the necessary public water quality. No Public Notifications have been required.
3.3.3.4. Interconnections The City currently has two interconnections with Sarasota County: one located on the south side of Venice (Country Club Way Interconnection) and one on the north side (Colonia Lane Interconnection). The existing interconnections are not used on a regular basis and are primarily in place for emergencies. The Colonia Lane interconnection was constructed in 1990 and has never been used. The Country Club Way interconnection has been used once to supply Sarasota County during a shortage. While the City utilizes free chlorine in the form of sodium hypochlorite, Sarasota County uses chloramines as a disinfectant. When the City uses chloraminated water from the interconnection with Sarasota County, the affected service area must be notified. The combination of chlorinated and chloraminated water can result in taste and odor problems caused by the formation of di- and tri-chloramines and can be harmful to kidney dialysis patients and tropical fish owners. Localized breakpoint chlorination may also occur resulting in a loss of disinfectant residual. See Section 6 for more details on the City’s interconnections. In the event that the interconnection is utilized, the Sarasota County Health Department and affected water customers must be notified no later than the previous business day for a planned use of the interconnection, according to Section 62-555.350 of the FAC.
3.4. Emerging Issues As analytical methods and detection technology continue to advance, more and more chemicals are being detected in drinking water. Some contaminants that are considered “new” to water and wastewater include pharmaceutical and personal care products, perfluorooctanoic acid (PFOA or C8), caffeine, toxins, endocrine disrupting compounds, methyl tertiary butyl ether, nano-materials, etc.
3.4.1. Unregulated Contaminants Monitoring Rule The Unregulated Contaminants Monitoring Rule (UCMR) was designed to evaluate and prioritize contaminants for inclusion in federal drinking water regulations for the purpose of protecting public health. USEPA must periodically publish this list of contaminants (called the Contaminant Candidate List or CCL) and decide whether to regulate at least five or more contaminants on the list. USEPA uses this list of unregulated contaminants to prioritize research and data collection efforts to help determine whether or not future regulation is warranted. USEPA published the final version of the third CCL (CCL3) in October 2009. The list includes 104 chemicals and 12 microbiological contaminates that are currently not subject to any proposed or promulgated national primary drinking water regulations, that are known or anticipated to occur in public water systems, and which may require

Section 3
Regulatory Assessment
City of Venice Water Supply Master Plan - Phase 2 5710010
3-25
regulation under the Safe Drinking Water Act (SDWA). The contaminants on the CCL3 are listed in Table 3-17.
Table 3-17: Contaminant Candidate List 3
Microbial Adenovirus Escherichia coli (0157) Mycobacterium avium Caliciviruses Helicobacter pylori Naegleria fowleri Campylobacter jejuni Hepatitis A virus Salmonella enterica
Chemical 1,1,1,2-Tetrachloroethane Dimethoate N-nitrosodimethylamine (NDMA) 1,1-Dichloroethane Disulfoton N-nitroso-di-n-propylamine (NDPA) 1,2,3-Trichloropropane Diuron N-Nitrosodiphenylamine 1,3-Butadiene equilenin N-nitrosopyrrolidine (NPYR) 1,3-Dinitrobenzene equilin Norethindrone (19-Norethisterone) 1,4-Dioxane Erythromycin n-Propylbenzene 17alpha-estradiol Estradiol (17-beta estradiol) o-Toluidine 1-Butanol estriol Oxirane, methyl- 2-Methoxyethanol estrone Oxydemeton-methyl 2-Propen-1-ol Ethinyl Estradiol (17-alpha ethynyl
estradiol) Oxyfluorfen
3-Hydroxycarbofuran Ethoprop Perchlorate 4,4'-Methylenedianiline Ethylene glycol Perfluorooctane sulfonic acid
(PFOS) Acephate Ethylene oxide Perfluorooctanoic acid (PFOA) Acetaldehyde Ethylene thiourea Permethrin Acetamide Fenamiphos Profenofos Acetochlor Formaldehyde Quinoline Acetochlor ethanesulfonic acid (ESA)
Germanium RDX (Hexahydro-1,3,5-trinitro-1,3,5-triazine)
Acetochlor oxanilic acid (OA) Halon 1011 (bromochloromethane) sec-Butylbenzene Acrolein HCFC-22 Strontium Alachlor ethanesulfonic acid (ESA)
Hexane Tebuconazole
Alachlor oxanilic acid (OA) Hydrazine Tebufenozide alpha-Hexachlorocyclohexane Mestranol Tellurium Aniline Methamidophos Terbufos Bensulide Methanol Terbufos sulfone Benzyl chloride Methyl bromide (Bromomethane) Thiodicarb Butylated hydroxyanisole Methyl tert-butyl ether Thiophanate-methyl Captan Metolachlor Toluene diisocyanate Chlorate Metolachlor ethanesulfonic acid
(ESA) Tribufos
Chemical (Continued)
Chloromethane (Methyl chloride)
Metolachlor oxanilic acid (OA) Triethylamine
Clethodim Molinate Triphenyltin hydroxide (TPTH) Cobalt Molybdenum Urethane

Section 3
Regulatory Assessment
City of Venice Water Supply Master Plan - Phase 2 5710010
3-26
Cumene hydroperoxide Nitrobenzene Vanadium Cyanotoxins (3)* Nitroglycerin Vinclozolin Dicrotophos N-Methyl-2-pyrrolidone Ziram Dimethipin N-nitrosodiethylamine (NDEA) On May 8th, 2012, USEPA began requesting nominations of drinking water contaminants to be included on a fourth drinking water Contaminate Candidate List, (CCL4). The nomination period ended on June 22nd, 2012, but the agency was also accepting nominations during the notice and comment period following EPA's publication of the draft CCL 4, which is currently being developed.
3.4.2. Methyl Tertiary-Butyl Ether Methyl tertiary-butyl ether (MTBE) has undergone UCMR monitoring and currently remains on the CCL. All large public water systems have to monitor and report the presence of MTBE in their water supplies. In December 1997, USEPA issued an advisory as a guidance to keep the concentrations of MTBE in the range of 20 to 40 parts per billion (ppb) of water or below to avoid unpleasant taste and odor and negative health effects. In UCMR monitoring, MTBE was detected 24 times in 17 out of 3,469 potable water systems. Of the 24 detections, the maximum concentration of MTBE was 49 µg/L and the mean concentration was 14.7 µg/L. It is still unclear whether the MTBE concern is in localized regions or widespread throughout the country. It is very likely that if MTBE detections are localized, the monitoring would spark state regulation rather than federal. While the USEPA is still in the process of researching the health effects of MTBE, the gasoline additive is a regulated drinking water contaminant in the State of California (primary MCL of 13 µg/L, secondary MCL of 5 µg/L to address taste and odor issues).
3.4.3. Perchlorate Another contaminant of concern for PWSs is the presence of perchlorate. Perchlorate is used as the primary ingredients of solid rocket propellant and has an adverse effect on the thyroid gland and body metabolism when ingested. Perchlorate has undergone UCMR monitoring and USEPA has decided to regulate perchlorate under the Safe Drinking Water Act (SDWA). USEPA has notified interested parties of its decision to regulate perchlorate, but has not yet imposed any requirements on PWSs. However, the agency is in the process of developing and establishing national primary drinking water regulation (NPDWR) for the contaminant. Once the NPDWR is finalized, certain PWSs will be required to take action to comply with the regulation in accordance with the schedule specified in the regulation. USEPA anticipates publication of the proposed rule for public review and comment will occur sometime in late 2013. All large public water systems have to monitor and report the presence of perchlorate in their water supplies. In UCMR monitoring, perchlorate was detected 583 times in 145 out of 3,405 systems. The maximum concentrations were observed in Puerto Rico (420

Section 3
Regulatory Assessment
City of Venice Water Supply Master Plan - Phase 2 5710010
3-27
µg/L) and Atlantic Beach, Florida (200 µg/L). The mean concentration for the 583 detected samples was 9.8 µg/L.
3.4.4. Endocrine Disrupting Compounds and Pharmaceuticals and Personal Care Products
Man-made chemicals, or their by-products, that are known to be capable of interfering with human endocrine system are categorized as endocrine-disrupting compounds (EDCs). Potential health effects of exposure to EDCs include adverse reproductive outcomes, birth defects, breast cancer, developmental disabilities, endometriosis, thyroid problems and testicular cancer. EDCs include industrial chemicals such as polychlorinated biphenyls (PCBs), as well as a wide variety of pesticides, including herbicides, fungicides, nematocides, and insecticides (DDT, endosulfan, methoxychlor). Pharmaceuticals and personal care products (PPCPs) used daily, as well as some household compounds, are starting to appear in drinking water systems around the world. Some of these compounds are known to be hormonally active (EDCs) but their significance in drinking water is still not clear. Future monitoring and testing will need to be carried out to determine which of these compounds, if any, would pose a threat to human health and at what dose. While EDCs and PPCPs are not monitored nationwide, the State of California has proposed that any groundwater recharge reuse project “monitor the recycled water for EDCs and pharmaceuticals specified” by the California Department of Health Services.
3.4.5. Algal Toxins Algal toxins were added to the CCL in 1998 and remain on the list for consideration for possible future regulation. From a public health standpoint, human illness associated with toxic algal blooms and consumption of toxin-contaminated shellfish in the US are paralytic, neurotoxic, amnesic, and diarrhetic shellfish poisoning. USEPA has listed microcystin-LR, LA, RR, YR, cylindrospermopsin, and anatoxin-a as the most important algal toxins in the US. USEPA anticipates developing analytical methods to quantify algal toxin occurrence in drinking water after which regulations can be set for utilities.
3.4.6. N-nitrosodimethylamine N-nitrosodimethylamine (NDMA) is primarily known as an industrial contaminant commonly found with perchlorate and also forms as a DBP during chlorine or chloramine disinfection of water or wastewater systems. USEPA has listed NDMA as a probable human carcinogen based on animal studies. Research is underway to determine the extent of NDMA occurrence in drinking water systems. USEPA has proposed monitoring for NDMA under Unregulated Contaminant Monitoring Rule 2. California established a notification level of 10 nanograms per liter (ng/L) due to analytical method limitations. NDMA is also discussed in the Stage 2 DBPR as an emerging DBP which has an estimated one in a million life time cancer risk of 7 ng/L based upon the induction of tumors. Current information indicates it is possible that EPA could propose a standard as low as 10 or 20 ng/L if NDMA is regulated in the future.

Section 3
Regulatory Assessment
City of Venice Water Supply Master Plan - Phase 2 5710010
3-28
3.4.7. Chromium (VI) Total chromium is a required nutrient for adults with a recommended daily intake of 50 to 200 µg. Total chromium (sum of Cr(III) and Cr(VI)) is regulated by USEPA with an MCL of 0.1 mg/L, but no specific limit has been set for Chromium (VI). Chromium (VI) may cause cancer in laboratory animals but the evidence of carcinogenicity via ingestion is not compelling. The National Toxicology Program has been conducting toxicity studies on Chromium (VI) which can lead to future regulation. In addition, the EPA announced a recommendation to water utilities to provide additional monitoring for this contaminant.
3.4.8. Groups of Contaminants § EPA is considering a new strategy to regulate some contaminants in groups and
not individually. The EPA has identified three groups that may be ready for regulation, which include: Carcinogenic VOCs – This group is most likely the first to be regulated, and includes eight VOCs that are currently regulated (e.g., TCE, PCE) and eight additional contaminants that are included in the CCL3 list.
§ Nitrosamines – There are six nitrosamines that may be monitored under the rule, one of which is NDMA, which has been the most commonly occurring contaminant among the UCMR contaminants (and at relatively high concentrations compared to other nitrosamines).
§ Chlorinated DBPs – There are some concerns about health effects of chlorinated
DBPs at lower levels than are currently regulated.
EPA has also identified the three groups (perflurocarbons (PFCs), organophosphates, and carbamates) for future consideration and three additional groups (triazines, cyanotoxins, and chloroacetanilides) for long-term consideration. The groups considered for future regulation have defined data gaps that first need to be addressed while groups under long-term consideration have significant data gaps in addition to other concerns that must first be addressed.
3.4.9. SDWA Six-Year Review As previously indicated, EPA is required to review each NPDWR at least once every six years and revise them as appropriate. In March 2010, EPA released the results of the Second Six-Year Review, and has decided to revise four standards, which include: § Tetrachloroethylene (PCE) and Trichloroethylene (TCE) (VOCs) – PCE and TCE
are known carcinogens and are currently regulated at 5 ug/L, with MCLGs of zero. A health assessment is currently in process for these compounds, but new analytical feasibility and treatment technique information may justify lowering the standard for these compounds.
§ Acrylamide and Epichlorohydrin (polymers) – These compounds are commonly used polymers, and they have a MCLG of zero. Recent improvements in

Section 3
Regulatory Assessment
City of Venice Water Supply Master Plan - Phase 2 5710010
3-29
manufacturing techniques have resulted in lower levels of these compounds than those achieved with current treatment techniques. Additional work is needed to understand the impacts of these new techniques of treatment and to ensure that treatment is not compromised by the establishment of a stricter standard.
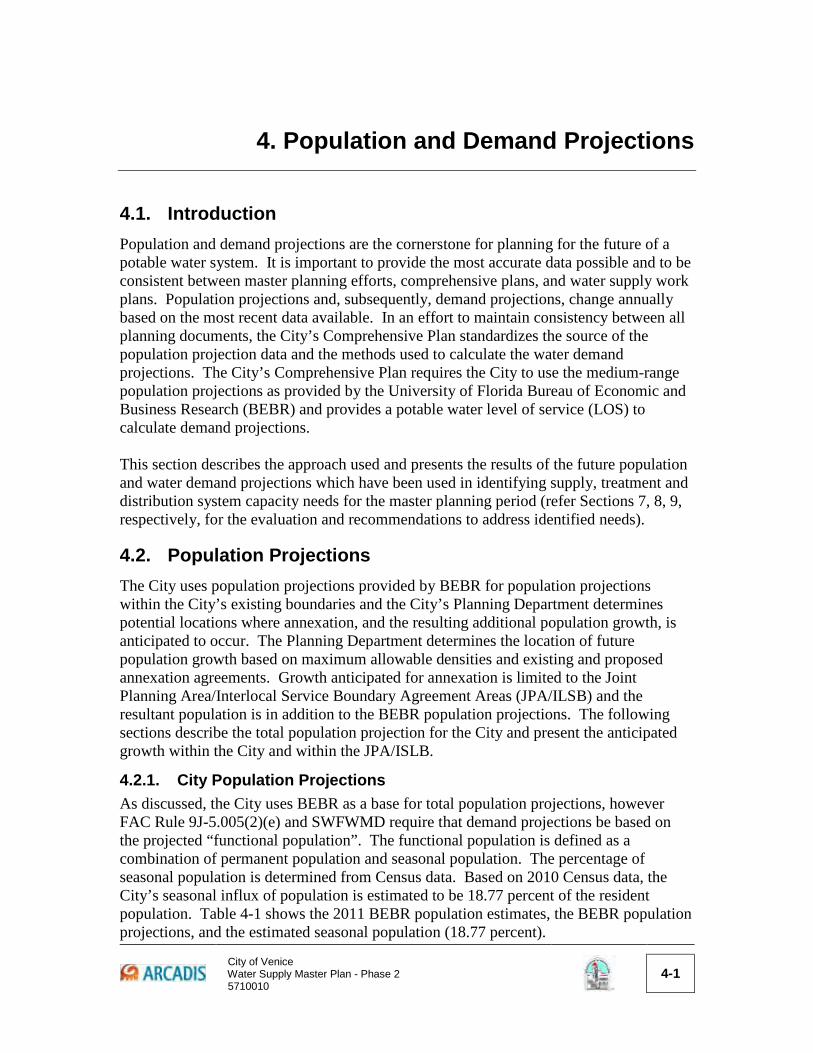
City of Venice Water Supply Master Plan - Phase 2 5710010
4-1
4
4. Population and Demand Projections
4.1. Introduction Population and demand projections are the cornerstone for planning for the future of a potable water system. It is important to provide the most accurate data possible and to be consistent between master planning efforts, comprehensive plans, and water supply work plans. Population projections and, subsequently, demand projections, change annually based on the most recent data available. In an effort to maintain consistency between all planning documents, the City’s Comprehensive Plan standardizes the source of the population projection data and the methods used to calculate the water demand projections. The City’s Comprehensive Plan requires the City to use the medium-range population projections as provided by the University of Florida Bureau of Economic and Business Research (BEBR) and provides a potable water level of service (LOS) to calculate demand projections. This section describes the approach used and presents the results of the future population and water demand projections which have been used in identifying supply, treatment and distribution system capacity needs for the master planning period (refer Sections 7, 8, 9, respectively, for the evaluation and recommendations to address identified needs).
4.2. Population Projections The City uses population projections provided by BEBR for population projections within the City’s existing boundaries and the City’s Planning Department determines potential locations where annexation, and the resulting additional population growth, is anticipated to occur. The Planning Department determines the location of future population growth based on maximum allowable densities and existing and proposed annexation agreements. Growth anticipated for annexation is limited to the Joint Planning Area/Interlocal Service Boundary Agreement Areas (JPA/ILSB) and the resultant population is in addition to the BEBR population projections. The following sections describe the total population projection for the City and present the anticipated growth within the City and within the JPA/ISLB.
4.2.1. City Population Projections As discussed, the City uses BEBR as a base for total population projections, however FAC Rule 9J-5.005(2)(e) and SWFWMD require that demand projections be based on the projected “functional population”. The functional population is defined as a combination of permanent population and seasonal population. The percentage of seasonal population is determined from Census data. Based on 2010 Census data, the City’s seasonal influx of population is estimated to be 18.77 percent of the resident population. Table 4-1 shows the 2011 BEBR population estimates, the BEBR population projections, and the estimated seasonal population (18.77 percent).
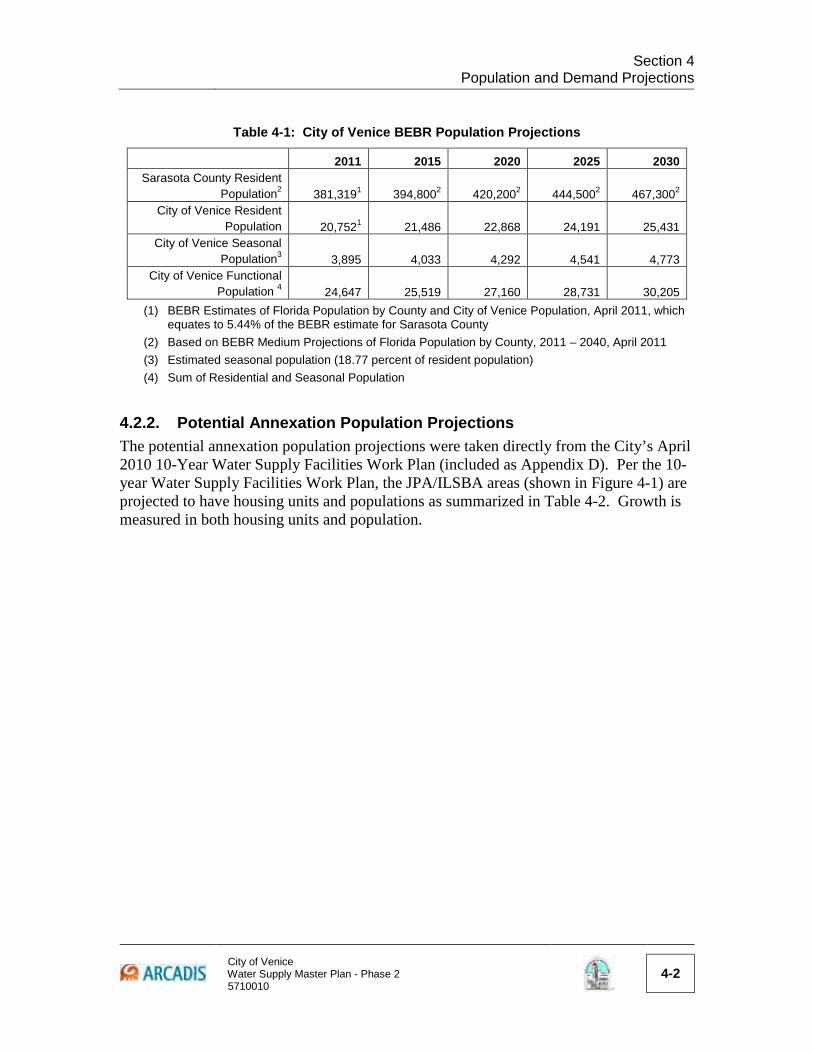
Section 4
Population and Demand Projections
City of Venice Water Supply Master Plan - Phase 2 5710010
4-2
Table 4-1: City of Venice BEBR Population Projections
2011 2015 2020 2025 2030 Sarasota County Resident
Population2 381,3191 394,8002 420,2002 444,5002 467,3002 City of Venice Resident
Population 20,7521 21,486 22,868 24,191 25,431 City of Venice Seasonal
Population3 3,895 4,033 4,292 4,541 4,773 City of Venice Functional
Population 4 24,647 25,519 27,160 28,731 30,205 (1) BEBR Estimates of Florida Population by County and City of Venice Population, April 2011, which
equates to 5.44% of the BEBR estimate for Sarasota County (2) Based on BEBR Medium Projections of Florida Population by County, 2011 – 2040, April 2011 (3) Estimated seasonal population (18.77 percent of resident population) (4) Sum of Residential and Seasonal Population
4.2.2. Potential Annexation Population Projections The potential annexation population projections were taken directly from the City’s April 2010 10-Year Water Supply Facilities Work Plan (included as Appendix D). Per the 10-year Water Supply Facilities Work Plan, the JPA/ILSBA areas (shown in Figure 4-1) are projected to have housing units and populations as summarized in Table 4-2. Growth is measured in both housing units and population.

Section 4
Population and Demand Projections
City of Venice Water Supply Master Plan - Phase 2 5710010
4-3
Table 4-2: JPA/LSBA Potential Residential Impact
JPA Area Location
2010-2011 Short-Term (2015) Long-Term (2030) Build-out
Subarea Existing Units
Total Units
Total Population
Total Units
Total Population
Total Units
Total Population
1 Knight's Trail Park Area (Rustic Road)
1 1 1 2 1 2 1,561 2,856 2 15 16 29 20 36 354 648
2(a) Auburn Road to I-75
1 - - - - - 119 218
2 5 5 10 7 12 200 365
3 9 10 18 12 22 157 287
2(b) I-75 to Jacaranda Blvd
1 1 1 2 1 2 418 766
2 5 5 10 7 12 217 396
3 5 5 10 7 12 442 809
3 Border Road to Myakka Corridor
1 1 1 2 1 2 2,329 4,261
2 30 32 59 40 72 394 721
4
Venetian Golf and River Club Area (Venice Myakka River)
- 4 4 8 5 10 10 19
5
South Venice Avenue Corridor (South Venice Avenue Mixed Use Neighborhood)
- 220 235 431 290 531 1,120 2,049
6 Laurel Road 1 11 12 22 15 27 723 1,323
2 2 2 4 3 5 511 935 3 - - - - - - -
7 Pinebrook Road Area - 30 32 59 40 72 695 1,272
8 Auburn Road to Curry Creek - 2 2 4 3 5 126 231
9(a) Jacaranda Blvd (Border Jacaranda) - 50 54 98 66 121 55 101
9(b) Border Road to Curry Creek - 65 70 127 86 157 110 202
10 Laurel Oaks - 17 18 33 22 41 50 91
11 Gulf Coast Blvd Enclave - 91 97 178 120 220 116 211
Total 564 602 1,106 746 1,361 9,707 17,761

Section 4
Population and Demand Projections
City of Venice Water Supply Master Plan - Phase 2 5710010
4-4
Figure 4-1: JPA/ILSBA Locations

Section 4
Population and Demand Projections
City of Venice Water Supply Master Plan - Phase 2 5710010
4-5
4.2.3. Total Population Projections The total functional population projections for the City of Venice are a combination of the BEBR projected functional population within the existing City limits and the projected functional population for the JPA/ILSBA areas. Table 4-3 summarizes the total functional population projections that were used for future planning purposes.
Table 4-3: Total Functional Population Projections
2011 2015 2030 Build-out
Total Total Incremental
Increase Total Incremental
Increase Total Incremental
Increase
Citywide 24,647 25,519 872 30,205 4,686 67,7181 37,513
JPA/ILSBA 0 1,106 1,106 1,361 255 17,761 16,400
Total 24,647 26,625 1,978 31,566 4,941 85,479 53,913
(1) From 10-year Facilities Work Plan, Table 7.61, Build-out Population, April 2010
4.3. Demand Projections The current City of Venice LOS standard for potable water was established in the 1999 Comprehensive Plan. The standard was based on a Capacity Analysis Report prepared by Boyle Engineering in 1994. The methodology used for determining available capacity (consumption per unit) in the Capacity Analysis Report’s was based on Equivalent Residential Units (ERU) and the water use permit (WUP) withdrawal limitations which included average annual flow, maximum monthly flow, and maximum daily follow. The City adopted the recommendations from the Capacity Analysis Report which set the annual average LOS at 152 gpd/ERU and the maximum day LOS at 227 gpd/ERU.
4.3.1. Potable Water Level of Service Due to water conservation measures and modifications to the distribution system to decrease flushing, the actual per capita usage within the City has declined since the creation of the LOS in 1994. Per the Potable Water Level of Service Memo (Appendix E) prepared by ARCADIS, dated March 2011, the LOS was re-evaluated based on historic water production, BEBR functional population estimates, and was based on historic per capita demand from 2005 to 2009. The annual average LOS from that memo is 90 gallons per capita per day (gpcd) and the maximum day LOS is 135 gpcd. Since submittal of the Potable Water LOS Memo, more recent data has become available which confirmed the LOS determined in the 2011 LOS memorandum. The City’s historic water production rates and calculated per capita demand through 2011 are summarized in Table 4-4.

Section 4
Population and Demand Projections
City of Venice Water Supply Master Plan - Phase 2 5710010
4-6
Table 4-4: City of Venice Historic Water Production Rates and per Capita Demand
Year City of Venice
Functional Population
Production Flows (mgd) Max Day Peaking Factor
per Capita Demand (gpcd) Annual
Average Max
Month Max Day
Annual Average
Max Month
Max Day
2007 26,136 2.13 2.41 3.24 1.5 81 92 124
2008 26,132 2.03 2.51 3.22* 1.6 78 96 123
2009 25,777 2.03 2.47 3.13 1.5 79 96 121
2010 24,643 2.02 2.37 3.04 1.5 82 96 123
2011 24,647 1.96 2.40 3.08 1.6 79 97 125
5-Year Average (2007-2011) 1.5 80 96 123 *maximum day was due to main break, thus the second maximum day was used for regulatory purposes
4.3.2. Projected Water Demands The projected finished water demands were derived from the 2011 water production data and increased based on the demand from the projected future functional population. Table 4-5 summarizes the future demands for the projected functional population.
Table 4-5: Total Projected Demand (mgd)
Existing (2011) Short-Term (2015) Long-Term (2030) Build-out
Annual
Average Maximum
Day Annual
Average Maximum
Day Annual
Average Maximum
Day Annual
Average Maximum
Day Citywide 1.96 3.08 2.04 3.20 2.46 3.87 5.84 9.19
JPA/ILSBA 0 0 0.10 0.16 0.12 0.19 1.60 2.52 Total Projected
Demand 1.96 3.08 2.14 3.36 2.58 4.06 7.43 11.72
A graph showing the City’s treatment capacity and projected annual average and max day demands through 2030 for the planning area is shown in Figure 4-2. This figure also shows the estimated point in time when the “75% capacity threshold” is reached. Based on current projections, the City’s water demands are expected to exceed 75% of the WTP capacity in 2013, triggering the required submittal of an annual Capacity Analysis Report to FDEP, as well as planning efforts to ensure future service area demands will be met. As seen in Figure 4-2, projected maximum day demands will only be about 0.42 mgd below the existing production capacity at the RO WTP by the end of the master planning period, with demands likely exceeding production capacity by around 2034. Figure 4-2 also presents the estimated years where the City’s concentrate quantity limit will likely be exceeded (around 2019 – assuming continued operation at the current 50% recovery), as well as a 5-year trigger until the projected demands will exceed the WTP’s existing production capacity of 4.48 mgd. This date, expected to occur around 2029, is recommended to begin planning activities to ensure that the City is able to plan, design, permit, and construct necessary expansion projects to meet the future needs of the service area before projected demands exceed the existing production capacity (projected to occur around 2034).

Section 4
Population and Demand Projections
City of Venice Water Supply Master Plan - Phase 2 5710010
4-7
Figure 4-2: Projected Supply and Demand
Based on current projections, the City will need to begin planning and implementation of improvements to increase supply and/or production capacity by around 2029 to ensure adequate capacity is available before projected demands exceed the existing production capacity. Alternatives to address the projected demand and concentrate management needs are discussed in Section 7.
0
0.5
1
1.5
2
2.5
3
3.5
4
4.5
5
2011 2013 2015 2017 2019 2021 2023 2025 2027 2029
Dem
and
(MG
D)
Year
WTP Capacity WTP 75% Threshold
Projected Demand - Ann Avg Projected Demand - Max Day
0.42 MGD Surplus
5-yr Trigger untilDemand > Capacity
Concentrate Quantity> Permit Limit

City of Venice Water Supply Master Plan - Phase 2 5710010
5-1
5
5. Potential Sources
5.1. Introduction The City is located within the jurisdictional boundaries of SWFWMD and as such, all water supplies available to the City are governed by SWFWMD. The District has many different designations that illustrate the varying water supply planning areas, supply options, conditions, and use within the District. For example, there are four planning regions and three water use caution areas within the District, and the various boundaries do not always coincide. SWFWMD manages water supply within the District to meet the different water source protection objectives in each designation. The City is in the Southern Planning Region and the Southern Water Use Caution Area (SWUCA) and must meet the water supply protection objectives in each designation. As discussed in Section 2.2.1, the City utilizes a series of groundwater supply wells to meet public water demands. The City is currently permitted (Permit # 20005393.009) by SWFWMD for an average daily withdrawal of 6.86 million gallons per day (mgd) and a peak month withdrawal of 8.24 mgd. In accordance with the City’s WUP, the withdrawal allocation is permitted from fifteen production wells (14 operational, 1 permitted) in two different wellfields - the Intracoastal and Eastern Wellfields. The wells provide brackish groundwater from the intermediate aquifer, which is treated by RO technology at the City’s WTP. Aquifer heterogeneities and saltwater intrusion along the gulf coast result in the production of differing water quality in the City’s Intracoastal and Eastern wellfields. This section discusses the City’s local hydrogeology and supply water quality and presents available water supply options from the Regional Water Supply Plan (RWSP) prepared by the SWFWMD. The detailed assessment of water supply alternatives completed as part of this Master Plan are presented and discussed in Section 7. The City is located entirely within the SWFWMD Southern Planning Region. Figure 5-1 displays the four planning regions. Each region has its own RWSP, and the RWSP for the Southern Planning Region is discussed in a later section.

Section 5
Potential Sources
City of Venice Water Supply Master Plan - Phase 2 5710010
5-2
Figure 5-1: 2011 SWFWMD Planning Regions
* Reproduced from the 2011 RWSP – Southern Planning Region
5.1.1. Southern Water Use Caution Area In response to growing demands for water and regionally declining water levels in both groundwater and surface water bodies, the SWFWMD has established the SWUCA. The SWUCA includes all of DeSoto, Hardee, Manatee, and Sarasota counties, including the City of Venice, and parts of Charlotte, Highlands, Hillsborough, and Polk counties (Figure 5-2). The SWUCA was first established in 1992 and designated as a water use caution area (WUCA) to manage water resources in the Southern West-Central Florida Groundwater Basin (SWCFGWB). The SWCFGWB is one of three groundwater basins within SWFWMD that were delineated based on persistent groundwater flow lines in the Floridan Aquifer. Management practices for the SWUCA have been revised over the

Section 5
Potential Sources
City of Venice Water Supply Master Plan - Phase 2 5710010
5-3
years with the most recent rules passed by the SWFWMD Board of Directors in 2006. The City must abide by the SWUCA rules.
Figure 5-2: Southern Water Use Caution Area
* Reproduced from the 2010 RWSP, SWFWMD 2011

Section 5
Potential Sources
City of Venice Water Supply Master Plan - Phase 2 5710010
5-4
Generally, in order to obtain a water use permit, the requested allocation must meet the following criteria: § Is necessary to fulfill a certain reasonable demand; § Will not cause quantity or quality changes which adversely impact the water
resources, including both surface and groundwater; § Will not cause adverse environmental impacts to wetlands, lakes, streams,
estuaries, fish and wildlife, or other natural resources; § Will comply with the minimum flows and level (MFL) provisions of the Basis of
Review (BOR); § Will utilize the lowest water quality the applicant has the ability to use; § Will not significantly induce saline water intrusion; § Will not cause pollution of the aquifer; § Will not adversely impact offsite land uses existing at the time of the application; § Will not adversely impact an existing legal withdrawal; § Will incorporate water conservation measures; § Will incorporate reuse measures to the greatest extent practicable; § Will not cause water to go to waste; and, § Will not otherwise be harmful to the water resources within the District.
5.2. District Hydrogeology Per the SWFWMD RWSP, brackish groundwater in the District is found in coastal areas in the Upper Floridan and intermediate aquifers as a depth-variable transition between fresh and saline waters. Figure 5-3 depicts the generalized location of the freshwater / saltwater interface (as defined by the 1,000 mg/L isochlor) in the high production zone of the Upper Floridan aquifer. Generally, water quality declines to the south and west in the District in both the Upper Floridan aquifer and lower portion of the intermediate aquifer. Brackish groundwater is also found in the Lower Floridan aquifer.

Section 5
Potential Sources
City of Venice Water Supply Master Plan - Phase 2 5710010
5-5
Figure 5-3: Generalized Location of the Freshwater/Saltwater Interface
* Reproduced from the 2011 RWSP – Southern Planning Region
5.2.1. Regional Hydrogeologic Conditions The geologic and hydrogeologic conditions of Sarasota County have been described in numerous publications over the past century. Initially, the US Geological Survey (USGS) defined the geologic conditions of the region based on various classification schemes for sedimentary rocks. With recent emphasis on groundwater resources, research throughout the 1990s by the Florida Geological Survey (FGS), SWFWMD, and the USGS has shifted toward redefining the geology of the area into hydrostratigraphic units. In general, the hydrogeology of Sarasota County is represented by three regional aquifer systems; the Surficial Aquifer System (SAS), the Intermediate Aquifer System (IAS), and the Floridan Aquifer System (FAS). These aquifer systems are separated by regional aquitards, or semi-confining units. Each aquifer system generally contains one or more water producing zones separated by less permeable units which provide confined or semi-confined conditions and upward hydraulic gradients. A generalized geologic column is provided as Figure 5-4.

City of Venice 200 N WARFIELD AVE, VENICE, FL 34285
WATER MASTER PLAN PHASE 2
ARCADIS US, Inc
AUGUST 2013
FIGURE 5-4
WATER MASTER PLAN REPORTGeneralized Geologic Column
of the Venice Area
0
50
100
150
200
250
300
350
400
450
500
Average Feet Below Land Surface in the Vicinity of Venice Well FieldsSurficial Aquifer
System
Floridan AquiferSystem
Inte
rmed
iate
Aqu
ifer S
yste
mAquitard
Aquitard (Venice Clay)
Production Zone 1, Tamiami Formation
Production Zone 2, Upper Arcadia Formation
Aquitard (Arcadia Formation)
Production Zone 3, Lower Arcadia Formation,Tampa Member
Aquitard (Lower Arcadia Formation)
Upper Floridan Aquifer, Suwannee Limestone
G:\GISDATA\Projects\5710\010\MXD\Master Plan Report

Section 5
Potential Sources
City of Venice Water Supply Master Plan - Phase 2 5710010
5-7
5.2.2. Local Hydrogeologic Conditions
5.2.2.1. Surficial Aquifer System The SAS consists of Pliocene to Holocene-age fossiliferous siliciclastic deposits and forms a permeable unit contiguous with the land surface. The Holocene-age surficial deposits generally consist of light gray, fine-grained, quartz sand present in thicknesses up to 20 feet. The Pleistocene-age deposits consist of medium yellow-orange sand with clay and shell fragments and range from 0 to 40 feet in thickness. The lower-most unit of the SAS is the Caloosahatchee Marl of Pliocene and Pleistocene age and consists of sand and shell beds, phosphatic sand, marl, sandy limestone, and dolomite. In the vicinity of the Venice wellfields, the primary water-bearing zone of the SAS is unconfined and extends from approximately three to five feet below land surface (bls) to a maximum depth of approximately fifteen feet bls. Recharge to the SAS occurs from flow within the aquifer, precipitation, upward flow from the IAS, surface water features, and anthropogenic sources. In the Venice area, the SAS is used for limited domestic supply and irrigation.
5.2.2.2. Intermediate Aquifer System The IAS consists of inter-layered sand, shell, clay, and carbonate deposits, and is composed of three major semi-regional production zones. The IAS is generally greater than 400 feet thick and is composed of lithostratigraphic units of the Hawthorn Group. Slight changes in the depositional environment during the Oligocene and Miocene Epochs created a diverse range of lithologies within the aquifer system which resulted in both vertical and lateral heterogeneity and discontinuity. The IAS exists from a depth of approximately 35 feet to 470 feet bls and typically becomes more dense (less productive) and produces lower quality water as depth increases. Production Zone (PZ) 1 of the IAS consists of the Tamiami Formation. It has limited areal extent and is generally not used as a source for public water supply. PZ2 consists of the Upper Arcadia Formation and is used primarily for domestic and irrigation supply. However, PZ2 is more productive in the southern, coastal area of Sarasota County, where it also is used for public supply. PZ3 consists of the Tampa Member of the Lower Arcadia Formation and is the primary production zone of the IAS. PZ3 serves as the primary source for many public water supplies in the region. The City wellfields withdraw from PZ3 of the IAS. Previous consultant reports have defined two distinct zones within PZ3 based on water quality, quantity, and the degree of hydraulic confinement (GMW&A, 2007). The upper zone of PZ3 ranges from 220 feet to 320 feet bls and is separated from the lower zone by a semi-confining bed that ranges from approximately 320 feet bls to approximately 350 to 380 feet bls. The top of the lower zone of PZ3 occurs between 350 and 380 feet bls and the unit extends to a total depth of approximately 470 feet bls.
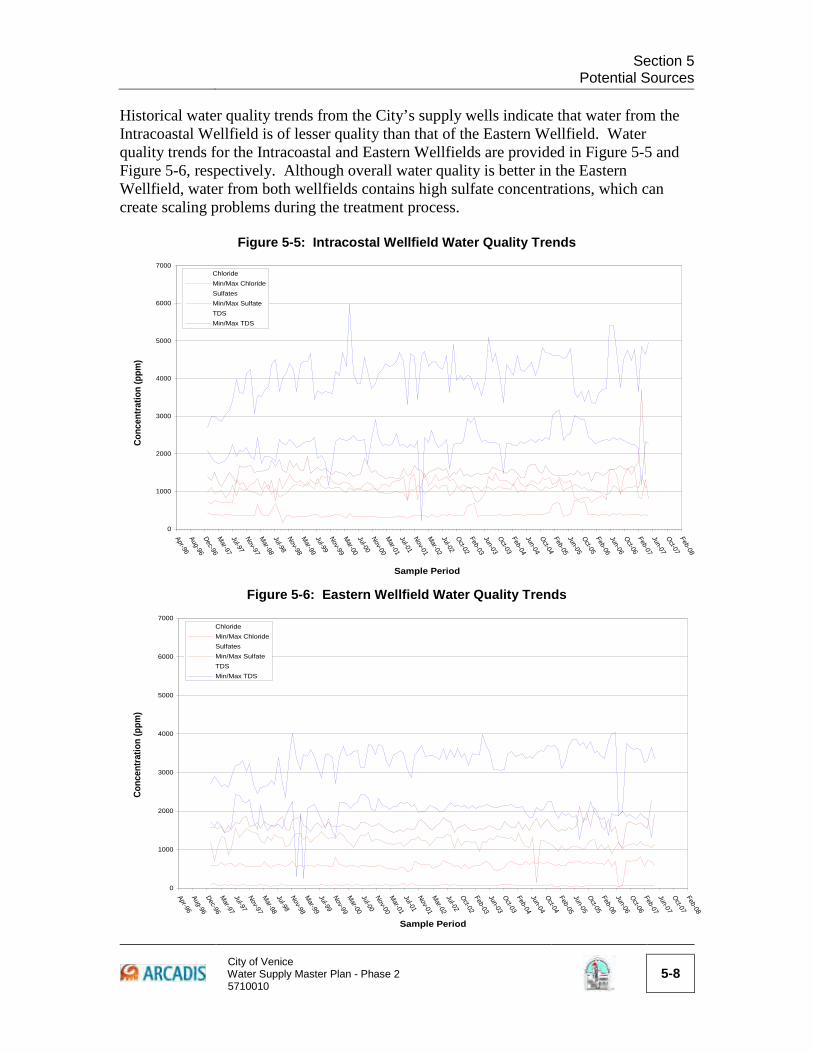
Section 5
Potential Sources
City of Venice Water Supply Master Plan - Phase 2 5710010
5-8
Historical water quality trends from the City’s supply wells indicate that water from the Intracoastal Wellfield is of lesser quality than that of the Eastern Wellfield. Water quality trends for the Intracoastal and Eastern Wellfields are provided in Figure 5-5 and Figure 5-6, respectively. Although overall water quality is better in the Eastern Wellfield, water from both wellfields contains high sulfate concentrations, which can create scaling problems during the treatment process.
Figure 5-5: Intracostal Wellfield Water Quality Trends
Figure 5-6: Eastern Wellfield Water Quality Trends
0
1000
2000
3000
4000
5000
6000
7000
Apr-96Aug-96Dec-96M
ar-97Jul-97Nov-97M
ar-98Jul-98Nov-98M
ar-99Jul-99Nov-99M
ar-00Jul-00Nov-00M
ar-01Jul-01Nov-01M
ar-02Jul-02Oct-02Feb-03Jun-03Oct-03Feb-04Jun-04Oct-04Feb-05Jun-05Oct-05Feb-06Jun-06Oct-06Feb-07Jun-07Oct-07Feb-08
Sample Period
Conc
entra
tion
(ppm
)
ChlorideMin/Max ChlorideSulfatesMin/Max SulfateTDSMin/Max TDS

Section 5
Potential Sources
City of Venice Water Supply Master Plan - Phase 2 5710010
5-9
5.2.2.3. Floridan Aquifer System The FAS is a major, regional groundwater flow system that extends from the north in parts of Georgia and Arkansas and dips southward extending toward the Caribbean. In the peninsular Floridan, the FAS may be present to depths greater than 3,500 feet. The primary producing zone of the FAS is the Upper Floridan Aquifer which consists of a thick sequence of Paleocene to Oligocene-aged rocks. In the vicinity of the Venice wellfields, the top of the Upper Floridan Aquifer coincides with the top of the Suwannee Limestone. Underlying the Suwannee Limestone are the Ocala Limestone, Avon Park Limestone, Lake City Limestone, and the Oldsmar Limestone. Early work by the USGS in the area of the Venice wellfields depicted the top of the Floridan Aquifer at approximately 220 feet. More recent work redefined this zone as the top of PZ3 of the Intermediate Aquifer. As withdrawals from the Upper Floridan Aquifer in coastal areas became limited as a result of saltwater intrusion, many wells in the region were allowed to be abandoned by backfilling the wells with gravel from the bottom of the well to approximately 220 feet bls, or the bottom of the well casing. These wells have provided a conduit for the migration of poor quality water upwards from the lower zone of PZ3 and pose a water quality concern for the existing Venice wells (GMW&A, 2007). In the Venice area, the Upper Floridan Aquifer is used for irrigation, aquifer storage and recovery (ASR), and public water supply (PWS). The lower portion of the FAS is used for deep well injection of municipal wastewater and RO concentrate disposal.
5.3. Future Well Sites and Potential Supply The City has identified two potential future well sites within the Venetian Golf and River Club Community. These locations have been preliminarily selected to locate the remaining permitted well, allowed via the City’s WUP. However, the City does not currently have property rights, and these sites have not been permitted at the time of this document. Figure 5-7 shows the potential well site locations with the Venetian Golf and River Club Community.

ARCADIS-US, INC.CITY OF VENICE200 N WARFIELD AVE, VENICE, FL 34285
WATER MASTER PLAN PHASE 2
WATER MASTER PLAN REPORT
POTENTIAL WELL LOCATIONS
³Legend
PotentialWellLocations
Water Distribution Piping1-inch
2-inch
3-inch
4-inch
6-inch
8-inch
9-inch
10-inch
12-inch
14-inch
16-inch
20-inch
24-inch
AUGUST 2013
FIGURE 5-7
0 1,000 2,000500
Feet
Well Site #1
Well Site #2
Well Site #4
Well Site #3

Section 5
Potential Sources
City of Venice Water Supply Master Plan - Phase 2 5710010
5-11
5.4. Regional Water Supply Plan – Southern Planning Region The SWFWMD coordinated with local governments and public entities to establish a RWSP, which was approved in 2001 and is to be updated every five years. The most recent update to the RWSP was completed in January 2011. The plan was established to set a framework for future decision making on water supply in areas where the hydraulic system is stressed so that all options are considered and that long term water needs are met. As part of the RWSP, SWFWMD strongly encourages the development of alternative water supplies and provides a variety of funding mechanisms to assist with implementation costs. The incentives can be used to fund a variety of projects including reclaimed water projects, low-volume plumbing rebate programs, desalination of seawater, storing of high river flows through the use of off-stream reservoirs and/or potable water ASR systems, water conservation education efforts, best management practice implementation, and water resource projects to return priority water bodies to their MFL status. The SWFWMD only funds the development of brackish groundwater sources where advanced membrane treatment is required. Brackish groundwater withdrawals that are treated by blending with fresh groundwater to reduce total dissolved solids (TDS) are categorized as traditional groundwater in the RWSP. The SWFWMD has not funded the development of any groundwater treatment facilities within its planning area.
5.4.1. Water Sources within the Southern Planning Region
5.4.1.1. Brackish Groundwater Desalination Due to the proximity of the brackish water supply to the coastline, brackish groundwater withdrawals from the Upper Floridan aquifer in the SWUCA have the potential to exacerbate saltwater intrusion. As such, requests for brackish groundwater will be evaluated similarly to requests for fresh groundwater withdrawals. Proposed withdrawals, either fresh or brackish, cannot impact Upper Floridan aquifer water levels in the most impacted area (MIA) of the SWUCA. The ultimate availability of brackish groundwater in the planning region, whether new or through expansion of existing facilities, must be determined on a case-by-case basis through the permitting process, per the 2011 RWSP. Because of this approach, the SWFWMD has not undertaken an analysis to determine the total amount of brackish groundwater available for water supply in the planning region. In its place, the availability of brackish groundwater for planning purposes is the quantity of finished water that will be developed from the unused permitted capacities of existing facilities plus the finished water capacities of facilities that are planned or actively being developed. The permitted annual average withdrawal within the Southern Planning region is 42.2 mgd, and the 2008 average withdrawals were 25.4 mgd. This means that the remaining available withdrawal is16.8 mgd. This does not account for withdrawal beyond the already permitted amounts.

Section 5
Potential Sources
City of Venice Water Supply Master Plan - Phase 2 5710010
5-12
The RWSP identifies two configurations for increased brackish water withdrawal for the City. According to the RWSP, both the City and PRMRWSA would be responsible for implementation of each configuration. Configuration 1 includes the construction of a new WTP to replace the existing Venice WTP. The new facility would have the capacity to produce 7.0 mgd of finished water with a recovery of 80%. The configuration includes five new intermediate aquifer supply wells, two deep-injection wells for RO concentrate disposal, and associated transmission pipelines. Configuration 2 includes the construction of a smaller RO facility that would have finished water capacity of 2.5 mgd with a recovery efficiency of 80 percent. The new facility would operate in conjunction with the existing WTP. The configuration includes the new WTP and five new sources.
5.4.1.2. Seawater Desalination Seawater can provide a stable source of water which is drought proof. It is becoming more attractive as traditional water supplies are diminished. Currently, there is only one seawater desalination WTP in the District. However, two options for large-scale seawater desalination facilities have been developed as part of the planning efforts for the Southern Planning Region by SWFWMD and PRMRWSA. The options include locating seawater desalination plants at Port of Manatee and the City of Venice, with each having a capacity of 20 mgd. According to the RWSP, the PRMRWSA would be responsible for implementation of each option. The site for the seawater desalination plant in the City is located near the Venice Airport. This site was chosen due to its close proximity to areas of high water demand, access to potential intake and discharge sites in the Intracoastal Waterway and Gulf of Mexico, and is near a permitted surface water discharge site. The site is also close to the Venice WTP and is interconnected to the Sarasota County distribution system, which could serve as a point of distribution for the finished water. Figure 5-8 shows the location of existing and potential seawater and brackish groundwater desalination facilities in the District.

Section 5
Potential Sources
City of Venice Water Supply Master Plan - Phase 2 5710010
5-13
Figure 5-8: Location of Existing and Potential Brackish and Seawater Desalination
Facilities * Reproduced from the 2011 RWSP – Southern Planning Region
5.4.1.3. Reuse System Expansion Wastewater from Venice residents is treated at the Eastside Advanced Wastewater Reclamation Facility (EAWRF). The Eastside WRF has a permitted treatment capacity of 6.0 mgd on a 3 month average daily flow (3-MADF) basis. Per the 2011 Capacity Analysis Report, in 2010 the Eastside WRF treated approximately 3.81 and 5.24 mgd on an AADF and maximum 3-MADF, respectively, and sent an annual average of about 2.77 mgd of reuse-quality effluent to over 2,800 private reuse connections, 5 golf courses, and 2 parks within the Venice Master Reuse System. The City also has an interconnection with Sarasota County, and has recently sent an average of 0.30 mgd for

Section 5
Potential Sources
City of Venice Water Supply Master Plan - Phase 2 5710010
5-14
use within the Sarasota County Master Reuse System. The excess portion of reuse water can also be mixed with RO concentrate from the WTP and discharged to surface water with system modifications, if additional adjustments to the RO concentrate stream are required in the future. Reuse, in lieu of potable water, is considered a viable source of water conservation. As discussed in Section 4.0, the City’s per capita water use is approximately 80 gallon per day (gpd) for full time residents. According to the SWFWMD RWSP, replacing residential potable water use with reclaimed water will account for an offset rate of 33 percent; while, agricultural potable water use replaced with reclaimed water will account for a 100 percent offset rate. The SWFWMD RWSP references expansion of the reclaimed water system between 2010 and 2030 as a potential water supply source. This project produces 0.5 mgd of reuse water, respectively, with corresponding offsets of 0.38 mgd. Additionally, fifteen WUPs for agriculture and aesthetic/recreational use exist within the city limits. These permits account for 1.2 mgd (annual average) and 5.6 mgd (peak month) withdrawals. Potential connections to these users with reuse water would decrease withdrawals from the groundwater system, which may be considered as an offset credit by SWFWMD and allow the City to increase groundwater withdrawals. However, the viability of this alternative is contingent upon the City’s availability of reuse water. Over the past few years, nearly all wastewater has been reclaimed and sent to distribution. However, as population and water use increase throughout the City, additional reuse water may become available.
5.4.1.4. Conservation The City currently has a water conservation plan and has completed several conservation projects. As mentioned in Section 2, the City’s conservation efforts include: n Higher utilization of reclaimed water, which replaces the need for potable water
irrigation in locations where reclaimed water is available; n SWFMWD-mandated watering restrictions, which were implemented in late 2006
and early 2007 and are still in use year-round; n The City’s tiered billing rate for potable water, which encourages conservation by
increasing the gallonage charge for high consumption quantities. n Numerous conservation protocols incorporated in the City’s previous and existing
WUPs, ensuring that the conservation efforts will continue in the future. n Rebates offered by the City and other agencies in March of 2012, for low water
appliances and fixtures. The City has replaced over 400 toilets with low flow toilets.
n Measures undertaken by City staff to ensure accuracy in metering of water consumption (i.e. changing out over 750 residential and commercial potable water meters during 2011).

Section 5
Potential Sources
City of Venice Water Supply Master Plan - Phase 2 5710010
5-15
As an example of the conservation potential, the estimated costs and associated water savings based on information published by SWFWMD for Sarasota County are summarized below in Table 5-1.
Table 5-1: Example Conservation Projects
Conservation Project Cost Amount
Conserved Sarasota County Showerhead Exchange Program
$24,000 0.33 mgd
Ultra Low Volume Toilet and High Efficiency Toilet Rebates
$2.42 / 1,000 gallons of public supply $1.22 / 1,000 gallons of domestic self-supply
0.71 mgd 0.051 mgd
Rain Sensors Installed on Irrigation Systems
$0.54 / 1,000 gallons of public supply $1.22 / 1,000 gallons of domestic self-supply $0.82 / 1,000 gallons of recreation/aesthetic
0.67 mgd 0.14 mgd 0.029 mgd
An evaluation of potential water supply alternatives for the City is presented in Section 7.

City of Venice Water Supply Master Plan - Phase 2 5710010
6-1
6
6. Interconnections
6.1. Existing Interconnections The City of Venice currently has two interconnections with Sarasota County. One 6-inch diameter connection is located on the south side of Venice near the intersection of Country Club Way and Gulf Coast Boulevard (Country Club Way Interconnection). The second interconnect is located on the north side of the City on the northeast corner of the intersection of Albee Farm Road and Colonia Lane (Colonia Lane Interconnection). This 10-inch diameter interconnection is operated with manual valves, and flow is allowed in either direction depending on system pressures. The locations of both interconnections are shown in Figure 6-1.
6.1.1. Terms of Agreement The City of Venice and Sarasota County have had an emergency interconnection agreement (Agreement) since December 13, 1994, allowing the purchase and sale of bulk water when needed by either party. The current Agreement, signed on October 9, 2012, states that when an emergency occurs, the Requesting Party with the water shortage may notify the Selling Party in writing to request a purchase of surplus water. The Selling Party must respond within 24 hours, advising the Requesting Party of the quantity of available water. A limit of 0.5 million gallons per day (mgd) for no more than 60 days, sold or purchased, is included in the agreement, and the rate of supply shall not exceed 400 gallons per minute (gpm) average over a 24 hour period. Water supplied under the Agreement is to be charged at the Selling Party’s bulk rate. This Agreement shall continue in effect for ten years and shall be automatically renewed for three additional five year terms unless otherwise terminated by either party.
6.1.2. Historical Interconnect Utilization The existing interconnections between the City and County are not used on a regular basis and are primarily in place for emergencies. The Colonia Lane interconnection was constructed in 1990 and has never been used. The Country Club Way interconnection has only been used once to supply Sarasota County during a water shortage and was reconstructed in 2012.

ARCADIS-US, INC.CITY OF VENICE200 N WARFIELD AVE, VENICE, FL 34285
WATER MASTER PLAN PHASE 2
WATER MASTER PLAN REPORT
EXISTING INTERCONNECTIONS
[Ú
[Ú
³
LegendWater Distribution Piping
1-inch
2-inch
3-inch
4-inch
6-inch
8-inch
9-inch
10-inch
12-inch
14-inch
16-inch
20-inch
24-inch
[Ú Pump Stations
UT Ground Storage Tanks
"³³ Elevated Storage Tank
3Q WTP
Existing City Limits
AUGUST 2013
FIGURE 6-1
0 5,000 10,0002,500
Feet
Interconnecton Location 6" (10" below grade)Albee Farm Road and Colonia Lane
Interconnecton Location 6" (8" below grade)Country Club Way Between
Gulf Coast Way and Pineland Ave

Section 6
Interconnections
City of Venice Water Supply Master Plan - Phase 2 5710010
6-3
6.1.3. Disinfectant Considerations The City of Venice utilizes free chlorine in the form of sodium hypochlorite for disinfection. Sarasota County, like most of the municipalities surrounding the City, uses chloramines rather than free chlorine. Without appropriate modifications to individual treatment systems, chloraminated water can be harmful to certain users such as kidney dialysis patients and tropical fish owners. When the City is required to use chloraminated water from an existing interconnection with Sarasota County, the affected service area must be notified. The combination of chlorinated and chloraminated water can also result in taste and odor problems caused by the formation of di- and tri-chloramines. Localized breakpoint chlorination may also occur, resulting in a loss of disinfectant residual. In the event that either interconnection is utilized, the Sarasota County Health Department and affected water customers must be notified no later than the previous business day for a planned use of the interconnection, according to Section 62-555.350 of the Florida Administrative Code (FAC).
6.2. Future Interconnection Needs In recent years, additional interconnects with other supply entities were considered desirable because population and demand projections anticipated a shortage of water supply. Updated population and flow projections suggest that the City will be able to provide adequate supply to meet projected annual average demands throughout the Master Planning period (see Section 4). However, additional interconnections could be beneficial to the City for supplementing projected max day demands, selling surplus water supply, and for use in emergency conditions.
6.2.1. Potential Interconnection Entities The City is bordered by unincorporated areas of Sarasota County, with whom two interconnections (and associated agreement framework) currently exist. In addition to Sarasota County, the Peace River/Manasota Regional Water Supply Authority (PR/MRWSA) has transmission lines in and around the City. The City has discussed the possibility of an interconnection with PR/MRWSA. The closest city to Venice is the City of North Port. However, an interconnection with this municipality is not considered viable at this time. North Port is a customer of PR/MRWSA and has several interconnections with them, with additional interconnections planned for the near future. Since the City of Venice is already considering an interconnection with PR/MRWSA, and has no existing interconnect framework with North Port, an interconnection with the City of North Port would not provide additional benefits above those provided by an interconnection with PR/MRWSA. A brief description of the key components of the Sarasota County and PR/MRWSA systems is provided in the following subsections. Additional interconnections with the County and/or the PR/MRWSA have been evaluated for the potential to help meet the

Section 6
Interconnections
City of Venice Water Supply Master Plan - Phase 2 5710010
6-4
regional water needs (emergency or other) for additional portions of the City of Venice service area. The results of these evaluations are presented in Sections 8.0 and 9.0.
6.2.1.1. Sarasota County The Sarasota County water system is comprised of three groundwater treatment facilities, 30 active wells, 16 ground storage tanks (36.75 million gallon (MG) usable capacity), two elevated storage tanks (2.25 MG usable capacity), 10 pumping stations, and several miles of transmission and distribution mains. In addition to County-owned raw water supply sources, the County has long-term bulk water supply agreements with Manatee County and PR/MRWSA. Sarasota County’s largest water treatment facility is the T. Mabry Carlton Water Treatment Facility. The electrodialysis reversal (EDR) treatment facility treats brackish groundwater and has a maximum design capacity of 12 mgd, provided by 10 parallel 1.2 mgd treatment trains. The Venice Gardens WTF has a design capacity of 2.75 mgd, and treats brackish groundwater with reverse osmosis treatment. The University WTF is located at the site of Manatee County Interconnect No. 1 and Pump Station No. 1, which was the original interconnect and pump station constructed in 1973 to deliver water purchased from Manatee County to Sarasota County’s potable water system. All of the County’s water treatment facilities utilize free chlorine (in the form of sodium hypochlorite) for primary disinfection, and ammonia is added to form chloramines for residual disinfection prior to distribution. The County also purchases water from two bulk water suppliers – PR/MRWSA and Manatee County. On October 5th, 2005, PR/MRWSA and the County entered into the current Second Amended Interlocal Agreement and the Master Water Supply Contract (the Contract). According to the terms of the Contract, the County is able to purchase 13.23 mgd on an annual average basis, and up to 18.52 mgd on a max day basis. Water purchased from PR/MRWSA is transferred to the County through Peace River Interconnect #1 (PRI1), located at the Carlton WTF. In addition to the Contract with PR/MRWSA, the County entered into a new wholesale water services agreement with Manatee County on October 21, 2003 (the Agreement). Currently, the County is able purchase up to 8.0 mgd of water, with the available quantity scheduled to step down until 2025, at which time the contract expires. There are a total of three interconnections with Manatee County.
PROJECTED COUNTY WATER DEMAND AND SUPPLIES As can be seen in Figure 6-2, Sarasota County is currently projected to have a surplus supply of water until approximately 2023, when a new project is proposed to aid the County in meeting future demands. While the County currently has planned projects to overcome projected water supply shortfalls, purchasing water from the City of Venice could also be a desirable option to meet potential demand shortfalls. However, the feasibility of selling water to the County

Section 6
Interconnections
City of Venice Water Supply Master Plan - Phase 2 5710010
6-5
will be highly dependent on City of Venice water surplus quantities and Sarasota County water demands many years down the road, as well as disinfection methodologies, cost benefit considerations, etc.
Figure 6-2: Sarasota County Projected Demand and Supplies
6.2.1.2. Peace River/Manasota Regional Water Supply Authority PR/MRWSA is an inter-local entity created to supply water to the region. PR/MRWSA’s treatment plant, the Peace River Treatment Facility (PRF), is located in southwest DeSoto County approximately 30 miles from the City of Venice WTP. PR/MRWSA currently has a water main connecting the PRF to Sarasota County’s Carlton WTP. In addition, several new transmission lines are planned for the area. An interconnection with PR/MRWSA has been evaluated as an option to help meet water needs (emergency or other) for the City of Venice (refer to Sections 8 and 9). The Peace River/Manasota Regional Water Supply Authority is a regional water supply authority under the laws of the State of Florida, created through an interlocal agreement between Charlotte, DeSoto, Hardee, Manatee, and Sarasota Counties in 1982. Hardee County subsequently withdrew from the PR/MRWSA in 1983 and the City of North Port now purchases water from the PR/MRWSA. The mission statement of PR/MRWSA is: “To provide the region with a sufficient, high quality, safe drinking water supply that is reliable, sustainable and protective of our natural resources now and into the future.”
0
5
10
15
20
25
30
35
40
45
50
2015 2016 2017 2018 2019 2020 2021 2022 2023 2024 2025 2026 2027 2028 2029 2030 2031 2032 2033
Max
imum
Day
Sup
ply
(MG
D)
Year
County Projected Max Day Demand

Section 6
Interconnections
City of Venice Water Supply Master Plan - Phase 2 5710010
6-6
The water supply components of the PRF include river intake, off-stream raw water storage, conventional surface water treatment, and finished water storage in both ground storage tanks and aquifer storage and recovery (ASR) well fields. The PR/MRWSA is permitted to withdraw 32.7 mgd (annual average) of raw water from the Peace River, and free chlorine is utilized for primary disinfection, while chloramines are used for secondary disinfection. The recently completed Regional Expansion Project (REP) increased the PR/MRWSA treatment and storage capacity, and included expansion of the water treatment facility to a capacity of 48 mgd, and the installation of a new 6.0 billion gallon (BG) raw water storage reservoir. The PRF has several regional transmission lines including a 36-inch diameter, seven-mile long transmission main that feeds Charlotte County, a 12-inch diameter transmission main that feeds southwest DeSoto County, and a 42-inch diameter, 23-mile long regional transmission line that connects the Carlton WTP to the PRF. Every day, PR/MRWSA supplies an average of 25 mgd to their customers. The remaining WTP capacity is used for recharging the ASR system.
PR/MRWSA FUTURE PLANS PR/MRWSA has looked at several options for continuing to provide water for its members in the future. They have worked with local municipalities to form a Water Planning Alliance (the Alliance) for the area’s water supplies and have coordinated an Integrated Loop Study to provide a means to share water among local municipalities. The Water Planning Alliance was formed approximately 10 years ago to further cooperative solutions to water supply issues within the four-county area of Charlotte, DeSoto, Manatee, and Sarasota Counties. It is a voluntary group of municipalities that includes the following fifteen members:
§ Charlotte County § DeSoto County § Manatee County § Sarasota County § City of Arcadia § City of Bradenton § City of North Port § City of Palmetto § City of Punta Gorda
§ City of Sarasota § City of Venice § Town of Longboat Key § Englewood Water District § West Villages Improvement
District § Lakewood Ranch Stewardship
District
The Alliance’s goal is to forge a regional system that is interconnected, diversified, affordable, and environmentally sensitive. To achieve this, the Alliance has been working on a two-phase regional, long-term study to identify water supply sources for the area municipalities. The first phase assessed the existing water supply sources and treatment facilities and was completed in October 2003. The study showed that the total treated water demand surpassed the available treated water during the planning period (20

Section 6
Interconnections
City of Venice Water Supply Master Plan - Phase 2 5710010
6-7
years). The second phase of the study included future water supply options (discussed in Section 5).
INTEGRATED LOOP STUDY A study was completed in 2006 that evaluated a new system, called the Regional Integrated Loop System, which would transmit finished water from sources with excess
water to areas within PR/MRWSA’s service area undergoing water shortage. The study evaluated alternatives and developed preliminary pipeline routes, sizes, interconnection points, and schedules based upon existing and future water supplies and demands. A phased implementation plan for several Regional Integrated Loop System projects was developed. Table 6-1 shows interconnection projects that have been completed to date and associated costs.
Table 6-1: Completed Interconnection Projects
Phase Location/Interconnection Pipe
Diameter (in)
Pipe Length
(mi) Cost Construction
Completion Date
I PRF to City of Punta Gorda Sarasota County Water Treatment Plant (SCWTP) 24 5.9 $11,500,000 May 2008
II PRF to North Port WTP 36 16.3 $41,188,000 November 2010
IIIA Carlton WTP to northern Sarasota County System – Preymore Pipe 60 9.7 $34,618,000 November 2011
Table 6-2 shows planned projects that have yet to be completed, as well as projected costs for land acquisition, transmission main, flow metering, storage tank, booster pump station, chemical feed facilities, and required instrumentation and controls.
Table 6-2: Planned Interconnection Projects
Phase Location/Interconnection Pipe
Diameter (in)
Pipe Length
(mi) Cost Construction
Completion Date
IIA North Port WTP to Sarasota County Carlton WTP 36 14.5 $37,294,000 April 2018
IIB North Port WTP to Englewood Water District System 36 to 24 14.8 $27,186,000 May 2014
IIIB2 Preymore Pipe to Sarasota County Storage Tank 60 13.6 $55,009,000 2025 / 2030
IVA Sarasota County Storage Tank to Manatee County System near University WTP 24 5.8 $14,761,000 2030
IVB Sarasota County Storage Tank to Manatee County WTP 60 to 36 15.8 $41,774,000 May 2016
The study is summarized in PR/MRWSA’s Integrated Regional Water Supply Master Plan, which was published in September 2008.
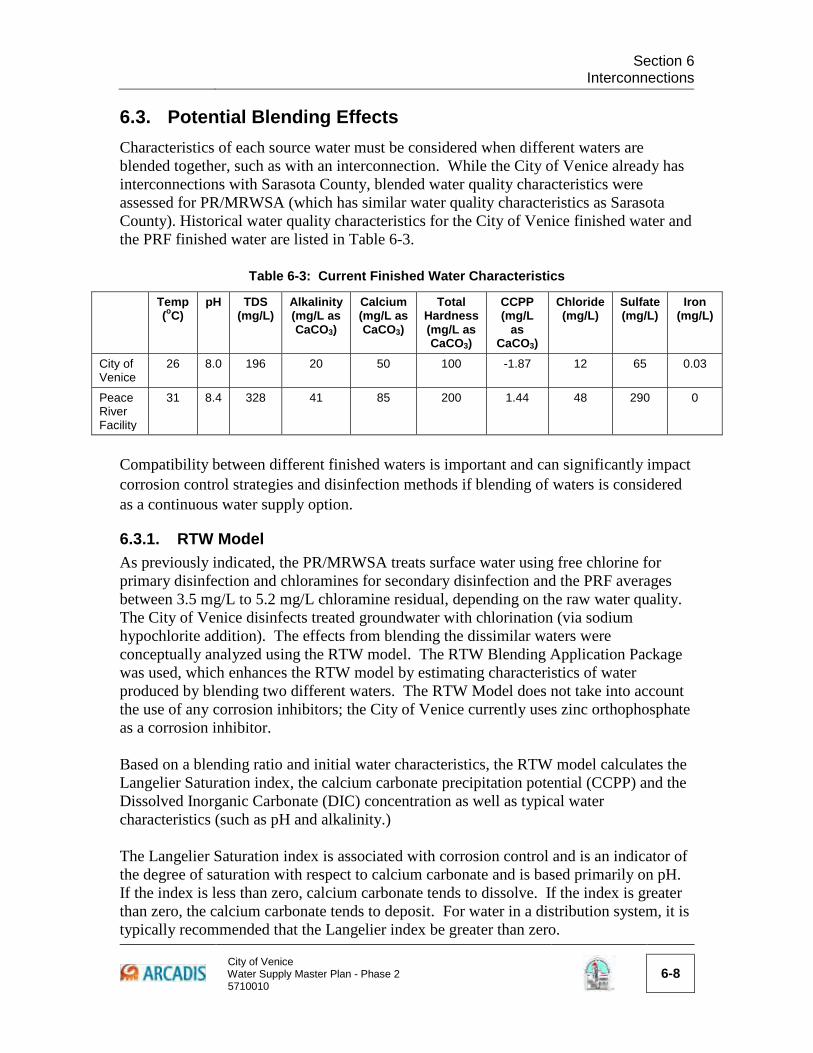
Section 6
Interconnections
City of Venice Water Supply Master Plan - Phase 2 5710010
6-8
6.3. Potential Blending Effects Characteristics of each source water must be considered when different waters are blended together, such as with an interconnection. While the City of Venice already has interconnections with Sarasota County, blended water quality characteristics were assessed for PR/MRWSA (which has similar water quality characteristics as Sarasota County). Historical water quality characteristics for the City of Venice finished water and the PRF finished water are listed in Table 6-3.
Table 6-3: Current Finished Water Characteristics
Temp (oC)
pH TDS (mg/L)
Alkalinity (mg/L as CaCO3)
Calcium (mg/L as CaCO3)
Total Hardness (mg/L as CaCO3)
CCPP (mg/L
as CaCO3)
Chloride (mg/L)
Sulfate (mg/L)
Iron (mg/L)
City of Venice
26 8.0 196 20 50 100 -1.87 12 65 0.03
Peace River Facility
31 8.4 328 41 85 200 1.44 48 290 0
Compatibility between different finished waters is important and can significantly impact corrosion control strategies and disinfection methods if blending of waters is considered as a continuous water supply option.
6.3.1. RTW Model As previously indicated, the PR/MRWSA treats surface water using free chlorine for primary disinfection and chloramines for secondary disinfection and the PRF averages between 3.5 mg/L to 5.2 mg/L chloramine residual, depending on the raw water quality. The City of Venice disinfects treated groundwater with chlorination (via sodium hypochlorite addition). The effects from blending the dissimilar waters were conceptually analyzed using the RTW model. The RTW Blending Application Package was used, which enhances the RTW model by estimating characteristics of water produced by blending two different waters. The RTW Model does not take into account the use of any corrosion inhibitors; the City of Venice currently uses zinc orthophosphate as a corrosion inhibitor. Based on a blending ratio and initial water characteristics, the RTW model calculates the Langelier Saturation index, the calcium carbonate precipitation potential (CCPP) and the Dissolved Inorganic Carbonate (DIC) concentration as well as typical water characteristics (such as pH and alkalinity.) The Langelier Saturation index is associated with corrosion control and is an indicator of the degree of saturation with respect to calcium carbonate and is based primarily on pH. If the index is less than zero, calcium carbonate tends to dissolve. If the index is greater than zero, the calcium carbonate tends to deposit. For water in a distribution system, it is typically recommended that the Langelier index be greater than zero.

Section 6
Interconnections
City of Venice Water Supply Master Plan - Phase 2 5710010
6-9
The CCPP indicates the potential for calcium carbonate precipitation to occur and is dependent upon the alkalinity and calcium concentrations present relative to the CaCO3 saturation pH. Low or negative CCPP values indicate the potential to leach calcium from Asbestos-Cement pipe and cement-mortar linings, which can ultimately lead to pipe failures and other water quality problems. CCPP is recommended to be in the range of 4 to 10 mg/L. Several ratios of the blended waters were evaluated; a 50/50 split between Venice and the PRF, a 70/30 Venice/PRF split and a 30/70 Venice/PRF split. The projected final quality conditions are presented in Table 6-4:
Table 6-4: Estimate of Blended Water Characteristics (RTW Model)
Approximate Final Water Characteristics
100% Venice
70% Venice / 30% PRF
50% Venice / 50% PRF
30% Venice / 70% PRF
100% PRF
pH 8.01 8.20 8.29 8.35 8.40
Alkalinity (mg/L as CaCO3)
20 26 31 35 41
Langelier Index -0.65 -0.25 -0.04 0.12 0.32
CCPP (mg/L) -1.87 -0.88 -0.24 0.42 1.44
DIC (mg/L as CaCO3) 40 52 60 69 81
Table 6-4 shows that as the PRF water is blended with the City of Venice, the values increase for all of the parameters. The Langelier Index is brought to within the recommended range above a 50/50 split (PRF/Venice). The CCPP also increases, but does not meet the recommended range of 4-10 mg/L (however, as stated above, the RTW model does not take into account the use of corrosion inhibitors). The pH of the blended water increases as water from the PRF is added to the Venice water. This may adversely affect the orthophosphate corrosion control and brings the pH high enough to minimize the water’s buffer capacity. As it is, the City of Venice is on the high-end of the effective range for orthophosphate corrosion control. However, alkalinity, CCPP, and the Langelier index all increase as PRF water is introduced, providing a positive impact on corrosion potential.
6.3.2. Possible Corrosion Control Blending Issues Corrosion control is employed by treatment facilities to protect the distribution system from deterioration and in accordance with the requirements of the Lead and Copper Rule (see Section 3 – Regulatory Assessment for more information). There are two common methods used for corrosion control: corrosion inhibitors and additive pH/alkalinity adjustment. The City of Venice uses a phosphate-based corrosion inhibitor, while the PRF uses pH adjustment to control corrosion in the distribution system. The PRF uses pH adjustment for corrosion control via carbonate passivation of the finished water. Passivation is the formation of insoluble lead, copper, and iron species,

Section 6
Interconnections
City of Venice Water Supply Master Plan - Phase 2 5710010
6-10
on the interior of distribution piping. As pH increases, the solubility of lead and copper typically decreases. An adequate level of dissolved inorganic carbonate (alkalinity) is required to assure formation of metal carbonate complexes and prevent leaching of lead, copper, and iron. Due to the amount of asbestos-cement and cement mortar-lined pipe in the City of Venice distribution system, it would be necessary to maintain a positive CCPP within the distribution system without the use of a corrosion inhibitor. As shown in Table 6-4, blending with water supplied by the PRF actually decreases the corrosion potential within the distribution system. In lieu of maintaining a higher CCPP, the City of Venice’s corrosion control strategy (zinc orthophosphate addition) inhibits corrosion by forming a protective coating in the piping system (i.e. passivation). Like pH/alkalinity adjustment, which encourages carbonate passivation, orthophosphate encourages the formation of insoluble metal-phosphate complexes on the interior of distribution piping. These complexes prevent the dissolution of lead, copper, and iron. The optimum pH for an orthophosphate corrosion controlled water is typically between 7 and 8. The City runs on the high end of this range. The effectiveness of each strategy can be compromised when two waters with different corrosion control methods are combined. When a phosphate-controlled water is blended with a pH-controlled water, the pH may change such that the phosphate is no longer in the optimum pH range. When a pH-controlled water is blended with phosphate-controlled water, changes in pH or alkalinity may occur and compromise the corrosion control. Provisions should be provided so that effective corrosion control is maintained.
6.3.3. Possible Disinfection Blending Issues In addition to corrosion control, maintenance of effective disinfection is of concern when blending PRF and City of Venice water. The PRF currently utilizes chloramines for secondary disinfection, whereas the City of Venice utilizes free chlorine. Blending of chloraminated and chlorinated waters can lead to taste and odor problems, loss of residual, and other water quality problems (e.g. increased nitrification potential). Therefore, the City of Venice would need to convert to chloramines at the interconnection or at the RTP WTP if the City has the intention of routinely selling or purchasing water from either Sarasota County or the PR/ MRWSA. Based on previous experience with similar projects, no significant change is expected in water quality as a result of chloramine conversion. However, the finished water oxidation reduction potential (ORP) may be reduced depending on the current free chlorine dose and future chloramines dose. The change in ORP could cause shifts in mineral speciation of pipe scales in cast-iron pipe and lead service lines. The City of Venice does not have any lead service lines; however, some home plumbing systems may have lead solder or lead bearing materials (such as brass fixtures or meters.)
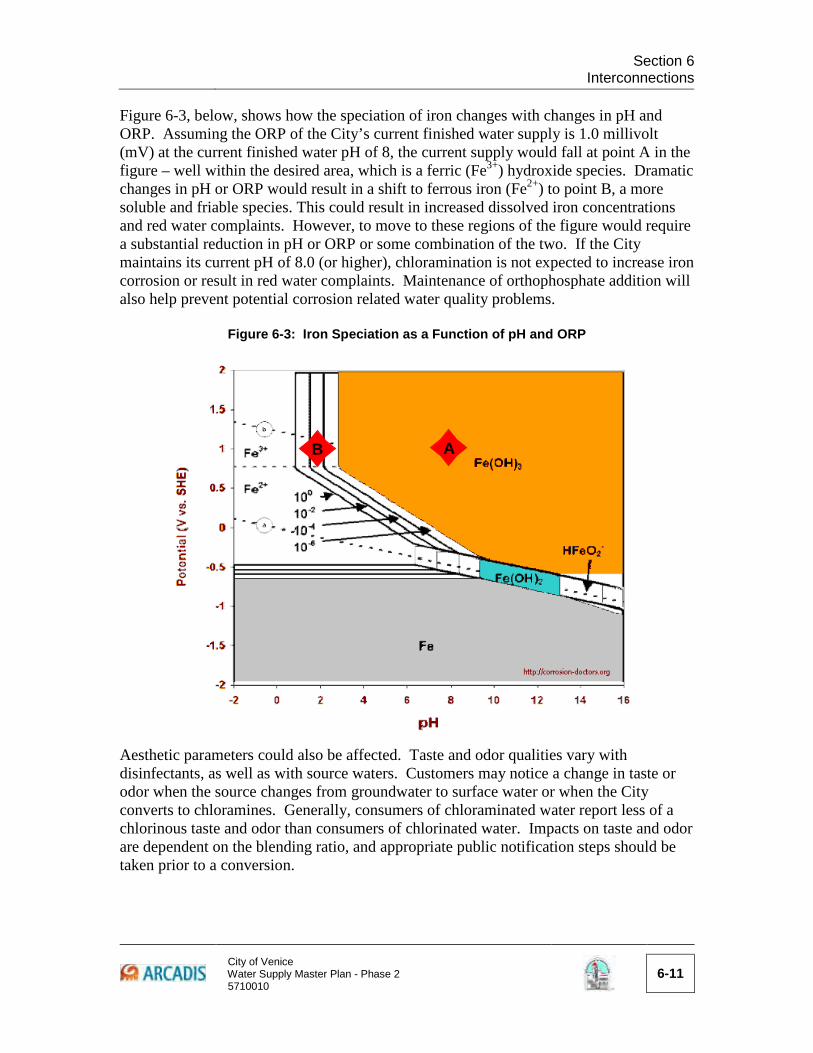
Section 6
Interconnections
City of Venice Water Supply Master Plan - Phase 2 5710010
6-11
Figure 6-3, below, shows how the speciation of iron changes with changes in pH and ORP. Assuming the ORP of the City’s current finished water supply is 1.0 millivolt (mV) at the current finished water pH of 8, the current supply would fall at point A in the figure – well within the desired area, which is a ferric (Fe3+) hydroxide species. Dramatic changes in pH or ORP would result in a shift to ferrous iron (Fe2+) to point B, a more soluble and friable species. This could result in increased dissolved iron concentrations and red water complaints. However, to move to these regions of the figure would require a substantial reduction in pH or ORP or some combination of the two. If the City maintains its current pH of 8.0 (or higher), chloramination is not expected to increase iron corrosion or result in red water complaints. Maintenance of orthophosphate addition will also help prevent potential corrosion related water quality problems.
Figure 6-3: Iron Speciation as a Function of pH and ORP
Aesthetic parameters could also be affected. Taste and odor qualities vary with disinfectants, as well as with source waters. Customers may notice a change in taste or odor when the source changes from groundwater to surface water or when the City converts to chloramines. Generally, consumers of chloraminated water report less of a chlorinous taste and odor than consumers of chlorinated water. Impacts on taste and odor are dependent on the blending ratio, and appropriate public notification steps should be taken prior to a conversion.
B A

City of Venice Water Supply Master Plan - Phase 2 5710010
7-1
7
7. Water Supply and Production Capacity Assessment and Recommendations
7.1. Introduction As discussed in Section 4.3.2, based on current demand projections, the City will need to begin planning and implementation of improvements to increase supply and/or production capacity by around 2029 to ensure adequate capacity is available before projected demands exceed the existing production capacity. This section discusses alternatives identified to increase the City’s water supply capacity to address projected long-term production needs.
7.2. Alternative 1 - Increased Recovery – Add Second Stage RO Skids
One alternative to increase the City’s water production capacity is to increase the recovery of the RO WTP. This alternative would increase production capacity without increasing the amount of water required to be extracted from the permitted raw water supply wells. Recovery is defined as the percentage of the feed water that is converted to permeate. As the recovery increases, the amount of finished water able to be produced from the same amount of raw feed water also increases. Two-stage RO systems typically allow for operation at higher recoveries than single-stage systems. For these systems, concentrate from the first stage is fed to the second stage to produce additional permeate and a lower volume, more highly concentrated waste stream. This is important – increasing the recovery will reduce the volume of concentrate generated, but will increase the salt concentration of the concentrate.
The August 2012, Reverse Osmosis Water Treatment Plant Preliminary Investigation Basis of Design Report (RO Preliminary BODR), completed by ARCADIS, included a preliminary desktop study that investigated the feasibility of increasing the WTP’s current RO permeate recovery of 50%. The desktop study was performed using RO membrane manufacturers’ modeling software to evaluate equipment and operational requirements needed to increase permeate recovery. The study concluded that a 75% permeate recovery may be achievable for a two-stage RO system using proper pretreatment system design.
Based on projections performed using Toray Design Software, the following flow and water quality values were estimated for one RO train array at 75% recovery.

Section 7 Water Supply and Production Capacity
Assessment and Recommendations
City of Venice Water Supply Master Plan - Phase 2 5710010
7-2
Table 7-1: Modeled Flow and Water Quality Values – Single RO Train Array
Parameter
Value(1)
Average TDS High TDS
Blend Flow (gpm) 105 50
Permeate Flow (gpm) 750 750
Blended Product Flow: Permeate + Blend (mgd) 1.23 1.15
Percent Blend 12% 6%
TDS (mg/L) 391 378
pH 5.8 5.7 (1) Based on year five membrane projections
Pilot testing is recommended to verify whether a 75% recovery is feasible, to assess if available antiscalants can prevent membrane scaling at this high recovery, and to help confirm the operating parameters (flux, feed pressure, etc.) for the proposed RO system. Also, further investigation is required to determine whether the increased permeate recoveries will allow the City to continue using their existing NPDES permit. However, preliminary assessments indicate that upgrading the RO WTP to 75% recovery would result in approximately 6.38 mgd of treated water on a peak month basis with the City’s current WUP limits of 8.24 mgd (5.6 mgd of permeate, 0.78 mgd of blend, 1.85 mgd of concentrate).
The estimated cost to expand the single stage units to a second stage (assuming the ongoing RO membrane rehabilitation project includes provisions for this, as discussed in Section 8.3.1) is estimated to be approximately $3,000,000. Expanding the single stage skids to two stages would require new feed, permeate, interconnecting and concentrate piping, as well as interstage booster pumps, additional valves, an energy recovery device (ERD), instrumentations and controls. Additional information on the two-stage RO treatment alternative can be found in the RO Preliminary BODR (August 2012). This does not include a potential alternative concentrate disposal method which may be required if additional discharges to the ICWW cannot be permitted (refer to Section 7.5 for additional discussion on concentrate management impacts).
This alternative has the following advantages and disadvantages:
Advantages:
n The RO WTP production capacity can be increased by approximately 50% without increasing raw water well extraction.
n The existing WUP can be used without requiring modification since groundwater well extractions will not be impacted.
n The latest RO equipment technology can be provided; decreasing energy costs and increasing permeate recovery.

Section 7 Water Supply and Production Capacity
Assessment and Recommendations
City of Venice Water Supply Master Plan - Phase 2 5710010
7-3
n This alternative would meet potential future Southwest Florida Water Management District (SWFWMD) requirements for increases in recovery.
n Potentially the most cost-effective production capacity alternative if the high recovery can be reliably achieved.
Disadvantages:
n NPDES permit modification or an alternative concentrate disposal method may be required if increased concentrate parameter concentrations exceed current discharge limits (see Section 7.5).
n Piloting is needed to confirm achievable recovery and concentrate parameter concentrations and flows.
7.3. Alternative 2 - Increased Recovery – Install Higher Quality Supply Wells
Another alternative considered for increasing the City’s water supply capacity is to increase the source water quality to the WTP. This would result in an increase of RO treatment process efficiency while decreasing raw water demands. As discussed in Section 5, the hydrogeology of Sarasota County is generally represented by three regional aquifer systems; the Surficial Aquifer System (SAS), the Intermediate Aquifer System (IAS), and the Floridan Aquifer System (FAS). The existing City wellfields withdraw from the IAS, and historical water quality trends indicate that water from the Intracoastal Wellfield is of lesser quality than that of the Eastern Wellfield. However, although overall water quality is better in the Eastern Wellfield, water from both wellfields contains high sulfate concentrations, which can create scaling issues during the reverse osmosis treatment process. The City has preliminarily identified four potential sites for new production wells within the Venetian Golf and River Club Community. Along the western coast of Florida, water quality of the Intermediate Aquifer increases to the east, away from the Gulf of Mexico and the existing saline water intrusion front. It is assumed that water from production wells in the Venetian Golf and River Club Community would be of comparable quality and quantity to water produced from the Eastern Wellfield. Therefore, if wells are installed at the Venetian Golf and River Club Community sites, the same finished water demands could be met with less raw water withdrawals. Based on the productivity of wells in the Eastern Wellfield, it is estimated that five new wells would be required to substitute the withdrawals from the Intracoastal Wellfield. It is anticipated that higher water quality from potential wells at the Venetian Golf and River Club Community sites can increase RO WTP system efficiency and overall recovery from 50% up to about 60% in the existing single-stage system. This increase in

Section 7 Water Supply and Production Capacity
Assessment and Recommendations
City of Venice Water Supply Master Plan - Phase 2 5710010
7-4
recovery equates to a production capacity of 4.75 mgd (a 0.43 mgd increase over current capacity). Also, because water quality to the plant would improve, annual operations and maintenance costs are anticipated to decrease. However, the total cost per new well, including design, bidding, drilling, construction, equipment, and testing is estimated at about $650,000. This results in a total cost of $3,250,000 for an estimated production increase of only 0.43 mgd. This alternative has the following advantages and disadvantages: Advantages:
n Higher raw water quality would increase the RO system recovery by up to 10% (4.32 mgd + 0.43 mgd = 4.75 mgd).
n No upgrades or modifications would be required to the existing treatment plant infrastructure.
n Decreased energy and chemical use due to the increased influent water quality (less feed pressure and lower antiscalant dose required).
n Projected concentrate flow and parameter concentration impacts from the increased recovery are not expected to exceed existing NPDES permit limits; therefore, modification to the permit would not be required (see Section 7.5).
Disadvantages:
n Requires a significant capital investment for the new raw water supply wells, while resulting in a relatively small increase in treated water production capacity.
n Piloting is needed to confirm achievable recovery and impact on concentrate parameter concentrations and flows.
Additionally, a preliminary water quality comparison suggests that local water from the Upper FAS may be of a higher quality than that of the City’s existing raw water supply wells with respect to TDS and sulfate. SWFWMD considers the Upper FAS an alternative water supply and obtaining a water use permit for supply wells in this system is a possibility. Other local municipalities, including Sarasota County, Charlotte County, and the City of Punta Gorda also have supply wells located within this portion of the aquifer system. However, more detailed analysis and modeling would be required to determine the feasibility and potential permeate recovery of water from the Upper FAS. Planning level cost for an Upper FAS well, including design, installation, construction, equipment, and testing, is about $1,500,000. The City could also opt to install an Upper Floridan supply well instead of the 15th well currently permitted in the existing WUP (or, to replace existing well 7W which is unable

Section 7 Water Supply and Production Capacity
Assessment and Recommendations
City of Venice Water Supply Master Plan - Phase 2 5710010
7-5
to produce the groundwater it was designed and permitted to produce). If the City is interested in pursuing this supply option, additional investigation of water quality, potential recovery, and permitting feasibility is recommended.
7.4. Alternative 3 - Increased Capacity – Single Stage RO Plant Expansion
A third alternative to increase production capacity is to increase the number of single stage RO trains while maintaining the current 50% recovery. This alternative would maintain current operating strategies since system recoveries would remain unchanged. Scaling potential would be minimized at this recovery rate and chemical usage would only increase in proportion to the increased flows, minimizing impacts to current operations and maintenance requirements.
This alternative, however, would require increased withdrawals from existing (or additional) wells, necessitating a modification to the existing WUP. Permitting of this alternative may not be possible given that increased raw water withdrawals from the Intermediate Aquifer are not favored by the SWFWMD, especially since other alternatives are available that do not require increased raw water withdrawals (i.e. Alternative Nos. 1 and 2). SWFWMD strictly regulates groundwater withdrawals within the District and in particular in the Southern Water Use Caution Area (SWUCA), where the City of Venice is located.
This alternative would also result in increased concentrate flows, exceeding the NPDES permit flow limit (see Section 7.5) and requiring a modification to the existing discharge permit. Alternative No. 3 would also require the installation of additional treatment equipment, piping modifications, and would likely require a building expansion.
Although unlikely, for comparison purposes with Alternative No. 1, it is assumed that four new wells could be permitted and installed in the Intermediate Aquifer System, with each providing a raw water flow of 1.0 mgd. This would provide an additional feed supply of 4 mgd, and a treated water flow increase of 2.0 mgd (4.32 mgd + 2.0 mgd = 6.32 mgd). It is also assumed that additional cartridge filters, feed pumps, and a building expansion would be required for this alternative in addition to the required membrane elements, skids, chemical feed systems, and piping and valve modifications. The planning level capital cost for this alternative is estimated to be about $11,750,000. This does not include a potential alternative concentrate disposal method which may be required if additional discharges to the ICWW cannot be permitted.
This alternative has the following advantages and disadvantages:

Section 7 Water Supply and Production Capacity
Assessment and Recommendations
City of Venice Water Supply Master Plan - Phase 2 5710010
7-6
Advantages:
n Maintains current system operating strategies since system recoveries would remain unchanged.
n Scaling potential is less than Alternative Nos. 1 and 2 due to the reduced permeate recovery, resulting in less chemical usage and maintenance requirements.
Disadvantages:
n Required WUP modifications for increased raw water withdrawal from the existing supply wells may not be allowed by SWFWMD.
n Would require a larger footprint for the same capacity increase when compared to Alternative Nos. 1 and 2.
n Potential future increases in SWFWMD recovery requirements could require RO treatment recoveries greater than 50%.
n NPDES modifications would be required due to increased concentrate flows and mass loadings. An alternative concentrate disposal method may be required.
7.5. Concentrate Management Considerations The City of Venice RO WTP concentrate is currently discharged into a mixing zone in the Gulf Intercoastal Waterway. The RO concentrate discharge is permitted through an industrial wastewater facility permit, which constitutes authorization to discharge to the ICWW under the NPDES. Table 7-2 illustrates the RO concentrate water quality limits set forth in the City’s NPDES permit and the RO WTP’s maximum and minimum concentrate water quality from the 2012 RO Preliminary Design BODR.
Table 7-2: Concentrate Discharge Limits and RO WTP Discharge
Parameter
Permit FL0035335 Discharge Limitations
Historical Concentrate Discharge(2)
Monthly Average
Daily Maximum
Daily Minimum
Daily Maximum
Daily Minimum
Flow (mgd) Report 3.56(1) - 2.9 -
Chlorine, Total Residual (mg/L) Report 0.01 - 0.01 -
Solids, Total Suspended (mg/L) Report 5 - 3 -
pH (s.u.) - 8.5 6.5 7.5 7.3
Fluoride, Total (mg/L) Report 5 - 3.5 -
Copper, Total Recoverable (mg/L) Report 0.0037 - 0.0026 -
Oxygen, Dissolved (mg/L) 5 - 4 - 5.1

Section 7 Water Supply and Production Capacity
Assessment and Recommendations
City of Venice Water Supply Master Plan - Phase 2 5710010
7-7
Parameter
Permit FL0035335 Discharge Limitations
Historical Concentrate Discharge(2)
Monthly Average
Daily Maximum
Daily Minimum
Daily Maximum
Daily Minimum
Radium 226 + Radium 228, Total (pCi/L) Report 17 - 15.4 -
Alpha, Gross (pCi/L) Report 55 - 42.4 -
Specific Conductance (uohms/cm) Report Report - - 7444
Chloride (mg/L) Report Report - 2840 -
Whole Effluent Toxicity (Acute) Factor of Specific Permit Conditions - - (1) Consecutive 7-day average (2) Data presented is from RO Preliminary BODR (August 2012), gathered from DEP Form 62-620.910(18) Part V
and from DMR summary tables.
7.5.1. Concentrate Quality Tables 7-3 and 7-4 show the projected concentrate water qualities for the Average and High TDS water quality conditions at the assumed recoveries for Alternative Nos. 1, 2 and 3 (75, 60, and 50% permeate recoveries, respectively). A comparison of Tables 7-2, 7-3, and 7-4 shows that for Alternative No. 1 (75% permeate recovery) under average and high TDS conditions, fluoride and radium 226/228 are projected to be above the existing permit limits. For the high TDS condition and 75% permeate recovery, gross alpha exceeds the NPDES permit limit. Projected chloride concentrations show high daily maximum values for the high TDS conditions for Alternative No. 1; however, there is no permit limit for this parameter.
Table 7-3: Concentrate Water Quality for Average TDS Conditions
Parameter Concentrate Water Quality Permit Limits
Alternative 1 (75% Rec)
Alternative 2 (60% Rec)
Alternative 3 (50% Rec)
Daily Maximum
Flow (mgd)(1) 1.85 3.15 6.32 3.56(4) Chlorine, Total Residual (mg/L)(2) 0.01 0.01 0.01 0.01 Solids, Total Suspended (mg/L) 2.3 1.4 1.1 5 pH (s.u.)(3) NA NA NA 8.5 Fluoride, Total (mg/L) 6.9 4.4 3.5 5 Copper, Total Recoverable (mg/L) 0.0028 0.0018 0.0014 0.0037 Oxygen, Dissolved (mg/L)(2) NA NA NA - Radium 226 + Radium 228, Total (pCi/L) 22.1 13.8 11.0 17
Alpha, Gross (pCi/L) 49 31 25 55 Specific Conductance (umohs/cm) 14,138 8,837 7,069 Report Chloride (mg/L) 1,835 1,153 924 Report
Whole Effluent Toxicity (Acute) NA NA NA Specific Permit Conditions
(1) Assumes 2 RO trains running 24 hours per day for Alternate 1 & 2 (2) Dependent on post-treatment (3) Dependent on whether acid injection is used; sodium hydroxide can be added to raise pH if necessary (4) Consecutive 7-day average
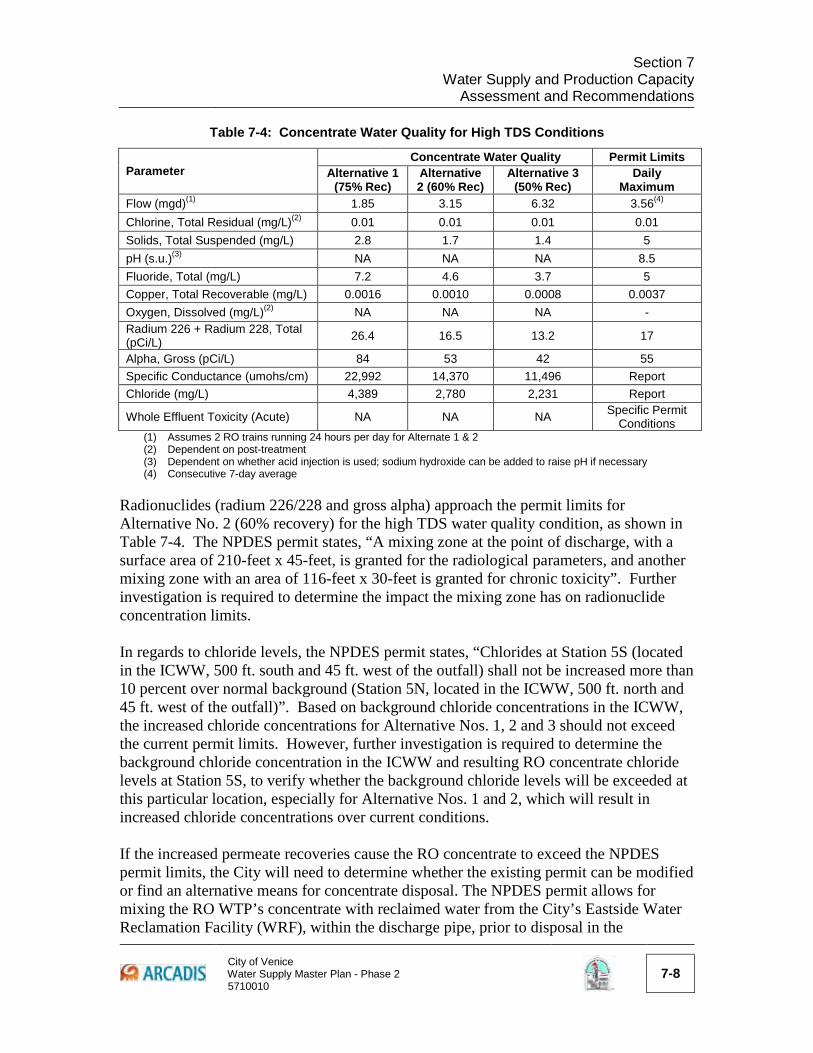
Section 7 Water Supply and Production Capacity
Assessment and Recommendations
City of Venice Water Supply Master Plan - Phase 2 5710010
7-8
Table 7-4: Concentrate Water Quality for High TDS Conditions
Parameter Concentrate Water Quality Permit Limits
Alternative 1 (75% Rec)
Alternative 2 (60% Rec)
Alternative 3 (50% Rec)
Daily Maximum
Flow (mgd)(1) 1.85 3.15 6.32 3.56(4) Chlorine, Total Residual (mg/L)(2) 0.01 0.01 0.01 0.01 Solids, Total Suspended (mg/L) 2.8 1.7 1.4 5 pH (s.u.)(3) NA NA NA 8.5 Fluoride, Total (mg/L) 7.2 4.6 3.7 5 Copper, Total Recoverable (mg/L) 0.0016 0.0010 0.0008 0.0037 Oxygen, Dissolved (mg/L)(2) NA NA NA - Radium 226 + Radium 228, Total (pCi/L) 26.4 16.5 13.2 17
Alpha, Gross (pCi/L) 84 53 42 55 Specific Conductance (umohs/cm) 22,992 14,370 11,496 Report Chloride (mg/L) 4,389 2,780 2,231 Report
Whole Effluent Toxicity (Acute) NA NA NA Specific Permit Conditions
(1) Assumes 2 RO trains running 24 hours per day for Alternate 1 & 2 (2) Dependent on post-treatment (3) Dependent on whether acid injection is used; sodium hydroxide can be added to raise pH if necessary (4) Consecutive 7-day average
Radionuclides (radium 226/228 and gross alpha) approach the permit limits for Alternative No. 2 (60% recovery) for the high TDS water quality condition, as shown in Table 7-4. The NPDES permit states, “A mixing zone at the point of discharge, with a surface area of 210-feet x 45-feet, is granted for the radiological parameters, and another mixing zone with an area of 116-feet x 30-feet is granted for chronic toxicity”. Further investigation is required to determine the impact the mixing zone has on radionuclide concentration limits. In regards to chloride levels, the NPDES permit states, “Chlorides at Station 5S (located in the ICWW, 500 ft. south and 45 ft. west of the outfall) shall not be increased more than 10 percent over normal background (Station 5N, located in the ICWW, 500 ft. north and 45 ft. west of the outfall)”. Based on background chloride concentrations in the ICWW, the increased chloride concentrations for Alternative Nos. 1, 2 and 3 should not exceed the current permit limits. However, further investigation is required to determine the background chloride concentration in the ICWW and resulting RO concentrate chloride levels at Station 5S, to verify whether the background chloride levels will be exceeded at this particular location, especially for Alternative Nos. 1 and 2, which will result in increased chloride concentrations over current conditions. If the increased permeate recoveries cause the RO concentrate to exceed the NPDES permit limits, the City will need to determine whether the existing permit can be modified or find an alternative means for concentrate disposal. The NPDES permit allows for mixing the RO WTP’s concentrate with reclaimed water from the City’s Eastside Water Reclamation Facility (WRF), within the discharge pipe, prior to disposal in the

Section 7 Water Supply and Production Capacity
Assessment and Recommendations
City of Venice Water Supply Master Plan - Phase 2 5710010
7-9
Intercoastal Waterway. The City’s Eastside WRF also has a permit from FDEP that allows discharge of up to 1 mgd of reclaimed water via the concentrate disposal. If mixing reclaimed water with RO concentrate is an option for the City, this may help dilute the RO concentrate and bring the concentrations within the permit limits; however, the quantity of concentrate flow would increase, possibly exceeding existing permit limits. Another alternative means of concentrate disposal is the use of a deep injection well. This method would consist of injecting concentrate underground within impermeable confining layers of the aquifer. While it may be capital-intensive to design, permit, and construct a deep injection well, the City could also consider an agreement with a local municipality, such as Sarasota County (County), to utilize existing injection well infrastructure. This would require installation of a connecting line from the RO WTP to the County’s existing deep injection well infrastructure and costs to buy into the County’s disposal system.
7.5.2. Concentrate Quantity In addition to concentrate parameter concentration, future concentrate quantity is also a permitted condition that will be dependent on the various supply options in consideration. The existing NPDES permit allows for a maximum of 3.56 mgd of concentrate discharge on a 7-day rolling average. At 50% treatment recovery, this value will be surpassed in around 2019 based on current demand projections. Increasing supply capacity at the existing RO WTP by increasing recovery (Alternative No. 1 or 2) will result in a decrease in concentrate volume that would be within the current WUP and should not be considered a limiting factor with the exception of the concentration limits discussed in Section 7.5.1. Maintaining 50% recovery does not allow the City to take advantage of the current 4.32 mgd rating of the water treatment plant. With expansion of the RO WTP at 50% recovery (Alternative No. 3), every mgd of increased treated water production would result in an equal increase in concentrate quantity generated, making an NPDES permit modification required for quantity. Table 7-5, below, summarizes the concentrate considerations of the three proposed supply alternatives.

Section 7 Water Supply and Production Capacity
Assessment and Recommendations
City of Venice Water Supply Master Plan - Phase 2 5710010
7-10
Table 7-5: Summary of Alternative Concentrate Considerations
Concentrate Consideration
Alt. 1 Second Stage RO (75% Recovery)
Alt. 2 Increased Raw Water
Quality (60% Recovery)
Alt. 3 Single Stage RO
Expansion (50% Recovery)
Concentration Increase Increase Same
Quantity Decrease Decrease Increase
NPDES Permit Modification Required Yes – Concentration
No – Flow and Concentration Below
Permit Limits Yes – Flow
Based on projected increases in concentrate flows under the current operating conditions (see Figure 4-2) and potential concentrate impacts from the supply alternatives considered, it is recommended that a study be conducted to investigate concentrate management alternatives with respect to concentrate discharge parameter concentration modeling in the ICWW, alternative discharge methods (reclaimed water, deep injection well, etc.), and other regulatory and permitting considerations. This concentrate management evaluation will need to be included as part of the detailed Treatment Efficiency Study required in the City’s Water Use Permit. The Treatment Efficiency Study needs to be submitted to the SWFWMD by January 15, 2019.
7.6. Alternative 4 - Interconnections for Long-Term Water Supply
Interconnections with other local entities would allow the City to (1) purchase water as an option to increase supply when projected demands exceed the available treatment capacity of the RO WTP, (2) sell surplus supply if capacity is available, and (3) utilize such interconnections for short-term use in emergency situations. This section discusses the use of interconnections as a long-term strategy to meet water supply needs (and to potentially sell surplus water). Use of interconnections for short-term use in emergency conditions is discussed in Section 9.3.3.3.
As discussed in Section 6, the City of Venice currently has two interconnections with Sarasota County and has had an interconnection agreement with the County since 1994. Thus, the framework for an additional interconnection is already in place. One connection is located near the intersection of Country Club Way and Gulf Coast Boulevard. The second interconnect is located on the northeast corner of the intersection of Albee Farm Road and Colonia Lane. These existing interconnections are not used on a regular basis and are primarily in place for emergencies. For purposes of this Master Plan, it is assumed that these existing interconnections will remain for emergency use only.
Also, PR/MRWSA is an entity created to supply water to the region, has dozens of interconnections with local governments, and has historically shown interest in obtaining

Section 7 Water Supply and Production Capacity
Assessment and Recommendations
City of Venice Water Supply Master Plan - Phase 2 5710010
7-11
water from the City of Venice in the winter (this was prior to the expansion of their plant) and potentially supplying water to the City of Venice in the summer. Two potential new interconnection locations considered for long-term supply of water to the City (and to sell surplus water when WTP capacity is available) include:
n Peace River/Manasota Regional Water Supply Authority (PR/MRWSA) Interconnection: This interconnect would be located near the intersection of Knights Trail Road and Laurel Road near the northeast corner of the City’s distribution system, east of I-75. The City owns a two acre parcel at the proposed PR/MRWSA location. Some additional land for the proposed interconnect is also available for the City of Venice in the Venetian Golf and River Club subdivision, which is located just northeast of the proposed interconnect location. One parcel in the development is set aside for the Utilities Department which is approximately one half acre, and is located approximately one mile from the proposed interconnect location.
n Sarasota County Interconnection #3: This interconnect with Sarasota County would be located near the intersection of East Venice Avenue and Auburn Road. This site is located at the southeast corner of the City’s distribution system. A land purchase would be required at this site for construction of the interconnect infrastructure. According to Sarasota County Property Appraiser records, three vacant lots are located near the intersection.
Long-term use of these potential interconnections to purchase or sell water from either PW/MRWSA or Sarasota County requires careful consideration of water quality impacts from blending each source water. Compatibility between the different finished waters is important and can significantly impact corrosion control strategies and disinfection methods.
As discussed in Section 6, the City of Venice currently utilizes a zinc orthophosphate inhibitor for corrosion control. PR/MRWSA utilizes pH and alkalinity adjustment, and Sarasota County utilizes a polyphosphate corrosion inhibitor. For water entering the Venice system from either PR/MRWSA or Sarasota County, orthophosphate and pH control mechanisms would be recommended to ensure that optimum pH and inhibitor levels are maintained. Similarly, should the City of Venice be providing water to PR/MRWSA or the County, those entities would also want to take measures to assure optimal corrosion control treatment is maintained. In addition to corrosion control, maintenance of effective disinfection is of concern when blending either PR/MRWSA or County water with City of Venice water. Both PR/MRWSA and Sarasota County currently utilize chloramines for secondary disinfection, whereas the City of Venice utilizes free chlorine. Blending of chloraminated and chlorinated waters can lead to taste and odor problems, loss of residual, and other water quality problems (e.g. increased nitrification potential).

Section 7 Water Supply and Production Capacity
Assessment and Recommendations
City of Venice Water Supply Master Plan - Phase 2 5710010
7-12
Therefore, the City of Venice would need to convert to chloramines or use breakpoint chlorination if the City has the intention of routinely purchasing water from either PR/MRWSA or the County. If the City opts to sell to either entity, those agencies would want to convert that supply to chloramines prior to introduction to their distribution systems. Should the City ultimately decide to purchase water to meet future supply needs, then two alternatives are available to maintain effective disinfection of the blended waters:
n Maintaining current free chlorine disinfection at the RO WTP and providing breakpoint chlorination capabilities at the interconnection point
n Converting to chloramines disinfection at the City’s RO WTP
An assessment of each scenario including advantages and disadvantages is presented in the subsections below.
7.6.1. Breakpoint Chlorination at Interconnection If the City wanted to purchase water and maintain chlorine disinfection at the RO WTP, additional sodium hypochlorite tanks and pumps would be required at the interconnection point to feed chlorine for breakpoint chlorination. With breakpoint chlorination, free chlorine is added until the chloramines (mainly monochloramine) are oxidized and a free-chlorine residual remains. This would result in a compatible disinfection strategy with the City’s system. However, while this option may be technically feasible, the PR/MRWSA treats surface water and likely uses chloramines to maintain a disinfectant residual and minimize disinfection byproduct (DBP) formation. Breakpoint chlorination at the interconnection point would likely result in increases in DBP concentrations in the areas of the City of Venice distribution system that are served by the PR/MRWSA or Sarasota County interconnections. In addition, due to disinfectant demand typically present in surface waters, the City may find it more difficult to maintain a free chlorine residual in some areas of the system. The required equipment for a new interconnection that allows for long-term bidirectional utilization includes interconnect piping, flow meter, valving, telemetry, a new 1.0 million gallon (MG) ground storage tank, booster pumps, chemical feed pumps and chemical storage tanks, fencing, and appurtenances. This will allow a means for chemical addition and blending, if required, and provides flexibility to meet different system pressure and flow requirements.
The advantages and disadvantages of this disinfection scenario include:

Section 7 Water Supply and Production Capacity
Assessment and Recommendations
City of Venice Water Supply Master Plan - Phase 2 5710010
7-13
Advantages
n Maintains current disinfection strategy for the City, which has historically been adequate in meeting required residual levels and maintaining DBP levels well below regulatory limits.
n Provides a simpler disinfection system to operate since aqua ammonia addition is not required.
n Requires less distribution monitoring and analytical needs compared to a chloraminated system.
n Requires a lower capital cost to implement and reduced chemical usage compared to a chloraminated system.
Disadvantages
n Maintains a disinfection system that is incompatible with the disinfection strategies for PR/MRWSA and Sarasota County.
n DBP formation within the City’s system will likely increase with breakpoint chlorination at the interconnection point due to likely higher DBP precursor levels in the purchased surface water supply.
n It is likely to be more difficult to maintain a free chlorine residual in those areas of the system served through the interconnect due to higher disinfectant demand in those waters.
7.6.2. Conversion to Chloramines Disinfection at the Venice RO WTP Alternatively, the City could change their current method of disinfection at the RO WTP to chloramines. This would make its disinfection method compatible with that of other local entities such as PR/MRWSA and Sarasota County. This option would require aqua ammonia tanks and feed equipment for the conversion to chloramines at the RO WTP. Chemical trimming equipment (chemical tanks and feed pumps) at the interconnect point would still be necessary.
A chloramine conversion would require extensive public education programs prior to chloramine implementation such that industrial, medical and others in the community are not affected by the change in disinfection method. Distribution system operations would likely see increased staffing and analytical needs for monitoring of chloramines.
Based on previous experience with similar projects, no significant change in water quality is anticipated as a result of a chloramine conversion for the City of Venice. However, the finished water oxidation reduction potential (ORP) may be reduced depending on the current chlorine dose and future chloramines dose. The change in ORP

Section 7 Water Supply and Production Capacity
Assessment and Recommendations
City of Venice Water Supply Master Plan - Phase 2 5710010
7-14
could cause shifts in mineral speciation of pipe scales in cast-iron pipe and lead service lines. The City of Venice does not have any lead service lines; however, some home plumbing systems may have lead solder or lead bearing materials (such as brass fixtures or meters). It is worth noting that with the City’s current average free chlorine dose of 2 mg/L, coupled with the fact that the City is utilizing zinc orthophosphate for corrosion control, it is unlikely that this is a significant concern.
Substantial changes in pH and/or ORP could potentially result in increased dissolved iron concentrations and red water complaints. However, if the City maintains its current pH of 8.0 (or higher), chloramination is not expected to increase iron corrosion or result in red water complaints. Maintenance of zinc orthophosphate addition would also help prevent potential corrosion-related water quality problems.
Aesthetic parameters could also be affected. Taste and odor qualities vary with disinfectants, as well as with source waters. Customers may notice a change in taste and odor when the source changes from groundwater to surface water or if the City converts to chloramines. Generally, consumers of chloraminated water report less of a chlorinous taste and odor than consumers of chlorinated water. Impacts on taste and odor would be dependent on the blending ratio and the City should take appropriate public notification steps prior to conversion.
The advantages and disadvantages of this disinfection scenario include:
Advantages
n Provides a disinfection strategy that is compatible with the disinfection strategies for PR/MRWSA and Sarasota County. This could simplify the sale and purchase of water between the City and PR/MRWSA and Sarasota County.
n Minimizes the generation of regulated DBPs in the distribution system
n Maintains a longer-lasting disinfectant residual in the distribution system
n Likely improvement in the taste and odor of customer tap water
Disadvantages
n Increased potential for nitrification in the distribution system given the water ages in portions of the City’s system. Nitrification does not occur in systems utilizing free chlorine for secondary disinfection.
n Potential water quality and taste and odor impacts during initial conversion to chloramines may affect current users.
n Extensive public education program is required prior to conversion.

Section 7 Water Supply and Production Capacity
Assessment and Recommendations
City of Venice Water Supply Master Plan - Phase 2 5710010
7-15
n Increased operational complexity given that an additional chemical (aqua ammonia) needs to be added compared to the current chlorine system.
n Additional distribution monitoring and analytical needs required compared to a chlorinated system.
7.6.3. Estimated Interconnection Costs Planning level costs for each interconnection option are provided below. For each option, it was assumed that the City would be able to purchase (or sell) 1.0 mgd of water. It should be noted that neither cost includes the infrastructure required for an emergency interconnect (estimated at $500,000 as discussed in Section 9.3.3.3), and that the costs presented are for the additional infrastructure required for long term water purchase (or sale).
n Breakpoint Chlorination at the interconnection – Requires a new 1.0-MG ground storage tank, booster pumps, chemical feed pumps and chemical storage tanks, valving, telemetry, fencing, and appurtenances. · PR/MRWSA Interconnection: $2,500,000 · Sarasota County Interconnection No. 3: $3,000,000 (additional land
purchase required)
n Conversion to chloramines disinfection at the RO WTP – Requires aqua ammonia tanks and feed equipment at the RO WTP and chemical trimming equipment at the interconnect point. Cost does not include public education effort or increased staffing and monitoring requirements, although these items should also be considered. $1,600,000.
7.7. Other Water Supply Options As discussed in Section 5, SWFWMD coordinates with local governments and public entities to establish a Regional Water Supply Plan (RWSP), which sets a framework for future decision making on water supply in areas where the hydraulic system is stressed so that all options are considered and long term water needs are met. This document was approved in 2001 and is to be updated every five years, with the most recent update completed in January 2011.
As part of the RWSP, the SWFWMD strongly encourages the development of alternative water supplies and provides a variety of funding mechanisms to assist with implementation costs. The following projects have been proposed in the RWSP as a means to increase local water supply in the future, and are considered here as potential water supply options to meet projected long-term demand needs for the City.

Section 7 Water Supply and Production Capacity
Assessment and Recommendations
City of Venice Water Supply Master Plan - Phase 2 5710010
7-16
7.7.1. Brackish Groundwater Desalination The RWSP identifies two configurations for increased brackish water withdrawal for the City. According to the RWSP, both the City and PR/MRWSA would be responsible for implementation of each configuration.
7.7.1.1. Alternative 5: New 7.0 mgd Water Treatment Plant This option, proposed in the SWFWMD RWSP, includes the construction of a new water treatment facility to replace the existing facility. The new facility would have the capacity to produce 7.0 mgd of finished water with a recovery efficiency of 80 percent. The option includes five additional intermediate aquifer supply wells, two deep-injection wells for RO concentrate disposal, and associated transmission pipelines. Costs were obtained from the PRMRWSA’s source feasibility study and assume interconnection with the PRMRWSA system. The total capital cost would be approximately $61,600,000.
7.7.1.2. Alternative 6: New 2.5 mgd Water Treatment Plant This option, proposed in the SWFWMD RWSP, includes construction of a smaller RO facility that would have a finished water capacity of 2.5 mgd with a recovery efficiency of 80 percent. The existing City of Venice RO WTP would remain in service and continue to operate with a 50 percent recovery efficiency. Both systems would use the current disposal method of surface water discharge. The option only includes the construction of the new facility and five additional source wells. Costs were obtained from the PRMRWSA source feasibility study and assume interconnection with the PRMRWSA system. The total capital cost for the new facility would be approximately $32,970,000. This cost does not include any capital improvements required at the existing City of Venice RO WTP (refer to Section 8.0 for needs and recommended improvements at the RO WTP).
7.7.2. Aquifer Storage and Recovery Another supply option presented in the RWSP is the use of aquifer storage and recovery (ASR). This involves injection of either potable, reclaimed, or partially treated surface water within confined aquifers with low permeability. Water is typically stored and then recovered with minimal treatment for seasonal use. Currently, ASR is limited to storage and recovery of water within confined, low permeable brackish aquifers. Typically, 90 to 100 percent of injected water is recoverable if the storage zone is less than 5,000 mg/L ambient TDS. The mixing of native waters that have a lower water quality than the injected water will result in low recovery efficiencies and poor water quality unless an adequate buffer zone is built and maintained around the ASR well. A survey of several Florida ASR wellfields for SWFWMD showed capital costs ranging from $0.30 to $1.80 per gpd, with an average cost of $1.00 per gpd of recovery capacity. Because of the relatively small ASR well that would be utilized by the City in this scenario, the upper end of this cost range would be applicable. For comparison purposes, the planning-level cost of this alternative is assumed to be $1.70 per gpd, or $4,250,000 for a 2.5 mgd increase in capacity.

Section 7 Water Supply and Production Capacity
Assessment and Recommendations
City of Venice Water Supply Master Plan - Phase 2 5710010
7-17
These costs account for treatment, injection, extraction, and disinfection of water for ASR. The principal difference in cost is the amount of testing, monitoring, and other project-specific items required. When compared with conventional off-stream storage, ASR is an inexpensive storage option. Building a treatment facility and diversions and impoundments for collecting wet-weather flows would, however, include significant additional capital costs. There are, however, significant regulatory and monitoring hurdles associated with this alternative supply option. Obtaining a permit for operational use of a potable ASR well has been extremely difficult over the last several years due to arsenic contamination of the recovered potable water. Arsenic is often naturally-occurring within the aquifer and becomes dissolved within the stored water supply. There are some changes in the regulatory framework within Florida on the horizon that may make the permitting process easier in the future. However, no ASR wells have been permitted for operational use in Florida recently and this option is not considered viable at this time.
7.7.3. Desalination Two options for large-scale seawater desalination facilities have been developed as part of the planning efforts for the Southern Planning Region by SWFWMD and PR/MRWSA. The options include locating seawater desalination plants at the Port of Manatee and the City of Venice (near the Venice Airport), with each having a capacity of 20 mgd. According to the RWSP, the PR/MRWSA would be responsible for implementation of each option. Costs for developing the desalination alternative were based on evaluations performed by SWFWMD for the PR/MRWSA Planning Area. The capital cost, estimated at $195,226,185, included construction of a desalination facility, concentrate disposal, open water intake system, feed water pipeline, and product transmission pipeline. This project also requires interconnection with the PR/MRWSA.
7.8. Recommended Water Supply Improvements In summary, the following are potential water supply alternatives to help the City meet projected water demands throughout the current planning period, and into the future:
n Increase plant recovery – install second stage RO trains and ancillary equipment
n Increase plant recovery – install higher quality supply well(s) in the IAS or FAS
n Increase plant capacity – single stage RO expansion n Purchase supply – interconnection with local entity n Brackish groundwater desalination
§ New 7.0 mgd facility to replace existing RO plant § New 2.5 mgd facility to supplement existing RO plant

Section 7 Water Supply and Production Capacity
Assessment and Recommendations
City of Venice Water Supply Master Plan - Phase 2 5710010
7-18
n Aquifer Storage and Recovery n Seawater desalination
Table 7-6 provides a summary of the presented supply alternatives as well as the capacity increase provided and estimated planning-level project cost. It should be noted that SWFWMD provides a variety of funding mechanisms to assist with portions of the implementation costs for alternative water supplies (not reflected in the costs shown in the table).
Table 7-6: Water Supply Alternative Summary
Alternative Capacity Increase (mgd) Capital Cost1 Normalized Cost1
($/mgd) Second Stage RO Trains2 2.06 $ 7,000,000 $ 3,300,000 Higher Quality Supply Wells 0.43 $ 3,250,000 $ 7,560,000 Single Stage RO Expansion2 2.0 $ 16,050,000 $ 8,025,000 Interconnection - Chem Feed 1.0 $ 2,500,000 $ 2,500,000 Interconnection - Chloramines Conv 1.0 $ 1,600,000 $ 1,600,000 Groundwater Desal - 7.0 mgd 7.0 $ 61,600,000 $ 8,800,000 Groundwater Desal - 2.5 mgd 2.5 $ 33,000,000 $ 13,200,000 ASR 2.5 $ 4,250,000 $ 1,700,000 Seawater Desal 20.0 $ 195,250,000 $ 9,770,000 1. Does not reflect any potential water management district funding. 2. Cost includes construction of a new deep injection well for concentrate disposal. Concentrate management
costs may be significantly lower depending on selected disposal method. Because it is projected that the existing City of Venice RO WTP has the capacity to supply the service area for the duration of the planning period, constructing a new brackish groundwater facility or a seawater desalination facility are not considered to be cost-effective supply options at this time. Due to current regulatory and monitoring hurdles, an ASR system is also not considered a viable option at this time. Also, increasing plant recovery by installing higher quality IAS supply wells is not considered a cost-effective option. It is anticipated that construction of five new wells would be required, each with a capital cost of about $650,000 (for a total of $3.25 million), and an overall increase in plant capacity of only 0.43 mgd. However, the City is currently permitted to install an additional supply well, and well 7W does not produce. If the City is interested in installing a supply well(s) in the Upper Floridan Aquifer, additional investigation into water quality, potential recovery, and permitting feasibility is recommended. Expanding the single stage RO treatment system is also not considered a viable alternative due to the required increased footprint, overall cost effectiveness, and significant regulatory hurdles (WUP increases, NPDES discharge quantity increases, and potential increases in SWFWMD recovery requirements). At this time, the most feasible and cost-effective options to increase the City’s supply are:

Section 7 Water Supply and Production Capacity
Assessment and Recommendations
City of Venice Water Supply Master Plan - Phase 2 5710010
7-19
n Installing second-stage RO treatment trains and ancillary equipment n Constructing an interconnection (and additional infrastructure) with
PR/MRWSA or Sarasota County for water purchase.
An interconnection with either PR/MRWSA or Sarasota County could be a feasible and cost effective supply option for the City. However, it is not clear if either Sarasota County or PR/MRWSA would be interested in purchasing/selling water, and if the quantities to be bought/sold would warrant the cost of constructing the chemical adjustment facilities from a cost/benefit perspective. For long term supply (or water sale), the City would be required to construct significant infrastructure, including a new 1.0-MG ground storage tank, booster pumps, chemical feed pumps and chemical storage tanks, valving, telemetry, and appurtenances. Also, the City would lose some independence of its water supply (increased reliance on other entities), and could experience water quality issues with respect to taste and odor, DBPs, corrosion/mineral precipitation. In addition, extensive public education efforts and changes to system operation, monitoring, and staffing requirements would be needed. The installation of second stage RO equipment is a cost effective alternative for increasing the City’s supply and treatment capacity, if the high recovery can be achieved reliably. This option could provide the City with an additional 2.06 mgd of treated water and does not require an increase in raw water well extraction, nor would any modifications to the City’s existing WUP be required. The latest RO equipment technology would be provided, decreasing energy costs and increasing permeate recovery, and potential future SWFWMD requirements for increases in recovery would be satisfied with minimal impacts to distribution system operation and end users. Given the capacity increase that can be achieved without requiring additional groundwater extractions, continued water supply independence, and consistency in finished water quality, this water supply alternative is recommended for further consideration. In accordance with the current WUP requirements, the City will need to conduct a detailed study for SWFWMD approval evaluating the feasibility (technical, environmental and economic) of increasing the current RO System recovery rate to a target efficiency of 75% by the end of the permit duration. The assessment will need to identify required infrastructure and costs to achieve this recovery and timeframe required for implementation. This detailed “Treatment Efficiency Study” will need to be submitted to the District by January 15, 2019, to meet WUP requirements. As discussed in Section 7.5, installing second stage RO equipment may increase some concentrate parameter concentrations above the current NPDES permit limit. Modifications to the current NPDES permit may be required or other alternative concentrate disposal methods may need to be provided. As such, a detailed evaluation of the impacts of increased recoveries on concentrate quality and alternatives to address potential concentrate discharge issues is recommended to be completed as part of the “Treatment Efficiency Study” required under the current WUP. For cost planning

Section 7 Water Supply and Production Capacity
Assessment and Recommendations
City of Venice Water Supply Master Plan - Phase 2 5710010
7-20
purposes, it is conservatively assumed that a new deep injection well would be provided for concentrate disposal. Actual concentrate disposal costs may be lower depending on the disposal method ultimately recommended for the City. Prior to implementing the second stage RO system improvements to increase recovery, it is recommended that the City conduct a detailed pilot study to confirm the most effective equipment/chemicals, actual recovery that can be achieved, and implementation requirements for the system. The pilot facility should be run under various conditions over a minimum six month period.
7.9. Summary of Recommended Water Supply Improvements Table 7-7 below summarizes the recommended water supply improvements.
Table 7-7: Summary of Recommended Water Supply Improvements
Item No. Item Description
1 Wellfield Optimization Study
Evaluate strategies to optimize rotation and operation of existing wells.
2 Initial Capacity Analysis Report (CAR)
Develop CAR for FDEP when max day demand surpasses 75% threshold of plant capacity. Annual CAR update required.
3 Upper Floridan Aquifer Supply and Well Location Study
Investigate potential water quality, permeate recovery, and permitting feasibility of installing one or more supply wells in the Upper FAS. Investigate and identify potential supply well locations.
4 Install Supply Well to replace existing Well 7W
Abandon existing Well 7-W and install replacement supply well. Will allow for additional well rotation and increased raw water quality. Location and depth are dependent on the results of the Upper Floridan Aquifer Supply Study. Cost assumes installation of Upper Floridan well.
5 Install Additional Supply Well currently permitted in existing WUP
Install additional supply well currently permitted in existing WUP. Will allow for additional well rotation and increased raw water quality. Location and depth are dependent on the results of the Upper Floridan Aquifer Supply Study. Cost assumes installation of Upper Floridan well.
6 Install 2nd Stage RO Skids to increase plant recovery
Install 2nd stage RO skids and ancillary equipment – increase recovery to 75%. Increase recovery and production within existing WUP permit.

City of Venice Water Supply Master Plan - Phase 2 5710010
8-1
8
8. Treatment System Assessment and Recommendations
8.1. Introduction ARCADIS assessed the suitability and condition of the RO WTP facilities to identify system deficiencies, mechanical or structural deterioration, operational constraints, and/or reliability concerns related to water supply needs and compliance with long-term water quality objectives. These assessments were based upon: n Review of available data, plans, records and reports, n Site visits and inspections of the readily-accessible facilities, and n Discussions with City engineering, operations, and maintenance personnel.
The results of the assessments are presented in this section, along with discussions of rehabilitation and replacement alternatives, implementation considerations, and recommended improvements over the 20-year master planning period. The City of Venice RO WTP consists of the following main processes:
n Pretreatment n Sand separators and cartridge filtration n Antiscalant chemical feed system
n RO Process n Feed pumps n RO skids n Pressure vessels and membrane elements
n Post-treatment n Dissolved gas removal (degasification) and odor control n Carbon dioxide (CO2) injection n pH adjustment with sodium hydroxide n Disinfection with sodium hypochlorite n Corrosion inhibitor with zinc-orthophosphate
n Electrical equipment n Instrumentation and Controls
Figure 8-1 provides an existing process flow diagram for the RO WTP. These process areas are described in the following sub-sections followed by identified deficiencies, operational needs, and recommended improvements. Further details can be found in Section 2, as well as in the Preliminary BODR (August 2012).


Section 8
Treatment System Assessment and Recommendations
City of Venice Water Supply Master Plan - Phase 2 5710010
8-3
8.2. Pretreatment Raw water is pumped though a cyclone sand separator and five-micron cartridge filters to separate sand and particulates from the process stream. An antiscalant is then injected into the filtered water to increase the dissolved mineral solubility limits prior to RO treatment.
8.2.1. Sand Separators and Cartridge Filters The existing cartridge filters and sand separators are functional and appear in good condition; however, they are from the original installation and are nearing the end of their expected useful service life. Based on conversations with plant staff, the sand separators provide adequate treatment at typical flows; however, when only one RO skid is online during lower flow periods, the level of treatment is significantly impacted. No redundancy is provided for the sand separators; but, since they have no moving parts and minimal maintenance is required, installation of redundant backup units is not recommended. The flows through the sand separators and cartridge filters would decrease when changing the single-stage RO skids to two-stage systems based on the increase in permeate recovery and resulting decrease in RO feed water (refer to Section 7.2). The existing cartridge filter housings are oriented vertically, which makes replacement of the cartridge elements difficult and labor intensive. In addition, there are no existing standby filter housings/filters in either Phase I or Phase II buildings. Plant staff has indicated that the existing cartridge filter housings will be replaced with either horizontally or vertically mounted units as part of the ongoing RO equipment replacement project (refer to Section 8.3.1 for additional details). Recommended Sand Separator and Cartridge Filter Improvements. It is recommended that an internal inspection of the sand separators be completed within five years to confirm their condition and suitability for continued long-term use. Replacement of the sand separators is recommended within 6 to 10 years (when the expected end of their useful service life will be reached), or longer, depending on results of the internal inspection. If the City implements second stage RO treatment, ancillary equipment such as the sand separators should be analyzed, to ensure that proper pretreatment can be achieved with any reduction in raw feed water flows.
8.2.2. Antiscalant Chemical Feed System Scale inhibitor addition is necessary to prevent mineral scale buildup on the membranes, allowing operation of the RO trains at the designed recovery rate. The scale inhibitor feed rate is not expected to change significantly with the RO membranes to be installed as part of the current plant upgrade project.
The existing Phase I and II antiscalant chemical feed systems are operational and in generally good condition; however, the systems do not have any pump redundancy and the existing pumps and day tanks are nearing the end of their expected useful service lives.

Section 8
Treatment System Assessment and Recommendations
City of Venice Water Supply Master Plan - Phase 2 5710010
8-4
Recommended Antiscalant System Improvements. The Phase I antiscalant system is slated to be replaced as part of the RO system rehabilitation project (see Section 8.3.1). Because antiscalant addition is critical to the successful operation of the plant and the City does not currently have any pump redundancy, it is recommended that an additional redundant feed pump be added for each RO system. In addition, the existing Phase II feed pumps and day tanks should be replaced within the next 2 to 5 years to ensure continued reliable operation.
8.2.3. Acid Chemical Feed System Acid injection is not necessary for the existing single-stage RO system, since antiscalant alone is sufficient to mitigate precipitation of sparingly soluble salts at the current permeate recovery of 50%. Acid injection is recommended, however, if the plant converts to a two-stage RO system to decrease the pH to below 6.5, facilitating operation of the new RO trains at an overall recovery of up to 75%. Typically, acid feed systems utilize hydrochloric acid, sulfuric acid, or carbon dioxide. Although sulfuric acid increases the sulfate content of the water, it is safer to handle and less expensive than hydrochloric acid. A new sulfuric acid chemical feed system would consist of bulk storage and day tanks, metering pumps, and associated valves, piping and instrumentation (pH analyzer). Alternatively, the existing carbon dioxide chemical feed system could potentially be used for this purpose. Further investigation is required to confirm whether the existing system has adequate capacity to lower the pH to below 6.5. If adequate capacity is available, the injection point would need to be relocated from the permeate/blend piping to the raw water piping. Using the carbon dioxide system has a two-fold benefit in that lowering the pH of the raw water aids in membrane pretreatment and increases hydrogen sulfide removal through the degassifiers by converting the sulfide to its gaseous form (similar to current operation). Recommended Acid Feed System Improvements. It is recommended that if the City opts for conversion to a two-stage RO system to increase system capacity, an assessment of the suitability of the existing carbon dioxide chemical feed system for pH adjustment be conducted as part of the preliminary design activities. The assessment should also include a cost analysis comparing CO2 to a new sulfuric acid chemical storage and feed system. For cost estimating purposes of this Master Plan, it is assumed that a new sulfuric acid storage and feed system would be provided if the plant converts to a two-stage RO system.
8.3. Reverse Osmosis Treatment After pretreatment, water is pumped at high pressure across reverse osmosis membranes, removing minerals from the water at a 50% recovery rate. The RO treatment is composed of two parallel pumping and membrane buildings separately housing the Phase I and Phase II process trains.

Section 8
Treatment System Assessment and Recommendations
City of Venice Water Supply Master Plan - Phase 2 5710010
8-5
Phase I was placed into service in 1989 and can produce up to 2.16 mgd of potable water. Phase I utilizes two 25 horsepower (hp) and two 150-hp vertical turbine high pressure pumps, which are operated by variable frequency drives (VFDs) to control the speed of the pump and maintain maximum operating efficiency. These pumps feed two RO trains, with each train containing 36 pressure vessels that are comprised of six Fluid Systems model TFC 8821-LP spiral-wound membrane elements in a single pass configuration. Phase II was put into service in 1990 as a second spiral-wound membrane tract, bringing the total plant capacity to 4.32 mgd. Phase II utilizes two, 250-hp, vertical turbine high pressure pumps with VFDs that feed two RO trains. Each train holds 36 pressure vessels that are loaded with six Fluid Systems model TFC 8821-LP spiral wound membrane elements in a single pass configuration.
8.3.1. Ongoing RO System Rehabilitation The City has recently initiated planning and design activities for a comprehensive rehabilitation of the existing RO treatment equipment, Programmable Logic Controllers (PLCs) and Supervisory Control and Data Acquisition (SCADA) systems, and other ancillary RO system components. This rehabilitation project includes the following key components: n Replacement of the Phase I and II cartridge filters n Replacement of the Phase I and II RO skids n Replacement of the Phase I & II RO feed pumps (consideration should be given to
providing a dedicated cartridge filter/feed pump for each RO skid, similar to the current Phase II configuration).
n Replacement of the Phase I clean-in-place system n Replacement of the Phase I antiscalant system n Replacement of Phase II VFDs n Replacement of the plant PLCs and SCADA system n Replacement of the chlorine metering pump system
8.3.2. RO Skids Many of the key components of the existing RO skids, especially the pressure vessels, are obsolete, making it difficult to find replacement parts. The existing membrane elements operate within the recommended pressure constraints and produce water quality within limits, but they are past their recommended useful life. Replacement of the RO vessels and membrane elements is warranted and, as described above, will be included as part of the current plant upgrade project.
8.3.3. RO Feed Pumps As detailed in the RO Preliminary BODR (August 2012), the existing RO feed pumps for both Phase I and II RO systems have sufficient capacity when operating at average and high TDS conditions for both a single stage or two-stage configuration. Therefore, the existing RO feed pumps do not need to be upgraded due to the proposed RO system for either single or two-stage systems. However, the City does not have RO feed pump
Section 8
Treatment System Assessment and Recommendations
City of Venice Water Supply Master Plan - Phase 2 5710010
8-6
redundancy, which leaves the WTP prone to a reduction in capacity if pump operational issues arise. The Phase I feed pumps will be replaced as part of the ongoing RO system rehabilitation project. It is recommended that a redundant Phase I feed pump be provided for redundancy as part of this project. Although the existing Phase II pumps are adequately sized and operate well, it is anticipated that they will reach the end of their expected useful service life during the master planning period and rehabilitation/replacement is recommended within 6-10 years. A redundant Phase II feed pump should also be provided at this time. The variable frequency drives (VFDs) are also nearing the end of their expected service lives. Plant staff have indicated that the existing permeate flow meter is damaged and no longer operates, but is in the process of being replaced. Replacement of the feed pump VFDs and permeate flow meter is recommended in the near future.
8.3.4. RO Cleaning Systems As the RO membranes foul, the pressure required to achieve the required product flow will gradually increase. Thus, it is necessary to periodically clean the RO membranes to remove accumulated foulant material and restore the system operating conditions. The Phase I and Phase II RO membrane cleaning system components were installed in 1989 and 1990, respectively, and include solution preparation tanks, circulation pumps, cleaning chemical dosing accessories, piping, and valves. The RO cleaning system for Phase I is in poor condition and does not have adequate capacity to meet cleaning requirements. Replacement of this system will be included as part of the current RO system rehabilitation project. The Phase II RO cleaning system operates reliably, but is nearing the end of its useful service life and should be replaced with updated equipment in the near term.
8.3.5. Recommended RO System Improvements There are a number of RO system improvements that are not part of the ongoing RO system rehabilitation project, which ARCADIS recommends for implementation during the master planning period. These include:
n Replace the Phase II clean-in-place system, including the cleaning storage tank,
cleaning pump and cleaning cartridge filter with updated equipment of the newest technology within 2 to 5 years, when the projected system service life will be reached.
n Replace the VFDs for the Phase I RO feed pumps within 2 to 5 years based on their expected useful lives.

Section 8
Treatment System Assessment and Recommendations
City of Venice Water Supply Master Plan - Phase 2 5710010
8-7
n Replace the pressure relief valve on the Phase II raw water line as this valve no longer functions properly and allows the backflow of concentrate into the raw water feed.
8.4. Post Treatment Chemical Systems The product water from both phases is combined and blended with raw well water bypassed around the RO process to recharge the finished water with mineral content. The amount of raw water used to blend with the RO permeate is approximately 5 to 7 percent of the total production (permeate + blended water). Carbon dioxide is injected into the flow stream to reduce the pH to approximately 5.5 prior to the degasifier system, which allows for the removal of dissolved hydrogen sulfide. Sodium hypochlorite is injected downstream of the degasifier, prior to the chlorine contact tank to provide disinfection. Caustic soda and zinc orthophosphate are added upstream of the clearwell to increase the pH prior to distribution and help prevent pipe corrosion.
8.4.1. Sodium Hypochlorite System The City of Venice utilizes free chlorine in the form of sodium hypochlorite (hypo) for disinfection. Liquid hypo (12% solution) is added to the treated water line after degasification and prior to storage in the clearwell. Hypo is also injected to the RO concentrate as well as the scrubber waste stream of the odor control system. The storage and feed system consists of two bulk storage tanks (installed in 2001), a day tank (installed in 2004), and three chemical metering pumps (installed in 2009). Because the system was designed for 5% solution, chemical compatibility problems and issues with turn-down of the metering pumps have hindered system operation. Also, plant staff has indicated that the pumps are poorly laid out and difficult to maintain. The bulk storage tanks are also sized for a 5% solution and are therefore oversized for the current application. The plant typically fills the tanks about halfway in an attempt to keep storage times less than 30 days to minimize solution strength degradation. Recommended Sodium Hypochlorite System Improvements. Replacement and reconfiguration of the metering pumps with pumps of proper size, orientation, and chemical compatibility is recommended within 2 years. It is also recommended that the day tank be replaced at this time with a tank designed to store the higher strength hypochlorite solution. (The metering pumps and day tank replacements are included as part of the RO System Rehabilitation Project.) While the bulk storage tanks are in good condition, they are also oversized for the current operation and generally kept about half full. At the end of their useful life (estimated to be in 11 to 15 years), it is recommended that they be replaced with smaller tanks properly sized for the higher strength hypo currently used.
8.4.2. Sodium Hydroxide System Adjustment of pH is achieved with the addition of sodium hydroxide (caustic) to the treated water line after degasification and prior to storage in the clearwell. Caustic is also added to the odor control scrubber unit.

Section 8
Treatment System Assessment and Recommendations
City of Venice Water Supply Master Plan - Phase 2 5710010
8-8
The feed system consists of a bulk storage tank, a day tank, and chemical metering pumps. The existing caustic system is functional, however the pumps are located within a dedicated chemical ‘hut’ which does not provide adequate space for access and maintenance. In addition, there is no on-line redundancy for the hydroxide feed pumps and the bulk storage and day tanks are nearing the end of their useful lives. Recommended Sodium Hydroxide System Improvements. It is recommended that within two years, new sodium hydroxide system metering pumps with in-line redundancy be installed. Also, installation of a new transfer pump, re-located for better accessibility, is recommended at this time along with new bulk storage and day tanks, which are original and nearing the end of their useful life.
8.4.3. Zinc Orthophosphate System Corrosion control is employed by treatment facilities to protect the distribution system from deterioration and in accordance with the requirements of the Lead and Copper Rule (see Section 3). There are two common methods used for corrosion control: corrosion inhibitors and additive pH/alkalinity adjustment. The City of Venice uses a phosphate-based corrosion inhibitor (zinc orthophosphate). The feed system consists of a bulk storage tank, a day tank, and chemical metering pumps. Plant staff has indicated that the system functions well without significant issues. Recommended Zinc Orthophosphate System Improvements. The metering pumps and day tank are nearing the end of their useful life and it is recommended that they be replaced within two years. The bulk tank, however, is estimated to have 11 to 15 years before replacement will be required.
8.4.4. Carbon Dioxide System Carbon dioxide is injected to reduce the pH of the flow stream to approximately 5.5 prior to entering the degasifier system, which allows for the removal of dissolved hydrogen sulfide. The system consists of a liquid CO2 storage tank with refrigeration, a vaporizer, fill system, booster pump, piping and valves, and controls housed in a panel. According to discussions with plant staff, the CO2 system can currently only be operated manually. The pH meter has issues with chemical compatibility and corrosion, and the needle valve malfunctions frequently. The storage tank and above grade piping and valves appear in fair condition. Recommended Carbon Dioxide System Improvements. It is recommended that the CO2 feed system be upgraded in 2 to 5 years, including the replacement of the panel components and booster pump to address current system automatic control issues. In 6 to 10 years it is recommended that the storage tank and above grade piping and valves be replaced, when this equipment is expected to reach the end of its useful life.

Section 8
Treatment System Assessment and Recommendations
City of Venice Water Supply Master Plan - Phase 2 5710010
8-9
8.5. Degasifier/Odor Control Systems Odor at the City’s RO WTP is due to dissolved hydrogen sulfide that is inherent to the raw water supply. The existing hydrogen sulfide treatment system consists of a degasifier, blower and single odor control scrubber with a recirculation pump. This system was installed during the Phase II RO System Expansion in 1990.
Details of the existing hydrogen sulfide treatment components at the WTP are provided in Table 8-1.
Table 8-1: Existing Degasifier and Odor Control System
Description Degasifier Diameter (ft) 12 Treatment Method Packed media, forced draft air flow, process water distribution
with trays Blower Quantity: 1
11,000 standard cubic feet per minute (scfm) (1) 25-hp
Odor Control Scrubber Diameter (ft) 6 Treatment Method Packed media with forced draft air flow, single-stage caustic Recirculation Pump Quantity: 1
300 gpm 10-hp
(1) Original blower had a capacity of 8,500 scfm
The degasifier appears in fair condition but is nearing the end of its expected useful service life. Plant personnel noted that there was a structural failure within the degasifier tower in 1999. This failure required re-work to the inside of the degasifier tower and the internal water distribution system – the degasifier was converted from a nozzle system to the current tray system. A new blower was later installed in 2002, increasing the air flow from the original design of 8,500 scfm to 11,000 scfm. The larger blower appears in fair condition and has no reported issues. The degasifier system does not have any redundancy, which is recommended due to the importance of hydrogen sulfide treatment at the plant. The existing single-stage scrubber is in fair condition; however, the system has not been reliable in the past and the scrubber recirculation pump has been replaced several times. The existing instrumentation and automation appears to be non-functional and has not been easy to operate. In addition, the system, installed in 1990, is nearing the end of its useful life. The existing single stage odor scrubber includes sodium hydroxide dosage. According to RO WTP staff, the sodium hydroxide system functioned well after installation; however, the pH control system stopped working properly after process modifications in the 1990s.

Section 8
Treatment System Assessment and Recommendations
City of Venice Water Supply Master Plan - Phase 2 5710010
8-10
Over the years, the RO WTP has received odor complaints from nearby businesses due to the levels of hydrogen sulfide released from the odor control scrubber and the proximity of the plant to surrounding neighbors. This has caused plant personnel to attempt various changes to the system to reduce hydrogen sulfide released into the atmosphere. Methods have included increased sodium hydroxide injection into the recirculation stream at the odor control scrubber, bypass of the odor control scrubber and release the hydrogen sulfide laden gas directly from the degasifier, and the use of a proprietary chemical with the odor control scrubber system. The City has recently had success with the Weatherford chemical Sulfa Clear 8411C, which has provided adequate hydrogen sulfide gas treatment and significantly reduced odor complaints from neighbors. It should be noted, however, that the cost of this proprietary chemical is expensive, particularly when purchased in 330-gallon totes (as is currently done at the plant).
8.5.1. Hydrogen Sulfide Treatment Alternatives Several hydrogen sulfide treatment options are available for the City of Venice RO WTP. Those considered most feasible based on treatment capabilities demonstrated in successful pilot and full scale installations include:
n Packed Tower/Forced Draft Aeration (FDA) (current treatment method) n Biological Oxidation followed by Ultrafiltration (UF) n Ozone oxidation (contact tank or sidestream)
A discussion of each of these options is presented in the subsections below. Additional information on these and other hydrogen sulfide removal options and the system assessment can be found in the RO Preliminary BODR (August 2012).
8.5.1.1. Alternative 1 - Packed Tower/Forced Draft Aeration Packed tower/forced draft aeration is the most common hydrogen sulfide removal method in Florida and is the method currently utilized by the City. This treatment method is generally effective for hydrogen sulfide removal at concentrations above 0.5 mg/L, but can be somewhat inefficient at high concentrations due to the solubility of hydrogen sulfide in water.
Two upgrade options considered for the City with this alternative include:
1. Alternative 1a - Replace Existing Degasifier/Odor Control System: This option includes a complete replacement of the existing degasifier and blower with two new optimally sized degasifiers and blowers to provide a redundant degasifier system. The two new degasifiers/blowers would provide the latest in hydrogen sulfide gas removal technology and would provide a fully-integrated system. The existing single-stage scrubber would also be replaced with a new two-stage odor control scrubber equipped with higher capacity 350 gpm recirculation pumps. Given

Section 8
Treatment System Assessment and Recommendations
City of Venice Water Supply Master Plan - Phase 2 5710010
8-11
the success that the City has had using the Sulfa Clear 8411C chemical in the existing odor scrubber, a permanent chemical storage and feed system that includes a 400 gallon storage tank and two diaphragm metering pumps on a concrete pad could also be included as part of the system upgrade. This permanent system would reduce the cost of the Sulfa Clear 8411C, as it is cheaper to purchase the chemical in bulk.
Alternatively, the new scrubber system could be provided with traditional sodium hydroxide and sodium hypochlorite chemical feed systems, or, the new scrubber system could be designed around a technology, such as a biologically active system, that does not require the use of chemicals. Additional investigation and selection of a particular site-specific odor scrubbing technology is recommended during the preliminary stages of design.
A new cleaning pump to allow for chemical cleaning of the degasifier towers would also be provided to simplify degasifier cleaning. The system would consist of one end-suction pump with a capacity of approximately 500 gpm. Flexible hosing would connect the pump to either degasifier, allowing cleaning of the tower not in use. The pump suction would pull from the wetwell at the bottom of the degasifiers and the discharge would send the cleaning solution to the top of the degasifier where it will be distributed over the media inside the vessel. The cleaning solution could be dumped directly into the degasifier wetwell, and could consist of either muriatic or citric acid, which can be purchased in small quantities when a cleaning is required. Estimated capital costs for a complete replacement of the existing degasifier/odor control system is about $2,590,000. Advantages and disadvantages of this option include: Advantages
n The new systems would be sized correctly to ensure that the liquid and air velocities are optimized for dissolved hydrogen sulfide removal from the liquid stream and gaseous hydrogen sulfide removal from the off-gas.
n A new system with new degasifiers, blowers, and odor control vessels would take advantage of improvements in design and technology since installation of the existing system.
n The new system provides needed degasifier redundancy and cleaning capabilities for improved performance and ease of maintenance compared to the current system.

Section 8
Treatment System Assessment and Recommendations
City of Venice Water Supply Master Plan - Phase 2 5710010
8-12
Disadvantages
n Higher initial capital cost compared to the phased implementation approach
2. Alternative 1b - Phased Existing System Upgrade: Since the existing degasifer, blower, and odor control scrubber are functional, these systems could potentially be maintained in service while a second degasifier unit and blower similar to the existing would be provided for redundancy. The degasifiers would also be equipped with a chemical cleaning system and permanent Sulfa Clear chemical storage and feed system (if required), as proposed for the phased rehabilitation in Alternative 1a.
As previously indicated, the existing systems are nearing the end of their expected useful service lives and replacement within the planning period will be required to ensure continued reliable operation (replacement recommended within 5 years). This option includes replacement of the existing degasifier, blower, and scrubber with similar units as part of a second upgrade phase when their service life is reached. The plant may be able to use the existing units past their expected useful service lives to postpone the second upgrade phase but performance would likely decrease and maintenance requirements could increase.
The estimated capital cost for the first and second phase upgrades are $1,400,000 and $1,500,000, respectively. Advantages and disadvantages of this option include: Advantages
n Reduces the initial capital investment required while maximizing use of existing equipment. Long-term upgrades are postponed, spreading overall capital investment requirements.
n Provides degasifier redundancy and cleaning capabilities for improved performance and ease of maintenance compared to the current system.
n If required for the new design, a permanent proprietary chemical storage and feed system could reduce costs for this chemical.
n High operational/maintenance familiarity since existing system is used.
Disadvantanges
n Maintains the existing system, which may not be optimally sized and configured, nor operate as efficiently as a new system that makes use of improvements in design and technology.
n A phased upgrade will provide a system that may not be fully integrated nor ideally configured for optimum operation.

Section 8
Treatment System Assessment and Recommendations
City of Venice Water Supply Master Plan - Phase 2 5710010
8-13
n Total capital costs are increased due to two mobilizations and potential reengineering required for the second upgrade phase.
n Given the age and condition of existing system, the second phase may need to be implemented shortly after the initial phase is completed.
8.5.1.2. Alternative 2 – Biological Oxidation with Ultrafiltration (UF) Biological oxidation can be an effective hydrogen sulfide treatment method that requires minimal chemical usage since it relies on natural biological processes. A biofilm converts hydrogen sulfide to elemental sulfur and sulfate in the liquid stream and is then removed by a UF membrane system to reduce turbidity in the finished water. Biological oxidation requires adequate retention time for the bacteria to work. This retention time would be provided by two 0.6 MG ground storage tanks.
The UF system would require a new building to house the membranes and appurtenances. The existing site would require significant changes to allow for the tanks and new building to fit, and further analysis is required to confirm that this alternative is viable due to site constraints. Significant piping modifications would be required to divert blended flow from the RO membranes to the ground storage tanks and then to the UF membrane system. Booster pumps may be required for the UF membrane feed. Waste streams from the UF membrane include backwash waste and chemical cleaning waste flows. Treatment of the biological film may require an additional hypochlorite rinse to prevent biological growth on the membranes.
Estimated capital costs for this alternative are approximately $24,500,000. Advantages and disadvantages of this alternative include:
Advantages
n Effective liquid stream hydrogen sulfide removal process requiring minimal chemical addition.
Disadvantages
n Significantly higher capital costs than a packed tower/forced draft air treatment system.
n Hydrogen sulfide removal efficiency is not significantly higher than a packed tower/forced draft air treatment system.
n Increased operational complexity associated with biological and UF system over current system.
n Higher capital costs to existing system primarily due to the UF system.
n Space constraints may make this alternative unfeasible.

Section 8
Treatment System Assessment and Recommendations
City of Venice Water Supply Master Plan - Phase 2 5710010
8-14
Due to the high capital costs, potential space constraints, and increased implementation complexity, this alternative is not recommended for further consideration.
8.5.1.3. Alternative 3 – Ozone Oxidation Ozone oxidation can be used to effectively remove hydrogen sulfide, with two configurations available for ozonation of the liquid process stream. Ozone oxidation can be provided using an ozone contact tank and bubble diffusers to deliver gaseous ozone in the water, providing complete oxidation of hydrogen sulfide. This type of system would require a liquid oxygen storage system, a contact tank with ozone diffusers, ozone building, ozone generators, and power supply units, nitrogen boost system, and a cooling system. The addition of the ozone generator building and liquid oxygen storage system would require significant changes to the site and there may not be sufficient space based on the plant’s current layout. Annual electrical costs would also significantly increase due to the power requirements of the ozone generation system.
Ozone oxidation can also be provided by sidestream injection. This system would be similar to the contact tank method with the addition of a sidestream pump system and a dissipation chamber replacing the diffusers and contact tank. Annual electrical costs would be higher for a sidestream system due to the ozone generation system and the sidestream pump station. It is unlikely that the existing site could accommodate this type of system due to the space constraints associated with the required process components.
Estimated capital costs for ozone contact and sidestream injection systems are $17,080,000 and $20,560,000, respectively. Advantages and disadvantages of this alternative include:
Advantages
n Complete oxidation of hydrogen sulfide from the liquid process stream can be achieved.
Disadvantages
n Significantly higher capital costs than a packed tower/forced draft air treatment system.
n Increased operational complexity associated with the ozone generation and sidestream pump systems.
n Significantly higher operating costs due to high electrical usage associated with ozone generation system and sidestream pump station.
n Space constraints may make this alternative unfeasible.
Due to the high capital costs, potential space constraints, and increased implementation complexity, this alternative is not recommended for further consideration.

Section 8
Treatment System Assessment and Recommendations
City of Venice Water Supply Master Plan - Phase 2 5710010
8-15
8.5.2. Recommended Degasifier/Odor Control System Improvements ARCADIS recommends a complete replacement of the existing degasifier and odor control system with two new degasifiers, blowers, and a new two-stage odor control scrubber (Alternative 1a). This alternative is recommended over a phased upgrade of the existing system (Alternative 1b), since a properly sized and fully integrated system would be provided at a total capital cost that is lower than a phased system upgrade. It is anticipated that the recommended system would operate more efficiently and provide improved performance over the partial upgrade of the existing system provided under Alternative 1b. Table 8-2 provides a summary of the recommended improvements for the Degasifier and Odor Control Systems.
Table 8-2: Degasifier and Odor Control Systems Improvement Summary
Description Improvement Degasifier System
Degasifier Replace, Add 2nd for Redundancy
Degasifier Blower Replace, Add 2nd for Redundancy
Scrubber Odor Scrubber Replace with two stage scrubber
Recirculation Pump Replace
Controls Replace
Chemical Systems
Sulfa Clear 8411C Install New Storage and Pumps
Cleaning System Install Pump and Piping
8.6. Finished Water/High Service Pump Station (HSPS) Following RO post-treatment and degasification, treated water is stored in a concrete clearwell structure and sent to the distribution system via three high service pumps (HSPs).
8.6.1. Clearwell The clearwell structure is a 1-MG covered cast-in-place concrete structure. It is coated internally and externally, and the external coating was observed to be stained and peeling in some locations. Also, some concrete spalling and minor external cracking is evident along the top slab of the structure. Recommended Clearwell Improvements. It is recommended that a structural investigation be conducted to determine the internal and external condition of the clearwell concrete and coating systems. The study should evaluate the concrete spalling, minor cracking, and coating system failure observed at the clearwell structure and identify improvements required to ensure continued structural integrity.

Section 8
Treatment System Assessment and Recommendations
City of Venice Water Supply Master Plan - Phase 2 5710010
8-16
8.6.2. High Service Pump Station Water is pumped from the on-site clearwell to the distribution system using three vertical turbine high service pumps fitted with VFDs. Each pump has a design point of 2,200 gpm at 200 ft. of head. The HSPs were installed in 1989 and the pumps and motors were rebuilt approximately 10 years ago. The plant typically runs one to two pumps at a time to meet system demands, with a third pump on standby for redundancy. The high service pumps appear in good condition and have been reliable. However, plant staff indicated that the high service pump VFDs experience harmonics issues and are nearing the end of their useful life. The distribution system magnetic flow meter is also nearing the end of its useful life. Plant staff also indicated that an air release valve (ARV) and a surge relief valve do not function at the HSPS. Recommended High Service Pump Station Improvements. While the pumps will need to be rehabilitated or replaced in approximately 6 to 10 years, it is recommended that in the immediate future, the VFDs, flow meter, and pump station ARV and surge relief valve be replaced. The cost effectiveness of rehabilitating the existing pumps versus replacing them with more efficient pumps should be considered at that time.
Should the City elect to upgrade the RO WTP to second stage reverse osmosis treatment to meet increased demand requirements, an additional HSP would be recommended to provide adequate firm pumping capacity based on a preliminary analysis of projected peak flows to the distribution system. The increase in treated water capacity could be handled by an additional pump similar in size to the existing HSPs. It should be noted that the HSPS is currently designed to accommodate the installation of up to two additional pumps.
8.7. Concentrate Disposal System As discussed in Section 7.5, the concentrate stream that is rejected by the reverse osmosis process is discharged to a mixing zone in the Gulf Intracoastal Waterway, before eventually flowing to the Gulf of Mexico. Prior to discharge, the stream is treated with sodium hypochlorite and compressed air (to neutralize hydrogen sulfide gas). Dissolved oxygen is also added via an air compressor to remove dissolved hydrogen sulfide in the concentrate stream. A flow meter measures the flow before the concentrate is discharged to the ICWW. The concentrate disposal system appears in generally good condition with no significant issues noted by plant staff; however, it is anticipated that portions of the system will reach the end of their expected useful service life within the master planning period. Recommended Concentrate Disposal System Improvements. The concentrate compressed air system was installed in 1990 and is recommended for replacement within 2 years, at the end of its estimated useful life. Additionally, the concentrate magnetic flow meter will likely reach the end of its useful life in about 2 to 5 years and should be replaced.

Section 8
Treatment System Assessment and Recommendations
City of Venice Water Supply Master Plan - Phase 2 5710010
8-17
8.8. Electrical, Instrumentation and Controls (I&C), and Security 8.8.1. Electrical Systems The existing electrical system at the RO WTP was installed in 1990 and was combined with the electrical components installed during the construction of Phase I in 1975. The power service of Phase I is connected to the Phase II distribution through an 800 ampere breaker located in the more recently constructed Phase II electrical room. Each system is located in their respective electrical rooms at the Phase I and Phase II RO buildings. The City’s existing switchgear is manufactured by General Electric (GE), and is located in the Phase II building electrical room. It is over 20 years old but appears to be in good condition. The switchgear is rated at 3,000 amperes, 480 Volt, 3-phase and is a 3-wire system, which means there is no neutral at 480V and therefore in this configuration cannot provide 277V for equipment such as lighting. It has solid state protection on the main feeder breaker also by General Electric. The existing Phase I distribution motor control center (MCC) is manufactured by Schneider Electric (Square D), and is in reasonable condition. The motor controllers for the RO feed pumps originally installed in the MCC were removed and new ones were installed on the opposite wall. The facility’s 1,250 kilowatt (kW) generator provides power to both Phase I and Phase II RO systems and ancillary treatment equipment, including high service pumping. It is a diesel engine-driven unit with a 3,000 gallon above ground tank. The generator can provide backup power to run the water facility and two supply wells in case of a power failure. Two portable generators can also provide backup power to additional well sites in case of power failure. Recommended Electrical Improvements. The primary plant electrical components include the Phase I and II MCCs, the diesel generator, and the switchgear, all of which were installed in 1989-1990. These systems will likely reach the end of their useful life in 11 to 15 years, at which time replacement is recommended. According to discussions with plant staff, the switchgear breaker was last calibrated upon installation over 20 years ago. Typically, it is recommended that this equipment be calibrated about every 5 years, as such, it is recommended that the switchgear be calibrated in the immediate future. To confirm the condition of the existing switchgear, it is recommended that thermograph images be taken by a licensed contractor. This initial study will provide a baseline for the switchgear to be compared to future thermographic studies, to be completed every five years. A Breaker Coordination study is also recommended per NFPA 70E requirements every five years, or when major renovations are completed. The study should include a fault current analysis and analysis of the installed breaker trip curves to determine setpoints for the main and subsequent feeder breakers. This is completed to avoid the tripping of

Section 8
Treatment System Assessment and Recommendations
City of Venice Water Supply Master Plan - Phase 2 5710010
8-18
upstream breakers in the event of a fault downstream where other subordinate breakers should handle the fault in order to keep other areas of the plant in operation. Since fault current calculations are a part of the study, NFPA 70 also requires that an Arc Flash study be performed. The Arc Flash Study will calculate the incident energy of equipment when energized, and will define approach boundaries around energized equipment and classify the necessary personal protection equipment required to breach the boundary for operation or maintenance. The engine hours of the existing generator are low (fewer than 1,000 hours) and yearly oil and filter changes have been performed as dictated by the minimum EPA requirements. However, a complete load bank test has not been performed in the past five years, as recommended by the manufacturer. This stress test is a four hour examination where the generator is run at 50, 75 and 100 percent of designed generator load. In addition, it is recommended that the main tank fuel be tested, preferably before any new fuel has been added. If contaminants are found, options such as a fuel polishing system should be evaluated.
8.8.2. Instrumentation and Controls The SCADA system used to operate the Phase II equipment is Allen Bradley PLC Technology. The SCADA system is interfaced with a desktop computer, loaded with Allen Bradley “Wonder Ware” and a 900 megahertz (MHz) radio telemetry system. It allows plant personnel to monitor and adjust all plant operational parameters, raw water well control, distribution flows and pressure, as well as remote booster pumping control. The Phase I plant’s automation is currently limited to the high pressure pumps, which have been fitted with VFDs to control feed pressures for improved efficiency. The plant has a significant amount of instrumentation to assist in monitoring and controlling plant systems and processes. Operations staff has indicated issues with some of the instrumentation equipment. For example, flow is monitored in certain locations with Onicon turbine flow meters. The plant has noted that they have issues with these flow meters. In addition, plant personnel has expressed concern with the instruments monitoring the concentrate disposal dissolved oxygen and chlorine residual. Given the average lifespan of instrumentation is 10-12 years, unless they were replaced as part of routine maintenance, the field instruments have reached or are approaching the end of their useful life. Recommended I&C Improvements. Given the age of the PLC hardware/HMI software and limited availability to find spare parts, a complete replacement of the SCADA system is warranted and is being included as part of the ongoing RO system rehabilitation project. As several field instruments have reached the end of their useful life and have been unreliable for certain processes, it is recommended that they be evaluated for viability and/or replaced in the immediate future as part of the current RO system rehabilitation

Section 8
Treatment System Assessment and Recommendations
City of Venice Water Supply Master Plan - Phase 2 5710010
8-19
project or as a separate project(s). As a minimum, the following field instruments are recommended to be replaced or added: n Flowmeters n Conductivity probe on RO permeate n pH analyzer and pressure transmitter on cleaning system n Differential pressure across cartridge filters n Level transmitters on chemical tanks n Concentrate DO and chlorine residual monitors
It is also recommend that the telemetry network be evaluated. The main telemetry network options for communication with remote sites in the supply and distribution systems are cellular, private licensed radio, and private license-free radio. ARCADIS recommends that radio be used as the telemetry backbone for the City. This decision will need to be confirmed by radio field studies to insure that stable radio communication is available between the plant and the remote sites. However, the payback period for radio is typically 5-7 years and it prevents the City from being reliant on a third party service provider.
8.8.3. Security and Fire Systems The WTP site is surrounded by a perimeter fence with a gated entrance that encompasses all critical equipment. Photo identification cards with embedded microchip circuitry serve as pass keys to entry doors and two gate access locks (keycard access system). Signs are also posted at each entrance notifying restricted access. There are eight video surveillance cameras (installed in 2002) situated at critical areas around the plant, four of which have pan, tilt and zoom capabilities. The video stream is monitored internally by control room personnel. Water production and distribution employees are supplied with Nextel radios to communicate during emergencies. The plant has four main building structures; however, only the Administration Building is equipped with a fire alarm system. The two buildings which house the RO, electrical distribution, standby generator, control, and break rooms and the Maintenance Building do not have any fire alarm infrastructure. Recommended Security Improvements. Although the plant has installed significant security measures, the existing security system should be compared to the Vulnerability Study performed between 2002- 2003 as required by the Patriot Act Directive 39. One example of a necessary security enhancement is the installation of exterior lighting. Based upon this review, further recommendations can be made based on the current conditions and security data available. It is also recommended that a fire alarm system for the Phase I, Phase II and Maintenance buildings be installed. Smoke and flame detection is recommended in the electrical, control and process areas along with the necessary audio/visual alarms and pull stations.

Section 8
Treatment System Assessment and Recommendations
City of Venice Water Supply Master Plan - Phase 2 5710010
8-20
Connection to the City’s Security system for notification or local fire department is also recommended to be included.
8.9. Summary of RO WTP System Recommendations Table 8-3 below summarizes the recommended improvements for the City of Venice RO WTP system.
Table 8-3: Summary of Recommended RO WTP Improvements
Item No. Item Description
Recommended Studies/Tests/Inspections
1 RO System Treatment Recovery and Concentrate Management Study
Conduct study to evaluate feasibility of increasing RO recovery to 75%. Investigate potential to increase NPDES-permitted concentrate discharge quantities/ concentrations and investigate additional discharge methods. To be submitted to SWFWMD by Jan 15, 2018, per permit requirements.
2 RO Pilot Study Conduct pilot study to confirm the most effective equipment, chemicals, implementation requirements, and recoveries prior to installing 2nd stage RO skids.
3 Clearwell Investigation Evaluate concrete spalling and coating system condition - inside and outside.
4 Thermographic Study and Insulation Test
Confirm condition of existing switchgear by performing thermograph imaging of electrical connections.
5 Coordination and Arc Flash Study
Conduct breaker coordination study that includes fault current analysis and breaker trip curve analysis. Conduct arc flash study to define approach boundaries around energized equipment and PPE requirements.
6 Switchgear Breaker Calibration Calibration recommended every five years.
7 Generator and Fuel Tank Evaluation
Confirm state of existing generator via condition or “stress” testing. Also evaluate fuel system.
Pretreatment
8 Sand Separator Inspection Confirm condition and suitability of Phase I and II sand separators for continued long-term use.
9 Sand Separator Replacement
Replace existing phase I and II sand separators, depending on results of sand separator inspection
Reverse Osmosis System
10 Antiscalant Metering Pump Upgrade
Install redundant metering pumps to Phase I and II antiscalant systems for increased system reliability.
11 Phase II Antiscalant System Replacement
Replace Phase II antiscalant metering pumps and day tank.
12 Phase II RO CIP System Replacement Replace Phase II clean-in-place system.
13 Phase II Raw Water Pressure Relief Valve Redesign/replacement
Redesign and replace pressure relief valve on raw water line at RO Phase II with correct valve system.

Section 8
Treatment System Assessment and Recommendations
City of Venice Water Supply Master Plan - Phase 2 5710010
8-21
Item No. Item Description
Post Treatment
14 Sodium Hydroxide System Replacement
Replace sodium hydroxide metering pumps, day tank, and bulk storage tank.
15 Corrosion Inhibitor System Replacement
Replace corrosion inhibitor metering pumps and day tank.
16 CO2 System Control Panel and Booster Pump Replacement
Current system lacks automatic control, and has issues with valves and meters. Replace panel and booster pump.
17 CO2 Tank and Piping Replacement Replace CO2 tank and ancillary piping.
Degasifier and Odor Control Systems
18 Degasifier and Blower Replacement
Replace existing degasifier and blower with latest technology and install a 2nd degasifier and blower for system redundancy
19 Two-stage Scrubber System Installation
Replace existing odor control scrubber with a two-stage system. Add recirculation pump and controls.
20 Degas Chemical Storage and Dosing System
Install permanent chemical storage and dosing system for proprietary chemical used to treat degasifier off-gas.
21 Degasifier/Scrubber Cleaning Pump System Installation
Install degasifier/scrubber cleaning pump system to make system cleaning simpler and more operator friendly.
Finished Water
22 HSP Surge Relief Valve Replacement Replace surge relief valve at high service pump station.
23 High Service Pump and VFD Renewal/replacement
Renew/replace three existing high service pumps and associated VFDs
24 Install Additional High Service Pump
Install one additional HSP and VFD, required when the 2nd Stage RO skids are added to provide additional production capacity.
Concentrate Management
25 Concentrate Compressed Air System Replacement Replace concentrate treatment compressed air system.
26 Concentrate Flow Meter Replacement Replace existing concentrate magnetic flow meter.
27 Concentrate Management Improvements
Design and construct concentrate management improvements when the 2nd Stage RO skids are added to provide additional production capacity.
Electrical, I&C, and Security Improvements
28 Plant Security Upgrade Install security upgrades, including exterior lighting, perimeter fencing, security entry ways, security cameras, and any outstanding items from 2002-2003 VA Study.
29 Fire Alarm System Installation
Install fire alarm systems for Buildings A and B and Maintenance Building.
30 Telemetry System Install new radio system, assess via radio field studies.

Section 8
Treatment System Assessment and Recommendations
City of Venice Water Supply Master Plan - Phase 2 5710010
8-22
Item No. Item Description
31 Field Instrument Replacement Evaluate/replace faulty field instruments.
32 Generator Replacement Replace existing generator with generator that is adequately sized for RO upgrade.
33 Phase I and II MCC Replacement Replace phase I and II MCCs.
34 Switchgear Replacement Replace switchgear equipment.

City of Venice Water Supply Master Plan - Phase 2 5710010
9-1
9
9. Distribution System Assessment and Recommendations
9.1. Introduction This section presents the assessment and recommended improvements required to meet City-projected growth, annexation, and acquisition from a distribution system perspective. Options are evaluated to improve the City’s existing water distribution system to continue to provide the highest quality of water to the City’s customers. In addition, methods for expansion of the distribution system are evaluated for the areas where growth is anticipated per the City’s Planning Department.
9.2. Existing System Evaluation/Improvements The performance of the existing system was analyzed under annual average day demand (AADD), maximum day demand (MDD), and MDD plus fire flow (FF). All of the existing system scenarios were performed using the calibrated model (refer to Appendix A for the July 2012 Model Development and Calibration Report for model development and calibration details). Water age was analyzed under the AADD scenario to determine areas in the system where water quality issues may be a concern due to water stagnation and limitations of flow. Water main velocities and system pressures were analyzed under the MDD and MDD plus FF scenarios to determine which water mains are under excessive stress (i.e. have high velocities) and which customers may experience low pressures under high demand conditions. The performance criteria used for the analyses were based on the following industry standards for acceptable velocities and pressures: n Recommended Standards for Water Works, Great Lakes – Upper Mississippi
River Board of State and Provincial Public Health and Environmental Managers, 2003;
n Distribution System Requirements for Fire Protection, American Water Works Association (AWWA) Manual M31, 1998;
n Distribution Network Analysis for Water Utilities, AWWA Manual M32, 1989; n Advanced Water Distribution Modeling and Management, Haested Methods et al,
2003.
The performance criteria are summarized in Table 9-1. These criteria are in line with and meet the requirements of Chapter 62-555.320 of the FAC, which governs all aspects of water treatment and distribution systems within the state of Florida.
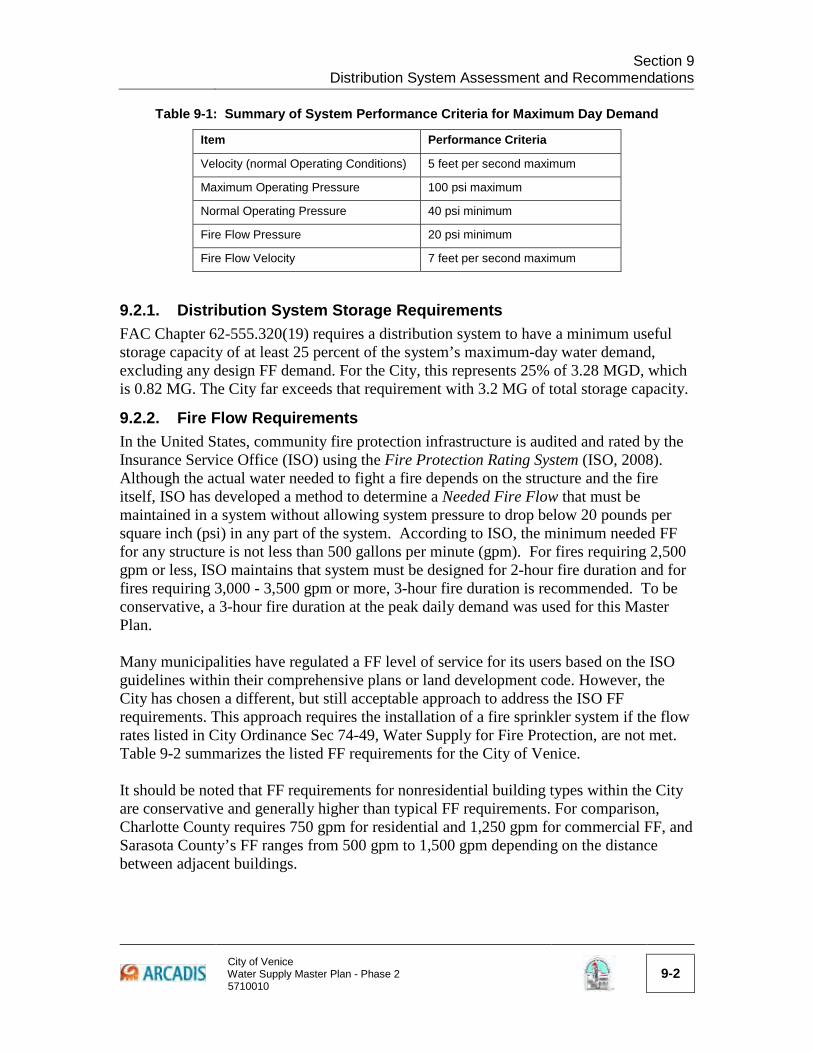
Section 9
Distribution System Assessment and Recommendations
City of Venice Water Supply Master Plan - Phase 2 5710010
9-2
Table 9-1: Summary of System Performance Criteria for Maximum Day Demand
Item Performance Criteria
Velocity (normal Operating Conditions) 5 feet per second maximum
Maximum Operating Pressure 100 psi maximum
Normal Operating Pressure 40 psi minimum
Fire Flow Pressure 20 psi minimum
Fire Flow Velocity 7 feet per second maximum
9.2.1. Distribution System Storage Requirements FAC Chapter 62-555.320(19) requires a distribution system to have a minimum useful storage capacity of at least 25 percent of the system’s maximum-day water demand, excluding any design FF demand. For the City, this represents 25% of 3.28 MGD, which is 0.82 MG. The City far exceeds that requirement with 3.2 MG of total storage capacity.
9.2.2. Fire Flow Requirements In the United States, community fire protection infrastructure is audited and rated by the Insurance Service Office (ISO) using the Fire Protection Rating System (ISO, 2008). Although the actual water needed to fight a fire depends on the structure and the fire itself, ISO has developed a method to determine a Needed Fire Flow that must be maintained in a system without allowing system pressure to drop below 20 pounds per square inch (psi) in any part of the system. According to ISO, the minimum needed FF for any structure is not less than 500 gallons per minute (gpm). For fires requiring 2,500 gpm or less, ISO maintains that system must be designed for 2-hour fire duration and for fires requiring 3,000 - 3,500 gpm or more, 3-hour fire duration is recommended. To be conservative, a 3-hour fire duration at the peak daily demand was used for this Master Plan. Many municipalities have regulated a FF level of service for its users based on the ISO guidelines within their comprehensive plans or land development code. However, the City has chosen a different, but still acceptable approach to address the ISO FF requirements. This approach requires the installation of a fire sprinkler system if the flow rates listed in City Ordinance Sec 74-49, Water Supply for Fire Protection, are not met. Table 9-2 summarizes the listed FF requirements for the City of Venice. It should be noted that FF requirements for nonresidential building types within the City are conservative and generally higher than typical FF requirements. For comparison, Charlotte County requires 750 gpm for residential and 1,250 gpm for commercial FF, and Sarasota County’s FF ranges from 500 gpm to 1,500 gpm depending on the distance between adjacent buildings.

Section 9
Distribution System Assessment and Recommendations
City of Venice Water Supply Master Plan - Phase 2 5710010
9-3
Table 9-2: City of Venice Minimum Fire Flowrate Required Prior to Sprinkler Installation
Building Type Performance Criteria New Single Family Residential 1,000 gpm @ 20 psi
Existing Single Family Residential 500 gpm @ 20 psi
Other 2,500 gpm @ 20 psi
For the purposes of this analysis, the model junctions were designated as either residential (requiring at least 500 gpm for 3 hours for existing buildings) or commercial (requiring at least 2,500 gpm for 3 hours), which were based on the City’s Future Land Use Map (FLUM). Figure 9-1 shows the FLUM and Figure 9-2 shows the residential and commercial junction designations.
Per conversations with the City Fire Chief, existing residential areas that did not meet the 500 gpm FF requisite were identified as requiring distribution system improvements to enable the system to meet the 500 gpm FF at a minimum pressure of 20 psi requisite. On the other hand, system improvements to meet the 2,500 gpm FF requisite require the installation of large diameter pipe, which would increase the system water age and decrease the chlorine residual. Hence, it was decided that commercial areas that did not meet the 2,500 gpm FF requisite were identified as requiring the installation of fire suppression sprinkler systems within the commercial building rather than requiring distribution system improvements.

ARCADIS-US, INC.CITY OF VENICE200 N WARFIELD AVE, VENICE, FL 34285
WATER MASTER PLAN PHASE 2
WATER MASTER PLAN REPORT
FUTURE LAND USE MAP
=
=
=
==
³
Legend
= Pumps
UT Ground Storage Tanks
"³³ Elevated Storage Tank
Water PipeCity Boundary
FLUM_CityLimitsFLU_CODE
AIRPORT OPERATIONSCOMMERCIALCONSERVATIONGREENWAY/RIVER BUFFER
INDUSTRIALINDUSTRIAL- COMMERCIALINSTITUTIONAL-PROFESSIONALLOW DENSITY RESIDENTIALMARINE PARKMEDIUM DENSITY RESIDENTIALMODERATE DENSITY RESIDENTIALPUBLIC BUILDINGS & FACILITIESRECREATION & OPEN SPACETRANSITIONVOLUNTARY ANNEXATIONWATERWAYS
AUGUST 2013
FIGURE 9-1
0 5,000 10,0002,500
Feet
WTP

ARCADIS-US, INC.CITY OF VENICE200 N WARFIELD AVE, VENICE, FL 34285
WATER MASTER PLAN PHASE 2
WATER MASTER PLAN REPORT
FIRE FLOW NODES
=
=
=
==
³
Legend
= Pumps
UT Ground Storage Tanks
"³³ Elevated Storage Tank
JunctionsFire Flow Nodes
Commercial FFResidential FFPipesCity Boundary
AUGUST 2013
FIGURE 9-2
0 5,000 10,0002,500
Feet
WTP

Section 9
Distribution System Assessment and Recommendations
City of Venice Water Supply Master Plan - Phase 2 5710010
9-6
9.2.3. Average Annual Day Demand – Water Age Results The water age analysis was performed using the calibrated model under average annual customer demands. Additional demand was also added to the model to simulate the operation of the sixteen automatic flushers throughout the distribution system. The HSP’s were turned on throughout the model analysis and the booster pump station was turned off. The booster pump station is normally controlled by the clearwell tank level (the booster pump station is used to supplement flow from the HSPs to allow the HSPs to discharge less flow which in turn allows the clearwell to fill). However, since the clearwell is modeled as a reservoir, per industry standards, which has an infinite volume and set elevation, rather than a tank, the booster pump station controls are not tied to the clearwell and the booster pump station has no need to turn on. This resulted in slightly lower water age results than would be expected near the booster pump station since none of the older water from the GST entered the system as a result of the booster pump station not turning on. The model was run as an extended period simulation (EPS) for 10 days to show the maximum water age of the system. Figure 9-3 illustrates the results of the existing system water age analysis. As expected, the water age is the lowest near the WTP and highest at the extremes of the distribution system. Additionally, there are a number of dead-end mains with elevated water age. Water age can be used as an indirect indicator for distribution system water quality in particular related to disinfectant residuals and disinfectant by-product (DBP) levels. The water age analysis was completed as part of this evaluation to show the relative difference in water ages to help identify areas where low residual levels may be of concern. The City has not reported any residual problems to date and has met all of the water quality requirements of the Florida Department of Environmental Protection (FDEP). It is not unusual for distribution systems which have a groundwater source and RO treatment to have very stable water and low DBPs even with higher water ages. As such, ARCADIS recommends the City continue to monitor the chlorine residuals throughout the distribution system and consider increasing the system flushing should low residuals become an issue. In particular, the North area of the distribution system has widespread high water ages. It is important to monitor this area carefully.

ARCADIS-US, INC.CITY OF VENICE200 N WARFIELD AVE, VENICE, FL 34285
WATER MASTER PLAN PHASE 2
WATER MASTER PLAN REPORT
EXISTING SYSTEM WATER AGE
=
=
=
==
³
Legend
= Pumps
UT Ground Storage Tanks
"³³ Elevated Storage Tank
Less than 1 day1 to 2 days2 to 3 days3 to 4 days4 to 5 days5 to 6 days6 to 7 days7 to 8 days8 to 9 daysGreater than 9 daysPipesCity Boundary
AUGUST 2013
FIGURE 9-3
0 5,000 10,0002,500
Feet
WTP

Section 9
Distribution System Assessment and Recommendations
City of Venice Water Supply Master Plan - Phase 2 5710010
9-8
9.2.4. Maximum Day Demand Scenario A Maximum Day Demand (MDD) analysis was performed using the calibrated model with base demands set to 1.3 times the maximum month consumption of March 2010 as previously described. As with the water age analysis, the HSPs were operational during the MDD scenario, but the booster station was shut off (refer to Section 9.2.3 above for more details). All initial tank levels were set to the initial tank level used for calibration. Additionally, an extended period simulation of 24-hours was run for the MDD. The extended period simulation allows for review of the elevated storage tank (EST) levels and includes the peak hour demands within the diurnal pattern.
9.2.4.1. Maximum Pipe Velocities The results of the existing system analysis show that the system has no areas of concern regarding high velocities. However, the velocities are elevated through the automatic flushers, which is expected and not a concern. The highest velocity within the distribution system, other than the automatic flushers, was 4.81 feet per second (fps) located next to the Venice Regional Medical Center at the intersection of Sovrano Rd and The Rialto, which is below the 5 fps maximum velocity performance criteria established, as outlined in Table 9-2. Figure 9-4 shows the maximum pipe velocities during the MDD analysis.
9.2.4.2. System Pressures An analysis of the minimum system pressures during the maximum day demand scenario found that the lowest pressure was 43 psi at the intersection of Clubhouse Road and N Waterway, but the majority of the pressures remained above 50 psi. The maximum pressure was 59 psi on Tarpon Center Drive about 600 feet south of Higel Park. The maximum and minimum pressures are close in range due to the VFD’s that are controlled by pressures downstream of the WTP. Overall, the system pressures were typical and within the range of normal operating pressures for distribution systems. Figure 9-5 shows the minimum pressures during the MDD analysis.
9.2.4.3. High Service Pump Flows The WTP is permitted at 4.32 MGD. During the MDD system analysis, the HSPs produced an hourly flow ranging from 597 gpm (0.86 MGD) to 2,826 gpm (4.07 MGD), with the average hourly flow being 2,016 gpm (2.90 MGD). This is well within the permitted capacity of the WTP and capabilities of the HSP curves.

ARCADIS-US, INC.CITY OF VENICE200 N WARFIELD AVE, VENICE, FL 34285
WATER MASTER PLAN PHASE 2
WATER MASTER PLAN REPORT
EXISTING SYSTEMMDD - MAX VELOCITIES
=
=
=
==
³
Legend
= Pumps
UT Ground Storage Tanks
"³³ Elevated Storage Tank
PipesMAXVEL
0 to 5 fps5 to 7 fps7 to 10 fpsGreat than 10 fpsCity Boundary
AUGUST 2013
FIGURE 9-4
0 5,000 10,0002,500
Feet
WTP

ARCADIS-US, INC.CITY OF VENICE200 N WARFIELD AVE, VENICE, FL 34285
WATER MASTER PLAN PHASE 2
WATER MASTER PLAN REPORT
EXISTING SYSTEMMDD - MIN PRESSURES
=
=
=
==
³
Legend
= Pumps
UT Ground Storage Tanks
"³³ Elevated Storage Tank
JunctionsMIN_PRESS
Less than 20 psi20 to 40 psi40 to 60 psi60 to 80 psi80 to 100 psiGreater than 100 psiPipesCity Boundary
AUGUST 2013
FIGURE 9-5
0 5,000 10,0002,500
Feet
WTP

Section 9
Distribution System Assessment and Recommendations
City of Venice Water Supply Master Plan - Phase 2 5710010
9-11
9.2.5. Distribution System Storage Tanks
9.2.5.1. Tank Turnover The ESTs have a total depth of 32.5 ft and the GST has a depth of 22 ft. To ensure proper mixing, which helps reduce water age and maintain distribution system residuals, storage tanks need to be sufficiently mixed and turned over so water does not remain in the tanks for extended time periods, which can result in a loss of disinfectant residual. An appropriate amount of tank turnover is considered acceptable when the tank fills and empties at least 40% of its volume daily. Figure 9-6 and Figure 9-7 show the tank levels of all three tanks during two weeks in May 2011 and during the calibration period in February 2012, respectively.
Figure 9-6: Tank Levels – May 2011
0
5
10
15
20
25
30
4/29
/11
0:00
5/1/
11 0
:00
5/3/
11 0
:00
5/5/
11 0
:00
5/7/
11 0
:00
5/9/
11 0
:00
5/11
/11
0:00
5/13
/11
0:00
5/15
/11
0:00
5/17
/11
0:00
Tank
Leve
l (ft
)
Date
WTP EST Ball Park EST GST
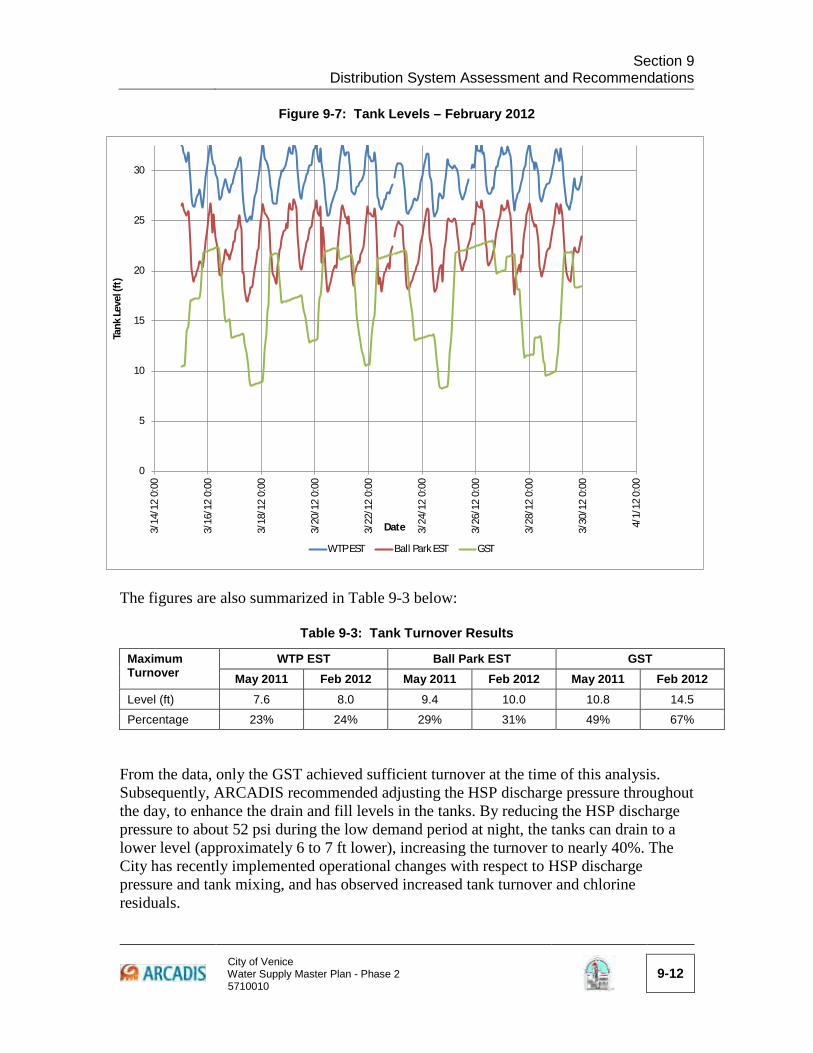
Section 9
Distribution System Assessment and Recommendations
City of Venice Water Supply Master Plan - Phase 2 5710010
9-12
Figure 9-7: Tank Levels – February 2012
The figures are also summarized in Table 9-3 below:
Table 9-3: Tank Turnover Results
Maximum Turnover
WTP EST Ball Park EST GST May 2011 Feb 2012 May 2011 Feb 2012 May 2011 Feb 2012
Level (ft) 7.6 8.0 9.4 10.0 10.8 14.5
Percentage 23% 24% 29% 31% 49% 67% From the data, only the GST achieved sufficient turnover at the time of this analysis. Subsequently, ARCADIS recommended adjusting the HSP discharge pressure throughout the day, to enhance the drain and fill levels in the tanks. By reducing the HSP discharge pressure to about 52 psi during the low demand period at night, the tanks can drain to a lower level (approximately 6 to 7 ft lower), increasing the turnover to nearly 40%. The City has recently implemented operational changes with respect to HSP discharge pressure and tank mixing, and has observed increased tank turnover and chlorine residuals.
0
5
10
15
20
25
303/
14/1
2 0:
00
3/16
/12
0:00
3/18
/12
0:00
3/20
/12
0:00
3/22
/12
0:00
3/24
/12
0:00
3/26
/12
0:00
3/28
/12
0:00
3/30
/12
0:00
4/1/
12 0
:00
Tank
Leve
l (ft
)
Date
WTP EST Ball Park EST GST

Section 9
Distribution System Assessment and Recommendations
City of Venice Water Supply Master Plan - Phase 2 5710010
9-13
Additionally, ARCADIS recommends investigating the tank configurations to improve mixing. There are a number of minor modifications that can be made to increase mixing within the tank, thus increasing tank turnover. More details on possible tank modifications are discussed in Section 9.2.9.
9.2.6. Maximum Day Demand Using Emergency Interconnections Only The City has two emergency interconnections; one is an 8-inch connection located on the south side of Venice near the intersection of Country Club Way and Gulf Coast Boulevard (Country Club Way Interconnection) and the other is a 10-inch connection located on the north side of the City on the northwest corner of the intersection of Albee Farm Road and Colonia Lane (Colonia Lane Interconnection). Refer to Section 6 and Section 7.6 for additional details of existing and potential interconnections. Through the use of the calibrated model, it was determined that the combination of these two interconnections can supply water to the City and still maintain acceptable pressures during a MDD scenario should the WTP and booster pump station be inoperable. However, a minimum connection pressure of 60 psi at each interconnection is required to maintain a minimum system pressure above 40 psi. During the MDD scenario the 8-inch connection supplied 745 gpm on average, while the 10-inch connection supplied 1,040 gpm on average. It is important to note, that these interconnections cannot supply the required fire flow and pressure in case of a fire.
9.2.7. Maximum Day Demand + Fire Flow Using the FF module in InfoWater, an analysis was performed to determine the available flow for almost every node in the model while maintaining a minimum pressure of 20 psi. Junctions along service laterals were excluded from the FF analysis because no fire hydrants exist along these water lines. The analysis used a 24-hour EPS simulation and incorporated the use of the booster station pumps during the FF period. (The HSPs alone cannot supply FF to a large portion of the distribution system). The MDD+FF simulation was performed using a fire duration of 3-hours during the peak demand time of 9:00 AM to 12:00 PM. In order to maintain acceptable limits on pipe velocities (up to 7 fps is acceptable under a short duration fire event based on operational experience), the minimum pipe diameters needed for various FF rates are presented in Table 9-4.
Table 9-4: Minimum Pipe Diameters Based on Fire Flow Rates
Fire Flow Rate Minimum Diameter Required 500 gpm 6 inches
1,000 gpm 8 inches
1,500 gpm 10 inches
2,500 gpm 14 inches
3,500 gpm 16 inches

Section 9
Distribution System Assessment and Recommendations
City of Venice Water Supply Master Plan - Phase 2 5710010
9-14
9.2.7.1. Residential Fire Flow Results A number of junctions were not considered in the FF analysis if it was determined that junctions were attached to a pipe not intended to provide FF. For example, a 2-inch service line to a condominium building which is adjacent to a 6-inch line going to the same building likely indicates a situation where the service line and FF line have been separated prior to reaching the building and the 2-inch line is not intended to provide FF. The FF analysis revealed several locations in residential areas of the City’s distribution system where a residual pressure of 20 psi could not be met under a required FF of 500 gpm for 3-hours. In general, the majority of locations with deficiencies appeared on junctions located on pipes with diameters of less than 4-inches. The available fire flow for each residential junction is shown in Figure 9-8. A single FF analysis is conducted by applying the established FF to a single junction in the distribution system rather than using the FF module. The junction chosen for the single FF is typically the junction with the worst performance during the system wide FF analysis. The single FF analysis allows the effects of the FF demand on the pumps, tank and pipes to be seen and analyzed. Residential single FF analyses were also conducted for each of the three areas within the City’s distribution system, and the results of the three single FF scenarios showed that the pumps, tanks and pipes operated normally under the FF condition. The HSPs operated on their curve, the tank levels decreased but did not empty either tank, and all pipe velocities, other than directly at the FF junction, were below 7 fps.
9.2.7.2. Commercial Fire Flow Results The FF analysis also revealed several locations in commercial areas of the City’s distribution system where a residual pressure of 20 psi could not be met under a required fire flow of 2,500 gpm for 3-hours. The available fire flow results are summarized in Figure 9-9. Per City Ordinances, commercial establishments without access to adequate fire protection from the City’s distribution network are required to install fire suppression sprinklers.

ARCADIS-US, INC.CITY OF VENICE200 N WARFIELD AVE, VENICE, FL 34285
WATER MASTER PLAN PHASE 2
WATER MASTER PLAN REPORT
EXISTING SYSTEMMDD+FIRE FLOW (RESIDENTIAL)
=
=
=
==
³
Legend
= Pumps
UT Ground Storage Tanks
"³³ Elevated Storage Tank
Less than 100 gpm100 to 200 gpm200 to 300 gpm300 tp 400 gpm400 to 500 gpmGreater than 500 gpmPipesCity Boundary
AUGUST 2013
FIGURE 9-8
0 5,000 10,0002,500
Feet
WTP

ARCADIS-US, INC.CITY OF VENICE200 N WARFIELD AVE, VENICE, FL 34285
WATER MASTER PLAN PHASE 2
WATER MASTER PLAN REPORT
EXISTING SYSTEMMDD+FIRE FLOW (COMMERCIAL)
=
=
=
==
³
Legend
= Pumps
UT Ground Storage Tanks
"³³ Elevated Storage Tank
Less than 500 gpm500 to 1,000 gpm1,000 to 1,500 gpm1,500 to 2,000 gpm2,000 to 2,500 gpmGreater than 2,500 gpmPipesCity Boundary
AUGUST 2013
FIGURE 9-9
0 5,000 10,0002,500
Feet
WTP

Section 9
Distribution System Assessment and Recommendations
City of Venice Water Supply Master Plan - Phase 2 5710010
9-17
9.2.8. Existing System Fire Flow Recommendations The only improvements that were considered for the existing system are those needed to meet the required residential fire flow of 500 gpm. No improvements were recommended for meeting a commercial fire flow requirement of 2,500 gpm, since this would result in significant and prohibitively expensive distribution system improvements, and would also likely result in unintended water quality issues due to increased stagnation and higher water ages. As such, it is recommended that commercial establishments not able to obtain the 2,500 gpm fire flow follow City Code 74-49 and be required to install fire suppression sprinkler systems. The fire flow analysis revealed several residential locations in the City’s distribution system where a minimum residual pressure of 20 psi could not be met under a required fire flow of 500 gpm for 3-hours. The majority of these locations have pipes with diameters less than 4-inches. Table 9-5 summarizes the recommended residential fire flow improvements. Locations for these improvements are shown in Figure 9-10.
Table 9-5: Summary of Improvements to Address Residential Fire Flow Needs
No. Location Recommended Improvement
1 Venice Lake Golf Club Replace 2,540 ft of 6-inch pipe with 8-inch pipe
2 Corte Del Rosa Replace 365 ft of 4-inch pipe with 6-inch pipe
3 Alley Between Alba St E and Base Ave E on Copper St
New Pipe: Connect 4-inch stub on Copper St to 4-inch pipe in alley
4 Sunset Dr Replace 865 ft of 4-inch pipe with 6-inch pipe
5 Venezia Park New Pipe: 2,200 ft of 4-inch pipe
6 Ravenna St New Pipe: 680 ft of 6-inch pipe
7 Verona St @ Harbor Dr S Replace 140 ft of 2-inch pipe with 6-inch pipe
8 Industrial Area east of Santa Maria St Replace 675 ft of 4-inch pipe with 6-inch pipe
9 Baycrest Dr between N Park Blvd & Bayside Dr New Pipe: 1,540 ft of 4-inch
10 El Dorado Dr Replace 530 ft of 4-inch pipe with 6-inch pipe
11 Gibbs Rd Replace 810 ft of 4-inch pipe with 6-inch pipe
12 Tarpon Center Dr Replace 615 ft of 4-inch pipe with 6-inch pipe
13 Bay Indies Mobile Park
Replace 13,230 ft of 3-inch pipe with 4-inch pipe Replace 4,175 ft of 3-inch pipe with 6-inch pipe +new pipe

WATER MASTER PLANPHASE 2
City of Venice Utilities Department200 North Warfield Avenue, Venice, FL 34285
AUGUST 2013FIGURE 9-10
=
=
=
==
³
Legend= Pumps
UT Ground Storage Tanks"³³ Elevated Storage Tank
Pipes
FF Improvements
ARCADIS, INC.
0 1,500 3,000 4,500 6,000750
Feet
WATER MASTER PLAN REPORT
2012 SYSTEM RESIDENTIAL FIRE FLOW IMPROVEMENTS
Path: G:\GISDATA\Projects\5710\010\MXD\Master Plan Report\9-10 - Fire Flow Improvements.mxd
WTP
1
2
3
4
56
7
8
9
10
11
12
13

Section 9
Distribution System Assessment and Recommendations
City of Venice Water Supply Master Plan - Phase 2 5710010
9-19
9.2.9. Distribution System Storage Tank Improvements
9.2.9.1. Tank Mixing Though water age does not appear to present problems in the City’s distribution system, poorly mixed storage tanks can have significantly higher water age than in the distribution system itself. Poorly mixed tanks frequently operate in a “last-in-first-out” mode, which can result in water in the top of the tank rarely being discharged. It is possible that the water in the top of the tanks will have very low or no disinfectant residual and may present taste and odor problems should it be discharged to the system. Standard distribution system operational practices should include assurance of adequate mixing and turnover in storage facilities. Since the speed of the HSPs is controlled by VFDs, the levels within the ESTs have tended to remain fairly constant historically, and the tanks have not experienced adequate turnover to ensure maintenance of a low water age and chlorine residual. Additionally, the single inlet/outlet and dry riser design of the two elevated storage tanks hinders mixing and increases water age within portions of the tank due to flow patterns and tank geometry. ARCADIS recommends completing a computational fluid dynamic (CFD) study on the ESTs to determine if there is proper mixing within the tanks and, if there is not proper mixing, determine the best solution to increase mixing. The primary objective of tank mixing improvements would be to direct flow into the upper reaches of the tank and around the dry riser. Such improvements may include installing a tee on the inlet/outlet pipe to increase the inlet/outlet velocity and force the flow around the dry riser, or fabrication of a customized inlet/outlet nozzle. Figure 9-11 and Figure 9-12 show examples of various tank inlet/outlet configurations. CFD modeling would aid in the design of a solution for the City’s elevated tanks based on specific data such as geometry, operating water elevations, inlet and outlet locations and velocities, etc.

Section 9
Distribution System Assessment and Recommendations
City of Venice Water Supply Master Plan - Phase 2 5710010
9-20
Figure 9-11: Example Inlet/Outlet #1 Figure 9-12: Example Inlet/Outlet #2
In addition to the inlet/outlet modifications, extending tank fill and draw cycles often results in better mixing and water quality. ARCADIS previously recommended altering the HSP discharge pressure during low demand periods to increase the turnover within the ESTs. Lowering the discharge pressure at the HSPs allows the ESTs to drain further, thus increasing tank turnover. The City has recently implemented operational changes with respect to HSP discharge pressure and tank mixing, and has observed a noticeable increase in tank turnover and chlorine residuals.
9.2.9.2. Tank Operations Currently, the EST at the WTP has a motor operated valve (MOV). This MOV does not control the inflow or outflow to the tank, but rather, is used to isolate the tank in case of an imminent overflow scenario. The MOV protects the tank and the distribution system in case of an emergency. The Ball Park EST on the Island does not have a MOV, and the City has no way to isolate the tank in cases of overflow or emergency. Additionally, the influent and effluent piping at the EST is poorly designed and laid out, making operation and maintenance activities difficult. ARCADIS recommends that a MOV be installed at the Ball Park EST to allow for opening and closing of the valve via a remote signal controlled by operations staff. The City may also choose to include a flow control valve that monitors the upstream and downstream pressures around the MOV to modulate the opening and closing of the valve to guard against water hammer or draining of the tank too quickly in the event of a drop in system pressure. Additionally, it is recommended that the influent and effluent piping at the tank be redesigned and replaced. The City currently owns an open/close MOV which could be installed at the Ball Park EST. Thus, ARCADIS recommends installing the existing MOV.
9.2.10. WTP Relocation Alternatives The existing WTP is located along Venice Avenue in the center of the City. This location is highly commercialized and there is limited space for expanding the WTP, or to store operation and maintenance equipment. As such, the City has considered relocating the

Section 9
Distribution System Assessment and Recommendations
City of Venice Water Supply Master Plan - Phase 2 5710010
9-21
WTP to a less constricted area in Wellfield Park. The City-owned Wellfield Park site is an 80- acre parcel of partially developed land approximately two miles northeast of the current site. The northern portion of this site is of sufficient size to accommodate a new WTP similar in size to the current facility. ARCADIS performed a WTP relocation evaluation as part of the August 2012, Reverse Osmosis Water Treatment Plant Preliminary Investigation Basis of Design Report (RO WTP Preliminary BODR). The cost to relocate the water treatment plant was estimated to be approximately $41,970,000. Required improvements to the distribution system associated with the WTP relocation were evaluated as part of this Master Planning effort and were found to be minimal. The only distribution system improvement found to be required is the upsizing of approximately 1,200 feet of the 12-inch water main from Venice Ave to the new WTP location along Pinebrook Road to a 16-inch water main. The cost of the new water main is estimated to be $270,000. ARCADIS does not recommend relocating the WTP to the Wellfield Park site at this time. As stated in the 2012 RO WTP Preliminary BODR, it is significantly more cost-effective to upgrade the existing WTP to meet the current and future needs of the City than to relocate the plant. Additionally, should the WTP be relocated to Wellfield Park, the Booster Pump Station will no longer be able to operate as a booster pump station due to its proximity to the relocated WTP. The Booster Pump Station would either need to be decommissioned, or turned into additional clearwell storage.
9.3. Future Conditions Evaluation and Improvements 9.3.1. Future Demand Projections and Locations As discussed in Section 4, the City uses the Bureau of Economic and Business Research (BEBR) data for permanent resident population projections. However, to account for seasonal population, the seasonal population estimates must be added to the permanent population to obtain a functional population, as required in the Florida Administrative Code (F.A.C.) Rule 9J-5.005(2)(e) and by the Southwest Florida Water Management District (SWFWMD). The functional population is the population used for the demand projections and hydraulic modeling efforts for the Master Plan. The functional population for the City was 24,647 in 2011and is projected to be 30,205 in 2030. The total projected demand based on functional population is summarized in Table 9-6. Per the most recently published 10-year Water Supply Facilities Work Plan, a significant portion of the population increase in the City is expected to come from the JPA/ILSBA areas. The JPA/ILSBA areas are not currently serviced by the City and are projected to have future demands as summarized in Table 4-1. As discussed in Section 4, the demands were calculated using the populations provided as part of the 10-year Water Supply Facilities Work Plan multiplied by the LOS. Demands not covered in the JPA/ILSBA areas were evenly distributed across the existing system. Figure 9-13 shows the locations of the JPA/ILSBA areas and their associated demands.

Section 9
Distribution System Assessment and Recommendations
City of Venice Water Supply Master Plan - Phase 2 5710010
9-22
Table 9-6: Total Projected Demand (mgd)
Existing (2011) Short-Term (2015) Long-Term (2030) Build-out
Annual
Average Maximum
Day Annual
Average Maximum
Day Annual
Average Maximum
Day Annual
Average Maximum
Day
Citywide 1.96 3.08 2.04 3.20 2.46 3.87 5.84 9.19
JPA/ILSBA 0 0 0.10 0.16 0.12 0.19 1.60 2.52 Total Projected
Demand 1.96 3.08 2.14 3.36 2.58 4.06 7.43 11.72
Table 9-7: City of Venice JPA/ILSBA Demand Projections
JPA Area
Location
Number of Nodes
Subarea
Short-Term (2015) Long-Term (2030)
MDD Demand
Flow per node
MDD Demand Increase Flow per
node
(gpm) (gpm) (gpm) (gpm) (gpm)
1 Knight's Trail Park Area (Rustic Road) 12
1 0.20 0.26
0.20 0.00 0.06
2 2.90 3.60 0.70
2(a) Auburn Road to I-75 5
1 -
0.56
- -
0.12 2 1.00 1.20 0.20
3 1.80 2.20 0.40
2(b) I-75 to Jacaranda Blvd 5
1 0.20
0.44
0.20 0.00
0.08 2 1.00 1.20 0.20
3 1.00 1.20 0.20
3 Border Road to Myakka Corridor 7
1 0.20 0.87
0.20 0.00 0.19
2 5.90 7.20 1.30
4 Venetian Golf and River Club Area (Venice Myakka River) 1 - 0.80 0.80 1.00 0.20 0.20
5 South Venice Avenue Corridor (South Venice Avenue Mixed Use Neighborhood)
12 - 43.10 3.59 53.10 10.00 0.83
6 Laurel Road 7
1 2.20
0.37
2.70 0.50
0.09 2 0.40 0.50 0.10
3 - - -
7 Pinebrook Road Area 15 - 5.90 0.39 7.20 1.30 0.09
8 Auburn Road to Curry Creek 1 - 0.40 0.40 0.50 0.10 0.10
9(a) Jacaranda Blvd (Border Jacaranda) 6 - 9.80 1.63 12.10 2.30 0.38
9(b) Border Road to Curry Creek 6 - 12.70 2.12 15.70 3.00 0.50
10 Laurel Oaks 4 - 3.30 0.83 4.10 0.80 0.20
11 Gulf Coast Blvd Enclave 11 - 17.80 1.62 22.00 4.20 0.38
Total 111 14 136 26 3

WATER MASTER PLANPHASE 2
City of Venice Utilities Department200 North Warfield Avenue, Venice, FL 34285
AUGUST 2013FIGURE 9-13
=
=
=
==
³Legend= Pumps
UT Ground Storage Tanks"³³ Elevated Storage Tank
Existing Pipes3-inch and Less
4-inch
6-inch
8-inch
10-inch
12-inch
14-inch
16-inch
18-inch
24-inch
30-inch and Greater
JPA/ILSBA
City Boundary
ARCADIS, INC.
0 2,300 4,600 6,900 9,2001,150
Feet
WATER MASTER PLAN REPORT
JPA/ILSBA FUTURE DEMANDS
Path: G:\GISDATA\Projects\5710\010\MXD\Master Plan Report\9-13 - JPA-ILSBA Demands.mxd
12015 = 3.10 gpm2030 = 3.80 gpm
102015 = 3.30 gpm2030 = 4.10 gpm
62015 = 2.80 gpm2030 = 3.20 gpm
72015 = 5.90 gpm2030 = 7.20 gpm
42015 = 0.80 gpm2030 = 1.00 gpm
32015 = 5.90 gpm2030 = 7.20 gpm
9B2015 = 12.70 gpm2030 = 15.70 gpm
9A2015 = 9.80 gpm
2030 = 12.10 gpm
2B2015 = 2.20 gpm2030 = 3.40 gpm
2A2015 = 2.80 gpm2030 = 3.40 gpm
82015 = 0.40 gpm2030 = 0.50 gpm
52015 = 43.10 gpm2030 = 53.10 gpm
112015 = 17.80 gpm2030 = 22.00 gpm
BASED ON APRIL 2010 WATER SUPPLY WORK PLAN

Section 9
Distribution System Assessment and Recommendations
City of Venice Water Supply Master Plan - Phase 2 5710010
9-24
Improvements associated with future distribution and system expansion have been classified into three categories: n Capacity Improvements – Improvements required to move water from one place
to another where the volume of water is required to meet MDD or MDD + FF demands.
n Operational Improvements – Improvements recommended to improve the ability of the operations staff and City personnel to complete their jobs effectively and efficiently.
n Water Quality Improvements – Improvements required to continue to provide high quality water to the City’s customers.
A description of recommended improvements for each of these categories is provided in the subsections below.
9.3.2. Capacity Improvements A significant portion of the projected potable water demand increase is a result of the annexation of the JPA/ILSBA areas, which represents about 60% of the total demand increase in 2015 and 30% of the total demand increase in 2030. The remainder of the demand increase within the City is not associated with a specific development or subdivision and is assumed to be dispersed throughout the existing service area. Therefore, the demand not associated with any of the JPA/ILSBA areas was evenly distributed over the existing system nodes, unlike the JPA/ILSBA demands which were isolated to the identified developments.
9.3.2.1. Transmission Mains The existing distribution system was re-evaluated using the criteria described in Section 9.2.4 under the MDD scenario and MDD + FF scenario for the 2015 and 2030 demand projections. For modeling purposes, it was assumed that water system piping within the JPA/ILSBA developments would be the responsibility of the developers. Distribution system analysis and recommended improvements were only made for areas outside of and up to the JPA/ILSBA developments. Like the existing system evaluation, the fire flow demand (1,000 gpm for new developments based on fire flow requirements for the City of Venice) is the controlling factor in the sizing of future water mains. Figure 9-14 shows the distribution system capacity improvements required to meet the projected 2030 population distribution. Other than improvements to service the JPA/ILSBA areas and the previously identified existing system fire flow improvements, the rest of the system met all of the design parameters for pressure and velocity under the MDD scenarios and met the required fire flow and pressure for the MDD plus fire flow scenario. The improvements required to meet the 2015 and 2030 JPA/ILSBA annexation demands were located in the same areas; however the different demands for the two planning horizons required different pipe diameters. As such the diameters required by the 2030

Section 9
Distribution System Assessment and Recommendations
City of Venice Water Supply Master Plan - Phase 2 5710010
9-25
demands were chosen for the future improvements. Identified improvements will need to be timed such that they occur at the same time as the JPA/ILSBA annexations occur. Costs for distribution system improvements associated with growth in the JPA/ILSBA developments are assumed to be the responsibility of the developers. Recommended transmission main improvements required to meet projected future demands and JPA/ILSBA annexations include:
1. Provide 7,700 feet of 12-inch pipe along Knights Trail Road to Laurel Oak Road to service JPA/ILSBA #1 and #10.
2. Provide a total of 20,200 feet of 12-inch pipe along the western edge of the JPA/ILSBA #3, northern edge of JPA/ILSBA #9A, eastern edge of JPA/ILSBA #2B and southern edge of JPA/ILSBA #2A. The 12-inch water main is to follow the proposed Jacaranda Blvd extension up to Laurel Rd and include a crossing under I-75 at or just north of the Jacaranda interchange. This transmission main will aid in looping the system and decreasing water age in the northeast portion of the distribution system.

ARCADIS-US, INC.CITY OF VENICE200 N WARFIELD AVE, VENICE, FL 34285
WATER MASTER PLAN PHASE 2
WATER MASTER PLAN REPORT
2015/2030 DISTRIBUTION SYSTEMCAPACITY IMPROVEMENTS
=
=
=
==
³
Legend
= Pumps
UT Ground Storage Tanks
"³³ Elevated Storage Tank
"³³ Prop. Elevated Storage Tank
3-inch and Less4-inch6-inch8-inch10-inch12-inch14-inch16-inch18-inch24-inch30-inch and Greater2030 Pipe ImprovementsCity BoundaryJPA/ILSBA
AUGUST 2013
FIGURE 9-14
0 5,000 10,0002,500
Feet
WTP

Section 9
Distribution System Assessment and Recommendations
City of Venice Water Supply Master Plan - Phase 2 5710010
9-27
9.3.2.2. Proposed Elevated Storage Tank Currently the northeast portion of the distribution system, located east of Interstate 75, is supplied with potable water through two interstate crossings. Currently, there is no potable water storage in the area and no source of water beyond the two interstate crossings, leaving the northeast area of the City vulnerable to significant water and pressure loss should one or both of the crossings break. As such, ARCADIS recommends the installation of an additional EST and emergency interconnect in the northeast portion of the system. (The emergency interconnect is discussed in more detail in Section 9.3.3.3). The proposed EST is sized to meet the MDD for a single day based on the 2030 projected demands for the areas east of I-75, which is approximately 300,000 gallons. If the pipe break is quickly isolated, the proposed volume would be able to supply water to the northeast portion of the distribution system, providing the City’s operations team with approximately one day for repair of the pipe break. The emergency interconnect could then be used if the break is not repaired within a day, or if the break is unable to be isolated quickly. Additionally, the recommended EST will provide hydraulic benefits to the City’s distribution system. Although the HSP VFDs maintain relatively level system pressures, pressures can drop due to normal diurnal demand patterns and isolated peak demands such as increased use at the industrial sites. The EST will help reduce system pressure fluctuations and can help reduce water hammer that may be caused by fire hydrant or pump operations. Beyond the hydraulic benefits of installing the proposed EST, the City may also be able to use the EST as a source of revenue by renting space to communications companies for antenna placement on the tank. Figure 9-14 also illustrates the recommended future 0.3 million gallon (MG) EST. The exact location of the proposed EST is to be determined; however the potential location is along the proposed Jacaranda Blvd extension, or north of Laurel Rd. on Knights Trail.
9.3.3. Operational Improvements Operational improvements are improvements which are recommended to improve the ability of operations staff and City personnel to complete their jobs effectively and efficiently.
9.3.3.1. Fire Hydrant Spacing Fire hydrant spacing is important to the City as a means of fire protection for structures, especially structures which do not have fire suppression sprinkler systems installed, including nearly all of the one-and two-dwelling units within the City. Section 74-79 of the City’s Municipal Code requires that a fire hydrant be located within 500 feet of the most remote exterior point of any one- and two-family dwelling unit measured along an approved roadway, or requires the installation of a fire sprinkler system approved by the fire chief or designee. Likewise, the code requires a fire hydrant to be located within 300 feet of the most remote exterior point of any non-one- or two-family dwelling unit

Section 9
Distribution System Assessment and Recommendations
City of Venice Water Supply Master Plan - Phase 2 5710010
9-28
measured along an approved roadway, or requires the installation of a fire sprinkler system approved by the fire chief or designee. A preliminary analysis of existing City fire hydrant spacing and coverage compared to the municipal code requirements was completed using a buffer analysis tool within the ArcGIS software platform. A buffer radius of 500 feet was placed around each hydrant, and buildings not completely covered by the buffers were considered to be outside the reach of any fire hydrant. Based on this preliminary analysis, 93% of the structures within the City (11,357 of 12,152 structures) are completely within the 500 foot buffer and all of the buildings in the northeast portion of the system are covered within the 500 foot hydrant buffer. Approximately 7% of the buildings within the City are not completely covered by the hydrant buffer of 500-ft, and each of those buildings are located within the Island and Central portions of the City. Figure 9-15 presents a zoomed in picture of the Island and Central portions of the City that shows various areas where buildings not completely covered by the hydrant buffer are located. ARCADIS recommends installing 46 additional fire hydrants to provide fire protection to the 7% of building not currently completely covered by the hydrant buffer of 500 ft.
9.3.3.2. Rear Lot Easement Pipes Prior to and around the 1950’s, many utilities, including water mains, were installed in rear lot easements. The most current practice is to install the utilities in front easement because these rear lot easements have become increasingly difficult to access and maintain. In many cases residents have pushed their backyard fences back, encroaching on the utility easements thus creating very narrow access. In addition to narrow access, the easements are not well maintained (mowed, cleared of vegetation, etc.), and are a common dumping ground for yard waste such as branches, logs and lawn furniture. Thus, access to the water mains within the rear lot easements now must be made across the homeowner’s property. The service, repair and replacement work, when necessary, is inconvenient to customers and costly to the City. Similarly, the response time for pipe breaks in rear lot easements is significantly increased and requires additional manpower and cost. As shown in Figure 9-16, there are approximately 162,600 feet (31 miles) of pipe ranging in diameter from 3-inches to 8-inches located in rear lot easements within the City limits. The City owns and maintains 128,400 feet (24 miles) of the rear lot easement pipes, with the remaining pipes owned and maintained by private developments. To decrease the burden of maintaining pipes within rear lot easements, ARCADIS recommends abandoning-in-place the pipes located within the rear lot easements and installing new water mains in the public right-of-way fronting the customer’s homes. Rather than replacing all of the rear lot easement pipes at the same time, ARCADIS recommends implementing a program to incrementally replace the pipes on a yearly basis. Figure 9-17 shows the first few proposed pipe replacement phases.

Section 9
Distribution System Assessment and Recommendations
City of Venice Water Supply Master Plan - Phase 2 5710010
9-29
9.3.3.3. Valve Replacement Due to the age of parts of the system, the City has a number of non-functioning valves that need to be replaced. Fifty-four valves have already been replaced since 2011 and ARCADIS recommends inspecting and replacing the remaining valves incrementally. We propose corresponding the valve replacement with the water main replacement phases to minimize the disturbance to customers.

WATER MASTER PLANPHASE 2
City of Venice Utilities Department200 North Warfield Avenue, Venice, FL 34285
AUGUST 2013FIGURE 9-15
=
=
=
==
³
Legend= Pumps
UT Ground Storage Tanks"³³ Elevated Storage Tank
Existing Pipes
HydrantBuffer (500ft)
Buildings Outside of the Buffer
City Boundary
ARCADIS, INC.
0 1,400 2,800 4,200 5,600700
Feet
WATER MASTER PLAN REPORT
EXISTING DISTRIBUTION SYSTEM FIRE HYDRANT SPACING
Path: G:\GISDATA\Projects\5710\010\MXD\Master Plan Report\9-15 - Hydrant Spacing.mxd
WTP

WATER MASTER PLANPHASE 2
City of Venice Utilities Department200 North Warfield Avenue, Venice, FL 34285
AUGUST 2013FIGURE 9-16
=
=
=
==
³
Legend= Pumps
UT Ground Storage Tanks"³³ Elevated Storage Tank
Rear Easement Pipes
Rear Easement Pipes3-inch or Less
4-inch
6-inch
8-inch
Existing Pipes
ARCADIS, INC.
0 1,100 2,200 3,300 4,400550
Feet
WATER MASTER PLAN REPORT
EXISTING DISTRIBUTION SYSTEM REAR LOT EASEMENT PIPES
Path: G:\GISDATA\Projects\5710\010\MXD\Master Plan Report\9-16 - Rear Easement Pipes2.mxd
WTP
Pipe Diameter Length (ft)3-inch or Less 76,259
4-inch 73,5646-inch 11,5098-inch 1,281

ARCADIS-US, INC.CITY OF VENICE200 N WARFIELD AVE, VENICE, FL 34285
WATER MASTER PLAN PHASE 2
WATER MASTER PLAN REPORT
PIPE REPLACEMENT PHASING
===
³
AUGUST 2013
FIGURE 9-17
0 1,000 2,000500
Feet
WTP
Legend= Pumps"³³ Elevated Storage Tank
Phases
Existing Pipes
City Boundary
7
2 6
34
1 5

Section 9
Distribution System Assessment and Recommendations
City of Venice Water Supply Master Plan - Phase 2 5710010
9-33
9.3.3.4. Interconnections As described in Section 6, the City is currently entertaining the possibility of two potential future interconnections, one with the PR/MRWSA and one with Sarasota County, which would be in addition to the two existing emergency interconnections with the County. As such, each potential interconnection was evaluated for inclusion into the distribution system for emergency situations as part of this Section (refer to Section 7.6 for discussion on interconnections for long-term water supply). With each existing emergency connection supplying water at 60 psi, the hydraulic model indicates that the two existing interconnections are capable of servicing the entire existing City demand should there be a catastrophic failure at the WTP and the Booster Pump Station while maintaining pressures above 50 psi. The two existing interconnects can also supply water to the City’s 2030 demand without either the WTP or the Booster Pump Station; however the minimum system pressure drops to 45 psi on the Island. If either of the two existing pipes crossing the interstate were to break, the existing emergency interconnects would not be able to maintain pressures above 20 psi in the northeastern portion of the distribution system. Figure 9-18 shows the pressure results within the existing distribution system when one of the existing interstate crossings is broken and losing water. A proposed 10-inch interconnection was preliminarily selected for each entity/location due to the desired flow range and pipe velocity constraints. A flow of 0.5 mgd, currently included in the draft Agreement with the County, would result in a flow of 350 gpm over the course of a 24 hour period. A fire flow of 1,500 gpm is a standard rule of thumb requirement for industrial structures. With a 10-inch diameter pipe, these two flow ranges would result in a velocity range of 1.43 to 6.1 feet per second (fps), close to the standard design goal of 2-7 fps for piping systems. PR/MRWSA Interconnection. The proposed 10-inch connection interconnect with PR/MRWSA would be to either the 16-inch PVC water main running along the north right-of-way of Laurel Road east of Knights Trail Road, or to a 12-inch water main that runs north and south along the west right-of-way of Knights Trail Road. This site is located near the northeast corner of the City’s distribution system, east of I-75. An interconnect at this location would aid in providing pressure and flow to the northeast portion of the distribution system during emergency situations. The Venetian Golf and River Club is located in this area as well and has some important industrial users. The benefit of installing the PR/MRWSA Interconnection includes adding a source of water on the east side of interstate I-75 where none currently exists. Additionally, should one of the pipes crossing I-75 break, as shown in Figure 9-18, the PR/MRWSA interconnection is capable of maintaining the system pressures to the distribution system until the pipe break can be repaired (Figure 9-19). However, similar to the existing County interconnections, the PR/MRWSA uses chloramines for disinfection. Without appropriate modifications to individual treatment

Section 9
Distribution System Assessment and Recommendations
City of Venice Water Supply Master Plan - Phase 2 5710010
9-34
systems, chloraminated water can be harmful to kidney dialysis patients and tropical fish owners, and can affect industrial users. When the City uses chloraminated water from the interconnection with the PR/MRWSA, the affected service area must be notified. The combination of chlorinated and chloraminated water can also result in taste and odor problems caused by the formation of di- and tri-chloramines. Localized breakpoint chlorination may also occur, resulting in a loss of disinfectant residual. Use of chloraminated water from PR/MRWSA to supply the City of Venice’s chlorinated system without modifying current disinfection practices would only be acceptable for short-term emergency conditions. Use of the proposed PR/MRWSA interconnection as a routine long-term supply option, however, would require the City to convert to chloramines at the plant or to install chemical injection facilities to chloraminate or for breakpoint chlorination at the interconnection point to allow the City the option of selling surplus water or purchasing water that is compatible with the PR/MRWSA supply. Refer to Section 6 and Section 7.6 for additional discussion on considerations and requirements to use the interconnections as a long-term supply option for the City. ARCADIS recommends installing the proposed PR/MRWSA Interconnection for emergency use only to guard the distribution system against a possible interstate crossing pipe break. The estimated cost of the interconnection is about $500,000. It is important to note that the City already owns the land for the potential interconnection near the intersection of Knights Trail Road and Laurel Road. Sarasota County Interconnection #3. A potential new interconnection with Sarasota County was also evaluated for emergency use. This was assumed to be a 10-inch connection near the intersection of East Venice Avenue and Auburn Road, only 4 miles from one of the existing emergency interconnections with the County. The proposed interconnection has the advantage of connecting to a larger diameter pipe than the existing interconnection (12-inch vs. 8-inch), but otherwise does not add any strategic advantage to the City. An analysis was conducted using the hydraulic model to test the hydraulic benefits of adding the third Sarasota County Interconnection with the assumption that each of the existing and proposed interconnections provided flow at 60 psi. It was determined that the existing interconnections were able to meet the demands within the system in case of a supply disruption and that the addition of the third proposed County interconnection did not add significant benefits with regards to pressure. Since the existing interconnections are rarely used (once since their installation) and it can be similarly assumed that the proposed interconnections will be rarely used as well, ARCADIS does not recommend the installation of the third emergency interconnect with Sarasota County.
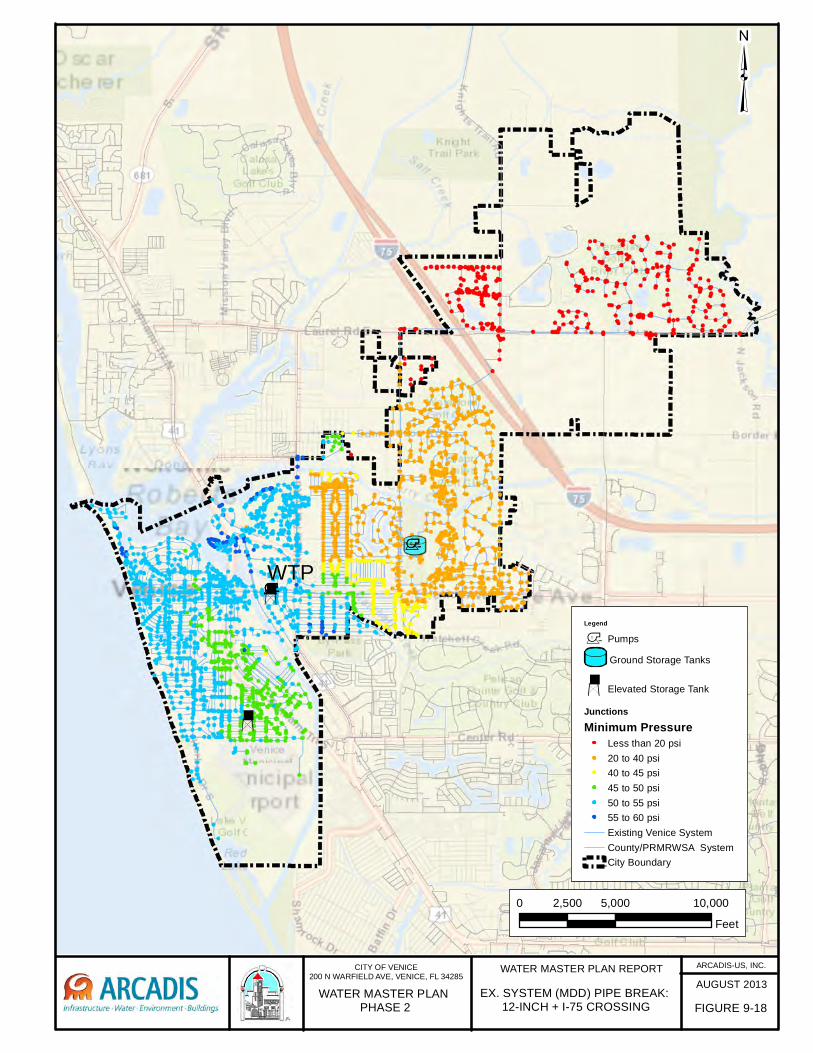
ARCADIS-US, INC.CITY OF VENICE200 N WARFIELD AVE, VENICE, FL 34285
WATER MASTER PLAN PHASE 2
WATER MASTER PLAN REPORT
EX. SYSTEM (MDD) PIPE BREAK: 12-INCH + I-75 CROSSING
=
=
=
==
³
Legend
= Pumps
UT Ground Storage Tanks
"³³ Elevated Storage Tank
JunctionsMinimum Pressure
Less than 20 psi20 to 40 psi40 to 45 psi45 to 50 psi50 to 55 psi55 to 60 psiExisting Venice SystemCounty/PRMRWSA SystemCity Boundary
AUGUST 2013
FIGURE 9-18
0 5,000 10,0002,500
Feet
WTP

ARCADIS-US, INC.CITY OF VENICE200 N WARFIELD AVE, VENICE, FL 34285
WATER MASTER PLAN PHASE 2
WATER MASTER PLAN REPORT
EX. SYSTEM (MDD) PIPE BREAK: 12-INCH + I-75 CROSSING
=
=
=
==
³
Legend
= Pumps
UT Ground Storage Tanks
"³³ Elevated Storage Tank
JunctionsMinimum Pressure
Less than 20 psi20 to 40 psi40 to 45 psi45 to 50 psi50 to 55 psi55 to 60 psiExisting Venice SystemCounty/PRMRWSA SystemCity Boundary
AUGUST 2013
FIGURE 9-19
0 5,000 10,0002,500
Feet
WTP
BOOSTER PUMP STATION STATUS:OFF
WTP STATUS: ON
PIPE BREAK10-INCH
PROPOSED INTERCONNECTWITH PEACE RIVER:
ON

Section 9
Distribution System Assessment and Recommendations
City of Venice Water Supply Master Plan - Phase 2 5710010
9-37
9.3.4. Water Quality Improvements
9.3.4.1. Water Age As with the existing system evaluation presented in Section 9.2.3, the 2015 and 2030 future demand scenarios were analyzed for water age. The same assumptions made during the existing system evaluation were used for the future planning horizons. Figure 9-20 illustrates the results of the water age simulation during the 2030 planning horizon under AADD conditions. Water age can be used as an indirect indicator for distribution system water quality in particular related to disinfectant residuals and disinfectant byproduct (DBP) levels. This analysis highlights the portions of the system which may have long detention times and thus, the potential for low disinfectant residuals. It should be noted that the model has not been calibrated for chlorine residual and, as such, water age results do not necessarily correspond exactly to actual chlorine residual levels. These model results are intended to show the relative difference in water ages to help identify areas where low residual levels may be of concern. The City has not reported any residual problems to date and has met all of the water quality requirements of the Florida Department of Environmental Protection (FDEP). It is not unusual for distribution systems which have groundwater supply and RO treatment to have very stable water quality and low DBP concentrations even with higher water ages. As with the existing system, ARCADIS recommends the City continue to monitor the chlorine residuals throughout the distribution system, especially as it expands into the higher water age areas, and to consider physical or operational improvements to reduce water age and improve water quality should low residuals become an issue. In particular, the northern area of the distribution system is projected to have widespread high water ages. It will be important to monitor this area carefully.

ARCADIS-US, INC.CITY OF VENICE200 N WARFIELD AVE, VENICE, FL 34285
WATER MASTER PLAN PHASE 2
WATER MASTER PLAN REPORT
2030 DISTRIBUTION SYSTEMADD WATER AGE
=
=
=
==
³
Legend
= Pumps
UT Ground Storage Tanks
"³³ Elevated Storage Tank
"³³ Prop. Elevated Storage Tank
2030 Water AgeLess than 1 day1 to 2 days2 to 3 days3 to 4 days4 to 5 days5 to 6 days6 to 7 days7 to 8 days8 to 9 daysGreater than 9 days2030 Pipe DiameterCity BoundaryJPA/ILSBA
AUGUST 2013
FIGURE 9-20
0 5,000 10,0002,500
Feet
WTP
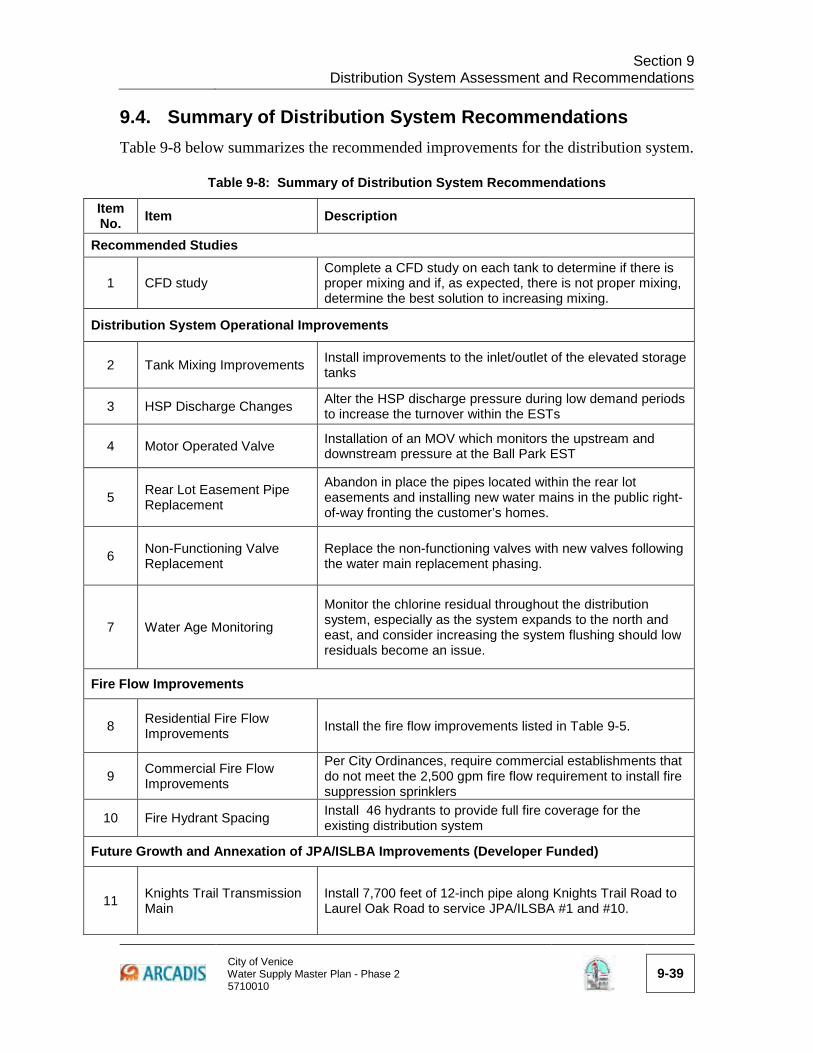
Section 9
Distribution System Assessment and Recommendations
City of Venice Water Supply Master Plan - Phase 2 5710010
9-39
9.4. Summary of Distribution System Recommendations Table 9-8 below summarizes the recommended improvements for the distribution system.
Table 9-8: Summary of Distribution System Recommendations
Item No. Item Description
Recommended Studies
1 CFD study Complete a CFD study on each tank to determine if there is proper mixing and if, as expected, there is not proper mixing, determine the best solution to increasing mixing.
Distribution System Operational Improvements
2 Tank Mixing Improvements Install improvements to the inlet/outlet of the elevated storage tanks
3 HSP Discharge Changes Alter the HSP discharge pressure during low demand periods to increase the turnover within the ESTs
4 Motor Operated Valve Installation of an MOV which monitors the upstream and downstream pressure at the Ball Park EST
5 Rear Lot Easement Pipe Replacement
Abandon in place the pipes located within the rear lot easements and installing new water mains in the public right-of-way fronting the customer’s homes.
6 Non-Functioning Valve Replacement
Replace the non-functioning valves with new valves following the water main replacement phasing.
7 Water Age Monitoring
Monitor the chlorine residual throughout the distribution system, especially as the system expands to the north and east, and consider increasing the system flushing should low residuals become an issue.
Fire Flow Improvements
8 Residential Fire Flow Improvements Install the fire flow improvements listed in Table 9-5.
9 Commercial Fire Flow Improvements
Per City Ordinances, require commercial establishments that do not meet the 2,500 gpm fire flow requirement to install fire suppression sprinklers
10 Fire Hydrant Spacing Install 46 hydrants to provide full fire coverage for the existing distribution system
Future Growth and Annexation of JPA/ISLBA Improvements (Developer Funded)
11 Knights Trail Transmission Main
Install 7,700 feet of 12-inch pipe along Knights Trail Road to Laurel Oak Road to service JPA/ILSBA #1 and #10.

Section 9
Distribution System Assessment and Recommendations
City of Venice Water Supply Master Plan - Phase 2 5710010
9-40
Item No. Item Description
12 Jacaranda Blvd Extension Transmission Main
Install 20,200 feet of 12-inch pipe along western edge of the JPA/ILSBA #3, northern edge of JPA/ILSBA #9A, eastern edge of JPA/ILSBA #2B and southern edge of JPA/ILSBA #2A. The 12-inch water main can follow the proposed Jacaranda Blvd extension up to Laurel Rd and will include crossing under I-75 at or just north of the Jacaranda interchange.
System Reliability and Redundancy Improvements
13 New Elevated Storage Tank
Construct an additional 0.3 MG EST to provide storage in the eastern portion of the City.
14 PR/MRWSA Emergency Interconnection
Install the proposed PR/MRWSA Interconnection to guard the distribution system against a possible interstate crossing pipe break.

City of Venice Water Supply Master Plan - Phase 2 5710010
10-1
10
10. Capital Improvement Plan
10.1. Introduction The City of Venice water supply, treatment, and distribution systems require capital improvements to provide for rehabilitation or replacement of equipment that has or will exceed its useful service life, to address redundancy needs, and to keep pace with population growth and increasingly stringent regulatory requirements. In this Section, recommended improvements identified in Sections 7, 8, and 9 were reviewed and grouped with other related improvements to form several capital improvement projects. This Section discusses the approach used to group and prioritize projects and to develop the 20-Year Capital Improvement Projects (CIP) for the planning period from 2013 through 2033. A recommended list of prioritized projects and a CIP implementation schedule are also presented.
10.2. CIP Prioritization 10.2.1. Prioritization Approach In this Section, various improvements were reviewed to determine their relative importance and priority. Each item was assigned a priority score varying from 1 to 5, based on relative importance and priority. The priority scores represent timeframes for implementation of improvements and studies based on the following specific drivers:
n Ability to meet current and future average and peak capacity requirements n Ability to meet current and future regulatory requirements n Physical and performance conditions n Equipment age n Reliability and frequency of operation and maintenance (O&M) issues n Consequence of equipment failure on plant and distribution system operation
Each priority corresponded to a recommend range of implementation years over the 20-year planning period as shown in Table 10-1. For example, items assigned a priority score of 1 are in need of immediate attention and should be addressed in years 0 to 2 of the 20-year CIP.

Section 10
Capital Improvement Plan
City of Venice Water Supply Master Plan - Phase 2 5710010
10-2
Table 10-1: Recommended CIP Implementation Years by Priority
Priority Score Priority CIP Implementation Years
1 Immediate Yrs 0 - 2
2 High Yrs 2 - 5
3 Medium Yrs 6 - 10
4 Low Yrs 11 - 15
5 Lowest Yrs 16 - 20
Identified improvements were grouped based on location, equipment type, and priority to form several capital projects. Projects were arranged in order of importance based on the priorities assigned to each item, as well as staff preferences. Project durations were estimated based on project experience for similar projects and include all phases from planning and design through construction. Projects were then used to create a 20-year CIP implementation schedule, with costs distributed based on the estimated project durations. When distributing costs over the duration of the project, it is sometimes unrealistic to expect that an equal expenditure of funds will occur in each year. Instead, many projects typically experience an S-curve distribution where there is a “ramp-up” period at the beginning followed by increased expenditures in the middle of the project, and a decrease in expenditures as the project comes to a close. The following assumptions were used in developing the annual expenditures for projects in the CIP: n Planning and design phases together were assumed to account for 15 percent of
the total investment cost of the project. This initial expenditure includes all fees paid to consultants for study and design tasks.
n The length of the planning and design phases was set according to the durations of the project. The cost for these initial phases was distributed evenly across their duration.
n The remaining funds (85 percent) were assumed to be spent during the bid, construction, and start-up phases of the project. The allocation of funds was distributed according to an S-curve. The overall distribution of funds depended on the length of the project.
Table 10-1 shows the estimated percent of project funds spent each year of the project, with the shaded cells representing expenditures during the planning and design phases and unshaded cells showing expenditures during the construction phase. For example, in a 6 year project, 15 percent of the costs are spent on planning and design evenly during the first two years, and the remaining 85 percent is distributed in an S-curve in the final four years.

Section 10
Capital Improvement Plan
City of Venice Water Supply Master Plan - Phase 2 5710010
10-3
Table 10-2: 20-Year CIP Cost Distribution
Project Duration (Years)
Percent of Costs Expended in Year
1 2 3 4 5 6
1 100 – – – – –
2 15 85 – – – –
3 15 50 35 – – –
4 7 8 50 35 – –
5 7 8 25 45 15 –
6 7 8 15 40 20 10
1. Shaded cells indicate planning and design phase expenditures.
10.2.2. Cost Estimates Opinions of probable construction costs were developed for the supply, treatment, distribution system capital projects. Estimated costs were also developed for the recommended studies and reports. Capital project costs include equipment, labor, materials, installation, and incidentals. The compiled capital project costs are consistent with an Association for the Advancement of Cost Engineering (ACEE) Class 4 estimate, where the project definition is between 1% and 15% and engineering design is 1% to 5% complete. The typical purpose of this level of estimate is for conceptual studies or feasibility evaluations. These estimates are primarily stochastic in nature (i.e., they are based on inferred or statistical relationships between similar projects and/or equipment quotes with additional factors applied. Class 4 estimates are generally prepared based on limited information and thus they have a wide accuracy range, typically -15 to +30%. These estimates can successfully be used by owners for budget estimating purposes. Costs are presented in Table 10-3, and items are presented in 2013 dollars. Due to the preliminary nature of the projects at this time, the costs presented include the following provisions: n Installation Factor – Estimated at 20 percent of the equipment cost. n Design/Construction Contingencies – Estimated at 30 percent of the subtotal
capital cost. n Contractor’s Overhead and Profit and Mobilization, Bonds, Insurance – Estimated
at 20 percent of the subtotal construction cost. n Engineering, Administration and Legal Costs – Estimated at 25 percent of the
subtotal construction cost. n Permitting – Estimated at 2 percent of the subtotal construction cost.

Section 10
Capital Improvement Plan
City of Venice Water Supply Master Plan - Phase 2 5710010
10-4
10.2.3. Recommended Studies In order to provide additional information necessary for shaping future decisions with respect to water supply, concentrate management options, regulatory requirements, and future treatment/infrastructure/equipment projects, the following reports, studies, tests, and inspections are recommended over the course of the planning period:
1. Wellfield Optimization Study – Evaluate strategies to optimize the rotation and operation of the City’s existing brackish water supply wells.
2. Storage Tank Mixing Evaluation – Complete a CFD study for each storage tank to determine if there is proper mixing and to determine improvements to increase tank mixing.
3. Initial Capacity Analysis Report (CAR) – FAC requires that an annual CAR be submitted to FDEP when the max day demand surpasses the 75% threshold of plant capacity (currently projected to occur in 2013).
4. Upper Floridan Aquifer Supply and Well Location Study – Investigate potential water quality, permeate recovery, and permitting feasibility of installing one or more supply wells in the Upper FAS. Investigate and identify potential supply well locations.
5. Cast Iron Pipe Investigation – Investigate the condition of the cast iron pipe within the City's distribution system with respect to tuberculation, scaling, corrosion, and pressure loss.
6. RO System Treatment Recovery and Concentrate Management Study – Conduct a study to evaluate the feasibility of increasing the WTP RO recovery to 75%. Investigate potential increases to NPDES-permitted concentrate discharge quantities/concentrations and investigate additional discharge methods. Study to be submitted to SWFWMD by Jan 15, 2018, per permit requirements.
7. RO Pilot Study – Conduct a pilot study to confirm the most effective equipment, chemicals, implementation requirements and actual recoveries that can be obtained with 2nd stage RO skids. The pilot study should run under various conditions over a minimum six month period.
8. Clearwell Investigation – Evaluate the concrete spalling, minor cracking, and coating system failure observed at the clearwell structure to ensure continued structural integrity.
9. Thermographic Study and Insulation Test – Confirm the condition of the existing switchgear by performing thermograph imaging of electrical connections.

Section 10
Capital Improvement Plan
City of Venice Water Supply Master Plan - Phase 2 5710010
10-5
10. Coordination and Arc Flash Study – Conduct a breaker coordination study that includes fault current analysis and breaker trip curve analysis. Conduct an arc flash study to define approach boundaries around energized equipment and PPE requirements.
11. Switchgear Breaker Calibration – Perform calibration of switchgear breaker, as recommended by manufacturer every five years.
12. Generator and Fuel Tank Evaluation – Confirm the state of existing generator via condition or “stress” testing and evaluate the condition of the diesel fuel and fuel tank system.
13. Sand Separator Inspection – Confirm the internal condition and suitability of the Phase I and II sand separators for continued long-term use.
10.2.4. Prioritization Results Table 10-3 presents a summary of the studies and future improvements discussed and recommended with respect to the City’s water supply, treatment, and distribution system infrastructure. The table also includes prioritization scores and planning-level costs. ARCADIS grouped recommended improvements into projects for inclusion into the City’s Capital Improvement Plan (CIP) for the 20-year master planning period. Costs were developed for 63 identified studies, tests, and capital improvements, which together total approximately $43.3M (in 2013 dollars). The individual improvements were grouped into a total of 7 reports/studies, 3 tests/inspections, and 21 capital improvement projects based on project type, location, and priority. The highest priority projects recommended for immediate implementation include: (1) facility odor control system upgrade, (2) distribution system fire flow and hydrant improvements, (3) high priority chemical and concentrate system upgrades, (4) PR/MRWSA emergency interconnect installation, (5) RO chemical systems upgrade, (6) miscellaneous valve, flow meter, and tank mixing upgrades, and (7) plant security upgrades. Table 10-3 provides a summary of the recommended project groupings and prioritization. The total estimated project costs are summarized by general project category and shown in Figure 10-1. Although the recommended distribution system improvements only make up 17% of the total number of improvements (11 of 63), distribution improvements make up a majority of the costs at 50%. This is not surprising given that the rear lot easement pipe replacement project alone is approximately $10M, or about 23% of the total estimated project costs (in 2013 dollars) for the entire 20-year CIP. It should be noted that the other two distribution system projects, the Knights Trail transmission main installation and the Jacaranda Blvd extension installation also total approximately $7M; however, while these projects are presented in the CIP, they are currently anticipated to be developer funded.

Table 10-3Summary of Recommended Project Groupings and Prioritization
Item No. Item Category Type Description PriorityInitial
CIP Impl.Yrs.
Total EstimatedProject Cost
($2013)
R-001 Wellfield Optimization Study Supply Report/Study Evaluate strategies to optimize rotation and operation of existing wells. 1 0 - 2 50,000$
R-002 Storage Tank Mixing Evaluation Distribution Report/StudyComplete CFD study for each storage tank to determine if there is proper mixing and determine improvements to increase mixing.
1 0 - 2 10,000$
R-003 Initial Capacity Analysis Report Supply Report/StudyDevelop CAR for FDEP when max day demand surpasses 75% threshold of plant capacity. Annual CAR update required.
1 0 - 2 20,000$
R-004 Upper Floridan Aquifer Supply and Well Location Study Supply Report/Study
Investigate potential water quality, permeate recovery, and permitting feasibility of installing one or more supply wells in the Upper FAS. Investigate and identify potential supply well locations.
1 2 - 5 75,000$
R-005 Cast Iron Pipe Investigation Distribution Report/Study
Investigate the condition of cast iron pipe throughout the City's distribution system with respect to tuberculation, scaling, corrosion, and pressure loss.
2 2 - 5 100,000$
R-006 RO System Treatment Recovery and Concentrate Management Study Treatment Report/Study
Conduct study to evaluate feasibility of increasing RO recovery to 75%. Investigate potential to increase NPDES-permitted concentrate discharge quantities/ concentrations and investigate additional discharge methods. To be submitted to SWFWMD by Jan 15, 2018, per permit requirements.
2 2 - 5 150,000$
R-007 RO Pilot Study Treatment Report/Study
Conduct pilot study to confirm the most effective equipment, chemicals, implementation requirements, and recoveries with 2nd stage RO skids.
3 6-10 200,000$
605,000$
Test/Inspection Priority Score 1
T-001 Clearwell Investigation Treatment Test/Inspection Evaluate concrete spalling and coating system condition - inside and outside. 1 0 - 2 50,000$
50,000$
Test/Inspection Priority Score 1
T-002 Thermographic Study and Insulation Test Treatment Test/InspectionConfirm condition of existing switchgear by performing thermograph imaging of electrical connections.
1 0 - 2 50,000$
T-003 Coordination and Arc Flash Study Treatment Test/Inspection
Conduct breaker coordination study that includes fault current analysis and breaker trip curve analysis. Conduct arc flash study to define approach boundaries around energized equipment and PPE requirements.
1 0 - 2 50,000$
T-004 Switchgear Breaker Calibration Treatment Test/Inspection Calibration recommended every five years. 1 0 - 2 15,000$
T-005 Generator and Fuel Tank Evaluation Treatment Test/Inspection Confirm state of existing generator via condition or “stress” testing. Also evaluate fuel system. 1 0 - 2 25,000$
140,000$
Test/Inspection Priority Score 2
T-006 Sand Separator Inspection Treatment Test/Inspection Confirm condition and suitability of Phase I and II sand separators for continued long-term use. 2 2 - 5 20,000$
20,000$
Project Priority Score 1
M-001 Degasifier and Blower Replacement Treatment Renewal/Replacement
Replace existing degasifier and blower with latest technology. 1 0 - 2 650,000$
M-002 Redundant Degasifier and Blower Installation Treatment Renewal/
ReplacementAdd 2nd degasifier and blower for system redundancy. 1 0 - 2 650,000$
M-003 Two-stage Scrubber System Installation Treatment Renewal/Replacement
Replace existing odor control scrubber with two-stage system. Add recirculation pump and controls.
1 0 - 2 1,500,000$
M-004 Degas Chemical Storage and Dosing System Installation Treatment Renewal/
Replacement
Install permanent chemical storage and dosing system for proprietary chemical used to treat degasifier off-gas.
2 2 - 5 275,000$
M-005 Degasifier/Scrubber Cleaning Pump System Installation Treatment Renewal/
Replacement
Install degasifier/scrubber cleaning pump system to make system cleaning simpler and more operator friendly.
1 0 - 2 175,000$
3,250,000$
Project Priority Score 1
F-001 Residential Fire Flow Improvements Distribution Distribution - Fire Flow
Install fire flow improvements listed in Table 1 of TM #9 (multi-year implementation). 1 0 - 2 2,660,000$
F-002 Fire Hydrant Installation Distribution Distribution - Fire Flow
Install 46 hydrants to provide full fire coverage for the existing distribution system (multi-year implementation).
1 0 - 2 340,000$
3,000,000$
Project Priority Score 1
M-006 Sodium Hydroxide System Replacement Treatment Renewal/Replacement
Replace sodium hydroxide metering pumps, day tank, and bulk storage tank. 1 0 - 2 300,000$
M-007 Corrosion Inhibitor System Replacement Treatment Renewal/Replacement
Replace corrosion inhibitor metering pumps and day tank. 1 0 - 2 120,000$
M-008 Concentrate Compressed Air System Replacement Treatment Renewal/
ReplacementReplace concentrate treatment compressed air system. 1 0 - 2 40,000$
460,000$
Project Priority Score 1
M-009 PR/MRWSA Emergency Interconnection Installation Distribution Distribution -
System Reliability
Install an interconnection with PR/MRWSA to protect distribution system from possible interstate crossing pipe break.
1 0 - 2 500,000$
500,000$
Project 1 - Odor Control System Upgrade
Project 2 - Distribution System Fire Flow and Hydrant Improvements
Project 3 - High Priority Chemical and Concentrate System Upgrades
Project 4 - PR/MRWSA Emergency Interconnection Installation
Subtotal - Project 3
Subtotal - Project 2
Recommended Reports and Studies
Subtotal - Project 4
Recommended Tests and Inspections
Subtotal - Recommended Reports and Studies
Subtotal - Test/Inspection 1
Subtotal - Test/Inspection 2
Subtotal - Test/Inspection 3
Test/Inspection 1 - Clearwell Inspection
Test/Inspection 2 - Electrical, Generator, and Fuel Tank Testing
Test/Inspection 3 - Sand Separator Inspection
Recommended Capital Improvement Projects
Subtotal - Project 5
City of Venice20-Year Water Master Plan - Phase IIFINAL Report
1 Revised: 7/30/13

Table 10-3Summary of Recommended Project Groupings and Prioritization
Item No. Item Category Type Description PriorityInitial
CIP Impl.Yrs.
Total EstimatedProject Cost
($2013) Project Priority Score 1
M-010 Antiscalant Metering Pump Upgrade Treatment Renewal/Replacement
Install redundant metering pumps to Phase I and II antiscalant systems for increased system reliability.
1 0 - 2 70,000$
M-011 Phase II Antiscalant System Replacement Treatment Renewal/Replacement
Replace phase II antiscalant metering pumps and day tank. 2 2 - 5 120,000$
M-012 Phase II RO Clean-in-place System Replacement Treatment Renewal/
Replacement Replace phase II clean-in-place system. 2 2 - 5 120,000$
310,000$
Project Priority Score 1
M-013 Concentrate Flow Meter Replacement Treatment Renewal/Replacement
Replace existing concentrate magnetic flow meter. 2 2 - 5 100,000$
M-014 Phase II Raw Water Pressure Relief Valve Redesign/replacement Treatment Renewal/
Replacement
Redesign and replace pressure relief valve on raw water line at RO Phase II with correct valve system.
1 0 - 2 80,000$
M-015 HSP Surge Relief Valve Replacement Treatment Renewal/Replacement
Replace surge relief valve at high service pump station. 1 0 - 2 60,000$
M-016 Tank Mixing Improvements Distribution Renewal/Replacement
Install improvements to the inlet/outlet of the elevated storage tanks. 1 0 - 2 25,000$
M-017 EST Piping Modifications Distribution Renewal/Replacement
Redesign and replacement of EST influent and effluent piping and installation of a FCV which controls the upstream and downstream pressure at the Ball Park EST.
1 0 - 2 250,000$
515,000$
Project Priority Score 1
S-001 Plant Security Upgrade Treatment Plant Security
Install security upgrades, including exterior lighting, perimeter fencing, security entry ways, security cameras, and any outstanding items from 2002-2003 VA Study.
2 2 - 5 500,000$
F-003 Fire Alarm System Installation Treatment Plant Security Install fire alarm systems for Buildings A and B and Maintenance Building. 1 0 - 2 120,000$
620,000$
Project Priority Score 2
I-001 Telemetry System Treatment Renewal/Replacement
Install new radio system, assess via radio field studies. 2 2 - 5 550,000$
I-002 Field Instrument Replacement Treatment Renewal/Replacement Evaluate/replace faulty field instruments. 1 0 - 2 190,000$
740,000$
Project Priority Score 2
G-001 Install Supply Well Supply Supply
Abandon existing Well 7-W and install replacement supply well. Will allow for additional well rotation and increased raw water quality. Location and depth are dependent on the results of the Upper Floridan Aquifer Supply Study. Cost assumes installation of Upper Floridan well.
2 2 - 5 1,600,000$
G-002 Install Supply Well Supply Supply
Install additional supply well currently permitted in existing WUP. Will allow for additional well rotation and increased raw water quality. Location and depth are dependent on the results of the Upper Floridan Aquifer Supply Study. Cost assumes installation of Upper Floridan well.
2 2 - 5 1,500,000$
3,100,000$
Project Priority Score 2
P-001 Rear Lot Easement Pipe Replacement Distribution Distribution - Operational
Abandon in place the pipes located within rear lot easements and install new water mains in the public right-of-way in front of the customer’s homes (multi-year implementation).
2 2 - 5 9,900,000$
9,900,000$
Project Priority Score 2
M-018 Elevated Storage Tank Installation Distribution Distribution - System Reliability
Construct 0.3 MG EST to provide storage in the eastern portion of the City. 2 2 - 5 1,000,000$
1,000,000$
Project Priority Score 2
P-002 Knights Trail Transmission Main Installation Distribution Distribution - Annexation
Install 7,700 feet of 12-inch pipe along Knights Trail Road to Laurel Oak Road to service JPA/ILSBA #1 and #10. Project to be funded by developer.
2 2 - 5 1,700,000$
1,700,000$
Project Priority Score 2
P-003 Jacaranda Blvd Extension Installation Distribution Distribution - Annexation
Install 20,200 feet of 12-inch transmission main along western edge of the JPA/ILSBA #3, northern edge of JPA/ILSBA #9A, eastern edge of JPA/ILSBA #2B and southern edge of JPA/ILSBA #2A. The 12-inch water main is to follow the proposed Jacaranda Blvd extension up to Laurel Rd and will include crossing under I-75 at or just north of the Jacaranda interchange. Project to be funded by developer.
2 2 - 5 5,100,000$
5,100,000$
Project Priority Score 2
M-019CO2 System Control Panel and Booster Pump Replacement
Treatment Renewal/Replacement
Current system lacks automatic control, and has issues with valves and meters. Replace panel and booster pump.
2 2 - 5 175,000$
M-020 CO2 Tank and Piping Replacement Treatment Renewal/Replacement
Replace CO2 tank and ancillary piping. 3 6 - 10 250,000$
425,000$
Project Priority Score 2
M-021 High Service Pump Renewal/replacement Treatment Renewal/Replacement
Renew/replace three existing high service pumps (cost assumes replacement). 3 6 - 10 450,000$
E-001 High Service Pump VFD Replacement Treatment Renewal/Replacement
Replace VFDs for high service pumps - experiencing harmonics issues. 2 2 - 5 310,000$
760,000$
Project 7 - Plant Security Upgrades
Project 8 - Communication and I&C Upgrades
Project 10 - Rear Lot Easement Pipe Replacement
Project 11 - Elevated Storage Tank Installation
Project 12 - Knights Trail Transmission Main (Developer Funded)
Project 5 - RO Chemical Systems Upgrade
Project 14 - CO2 System Replacement
Subtotal - Project 9
Subtotal - Project 15
Subtotal - Project 7
Subtotal - Project 8
Subtotal - Project 13
Subtotal - Project 6
Subtotal - Project 1
Subtotal - Project 12
Subtotal - Project 11
Project 13 - Jacaranda Blvd Extension Transmission Main (Developer Funded)
Subtotal - Project 14
Subtotal - Project 10
Project 6 - Miscellaneous Valve, Flow Meter, and Tank Mixing Upgrades
Project 9 - Supply Well Installation
Project 15 - High Service Pump and VFD Rehabilitation and Replacement
City of Venice20-Year Water Master Plan - Phase IIFINAL Report
2 Revised: 7/30/13

Table 10-3Summary of Recommended Project Groupings and Prioritization
Item No. Item Category Type Description PriorityInitial
CIP Impl.Yrs.
Total EstimatedProject Cost
($2013) Project Priority Score 2
G-003 Concentrate Management Improvements Treatment Capacity
Design and construct concentrate management improvements. Assumes installation of new on-site deep injection well for concentrate disposal.Actual costs may be lower depending on recommended concentrate management option in Treatment Efficiency and Concentrate Management Study (R-005).
2 6 - 10 4,300,000$
4,300,000$
Project Priority Score 3
E-002 RO Feed Pump VFD Replacement Treatment Renewal/Replacement Replace VFDs for phase I RO feed pumps. 2 2 - 5 312,500$
312,500$
Project Priority Score 3
M-022 Sand Separator Replacement Treatment Renewal/Replacement
Replace existing phase I and II sand separators, depending on results of sand separator inspection (T-006).
3 6 - 10 200,000$
200,000$
Project Priority Score 4
M-023 Sodium Hypochlorite Bulk Storage Tank Replacement Treatment Renewal/
Replacement
Replace sodium hypochlorite bulk storage tanks with smaller tanks. Oversized for 12% hypo currently used.
4 11-15 350,000$
M-024 Corrosion Inhibitor Bulk Storage Tank Replacement Treatment Renewal/
Replacement Replace corrosion inhibitor bulk storage tank. 4 11 - 15 180,000$
M-025 Sodium Hypochlorite Pump Replacement Treatment Renewal/Replacement
Replace sodium hypo metering pumps and transfer pumps. 4 11 - 15 120,000$
M-026 Sodium Hydroxide Pump Replacement Treatment Renewal/Replacement Replace sodium hydroxide metering pumps. 4 11 - 15 100,000$
M-027 Corrosion Inhibitor Pump Replacement Treatment Renewal/Replacement
Replace corrosion inhibitor metering pumps and transfer pump. 4 11 - 15 120,000$
M-028 Phase I and II Antiscalant Pump Replacement Treatment Renewal/
ReplacementReplace phase I and II antiscalant metering pumps. 4 11 - 15 140,000$
1,010,000$
Project Priority Score 4
E-003 Generator Replacement Treatment Renewal/Replacement
Replace existing generator with generator that is adequately sized for RO upgrade. 4 11 - 15 700,000$
E-004 Phase I MCC Replacement Treatment Renewal/Replacement Replace phase I MCCs. 4 11 - 15 140,000$
E-005 Phase II MCC Replacement Treatment Renewal/Replacement Replace phase II MCCs. 4 11 - 15 220,000$
E-006 Switchgear Replacement Treatment Renewal/Replacement Replace switchgear equipment. 4 11 - 15 200,000$
1,260,000$
Project Priority Score 5
M-029 RO System 2nd Stage Upgrade Supply Capacity
Install 2nd stage RO skids and ancillary equipment – increase recovery to 75%. Increase recovery and production within existing WUP permit.
5 16 - 20 3,000,000$
M-030 Install High Service Pump Treatment Capacity Install additional HSP and VFD, required for increase in plant capacity. 5 16 - 20 250,000$
3,250,000$
42,528,000$
Project 18 - Sand Separator Replacement
Project 19 - Long Term Chemical Systems Replacement
Project 20 - Plant Electrical Equipment Replacement
Project 21 - RO System Second Stage Treatment Upgrade
Subtotal - Project 19
Total 20-Year CIP Costs ($2013)
Subtotal - Project 20
Subtotal - Project 21
Subtotal - Project 16
Subtotal - Project 18
Subtotal - Project 17
Project 16 - Concentrate Management Improvements
Project 17 - RO Feed Pump and VFD Rehabilitation and Replacement
City of Venice20-Year Water Master Plan - Phase IIFINAL Report
3 Revised: 7/30/13

Section 10
Capital Improvement Plan
City of Venice Water Supply Master Plan - Phase 2 5710010
10-9
Figure 10-1: Total Costs by General Project Category
The total estimated project costs were also grouped by discipline and are shown in Figure 10-2. As seen, the largest portion of the costs required is for civil/pipeline improvements. While there were only 5 improvements categorized in this group, or less than 8% of the total individual improvements, the costs made up 46% of the total CIP. The next largest category of improvements was process mechanical-related improvements associated mostly with upgrades or replacement of treatment equipment required for the reverse osmosis water treatment plant (RO WTP). These improvements made up 51% of the total number of improvements and 27% of the total CIP costs.
Figure 10-2: Total Costs by Improvement Discipline
Report/Study1%
Test/Inspection1%
Hydrogeo17%
Process Mechanical
27%
Electrical5%I&C
3%
Civil/Pipeline46%
Supply15%
Treatment34%
Distribution51%

Section 10
Capital Improvement Plan
City of Venice Water Supply Master Plan - Phase 2 5710010
10-10
Figure 10-3 presents the total estimated project costs broken out by project type. The 11 renewal/replacement projects identified made up the largest type of project by number (at 35%), but made up 23% of the total CIP cost. The Rear Lot Easement Pipe Replacement project (classified as a Distribution – Operational project) made up 23% of the total CIP costs by itself. Projects increasing production capacity and providing for future distribution system annexation account for 17% and 16% of the total costs, respectively.
Figure 10-3: Total Costs by Project Type
Table 10-4 summarizes reports/studies, tests/inspections, and major capital improvement projects by priority. Although thirteen of the “projects” (or 42%) were assigned a priority score of 1 (highest priority), these projects only make up 28% of the total estimated project costs. Twelve projects were assigned a priority score of 2 with the remaining six projects are divided between the lowest three priorities.
Table 10-4: Recommended Projects by Priority
Priority Score Priority
CIP Implementation
Years No. of
Projects Percent
of Projects
Total Costs of Projects
Percent of All Project
Costs 1 Immediate Yrs 0 - 2 13 42% $12,175,000 28% 2 High Yrs 2 - 5 12 39% $24,270,000 56% 3 Medium Yrs 6 - 10 3 10% $1,100,000 3% 4 Low Yrs 11 - 15 2 6% $2,470,000 6% 5 Lowest Yrs 16 - 20 1 3% $3,250,000 7%
Figures 10-4 and 10-5 show the spatial location of CIP projects located at the RO WTP and throughout the distribution system, respectively.
Report/Study1%
Test/Inspection1%
Supply7%
Capacity18%
Renewal and Replacement
22%Plant Security
Upgrades1%
Distribution -Fire Flow
7%
Distribution -System
Reliability4%
Distribution -Operational
23%
Distribution -Annexation
16%

WATER MATER PLANPHASE 2
City of Venice Utilities Department200 North Warfield Avenue, Venice, FL 34285
FIGURE 10-4
T2
T1
T3P18
P2
P15
P14
P8
P4 P6, P9,P17, P21
T3P18
P6, P7, P17, P20
P19
³
CITY OF VENICE CAPITAL IMPROVMENTS PLAN
SUPPLY AND TREATMENT IMPROVEMENTS
Path: G:\GISDATA\Projects\5710\010\MXD\Master Plan Report\10-4 - Treatment & Supply Projects.mxd
0 80 16040Feet
AUGUST 2013
LEGEND
Tests/Inspections and Projects
T1 Clearwell InvestigationT2 Electrical, Generator, and Fuel Tank TestingT3 Sand Separator InspectionP2 Odor Control System UpgradeP4 High Priority Chemical and Concentrate System UpgradesP6 RO Chemical Systems UpgradeP7 Miscellaneous Valve, Flow Meter, and Tank Mixing UpgradesP8 Plant Security UpgradesP9 Communication and I&C UpgradesP14 CO2 System ReplacementP15 High Service Pump and VFD Rehabilitation and ReplacementP17 RO Feed Pump and VFD Rehabilitation and ReplacementP18 Sand Separator ReplacementP19 Long Term Chemical Systems ReplacementP20 Plant Electrical Equipment ReplacementP21 RO System 2nd Stage Upgrade
Projects Not Shown
P1 Supply Well InstallationP16 Concentrate Management Improvements
High ServicePump Station
ElevatedStorage
Tank
Clearwell
Admin.Bldg.
MechanicShop
CO2System
OdorControlSystem
Phase IRO System
Phase IIRO System
Sand Separator
Sand Separator

ARCADIS-US, INC.CITY OF VENICE200 N WARFIELD AVE, VENICE, FL 34285
WATER MASTER PLAN PHASE 2
WATER MASTER PLAN REPORT
PROPOSED DISTRIBUTION ANDEXPANSION IMPROVEMENTS
=
=
=
==
³
Legend
= Pumps
UT Ground Storage Tanks
"³³ Elevated Storage Tank
"³³ Prop. Elevated Storage Tank
Transmission Main ImprovementsFF ImprovementsRear Easement Pipes2030 Pipe DiameterCity BoundaryJPA/ILSBA
AUGUST 2013
FIGURE 10-5
0 5,000 10,0002,500
Feet
WTP

Section 10
Capital Improvement Plan
City of Venice Water Supply Master Plan - Phase 2 5710010
10-13
10.3. 20-Year CIP Schedule The 20-year CIP schedule is shown in Table 10-5. The total estimated capital costs over the 20-year planning period are about $43.3M. The CIP schedule includes provisions for annual general renewal and replacement needs not identified as specific projects in the Master Plan and yearly updates to the FDEP-required Capacity Analysis Report, totaling approximately $4.4M over the planning period. The total estimated capital costs of recommended projects and recurring annual costs is about $47.6M (2013 dollars). Figure 10-6 shows the annual and cumulative capital expenditures over the 20-year planning period from 2010 through 2030. The costs are relatively evenly distributed, with the largest total expenditures planned for fiscal years (FY) 2016/2017 through 2019/2020. In these years, the largest portions of capital expenditures occur for the Supply Well Installations, the Jacaranda Blvd. Extension Transmission Main, and the Concentrate Management Improvements. It should be noted that the Jacaranda Blvd. Extension and Knights Trail Transmission Main projects are anticipated to be developer funder projects. It should also be noted that the CIP does not include any pipe replacement costs associated with the findings of the cast iron pipe condition study.
Figure 10-6: Annual and Cumulative CIP Capital Expenditures
$0
$5
$10
$15
$20
$25
$30
$35
$40
$45
$50
Capi
tal E
xpen
ditu
res
($M
illio
n )
Annual Cost
Cummulative Annual Cost

FY 13/14 FY 14/15 FY 15/16 FY 16/17 FY 17/18 FY 18/19 FY 19/20 FY 20/21 FY 21/22 FY 22/23 FY 23/24 FY's 24 to 29 FY's 29 to 340 1 2 3 4 5 6 7 8 9 10 11 ‐ 15 16 ‐ 20
1 Project 1 ‐ Odor Control System Upgrade 1 2 3,250,000$ 488,000$ 2,762,000$ 2 Project 2 ‐ Distribution System Fire Flow and Hydrant Improvements 1 6 3,000,000$ 500,000$ 500,000$ 500,000$ 500,000$ 500,000$ 500,000$ 3 Project 3 ‐ High Priority Chemical and Concentrate System Upgrades 1 2 460,000$ 69,000$ 391,000$ 4 Project 4 ‐ PR/MRWSA Emergency Interconnection Installation 1 3 500,000$ 75,000$ 250,000$ 175,000$ 5 Project 5 ‐ RO Chemical Systems Upgrade 1 2 310,000$ 47,000$ 263,000$ 6 Project 6 ‐ Miscellaneous Valve, Flow Meter, and Tank Mixing Upgrades 1 1 515,000$ 515,000$ 7 Project 7 ‐ Plant Security Upgrades 1 2 620,000$ 93,000$ 527,000$ 8 Project 8 ‐ Communication and I&C Upgrades 2 2 740,000$ 111,000$ 629,000$ 9 Project 9 ‐ Supply Well Installation 2 3 3,100,000$ 465,000$ 1,550,000$ 1,085,000$ 10 Project 10 ‐ Rear Lot Easement Pipe Replacement 2 15 9,900,000$ 660,000$ 660,000$ 660,000$ 660,000$ 660,000$ 660,000$ 660,000$ 660,000$ 660,000$ 3,300,000$ 660,000$ 11 Project 11 ‐ Elevated Storage Tank Installation 2 3 1,000,000$ 150,000$ 500,000$ 350,000$ 12 Project 12 ‐ Knights Trail Transmission Main (Developer Funded) 2 3 1,700,000$ 255,000$ 850,000$ 595,000$ 13 Project 13 ‐ Jacaranda Blvd Extension Transmission Main (Developer Funded) 2 3 5,100,000$ 765,000$ 2,550,000$ 1,785,000$ 14 Project 14 ‐ CO2 System Replacement 2 2 425,000$ 64,000$ 361,000$ 15 Project 15 ‐ High Service Pump and VFD Rehabilitation and Replacement 2 2 760,000$ 114,000$ 646,000$ 16 Project 16 ‐ Concentrate Management Improvements 2 3 4,300,000$ 645,000$ 2,150,000$ 1,505,000$ 17 Project 17 ‐ RO Phase I VFD Rehabilitation and Replacement 3 2 312,500$ 46,875$ 265,625$ 18 Project 18 ‐ Sand Separator Replacement 3 1 200,000$ 200,000$ 19 Project 19 ‐ Long Term Chemical Systems Replacement 4 2 1,010,000$ 1,010,000$ 20 Project 20 ‐ Plant Electrical Equipment Replacement 4 3 1,260,000$ 1,260,000$ 21 Project 21 ‐ RO System Second Stage Treatment Upgrade 5 3 3,250,000$ 3,250,000$
22 Report/Study 1 ‐ Wellfield Optimization Study 1 1 50,000$ 50,000$ 23 Report/Study 2 ‐ Storage Tank Mixing Evaluation 1 1 10,000$ 10,000$ 24 Report/Study 3 ‐ Initial Capacity Analysis Report 1 1 20,000$ 20,000$ 25 Report/Study 4 ‐ Upper Floridan Aquifer Supply and Well Location Study 1 1 75,000$ 75,000$ 26 Report/Study 5 ‐ Cast Iron Pipe Investigation 2 1 100,000$ 100,000$
27 Report/Study 6 ‐ RO System Treatment Recovery and Concentrate Management Study 2 1 150,000$ 150,000$ 28 Report/Study 7 ‐ RO Pilot Study 3 1 200,000$ 200,000$
29 Test/Inspection 1 ‐ Clearwell Inspection 1 1 50,000$ 50,000$ 30 Test/Inspection 2 ‐ Electrical, Generator, and Fuel Tank Testing 1 1 140,000$ 140,000$ 31 Test/Inspection 3 ‐ Sand Separator Inspection 2 1 20,000$ 20,000$
32 Annual Capacity Analysis Report Updates NA 19 NA 7,500$ 7,500$ 7,500$ 7,500$ 7,500$ 7,500$ 7,500$ 7,500$ 7,500$ 7,500$ 37,500$ 37,500$ 33 Annual General Equipment Renewal and Replace Costs NA 20 NA 200,000$ 200,000$ 200,000$ 200,000$ 200,000$ 200,000$ 200,000$ 200,000$ 200,000$ 200,000$ 200,000$ 1,000,000$ 1,000,000$
CAPITAL PROJECT SUBTOTALS $41,713,000 $1,050,000 $3,262,000 $3,204,000 $4,778,000 $4,800,000 $4,741,000 $5,111,875 $3,305,625 $660,000 $660,000 $660,000 $5,570,000 $3,910,000
REPORTS/STUDIES SUBTOTALS $605,000 $155,000 $0 $0 $250,000 $0 $0 $200,000 $0 $0 $0 $0 $0 $0
TESTS/INSPECTIONS SUBTOTALS $210,000 $50,000 $140,000 $0 $20,000 $0 $0 $0 $0 $0 $0 $0 $0 $0
GENERAL RENEWAL/ANNUAL COSTS SUBTOTALS NA $200,000 $207,500 $207,500 $207,500 $207,500 $207,500 $207,500 $207,500 $207,500 $207,500 $207,500 $1,037,500 $1,037,500
TOTALCOSTS $42,528,000 $1,455,000 $3,609,500 $3,411,500 $5,255,500 $5,007,500 $4,948,500 $5,519,375 $3,513,125 $867,500 $867,500 $867,500 $6,607,500 $4,947,500
General Renewal and Repair/Annual Costs
Venice, FLCITY OF VENICE WATER SUPPLY MASTER PLAN
Table 10‐5: 20‐Year CIP Implementation Schedule
Item Item Description PriorityProject Duration(years)
Total Estimated Project Cost(2013 dollars)
Year
Capital Projects
Reports/Studies
Tests/Inspections

Appendix A
Model Development and Calibration Report (ARCADIS, July 2012)

City of Venice 200 N. Warfield Ave. Venice, FL 34285
Water Master Plan Phase 2 – Model Development & Calibration Report July 2012 DRAFT
Report Prepared By:
ARCADIS, Inc. 14025 Riveredge Dr, Suite 600 Tampa, FL
05710010.0000

Table of Contents
City of Venice Water Master Plan Phase 2 – Calibration Report 5710010
i
Contents
1. Introduction 1-1
2. Model Development 2-1 2.1. Distribution Mains ......................................................................................................... 2-1 2.2. Junctions ....................................................................................................................... 2-2 2.3. Tanks ............................................................................................................................ 2-2 2.4. Pumps ........................................................................................................................... 2-2 2.5. Service Areas ................................................................................................................ 2-3 2.6. Existing Demands ......................................................................................................... 2-3
2.6.1. Demand Allocation ........................................................................................ 2-3 2.6.2. Maximum Day Peaking Factors .................................................................... 2-5
3. Calibration Data and Results 3-1 3.1. Calibration Plan ............................................................................................................. 3-1
3.1.1. Calibration Period .......................................................................................... 3-1 3.1.2. Field Data Collection ..................................................................................... 3-1 3.1.3. Pressure Logger ............................................................................................ 3-1 3.1.4. Operational /SCADA Data Collection ............................................................ 3-2 3.1.5. Atypical System Conditions ........................................................................... 3-3
3.2. Model Input Data ........................................................................................................... 3-3 3.2.1. Diurnal Demand Patterns .............................................................................. 3-3 3.2.2. Roughness Coefficients ................................................................................ 3-3
3.3. Calibration Results ........................................................................................................ 3-3 3.3.1. Calibration Goals ........................................................................................... 3-3 3.3.2. Pressure Logger Results ............................................................................... 3-3 3.3.3. Pump Flow Results ....................................................................................... 3-4 3.3.4. Tank Levels ................................................................................................... 3-5

Table of Contents
City of Venice Water Master Plan Phase 2 – Calibration Report 5710010
ii
List of Tables
Table 2-1: Potable Water Distribution Pipe ................................................................................. 2-1 Table 2-2: Summary of Billing Data ............................................................................................. 2-3 Table 3-1: Summary of Pressure Logger Data ............................................................................ 3-2 Table 3-2: Peaking Factors Used in Calibration .......................................................................... 3-2 Table 3-3: Calibration Goals ........................................................................................................ 3-3
List of Figures
Figure 2-1: Thiessen Polygon ...................................................................................................... 2-4 Figure 3-1: Pressure Logger Locations ....................................................................................... 3-2 Figure 3-2: Residential & Commercial Demand Pattern ............................................................. 3-2 Figure 3-3: Pump Flow Calibration Results ................................................................................. 3-5 Figure 3-4: Elevated Storage Tanks Calibration Results ............................................................ 3-6
Appendices
A. Model Setup Information B. Calibration Data Log Sheets C. Calibration Result Figures

Acronyms
City of Venice Water Master Plan Phase 2 – Calibration Report 5710010
iii
Acronyms Used in the Report
AWWA American Water Works Association City City of Venice EPS Extended Period Simulationgal gallon GIS Geographic Information Systems hp Horsepower HSP High Service Pumps MG Million Gallons MGD million gallons per dayNED National Elevation Datasetpsi Pounds per square inch USGS United States Geological SurveyVFD Variable Frequency DriveWTP Water Treatment Plant

City of Venice Water Master Plan Phase 2 – Calibration Report 5710010
1-1
1. Introduction
The City of Venice (City) Public Utilities Department hired ARCADIS, Inc to complete an update to its Water System Master Plan. The Utilities Department is responsible for the administration, operation and maintenance of the City-owned potable water, reclaimed water and wastewater systems. The Utilities Department develops and periodically updates master planning documents that describe the features of each system, establish future system projections, and review the infrastructure necessary to support the City’s current and future needs. As part of this Master Plan, the City has requested that an accurate and functional hydraulic model, based on the City’s GIS (geographic information system), be developed and calibrated to match the system conditions.
This report describes the development and calibration of the hydraulic model prepared as part of the Water Master Plan. The model was developed according to industry best practices and calibrated to the available data based on recommended guidelines found in AWWA Manual M32 for smaller systems. The calibration process provided many insights into the operation of the City of Venice’s distribution system. Overall, the calibration resulted in a model that will serve to address the goals of the Water Master Plan, and enable the City to effectively evaluate distribution system operation and improvements in the future.
.

City of Venice Water Master Plan Phase 2 – Calibration Report 5710010
2-1
2
2. Model Development
A hydraulic model is a tool used by water professionals to simulate distribution systems. The model incorporates physical information about the distribution pipes, valves, fittings, connections, pumps and storage tanks; and is used to better understand a specific system in its entirety or in parts. Models are used to simulate existing conditions to solve immediate problems as well as simulate future scenarios to help decision makers plan for the future. A new hydraulic model was created in the Innovyze® InfoWater software for the City of Venice. This model will be used to analyze the existing and future distribution system for deficiencies in order to make recommendations to address those deficiencies and future improvements.
Record drawings and operator/staff input were used as a basis for the tanks and pumps in the model, providing pump curves, levels and elevations. The additional data sources used for specific model components are outlined in the following sections.
2.1. Distribution Mains The City’s updated GIS (2011), including improvements completed as a part of this project such as correcting pipe crossings, gaps, and missing data, was used as the basis for the distribution pipes and network. Data imported from the City’s GIS included: the pipe coordinates, pipe diameter, pipe ID, description, material and length. A total of 185 miles of water distribution mains are represented in the model, and are summarized by diameter in Table 2-1. The model contains 7,374 links representing these pipes.
Table 2-1: Potable Water Distribution Pipe Pipe Diameter
(inches) TOTAL (feet)
1 2,600 2 78,500 3 44,900 4 128,000 6 300,300 8 227,300
10 38,700 12 142,400 14 1,300 16 16,400 20 700 24 140
TOTAL (feet) 981,200
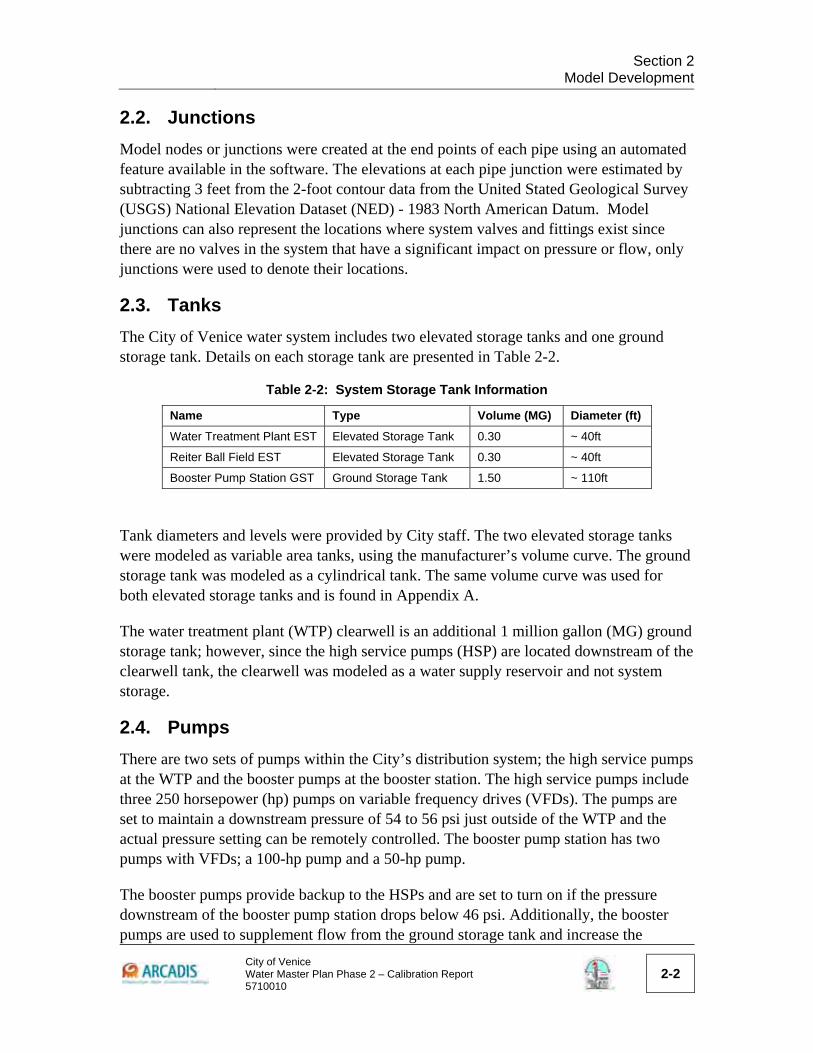
Section 2
Model Development
City of Venice Water Master Plan Phase 2 – Calibration Report 5710010
2-2
2.2. Junctions Model nodes or junctions were created at the end points of each pipe using an automated feature available in the software. The elevations at each pipe junction were estimated by subtracting 3 feet from the 2-foot contour data from the United Stated Geological Survey (USGS) National Elevation Dataset (NED) - 1983 North American Datum. Model junctions can also represent the locations where system valves and fittings exist since there are no valves in the system that have a significant impact on pressure or flow, only junctions were used to denote their locations.
2.3. Tanks The City of Venice water system includes two elevated storage tanks and one ground storage tank. Details on each storage tank are presented in Table 2-2.
Table 2-2: System Storage Tank Information
Name Type Volume (MG) Diameter (ft) Water Treatment Plant EST Elevated Storage Tank 0.30 ~ 40ft
Reiter Ball Field EST Elevated Storage Tank 0.30 ~ 40ft
Booster Pump Station GST Ground Storage Tank 1.50 ~ 110ft
Tank diameters and levels were provided by City staff. The two elevated storage tanks were modeled as variable area tanks, using the manufacturer’s volume curve. The ground storage tank was modeled as a cylindrical tank. The same volume curve was used for both elevated storage tanks and is found in Appendix A.
The water treatment plant (WTP) clearwell is an additional 1 million gallon (MG) ground storage tank; however, since the high service pumps (HSP) are located downstream of the clearwell tank, the clearwell was modeled as a water supply reservoir and not system storage.
2.4. Pumps There are two sets of pumps within the City’s distribution system; the high service pumps at the WTP and the booster pumps at the booster station. The high service pumps include three 250 horsepower (hp) pumps on variable frequency drives (VFDs). The pumps are set to maintain a downstream pressure of 54 to 56 psi just outside of the WTP and the actual pressure setting can be remotely controlled. The booster pump station has two pumps with VFDs; a 100-hp pump and a 50-hp pump.
The booster pumps provide backup to the HSPs and are set to turn on if the pressure downstream of the booster pump station drops below 46 psi. Additionally, the booster pumps are used to supplement flow from the ground storage tank and increase the

Section 2
Model Development
City of Venice Water Master Plan Phase 2 – Calibration Report 5710010
2-3
pressure within the distribution system when the level in the clearwell drops to a specified threshold. This allows the clearwell to refill at a faster rate and prevents the levels from dropping too low. Copies of the Manufacturer’s pump curves are located in Appendix A.
2.5. Service Areas The City’s entire distribution system is one pressure zone and there is only one service area for the entire City.
2.6. Existing Demands 2.6.1. Demand Allocation A detailed review of the City’s existing water usage and customer accounts was performed before the demands were allocated. Customer billing data was obtained from the City’s billing records for all potable water accounts from 2005 to November 2010. The City bills its customers for water usage on a monthly basis and has over 12,000 billing meters. The billing data is summarized by customer type in Table 2-3. The maximum month water demand based on billed usage during 2010 was 2.44 million gallons per day (MGD). The customer billing data is based on monthly readings; however, the monthly readings are not on the same day for every meter. Thus, the dates comprising the maximum month for the WTP flows could be slightly different than the dates comprising the maximum month for the billing records. As such the maximum month for the billing records is slightly higher than the WTP production flows presented in Technical Memorandum #6, Existing Demands and Table 2-4 in this report. .
Table 2-3: Summary of Billing Data
Account Type Number of Accounts Maximum Month Demand 2010 (MGD)
Residential 10,489 1.01
Multi-Unit 482 0.68
Commercial 876 0.58
Irrigation 290 0.17
Total 12,137 2.44
To spatially orient the billing data for inclusion in the model, a geocoding process was used to locate the billing accounts (addresses) on a GIS map of the distribution system. The automated geocoding function within ArcMap was used to match each address with a location in the City, using the Sarasota County property appraiser’s GIS parcel data files for address information. The initial automated geocoding attempt matched 94% of the addresses in the billing account database. The remaining addresses were manually matched to a location in the model. Once the meters were geocoded, demand polygons,

Section 2
Model Development
City of Venice Water Master Plan Phase 2 – Calibration Report 5710010
2-4
called Thiessen polygons, were created around each model node, thereby grouping customer accounts so that their water usage could be assigned to the correct node in the model.
An automated tool within the modeling software was used initially to establish the Theissen polygons which were developed using the following method. Lines were first created that bisect the distance between adjacent model nodes. The lines were then extended until they intersected with either another bisecting line or an outer boundary limit. This resulted in the creation of polygon areas surrounding each model node similar to what is shown in Figure 2-1. Customer accounts that fell within each polygon area were then assigned to the model node located at the centroid of the polygon. Model nodes with no customer accounts within their respective polygons were assigned zero demand.
Figure 2-1: Thiessen Polygon

Section 2
Model Development
City of Venice Water Master Plan Phase 2 – Calibration Report 5710010
2-5
All residential customer demand was assigned to category “Demand1” in the model. Commercial customer demand was assigned to category “Demand2” and Irrigation demand was assigned to category “Demand3”.
As described in Technical Memorandum #1, Updated Population and Demand Projections, the City has a significant population of seasonal residents (snow birds). As a result, a number of residences are vacant throughout the year. Since the vacant residences cause the annual average use per residence to be reduced and not representative of an average day use, the billing records for the maximum month in 2010 (March 2010) were used to created the base model demands. By using the maximum month billing records, the number of vacant homes is reduced and the demand distribution across the system is better represented. Historically, February and March are the maximum demand months for the City. Since the calibration data collection period was in February, it was anticipated that the March 2010 demands would correlate well for calibration.
2.6.2. Maximum Day Peaking Factors As described in Technical Memorandum #6, Existing Demand, and shown in Table 2-4 below, the average peaking factor derived from comparing maximum day to maximum month demands is 1.3. This peaking factor was used to adjust the March 2010 demands in the model to a maximum day demand.
Table 2-4: Historic Finished Water Production Flows
Year AAD
(mgd) MMD (mgd)
MDD (mgd) MMD PF MDD PF MDD/MMD
2002 2.26 2.71 3.42 1.2 1.5 1.3
2003 2.19 2.65 3.24 1.2 1.5 1.2
2004 2.26 2.64 3.19 1.2 1.4 1.2
2005 2.29 2.82 3.34 1.2 1.5 1.2
2006 2.27 2.61 3.54 1.1 1.6 1.4
2007 2.13 2.41 3.24 1.1 1.5 1.3
2008 2.03 2.51 3.59 1.2 1.8 1.4
2009 2.03 2.47 3.13 1.2 1.5 1.3
2010 2.02 2.37 3.04 1.2 1.5 1.3
2011 1.96 2.40 3.08 1.2 1.5 1.3
Average 2.14 2.56 3.28 1.2 1.5 1.3
City of Venice Water Master Plan Phase 2 – Calibration Report 5710010
3-1
3
3. Calibration Data and Results
3.1. Calibration Plan After a hydraulic model is constructed, it is necessary to calibrate the model so it accurately reflects distribution system performance. System pressure, pump flow and tank level data was collected both in the field and from operator input for use during calibration of the model. The calibration process involved the adjustment of factors such as elevations, pipe roughness, pump curves, etc so that the model results better matched the monitoring data collected during the calibration period.
3.1.1. Calibration Period
The calibration data was collected from February 15 to February 29, 2012. This period was selected as a representative time frame for higher demands than average demands.
3.1.2. Field Data Collection
System pressure was monitored at nine locations for 14 days during the calibration period. The locations where field data was collected are as indicated in Figure 3-1. Eight of those locations were monitored using pressure loggers purchased or borrowed by the City. The ninth location was at the WTP and is monitored continuously by the City and used to control the HSPs. Pressures were recorded at five minute intervals. The City was responsible for installing and monitoring the pressure loggers and for recording the time and pressure readings. The City provided all pressure data in a Microsoft Excel document format from each pressure logger at the end of the calibration period.
3.1.3. Pressure Logger A summary of the pressure logger data results is provided in Table 3-1. The operational data collected in addition to the pressure loggers for the calibration day, February 23, 2012, is located in Appendix B. The operational data included the WTP and booster station flows, tank level and system pressure directly adjacent to the WTP.

Section 3
Calibration Data and Results
City of Venice Water Master Plan Phase 2 – Calibration Report 5710010
3-2
Table 3-1: Summary of Pressure Logger Data
Logger Location Pressure (psig)
Minimum Maximum Average
1 188 Savona Way 39.5 60.7 51.8
2 109 Bluegrass 44.4 60.9 51.9
3 4112 Arbor View Ln 47.5 64 55.1
4 1340 Featherbed Ln 41.8 59 53.5
5 Live Oak St and Pineland Ave 49.2 58 54.5
6 660 White Pine Tree Rd 41.7 58.3 53.1
7 220 W/ Miami Ave 50.4 60.3 55.7
8 411 Baynard St 46.4 56 52.2
WTP* Downstream of the HSPs 55 55 55
* Data provided hourly by WTP operators.
3.1.4. Operational /SCADA Data Collection
The following information was also provided by the City in one hour increments for the purpose of model calibration.
Clearwell levels Elevated tank levels (both tanks) Ground storage tank level System Pressure downstream of the
WTP Water Treatment Plant Flow
High service pump operational status (on/off)
Booster pump status (on/off) Booster pump station flow Booster Pump Control Logic /
Rationale per hour
A data input log sheet provided by the City can be found in Appendix B.

Water Master Plan
City of Venice Utilities Department200 North Warfiled Avenue, Venice, FL 34285
JULY 2012FIGURE #3-1
=
=
=
==
^
^
^
^
^
^
^
^#2
#3
#1
#4
#5
#6
#7
#8
³
Legend
^ pressure_loggers
= ex-pump 7-24-12
UT Tanks
Pipes
ARCADIS, INC.
0 2,400 4,800 7,200 9,6001,200Feet
CITY OF VENICE POTABLE WATER DISTRIBUTION SYSTEM
PRESSURE LOGGER LOCATIONS
Path: G:\Projects\5710 - Venice, City of\010 - Water Master Plan - Phase II\3 - Model Development and Calibration\3.8 Calibration\Figure 3-1 Pressure Logger locations.mxd

Section 3
Calibration Data and Results
City of Venice Water Master Plan Phase 2 – Calibration Report 5710010
3-3
Additionally, all system control data and/or notes from the operators during each shift were obtained. System control data included pump set-points for when the pumps are turned on/off and any other operational changes that are either built into the facility controls or were performed manually by operators based on system observations.
3.1.5. Atypical System Conditions
The City was asked to avoid (if possible) any actions or events that affected typical distribution system pressures and flows during the calibration period. If any of the above mentioned items were to occur, the City was also asked to note the time, date, location and description of the event. Some actions or events that could impact distribution hydraulics include such things as:
Hydrant Flushing
Automatic flushing for water quality
Line breaks
Fires
Emergency interconnection use
Power failure affecting pumps
SCADA or pressure logger failure
Line replacement/maintenance
Connection of new services
Note: No actions or events that could have affected typical distribution system pressures and flows were reported. No system hydrant flushing occurred during the calibration period.
3.2. Model Input Data After a hydraulic model is constructed, it is necessary to calibrate that model so that it accurately reflects distribution system performance. Pressure, pump flow and tank level data was collected for use during calibration of the model. The calibration process involves the adjustment of factors such as elevation, pipe roughness, pump curves, etc. within the model so that the model results better match the monitoring data during a given period of time.
3.2.1. Diurnal Demand Patterns To adjust the base demands in the model to match the hourly demands during the calibration period, diurnal demand patterns and peaking factors were used. The patterns are a series of factors that are multiplied by the base demand at each time increment (one hour, in this case) of the model simulation. Diurnal demand patterns are calculated using a mass balance approach for each pressure zone such that the volume of water entering the system can be accounted for as either water that is stored or demanded by the customers for each increment throughout the day.

Section 3
Calibration Data and Results
City of Venice Water Master Plan Phase 2 – Calibration Report 5710010
3-2
Water into System - Water stored = Water used
(from pumps) (in tanks) (demand) The demand multiplier for each time increment is the ratio of water used during the time increment to the average usage for all time increments. The base demands must also be scaled to reflect the actual usage during the calibration day with a peaking factor. The peaking factor is the ratio of average demand during the calibration time to base model demand. Therefore the demand calculated by the model at each node is:
Demand for each time increment
= Base demand
x Peaking factor
x Diurnal multiplier for the time increment
A global peaking factor can be applied to the model to adjust all of the demands within the model. This adjustment accounts for the difference in the March 2010 demands used to create the model and the actual February 2012 demands affecting the calibration day. The final global peaking factor used for calibration is listed in Table 3-2 and the patterns are as described in Technical Memorandum #6 included for each service type. The residential demand pattern is shown in Figure 3-2.
Table 3-2: Peaking Factors Used for Calibration Day
Service Area Calibration Day Peaking Factor
Calibration 2-23-12 1.15
Figure 3-2: Residential & Commercial Demand Pattern
0.00
0.20
0.40
0.60
0.80
1.00
1.20
1.40
1.60
1.80
0:00
2:00
4:00
6:00
8:00
10:00
12:00
14:00
16:00
18:00
20:00
22:00
0:00
Demand M
ultiplier
Hour
23‐Feb‐12

Section 3
Calibration Data and Results
City of Venice Water Master Plan Phase 2 – Calibration Report 5710010
3-3
3.2.2. Roughness Coefficients Roughness coefficients, or C-factors, are used to model the resistance of the pipe to flow. As the C-factor increases, the headloss incurred by the pipe due to friction resistance decreases. Typical distribution system C-factors range from 140 for new pipe to 50 or lower for old, unlined pipe. Studies have found that the C-factor is generally correlated with the age of the pipe and the pipe material.
As the calibration proceeded, the C-factors were adjusted so that the model results could better match the tank levels, pump flows, and pressures recorded during the monitoring period. Initial model C-factors were chosen to correlate to the general age of the pipe. The system was divided into three location areas based on average pipe age. The areas and C-factors used were as follows:
The Island (C-factor = 90), The central portion (C-factor = 125) The northeast portion (C-factor = 140)
3.3. Calibration Results 3.3.1. Calibration Goals The calibration of a model involves adjustments to physical model parameters in an iterative way until the model results closely match the monitoring data for tank levels, pumped flows, and system pressures.
There are no strict guidelines for calibration performance in terms of goodness-of-fit between modeled and measured data. The level of calibration required generally depends on the specific system being modeled and the intended use of the model. Table 3-3 summarizes the calibration goals outlined in the AWWA Manual M32 for master planning purposes in smaller systems with 24-in pipes and smaller.
Table 3-3: Calibration Goals
Model Element Calibration Goal
Hydraulic Grade Lines Within 5 to 10 feet (2.2 to 4.3 psi)
Pump Flows Within 10 to 20 %
Tank Level Within 3 to 6 feet
3.3.2. Pressure Logger Results The calibration results for the system pressure loggers all fell within the recommended guidelines of 5 to 10 feet (2.2 to 4.3 psi). In fact the highest average difference in

Section 3
Calibration Data and Results
City of Venice Water Master Plan Phase 2 – Calibration Report 5710010
3-4
hydraulic grade line of all of the pressure loggers is 3.7 feet. Table 3-4 shows a summary of the results. Figures of the results for each pressure logger location can be found in Appendix C.
Table 3-4: Pressure Logger Calibration Results
Pressure Logger
Average Field
Results
Average Model
Results
% Difference
#1 51.82 52.96 2%
#2 51.78 53.02 2%
#3 55.39 55.7 1%
#4 53.78 54.95 2%
#5 54.28 54.21 0%
#6 53.02 54.00 2%
#7 55.34 53.74 3%
#8 51.60 53.15 3%
3.3.3. Pump Flow Results The high service pump flow results matched the field data well during periods when the booster station was not operational; on average the modeled pump flows were within 10% of the field data, which is within the target calibration goal range. One drawback of the modeling software is that it does not allow multiple pumps/VFD’s controlled by downstream pressure to be operated simultaneously in the same pressure zone. Therefore, the booster pumps were modeled as constant speed pumps. This resulted in less desirable match of pump flows from the booster pumps. On average the HSP pump flows were within 14% and the booster pump flows were within 23% over the entire simulation period. Figure 3-3 shows the calibration results of the pump flows.
During existing and future system analysis, it is not anticipated that the booster pumps will be used. The main purpose of the booster pumps, other than very low pressure scenarios, is to supplement the HSPs to allow the clearwell to fill. Since the clearwell is modeled as a reservoir in the model and by definition has infinite volume available, there will be no need for the booster station to turn on to fill the clearwell. Therefore, calibration of the booster pump is less critical than matching the flow from the HSPs.

Section 3
Calibration Data and Results
City of Venice Water Master Plan Phase 2 – Calibration Report 5710010
3-5
Figure 3-3: Pump Flow Calibration Results
3.3.4. Tank Levels The average tank level difference between the model results and the field data is excellent for the ground storage tank at 1.18 feet. The average tank level difference between the model results and the field data for the two elevated storage tanks was less accurate but still within the desirable range and resulted in a difference of 1.40 feet for the WTP tank and 3.08 feet for the Ball Park tank. When examining the level pattern for each tank; however, the model results do not show close correlation. Figure 3-4 shows the results of the elevated and ground storage tanks level calibration. Several factors are believed to be contributing to this lack of correlation in tank levels. These include: the potential for closed or partially closed valves between the WTP pumps and the elevated tanks, and the inability of the model to replicate variations in the booster station flows. Additionally, record drawings showing the tank dimensions and pipe layouts were unavailable to verify the data provided by the City. Since the modeled pressure loggers match the field data well, and the booster station cannot be modeled with VFD controls, the difference in tank elevations, though not ideal, is sufficient to move forward for master planning purposes.
0
500
1000
1500
2000
2500
3000
0.0 4.0 8.0 12.0 16.0 20.0 24.0
Flow
(gpm
)
Time (hrs)
Field Data - WTPModel Data - WTPField Data - BSPModel Data - BSP
.

Section 3
Calibration Data and Results
City of Venice Water Master Plan Phase 2 – Calibration Report 5710010
3-6
Figure 3-4: Elevated Storage Tanks Calibration Results
The model has been calibrated to the best available information and is sufficient for use for master planning efforts. The calibrated model will be used to model the existing system and analyze the distribution system for deficiencies. Then the future demands and joint planning areas referenced in Technical Memorandum #1, Population and Demand Projections, will be input in the model and improvements will be identified for the distribution system to meet projected future demands throughout the master planning period.
0
5
10
15
20
25
30
35
0.0
1.0
2.0
3.0
4.0
5.0
6.0
7.0
8.0
9.0
10.0
11.0
12.0
13.0
14.0
15.0
16.0
17.0
18.0
19.0
20.0
21.0
22.0
23.0
24.0
Tank
Lev
el (f
t)
WTP EST Field Tank Level WTP EST Model Tank Level Ball Park EST Field Tank LevelBall Park EST Model Tank Level GST Field Tank Level GST Model Tank Level
.

APPENDIX A – MODEL SETUP INFORMATION

Savage
Text Box
TANK VOLUME CURVE

Savage
Text Box
HIGH SERVICE PUMP CURVE

Savage
Text Box
BOOSTER PUMP #1 CURVE

Savage
Text Box
BOOSTER PUMP #2 CURVE

APPENDIX B – DATA LOG SHEET 2‐23‐12

City of Venice
Water Master Plan ‐ Phase 2
Calibration Data Round 2
2/15/2012
Clearwell Level
WTP Elevated
Tank Level
Ball Park Elevated
Tank Level GST Level System Pressure WTP Flow HSP #1 Status HSP #2 Status HSP #3 Status
Booster Pump
#1 Status
Booster Pump
#2 Status Control Logic
(ft) (ft) (ft) (ft) (psi) (gpm) (on/off) (on/off) (on/off)
(on/off)
Flow (gpm)
(on/off)
Flow (gpm) (Reason the WTP and/or the Booster Station was turned on/off)
0:00 7.39 32.5 26.5 10.4 56 1171 on off off off off 55 KK
1:00 8.12 32.4 26.7 10.4 55 1171 on off off off off 56 KK
2:00 9.19 31.8 26.2 10.5 55 983 on off off off off 56 KK
3:00 10.21 31.6 25.9 10.5 55 948 on off off off off Filling ET KK
4:00 10.37 31.1 25.7 11.8 56 3019 on on off off off Filling ET KK
5:00 10.1 30.9 25.5 13.8 56 2801 on on off off off Stop Filling KK
6:00 10.62 31.8 25.9 14.5 56 2946 off on on off off Filling ET KK
7:00 10.23 30.3 24.4 15.9 56 3061 off on on off off FillingET EB
8:00 9.78 29 22.4 17 56 2532 off on on off off stop filling 7:45am EB
9:00 9.53 27.4 20.3 17 56 2971 off on on off off EB
10:00 9.25 26.6 19.6 17.1 56 2781 off on on off off EB
11:00 8.99 26.4 19 17.1 56 2721 off on on off off EB
12:00 8.8 26.4 19.4 17.2 56 2614 off on on off off EB
13:00 8.69 26.8 19.5 17.2 56 2580 off on on off off EB
14:00 8.67 27.3 19.9 17.2 56 2442 off on on off off BMT
15:00 8.69 27.7 20.5 17.2 56 2114 off on on off off EB
16:00 8.74 28.1 21 17.3 56 2092 off on on off off DMF
17:00 8.63 27.6 20.9 17.9 56 3525 off on on off off filling ET 4:40 pm rrh
18:00 7.82 26.8 20.8 19.4 56 3406 off on on off off DMF
19:00 7.11 26.3 20.4 21 56 3508 off on on off off DMF
20:00 6.78 27.1 21 21.8 56 2255 off on on off off stopped filling 7.30pm rrh
21:00 6.96 28.2 21.8 21.9 56 2711 off on on off off rrh
22:00 7.2 29.3 22.8 21.9 56 1783 off on on off rw rrh
23:00 30.6 24.3 21.9 56 1689 off on on off off tjo
HSP = High Service Pump Additional Notes:
EST = Elevated Storage Tank
GST = Ground Storage Tank
DATE:
Operator's Initials/Comments

APPENDIX C – CALIBRATION RESULTS

60 00
Calibration Data Pressure #1
50.00
60.00
40.00
)
30.00
sure
(psi
)
.
20.00
Pres
s
0 00
10.00 Model Pressure Reading
Pressure Logger Reading
0.000.0 4.0 8.0 12.0 16.0 20.0 24.0
Time (hrs)

60
Calibration Data Pressure #2
50
60
40
)
30
sure
(psi
)
.
20
Pres
s
0
10Pressure Logger Reading
Model Pressure Reading
00.0 4.0 8.0 12.0 16.0 20.0 24.0
Time (hrs)

60
Calibration Data Pressure #3
50
60
40
)
30
sure
(psi
)
.
20
Pres
s
0
10Pressure Logger Reading
Model Pressure Reading
00.0 4.0 8.0 12.0 16.0 20.0 24.0
Time (hrs)

60
Calibration Data Pressure #4
50
60
40
)
30
sure
(psi
)
.
20
Pres
s
0
10Pressure Logger Reading
Model Pressure Reading
00.0 4.0 8.0 12.0 16.0 20.0 24.0
Time (hrs)

60
Calibration Data Pressure #5
50
60
40
)
30
sure
(psi
)
.
20
Pres
s
0
10Pressure Logger Reading
Model Pressure Reading
00.0 4.0 8.0 12.0 16.0 20.0 24.0
Time (hrs)

60
Calibration Data Pressure #6
50
60
40
)
30
sure
(psi
)
.
20
Pres
s
0
10Pressure Logger Reading
Model Pressure Reading
00.0 4.0 8.0 12.0 16.0 20.0 24.0
Time (hrs)
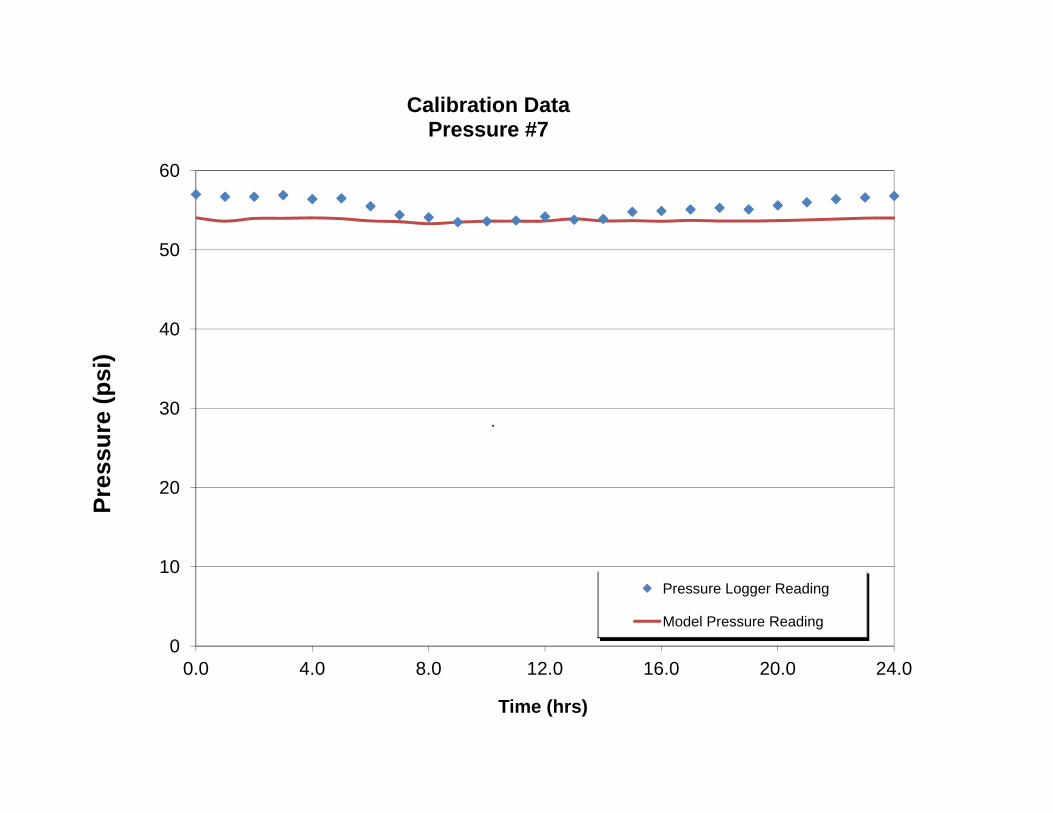
60
Calibration Data Pressure #7
50
60
40
)
30
sure
(psi
)
.
20
Pres
s
0
10Pressure Logger Reading
Model Pressure Reading
00.0 4.0 8.0 12.0 16.0 20.0 24.0
Time (hrs)

60
Calibration Data Pressure #8
50
60
40
)
30
sure
(psi
)
.
20
Pres
s
0
10Pressure Logger Reading
Model Pressure Reading
00.0 4.0 8.0 12.0 16.0 20.0 24.0
Time (hrs)

1500
2000
2500
3000
ow (g
pm)
Calibration Data WTP & BPS Flows
Field Data - WTPModel Data - WTPField Data - BSPModel Data - BSP
.
0
500
1000
0.0 4.0 8.0 12.0 16.0 20.0 24.0
Flo
Time (hrs)

1500
2000
2500
3000
ow (g
pm)
Calibration Data WTP Flows
Field Data
Model Data
.
0
500
1000
0.0 4.0 8.0 12.0 16.0 20.0 24.0
Flo
Time (hrs)

1 800
Calibration Data BSP-1 Flows
1,600
1,800Field Data
Model Data
1,200
1,400
)
800
1,000
ow (g
pm)
.
400
600Flo
0
200
00.0 4.0 8.0 12.0 16.0 20.0 24.0
Time (hrs)

1
Calibration Data BSP-2 Flows
1
1
1
1
1
1
)
0
1
1
ow (g
pm)
.
0
0
0
Flo
0
0
0Field Data
Model Data
00.0 4.0 8.0 12.0 16.0 20.0 24.0
Time (hrs)
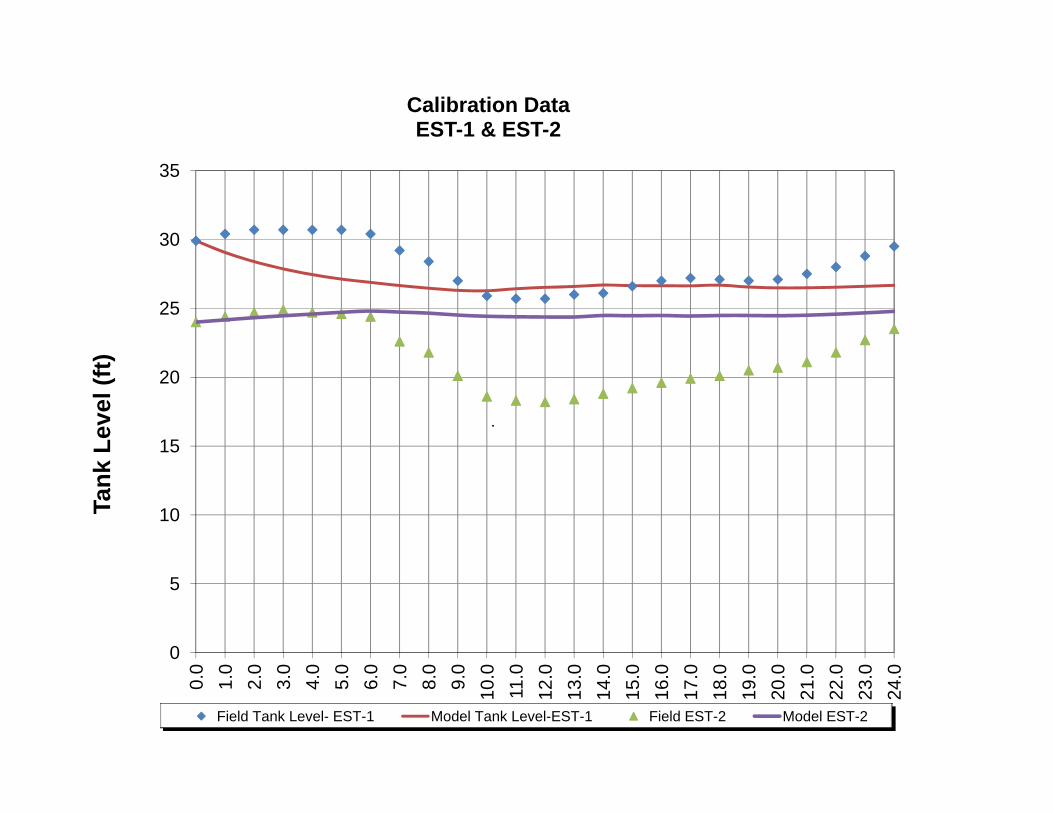
35
Calibration Data EST-1 & EST-2
30
35
25
)
15
20
Leve
l (ft)
.
10
15
Tank
5
0
0.0
1.0
2.0
3.0
4.0
5.0
6.0
7.0
8.0
9.0
10.0
11.0
12.0
13.0
14.0
15.0
16.0
17.0
18.0
19.0
20.0
21.0
22.0
23.0
24.0
Field Tank Level- EST-1 Model Tank Level-EST-1 Field EST-2 Model EST-2

35
Calibration Data EST-1
30
35
25
)
15
20
Leve
l (ft)
..
10Tank
0
5Field Tank Level
Model Tank Level
00.0 4.0 8.0 12.0 16.0 20.0 24.0
Time (hrs)
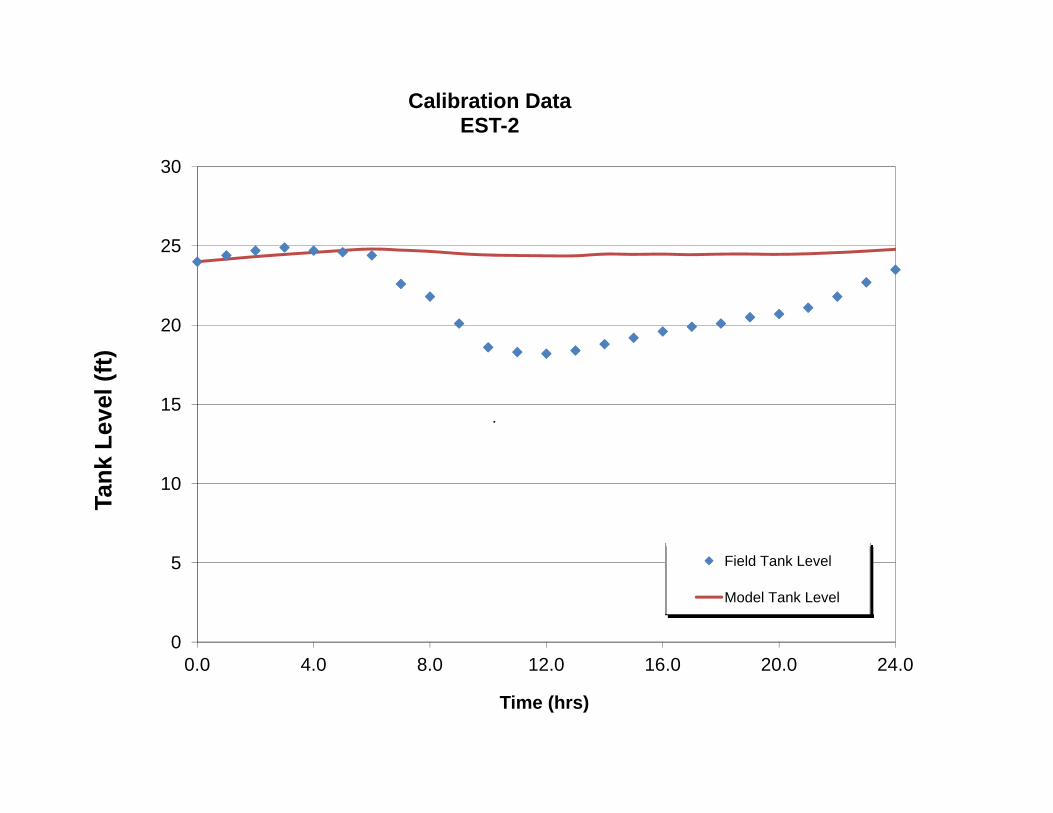
30
Calibration Data EST-2
25
30
20
)
15
Leve
l (ft)
.
10
Tank
0
5 Field Tank Level
Model Tank Level
00.0 4.0 8.0 12.0 16.0 20.0 24.0
Time (hrs)

25
Calibration Data GST
20
25
15
20
)
10
15
sure
(psi
)
.
5
10
Pres
s
0
5Field Tank Level
Model Tank Level
00.0 4.0 8.0 12.0 16.0 20.0 24.0
Time (hrs)

Appendix B
City of Venice Water Use Permit


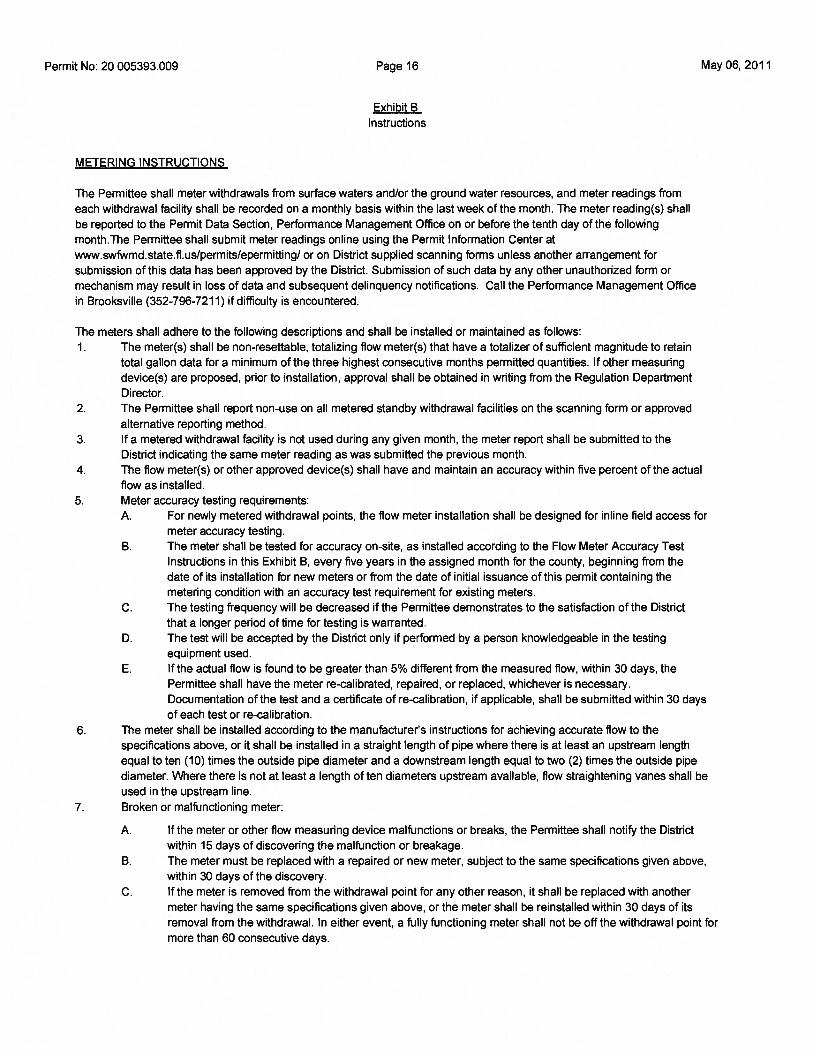


Appendix C
2011 FDEP SWAPP Results

SWAP: Assessment for VENICE WATER DEPT CITY OF
http://www.dep.state.fl.us/swapp/DisplayPWS.asp?pws_id=6581901&odate=01-OCT-11[7/27/2012 9:08:33 AM]
DEP Home About DEP Programs Contact Site Map Search
SWAPPHomepageSearch ByCountySearch byPWS Nameor NumberHow to Help?
Definitions
AquifersPublic WaterSystemsAssessmentPotentialContaminantsSusceptibilityPrevention
Contact Us
EmailMailingAddressSource WaterProtectionWorkshop
EPA SourceWater
Protectionwebsite
Source Water Assessment & Protection Program
Results for: 2011
VENICE WATER DEPT CITY OF200 N WARFIELD AVENUEVENICE, FL 34292
Public Water System ID: 6581901County: SARASOTADEP Regulatory Office: Sarasota County Health Dept. 1301 Cattleman Rd. Sarasota, FL 34232 914-378-6111Public Water System Type : COMMUNITYPublic Water System Source : GROUNDPrimary Use: MUNICIPAL/CITYPopulation Served: 28685Size of Assessment Area: GROUND: For this community system, a 5-year ground water travel time around each well wasused to define the assessment area. The 5-year ground water travel time is defined by the areafrom which water will drain to a well pumping at the average daily permitted rate for a five yearperiod of time.
Number of Wells: 14
Well ID Owner ID Status Well Depth(ft) Aquifer37418 VENICE WELLFIELD 7E ACTIVE 330 Floridan Aquifer37417 VENICE WELLFIELD 6E ACTIVE 305 Floridan Aquifer18463 VENICE WELL FIELD RO1E ACTIVE 500 Floridan Aquifer18462 VENICE WELL FIELD RO8W ACTIVE 450 Floridan Aquifer18461 VENICE WELL FIELD RO7W ACTIVE 530 Floridan Aquifer18458 VENICE WELL FIELD RO2W ACTIVE 450 Floridan Aquifer18457 VENICE WELL FIELD RO2 ACTIVE 450 Floridan Aquifer18456 VENICE WELL FIELD RO1A ACTIVE 450 Floridan Aquifer18467 VENICE WELL FIELD 5E ACTIVE 228 Floridan Aquifer18466 VENICE WELL FIELD RO4E ACTIVE 242 Floridan Aquifer18465 VENICE WELL FIELD RO3E ACTIVE 197 Floridan Aquifer18464 VENICE WELL FIELD 2E ACTIVE 207 Floridan Aquifer18460 VENICE WELL FIELD RO4W ACTIVE 450 Floridan Aquifer18459 VENICE WELL FIELD RO3W ACTIVE 450 Floridan Aquifer
Results:
GROUND WATER:
Number of Unique Potential Contaminant Sources: 44
Facility Type FacilityClass Status Name Affected
WellSusceptibility
ScoreConcern
LevelPETROLEUMSTORAGE
FUELUSER/NON- CLOSED
SARASOTACNTY SCHOOL 18457 33.33 MODERATE
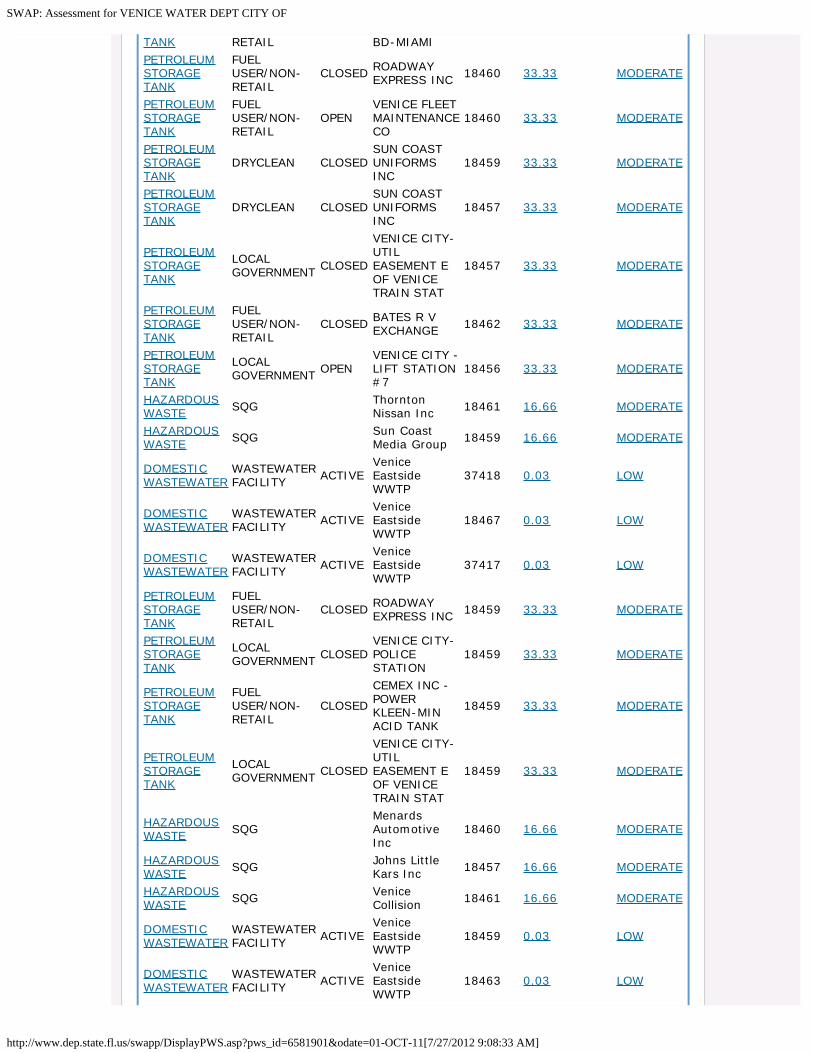
SWAP: Assessment for VENICE WATER DEPT CITY OF
http://www.dep.state.fl.us/swapp/DisplayPWS.asp?pws_id=6581901&odate=01-OCT-11[7/27/2012 9:08:33 AM]
TANK RETAIL BD-MIAMIPETROLEUMSTORAGETANK
FUELUSER/NON-RETAIL
CLOSED ROADWAYEXPRESS INC 18460 33.33 MODERATE
PETROLEUMSTORAGETANK
FUELUSER/NON-RETAIL
OPENVENICE FLEETMAINTENANCECO
18460 33.33 MODERATE
PETROLEUMSTORAGETANK
DRYCLEAN CLOSEDSUN COASTUNIFORMSINC
18459 33.33 MODERATE
PETROLEUMSTORAGETANK
DRYCLEAN CLOSEDSUN COASTUNIFORMSINC
18457 33.33 MODERATE
PETROLEUMSTORAGETANK
LOCALGOVERNMENT CLOSED
VENICE CITY-UTILEASEMENT EOF VENICETRAIN STAT
18457 33.33 MODERATE
PETROLEUMSTORAGETANK
FUELUSER/NON-RETAIL
CLOSED BATES R VEXCHANGE 18462 33.33 MODERATE
PETROLEUMSTORAGETANK
LOCALGOVERNMENT OPEN
VENICE CITY -LIFT STATION#7
18456 33.33 MODERATE
HAZARDOUSWASTE SQG Thornton
Nissan Inc 18461 16.66 MODERATE
HAZARDOUSWASTE SQG Sun Coast
Media Group 18459 16.66 MODERATE
DOMESTICWASTEWATER
WASTEWATERFACILITY ACTIVE
VeniceEastsideWWTP
37418 0.03 LOW
DOMESTICWASTEWATER
WASTEWATERFACILITY ACTIVE
VeniceEastsideWWTP
18467 0.03 LOW
DOMESTICWASTEWATER
WASTEWATERFACILITY ACTIVE
VeniceEastsideWWTP
37417 0.03 LOW
PETROLEUMSTORAGETANK
FUELUSER/NON-RETAIL
CLOSED ROADWAYEXPRESS INC 18459 33.33 MODERATE
PETROLEUMSTORAGETANK
LOCALGOVERNMENT CLOSED
VENICE CITY-POLICESTATION
18459 33.33 MODERATE
PETROLEUMSTORAGETANK
FUELUSER/NON-RETAIL
CLOSED
CEMEX INC -POWERKLEEN-MINACID TANK
18459 33.33 MODERATE
PETROLEUMSTORAGETANK
LOCALGOVERNMENT CLOSED
VENICE CITY-UTILEASEMENT EOF VENICETRAIN STAT
18459 33.33 MODERATE
HAZARDOUSWASTE SQG
MenardsAutomotiveInc
18460 16.66 MODERATE
HAZARDOUSWASTE SQG Johns Little
Kars Inc 18457 16.66 MODERATE
HAZARDOUSWASTE SQG Venice
Collision 18461 16.66 MODERATE
DOMESTICWASTEWATER
WASTEWATERFACILITY ACTIVE
VeniceEastsideWWTP
18459 0.03 LOW
DOMESTICWASTEWATER
WASTEWATERFACILITY ACTIVE
VeniceEastsideWWTP
18463 0.03 LOW

SWAP: Assessment for VENICE WATER DEPT CITY OF
http://www.dep.state.fl.us/swapp/DisplayPWS.asp?pws_id=6581901&odate=01-OCT-11[7/27/2012 9:08:33 AM]
PETROLEUMSTORAGETANK
FUELUSER/NON-RETAIL
CLOSED
R C MARTINCONCRETEPRODUCTSINC
18460 33.33 MODERATE
PETROLEUMSTORAGETANK
FUELUSER/NON-RETAIL
CLOSED VENICEROOFING INC 18462 33.33 MODERATE
INDUSTRIALWASTEWATER
WASTEWATERFACILITY ACTIVE Venice, City of
- R/O Plant 18457 0.03 LOW
DOMESTICWASTEWATER
WASTEWATERFACILITY ACTIVE
VeniceEastsideWWTP
37417 0.03 LOW
PETROLEUMSTORAGETANK
FUELUSER/NON-RETAIL
CLOSED
CEMEX INC -VENICEREADYMIXPLT
18459 33.33 MODERATE
HAZARDOUSWASTE SQG
MenardsAutomotiveInc
18459 16.66 MODERATE
PETROLEUMSTORAGETANK
RETAILSTATION CLOSED KT FOOD
STORE 18456 33.33 MODERATE
PETROLEUMSTORAGETANK
COUNTYGOVERNMENT CLOSED VENICE TRAIN
DEPOT 18456 33.33 MODERATE
INDUSTRIALWASTEWATER
WASTEWATERFACILITY ACTIVE Venice, City of
- R/O Plant 18459 0.03 LOW
DOMESTICWASTEWATER
WASTEWATERFACILITY ACTIVE
VeniceEastsideWWTP
18467 0.03 LOW
PETROLEUMSTORAGETANK
LOCALGOVERNMENT OPEN
VENICE CITYPUBLICWORKS
18460 33.33 MODERATE
PETROLEUMSTORAGETANK
FUELUSER/NON-RETAIL
CLOSED
CEMEX INC -VENICEREADYMIXPLT
18457 33.33 MODERATE
PETROLEUMSTORAGETANK
FUELUSER/NON-RETAIL
CLOSED
CEMEX INC -POWERKLEEN-MINACID TANK
18457 33.33 MODERATE
PETROLEUMSTORAGETANK
FUELUSER/NON-RETAIL
CLOSED LANNING TIRESALES 18461 33.33 MODERATE
PETROLEUMSTORAGETANK
FUELUSER/NON-RETAIL
OPENMANORCAREHEALTHSERVICES
37418 33.33 MODERATE
HAZARDOUSWASTE SQG Weeks
Machine Shop 18460 16.66 MODERATE
INDUSTRIALWASTEWATER
WASTEWATERFACILITY ACTIVE
Florida RockIndustries Inc- Venice Plant
18460 0.03 LOW
PETROLEUMSTORAGETANK
FUELUSER/NON-RETAIL
OPENTHORNTONDATSUNNISSAN INC
18461 33.33 MODERATE
HAZARDOUSWASTE SQG Sun Coast
Media Group 18457 16.66 MODERATE
DOMESTICWASTEWATER
WASTEWATERFACILITY ACTIVE
VeniceEastsideWWTP
18457 0.03 LOW
DOMESTICWASTEWATER
WASTEWATERFACILITY ACTIVE
VeniceEastsideWWTP
18456 0.03 LOW
INDUSTRIALWASTEWATER
WASTEWATERFACILITY ACTIVE Venice, City of
- RO Plant 18456 0.03 LOW

SWAP: Assessment for VENICE WATER DEPT CITY OF
http://www.dep.state.fl.us/swapp/DisplayPWS.asp?pws_id=6581901&odate=01-OCT-11[7/27/2012 9:08:33 AM]
PETROLEUMSTORAGETANK
RETAILSTATION CLOSED KT FOOD
STORE 18459 33.33 MODERATE
HAZARDOUSWASTE SQG Johns Little
Kars Inc 18456 16.66 MODERATE
PETROLEUMSTORAGETANK
FUELUSER/NON-RETAIL
CLOSED ROADWAYEXPRESS INC 18456 33.33 MODERATE
PETROLEUMSTORAGETANK
FUELUSER/NON-RETAIL
CLOSED
CEMEX INC -VENICEREADYMIXPLT
18456 33.33 MODERATE
PETROLEUMSTORAGETANK
DRYCLEAN CLOSEDSUN COASTUNIFORMSINC
18456 33.33 MODERATE
PETROLEUMSTORAGETANK
FUELUSER/NON-RETAIL
CLOSED
CEMEX INC -POWERKLEEN-MINACID TANK
18456 33.33 MODERATE
HAZARDOUSWASTE SQG Midas Muffler 18462 16.66 MODERATE
HAZARDOUSWASTE TSD
PrecisionPlating &Anodizing
18458 33.33 MODERATE
PETROLEUMSTORAGETANK
FUELUSER/NON-RETAIL
OPEN
FL ROCKINDUSTRIESINC-VENICERM PLT
18460 33.33 MODERATE
PETROLEUMSTORAGETANK
LOCALGOVERNMENT OPEN VENICE CITY
WTP 18459 33.33 MODERATE
PETROLEUMSTORAGETANK
FUELUSER/NON-RETAIL
CLOSED
R C MARTINCONCRETEPRODUCTSINC
18459 33.33 MODERATE
PETROLEUMSTORAGETANK
COUNTYGOVERNMENT CLOSED VENICE TRAIN
DEPOT 18457 33.33 MODERATE
PETROLEUMSTORAGETANK
LOCALGOVERNMENT CLOSED
VENICE CITY-POLICESTATION
18456 33.33 MODERATE
PETROLEUMSTORAGETANK
FUELUSER/NON-RETAIL
CLOSED TEN THIRTYRENTAL BAYS 18462 33.33 MODERATE
PETROLEUMSTORAGETANK
FUELUSER/NON-RETAIL
OPEN WATERFORDGOLF CLUB 18466 16.66 MODERATE
PETROLEUMSTORAGETANK
LOCALGOVERNMENT OPEN FIRE STATION
2 18456 33.33 MODERATE
DOMESTICWASTEWATER
WASTEWATERFACILITY ACTIVE
VeniceEastsideWWTP
37417 0.03 LOW
PETROLEUMSTORAGETANK
FUELUSER/NON-RETAIL
CLOSED
CEMEX INC -VENICEREADYMIXPLT
18458 33.33 MODERATE
PETROLEUMSTORAGETANK
FUELUSER/NON-RETAIL
CLOSEDSARASOTACNTY SCHOOLBD-MIAMI
18459 33.33 MODERATE
PETROLEUMSTORAGETANK
COUNTYGOVERNMENT CLOSED VENICE TRAIN
DEPOT 18459 33.33 MODERATE
HAZARDOUSWASTE SQG
MenardsAutomotive 18456 16.66 MODERATE

SWAP: Assessment for VENICE WATER DEPT CITY OF
http://www.dep.state.fl.us/swapp/DisplayPWS.asp?pws_id=6581901&odate=01-OCT-11[7/27/2012 9:08:33 AM]
IncPETROLEUMSTORAGETANK
COUNTYGOVERNMENT CLOSED VENICE TRAIN
DEPOT 18458 33.33 MODERATE
PETROLEUMSTORAGETANK
FUELUSER/NON-RETAIL
CLOSED
CEMEX INC -POWERKLEEN-MINACID TANK
18458 33.33 MODERATE
HAZARDOUSWASTE SQG Johns Little
Kars Inc 18459 16.66 MODERATE
PETROLEUMSTORAGETANK
LOCALGOVERNMENT OPEN VENICE CITY
WTP 18456 33.33 MODERATE
PETROLEUMSTORAGETANK
LOCALGOVERNMENT CLOSED
VENICE CITY-UTILEASEMENT EOF VENICETRAIN STAT
18456 33.33 MODERATE
PETROLEUMSTORAGETANK
FUELUSER/NON-RETAIL
CLOSED
R C MARTINCONCRETEPRODUCTSINC
18456 33.33 MODERATE
PETROLEUMSTORAGETANK
BULKSTORAGEFACILITY
CLOSED RICHPROPERTY 18456 33.33 MODERATE
HAZARDOUSWASTE SQG Bates RV
Exchange 18462 16.66 MODERATE
Last updated: March 23, 2012
Copyright 2012 State of FloridaDisclaimer
Exit Disclaimer Privacy Statement
3900CommonwealthBoulevard M.S.
49 Tallahassee,
Florida 32399 850-245-2118(phone) / 850-
245-2128(fax)
DEP Home | About DEP | Contact Us | Search | Site Map

Appendix D
City of Venice 10-Year Water Supply Facilities Work Plan (April 2010)

_________________________________________________________________________ April, 2010 1
CITY OF VENICE, FLORIDA
10 –YEAR WATER SUPPLY FACILITIES WORK PLAN
Prepared For:
Florida Department of Community Affairs
Prepared By:
City of Venice Utilities Department &
Planning and Zoning Department
April 2010

_________________________________________________________________________ April, 2010 2
TABLE OF CONTENTS 1.0 INTRODUCTION
1.1 Statutory History
1.2 Statutory Requirements 2.0 BACKGROUND INFORMATION 2.1 City of Venice Overview 2.2 Population and Land Use 3.0 POTABLE WATER SERVICE INFORMATION
3.1 Utilities Overview 3.2 Utilities Contact Information 3.3 Utilities Department and Divisions Overview
4.0 WATER USE PERMIT INFORMATION 4.1 WUP Permit Information (Individual) 5.0 EXISTING SYSTEMS 5.1 City of Venice Water Supply Sources 5.2 Raw Water Supply
5.3 Treatment Facility 5.4 Treatment Process 5.5 Treatment Capacity 5.6 Storage 5.7 Distribution System 5.8 Distribution Pumping Capacity 5.9 Distribution Piping 5.10 Existing Interconnections 5.11 Terms of Agreement 5.12 Historical Interconnections Utilization 5.13 Outside / Bulk Sales 6.0 REGIONAL ISSUES
6.1 Southern Water Use Caution Area 6.2 Southwest Florida Water Management District 6.3 Sarasota County 6.4 Other Water Partners 6.5 Joint Planning / Interlocal Service Boundary Agreement Planning Areas

_________________________________________________________________________ April, 2010 3
7.0 DATA AND ANALYSIS 7.1 Population Methodology
7.2 Population Estimates and Projections 7.3 Resident Population 7.4 Seasonal and Functional Populations 7.5 Historical Population Trends 7.6 Residential and Nonresidential Projections for the City of Venice
(Incorporated Areas) 7.7 Potable Water Projections for the Planning Areas (Incorporated Areas)
7.8 Residential and Nonresidential Projections for the JPA/ILSBA Planning Areas (Potential Voluntary Annexation Areas)
7.9 Potable Water Projections for the JPA/ILSBA Planning Areas (Potential Voluntary Annexation Areas)
7.10 Potable Water Level of Service Standard 7.11 Potable Water Concurrency Management
8.0 WATER CONSERVATION 8.1 Regional Coordination 8.2 Specific Actions, Programs, Regulations, or Opportunities 8.3 Re-Use / Reclaimed Water 9.0 CAPITAL IMPROVEMENTS
9.1 Potable Water Supply Related Capital Improvements (2008 Annual Reporting Period)
9.2 Potable Water Supply Related Capital Improvements (Future) 9.3 Five-Year Schedule of Capital Improvements FY09-FY15 9.4 Five-Year Schedule of Capital Improvements FY15-FY20
10.0 GOALS, OBJECTIVES AND POLICIES 10.1 Goals, Objectives and Policies Addressing Potable Water Supply APPENDIX Map 1 Supply Wells Map 2 Water Treatment Facilities Map 3 Distribution Lines Map 4 Existing Interconnections w/Sarasota County Map 5 JPA/ILSBA Areas

_________________________________________________________________________ April, 2010 4
1.0 INTRODUCTION The purpose of the City of Venice Water Supply Facilities Work Plan (Work Plan) is to identify and plan for the water supply sources and facilities needed to serve existing and new development within the City’s jurisdiction. Chapter 163, Part II, F.S., requires local governments to prepare and adopt Work Plans into their comprehensive plans within 18 months after the water management district approves a regional water supply plan or its update. At its December 1, 2006 meeting, the Southwest Florida Water Management District’s (SWFWMD) Governing Board approved the 2006 Regional Water Supply Plan (RWSP) in accordance with Section 373.0361, Florida Statutes. Therefore, the deadline for local governments within SWFWMD’s jurisdiction to amend their comprehensive plans to adopt a Work Plan was May 30, 2008. The City of Venice was unable to complete and amend the Work Plan in advance of this deadline resulting in Objections from the Department of Community Affairs (DCA) and corresponding comments from SWFWMD through the review of the City’s Evaluation and Appraisal Report (EAR) based Comprehensive Plan Amendment, Envision Venice. As such, this Work Plan has been prepared to address DCA’s Objections and to bring the City of Venice into compliance with State Statutes.
According to State guidelines, the Work Plan and the comprehensive plan amendment must address the development of traditional and alternative water supplies, bulk sales agreements and conservation and reuse programs that are necessary to serve existing and new development for at least a 10-year planning period.
There are three potential options available to the City for adopting the Work Plan: (1) incorporate the plan as a sub-element; (2) incorporate by reference in a policy; and (3) include as goals, objectives and policies throughout the comprehensive plan. The City has chosen to incorporate the Work Plan by reference in the Policies and have included the work plan into Volume II: Data & Analysis in the Public Services & Infrastructure Chapter. A complete list of Goals, Objectives and Policies related to public water supply and the Water Supply Work Plan are included in Section 10.
The City’s Work Plan has been divided into ten (10) sections:
Section 1 – Introduction Section 2 – Background Information Section 3 – Potable Water Service Information Section 4 – Water Use Permit Information Section 5 – Existing Systems Section 6 – Regional Issues Section 7 – Data and Analysis Section 8 – Water Conservation Section 9 – Capital Improvements Section 10 – Goals, Objectives, Policies

_________________________________________________________________________ April, 2010 5
THIS PAGE INTENTIONALLY LEFT BLANK

_________________________________________________________________________ April, 2010 6
1.0 INTRODUCTION 1.1 Statutory History
The Florida Legislature has enacted bills in the 2002, 2004, and 2005 sessions to address the state’s water supply needs. These bills, especially Senate Bills 360 and 444 (2005 legislative session), significantly changed Chapter 163 and 373 Florida Statutes (F.S.) by strengthening the statutory links between the regional water supply plans prepared by the water management districts and the comprehensive plans prepared by local governments. In addition, these bills established the basis for improving coordination between the local land use planning and water supply planning.
1.2 Statutory Requirements Each local government must comply with the following requirements:
1. Coordinate appropriate aspects of its comprehensive plan with the appropriate water management district’s regional water supply plan, [163.3177(4)(a), F.S.]
2. Ensure that its future land use plan is based upon availability of adequate water supplies and public facilities and services [s.163.3177(6)(a), F.S., effective July 1, 2005]. Data and analysis demonstrating that adequate water supplies and associated public facilities will be available to meet projected growth demands must accompany all proposed Future Land Use Map amendments submitted to the Department for review. The submitted package must also include an amendment to the Capital Improvements Element, if necessary, to demonstrate that adequate public facilities will be available to serve the proposed Future Land Use Map modification.
3. Ensure that adequate water supplies and facilities area available to serve new development no later than the date on which the local government anticipates issuing a certificate of occupancy and consult with the applicable water supplier prior to approving building permit, to determine whether adequate water supplies will be available to serve the development by the anticipated issuance date of the certificate of occupancy [s.163.3180 (2)(a), F.S., effective July 1, 2005]. This “water supply concurrency” is now in effect, and local governments should be complying with the requirement for all new development proposals. In addition, local governments should update their comprehensive plans and land development regulations as soon as possible to address these statutory requirements. The latest point at which the comprehensive plan must be revised to reflect the concurrency requirements is at the time the local government adopts plan amendments to implement the recommendations of the Evaluation and Appraisal Report (EAR).
4. For local governments subject to a regional water supply plan, revise the General Sanitary Sewer, Solid Waste, Drainage, Potable Water, and Natural Groundwater Aquifer Recharge Element (the “Infrastructure Element”), within 18 months after the water management district approves an updated regional water supply plan, to:
a. Identify and incorporate the alternative water supply project(s) selected by the local government from projects identified in the updated regional water supply plan, or the alternative project proposed by the local government under s. 373.0361(7), F.S. [s. 163.3177(6)(c), F.S.];

_________________________________________________________________________ April, 2010 7
b. Identify the traditional and alternative water supply projects, bulk sales agreements, and the conservation and reuse programs necessary to meet current and future water use demands within the local government’s jurisdiction [s. 163.3177(6)(c), F.S.]; and
c. Include a water supply facilities work plan for at least a 10-year planning period for constructing the public, private, and regional water supply facilities identified in the element as necessary to serve existing and new development. [s. 163.3177(6)(c), F.S.] Amendments to incorporate the water supply facilities work plan into the comprehensive plan are exempt from the twice-a-year amendment limitation. [s. 163.3177(6)(c), F.S.]
5. Revise the Five-Year Schedule of Capital Improvements to include any water supply, reuse, and conservation projects and programs to be implemented during the five-year period.
6. To the extent necessary to maintain internal consistency after making changes described in Paragraph 1 through 5 above, revise the Conservation Element to assess projected water needs and sources for at least a 10-year planning period, considering the appropriate regional water supply plan, the applicable District Water Management Plan, as well as applicable consumptive use permit(s). [s.163.3177 (6)(d), F.S.]
If the established planning period of a comprehensive plan is greater than ten years, the plan must address the water supply sources necessary to meet and achieve the existing and projected water use demand for established planning period, considering the appropriate regional water supply plan. [s.163.3167 (13), F.S.]
7. To the extent necessary to maintain internal consistency after making changes described in Paragraphs 1 through 5 above, revise the Intergovernmental Coordination Element to ensure coordination of the comprehensive plan with applicable regional water supply plans and regional water supply authorities’ plans. [s.163.3177(6)(h)1., F.S.]
8. Address in the EAR, the extent to which the local government has implemented the 10-year water supply facilities work plan, including the development of alternative water supplies, and determine whether the identified alternative water supply projects, traditional water supply projects, bulk sales agreements, and conservation and reuse programs are meeting local water use demands. [s.163.3191 (2)(1), F.S.]

_________________________________________________________________________ April, 2010 8
2.0 BACKGROUND INFORMATION 2.1 City of Venice Overview
The City of Venice is located in Southwest Florida on the Gulf of Mexico, midway between Tampa and Ft. Myers. The City is primarily surrounded by unincorporated Sarasota County to the north, south and east. In 1925, the Brotherhood of Locomotive Engineers engaged famous city planner John Nolen and landscape architect Prentiss French to design a town reminiscent of its Italian namesake. Venice was incorporated as a town at that time. Building began in earnest in 1926. The first town council was selected and police and fire departments were established. On May 9, 1927, Venice was incorporated as a city. Venice became known as the City on the Gulf because it is one of the few cities on the west coast of Florida that occupies a coastal area with no barrier island. What we now refer to as the "Island of Venice" was created in 1967 when the Army Corps of Engineers completed the Intracoastal Waterway through the city. The City of Venice provides a range of municipal services, including potable water, sewer, reclaimed water, solid waste and recycling collections, road and parks maintenance, stormwater management, building inspections, planning, zoning, code enforcement, and emergency services including fire and police. The City also operates a municipal airport, mobile home park and related enterprise functions. The City continues to emphasize its unique character and has adopted several regulatory mechanisms to ensure that the community standards and values are sustained in the future as redevelopment and new growth occurs in and around the formal municipal boundaries of the City. In addition to standard zoning provisions, specialized requirements relating to architectural control, historic preservation and protection of significant environmental resources have been adopted and enforced. Today the City covers an area of approximately 16.69 square miles (10,681 acres) with a permanent resident population of approximately 22,146. Physical features and infrastructure associated with the City include: over 54 miles of paved streets, 38 miles of storm water management lines, three fire stations, one police station, one County library branch, over 305 acres of public parks, three miles of public beach, and several public boat launches. On July 14, 2009 the City adopted the Envision Venice: Strategic Plan 2020 which identifies the City’s mission, vision, goals and strategies that incorporate building upon the success of the community and its assets. The mission is simply stated as follows: “To provide exceptional municipal services through a financially and environmentally sustainable city with engaged citizens.”

_________________________________________________________________________ April, 2010 9
The commencement of the City’s water supply planning efforts in concert with the Florida Department of Community Affairs, Department of Environmental Regulation, and the Southwest Florida Water Management District represents another important element of local efforts to preserve the unique character and appeal of the Venice community.
2.2 Population and Land Use
Between 1990 and 2000, the City of Venice population grew from 16,922 to 17,764, an increase of five percent. Although the 1996 EAR predicted a decline in population, based on the projections prepared by the University of Florida Bureau of Economic and Business Research (BEBR), in 2005 it was estimated that the City’s population had increased to 20,800 residents. This relatively minor population growth is reflective of the fact that the City is substantially built-out, with future development potential and population growth contingent on annexation and development of properties within the Joint Planning and Interlocal Service Boundary Agreement Areas (JPA/ILSBA). The potential expansion of the City’s current boundaries through annexations within the JPA/ILSBA Planning Areas is the only factor which might result in significant population increase during the 2010-2020 planning period. The JPA/ILSBA is discussed in further detail below in Section 6.0 (Regional Issues) and population estimates and projections are further described in Section 7.0 (Data and Analysis).
The total area of the City is approximately 10,681 acres (16.69 square miles). Of that area, approximately 9,981 acres comprise the land mass of the City of Venice. In the City’s Evaluation and Appraisal Based Large Scale Comprehensive Plan Amendment (aka Envision Venice), an evaluation of existing gross acreage by land uses revealed that 2,717 acres or 25% of the total gross acreage in the city is dedicated to residential use. The remaining gross acreages are allocated to non-residential such as commercial and office (3%); golf courses (10%); industrial (2%); institutional (2%); government (6%); transportation, communication, utilities (17%); agriculture (2%); undeveloped (26%) and; inland water (7%).
The City does not anticipate substantial increases in land area in the short- and long-term planning horizon beyond those identified within the JPA/ILSBA. In the meantime, the residential and non-residential growth rate is anticipated to be minimal for the next 10 to 20 years

_________________________________________________________________________ April, 2010 10
3.0 POTABLE WATER SERVICE INFORMATION The City of Venice owns and operates a full range of water supply facilities to meet the needs of a growing urban area. Included is potable water, wastewater treatment and reclaimed water facilities. The City also operates a related water resource program through its stormwater management enterprise program.
3.1 Utilities Overview Residents of the City of Venice obtain their water directly from City of Venice Utilities, which is responsible for ensuring that enough capacity is available for existing and future customers.
3.2 Utilities Contact Information
Utility Name: City of Venice Utility Department
Project/Service Area Name: City of Venice Water Use Permit No: 20005393.008 County: Sarasota
Utility Address: 200 N. Warfield Avenue
Venice, FL 34285
DEP PWSI No(s): 658 / 1901
Utility Contact Name: Stephen F. Park
Utility Contact Title: Chief Plant Operator Contact Phone Number: 941.480.3333 (ext. 236) Contact Email Address: [email protected]
3.3 Utilities Department and Divisions Overview Under the management of the Utility Director, the department consists of four divisions: Administration, Water Production, Field Operations, and Water Reclamation.
While keeping in compliance with all federal, state and local regulations, the Administration Division is responsible for program implementation of quality control/assurance; utility planning and the coordination of the other Utility divisions as they relate to the overall production and distribution of drinking water; the collection and treatment of wastewater: and the delivery and use of reclaimed water. The department works regionally with Sarasota County, Peace River/Manasota Water Supply Authority, Southwest Florida Water

_________________________________________________________________________ April, 2010 11
Management District, and other local municipalities to provide for the collective needs of the community and region.
The Water Production Division is responsible for the water treatment system and has a plant design capacity of 4.49 million gallons per day. At the present, an annual average of 2.3 million gallons of highly purified drinking water is delivered each day to customers. The plant is maintained and operated by a team of nine DEP licensed operators and maintenance crew of six and is operational 24 hours a day, 7 days a week.
The Field Operations Division is responsible for the repair and maintenance of approximately 180 miles of water distribution mains, 49 miles of reclaimed distribution mains, 16 miles of raw water mains, 107 miles of gravity collection lines, 41 miles of force main, over 1,000 fire hydrants, over 2,700 main line valves, 100 air release valves, 2,300 manholes, approximately 11,000 potable water meters, and 2,800 reclaimed water meters. Permits for development review and construction are coordinated and reviewed by this division as well as performing utility locates for all underground facilities. The City’s Cross Connection Control Program is also a function of this division which consists of testing, maintaining, and repairing of all City-owned backflow assemblies.
The Water Reclamation Division processes all wastewater for the City using Advanced Wastewater Treatment (AWT) technology producing a final effluent that meets all regulatory requirements and worthy of being “reused” for irrigation. The maintenance operation maintains 83 lift stations throughout the City that transports the wastewater. This group is also responsible for maintaining equipment and improving the appearance of lift stations.

_________________________________________________________________________ April, 2010 12
4.0 WATER USE PERMIT INFORMATION A water use permit (WUP) allows withdrawal of a specified amount of water, either from the ground water or surface water source. The City of Venice received a renewal of their WUP from Southwest Florida Water Management District (SWFWMD) on December 16, 2008. A summary of information contained within the WUP is provided below and a complete copy is provided for reference as Appendix A.
4.1 WUP Permit Information (Individual)
PERMIT NUMBER: 20005393.008
TYPE OF APPLICATION: Renewal
PERMIT ISSUE DATE: December 16, 2008
EXPIRATION DATE: December 16, 2028
GRANTED TO: City of Venice
200 North Warfield Avenue Venice, FL 34292
PROJECT NAME: City of Venice
WATER USE CAUTION AREA: Southern
PROPERTY LOCATION: 162 owned and 8,002 serviced acres in Sarasota County, located within the City of Venice.
ABSTRACT: This is a renewal of an existing public supply permit with no change in quantities. The sole source of water authorized for use by this permit is from brackish groundwater from the Intermediate Aquifer System, an Alternative Water Supply This renewal authorizes a standard annual average daily quantity of 6,864,000 gpd (6.8 MGD) and a peak month quantity of 8,240,000 gpd (8.2 MGD).
CHANGES FROM PRIOR PERMIT: The permit is renewed with a 20-year term, and the addition of Special Conditions requiring 5-year compliance reporting and improved treatment efficiency. There is no change in quantities.
PERMIT INFORMATION
Previous Permitted (1997-2007)
gpd
Requested (2007)
gpd
Authorized (2007-2027)
gpd
ANNUAL AVERAGE1 6,864,000 6,864,000 6,864,000 Ground Water 6,864,000 6,864,000 6,864,000 Surface Water 0 0 0
PEAK MONTH2 8,240,000 8,240,000 8,240,000 Ground Water 8,240,000 8,240,000 8,240,000 Surface Water 0 0 0
1 Annual Average is the total gallons in a year divided by 365 days per year. 2 Peak Month is the total gallons in the highest water-use month divided by the number of days in that month.

_________________________________________________________________________ April, 2010 13
5.0 EXISTING SYSTEMS The City of Venice Utilities System currently consists of the following key features: a reverse osmosis water treatment plant, an extensive distribution and collection system, and a waste water treatment facility. In 2007 Malcolm Pirnie, Inc. was retained by the City of Venice Utilities Department to complete a Water Master Plan. A series of technical memorandums dated August 31, 2007 were prepared and compiled to create Sections of the Water Master Plan. Technical Memorandum No. 2 focused on providing an overview of the existing treatment system while Technical Memorandum No. 4 focused on providing an overview of the existing City of Venice interconnections, as well as future interconnection needs and options for future interconnections. The following excerpt regarding the existing treatment systems and interconnections is taken from these memorandums. The following is a description of the different components of the City’s existing Utility System. 5.1 City of Venice Water Supply Sources
The City utilizes a series of ground water wells to meet its potable water needs (see Map 1, Appendix). There are currently three primary well locations, including several wells along the Intracoastal waterway, at the City’s Wellfield Park (Venice Avenue and Pinebrook Road area) and in the Sawgrass Community (Venice Avenue and Auburn Road area). The City has also received dedicated future potential well sites within the Venetian Golf & River Club Community.
The City derives its water from the Intermediate Aquifer. The water available from this source is characterized as brackish and requires special treatment through reverse osmosis to produce safe drinking water.
The following table (Table 5.1.1) lists the diameter, depth, casing depth, pump depth and pump capacity of the wells within the Intermediate Aquifer System.
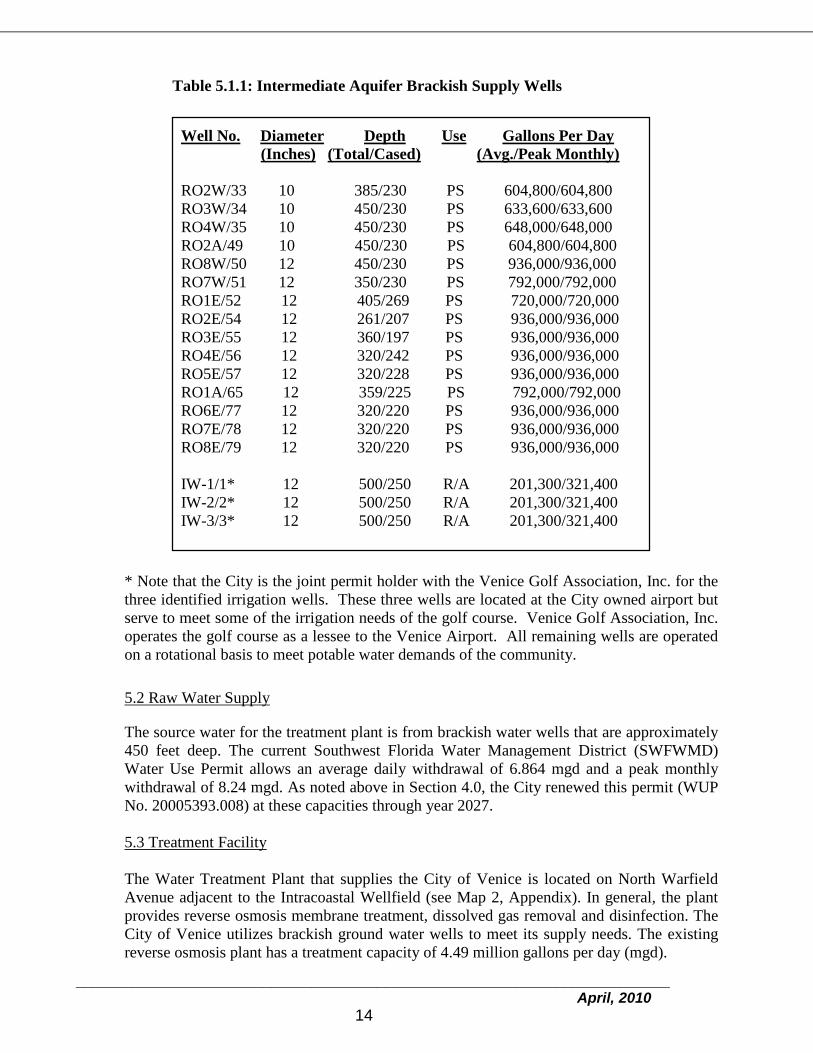
_________________________________________________________________________ April, 2010 14
Table 5.1.1: Intermediate Aquifer Brackish Supply Wells
* Note that the City is the joint permit holder with the Venice Golf Association, Inc. for the three identified irrigation wells. These three wells are located at the City owned airport but serve to meet some of the irrigation needs of the golf course. Venice Golf Association, Inc. operates the golf course as a lessee to the Venice Airport. All remaining wells are operated on a rotational basis to meet potable water demands of the community.
5.2 Raw Water Supply
The source water for the treatment plant is from brackish water wells that are approximately 450 feet deep. The current Southwest Florida Water Management District (SWFWMD) Water Use Permit allows an average daily withdrawal of 6.864 mgd and a peak monthly withdrawal of 8.24 mgd. As noted above in Section 4.0, the City renewed this permit (WUP No. 20005393.008) at these capacities through year 2027. 5.3 Treatment Facility
The Water Treatment Plant that supplies the City of Venice is located on North Warfield Avenue adjacent to the Intracoastal Wellfield (see Map 2, Appendix). In general, the plant provides reverse osmosis membrane treatment, dissolved gas removal and disinfection. The City of Venice utilizes brackish ground water wells to meet its supply needs. The existing reverse osmosis plant has a treatment capacity of 4.49 million gallons per day (mgd).
Well No. Diameter Depth Use Gallons Per Day (Inches) (Total/Cased) (Avg./Peak Monthly) RO2W/33 10 385/230 PS 604,800/604,800 RO3W/34 10 450/230 PS 633,600/633,600 RO4W/35 10 450/230 PS 648,000/648,000 RO2A/49 10 450/230 PS 604,800/604,800 RO8W/50 12 450/230 PS 936,000/936,000 RO7W/51 12 350/230 PS 792,000/792,000 RO1E/52 12 405/269 PS 720,000/720,000 RO2E/54 12 261/207 PS 936,000/936,000 RO3E/55 12 360/197 PS 936,000/936,000 RO4E/56 12 320/242 PS 936,000/936,000 RO5E/57 12 320/228 PS 936,000/936,000 RO1A/65 12 359/225 PS 792,000/792,000 RO6E/77 12 320/220 PS 936,000/936,000 RO7E/78 12 320/220 PS 936,000/936,000 RO8E/79 12 320/220 PS 936,000/936,000 IW-1/1* 12 500/250 R/A 201,300/321,400 IW-2/2* 12 500/250 R/A 201,300/321,400 IW-3/3* 12 500/250 R/A 201,300/321,400

_________________________________________________________________________ April, 2010 15
5.4 Treatment Process
The brackish ground water requires reverse osmosis treatment for removal of total dissolved solids (TDS), degasification to remove dissolved gases, pH adjustment and disinfection prior to distribution. Water from the wells is sent via raw water mains to the reverse osmosis plant located on North Warfield Avenue.
5.5 Treatment Capacity
The existing reverse osmosis plant has a treatment capacity of 4.49 mgd. The capacity can be expanded to 6.225 mgd with the addition of two more reverse osmosis (RO) trains. The total finished water plant capacity varies with the treatment efficiency of the limited-life membrane filters. Currently the plant has a recovery rate of approximately 50 percent; therefore half of the raw water that is withdrawn is processed and distributed through the potable water distribution system, while the rest is disposed as concentrate. The RO facility is limited to about 50 percent treatment recovery efficiency due to the allowable surface water discharge concentrations into the Intracoastal Waterway. Treatment efficiency could be increased to provide additional supply if an alternate disposal method such as a deep well injection is employed, or if additional raw water is used to blend concentrate down to acceptable levels.
The City completed a study of one option to increase the finished water recovery percentage for the RO treatment process in 1997. The City evaluated increasing pressure in a second stage of membranes for treating the concentrate from the existing membranes. Pressures in the second stage of membranes were tested from 50 psi to 245 psi, resulting in increased recovery of 0.7 to 12.5 percent, for a maximum improved plant efficiency of approximately 62.5 percent. This study did not evaluate different scale inhibitors, pre-treatment, modifying feed water pH, or changing the type of the existing membranes, all which have the potential to improve the finished water recovery.
5.6 Storage
After the water is treated, the finished water is stored in a 1 MG covered clear well prior to being pumped into the distribution system. A 300,000-gallon elevated storage tank is also located at the treatment plant (see Map 2, Appendix). These onsite storage facilities are routinely monitored for chlorine residual and/or pH and water levels.
There are two water storage tanks in the distribution system; a 300,000-gallon steel elevated storage tank at the Chuck Reiter ball field and a 1.5 MG concrete ground storage tank at the Pinebrook Booster Pump Facility. The Chuck Reiter ball field is located at the intersection of Field and Cooper Streets. This tank provides additional storage for peak demand and fire flow on the island in the western side of the distribution system. The Pinebrook Booster Pump Facility is located at Wellfield Park and includes a 1.5 MG concrete ground storage tank and booster pumping capacity (Figure 5.6.1). Table 5.6.1 lists the City of Venice storage volumes, which provide a total of 3.1 MG of finished storage.

_________________________________________________________________________ April, 2010 16
Figure 5.6.1: Pinebrook Booster Facility Ground Storage Tank
Table 5.6.1: Finished Water Storage Storage Location
Volume
(Million Gallons)
Clear Well at Treatment Plant Ground Storage Tank 1.0 Elevated Tank at Treatment Plant 0.3 Elevated Tank at Chuck Reiter ball field 0.3 Booster Pump Station Ground Storage Tank 1.5 Total Storage Capacity 3.1
5.7 Distribution System Maps 1-3, included in the Appendix, show the location of the supply wells, the water treatment plant, water storage locations and the extent of the City limits.
5.8 Distribution Pumping Capacity
Water is pumped from the on-site 1 MG clearwell to the distribution system using three 250-hp vertical turbine high service pumps that are fitted with VFDs. Typically, the distribution system pressure at the water treatment plant is 58 psi during the day and drops to between 54 and 56 psi at night.
The Pinebrook Booster Pump Facility utilizes a 100-hp booster pump and 50-hp backup booster pump. A 16-inch water main from the distribution system supplies the Pinebrook Booster Pump Facility. A 16-inch control valve regulates the flow into the Pinebrook storage tank at night, typically at a rate of 500 to 900 gpm. The 150-hp and 125-hp pumps can also be remotely operated from the Water Treatment Plant to pump water from the

_________________________________________________________________________ April, 2010 17
Pinebrook Storage and Booster Pump Facility to the distribution system in order to boost pressure for peak demand and to maintain fire protection to the northeast service area.
5.9 Distribution Piping
The distribution system includes approximately 170 miles of potable water mains, 15 miles of raw water mains, 38 miles of reuse distribution mains, 12,900 water meters, over 900 fire hydrants and over 2,600 main line valves. The piping network supplies homes, businesses, irrigation meters and fire hydrants throughout the City. Map 3 (see Appendix) shows the City’s potable distribution system.
As noted above four water storage tanks, two of which are elevated, are provided within the distribution system to provide fire storage volumes and to limit the effects of seasonal fluctuations and/or demands on the City’s system.
5.10 Existing Interconnections
The City of Venice currently has two interconnections with Sarasota County: one located on the south side of Venice (Country Club Way Interconnection) and one on the north side (Colonia Lane Interconnection). The locations of both interconnections are shown in Map 4 (see Appendix). The Colonia Lane Interconnection is a 10-inch above-ground interconnection and the Country Club Way Interconnection is an 8-inch diameter below-ground connection.
5.11 Terms of Agreement An agreement between the City of Venice and Sarasota County was signed on December 13, 1994, which allows the purchase and sale of bulk water when needed by either party. The ten-year agreement expired in 2004. Both parties have verbally agreed to honor the terms of the expired agreement in an emergency until a new agreement is put in place. Sarasota County is currently drafting an updated interlocal agreement, which will include water and wastewater contracts.
The agreement states that when an emergency occurs, the party with the water shortage may notify the other party to request a purchase of surplus water. The granting of the request is not mandatory and is at the full discretion of the party with the surplus, if a surplus exists. A limit of 0.5 million gallons per day (mgd), sold or purchased, is included in the agreement. Water supplied by Sarasota County costs the City of Venice $3.59 per 1,000 gallons in addition to a monthly charge of $2.44. When water is supplied by the City of Venice to Sarasota County, the County will be charged 125 percent of the City’s current retail rate. A billing schedule and payment plan, as well as provisions for water flow measurement, are also included in the agreement.
5.12 Historical Interconnections Utilization The existing interconnections are not used on a regular basis and are primarily in place for emergencies. The Colonia Lane interconnection was constructed in 1990 and has never been

_________________________________________________________________________ April, 2010 18
used. The Country Club Way interconnection has been used once to supply Sarasota County during a shortage.
5.13 Outside / Bulk Sales of Potable Water
The City does not currently have any bulk sales agreements for potable water nor does the City purchase water from another utility.

_________________________________________________________________________ April, 2010 19
6.0 REGIONAL ISSUES
6.1 Southern Water Use Caution Area In response to growing demands for water and regionally declining water levels in both groundwater and surface water bodies, the Southwest Florida Water Management District has established the Southern Water Use Caution Area (SWUCA). The SWUCA includes all of DeSoto, Hardee, Manatee, and Sarasota counties, and parts of Charlotte, Highlands, Hillsborough, and Polk counties. The SWUCA was first established in 1992 and designated as a water use caution area (WUCA) to manage water resources in the Southern West-Central Florida Groundwater Basin (SWCFGWB). The SWCFGWB is one of three groundwater basins within SWFWMD that were delineated based on persistent groundwater flow lines in the Floridan Aquifer. Management practices for the SWUCA have been revised over the years and passed by the SWFWMD Board of Directors. 6.2 Southwest Florida Water Management District
The Southwest Florida Water Management District (SWFWMD) is charged with the management, protection, and enhancement of water and water-related natural resources in the region in accordance with the Water Resources Act (Chapter 373, Florida Statutes). SWFWMD is also responsible for developing a Regional Water Supply Plan, a requirement resulting from state laws that were adopted in 1997 which specifically amended Chapter 373, Florida Statutes. The regional water supply planning requirements were again amended as a result of the passage of Senate Bill 444 during the 2005 legislative session in order to encourage better communication between water planners, city planners, and local utilities. Included in this coordination and conservation is ongoing communication with SWFWMD.
The Regional Water Supply Plan provides a framework for future water management decisions regarding the health of the hydrologic system and the system’s ability to meet long term water resource demands. SWFWMD’s Regional Water Supply Plan addresses a ten-county planning area along the west coast of Florida from Pasco to Charlotte County.
The updated 2006 Regional Water Supply Plan was approved in December 2006. It projected the Planning Region’s water demand would be approximately 409 million gallons per day (mgd) through 2025. The Plan determined that up to 703 mgd is potentially available to meet this demand.
Additionally, the City of Venice lies within the Southern Water Use Caution Area (SWUCA) designated by SWFWMD, an area impacted by increased groundwater withdrawal. The 2006 Regional Water Supply Plan determined that there is additional demand projected for this area. In the SWUCA, the additional demand through 2025 is projected to be approximately 211 mgd while potentially available sources will be approximately 414 mgd. As a result, the potential impacts to the SWUCA include saltwater intrusion, reduced stream flow, and lowered lake levels. The ultimate effect of the SWUCA on the City of Venice is that there will likely be pressure to seek alternative sources of potable water.
The Updated 2006 Regional Water Supply Plan states that:

_________________________________________________________________________ April, 2010 20
“The rapidly urbanizing coastal counties in the SWUCA will be supplied principally by alternative sources, not the retired ground-water quantities. The 50 mgd reduction in ground-water withdrawals required to meet the saltwater intrusion minimum aquifer level in the SWUCA can therefore be offset by the projected 142 mgd decrease in ground-water withdrawals. Some of the remaining 92 mgd in ground-water reductions may be re-permitted under certain conditions to meet demand in the inland counties in the SWUCA where access to alternative supplies is limited.”
6.3 Sarasota County
The City and County executed a Joint Planning and Interlocal Service Boundary Agreement (JPA/ILSBA) in January 2007 that addresses Potential Annexation Areas and the coordination of extra-jurisdictional planning in the County. Both governments agreed to future land use, utility service, transportation and environmental coordination decisions that encompass approximately 23,000 acres in the greater Venice/south county area (see Map 5, Appendix). Through the JPA/ILSBA, the City agrees not to annex any lands other than those designated as Potential Annexation Areas. These areas consist of land likely to be developed for urban uses within the next several decades. The rate of annexation in these areas is unknown. More information on the JPA/ILSBA areas is found in Sections 6.5, 7.10 and 7.11.
Coordination between SWFWMD, Sarasota County and the City of Venice is needed to ensure that future water demand is fulfilled.
6.4 Other Water Partners
The City of Venice has also been coordinating with the Peace River/Manasota Regional Water Supply Authority and the Water Planning Alliance. The Water Planning Alliance is governed by one elected official from each participating entity, including the counties of Charlotte, DeSoto, Manatee, and Sarasota; the cities of Arcadia, Bradenton, North Port, Palmetto, Punta Gorda, Sarasota, and Venice; the Town of Longboat Key; and the Englewood Water District. The goal of the Water Planning Alliance is to consider non-traditional options (such as desalinization) to meet long-term potable water demands in order to reduce ground and surface water withdrawals from existing resources.
6.5 Joint Planning / Interlocal Service Boundary Agreement Planning Areas (JPA/ILSBA)
In the past, the City has addressed its need to expand its boundaries through amendments to its comprehensive plan. In the 1988 Venice Comprehensive Plan, the City Council adopted a map depicting areas for potential annexation and designating these areas as comprising the municipal Potential Planning Service Area (PPSA). The PPSA area included all unincorporated enclaves as well as properties that are essentially vacant, or used for agricultural or very low density residential purposes lying east and northeast of the City. The problem with this method is that it did not promote communication and joint planning between the City and Sarasota County.

_________________________________________________________________________ April, 2010 21
In order to address this problem and promote such communication, the City of Venice and Sarasota County sought to establish a Joint Planning and Interlocal Service Boundary Agreement. The State of Florida recognizes the use of interlocal service boundary and joint planning agreements as a means to coordinate future land use, public facilities and services, and protection of natural resources in advance of annexation.
When discussions began in 2006, Sarasota County was experiencing the greatest amount of annexation activity in its history with the City of Venice which was proposing that large land areas be either annexed or set aside for future annexation. In 2000, for example, the City annexed 1,100 acres for new residential development encompassing an area lying north of Laurel Road from Knights Trail Road east to the Myakka River. This activity was largely driven by the City seeking to expand its tax base and developers seeking more intensive land uses, less stringent regulations and greater surety of development approvals.
Because of a concern for the potential loss of regional growth management perspective, revenue shifts affecting committed and planned infrastructure and potential duplication of public facilities and services, Sarasota County approached the City of Venice to initiate dialog regarding how the City and the County could proactively address these issues, to make the best decisions for the long-term future of the region.
The Joint Planning and Interlocal Service Boundary Agreement (JPA/ILSBA) between the City of Venice and Sarasota County identifies lands that are logical candidates for future annexation into the City Limits over the long term planning period. As a result of the discussions, the City and County executed the Joint Planning and Interlocal Service Boundary Agreement between the City of Venice and Sarasota County (JPA/ILSBA) in January 2007. The agreement identifies lands that are logical candidates for future annexation to the City over the long-term planning period and provides for the coordination of extra-jurisdictional planning in the County. Through the executed JPA/ILSBA, both governments agreed to future land use, utility service, transportation and environmental coordination decisions that encompass approximately 23,000 acres in the greater Venice/South County (see Map 5, Appendix). Population, residential (housing) units, nonresidential square footage, and water supply within the JPA/ILSBA Planning Areas are discussed in Sections 7.10 and 7.11.

_________________________________________________________________________ April, 2010 22
7.0 DATA AND ANALYSIS The intent of the data and analysis section of this Work Plan is to describe the information that the City needs to provide to state planning and regulatory agencies as part of their proposed comprehensive plan amendments, particularly those that would change the Future Land Use Map (FLUM) to increase density and intensity. The City has provided the following data and analysis regarding population, housing units, and potable water for the Planning Areas and the JPA/ILSBA Areas.
The analysis below has been prepared consistent with Data and Analysis utilized in Volume II of the Comprehensive Plan. As such, the analysis has been organized into two distinct sections: (1) Citywide data and analysis, reflecting those land use designations, including planning areas, already within the City limits, and (2) JPA/ILSBA data analysis, reflecting only those lands outside the City limits with potential for voluntary annexation.
7.1 Population Methodology
A description of the methodology used to determine a population estimate for the City, as well as to determine the population projections through 2030, is provided below. This methodology is consistent with Rule 9J-5.005(2)(e), which requires that the Comprehensive Plan be based on resident and seasonal population estimates and medium-range projections as provided by the University of Florida Bureau of Economic and Business Research (BEBR).
7.2 Population Estimates & Projections
The City of Venice utilizes both resident and seasonal population estimates for planning. Estimates of resident population are used to determine the permanent population of the City that is not affected by seasonal trends. The City utilizes resident population for the majority of its calculations, particularly with regard to land use and housing provision. Estimates of seasonal population are used to determine the population of the City at peak season, taking into account Venice’s brief influx of tourists and part-time residents during the winter months. The City utilizes seasonal population when necessary to calculate the additional demand on public services resulting from this influx. When the resident population and the seasonal population are combined, this value is referred to as “functional population”.
7.3 Resident Population
For the purposes of this analysis, the estimated resident population of the City of Venice in the year 2008 was sourced from the University of Florida’s Bureau of Economic and Business Research (BEBR). Population projections for years 2010 through 2030 are based on BEBR “medium” range projections for Sarasota County, Florida [Projections of Florida Population by County, 2008-2035, FPS Volume 42, Bulletin 153, March 2009]. A percentage of 5.6% was applied to the “medium” projections for Sarasota County to determine the projected population for the City of Venice for years 2010 through 2030. This percentage (5.6%) represents the City of Venice’s estimated share of Sarasota County’s population (total population inclusive of incorporated areas) for the year 2008 as determined by BEBR.
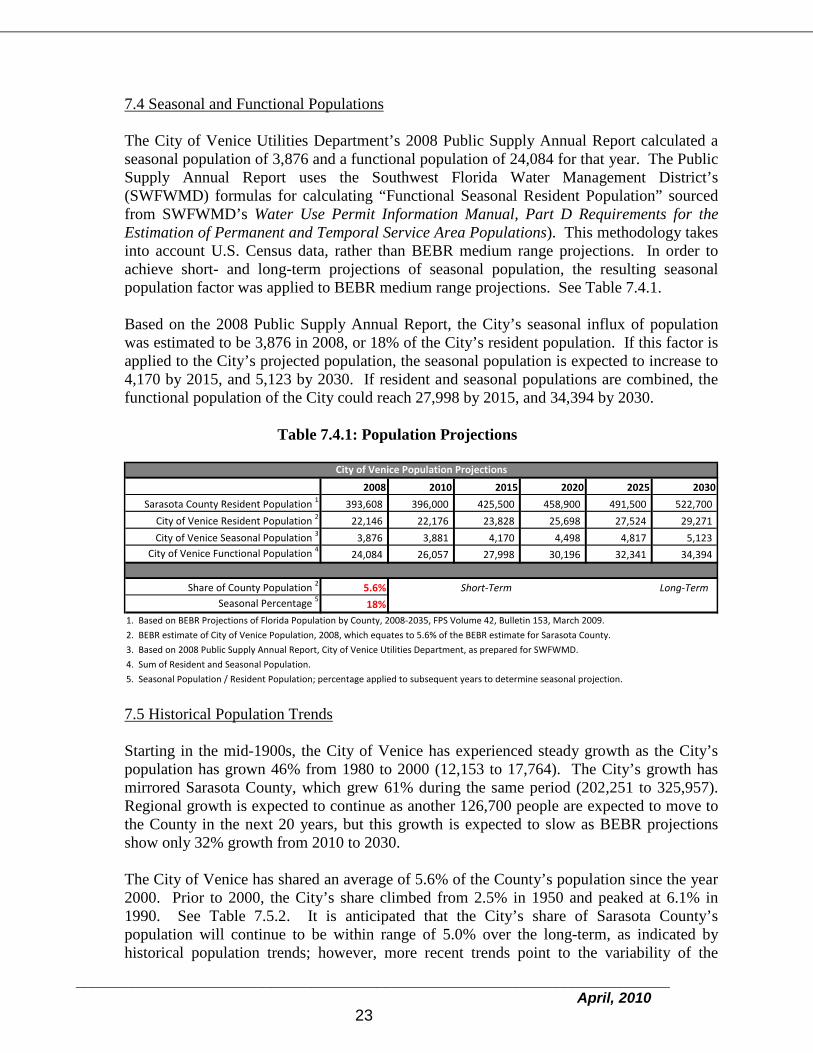
_________________________________________________________________________ April, 2010 23
7.4 Seasonal and Functional Populations
The City of Venice Utilities Department’s 2008 Public Supply Annual Report calculated a seasonal population of 3,876 and a functional population of 24,084 for that year. The Public Supply Annual Report uses the Southwest Florida Water Management District’s (SWFWMD) formulas for calculating “Functional Seasonal Resident Population” sourced from SWFWMD’s Water Use Permit Information Manual, Part D Requirements for the Estimation of Permanent and Temporal Service Area Populations). This methodology takes into account U.S. Census data, rather than BEBR medium range projections. In order to achieve short- and long-term projections of seasonal population, the resulting seasonal population factor was applied to BEBR medium range projections. See Table 7.4.1.
Based on the 2008 Public Supply Annual Report, the City’s seasonal influx of population was estimated to be 3,876 in 2008, or 18% of the City’s resident population. If this factor is applied to the City’s projected population, the seasonal population is expected to increase to 4,170 by 2015, and 5,123 by 2030. If resident and seasonal populations are combined, the functional population of the City could reach 27,998 by 2015, and 34,394 by 2030.
Table 7.4.1: Population Projections
2008 2010 2015 2020 2025 2030
Sarasota County Resident Population 1 393,608 396,000 425,500 458,900 491,500 522,700
City of Venice Resident Population 2 22,146 22,176 23,828 25,698 27,524 29,271
City of Venice Seasonal Population 3 3,876 3,881 4,170 4,498 4,817 5,123 City of Venice Functional Population 4 24,084 26,057 27,998 30,196 32,341 34,394
Share of County Population 2 5.6% Short-Term Long-TermSeasonal Percentage 5 18%
1. Based on BEBR Projections of Florida Population by County, 2008-2035, FPS Volume 42, Bulletin 153, March 2009.
2. BEBR estimate of City of Venice Population, 2008, which equates to 5.6% of the BEBR estimate for Sarasota County.
3. Based on 2008 Public Supply Annual Report, City of Venice Utilities Department, as prepared for SWFWMD.
4. Sum of Resident and Seasonal Population.
5. Seasonal Population / Resident Population; percentage applied to subsequent years to determine seasonal projection.
City of Venice Population Projections
7.5 Historical Population Trends
Starting in the mid-1900s, the City of Venice has experienced steady growth as the City’s population has grown 46% from 1980 to 2000 (12,153 to 17,764). The City’s growth has mirrored Sarasota County, which grew 61% during the same period (202,251 to 325,957). Regional growth is expected to continue as another 126,700 people are expected to move to the County in the next 20 years, but this growth is expected to slow as BEBR projections show only 32% growth from 2010 to 2030.
The City of Venice has shared an average of 5.6% of the County’s population since the year 2000. Prior to 2000, the City’s share climbed from 2.5% in 1950 and peaked at 6.1% in 1990. See Table 7.5.2. It is anticipated that the City’s share of Sarasota County’s population will continue to be within range of 5.0% over the long-term, as indicated by historical population trends; however, more recent trends point to the variability of the

_________________________________________________________________________ April, 2010 24
City’s share over the short-term, as the City’s share peaked at 5.7% for the three-year period from 2005 to 2007 but dropped to 5.6% in 2008.
Table 7.5.2: Historical Population Trends
Year Sarasota County City of Venice City Share (3)
2008 (1) 393,608 22,146 5.6%
2007 (1) 387,461 22,149 5.7%
2006 (1) 379,386 21,584 5.7%
2005 (1) 367,867 20,800 5.7%
2004 (1) 358,307 20,035 5.6%
2003 (1) 348,761 19,290 5.5%
2002 (1) 339,684 18,628 5.5%
2001 (1) 334,023 18,151 5.4%2000 (1)
325,957 17,764 5.4%Average % 5.6%
1990 (2) 277,776 16,922 6.1%
1980 (2) 202,251 12,153 6.0%
1970 (2) 120,413 6,648 5.5%
1960 (2) 76,895 3,444 4.5%1950 (2)
28,827 727 2.5%Average % 4.9%
2. Based on historical decennial U.S. Census.
3. Percentage of Sarasota County population residing within the City of Venice.
Sarasota County / City of Venice Historical Population Trends
1. Based on Florida City and County Population, 2000-2009 , University of Florida Bureau of Economic and Business Research (BEBR), November 1, 2009.
7.6 Residential and Nonresidential Projections for the City of Venice (Incorporated Areas)
In order to analyze the impacts of Future Land Use Map (FLUM) designations on population, residential (housing) units, nonresidential square footage, and water supply, staff has applied the percentages of “build-out” represented by the long-term (i.e., 2030) and short-term (i.e., 2015) to achieve a 20-year and 5-year scenario.
For the City of Venice, these percentages were determined using BEBR medium range projections as cited in BEBR’s Florida Population Studies, Volume 42, Bulletin 153, published in March 2009. The City share (5.6%)1
1 City share was obtained by dividing the estimated City population (22,146) by the estimated Sarasota County population (393,608) for the year 2008, per BEBR’s Florida Population Studies, Volume 42, Bulletin 153, March 2009.
was applied to the Sarasota County projection for years 2015 and 2030 to determine the anticipated City population for these years. While the maximum allowable densities could accommodate a population of 67,718 at build-out, BEBR medium range projections indicate a citywide resident population of only 29,271, or 43% of build-out, by 2030, meaning that build-out is unlikely to occur before 2030. Moreover, the BEBR medium range population projections show that only 35% of this population is expected by 2015. When functional (resident + seasonal) population is considered, these percentages increase to approximately 51% and 41% respectively, yet still do not approach the build-out scenario.

_________________________________________________________________________ April, 2010 25
Table 7.6.1 shows the maximum residential potential allowed by the proposed future land use designations as depicted on the Future Land Use Map (FLUM) of the City of Venice Comprehensive Plan, excluding those designations which prohibit residential use. Population Based on maximum allowable density, the City’s population could reach 67,718 at build-out; however, a functional population of only 34,394 is expected by 2030 and only 27,998 is expected by 2015 if BEBR medium range projections are considered. Approximately 31% of the population is expected to reside in the planning areas, and the other 69% is expected to reside in other future land use designations. Nearly 66% of the population will reside in low density and medium density residential land use designations, which continue to occupy 53% of the City’s land area predominately west of I-75. It is anticipated that twenty percent (20%) of the City’s population will reside in planning areas east of I-75. Residential (Housing) Units Based on the maximum allowable density, a total of 37,005 housing units could be developed at build-out; however, only 18,795 are expected by 2030, and only 15,299 are expected by 2015. For comparison, the U.S. Census 2000 estimated that the City of Venice had approximately 13,638 units, of which only 9,766 were occupied. In contrast, the 2008 American Community Survey’s estimates showed approximately 17,280 units, of which only 11,402 were occupied. Based on these estimates, the number of housing units in the short-term could be higher, depending on fluctuations in the housing market.

_________________________________________________________________________ April, 2010 26
Tab
le 7
.6.1
Gro
ss
Acre
age
(2)
Suba
rea
Gro
ss
Acre
age
per
Suba
rea
% o
f Gro
ss
Acre
age
Allo
wab
le fo
r R
esid
entia
l
Acr
eage
Al
low
able
for
Res
iden
tial
Com
preh
ensi
ve
Plan
Max
imum
Al
low
able
Den
sity
(3
) (du/
acre
)
Tot
al
Hou
sing
Uni
ts
@ B
uild
-Out
(4
)
Tot
al
Popu
latio
n @
B
uild
-Out
(5)
Tot
al
Hou
sing
U
nits
by
2030
(6
)
Tot
al
Popu
latio
n b
y 20
30 (6
)
Tota
l H
ousi
ng
Uni
ts b
y 20
15 (7
)
Tota
l Po
pula
tion
by
2015
(7)
- Lo
w D
ensi
ty R
esid
entia
l2,
378.
98 -
2,37
8.98
100%
2,37
8.98
5
11,8
95
21,
768
6,0
41
11,
056
4
,918
9
,000
- M
ediu
m D
ensi
ty R
esid
entia
l95
1.69
- 95
1.69
100%
95
1.69
13
12,3
72
22,
641
6,2
84
11,
499
5
,115
9
,361
- H
igh
Den
sity
Res
iden
tial
33.5
2 -
33.5
285
%
28.
49
18
513
9
39
2
60
477
21
2
388
- M
ixed
-Use
Res
iden
tial
0.6
- 0.
6065
%
0
.39
18
7
13
4
7
3
5
- C
omm
erci
al12
7.77
- 12
7.77
25%
3
1.94
13
4
15
760
211
3
86
172
3
14
- In
stitu
tiona
l Pro
fess
iona
l87
.53
- 87
.53
25%
2
1.88
9
1
97
360
100
1
83
81
1
49
3,58
0.09
3,58
0.09
3,41
3.38
25,3
99
46
,480
12
,900
23,6
07
10,5
01
19,2
17
Sub
area
156
.56
90%
50.9
0
18
916
1
,677
465
8
52
379
6
93
Sub
area
211
.58
90%
10.4
3
18
188
343
95
1
74
78
1
42
BH
erita
ge P
ark
59.4
1
-
59.4
1
90
%53
.47
1896
2
1,7
61
4
89
895
39
8
728
CSo
uthe
rn G
atew
ay76
.88
- 76
.88
25%
19.2
2
13
250
457
127
2
32
103
1
89
DIs
land
Pro
fess
iona
l83
.38
- 83
.38
20%
16.6
8
18
300
549
152
2
79
124
2
27
EC
ity C
ente
r75
.65
- 75
.65
20%
15.1
3
18
272
498
138
2
53
113
2
06
FN
orth
ern
Gat
eway
33.1
6
-
33.1
6
20
%6.
63
1811
9
2
18
61
111
4
9
9
0
GSe
aboa
rd26
2.92
-
262.
92
20%
52.5
8
18
947
1
,732
481
8
80
391
7
16
HEa
ster
n G
atew
ay16
3.73
-
163.
73
25%
40.9
3
7
287
524
146
2
66
118
2
17
ISo
uth
Laur
el91
1.15
-
911.
15
65%
592.
25
63,
553
6,5
03
1,8
05
3
,303
1,46
9
2
,689
JSh
aket
t Cre
ek39
.78
- 39
.78
40%
15.9
1
18
286
524
145
2
66
118
2
17
Sub
area
113
6.09
65
%88
.46
131,
150
2,1
04
5
84
1
,069
47
5
870
Sub
area
240
6.61
65
%26
4.30
8
2,11
4
3
,869
1
,074
1,9
65
874
1,6
00
Sub
area
31.
98
65
%1.
29
1823
42
12
22
1
0
1
8
Sub
area
472
.97
25%
18.2
4
13
237
434
120
2
20
98
1
79
LG
ene
Gre
en28
5.99
-
285.
99
0%-
-
- -
-
-
-
-
2,67
7.84
2,67
7.84
1,24
6.41
11,6
06
21
,238
5,
894
10,7
87
4,79
8
8,78
1
Tota
l6,
257.
93
6,
257.
93
4,
659.
79
37
,005
67,7
18
18,7
95
34
,394
15
,299
27
,998
(1) D
esign
ation
s as i
denti
fied o
n the
Futu
re La
nd U
se M
ap (F
LUM)
and w
ithin
the O
bjecti
ve 13
and O
bjecti
ve 15
polic
y ser
ies of
the C
ompr
ehen
sive P
lan; e
xclud
es th
ose d
esign
ation
s whic
h pro
hibit r
eside
ntial
use.
(2) G
ross
acre
age o
f par
cels.
(3) C
ompr
ehen
sive P
lan m
axim
um al
lowab
le de
nsity
base
d on g
ross
acre
age p
er ar
ea, o
r sub
-are
a whe
re ap
plica
ble.
(4) B
ased
upon
max
imum
allow
able
dens
ity; s
ee (3
). (5
) Anti
cipate
d pop
ulatio
n by m
ultipl
ying a
nticip
ated d
wellin
g unit
s by 1
.83 pe
rsons
per h
ouse
hold.
Subt
otal
(6) F
ifty-o
ne pe
rcent
(51%
) of b
uild-
out s
cena
rio ba
sed o
n BEB
R me
dium
rang
e pro
jectio
ns, F
PS, V
olume
42, B
ulleti
n 153
, Mar
ch 20
09; 5
.6% (C
ity of
Ven
ice )
shar
e of S
aras
ota C
ounty
2030
popu
lation
equiv
alent
to 29
,271;
City
of Ve
nice f
uncti
onal
popu
lation
equiv
alent
to 34
,394.
(7) E
ighy-o
ne pe
rcent
(81%
) of 2
030 s
cena
rio ba
sed o
n BEB
R me
dium
rang
e pro
jectio
ns, F
PS, V
olume
42, B
ulleti
n 153
, Mar
ch 20
09; 5
.6% (C
ity of
Ven
ice )
shar
e of S
aras
ota C
ounty
2015
popu
lation
equiv
alent
to 23
,828;
City
of Ve
nice f
uncti
onal
popu
lation
equiv
alent
to 27
,998.
ATa
rpon
Cen
ter/E
spla
nade
68.1
4
KKn
ight
s Tr
ail
617.
65
City
wid
e Po
tent
ial R
esid
entia
l Im
pact
Bui
ld-O
utLo
ng-T
erm
(203
0)Sh
ort-T
erm
(201
5)
Futu
re L
and
Use
Des
igna
tion (1
)
Subt
otal

_________________________________________________________________________ April, 2010 27
Nonresidential Square Footage
Based on the maximum allowable density and the conversion factor, or floor area ratio where residential use is prohibited, a potential of 72,159,264 square feet of nonresidential use could be developed at build-out; however, only 36,649,553 are expected by 2030, and only 29,834,105 are expected by 2015. Approximately 71% of the potential square footage could be developed within the planning areas and the other 29% could be developed in other future land use designations. Over half (57%) of the potential is in the Seaboard planning area and Industrial and Industrial-Commercial future land use designations. Table 7.6.2 shows the maximum nonresidential potential allowed by the proposed future land use designations as depicted on the Future Land Use Map (FLUM), excluding those designations which prohibit nonresidential use.

_________________________________________________________________________ April, 2010 28
T
able
7.6
.2
Gro
ss
Acr
eage
Su
bare
a
Gro
ss
Acr
eage
pe
r Su
bare
a
% o
f Gro
ss
Acr
eage
A
llow
able
N
onre
side
ntia
l Re
side
ntia
l
Gro
ss A
crea
ge
Allo
wab
le fo
r N
onre
side
ntia
l
Max
imum
A
llow
able
Den
sity
(2)
(du/
acre
)
Conv
ersi
on
Fact
or (2
) or
Floo
r A
rea
Ratio
(FA
R)
Tot
al S
quar
e Fo
otag
e To
tal S
quar
e
Foot
age
(3)
Tota
l Squ
are
Foot
age
(4)
- H
igh
Den
sity
Res
iden
tial
33.5
2 -
33.5
215
%5.
03
18
4,00
0
36
2,01
6
183,
867
149,
675
- M
ixed
-Use
Res
iden
tial
0.6
- 0.
6035
%0.
21
18
4,00
0
15
,120
7,67
9
6,25
1
- Co
mm
erci
al12
7.77
- 12
7.77
75%
95.8
3
13
2,00
0
2,
491,
515
1,26
5,43
6
1,
030,
112
- In
stitu
tiona
l Pro
fess
iona
l87
.53
- 87
.53
75%
65.6
5
9
2,00
0
1,
181,
655
600,
160
488,
553
- In
dust
rial
173.
78
- 17
3.78
10
0%17
3.78
0
2.0
15,1
39,4
44
7,68
9,29
5
6,
259,
373
- In
dust
rial
-Com
mer
cial
124.
42
- 12
4.42
10
0%12
4.42
0
2.0
10,8
39,2
87
5,50
5,25
4
4,
481,
482
547.
61
54
7.61
464.
91
30,0
29,0
37
15,2
51,6
91
12,4
15,4
46
Suba
rea
156
.56
10
%5.
66
18
4,00
0
40
7,20
5
206,
818
168,
358
Suba
rea
211
.58
10
%1.
16
18
4,00
0
83
,403
42,3
60
34
,483
BH
erita
ge P
ark
59.4
1
- 59
.41
10
%5.
94
18
4,00
0
42
7,75
2
217,
254
176,
853
CSo
uthe
rn G
atew
ay76
.88
-
76.8
8
75%
57.6
6
13
2,00
0
1,
499,
160
761,
421
619,
825
DIs
land
Pro
fess
iona
l83
.38
-
83.3
8
80%
66.7
0
18
4,00
0
4,
802,
688
2,43
9,27
6
1,
985,
662
ECi
ty C
ente
r75
.65
-
75.6
5
80%
60.5
2
18
4,00
0
4,
357,
440
2,21
3,13
6
1,
801,
575
FN
orth
ern
Gat
eway
33.1
6
- 33
.16
80
%26
.53
184,
000
1,91
0,01
6
97
0,09
4
78
9,69
2
GSe
aboa
rd26
2.92
-
262.
92
80%
210.
34
184,
000
15,1
44,1
92
7,69
1,70
6
6,
261,
336
HEa
ster
n G
atew
ay16
3.73
-
163.
73
75%
122.
80
72,
000
1,71
9,16
5
87
3,16
1
71
0,78
5
ISo
uth
Laur
el91
1.15
-
911.
15
35%
318.
90
62,
000
3,82
6,83
0
1,
943,
640
1,58
2,19
5
JSh
aket
t Cre
ek39
.78
-
39.7
8
60%
23.8
7
18
4,00
0
1,
718,
388
872,
766
710,
464
Suba
rea
113
6.09
35
%47
.63
132,
000
1,23
8,39
5
62
8,97
8
51
2,01
2
Su
bare
a 2
406.
61
35%
142.
31
82,
000
2,27
7,03
4
1,
156,
501
941,
435
Suba
rea
31.
98
35
%0.
69
18
4,00
0
49
,833
25,3
10
20
,603
Suba
rea
472
.97
75
%54
.73
132,
000
1,42
2,95
4
72
2,71
6
58
8,31
8
L
Gen
e G
reen
285.
99
- 28
5.99
10
0%28
5.99
-
0.1
1,24
5,77
2
63
2,72
5
51
5,06
2
2,
677.
84
2,67
7.84
1,
431.
43
42,1
30,2
27
21,3
97,8
62
17,4
18,6
59
Tota
l 3,
773.
07
3,77
3.07
1,
896.
33
72,1
59,2
64
36,6
49,5
53
29,8
34,1
05
(1) D
esig
natio
ns a
s id
entif
ied
on th
e Fu
ture
Lan
d U
se M
ap (F
LUM
) and
with
in th
e O
bjec
tive
13 a
nd O
bjec
tive
15 p
olic
y se
ries
of t
he C
ompr
ehen
sive
Pla
n; e
xclu
des
thos
e de
sign
atio
ns w
hich
pro
hibi
t res
iden
tial u
se.
Subt
otal
(2) C
ompr
ehen
sive
Pla
n m
axim
um a
llow
able
per
cent
age
of n
onre
side
ntia
l acr
eage
and
con
vers
ion
fact
or fo
r re
side
ntia
l to
nonr
esid
entia
l fro
m O
bjec
tive
13 a
nd O
bjec
tive
15 p
olic
y se
ries
. Co
nver
sion
fact
or e
quiv
alen
t to
nonr
esid
entia
l sq
uare
feet
per
res
iden
tial u
nit;
floo
r ar
ea r
atio
(F.A
.R.)
appl
ied
whe
re r
esid
entia
l use
pro
hibi
ted.
Futu
re L
and
Use
Des
igna
tion
(1)
Subt
otal
ATa
rpon
Cen
ter/
Espl
anad
e68
.14
KKn
ight
s Tr
ail
617.
65
(3) F
ifty-
one
perc
ent (
51%
) of b
uild
-out
sce
nari
o ba
sed
on B
EBR
med
ium
ran
ge p
roje
ctio
ns, F
PS, V
olum
e 42
, Bul
letin
153
, Mar
ch 2
009.
(4) E
ighy
-one
per
cent
(81%
) of 2
030
scen
ario
bas
ed o
n BE
BR m
ediu
m r
ange
pro
ject
ions
, FPS
, Vol
ume
42, B
ulle
tin 1
53, M
arch
200
9.
City
wid
e Po
tent
ial N
onre
side
ntia
l Im
pact
Long
-Ter
m (2
030)
Shor
t-Te
rm (2
015)
Build
-Out
Scen
ario
/Sta
ndar
ds (2
)

_________________________________________________________________________ April, 2010 29
7.7 Potable Water Level of Service Standard
The City of Venice has available facilities, permitted resources, and capital funding to meet the existing and projected future demand for potable water through and beyond a 10-year planning horizon. This availability is unique as many communities in the State of Florida have water capacity concerns. The success of the City is partly the result of progressive water planning education program, a water reuse program, and an aggressive capital improvements program. As a result of these programs, the City has effectively maintained its level of service standard for potable water for the past several decades.
The current Level of Service (LOS) standard for potable water is 152 gpd/ERU based on average annual flow and a peak LOS of 227 gpd/ERU based on maximum daily flow. Actual usage per equivalent residential unit has declined since 1999, from 189 gpd/ERU to 106 gpd/ERU (in 2008), meaning that the City of Venice’s LOS currently exceeds the actual demand for potable.
The current LOS standard for potable water was established in the 1999 Comprehensive Plan. The standard was based on a Capacity Analysis Report prepared by Boyle Engineering in 1994. The Capacity Analysis Report’s methodology for determining available capacity (consumption per unit) was based on Equivalent Residential Units (ERUs) and three Water Use Permit withdrawal flow limitations: average annual flow, maximum monthly flow and maximum daily follow.
Average annual flow was determined to be the limiting factor for determining the LOS to be applied to calculating available capacity for future development. Moreover, ERUs were chosen as the measuring unit for the LOS instead of population, which was used in 1989. This change was made because ERUs provide a more accurate measure of the number of connections to the City’s potable water system.
Table 7.7.1 shows the water demand projections prepared by Boyle Engineering in 1994 and the average demand (gpd/ERU) adopted by the City as the LOS standard for potable water in 1999.
Table 7.7.1: 1994 Average & Peak Demand Projections as
Level of Service (LOS) Standard for Potable Water
YearResident
Population 1Functional
Popualtion 1Number of
ERUs 3Average
Flow (MGD) 2
Average Demand
(gpd/ERU)
Peak Demand (MGD) 4
Peak Demand
(gpd/ERU)1995 18,450 25,299 14,528 2.21 152 3.30 2272000 21,246 29,144 16,729 2.54 152 3.80 2272005 22,556 30,941 17,524 2.66 152 3.98 2272010 23,056 31,579 18,152 2.76 152 4.12 227
Source: Boyle Engineering Corporation, 1994 - Capacity Analysis Report1. University of Florida BEBR, 19942. Adjusted to account for water lost to Venice Gardens Utilities System (1994 Average Flow)3. Total Equivalent Residential Units (ERUs) represents the number of connections to the City's potable water system expressed in terms of residential units. ERUs are independent of seasonal population variation (functional versus resident population).4. Peak demand is based on maximum daily flow that occurred at the WTP for the referenced year.

_________________________________________________________________________ April, 2010 30
Since actual usage has declined since 1999, the City is in a position to reevaluate the LOS standard to more accurately align the City’s service provision with actual demand for potable water. Consequently, the City intends to reevaluate the LOS standard for potable water as part of the update to the City’s Water Master Plan.
7.8 Potable Water Concurrency Management
The City has a Concurrency Management Ordinance (CMO) that requires development orders to be evaluated according to the City’s ability to provide public services and infrastructure capacity to the site. The CMO ensures that there is adequate public supply and quality facilities available to address the development and its future needs. The City of Venice Code of Ordinances, Chapter 94, Article 2, Section 94-35, Minimum Requirements for Concurrency, requires that adequate capacity is available before development and the issuance of a certificate of occupancy. The Code of Ordinances states:
In order to obtain a certificate of concurrency, it must be established that level of service standards can be met for all public facilities and services according to one of the following conditions:
(1) Wastewater, solid waste, drainage, and potable water facilities.
a. A development order or permit is issued subject to the condition that, at the time of the issuance of a certificate of occupancy or its functional equivalent, the necessary facilities and services are in place and available to serve the new development; or
b. At the time the development order or permit is issued, the necessary facilities and services are guaranteed in an enforceable development agreement, pursuant to F.S. 163.3220, or an agreement or development order issued pursuant to F.S. ch. 380, to be in place and available to serve the new development at the time of the issuance of a certificate of occupancy or its functional equivalent.
7.9 Potable Water Projections for the Planning Areas (Incorporated Areas
)
The City of Venice water production division has treatment capacity of 4.49 million gallons per day. This capacity is provided using a combination of 14 production wells. These wells pump brackish or slightly salty water from the intermediate aquifer located approximately 300 to 400 feet underground. The water is treated using the reverse osmosis process. The City delivers 2.8 million gallons of potable water each day during the peak season, which runs from December through March. The methodology used to determine the impact on potable water capacity is established by multiplying the level of service (LOS) standard by the number of Equivalent Residential Units (ERUs) allowed in each planning area. The number of ERUs allowed in each planning area was calculated using the following conversion factors provided by the City of Venice Utilities Department:
1 unit of residential (e.g., dwelling unit) = 1.00 ERU 1,000 square feet of nonresidential = 0.45 ERU

_________________________________________________________________________ April, 2010 31
The City of Venice Utilities Department maintains a LOS of 152 gpd/ERU for average annual flow and 227 gpd/ERU for maximum daily flow. The projected potable water demand at build-out for each planning area was calculated based on the maximum allowable density for each planning area, and projected demand for the long term (i.e., 2030) and short-term (i.e., 2015) was calculated based on the percentages of build-out applied in Table 7.6.1 and Table 7.6.2. Table 7.9.1 shows these calculations. The potable water demand of the planning areas will have an impact on the City’s water distribution system and could compromise the City’s LOS prior to 2030, the horizon of the Comprehensive Plan. If the planning areas reach build-out, the City will exceed its treatment capacity by 0.11 based on average annual flow and by 0.23 mgd based on maximum daily flow. Table 7.9.2 shows these calculations. The City has a Water Use Permit (WUP) from the Southwest Florida Water Management District (SWFWMD) for an average supply of 6.8 mgd and peak supply of 8.2 mgd. The permitted supply is expected to be adequate through the short-term and long-term. If the planning areas reach build-out, the City could exceed its permitted average supply by 0.53 mgd.

_________________________________________________________________________ April, 2010 32
Tab
le 7
.9.1
Plan
ning
Ar
eaLo
catio
nSu
bare
aR
esid
entia
l ER
Us
1
Non
res.
Sq
uare
Fee
t by
Bui
ldou
t 2
Non
res.
ER
Us
3To
tal
ERU
s 4
Pote
ntia
l D
eman
d (A
vera
ge
Annu
al F
low
) 5
Pote
ntia
l D
eman
d (M
axim
um
Dai
ly F
low
) 5
Res
iden
tial
ERU
s
Non
res.
Sq
uare
Fee
t by
203
0 1
Non
res.
ER
Us
2To
tal
ERU
s
Pote
ntia
l D
eman
d (A
vera
ge
Annu
al F
low
) 3
Pote
ntia
l D
eman
d (M
axim
um D
aily
Fl
ow) 3
Res
iden
tial
ERU
s
Non
res.
Sq
uare
Fee
t by
201
5 1
Non
res.
ER
Us
2To
tal
ERU
s
Pote
ntia
l D
eman
d (A
vera
ge
Annu
al F
low
) 3
Pote
ntia
l D
eman
d (M
axim
um
Dai
ly F
low
) 3
Sub
area
191
6
40
7,20
5
18
3
1,
099
0.
17
0.25
465
20
6,81
8
93
558
0.08
0.
13
379
16
8,35
8
76
45
5
0.07
0.
10
Sub
area
218
8
83
,403
38
22
5
0.
03
0.05
95
42
,360
19
114
0.02
0.
03
78
34
,483
16
93
0.01
0.
02
BH
erita
ge P
ark
- 96
2
42
7,75
2
19
2
1,
155
0.
18
0.26
489
21
7,25
4
98
587
0.09
0.
13
398
17
6,85
3
80
47
8
0.07
0.
11
CS
outh
ern
Gat
eway
- 25
0
1,
499,
160
67
5
92
4
0.
14
0.21
127
76
1,42
1
34
3
470
0.07
0.
11
103
61
9,82
5
27
9
38
2
0.06
0.
09
DIs
land
Pro
fess
iona
l -
300
4,80
2,68
8
2,16
1
2,46
1
0.37
0.
56
15
2
2,43
9,27
6
1,09
8
1,
250
0.
19
0.28
12
4
1,98
5,66
2
894
1,01
8
0.
15
0.23
E
City
Cen
ter
- 27
2
4,
357,
440
1,
961
2,
233
0.
34
0.51
138
2,
213,
136
99
6
1,13
4
0.17
0.
26
113
1,
801,
575
81
1
92
3
0.14
0.
21
FN
orth
ern
Gat
eway
- 11
9
1,
910,
016
86
0
97
9
0.
15
0.22
61
97
0,09
4
43
7
497
0.08
0.
11
49
78
9,69
2
35
5
40
5
0.06
0.
09
GS
eabo
ard
- 94
7
15
,144
,192
6,81
5
7,76
1
1.18
1.
76
48
1
7,69
1,70
6
3,46
1
3,
942
0.
60
0.89
39
1
6,26
1,33
6
2,81
8
3,20
9
0.
49
0.73
H
Eas
tern
Gat
eway
- 28
7
1,
719,
165
77
4
1,
060
0.
16
0.24
146
87
3,16
1
39
3
538
0.08
0.
12
118
71
0,78
5
32
0
43
8
0.07
0.
10
IS
outh
Lau
rel
- 3,
553
3,
826,
830
1,
722
5,
276
0.
80
1.20
1,80
5
1,
943,
640
87
5
2,67
9
0.41
0.
61
1,46
9
1,
582,
195
71
2
2,
181
0.33
0.
50
JS
hake
tt C
reek
- 28
6
1,
718,
388
77
3
1,
060
0.
16
0.24
145
87
2,76
6
39
3
538
0.08
0.
12
118
71
0,46
4
32
0
43
8
0.07
0.
10
Sub
area
11,
150
1,
238,
395
55
7
1,
707
0.
26
0.39
584
62
8,97
8
28
3
867
0.13
0.
20
475
51
2,01
2
23
0
70
6
0.11
0.
16
Sub
area
22,
114
2,
277,
034
1,
025
3,
139
0.
48
0.71
1,07
4
1,
156,
501
52
0
1,59
4
0.24
0.
36
874
94
1,43
5
42
4
1,
298
0.20
0.
29
Sub
area
323
49,8
33
22
46
0.01
0.
01
12
25,3
10
11
23
0.
00
0.01
10
20,6
03
9
19
0.00
0.
00
Sub
area
423
7
1,
422,
954
64
0
87
7
0.
13
0.20
120
72
2,71
6
32
5
446
0.07
0.
10
98
58
8,31
8
26
5
36
3
0.06
0.
08
LG
ene
Gre
en -
-
1,
245,
772
56
1
56
1
0.
09
0.13
-
63
2,72
5
28
5
285
0.04
0.
06
-
515,
062
232
232
0.
04
0.05
11
,606
42,1
30,2
27
18
,959
30,5
64
4.
65
6.94
5,89
4
21
,397
,862
9,62
9
15
,523
2.36
3.
52
4,79
8
17
,418
,659
7,83
8
12,6
37
1.92
2.
87
Notes
:ER
Ussq
. ft.
ERUs
ERUs
mgd
mgd
ERUs
sq. f
t.ER
UsER
Usm
gdm
gdER
Ussq
. ft.
ERUs
ERUs
mgd
mgd
1: Co
mpre
hens
ive P
lan m
axim
um al
lowab
le de
nsity
base
d on g
ross
acre
age p
er ar
ea, o
r sub
-are
a whe
re ap
plica
ble; a
djuste
d for
BEB
R pr
ojecti
ons,
FPS,
Volu
me 42
, Bull
etin 1
53, M
arch
2009
.
Plan
ning
Are
a Po
tent
ial P
otab
le W
ater
Dem
and
Bui
ld-O
utLo
ng-T
erm
(203
0)
5: Th
e pote
ntial
dema
nd w
as ba
sed u
pon 1
52 gp
d/ERU
, the C
ity's
level
of se
rvice
(LOS
) for
potab
le wa
ter av
erag
e ann
ual fl
ow, a
nd 22
7 gpd
/ERU
, the C
ity's
LOS
for po
table
water
max
imum
daily
flow.
ATa
rpon
Cen
ter/E
spla
nade
KK
nigh
ts T
rail
Shor
t-Ter
m (2
015)
Tota
l
2: Co
mpre
hens
ive P
lan no
nres
identi
al sq
uare
foota
ge ba
sed o
n gro
ss ac
reag
e per
area
, or s
ub-a
rea w
here
appli
cable
; adju
sted f
or B
EBR
proje
ction
s, FP
S, V
olume
42, B
ulleti
n 153
, Mar
ch 20
09.
3: Fo
r non
resid
entia
l, an E
quiva
lent R
eside
ntial
Unit (
ERU)
conv
ersio
n fac
tor of
0.45
ERU
s per
1,00
0 squ
are f
eet o
f non
resid
entia
l spa
ce w
as ap
plied
. This
conv
ersio
n fac
tor is
base
d on t
he C
ity of
Ven
ice U
tilitie
s Dep
artm
ent's
aver
age E
RU va
lue fo
r offic
e (0.6
0 ERU
per 1
,000 s
q. ft.)
and c
omme
rcial/
retai
l (0.30
ERU
per 1
,000)
sq. ft
.).4:
Total
ERU
s, re
siden
tial a
nd no
nres
identi
al co
mbine
d.
Tab
le 7
.9.2
Hor
izon
Tota
l ER
Us
1
Pote
ntia
l D
eman
d (A
vera
ge
Annu
al F
low
) 2
Aver
age
Trea
tmen
t C
apac
ity
Use
d 3
Aver
age
Rem
aini
ng
Trea
tmen
t C
apac
ity 5
Pote
ntia
l D
eman
d (M
axim
um
Dai
ly F
low
) 2
Peak
Tr
eatm
ent
Cap
acity
U
sed
4
Peak
R
emai
ning
Tr
eatm
ent
Cap
acity
5
Aver
age
Rem
aini
ng
Perm
itted
Su
pply
6
Build
-Out
30,5
64
4.
65
7.33
(2.8
4)
6.94
9.
74
(5.2
5)
(0.5
3)
Long
-Ter
m (2
030)
15,5
23
2.
36
5.04
(0.5
5)
3.52
5.
16
(0.6
7)
1.76
Sh
ort-
Term
(201
5)12
,637
1.92
4.
60(0
.11)
2.
87
4.72
(0
.23)
2.
20
Notes
:ER
Usm
gdm
gdm
gdm
gdm
gdm
gdm
gd
Plan
ning
Are
as P
oten
tial P
otab
le W
ater
Impa
ct
5: Th
e City
of V
enice
Wate
r Tre
atmen
t Plan
t has
a ca
pacit
y of 4
.49 m
gd.
6: Th
e City
of V
enice
has a
perm
itted a
vera
ge su
pply
of 6,8
64,00
0 gpd
or 6.
8 mgd
(Sou
thwes
t Flor
ida W
ater M
anag
emen
t Dist
rict, W
UP N
o. 53
596)
.
1: To
tal E
RUs,
resid
entia
l and
nonr
eside
ntial
comb
ined.
3: Th
e yea
rly av
erag
e usa
ge is
2.68
mgd
.4:
The y
early
peak
usag
e is 2
.8 mg
d. T
he pe
ak m
onths
of us
age a
re D
ecem
ber -
Mar
ch.
2: Th
e pote
ntial
dema
nd w
as ba
sed u
pon 1
52 gp
d/ERU
, the C
ity's
level
of se
rvice
(LOS
) for
potab
le wa
ter av
erag
e ann
ual fl
ow, a
nd 22
7 gpd
/ERU
, the C
ity's
LOS
for po
table
water
max
imum
daily
flow.

_________________________________________________________________________ April, 2010 33
7.10 Residential and Nonresidential Projections for the JPA/ILSBA Planning Areas (Potential Voluntary Annexation Areas)
In order to analyze the impacts of the JPA/ILSBA areas on population, residential (housing) units, nonresidential square footage, and water supply, staff has applied the percentage of “build-out” represented by the long-term (i.e., 2030) and short-term (i.e., 2015) to achieve a 20-year and 5-year scenario. For the JPA/ILSBA areas, this percentage was determined using BEBR medium range projections as cited in BEBR’s Florida Population Studies, Volume 42, Bulletin 153, published in March 2009; however, because these areas are not yet annexed into the City of Venice and therefore cannot be based on the City share, projected growth rates were applied to existing housing units. Based on BEBR projections, Sarasota County is expected to grow 7% by 2015 and 32% by 2030. Table 7.10.1 shows the maximum residential potential allowed in each JPA/ILSBA area as defined within the Objective 18 policy series of the City of Venice Comprehensive Plan. Population Based on maximum allowable density, the population of the JPA/ILSBA areas could reach 17,761 at build-out; however, based on the projected growth rate for Sarasota County, only 8% of that population is expected by 2030. Although the Border Road to Myakka Corridor can accommodate the most population at build-out (4,982), the South Venice Avenue Corridor is expected to accommodate the most population in the short-term (431), or 39% of the short-term potential population of the JPA/ILSBA areas combined. Residential (Housing) Units Based on maximum allowable density, a total of 9,706 housing units could be developed at build-out; however, only 744 are expected by 2030 and only 603 are expected by 2015 if BEBR medium range projections are taken into consideration.

_________________________________________________________________________ April, 2010 34
Tab
le 7
.10.
1
2010
JPA
Area
Lo
catio
n (1)
Gro
ss
Acre
age
(1)
Suba
rea
Gro
ss
Acre
age
per
Suba
rea
% o
f Gro
ss
Acre
age
Allo
wab
le fo
r R
esid
entia
l
Acr
eage
Al
low
able
for
Res
iden
tial
Com
preh
ensi
ve
Plan
Max
imum
Al
low
able
Den
sity
(2
) (du/
acre
)
Tota
l H
ousi
ng
Uni
ts @
B
uild
-Out
(3)
Tota
l Po
pula
tion
@ B
uild
-O
ut (4
)
Exis
ting
Hou
sing
U
nits
(5)
Tota
l H
ousi
ng
Uni
ts b
y 20
30 (6
)
Tota
l Po
pula
tion
by
203
0 (6)
Tota
l H
ousi
ng
Uni
ts b
y 20
15 (7
)
Tota
l Po
pula
tion
by 2
015
(7)
Sub
area
134
6.84
173.
42
91,
561
2,85
6
1
1
2
1
2
Sub
area
214
1.66
70.8
3
5
354
64
8
15
20
36
16
29
Sub
area
144
.03
39
.63
311
9
218
-
-
-
-
-
Sub
area
273
.97
66
.57
320
0
365
5
7
12
5
10
Sub
area
358
.10
52
.29
315
7
287
9
12
22
10
18
Sub
area
192
.96
46
.48
941
8
766
1
1
2
1
2
Sub
area
233
.33
16
.67
1321
7
396
5
7
12
5
10
Sub
area
349
.11
24
.56
1844
2
809
5
7
12
5
10
Sub
area
149
0.23
465.
72
52,
329
4,26
1
1
1
2
1
2
Sub
area
213
8.27
131.
36
339
4
721
30
40
72
32
59
4Ve
netia
n G
olf a
nd R
iver
Clu
b Ar
ea
(Ven
ice
Mya
kka
Riv
er)
52.0
0
- 52
.00
10
0%52
.00
0.2
10
19
4
5
10
4
8
5So
uth
Veni
ce A
venu
e C
orrid
or
(Sou
th V
enic
e Av
enue
Mix
ed U
se
Nei
ghbo
rhoo
d)23
8.70
- 23
8.70
67%
159.
93
71,
120
2,04
9
22
0
290
53
1
235
43
1
Sub
area
113
4.85
67%
90.3
5
8
723
1,
323
11
15
27
12
22
Sub
area
212
7.68
50%
63.8
4
8
511
93
5
2
3
5
2
4
Sub
area
333
.17
0%
-
8-
-
-
-
-
-
-
7Pi
nebr
ook
Roa
d Ar
ea23
1.70
- 23
1.70
100%
231.
70
369
5
1,27
2
30
40
72
32
59
8Au
burn
Roa
d to
Cur
ry C
reek
25.2
0
- 25
.20
10
0%25
.20
512
6
231
2
3
5
2
4
9 (a
)(A
) Jac
aran
da B
oule
vard
(B
orde
r Jac
aran
da)
306.
70
-
306.
70
90
%27
6.03
0.
255
10
1
50
66
12
1
54
98
9 (b
)(B
) Bor
der R
oad
to C
urry
Cre
ek
551.
40
-
551.
40
10
0%55
1.40
0.
211
0
202
65
86
157
70
127
10La
urel
Oak
s 24
9.90
- 24
9.90
100%
249.
90
0.2
50
91
17
22
41
18
33
11G
ulf C
oast
Bou
leva
rd E
ncla
ve33
.00
-
33.0
0
100%
33.0
0
3.
511
6
211
91
12
0
220
97
178
3,45
2.80
3,
452.
80
2,82
0.86
9,70
6
17,7
61
564
744
1,
362
60
3
1,
104
(1) J
oint P
lannin
g and
Inter
local
Servi
ce B
ound
ary A
gree
ment
betw
een t
he C
ity of
Ven
ice an
d Sar
asota
Cou
nty, J
anua
ry 9,
2007
: 6(c)
“Agr
eeme
nts on
Par
cels”
, p. 7
-11
(2) C
ompr
ehen
sive P
lan m
axim
um al
lowab
le de
nsity
base
d on g
ross
acre
age p
er ar
ea, o
r sub
-are
a whe
re ap
plica
ble.
(3) B
ased
upon
max
imum
allow
able
dens
ity; s
ee (2
). (4
) Anti
cipate
d pop
ulatio
n by m
ultipl
ying a
nticip
ated d
wellin
g unit
s by 1
.83 pe
rsons
per h
ouse
hold.
(5
) App
roxim
ate nu
mber
of ho
using
units
base
d on a
erial
surve
y. (6
) Bas
ed on
BEB
R po
pulat
ion pr
ojecti
ons,
FPS,
Volu
me 42
, Bull
etin 1
53, M
arch
2009
, indic
ating
32%
grow
th fro
m 20
10 to
2030
. (7
) Bas
ed on
BEB
R po
pulat
ion pr
ojecti
ons,
FPS,
Volu
me 42
, Bull
etin 1
53, M
arch
2009
, indic
ating
7% gr
owth
from
2010
to 20
15.
Scen
ario
/Sta
ndar
ds
6La
urel
Roa
d29
5.70
50%
90%
50%
95%JP
A / I
LSB
A Po
tent
ial R
esid
entia
l Im
pact
2(b)
I-75
to J
acar
anda
Bou
leva
rd17
5.40
3Bo
rder
Roa
d to
Mya
kka
Cor
ridor
628.
50
1Kn
ight
s Tr
ail P
ark
Area
(R
ustic
Roa
d)48
8.50
2(a)
Aubu
rn R
oad
to I-
7517
6.10
Bui
ld-O
utLo
ng-T
erm
(203
0)Sh
ort-T
erm
(201
5)

_________________________________________________________________________ April, 2010 35
Nonresidential Square Footage Based on the maximum allowable density and the nonresidential conversion factor, or floor area ratio where residential use is prohibited, a potential 10,147,512 square feet of nonresidential uses could be developed at build-out; however, only 3,247,204 square feet are expected by 2030, and only 710,326 square feet are expected by 2015. The majority (38%) of the potential nonresidential square footage is allowed in the Knights Trail Park Area (Rustic Road). Table 7.10.2 shows the maximum nonresidential potential allowed in each JPA/ILSBA area as defined within the Objective 18 policy series of the City of Venice Comprehensive Plan.

_________________________________________________________________________ April, 2010 36
Bui
ld-O
utLo
ng-T
erm
(203
0)Sh
ort-T
erm
(201
5)
JPA
Area
Lo
catio
n (1)
Gro
ss
Acre
age
Suba
rea
Gro
ss
Acre
age
per
Suba
rea
% o
f Gro
ss
Acre
age
Allo
wab
le
Non
resi
dent
ial
Res
iden
tial
Gro
ss A
crea
ge
Allo
wab
le fo
r N
onre
side
ntia
l
Max
imum
Al
low
able
D
ensi
ty (2
)
(du/
acre
)
Con
vers
ion
Fact
or
(non
res.
sq.
ft.
per
uni
t)
Tota
l Squ
are
Foot
age
Tota
l Squ
are
Foot
age
(3)
Tota
l Squ
are
Foot
age
(4)
Sub
area
134
6.84
173.
42
9
2,00
0
3,
121,
560
99
8,89
9
218,
509
Sub
area
214
1.66
70.8
3
52,
000
708,
300
226,
656
49
,581
Sub
area
144
.03
4.
40
3
4,00
0
52
,836
16
,908
3,69
9
Sub
area
273
.97
7.
40
3
4,00
0
88
,764
28
,404
6,21
3
Sub
area
358
.10
5.
81
3
4,00
0
69
,720
22
,310
4,88
0
Sub
area
192
.96
46
.48
9
2,00
0
83
6,64
0
26
7,72
5
58,5
65
Sub
area
233
.33
16
.67
13
2,00
0
43
3,29
0
13
8,65
3
30,3
30
Sub
area
349
.11
24
.56
18
2,00
0
88
3,98
0
28
2,87
4
61,8
79
Sub
area
149
0.23
24.5
1
54,
000
490,
230
156,
874
34
,316
Sub
area
213
8.27
6.91
34,
000
82,9
62
26,5
48
5,
807
4Ve
netia
n G
olf a
nd R
iver
Clu
b Ar
ea
(Ven
ice
Mya
kka
Riv
er)
52.0
0
- 52
.00
0%
-
0.
2-
-
-
-
5So
uth
Veni
ce A
venu
e C
orrid
or
(Sou
th V
enic
e Av
enue
Mix
ed U
se
Nei
ghbo
rhoo
d)23
8.70
- 23
8.70
33%
78.7
7
72,
000
1,10
2,79
4
352,
894
77
,196
Sub
area
113
4.85
33%
44.5
0
82,
000
712,
019
227,
846
49
,841
Sub
area
212
7.68
50%
63.8
4
82,
000
1,02
1,41
7
326,
853
71
,499
Sub
area
333
.17
10
0%33
.17
8
2,00
0
53
0,73
2
16
9,83
4
37,1
51
7Pi
nebr
ook
Roa
d Ar
ea23
1.70
- 23
1.70
0%-
3-
-
-
-
8Au
burn
Roa
d to
Cur
ry C
reek
25.2
0
- 25
.20
0%
-
5
-
-
-
-
9 (a
)(A
) Jac
aran
da B
oule
vard
(B
orde
r Jac
aran
da)
306.
70
-
306.
70
10
%30
.67
0.
22,
000
12,2
68
3,92
6
85
9
9 (b
)(B
) Bor
der R
oad
to C
urry
Cre
ek
551.
40
-
551.
40
0%
-
0.
2-
-
-
-
10La
urel
Oak
s 24
9.90
- 24
9.90
0%-
0.2
-
-
-
-
11G
ulf C
oast
Bou
leva
rd E
ncla
ve33
.00
-
33.0
0
0%-
3.5
-
-
-
-
3,45
2.80
3,
452.
80
631.
94
10
,147
,512
3,24
7,20
4
710,
326
(1) J
oint P
lannin
g and
Inter
local
Servi
ce B
ound
ary A
gree
ment
betw
een t
he C
ity of
Ven
ice an
d Sar
asota
Cou
nty, J
anua
ry 9,
2007
: 6(c)
“Agr
eeme
nts on
Par
cels”
, p. 7
-11
(2) C
ompr
ehen
sive P
lan m
axim
um al
lowab
le pe
rcenta
ge of
nonr
eside
ntial
acre
age a
nd co
nver
sion f
actor
for r
eside
ntial
to no
nres
identi
al fro
m Ob
jectiv
e 17 p
olicy
serie
s.(3
) Bas
ed on
BEB
R po
pulat
ion pr
ojecti
ons,
FPS,
Volu
me 42
, Bull
etin 1
53, M
arch
2009
, indic
ating
32%
grow
th fro
m 20
10 to
2030
. (4
) Bas
ed on
BEB
R po
pulat
ion pr
ojecti
ons,
FPS,
Volu
me 42
, Bull
etin 1
53, M
arch
2009
, indic
ating
7% gr
owth
from
2010
to 20
15.
6La
urel
Roa
d29
5.70
Scen
ario
/Sta
ndar
ds (2
)
2(b)
I-75
to J
acar
anda
Bou
leva
rd17
5.40
50%
3Bo
rder
Roa
d to
Mya
kka
Cor
ridor
628.
50
5%
1Kn
ight
s Tr
ail P
ark
Area
(R
ustic
Roa
d)48
8.50
50%
2(a)
Aubu
rn R
oad
to I-
7517
6.10
10%
JPA
/ ILS
BA
Pote
ntia
l Non
resi
dent
ial I
mpa
ct
Tab
le 7
.10.
2

_________________________________________________________________________ April, 2010 37
7.11 Potable Water Projections for the JPA/ILSBA Planning Areas (Potential Voluntary Annexation Areas
)
The methodology used to determine the impact on potable water capacity is established by multiplying the level of service (LOS) standard by the number of Equivalent Residential Units (ERUs) allowed in each JPA/ILSBA area. The number of ERUs allowed in each planning area was calculated using the following conversion factors provided by the City of Venice Utilities Department:
1 unit of residential (e.g., dwelling unit) = 1.00 ERU 1,000 square feet of nonresidential = 0.45 ERU
The City of Venice Utilities Department maintains a LOS of 152 gpd/ERU for average annual flow and 227 gpd/ERU for maximum daily flow. The potable water demand at build-out for each JPA/ILSBA area was calculated based on the maximum allowable density for each JPA/ILSBA area, and projected demand for the long term (i.e., 2030) and short-term (i.e., 2015) was calculated based on the growth rates applied in Table 7.6.1 and Table 7.6.2. Table 7.11.1 shows these calculations. The additional demands of the JPA/ILSBA areas will have an impact on the City’s water distribution system; however, JPA/ILSBA Area No. 6 will not be served by the City’s water distribution system and JPA/ILSBA Area No.11 is currently built-out and already served by the City. Sarasota County has concluded through their capital improvement assessment of the JPA/ILSBA Planning Areas that there are no issues or impacts related to potable water service and infrastructure. Although the potable water demand of the JPA/ILSBA areas will have an impact on the City’s potable water distribution system, this impact is not expected to compromise the City’s LOS prior to 2030, the horizon of the Comprehensive Plan. See Table 7.11.2. If the JPA/ILSBA areas are annexed into the City of Venice and subsequently reach build-out, the City will not have enough capacity to support these areas, as build-out demand could exceed average and peak treatment capacity by 0.36 mgd and 1.55 mgd, respectively. It is important to note that build-out demand should not be considered in isolation. If the incorporated City reaches build-out either prior to or simultaneous with annexation, the City will experience cumulative deficits of 5.01 mgd and 8.49 mgd in average and peak treatment capacity, respectively. The City has a Water Use Permit (WUP) from the Southwest Florida Water Management District (SWFWMD) for an average supply of 6.8 mgd and peak supply of 8.2 mgd. The permitted supply is expected to be adequate for the build-out of the JPA/ILSBA areas; however, if the incorporated City reaches build-out either prior to or simultaneous with annexation, permitted supply would only be adequate for the short-term. Table 7.11.3 shows the impacts assuming a build-out scenario occurs within the incorporated city either prior to or simultaneous with annexation of the JPA/ILSBA areas.
_________________________________________________________________________ April, 2010 38
Coordination between SWFWMD, Sarasota County and the City of Venice is needed to ensure that future water demand is fulfilled. The Comprehensive Plan proposes a number of policies to ensure this coordination.

_________________________________________________________________________ April, 2010 39
JP
A Ar
ea
Loca
tion
Suba
rea
Res
iden
tial
ERU
s 1
Non
res.
Sq
uare
Fee
t by
Bui
ldou
t 2
Non
res.
ER
Us
3To
tal
ERU
s 4
Pote
ntia
l D
eman
d (A
vera
ge
Annu
al F
low
) 5
Pote
ntia
l D
eman
d (M
axim
um
Dai
ly F
low
) 5
Res
iden
tial
ERU
s
Non
res.
Sq
uare
Fee
t by
203
0 1
Non
res.
ER
Us
2To
tal
ERU
s
Pote
ntia
l D
eman
d (A
vera
ge
Annu
al F
low
) 3
Pote
ntia
l D
eman
d (M
axim
um
Dai
ly F
low
) 3
Res
iden
tial
ERU
s
Non
res.
Sq
uare
Fee
t by
201
5 1
Non
res.
ER
Us
2To
tal
ERU
s
Pote
ntia
l D
eman
d (A
vera
ge
Annu
al F
low
) 3
Pote
ntia
l D
eman
d (M
axim
um
Dai
ly F
low
) 3
Sub
area
11,
561
3,12
1,56
0
1,
405
2,
965
0.45
0.
67
1
998,
899
45
0
45
1
0.07
0.
10
1
218,
509
98
99
0.
02
0.02
S
ubar
ea 2
354
70
8,30
0
319
673
0.
10
0.15
20
226,
656
10
2
12
2
0.02
0.
03
16
49
,581
22
38
0.01
0.
01
Sub
area
111
9
52,8
36
24
143
0.
02
0.03
-
16,9
08
8
8
0.
00
0.00
-
3,69
9
2
2
0.00
0.
00
Sub
area
220
0
88,7
64
40
240
0.
04
0.05
7
28
,404
13
19
0.00
0.
00
5
6,21
3
3
8
0.00
0.
00
Sub
area
315
7
69,7
20
31
188
0.
03
0.04
12
22,3
10
10
22
0.
00
0.00
10
4,88
0
2
12
0.
00
0.00
S
ubar
ea 1
418
83
6,64
0
376
795
0.
12
0.18
1
26
7,72
5
120
122
0.
02
0.03
1
58
,565
26
27
0.00
0.
01
Sub
area
221
7
433,
290
19
5
41
2
0.06
0.
09
7
138,
653
62
69
0.
01
0.02
5
30
,330
14
19
0.00
0.
00
Sub
area
344
2
883,
980
39
8
84
0
0.13
0.
19
7
282,
874
12
7
13
4
0.02
0.
03
5
61,8
79
28
33
0.
01
0.01
S
ubar
ea 1
2,32
9
49
0,23
0
221
2,54
9
0.
39
0.58
1
15
6,87
4
71
72
0.01
0.
02
1
34,3
16
15
17
0.
00
0.00
S
ubar
ea 2
394
82
,962
37
43
1
0.07
0.
10
40
26
,548
12
52
0.01
0.
01
32
5,
807
3
35
0.01
0.
01
4Ve
netia
n G
olf a
nd R
iver
Clu
b Ar
ea (V
enic
e M
yakk
a R
iver
) -
10
-
-
10
0.00
0.
00
5
-
-
5
0.00
0.
00
4
-
-
4
0.00
0.
00
5So
uth
Veni
ce A
venu
e C
orrid
or
(Sou
th V
enic
e Av
enue
Mix
ed U
se
Nei
ghbo
rhoo
d) -
1,12
0
1,
102,
794
496
1,61
6
0.
25
0.37
29
0
352,
894
15
9
44
9
0.07
0.
10
235
77
,196
35
27
0
0.04
0.
06
Sub
area
172
3
712,
019
32
0
1,
043
0.16
0.
24
15
22
7,84
6
103
117
0.
02
0.03
12
49,8
41
22
34
0.
01
0.01
S
ubar
ea 2
511
1,
021,
417
460
970
0.
15
0.22
3
32
6,85
3
147
150
0.
02
0.03
2
71
,499
32
34
0.01
0.
01
Sub
area
3-
530,
732
23
9
23
9
0.04
0.
05
-
16
9,83
4
76
76
0.01
0.
02
-
37
,151
17
17
0.00
0.
00
7Pi
nebr
ook
Roa
d Ar
ea -
695
-
-
69
5
0.11
0.
16
40
-
-
40
0.01
0.
01
32
-
-
32
0.00
0.
01
8Au
burn
Roa
d to
Cur
ry C
reek
- 12
6
-
-
126
0.
02
0.03
3
-
-
3
0.
00
0.00
2
-
-
2
0.
00
0.00
9 (a
)(A
) Jac
aran
da B
oule
vard
(B
orde
r Jac
aran
da)
- 55
12,2
68
6
61
0.01
0.
01
66
3,
926
2
68
0.01
0.
02
54
85
9
0
54
0.01
0.
01
9 (b
)(B
) Bor
der R
oad
to C
urry
Cre
ek
- 11
0
-
-
110
0.
02
0.03
86
-
-
86
0.
01
0.02
70
-
-
70
0.
01
0.02
10
Laur
el O
aks
- 50
-
-
50
0.
01
0.01
22
-
-
22
0.
00
0.01
18
-
-
18
0.
00
0.00
11
Gul
f Coa
st B
oule
vard
Enc
lave
- 11
6
-
-
116
0.
02
0.03
12
0
-
-
120
0.
02
0.03
97
-
-
97
0.
01
0.02
9,
706
10,1
47,5
12
4,56
6
14
,272
2.17
3.
24
744
3,
247,
204
1,46
1
2,
206
0.34
0.
50
603
71
0,32
6
320
92
3
0.14
0.
21
Notes
:ER
Ussq
. ft.
ERUs
ERUs
mgd
mgd
ERUs
sq. f
t.ER
UsER
Usm
gdm
gdER
Ussq
. ft.
ERUs
ERUs
mgd
mgd
1: Co
mpre
hens
ive P
lan m
axim
um al
lowab
le de
nsity
base
d on g
ross
acre
age p
er ar
ea, o
r sub
-are
a whe
re ap
plica
ble; a
djuste
d for
BEB
R pr
ojecti
ons,
FPS,
Volu
me 42
, Bull
etin 1
53, M
arch
2009
.
5: Th
e pote
ntial
dema
nd w
as ba
sed u
pon 1
52 gp
d/ERU
, the C
ity's
level
of se
rvice
(LOS
) for
potab
le wa
ter av
erag
e ann
ual fl
ow, a
nd 22
7 gpd
/ERU
, the C
ity's
LOS
for po
table
water
max
imum
daily
flow.
JPA
/ ILS
BA
Pote
ntia
l Pot
able
Wat
er D
eman
dB
uild
-Out
Long
-Ter
m (2
030)
1Kn
ight
s Tr
ail P
ark
Area
(R
ustic
Roa
d)
Shor
t-Ter
m (2
015)
Aubu
rn R
oad
to I-
75
2(b)
I-75
to J
acar
anda
Bou
leva
rd
3Bo
rder
Roa
d to
Mya
kka
Cor
ridor
2(a)
Laur
el R
oad
Tota
l
2: Co
mpre
hens
ive P
lan no
nres
identi
al sq
uare
foota
ge ba
sed o
n gro
ss ac
reag
e per
area
, or s
ub-a
rea w
here
appli
cable
; adju
sted f
or B
EBR
proje
ction
s, FP
S, V
olume
42, B
ulleti
n 153
, Mar
ch 20
09.
3: Fo
r non
resid
entia
l, an E
quiva
lent R
eside
ntial
Unit (
ERU)
conv
ersio
n fac
tor of
0.45
ERU
s per
1,00
0 squ
are f
eet o
f non
resid
entia
l spa
ce w
as ap
plied
. This
conv
ersio
n fac
tor is
base
d on t
he C
ity of
Ven
ice U
tilitie
s Dep
artm
ent's
aver
age E
RU va
lue fo
r offic
e (0.6
0 ERU
per 1
,000 s
q. ft.)
and c
omme
rcial/
retai
l (0.30
ERU
per 1
,000)
sq. ft
.).4:
Total
ERU
s, re
siden
tial a
nd no
nres
identi
al co
mbine
d.
6
Tab
le 7
.11.
1

_________________________________________________________________________ April, 2010 40
Tab
le 7
.11.
2
Hor
izon
Tota
l ER
Us
1
Pote
ntia
l D
eman
d (A
vera
ge
Annu
al F
low
) 2
Aver
age
Trea
tmen
t C
apac
ity
Use
d 3
Aver
age
Rem
aini
ng
Trea
tmen
t C
apac
ity 5
Pote
ntia
l D
eman
d (M
axim
um
Dai
ly F
low
) 2
Peak
Tr
eatm
ent
Cap
acity
U
sed
4
Peak
R
emai
ning
Tr
eatm
ent
Cap
acity
5
Aver
age
Rem
aini
ng
Perm
itted
Su
pply
6
Build
-Out
14,2
72
2.
17
4.85
(0.3
6)
3.24
6.
04
(1.5
5)
1.95
Lo
ng-T
erm
(203
0)2,
206
0.
34
3.02
1.47
0.
50
3.14
1.
35
3.78
Sh
ort-
Term
(201
5)92
3
0.
14
2.82
1.67
0.
21
2.94
1.
55
3.98
No
tes:
ERUs
mgd
mgd
mgd
mgd
mgd
mgd
mgd
5: Th
e City
of V
enice
Wate
r Tre
atmen
t Plan
t has
a ca
pacit
y of 4
.49 m
gd.
6: Th
e City
of V
enice
has a
perm
itted a
vera
ge su
pply
of 6,8
64,00
0 gpd
or 6.
8 mgd
(Sou
thwes
t Flor
ida W
ater M
anag
emen
t Dist
rict, W
UP N
o. 53
596)
.
JPA
/ ILS
BA
Pote
ntia
l Pot
able
Wat
er Im
pact
1: To
tal E
RUs,
resid
entia
l and
nonr
eside
ntial
comb
ined.
2: Th
e pote
ntial
dema
nd w
as ba
sed u
pon 1
52 gp
d/ERU
, the C
ity's
level
of se
rvice
(LOS
) for
potab
le wa
ter av
erag
e ann
ual fl
ow, a
nd 22
7 gpd
/ERU
, the C
ity's
LOS
for po
table
water
max
imum
daily
flow.
3: Th
e yea
rly av
erag
e usa
ge is
2.68
mgd
.4:
The y
early
peak
usag
e is 2
.8 mg
d. T
he pe
ak m
onths
of us
age a
re D
ecem
ber -
Mar
ch. Tab
le 7
.11.
3
Hor
izon
Tota
l ER
Us
1
Pote
ntia
l D
eman
d (A
vera
ge
Annu
al F
low
) 2
Aver
age
Trea
tmen
t C
apac
ity
Use
d 3
Aver
age
Rem
aini
ng
Trea
tmen
t C
apac
ity 5
Pote
ntia
l D
eman
d (M
axim
um
Dai
ly F
low
) 2
Peak
Tr
eatm
ent
Cap
acity
U
sed
4
Peak
R
emai
ning
Tr
eatm
ent
Cap
acity
5
Aver
age
Rem
aini
ng
Perm
itted
Su
pply
6
Build
-Out
44,8
36
6.
82
9.50
(5.0
1)
10.1
8
12.9
8
(8.4
9)
(6.1
8)
Long
-Ter
m (2
030)
17,7
29
2.
69
5.37
(0.8
8)
4.02
6.
82
(2.3
3)
(0.0
2)
Shor
t-Te
rm (2
015)
13,5
60
2.
06
4.74
(0.2
5)
3.08
5.
88
(1.3
9)
0.92
Notes
:ER
Usm
gdm
gdm
gdm
gdm
gdm
gdm
gd
4: Th
e yea
rly pe
ak us
age i
s 2.8
mgd.
The
peak
mon
ths of
usag
e are
Dec
embe
r - M
arch
.
City
wid
e (P
lann
ing
Area
s) +
JPA
/ IL
SBA
Pote
ntia
l Cum
ulat
ive
Impa
ct
1: To
tal E
RUs,
resid
entia
l and
nonr
eside
ntial
comb
ined.
2: Th
e pote
ntial
dema
nd w
as ba
sed u
pon 1
52 gp
d/ERU
, the C
ity's
level
of se
rvice
(LOS
) for
potab
le wa
ter av
erag
e ann
ual fl
ow, a
nd 22
7 gpd
/ERU
, the C
ity's
LOS
for po
table
water
max
imum
daily
flow.
3: Th
e yea
rly av
erag
e usa
ge is
2.68
mgd
.
5: Th
e City
of V
enice
Wate
r Tre
atmen
t Plan
t has
a ca
pacit
y of 4
.49 m
gd.
6: Th
e City
of V
enice
has a
perm
itted a
vera
ge su
pply
of 6,8
64,00
0 gpd
or 6.
8 mgd
(Sou
thwes
t Flor
ida W
ater M
anag
emen
t Dist
rict, W
UP N
o. 53
596)
.

_________________________________________________________________________ April, 2010 41
WATER CONSERVATION 8.1 Regional Coordination The City of Venice will continue to coordinate future water conservation efforts with Sarasota County and SWFWMD to ensure that proper techniques are applied. In addition, the City will continue to support and implement the goals, objectives and policies (GOPs) contained in the Envision Venice Comprehensive Plan that promote water conservation in a cost-effective and environmentally sensitive manner. The City will continue to actively support SWFWMD and Sarasota County in the implementation of new regulations or programs that are designed to conserve water during the dry season. Many of these coordination efforts are memorialized as a series of GOPs and identified in Section 10 (Goals, Objectives and Policies). 8.2 Specific Actions, Programs, Regulations, or Opportunities The City of Venice has implemented a water conservation program that reflects the following major components:
1. Education
A series of informational materials are made available to the community through distribution at City offices, the public library and other non-profit agencies. These materials highlight the benefits of water conservation and provide tips for homeowners and businesses to conserve water. Leak detection kits and water conserving hardware are made available at the utility billing and utility service offices.
2. Rate System
The City has implemented a rate system that provides for escalating water charges as consumption increases for its potable system. A similar reuse water rate system is currently under review as required by the existing Comprehensive Plan as part of an on-going utility rate study.
3. Reuse Availability The City initiated the development of a reclaimed water system in cooperation with the Southwest Florida Water Management District as a funding partner. As new areas are constructed, developments install reuse distribution lines for use by individual homeowners and for irrigation of any large open areas (common areas, golf course, etc.). A major system expansion to previously developed areas, particularly on the island of Venice, is currently under construction to create the transmission system for future distribution network and individual property owner connections.
4. Testing and Rehabilitation
A comprehensive meter testing and replacement program has been instituted to provide for

_________________________________________________________________________ April, 2010 42
an accurate water use system. Meter replacements assist with leak detection and elimination, as well as to ensure consumer awareness of City efforts to conserve water use.
5. System Maintenance program
An on-going preventative maintenance program that includes line replacements, valve checks and plant facility inspections is in place to aide with conservation efforts. Included within this program is the City’s effort to protect against cross connection to the potable water system in order to ensure that potentially hazardous substance do not contaminate a single supply, neighborhood or the distribution system itself.
In 2009 the City of Venice has continued to work on its’ water conservation plan and has researched a formal Best Management Practices (BMP’s) to ensure a per capita water use rate of 150 GPD per person or less. Currently the City maintains a per capita rate of 88.2 GPD. This number is slightly higher then the 2008 Per Capita rate (77.6 GPD). The City has seen a decline in its’ population while its’ distribution flushing requirement remain constant and could account for the sight increase in per capita usage.
The City was awarded co-operative funding from the Southwest Florida Water Management District to purchase water conservation kits and implement low flow toilet rebate program. In early fiscal year 2008-2009 it was determined that the City coffers could not support its’ 50% obligation for the grant, so the funding was returned to SWFWMD with anticipation of applying again when economic conditions permit the follow through of this program.
The following is a summary of the City’s water conservation efforts.
• The City Conservation Team has researched the implementation of a landscape ordinance that would effectively regulate the planning and installation of new landscaping to include native (Florida Friendly), drought resistant plants in an effort to reduce watering demands in commercial and residential applications. A draft version has been prepared and is currently under review by the City’s Conservation Team.
• The City of Venice continues to utilize water conservation rates in its consumer billing structure.
• The City of Venice currently publishes conservation ideas and watering restrictions on its’ website : www.venicegov.com/Files /Utilities/Cashiers_brochure.pdf
• The City has incorporated numerous conservation protocols in its recently issued WUP that will ensure the conservation effort continue into the future.
• The City once again held its’ elementary school water conservation poster contest. This annual even continues to educate your about the importance of water conservation.
• Discussions have been held with the Peace River Manasota Regional Water Supply Authority and Sarasota County Utilities staff regarding the City’s role in the drought relief.
• City has inspected and repairs have been made to the sub-aqueous RO concentrate discharge outfall diffuser system.

_________________________________________________________________________ April, 2010 43
• The elevated tank at the City’s Chuck Reiter Field and the plant site location was inspected and cleaned. Necessary repairs and painting are pending.
• The 1.5 million gallon Pinebrook Storage Tank and 1.0 mg plant were cleaned and inspected.
8.3 Reuse / Reclaimed Water
Reclaimed or reuse water is defined by FDEP as water that is beneficially reused after being treated to at least secondary wastewater treatment standards by a domestic wastewater treatment plant (WWTP). Reclaimed water can be used in a number of ways including decreasing reliance on potable water supplies, increasing ground-water recharge, and restoring natural systems.
For several decades, the City of Venice has implemented a water conservation program that includes education, an escalating rate system, reuse availability (reclaimed water), testing and rehabilitation, and preventative system maintenance.
The City of Venice has a reclaimed water program to reduce demand for potable water and withdrawals from water supply sources. The system is currently operating in conjunction with the Eastside Wastewater Treatment Plant and has a design capacity of 6.5 mgd for production.
The City has connected reclaimed water transmission lines from the Eastside Wastewater Treatment Plant to the island in an effort to provide reclaimed water to all residents of the City. The City is currently adding distribution lines to the reclaimed water system. It is estimated that the project will take 10 years to complete and the improvements are reflected in the City’s 10-year capital improvement program beginning in 2003. The City will continue to support SWFWMD and Sarasota County water reuse projects, and implementation of new regulations or programs designed to increase the volume of reclaimed water used and public acceptance of reclaimed water.
As noted in Section 5.13 above, the City currently provides bulk sales of reclaimed water.
8.4 Outside / Bulk Sales of Reclaimed Water
The City does provide bulk sales for reclaimed water. Per the City’s 2009 Public Supply Annual Report the following bulk customer information is provided:
Customer (Account) Name
Waterford Golf Course
Capri Isle Golf Course
Bird Bay Golf Course
Lake Venice Golf Course
Venetian Golf & River Club
Contact Person Roger Moore Mike Simpson Rich Robertson Rod Perry Mike Miles WUP No. 011438 005517 011797 011871 012075
Use Category (R,C, RA, M or
A) RA RA RA RA RA
Month/Year First Served 10/1998 Prior to 2000 8/1991 Prior to 1989 4/2007
Line Size 6” 4” 4” 12” 10”

_________________________________________________________________________ April, 2010 44
Meter Ownership Utility Utility Utility Utility Customer Pressurized (P)
or Non Pressurized (NP)
NP NP NP NP NP
The monthly actual flow for each customer based on actual meter reading of quantities of reclaimed water delivered each month is provided below:
Customer (Account) Name
Waterford Golf Course
Capri Isle Golf Course
Bird Bay Golf Course
Lake Venice Golf Course
Venetian Golf & River Club
January 18,625,000 6,084,000 3,817,000 4,908,000 12,690,000 February 18,686,000 7,383,000 3,548,000 5,421,000 15,755,000 March 15,775,000 10,782,000 4,194,000 8,830,000 12,588,000 April 23,900,000 9,749,000 3,404,000 12,380,000 6,141,000 May 30,532,000 5,542,000 1,287,000 9,512,000 8,042,000 June 23,641,000 4,052,000 2,088,000 12,103,000 4,821,000 July 11,120,000 3,665,000 2,044,000 12,759,000 4,527,000
August 14,648,000 3,110,000 1,808,000 9,489,000 6,050,000 September 42,035,000 803,300 1,838,000 8,872,000 12,870,000
October 12,166,000 4,569,000 2,063,000 15,500,000 4,737,000 November 13,227,000 4,116,000 2,695,000 13,993,000 5,878,000 December 50,440,000 0 1,625,000 6,553,000 19,705,000
Total Gallons 274,795,000 59,855,000 30,411,000 120,320,000 113,774,000 Divide by 365 for
gpd 752,863 163,986 83,318 329,644 311,710
The City will continue to provide to bulk sales of reclaimed water to customers as identified above.
8.5 Conservation Offset
The primary use of reclaimed water in Venice is irrigation, particularly with regard to residential and golf course uses, which are intensely landscaped. Based on the average gallons per day used for irrigation by residential and golf course uses, approximately 1.80 mgd is offset through the use of reclaimed water.
Table 8.5.1: Conservation Offset
Type of Reclaimed
Use
Number of Meters
Amount of Irrigation per Meter* (gpd)
Total Water Use (gpd) Offset** (%) Offset**
(gpd)
Residential 2,900 395 1,145,500 50% 527,750
Golf Course See previous table
See previous table 1,641,521 75% 1,231,141
Total (mgd) - - 2.79 - 1.80 * Andrade, Anthony J. and Kathy F. Scott, “Effective Use of Reclaimed Water Demonstrated to Offset Water Demand”, SWFMWD, October, 2002. http://www.swfwmd.state.fl.us/files/database/site_file_sets/118/reclaimed-offset-docs.pdf **Percentage or amount of reclaimed water use that replaces potable water consumption.
With an ever-growing population and a finite supply of available drinking water, finding new water supply sources is critical. One way to conserve is to use reclaimed water for

_________________________________________________________________________ April, 2010 45
irrigation purposes. The use of reclaimed water in-lieu of potable water for irrigation is expected to increase as availability of reclaimed water increases in conjunction with new development and facility enhancements. It will become increasingly important to link the City’s reclaimed water plans more closely with regional water supply planning. Currently, the water management districts develop regional water supply plans to meet future needs, sometimes without adequate input from reclaimed water providers or DEP’s wastewater program. This could become an issue when the City prepares to make a capital investment in distributing reclaimed water to an area not anticipated in the regional water supply plan. By coordinating with DEP and SWFWMD, the parties collaboratively can work out where it is best to utilize reclaimed water before the City invests capital in a specific project.

_________________________________________________________________________ April, 2010 46
9.0 CAPITAL IMPROVEMENTS The City’s Capital Improvement System (CIS) provides for the public services, facilities, and infrastructure systems needed to implement the Envision Venice Comprehensive Plan, and maintain and achieve adopted level of service standards. It is comprised of four components: 1) Capital Improvement Element, 2) Capital Improvement Schedule, 3) Capital Improvement Program, and 4) Annual Budget. A summary of what each of these components is and how the system works together is as follows:
• Capital Improvement Element (CIE). The Capital Improvement Element prioritizes the capital improvements needed to implement the 2009 Comprehensive Plan planning framework and established LOS. The CIE coordinates the City's planning framework and LOS, with the City public services, facilities, and infrastructure systems; work plan schedules; and fiscal demands, costs, and funding sources. Included within the CIE is the City’s Capital Improvement Schedule.
• Capital Improvement Schedule (CIS). The Capital Improvement Schedule provides the financial foundation necessary to implement capital improvements needed to implement the Comprehensive Plan and achieve and maintain adopted LOS. The CIS guides the development of public facilities and infrastructure systems over a 5-year period. The CIS is structured according to the City’s planning priorities, estimated project costs, and availability of funding resources. Since the CIS includes only those items necessary to achieve and maintain the comprehensive plan planning framework and LOS, it does not include all items found within the City-wide CIP. The CIS is found in the 2009 Comprehensive Plan’s Capital Improvement Element.
• Capital Improvement Program (CIP). The Capital Improvement Program plans for the provision of City-wide capital budgeting needs. The capital budget deals with projects for the construction, renovation, improvement, acquisition of any facilities, buildings, structures, land, or land rights. The plan identifies the development schedule for all capital projects, related expenditures, and financing needs proposed within the City.
• Annual Budget. Supports the day-to-day operations of the City for a single fiscal year. It includes all planned services and programs, their expenditure requirements and revenue estimates to support the stated level of activity. Additionally, the CIP is a city document that is referenced in the CIE but not adopted as part of the element.
The process of preparing the CIP component of the annual budget includes identifying and listing capital items, evaluation, scheduling, estimating costs, and anticipating revenue sources.
Evaluation for funding and scheduling within the CIP is generally in accordance with the following criteria:
a) Improvements which are necessary to protect the health, safety and environmental integrity of the City.
b) Improvements which are necessary to meet existing deficiencies in capacity, performance, or reliability, including potable water.
c) Improvements that will contribute to fulfill the goals, objectives and policies established within the Comprehensive Plan.

_________________________________________________________________________ April, 2010 47
d) Improvements that are consistent with the Future Land Use Element of the Comprehensive Plan.
e) Improvements that target un-served areas within established service areas. f) Cost-effective improvements to expand capacity, maximize operational
efficiency, and increase productivity. g) Improvements that are financially feasible. h) Improvements to optimize use of existing facilities.
Some additional and specific criteria may be considered by each of the City’s departments within the evaluation. The City Council adopts the one year capital improvements budget as part of the annual budget, and the remainder of the program is updated each year. The current CIP document is a guide to determining and establishing priorities based upon the condition of each element of the comprehensive plan and the capital improvements needed to maintain adopted level of service standards.
9.1 Potable Water Supply Related Capital Improvements (2008 Annual Reporting Period)
The following capital improvements related to potable water supply were completed for the 2008 annual reporting period as defined as October 1, 2007 to September 30, 2008: 1. Variable Frequency Drives (VFD) were installed on User ID Nos. RO-4E & RO-6E, District ID Nos. 56 & 77 production wells to conserve electricity and allow the withdrawal rate to be adjusted to allow for better management of pumpage and water quality concentrations. This brings the total number of wells equipped with VFD’s to four. Additionally, the City installed this equipment on two more wells in 2009.
2. The City installed a motor operated valve on the elevated water tank to gain more control over system pressures.
3. The City held preliminary discussions with its consultants regarding increased recovery efficiencies of the RO Plant. Further planning is underway.
9.2 Potable Water Supply Related Capital Improvements (Future)
The City has budgeted or is planning for the following capital improvements or programs related to improvements of the potable water supply system: 1. Installation of VFDs on the remaining production wells over the next several years. 2. Continue to explore the feasibility of relocating the City’s RO water treatment plant. 3. Continue study of the potential for increased recovery of the RO treatment system. 4. Update to the Water Supply Master Plan
5. Replace the RO membranes, pressure vessels, and associated instruments.
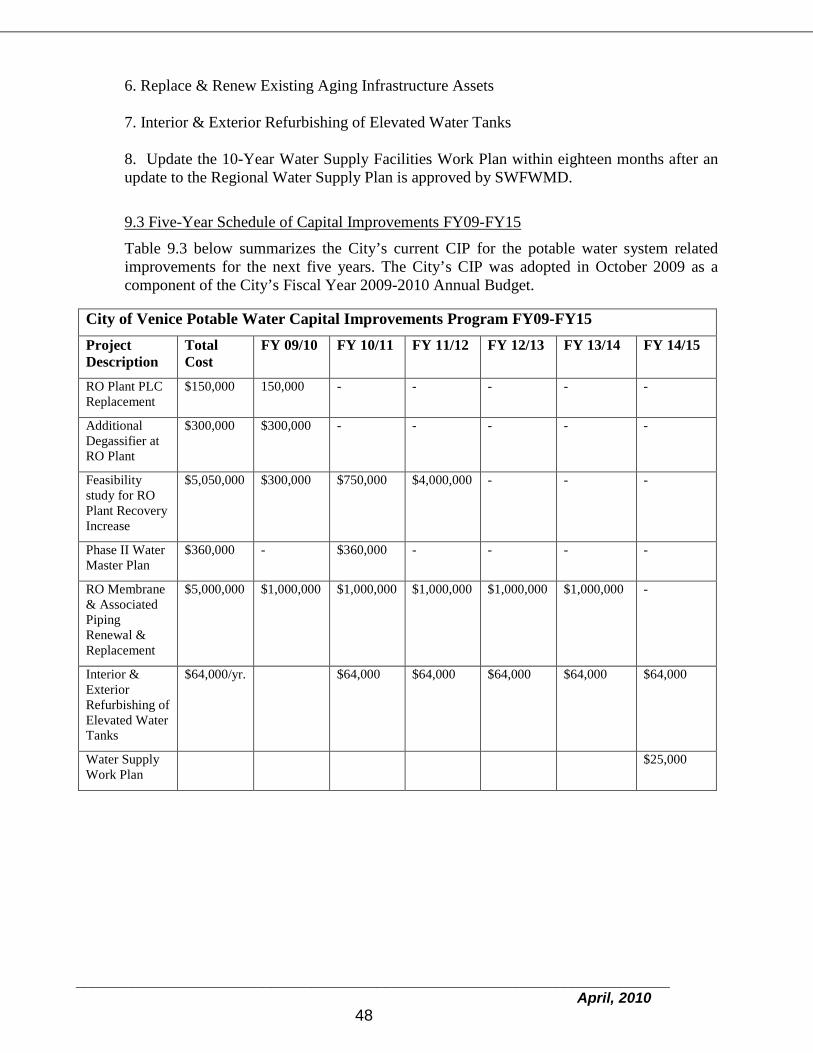
_________________________________________________________________________ April, 2010 48
6. Replace & Renew Existing Aging Infrastructure Assets 7. Interior & Exterior Refurbishing of Elevated Water Tanks 8. Update the 10-Year Water Supply Facilities Work Plan within eighteen months after an update to the Regional Water Supply Plan is approved by SWFWMD.
9.3 Five-Year Schedule of Capital Improvements FY09-FY15
Table 9.3 below summarizes the City’s current CIP for the potable water system related improvements for the next five years. The City’s CIP was adopted in October 2009 as a component of the City’s Fiscal Year 2009-2010 Annual Budget.
City of Venice Potable Water Capital Improvements Program FY09-FY15 Project Description
Total Cost
FY 09/10 FY 10/11 FY 11/12 FY 12/13 FY 13/14 FY 14/15
RO Plant PLC Replacement
$150,000 150,000 - - - - -
Additional Degassifier at RO Plant
$300,000 $300,000 - - - - -
Feasibility study for RO Plant Recovery Increase
$5,050,000 $300,000 $750,000 $4,000,000 - - -
Phase II Water Master Plan
$360,000 - $360,000 - - - -
RO Membrane & Associated Piping Renewal & Replacement
$5,000,000 $1,000,000 $1,000,000 $1,000,000 $1,000,000 $1,000,000 -
Interior & Exterior Refurbishing of Elevated Water Tanks
$64,000/yr. $64,000 $64,000 $64,000 $64,000 $64,000
Water Supply Work Plan
$25,000

_________________________________________________________________________ April, 2010 49
9.4 Five-Year Schedule of Capital Improvements FY15-FY20
The 5-year work plan for the City of Venice for FY15-FY20 is presented below. The City will continue to adopt a Five-Year Capital Improvement Program (CIP) as part of the annual budgeting process. The CIP will be coordinated with the annual review of the capital improvements element.
City of Venice Potable Water Capital Improvements Program FY15-FY20 Project Description
Total Estimated Cost
FY 15/16 FY 16/17 FY 17/18 FY 18/19 FY 19/20
Replace & Renew Existing Aging Infrastructure Assets
$1,750,000/yr. $1,750,000 $1,750,000 $1,750,000 $1,750,000 $1,750,000
Interior & Exterior Refurbishing of Elevated Water Tanks
$64,000/yr. $64,000 $64,000 $64,000 $64,000 $64,000
Water Supply Work Plan
$25,000

_________________________________________________________________________ April, 2010 50
10.0 GOALS, OBJECTIVES AND POLICIES
Consistent with the requirements of Chapter 9J-5, each element of Envision Venice establishes long-term direction of goals as well as short-term objectives and policies (Volume I) to guide implementation efforts, and provides data and analysis necessary for decision making (Volume II). Goals, objectives and policies are generally defined as follows:
• Goal: The long-term result toward which programs or activities are ultimately directed.
• Objective: A specific, measurable, intermediate result that is achievable and marks progress toward a goal.
• Policy: The way in which programs and activities are conducted to achieve an identified goal.
10.1 Goals, Objectives and Policies Addressing Potable Water Supply
The following provides a list of goals, objectives and policies (GOPs) that address potable water supply and facilities, conservation and reuse programs, and implementation of the required 10-year water supply work plan. In addition, a number of policies have been included to address coordination and ensure availability of public facilities, including potable water, in the JPA/ILSBA Planning Areas. These GOPs will be adopted as part of the City’s Evaluation and Appraisal (EAR) based Comprehensive Plan Amendment commonly referred to as Envision Venice. The GOPs have been organized by the applicable Element. FUTURE LAND USE & DESIGN ELEMENT
Policy 1.2 Sustainable Development Practices. Provide for the needs of present
and future populations by: A. Focusing future growth toward existing development and
designated planning areas. B. Promoting green building practices. C. Promoting alternative transportation methods and pedestrian
connectivity. D. Minimizing impacts to the natural environment.
Policy 2.6 Landscape Design.
Definition: A landscape design is a plan that blends the built and natural environment together by incorporating landscape materials into the design and planning of the built environment.
Policy: Development projects shall promote community character and
resource conservation by incorporating a landscape plan that addresses the development’s visual appearance, neighborhood compatibility, and

_________________________________________________________________________ April, 2010 51
maintenance needs of the development. Criteria to consider when developing landscape design plans include: A. Overall visual appeal of landscape design. B. Use of drought tolerant native species and plant materials,
including low-maintenance groundcovers and perennials to offset carbon emissions and reduce irrigation demand.
C. Provision of shade and sitting areas. D. Buffering of incompatible uses and structures with walls, fencing,
and landscaping. E. Use of reclaimed water and ability to minimize irrigation
schedules. F. Suitability of landscaping materials to the site based on the future
health and maintenance of the plants, streetscape, and other structures.
G. Compatibility with abutting and/or adjacent properties. Policy 3.5 Public Facility and Services Planning. Provide for the community’s
public service needs by coordinating future development projects with public service and facility planning by: A. Coordinating land development practices with public facility and
service planning and budgeting. B. Implementing established level of service standards for parks,
utilities, schools, and transportation systems. C. Ensuring future development pays for its impacts. D. Coordinating development practices with the Capital Improvement
Schedule.
Objective 6 Block Level Standards for Service Facility and Infrastructure Systems. Provide for the community’s public service and utility needs by coordinating the City’s land use, public facility, and utility infrastructure planning efforts.
Policy 6.1 Public Service and Infrastructure Systems. Minimize impact on public services and infrastructure systems by supporting and encouraging the following energy and resource efficient building practices: A. Green building and sustainable design practices. B. Co-location of community service and infrastructure systems,
facilities, and operations. C. Renewable and alternative energy resources. D. Green, recycled, or energy efficient products. E. Waste reduction and recycling. F. Water conservation and the use of native and Florida Friendly
landscaping materials and planting techniques. G. Integrated pest management practices. H. Implementation of the U.S. Conference of Mayors Climate

_________________________________________________________________________ April, 2010 52
Protection Agreement. Policy 8.1 Smart Growth and Sustainable Development Practices. Ensure that all
development projects utilize best practices for smart growth and sustainability by implementing the following sustainable development standards: A. Provide a balance of land use and infrastructure capacity in
developed areas through a focus on infill and redevelopment projects consistent with the character of the City.
B. Foster compact forms of development within designated infill, redevelopment, and new growth corridors.
C. Protect natural habitats and environmental areas through conservation practices.
D. Minimize sprawl by discouraging growth and development in undeveloped areas where infrastructure does not exist and where inconsistent with the environmental character of the area.
E. Include transitioning and buffering between different heights, densities, and intensities.
Policy 11.1 Development Capacity and Resources. Coordinate the expansion of
public services, infrastructure and facilities with the development of land to ensure: A. Future development patterns are compatible with the City’s
historic and small town character, built and natural environment, physical infrastructure, and public services and facilities.
B. There are sufficient infrastructure and fiscal resources available to meet the demands of the City’s Comprehensive Plan.
C. The capacity of existing facilities and infrastructure is utilized efficiently.
Policy 11.2 Development Pay As You Grow. Ensure that growth pays for its
impacts to the City’s public facilities and infrastructure systems by preventing development from taking place until the funding has been programmed through the adopted Capital Improvements Schedule, private financing, or independent special purpose units of government including Community Development Districts. Such public facilities, infrastructure, and services include: A. Transportation (roads, bicycle lanes, and related infrastructure). B. Utilities (potable water, wastewater, stormwater, reclaimed water
and solid waste). C. Emergency services (fire and police). D. Parks and recreation. E. Tree replacement, air quality mitigation, and other environmental
measures. F. Other city services.

_________________________________________________________________________ April, 2010 53
Policy 11.7 Environmental Best Management Practices. Incorporate best management practices for environmental protection into the City’s land development processes. These practices include: A. Maximizing existing public facilities and infrastructure systems
prior to expanding the system. B. Preventing wastewater infiltration during a stormwater event. C. Minimizing stormwater system overflow during storm events and
reducing water quality impacts to receiving waters. D. Protecting natural water sources and environmentally sensitive
land areas from the impact of development. E. Coordinating water quality monitoring, waste disposal, and
stormwater management practices with partner entities. F. Minimizing the impact of wastewater facilities on the environment. G. Managing new development within the coastal planning areas as
defined in the Coastal and Waterway Management Element. H. Limiting fertilizer use to minimize the impact on environmental
resources. Policy 11.8 Green Design. Significantly reduce or eliminate the negative impact
of buildings on the environment and on building occupants by utilizing the City’s site and development processes to support and encourage the following site and green building design and construction practices: A. Sustainable site planning. B. Minimizing lawns and utilizing low maintenance ground covers. C. Safeguarding water and water efficiency. D. Energy efficiency. E. Conservation of materials and resources. F. Indoor environmental quality through nontoxic materials and
adequate ventilation. G. Florida Green Building Coalition (FGBC) or Leadership in Energy
and Environmental Design (LEED) certification criteria.
Objective 12 Regional Development Coordination. Support a unified community character by coordinating land use and development practices with the other governments, non-profits, and development organizations.
Policy 12.1 Planning Coordination. Coordinate the planning and development of
land, transportation, public facilities, and infrastructure systems with Sarasota County and other applicable local, regional, state, and federal private and public agencies. Development practices shall be sensitive to the City’s design and architectural standards and environmental, historical, and cultural resources.

_________________________________________________________________________ April, 2010 54
COMMUNITY LINKAGES & DESIGN ELEMENT
Policy 2.5 Street Landscaping and Buffering. Utilize the City’s long-range planning practices and development review to ensure streets are appropriately landscaped and buffered by implementing standards for: A. Use of native, low maintenance, and drought-tolerant species. B. Shaded sidewalks, trails and sitting areas. C. Incompatible uses and structures. D. Traffic noise. E. Water conservation and use of reclaimed water systems. F. Suitability of landscaping materials based on the future health and
maintenance of plants, streetscape, and other structures.
UTILITIES ELEMENT Objective 1 Utility Services and Development Coordination. Ensure that
infrastructure service expansion is coordinated with development. Policy 1.1 Timing of Facilities. Ensure all existing infrastructure systems are
maintained, improved, or expanded in coordination with the development of properties and capital improvements schedule.
Policy 1.5 Infrastructure Utilization. Maximize existing public utility
infrastructure systems by encouraging infill development and redevelopment of established service areas.
Policy 1.10 Existing System Improvements. Utilize the site and development
process to ensure new development addresses the impact and deficiencies of existing infrastructure systems by improving the systems’: A. Effectiveness through a more compact and better-utilized utility
system. B. Efficiency and safety by looping the system. C. Economic sustainability by evaluating its financial feasibility and
charging appropriate rates. D. Operational effectiveness, system functionality, and cost
expenditures in coastal high hazard areas. E. Conservation of water resources. F. Utilization, whenever possible, of alternative energy sources such
as solar energy for the provision of electrical power to island sewage pumping facilities, toward eventually reducing water utility rates.

_________________________________________________________________________ April, 2010 55
Policy 1.13 Utility Master Plans. Examine the feasibility of updating the City’s utility master plans based on an overall infrastructure prioritization schedule to ensure consistency with partner agency plans and reflect best industry practices. The City’s utility master plans include: A. Water Master Plan. B. Wastewater Master Plan. C. Stormwater Master Plan.
Policy 1.14 Utility Inventory. In conjunction with the development of the utility
master plans, develop and maintain stormwater, reclaimed water, potable water, and wastewater service inventories to identify and address potential deficiencies in capacity. The inventory shall include: A. Current plant capacity. B. Existing use (number and types of hook-ups). C. All future committed capacity based upon approved site and
development plans (number and type of hook-ups). D. All future committed capacity based upon maximum density
allowed if no site and development plan has been approved. E. Potential service area needs.
Policy 1.15 Infrastructure Replacement and Improvement Plan. The City shall
target and prioritize the improvement and replacement of public infrastructure.
Policy 1.16 Fee and Cost Reviews. Annually, review all fees, costs, and
expenditures to continually ensure infrastructure systems are properly funded and promote resource conservation. The following funds are used to pay for infrastructure system improvements: A. Potable Water: Utilities Fund. B. Reclaimed Water: Utilities Fund. C. Wastewater: Utilities Fund. D. Stormwater Management: Stormwater Fund. E. Solid Waste Services: Solid Waste Fund.
Policy 2.3 Wellhead Protection Areas. All areas within a 500’ radial setback
from a surface or subsurface potable water well shall be designated as wellhead protection areas. The following uses will not be permitted within the wellhead protection areas:
A. Treatment, storage, disposal, and transfer facilities for hazardous wastes.
B. Chemical and hazardous material storage tanks. C. Industrial wastewater. D. Reuse water applications. E. New class I and class III injection control wells.

_________________________________________________________________________ April, 2010 56
Policy 2.4 Potable Water Supply Safety. The City shall protect the safety of its potable water supply by: A. Visually inspecting every well site for damage and vandalism. B. Utilizing a radio telemetry system to monitor pump failures, loss of
flow and other indications of security problems. C. Having a redundant, off site, manual shut down system for well
operations. D. Reporting any suspicious activities to the Florida State Warning
Point. Policy 2.5 Water Quality System Evaluation. The City shall continually evaluate
and, if appropriate, enact alternative water quality standards for the design, construction, and maintenance of water infrastructure systems. This evaluation shall review the following: A. Non-structural storm water management system designs. B. Littoral zone vegetation requirements. C. Vegetation removal and management standards. D. System designs that conserve uplands and populations of listed
species. Policy 2.6 Water Resource Partnerships. Partner with the Southwest Florida
Water Management District, Florida Department of Environmental Protection, and other local, regional, state, and federal water entities to protect the quality of natural ground water recharge areas, natural drainage features, and surface water bodies. Specific programs that require regional water coordination include, but are not limited to: A. Wellhead Protection Program. B. Location of potable wells. C. 2006 Regional Water Supply Plan (RSWP). D. Myakka River Comprehensive Watershed Management Plan. E. Myakka Wild and Scenic River Management Plan. F. Charlotte Harbor Surface Water Improvement and Management
(SWIM) Plan. G. Watershed Management Program (WMP) Plans.
Policy 2.7 Private Wells and Septic Systems. The City will not permit new
private well and septic systems within environmentally sensitive areas or areas currently served by potable water, reclaimed water, and wastewater systems.
A. Existing or new private well and septic systems are required to connect to City utilities upon service availability.

_________________________________________________________________________ April, 2010 57
Policy 2.8 Reclaimed Water Utilization. Utilize the site and development process to encourage the use of reclaimed water for irrigation where supplies are available. Areas that should be addressed include: A. Golf courses. B. Public and private common areas and greenspace. C. Roadway medians. D. Landscaped areas in parks and other public properties. E. Residential irrigation in all new proposed development areas.
Policy 2.9 Reclaimed Water Infrastructure. Utilize the site and development
process to ensure that development projects address the need for increased reclaimed water capacity for irrigation purposes throughout the City.
Objective 4: Regional Coordination. The City shall assume its local and regional
responsibility and authority by coordinating with intergovernmental partners in the development, maintenance, and delivery of public utility services.
Policy 4.1 Public Facilities. The City will cooperate with Sarasota County to
investigate the feasibility of possible system interconnections, co-location of facilities and joint financing and construction of regional infrastructure within the JPA/ILSBA Planning Areas.
Policy 4.2 Master Planning Consistency. Utilize the Joint Planning and Interlocal Service Boundary Agreement (JPA/ILSBA)between the City of Venice and Sarasota County to ensure the City’s utility master plans are coordinated with applicable local, regional, state, and federal partner plans.
Policy 4.3 Joint Planning Area and Extrajurisdictional Planning Areas.
Coordinate infrastructure and public services in the JPA/ILSBA Planning Areas and Extrajurisdictional Planning Areas with Sarasota County and private property owners as established in the JPA/ILSBA.
Policy 4.4 Infrastructure Coordination. Coordinate with partner entities including
Sarasota County and SWFWMD on infrastructure planning in undeveloped parts of the City in order to ensure: A. New infrastructure is sensitive to environmental resources. B. Coordination of infrastructure capital improvement and impact fee
expenditures within Extrajurisdictional Planning Areas with Sarasota County.
C. Execution of developer agreements through which private developers construct infrastructure enhancements that meet community needs while limiting public impact.

_________________________________________________________________________ April, 2010 58
D. Alternative funding strategies, such as Community Development Districts, are considered to limit the impact on public expenditures.
Policy 4.5 Ground Water Resource Coordination. Coordinate with SWFWMD,
Peace River / Manasota Water Supply Authority, and other water related agencies and organizations on the identification and protection of artesian aquifers and natural ground water recharge areas.
Policy 4.6 Regional Water Supply System. Continue to cooperate with partner
entities including Sarasota County, SWFWMD, and Peace River/Manasota Water Supply Authority regarding an interconnected potable water supply system, regional water planning, and coordination of supply system lines.
Objective 5 Potable Water Supply. To provide a reliable supply of potable water to meet the needs of existing and future development through the development and implementation of a 10-Year Water Supply Facilities Work Plan.
Policy 5.1 Potable Water Supply Inventory. Continue to maintain up to date
inventories indicating the available capacity and present demand for potable water in the City of Venice potable water service area.
Policy 5.2 Potable Water Conservation. Maximize water efficiency by supporting
FGBC and/or LEED criteria and SWFWMD programs such as the Water Conservation Hotel and Motel Program (Water CHAMP), the Water Program for Restaurant Outreach (Water Pro) and the Florida Star Gold (residential) program.
Policy 5.3 Potable Water Capital Improvements. Through updates to the Capital
Improvement Plan, the City shall identify and give priority to projects that correct identified potable water system facility deficiencies.
Policy 5.4 Potable Water Availability. Evaluate proposed land use changes to
ensure availability of potable water supplies and potable water supply facilities.
Policy 5.5 Development Orders. Prior to issuance of a development order the
City shall utilize the Concurrency Management System to ensure development is served by adequate potable water services and facilities.
Policy 5.6 Water Shortage. The City will abide by Southwest Florida Water
Management District’s emergency water shortage plan, and when necessary, the City may implement more restrictive water conservation

_________________________________________________________________________ April, 2010 59
measures, as may be required to protect and maintain the potable water utility system.
Policy 5.7 10-Year Water Supply Facilities Work Plan. The City will coordinate
with SWFWMD and amend the Comprehensive Plan to incorporate any required updates to the 10-Year Water Supply Facilities Work Plan within eighteen months after an update to the Regional Water Supply Plan is approved by SWFWMD. The update will include an evaluation of impacts from developments and plan amendments approved in the interim.
CONSERVATION & OPEN SPACE ELEMENT Objective 1 Sustainable Environmental Practices. Implement sustainable
environmental practices that minimize impacts to natural habitats caused by the development of land.
Policy 1.1 Sustainable Land Development Strategies. By 2012, evaluate the
following sustainable land development strategies through the City’s Land Development Regulations to protect natural habitats and conservation lands by making the best use of urbanized land areas. The strategies to be evaluated include: A. Reduction of impermeable surface areas. B. Infill and redevelopment practices that enhance Venice’s unique
character. C. Removal of invasive non-native plant species and immediate
replacement with native Florida plant species. D. Utilize conservation easements, transfer of development rights,
open space set-aside, wetland protection, and environmental lands programs to direct new growth from these areas.
Policy 1.7 Green Building Strategies. Support green building strategies that
mitigate the environmental impacts that result from the construction of buildings and development of land, including:
A. Consider the site’s location in relation to the sun and other sources of renewable energy, access to transportation alternatives, and availability of water and natural resources.
B. Reduce use of building materials by creating open floor plans, building smaller units, and more compact, efficient design.
C. Encourage “Florida Friendly” landscaping. D. Maximize water efficiency by supporting SWFWMD water
conservation programs such as the Water Conservation Hotel and Motel Program (Water CHAMP), the Water Program for Restaurant Outreach (Water Pro) and the Florida Water Star Gold (residential) Program.

_________________________________________________________________________ April, 2010 60
.E. Make smart use of materials and resources. F. Reuse, recycle, and reduce amount of waste products. G. Safeguard indoor environmental quality. H. FGBC and/or LEED criteria.
Policy 1.8 Low-Impact Development Site Design Practices. Reduce the amount
of stormwater runoff by utilizing Low-Impact Development (LID) Site Design Practices including: A. Reduced impervious area through use of permeable pavement
surfaces, reduced parking widths, shared parking resources, and compact development (e.g, clustered homes and mixed-use).
B. Reduced clearing of existing natural resources. C. Use of natural drainage/hydrology as a design element D. Landscaping of stormwater retention ponds to prevent erosion,
encourage bioretention and biofiltration of pollutants, and enhance appearance
E. Use of “Florida Friendly” ground cover. F. Use of green infrastructure for infill and redevelopment projects
(e.g., green roofs, landscaped swales, etc.) G. Reduction of fertilizer runoff.
Policy 1.10 Wetland and Aquifer Recharge Areas Protection. The City shall
protect its groundwater sources, particularly in wetland and aquifer recharge areas, through its site and development review process by: A. Directing development to first avoid impact to wetlands and
aquifer recharge areas. B. When impacts to wetlands and aquifer recharge areas are
unavoidable, directing development to minimize impact and then mitigate for impacts to wetlands and aquifer recharge areas.
C. Limiting activities that are known to adversely impact such areas. D. Requiring that site plans include an identification and analysis of
natural drainage features, man-made drainage structures, and impact of the proposed development on drainage and topographic features.
E. Coordinating with federal and state review agencies on the designation of and permitting within such areas.
F. Wetlands shall be restored in connection with new development, where feasible.
G. The natural flow of water within and through contiguous wetlands shall not be impeded.
H. Buffers of existing upland vegetation that protect the function and values of the wetlands from the adverse impacts of adjacent development will be required.
I. The amount of wetland mitigation required will be based upon the most current state-approved methodology.

_________________________________________________________________________ April, 2010 61
Policy 1.11 Water Resource Protection. The City will coordinate with other
governmental and private entities to protect water resources.
Policy 1.12 Water Conservation. Utilize the “Florida Yards and Neighborhoods” program to promote water conservation and the maintenance of surface water quality through of the use of native plant materials in landscaping.
Policy 3.18 Control and Monitoring of Water Pollutants. The City shall protect the
water quality of its wetlands, rivers, streams, bays, and coastal areas by coordinating with Sarasota County on the monitoring and elimination of point and nonpoint sources of pollution to the City’s waterways. A. The City will continue to participate in an ambient water quality-
monitoring program and to conduct baseline assessments of water quality in City water bodies.
B. The City will maintain a program of water quantity and quality data collection and analysis.
Policy 3.19 Runoff Filtration Processes. The City will continue to utilize
appropriate stormwater filtration processes to purify stormwater runoff before the runoff filtrates into surface waters and natural water systems. Methods to be utilized include, but are not limited to: A. Bio-retention strips or rain gardens (i.e., grass buffers, sand beds,
and ponding areas). B. Vegetative buffers, swales, and filter strips. C. Disconnected impervious areas and separate localized water
detention cells. D. Cistern collection systems. E. Regular sweeping of paved surfaces areas. F. Planted littoral zones to provide water quality treatment for surface
water and wildlife habitat. G. Promote the use of pervious concrete or asphalt on beach parking
lots, drives, accesses, etc. H. Continue to pre-treat stormwater runoff from new development
prior to its discharge so stormwater runoff does not violate applicable local, state or federal water quality standards or degrade the quality of the receiving water body.
Policy 3.20 Groundwater Resources. The City shall protect and conserve surface
and groundwater resources and require that land use and development activities in important groundwater recharge areas be consistent with water resource protection criteria established by the Southwest Florida Water Management District.
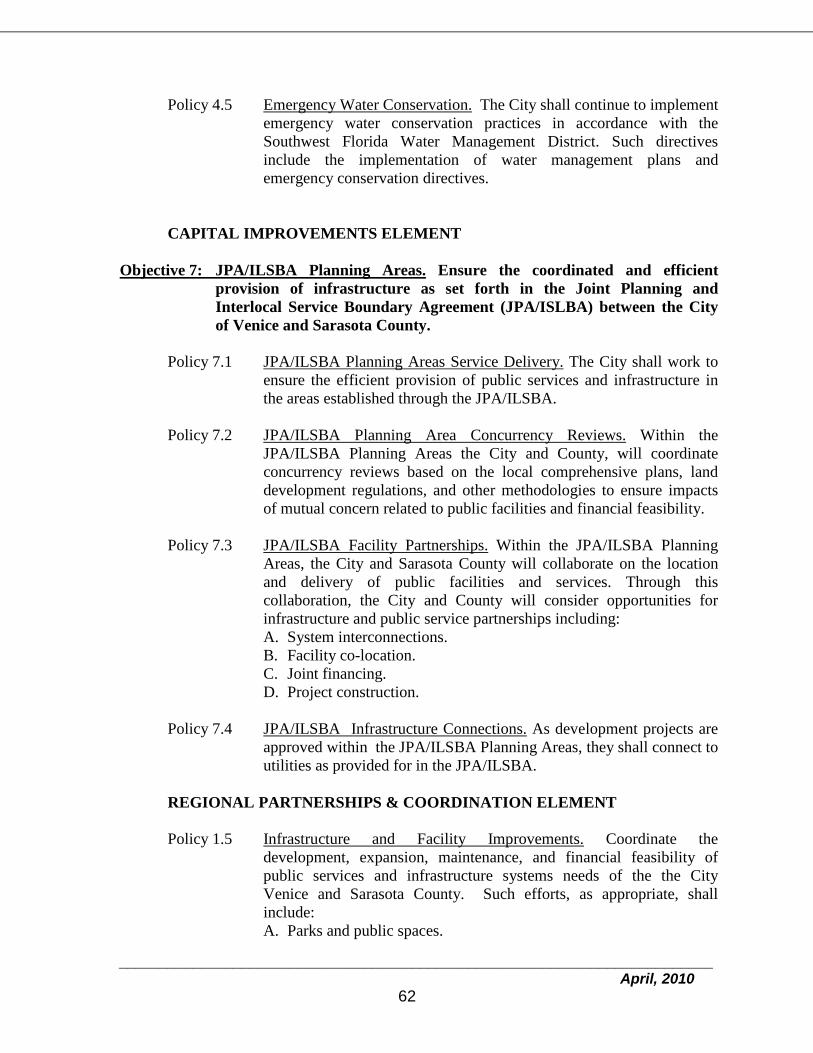
_________________________________________________________________________ April, 2010 62
Policy 4.5 Emergency Water Conservation. The City shall continue to implement emergency water conservation practices in accordance with the Southwest Florida Water Management District. Such directives include the implementation of water management plans and emergency conservation directives.
CAPITAL IMPROVEMENTS ELEMENT Objective 7: JPA/ILSBA Planning Areas.
Ensure the coordinated and efficient provision of infrastructure as set forth in the Joint Planning and Interlocal Service Boundary Agreement (JPA/ISLBA) between the City of Venice and Sarasota County.
Policy 7.1 JPA/ILSBA Planning Areas Service Delivery. The City shall work to ensure the efficient provision of public services and infrastructure in the areas established through the JPA/ILSBA.
Policy 7.2 JPA/ILSBA Planning Area Concurrency Reviews. Within the
JPA/ILSBA Planning Areas the City and County, will coordinate concurrency reviews based on the local comprehensive plans, land development regulations, and other methodologies to ensure impacts of mutual concern related to public facilities and financial feasibility.
Policy 7.3 JPA/ILSBA Facility Partnerships. Within the JPA/ILSBA Planning
Areas, the City and Sarasota County will collaborate on the location and delivery of public facilities and services. Through this collaboration, the City and County will consider opportunities for infrastructure and public service partnerships including: A. System interconnections. B. Facility co-location. C. Joint financing. D. Project construction.
Policy 7.4 JPA/ILSBA Infrastructure Connections. As development projects are
approved within the JPA/ILSBA Planning Areas, they shall connect to utilities as provided for in the JPA/ILSBA.
REGIONAL PARTNERSHIPS & COORDINATION ELEMENT
Policy 1.5 Infrastructure and Facility Improvements. Coordinate the
development, expansion, maintenance, and financial feasibility of public services and infrastructure systems needs of the the City Venice and Sarasota County. Such efforts, as appropriate, shall include: A. Parks and public spaces.

_________________________________________________________________________ April, 2010 63
B. Library systems. C. Utility systems (potable water, wastewater, stormwater, reclaimed
water and solid waste). D. Schools and educational services. E. Emergency management services. F. Transportation systems including roadways, urban trails, and
transit resources. Policy 1.8 Long Range Planning. The City shall coordinate its future
development projects and long range planning efforts with its local, regional, and state partners including Sarasota County, Southwest Florida Regional Planning Council (SWFRPC), Southwest Florida Water Management District (SWFWMD), Sarasota-Manatee Metropolitan Planning Organization (MPO), Sarasota County School Board, and State of Florida. Such efforts, as appropriate, shall include: A. Review of proposed comprehensive plan amendments. B. Development of long range plans for public services and
infrastructure systems such as: utilities, transportation, parks, and schools.
C. Execution of developer agreements through which private developers construct infrastructure enhancements that meet community needs while limiting public expenditures.
D. Planning of infrastructure capital improvement and impact fee expenditures within Extrajurisdictional planning areas and JPA/ILSBA Planning Areas.
E. Development of community housing opportunities.
Objective 2 Level of Service Coordination. Maintain an adequate level of service for each of the City’s public service and infrastructure systems in coordination with the City’s local, regional, and state partners.
Policy 2.1 Level of Service Standards. Ensure that the established level of service
standards for parks and recreation, potable water, wastewater, stormwater, solid waste, schools, and transportation systems are maintained in coordination with the City’s established intergovernmental partnerships and agreements.
Objective 3 Cooperative Work Efforts. The City shall coordinate work efforts with its
local, regional, state, and federal partner agencies in order to ensure effective and efficient delivery of services and use of community resources. Coordinated work efforts shall address coordination of the following public services and infrastructure systems: A. Parks and recreation. B. Conservation and natural resource protection. C. Coastal and waterway management.
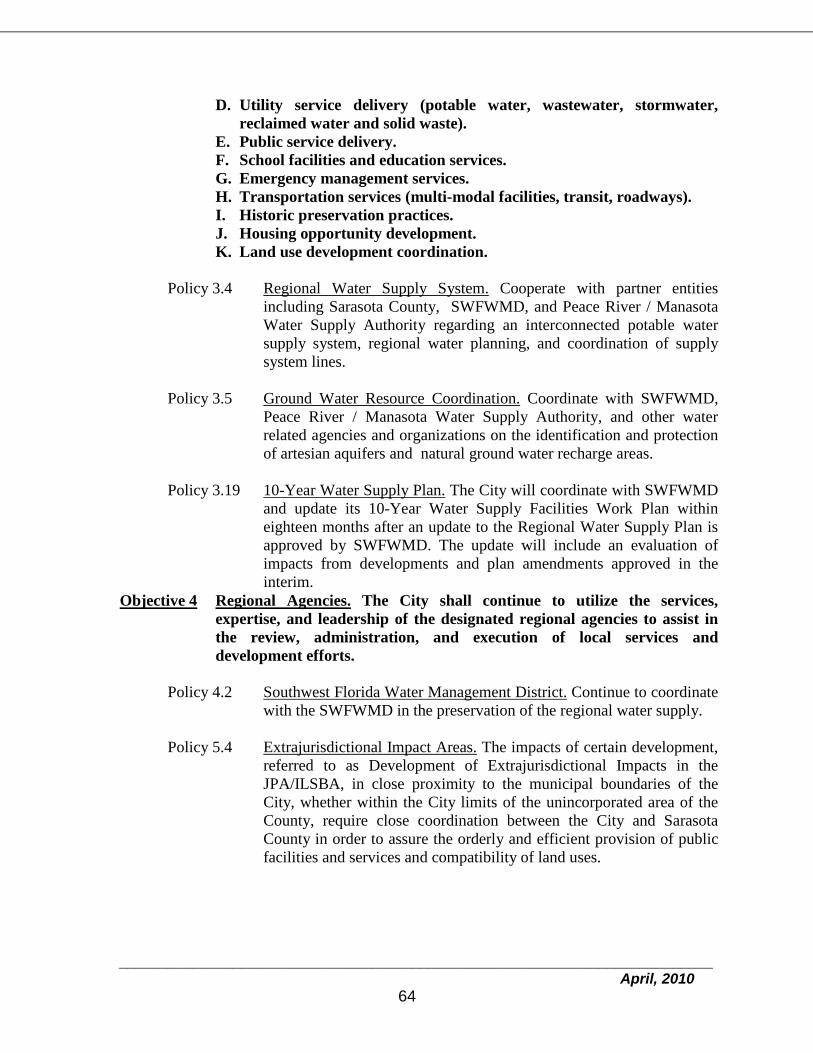
_________________________________________________________________________ April, 2010 64
D. Utility service delivery (potable water, wastewater, stormwater, reclaimed water and solid waste).
E. Public service delivery. F. School facilities and education services. G. Emergency management services. H. Transportation services (multi-modal facilities, transit, roadways). I. Historic preservation practices. J. Housing opportunity development. K. Land use development coordination.
Policy 3.4 Regional Water Supply System. Cooperate with partner entities including Sarasota County, SWFWMD, and Peace River / Manasota Water Supply Authority regarding an interconnected potable water supply system, regional water planning, and coordination of supply system lines.
Policy 3.5 Ground Water Resource Coordination. Coordinate with SWFWMD,
Peace River / Manasota Water Supply Authority, and other water related agencies and organizations on the identification and protection of artesian aquifers and natural ground water recharge areas.
Policy 3.19 10-Year Water Supply Plan. The City will coordinate with SWFWMD
and update its 10-Year Water Supply Facilities Work Plan within eighteen months after an update to the Regional Water Supply Plan is approved by SWFWMD. The update will include an evaluation of impacts from developments and plan amendments approved in the interim.
Objective 4 Regional Agencies. The City shall continue to utilize the services, expertise, and leadership of the designated regional agencies to assist in the review, administration, and execution of local services and development efforts.
Policy 4.2 Southwest Florida Water Management District. Continue to coordinate with the SWFWMD in the preservation of the regional water supply.
Policy 5.4 Extrajurisdictional Impact Areas. The impacts of certain development,
referred to as Development of Extrajurisdictional Impacts in the JPA/ILSBA, in close proximity to the municipal boundaries of the City, whether within the City limits of the unincorporated area of the County, require close coordination between the City and Sarasota County in order to assure the orderly and efficient provision of public facilities and services and compatibility of land uses.

_________________________________________________________________________ April, 2010 65
APPENDIX

!(!( !( !(
!(
!(
!(
!(
!(
!(!(
!(
!( !(
TAMIAMI TRL
VENI
CE A
VE
PINEBROOK RD
LAUR
EL R
D
ALBEE FARM RD
SR 681
CENT
ER R
D
JACARANDA BLVD
§̈¦75
§̈¦75
§̈¦75
£¤41
£¤41
£¤41
RO1A
/65
RO4W
/35
RO3E
/55RO
4E/56
RO7E
/78
RO6E
/77
RO5E
/57
RO2E
/54
RO1E
/52
RO8W
/50
RO7W
/51
RO3W
/34
RO2A
/49
RO2W
/33
Water
Supp
ly Fac
ilities
Work P
lanMa
p 1
Myakka River
Gulf of Mexico
:Pr
epar
ed M
arch
201
0by
City o
f Veni
ce
00.
51
0.25
Mile
s
Sour
ce:
City
of V
enice
GIS
/ Ut
ilitie
s Dep
artm
ent,
Mar
ch 1
2, 2
010.
Suppl
y Wells
Max
. Per
mitt
ed W
ithdr
awal
(GPD
)
!(<
650,
000
!(65
0,00
0 - 8
00,0
00
!(>
800,
000
Maj
or R
oads
Min
or R
oads
City
of V
enic
e Li
mits
Sara
sota
Cou
nty

TAMIAMI TRL
VENI
CE A
VE
PINEBROOK RD
LAUR
EL R
D
ALBEE FARM RD
SR 681
CENT
ER R
D
JACARANDA BLVD
§̈¦75
§̈¦75
§̈¦75
£¤41
£¤41
£¤41
Water
Supp
ly Fac
ilities
Work P
lanMa
p 2
Myakka River
Gulf of Mexico
:Pr
epar
ed M
arch
201
0by
City o
f Veni
ce
00.
51
0.25
Mile
s
Sour
ce:
City
of V
enice
GIS
/ Ut
ilitie
s Dep
artm
ent,
Mar
ch 1
2, 2
010.
Water
Treat
ment
Faciliti
es
Maj
or R
oads
Min
or R
oads
City
of V
enic
e Li
mits
Sara
sota
Cou
nty
RO W
ater
Tre
atm
ent P
lant
_̂

TAMIAMI TRL
VENI
CE A
VE
PINEBROOK RD
LAUR
EL R
D
ALBEE FARM RD
SR 681
CENT
ER R
D
JACARANDA BLVD
§̈¦75
§̈¦75
§̈¦75
£¤41
£¤41
£¤41
Water
Supp
ly Fac
ilities
Work P
lanMa
p 3
Myakka River
Gulf of Mexico
:Pr
epar
ed M
arch
201
0by
City o
f Veni
ce
00.
51
0.25
Mile
s
Distrib
ution
Lines
Wat
er L
ines
Maj
or R
oads
Min
or R
oads
City
of V
enic
e Li
mits
Sara
sota
Cou
nty
Sour
ce:
City
of V
enice
GIS
/ Ut
ilitie
s Dep
artm
ent,
Mar
ch 1
2, 2
010.

!
!
TAMIAMI TRL
VENI
CE A
VE
PINEBROOK RD
LAUR
EL R
D
ALBEE FARM RD
SR 681
CENT
ER R
D
JACARANDA BLVD
§̈¦75
§̈¦75
§̈¦75
£¤41
£¤41
£¤41
Interc
onne
ction
Loca
tion 1
0"Alb
ee Fa
rm Ro
ad an
d Colo
nia La
ne
Interc
onne
ction
Loca
tion 8
"Co
untry
Club
Way
Betwe
enGu
lf Coa
st Wa
y and
Pine
land A
ve.
Gulf of Mexico
Water
Supp
ly Fac
ilities
Work P
lanMa
p 4
Myakka River
:Pr
epar
ed M
arch
201
0by
City o
f Veni
ce
00.
51
0.25
Mile
s
Existin
g Inter
connec
tions
w/Sara
sota C
ounty
!In
terc
onne
ctio
nsW
ater
Lin
esSi
ze (I
nche
s)0
- 34
- 67
- 910
- 12
13 -
24M
ajor
Roa
dsM
inor
Roa
dsC
ity o
f Ven
ice
Lim
itsSa
raso
ta C
ount
y
Sour
ce:
City
of V
enice
GIS
/ Ut
ilitie
s Dep
artm
ent,
Mar
ch 1
2, 2
010.

TAMIAMI TRL
VENI
CE A
VE
PINEBROOK RD
LAUR
EL R
DALBEE FARM RD
SR 681
CENT
ER R
D
JACARANDA BLVD
§̈¦75
§̈¦75
§̈¦75
£¤41
£¤41
£¤4111
8
7
4
10
7
2A2B
9A
5
61
9B
3 17
16
15
18
18
14
12
13
Water
Supp
ly Fac
ilities
Work P
lanMa
p 5
Myakka River
Gulf of Mexico
:Pr
epar
ed M
arch
201
0by
City o
f Veni
ce
01
20.
5M
iles
Joint P
lannin
g Area
Agree
ment
Exis
ting
Join
t Pla
nnin
g St
udy
Expe
cted
Vol
unta
ry A
nnex
atio
nC
oord
inat
ion
Area
(No
Ann
exat
ion)
Maj
or R
oads
Min
or R
oads
City
of V
enic
e Li
mits
Sara
sota
Cou
nty
Sour
ce:
City
of V
enice
GIS
/ Pl
annin
g &
Zoni
ng D
epar
tmen
t, M
arch
12,
201
0.

Appendix E
Potable Water Level of Service Memo (ARCADIS, March 2011)

Technical MemorandumPotable Water Level of Service
Date: March 21, 2011
To: William “Jim” Anderson, Lead Water Treatment Plant Operator – City of Venice
Copy: Len Bramble, PE; Utilities Director – City of Venice
Tim Hochuli, PE; Assistant Utilities Director – City of Venice
Ann Elder, PE, Ryan McKenna, PE –ARCADIS.
From: Amanda Savage, PE - ARCADIS.
Re: Potable Water Level of Service Technical Memorandum
Project No.: 5710010
Table of Contents 1.0 Purpose.................................................................................................................... 2
2.0 Background ............................................................................................................ 2
3.0 Governing Entity .................................................................................................... 2
4.0 Current Population Estimates .............................................................................. 3
5.0 Historic Per Capita Demand ................................................................................. 4
6.0 Potable Water Consumption by User Type ......................................................... 5
7.0 Recommendations .................................................................................................. 6
Abbreviations
BEBR Bureau of Economic and Business Research CM Commercial Classification DCA Department of Community Affairs ERU Equivalent Residential Unit FAC Florida Administrative Code gpd gallon per day gpcd gallons per capita per day IR Irrigation Service JPA/ILSB Joint Planning Area / Interlocal Service Boundary Agreement Area LOS Level of Service mgd million gallons per day MM Multi-Unit Classification RM Single-Family Detached Classification

Len Bramble, City of Venice March 21, 2011 Potable Water Level of Service Page 2 of 7
SWFWMD Southwest Florida Water Management District WA Water Service WUP Water Use Permit
1.0 Purpose
The purpose of this technical memorandum is to recommend an updated potable water level of service (LOS) for the City of Venice’s (City) Comprehensive Plan, 10-year Water Supply Facilities Work Plan and Water Master Plan. ARCADIS is currently underway on the second phase of the Water Master Plan for the City.
2.0 Background
The current LOS standard for potable water was established in the 1999 Comprehensive Plan. The standard was based on a Capacity Analysis Report prepared by Boyle Engineering in 1994. The methodology used for determining available capacity (consumption per unit) in the Capacity Analysis Report’s was based on Equivalent Residential Units (ERUs) and the three water use permit (WUP) withdrawal limitations: average annual flow, maximum monthly flow and maximum daily follow. At that time, the average annual flow was determined to be the most stringent and thus limiting factor for determining the LOS. The LOS was then applied to calculate the available capacity for future development. The City adopted the recommendations from the Capacity Analysis Report which set the annual average LOS at 152 gpd/ERU and the maximum day LOS at 227 gpd/ERU. The LOS has not been modified since the original creation in 1994.
As further discussed in Section 5.0, the actual usage within the City has declined since the creation of the current LOS in 1994. The difference between the current LOS and the City’s actual usage has prompted the City to update the comprehensive plan LOS.
3.0 Governing Entity
The Department of Community Affairs (DCA), which regulates comprehensive planning within the state of Florida, was contacted regarding state standards to calculate comprehensive plan LOSs. The DCA stated that they have not developed or issued any official standards and deferred advice on calculating LOS to the Southwest Florida Water Management District (SWFWMD), whose responsibilities include managing the water supply, protecting water quality and preserving natural systems that serve important water-related functions. As part of those responsibilities, SWFWMD was mandated by the Florida Legislature to create and implement water conservation regulations and is the governing entity responsible for issuing WUPs to the City.
Len Bramble, City of Venice March 21, 2011 Potable Water Level of Service Page 3 of 7
WUPs establish the maximum flow rate permitted for withdrawal from the aquifer, conservation measures the entity is required to enact, and special use conditions like sampling and metering requirements. SWFWMD uses WUPs to limit the amount of water withdrawn from the aquifers within the District and in doing so protects the water source. WUPs also limit the allowable per capita demand in order to conserve water within the District.
For comprehensive planning, SWFWMD recommends that utilities use an average of the past five years unadjusted gross per capita day demands for the LOS. This demand includes both commercial and residential usage and is based on a per capita basis rather than an ERU determination.
Since SWFWMD recommends this methodology, it is assumed that this method was utilized for the City’s recent WUP application. The WUP states that the gross per capita demand for the City is 79.4 gallons per capita per day (gpcd) in 2007 and increases to 90.3 gpcd in 2028.
4.0 Current Population Estimates
For the City’s Comprehensive Plan, the total population was estimated based on the combination of resident (permanent) and seasonal components, defined as the “functional population” in accordance with the Florida Administrative Code (FAC) Rule 9J-5.005(2)(e). The resident population was based on the medium range population estimates provided by the Bureau of Business and Economic Research (BEBR) and the seasonal population estimates were calculated using the methods provided by SWFWMD. The population discussion within this technical memorandum is based on and cited from the 10-year Water Supply Facilities Work Plan.
The City’s 2008 Public Supply Annual Report calculated the seasonal population and the functional population using “Functional Seasonal Resident Population” sourced from SWFWMD’s Water Use Permit Information Manual, Part D Requirements for the Estimation of Permanent and Temporal Service Area Populations). This methodology takes into account U.S. Census data, rather than BEBR projections. However, this method provides a seasonal population percentage which can be applied to the BEBR population estimates. Based on the 2008 Public Supply Annual Report, the City’s seasonal influx of population was estimated to be 18% of the City’s resident population.
Since the seasonal population is 18% of the resident population, the functional population can be calculated as 1.18 times the resident population.
Table 1 summarizes the City’s population estimates from 2000 to 2009 based on the 2009 Florida City and County Population Report provided by BEBR.

Len Bramble, City of Venice March 21, 2011 Potable Water Level of Service Page 4 of 7
Table 1: City of Venice Population Estimates
Year City of Venice Resident Population
City of Venice Seasonal Population
City of Venice Functional Population
2000 17,764 3,197 20,962 2001 18,151 3,267 21,418 2002 18,628 3,353 21,981 2003 19,290 3,472 22,762 2004 20,035 3,606 23,641 2005 20,800 3,744 24,544 2006 21,584 3,885 25,469 2007 22,149 3,986 26,136 2008 22,146 3,986 26,132 2009 21,845 3,932 25,777
5.0 Historic Per Capita Demand
The historic per capita demand is based on the total production flow of the City’s Water Treatment Plant divided by the annual functional population. The City’s historic water production rates and calculated per capita demand are summarized in Table 2. Figure 1 displays the historic per capita demand and shows the decline in per capita demand over time.
Table 2: City of Venice Historic Water Production Rates and per Capita Demand
Year City of Venice
Functional Population
Production Flows (mgd) Max Day Peaking Factor
per Capita Demand (gpcd) Annual
Average Max
Month Max Day
Annual Average
Max Month
Max Day
2000 20,962 2.23 2.76 3.32 1.5 107 132 158
2001 21,418 2.22 2.64 3.38 1.5 104 123 158
2002 21,981 2.26 2.71 3.42 1.5 103 123 156
2003 22,762 2.19 2.65 3.24 1.5 96 117 142
2004 23,641 2.26 2.64 3.19 1.4 96 111 135
2005 24,544 2.29 2.82 3.34 1.5 93 115 136
2006 25,469 2.27 2.61 3.54 1.6 89 102 139
2007 26,136 2.13 2.41 3.24 1.5 81 92 124
2008 26,132 2.03 2.51 3.59 1.8 78 96 137
2009 25,777 2.03 2.47 3.13 1.5 79 96 121
10-Year Average 1.5 93 111 141 5-Year Average (2005-2009) 1.6 84 100 132

Len Bramble, City of Venice March 21, 2011 Potable Water Level of Service Page 5 of 7
Figure 1: Historic per Capita Demand
The annual average per capita demand decreased from 93 to 84 gpcd and the max day demand decreased from 141 to 132 gpcd. The decline in demand per capita is most likely attributed to conservation efforts by the City and its residents. Some of the City’s conservation efforts include:
Higher utilization of reclaimed water, which replaced the need for potable water irrigation in locations where reclaimed water is available;
SWFMWD mandated watering restrictions, which were implemented in late 2006 and early 2007;
The City uses a tiered billing rate for potable water to encourage conservation by increasing the gallonage charge for high consumption quantities.
The City and other agencies offer rebates for low water appliances and fixtures.
6.0 Potable Water Consumption by User Type
The City classifies customer meters into several service types and class types. There are two service types for potable water; Water (WA) and Irrigation (IR). Within the two service types are three class types; commercial (CM), multi-unit (MM) and single-family detached residential (RM). Table 3 shows the historic water use by classification, the sum of which represents the entire billable water consumption within the City.
0
20
40
60
80
100
120
140
160
180
2000 2001 2002 2003 2004 2005 2006 2007 2008 2009
per C
apita
Dem
and (gpcd)
Annual AverageMax MonthMax Day

Len Bramble, City of Venice March 21, 2011 Potable Water Level of Service Page 6 of 7
Table 3: City of Venice Potable Water Use Distribution
Year Consumption (gallons) Percentage of Total Consumption
Total IR CM MM RM IR CM MM RM 2005 75,148,099 4,792,791 22,324,533 18,573,143 29,457,632 6.4% 29.7% 24.7% 39.2%
2006 74,742,010 5,777,489 22,276,601 18,340,312 28,347,608 7.7% 29.8% 24.5% 37.9%
2007 69,128,630 5,392,366 18,941,219 17,273,510 27,521,535 7.8% 27.4% 25.0% 39.8%
2008 66,769,943 4,218,440 20,749,774 15,490,865 26,310,864 6.3% 31.1% 23.2% 39.4%
2009 64,640,749 3,730,994 18,616,090 15,745,321 26,548,344 5.8% 28.8% 24.4% 41.1%
2010 64,719,069 4,152,715 19,050,669 15,227,478 26,288,207 6.4% 29.4% 23.5% 40.6%
Minimum 5.8% 27.4% 23.2% 37.9%
Average 6.6% 29.4% 24.2% 39.7%
Maximum 7.8% 31.1% 25.0% 41.1%
Over the past six years, residential consumption averages 64 percent of the total water use.
7.0 Recommendations
The historic water use shows that the per capita demand has declined over time, substantiating the City’s concern that the current LOS, created in 1994, is outdated and excessive.
The average water demand of the past five years is 84 gpcd. To provide a safety factor, ARCADIS recommends increasing the established annual average LOS to 90 gpcd. This LOS is also consistent with the per capita demand stated on the City’s current WUP. Furthermore, it is recommended that the maximum day LOS be established by using the 10-year maximum day peaking factor average of 1.5, which equates to 135 gpcd.
To measure the impact of adopting the recommended LOS on future water demands, a comparison of the future water demands based on the current LOS and the recommended
LOS is provided below. The population projections used were taken from the City’s 10-year Water Supply Facilities Work Plan. The Work Plan divides the total population
increase in two categories; Citywide and Joint Planning Area/Interlocal Service Boundary Agreement (JPA/ILSB). The Citywide demand projection is due to the portion of the
population increase within the existing service area. The JPA/ILSB demand projection is due to the portions of land surrounding the existing service area which are proposed to be
annexed into the City.
Table 4 shows a comparison of future water projections using the current annual average LOS of 152 gpd/ERU and the recommended annual average LOS of 90 gpcd.

Len Bramble, City of Venice March 21, 2011 Potable Water Level of Service Page 7 of 7
Table 4: Projected City Water Demands (Short-term, Long-Term, and Buildout)
Year Projected Water Demands (mgd)
Current LOS (152 gpd/ERU) Recommended LOS (90 gpcd) Citywide JPA/ILSB Total Citywide JPA/ILSB Total
2015 4.37 0.13 4.49 2.52 0.10 2.62
2030 5.75 0.81 6.56 3.10 0.12 3.22
Buildout 7.84 2.15 9.99 6.09 1.60 7.69