Water Supply and Sanitation in Liberia - WSP · Water Supply and Sanitation in Liberia: Turning...
32
An AMCOW Country Status Overview Water Supply and Sanitation in Liberia Turning Finance into Services for 2015 and Beyond
Transcript of Water Supply and Sanitation in Liberia - WSP · Water Supply and Sanitation in Liberia: Turning...
For enquiries, contact:Water and Sanitation Program–Africa RegionThe World Bank, Upper Hill RoadP.O. Box 30577, 00100, Nairobi, KenyaTel: +(254) 20 322 6300 E-mail: [email protected] site: www.wsp.org
An AMCOW Country Status Overview
Water Supply and Sanitation in LiberiaTurning Finance into Services for 2015 and Beyond
The first round of Country Status Overviews (CSO1) published in 2006 benchmarked the preparedness of sectors of 16 countries in Africa to meet the WSS MDGs based on their medium-term spending plans and a set of ‘success factors’ selected from regional experience. Combined with a process of national stakeholder consultation, this prompted countries to ask whether they had those ‘success factors’ in place and, if not, whether they should put them in place.
The second round of Country Status Overviews (CSO2) has built on both the method and the process developed in CSO1. The ‘success factors’ have been supplemented with additional factors drawn from country and regional analysis to develop the CSO2 scorecard. Together these reflect the essential steps, functions and results in translating finance into services through government systems – in line with Paris Principles for aid effectiveness. The data and summary assessments have been drawn from local data sources and compared with internationally reported data, and, wherever possible, the assessments have been subject to broad-based consultations with lead government agencies and country sector stakeholders, including donor institutions.
This second set of 32 Country Status Overviews (CSO2) on water supply and sanitation was commissioned by the African Ministers’ Council on Water (AMCOW). Development of the CSO2 was led by the World Bank administered Water and Sanitation Program (WSP) in collaboration with the African Development Bank (AfDB), the United Nations Children’s Fund (UNICEF), the World Bank and the World Health Organization (WHO).
This report was produced in collaboration with the Government of Liberia and other stakeholders during 2009/10. Some sources cited may be informal documents that are not readily available.
The findings, interpretations, and conclusions expressed in this volume do not necessarily reflect the views of the collaborating institutions, their Executive Directors, or the governments they represent. The collaborating institutions do not guarantee the accuracy of the data included in this work. The boundaries, colors, denominations, and other information shown on any map in this work do not imply any judgment on the part of the collaborating institutions concerning the legal status of any territory or the endorsement or acceptance of such boundaries.
The material in this publication is copyrighted. Requests for permission to reproduce portions of it should be sent to [email protected]. The collaborating institutions encourage the dissemination of this work and will normally grant permission promptly. For more information, please visit www.amcow.net or www.wsp.org.
Photograph credits: Getty Images/Chantal Richey/The World Bank
© 2011 Water and Sanitation Program

1
Water Supply and Sanitation in Liberia: Turning Finance into Services for 2015 and Beyond
Water Supply and Sanitation in LiberiaTurning Finance into Services for 2015 and Beyond
An AMCOW Country Status Overview

2
An AMCOW Country Status Overview
Strategic Overview
A 14-year civil conflict (1990–2003) undermined Liberia’s development prospects. However, in 2006, Liberia ushered in Africa’s first female president through a democratic process and has since been relatively stable. Momentous changes and reforms continue to accompany the post-conflict era. A poverty reduction strategy (PRS 2008–11) which includes water and sanitation, was developed and is being implemented, an Integrated Water Resource Management Policy as well as a Water Supply and Sanitation Policy (WSSP) were approved by the Liberian Cabinet in 2008 and 2009, respectively. Post-conflict reconstruction of service delivery and sustainability of existing infrastructure remain as the main challenges. A PRS2 (2012–17) is currently being developed and will be concluded by the end of 2011.
Government capacity to lead, coordinate, and deliver services was severely compromised by the conflict but is beginning to re-emerge with aspirations to make a full transition to a country-led process in service delivery, data management, regulation, and sector oversight. Recognizing that the policies were not being fully operationalized, the Government of Liberia and development partners negotiated the Liberia WASH Compact. This Compact, agreed in early 2011 as part of the Sanitation and Water for All (SWA) initiative, sets out four joint commitments on institutional capacity, equity, monitoring, and finance (see Section 4).
Under its first PRS, Liberia aims at increasing coverage to 50 percent of the population by 2011, from a reference point of 25 percent water coverage in 2008. For sanitation, the PRS initially targeted 40 percent of the population but this has been revised to 33 percent in 2008 owing to a sector assessment that pointed to slow progress. The second PRS
sets targets at 77 percent for water supply and 56 percent for improved sanitation. 1
If UNICEF/WHO Joint Monitoring Programme (JMP) data are used (68 percent for water), then Liberia could very easily achieve its Millennium Development Goal (MDG) water target but the sector consensus is that coverage rates are well below those reported by the JMP. In relation to improved sanitation (17 percent) both the MDG and PRS targets will require significant progress to meet the targets.
Financing to the sector remains weak. Current estimates of government financing are below 1 percent of the total annual domestic budget and these are mainly indicated as grants to the urban focused Liberia Water and Sewer Corporation (LWSC). Financing for rural areas was improved in 2009–10 through a major allocation to the Bureau responsible for rural water supply and sanitation. The bulk of the investment in rural sanitation is expected to be borne by households, with the current emphasis on the Community-Led Total Sanitation (CLTS) approach. There is no urban sanitation strategy to address Liberia’s rapidly growing urban population.
A well-articulated Sector Investment Plan will greatly enhance resource mobilization and utilization for the sector. A sector strategic plan, which includes a basic investment plan, is due to be launched in 2011. The investment plan should be developed further to detail subsector requirements and anticipated sources of funds, including how complementary funding from revenues from users could be used to sustain services. This AMCOW Country Status Overview has been produced in collaboration with the Government of Liberia and other stakeholders.
An AMCOW Country Status Overview
2

3
Water Supply and Sanitation in Liberia: Turning Finance into Services for 2015 and Beyond
Rural water supply• At community level, enforce cost recovery and local management of water points by Community Water and Sanitation
Committees where they are not already established.
• At county level, build capacity to manage spare-part supply-chains and train pump mechanics.
• At national level, improve the registration, vetting, and quality control of pump installers and roll out technical guidelines on handpumps and water quality.
Water Supply and Sanitation in Liberia: Turning Finance into Services for 2015 and Beyond
Agreed priority actions to tackle these challenges, and ensure finance is effectively turned into services, are:
Sectorwide• Operationalize the WSSP and its proposed institutions in consultation with stakeholders.
• Undertake a sector capacity needs assessment, and resource institutions to play assigned roles.
• Prioritize WASH and increase the level of sector funding by linking PRS II and MDG targets to the domestic budget process.
• Work towards a Sector-Wide Approach to:
o Capture and coordinate development partner budget and expenditure on WASH; o Build a national information management system for the sector that consolidates reporting on schemes being built
and monitors functionality; and o Institute an annual multistakeholder review to evaluate progress and set priority actions for the sector.
Urban water supply• Develop an urban water sector investment plan aligned to the sector strategic plan.
• Develop a financing strategy that puts the LWSC in a position to carry out basic efficiency improvements in its operations.
Rural sanitation and hygiene• Clarify the institutional lead for sanitation and scale up CLTS.
• Adapt and adopt a nationwide hygiene promotion toolkit to scale up current levels of progress.
Urban sanitation and hygiene• Develop appropriate sanitation technologies for densely populated urban slums.
• Clarify strategy for the promotion of sanitation in low income and peri-urban communities.
• Identify low cost sanitation/sewerage options including small-bore sewerage and decentralized, neighborhood-based treatment plants.
3
4
An AMCOW Country Status Overview

5
Water Supply and Sanitation in Liberia: Turning Finance into Services for 2015 and Beyond
Acronyms and Abbreviations ........................................................................................................................... 6
1. Introduction .................................................................................................................................................... 7
2. Sector Overview: Coverage and Finance Trends ............................................................................................... 8
3. Reform Context: Introducing the CSO2 Scorecard ......................................................................................... 11
4. Institutional Framework ................................................................................................................................ 13
5. Financing and Its Implementation .................................................................................................................. 16
6. Sector Monitoring and Evaluation ................................................................................................................. 18
7. Subsector: Rural Water Supply ...................................................................................................................... 19
8. Subsector: Urban Water Supply ..................................................................................................................... 22
9. Subsector: Rural Sanitation and Hygiene ....................................................................................................... 24
10. Subsector: Urban Sanitation and Hygiene ...................................................................................................... 26
Notes and References ................................................................................................................................... 28
Contents

6
An AMCOW Country Status Overview
Acronyms and Abbreviations
AfDB African Development BankAMCOW African Ministers’ Council on WaterCAPEX Capital expenditureCLTS Community-Led Total SanitationCSO2 Country Status Overviews (second round)CWSC Community Water and Sanitation
Committees
DCMHyP Directorate for Community Mobilization and Hygiene Promotion
DEOH Division of Environmental and Occupational Health
GDP Gross domestic productGNI Gross national incomeGoL Government of LiberiaHH HouseholdHIPC Highly Indebted Poor CountriesIWRMP Integrated Water Resource
Management PolicyJMP Joint Monitoring Programme (UNICEF/WHO)LIC Low Income CountryLWSC Liberia Water and Sewer CorporationM&E Monitoring and evaluationMCC Monrovia City CorporationMDG Millennium Development GoalMICS Multiple-Indicator Cluster Survey (UNICEF)MoE Ministry of EducationMoF Ministry of FinanceMoHSW Ministry of Health and Social WelfareMoLME Ministry of Lands, Mines and Energy
MoPW Ministry of Public WorksMTEF Medium-Term Expenditure FrameworkNGO Nongovernmental organizationNWRSB National Water Resources and
Sanitation Board NWSHPC National Water Sanitation and Hygiene
Promotion CommitteeNWSSC National Water Supply and
Sanitation CommissionOECD Organisation for Economic Cooperation and
DevelopmentOPEX Operations expenditurePRS Poverty Reduction StrategyPRS1 First Poverty Reduction StrategyPRS2 Second Poverty Reduction StrategyPRSP Poverty Reduction Strategy PaperRSH Rural sanitation and hygieneRWS Rural water supplyRWSSB Rural Water Supply and Sanitation BureauSIP Sector Investment Plan SSA Sub-Saharan AfricaSWA Sanitation and Water for AllSWAp Sector-Wide ApproachUSH Urban sanitation and hygieneUWS Urban water supplyWASH Water, sanitation and hygieneWatSan Water and SanitationWHO World Health OrganizationWSP Water and Sanitation ProgramWSSP Water Supply and Sanitation Policy
7
Water Supply and Sanitation in Liberia: Turning Finance into Services for 2015 and Beyond
1. Introduction
The African Ministers’ Council on Water (AMCOW) commissioned the production of a second round of Country Status Overviews (CSOs)2 to better understand what underpins progress in water supply and sanitation and what its member governments can do to accelerate that progress across countries in Sub-Saharan Africa (SSA). AMCOW delegated this task to the World Bank’s Water and Sanitation Program and the African Development Bank who are implementing it in close partnership with UNICEF and WHO in over 30 countries across SSA. This CSO2 report has been produced in collaboration with the Government of Liberia and other stakeholders during 2009/10.
The analysis aims to help countries assess their own service delivery pathways for turning finance into water supply and sanitation services in each of four subsectors: rural and urban water supply, and rural and urban sanitation and hygiene. The CSO2 analysis has three main components: a review of past coverage; a costing model to assess the adequacy of future investments; and a scorecard which allows diagnosis of particular bottlenecks along the service delivery pathway. The CSO2’s contribution is to answer not only whether past trends and future finance are sufficient to meet sector targets, but what specific issues need to be addressed to ensure finance is effectively turned into accelerated coverage in water supply and sanitation. In this spirit, specific priority actions have been identified through consultation. A synthesis report, available separately, presents best practice and shared learning to help realize these priority actions.
8
An AMCOW Country Status Overview
2. Sector Overview: Coverage and Finance Trends
Coverage: Assessing Past Progress
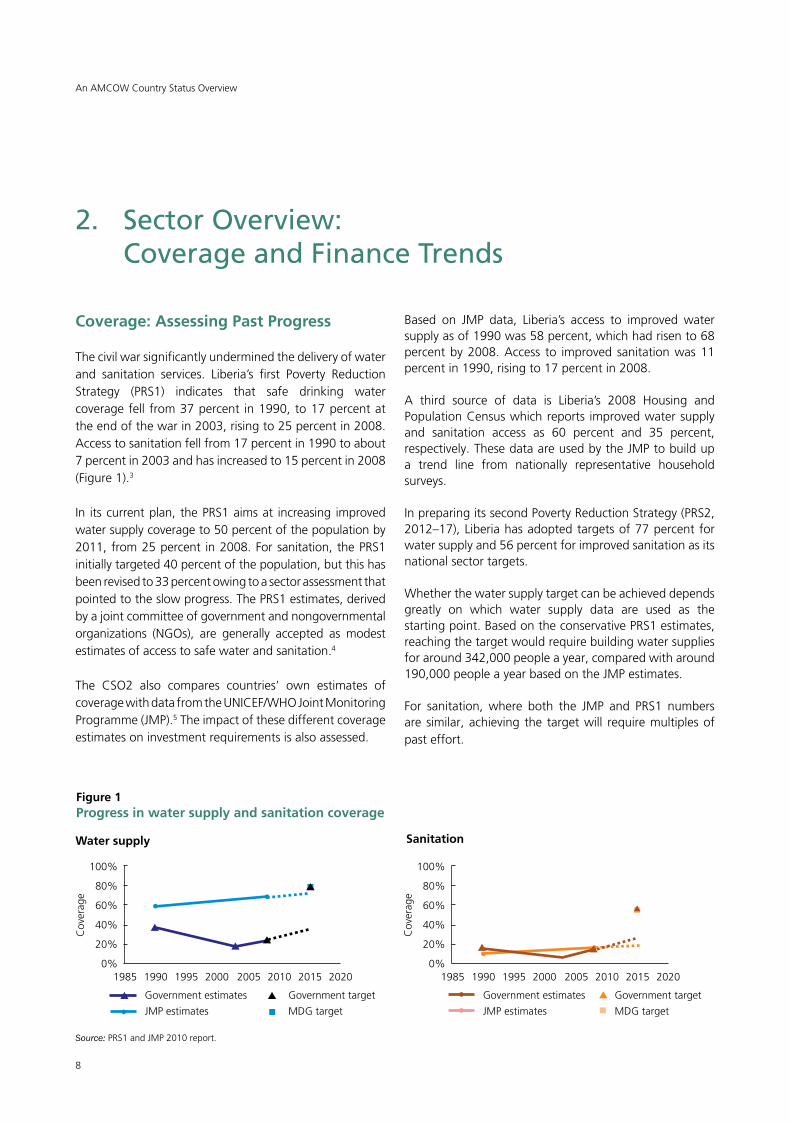
The civil war significantly undermined the delivery of water and sanitation services. Liberia’s first Poverty Reduction Strategy (PRS1) indicates that safe drinking water coverage fell from 37 percent in 1990, to 17 percent at the end of the war in 2003, rising to 25 percent in 2008. Access to sanitation fell from 17 percent in 1990 to about 7 percent in 2003 and has increased to 15 percent in 2008 (Figure 1).3
In its current plan, the PRS1 aims at increasing improved water supply coverage to 50 percent of the population by 2011, from 25 percent in 2008. For sanitation, the PRS1 initially targeted 40 percent of the population, but this has been revised to 33 percent owing to a sector assessment that pointed to the slow progress. The PRS1 estimates, derived by a joint committee of government and nongovernmental organizations (NGOs), are generally accepted as modest estimates of access to safe water and sanitation.4
The CSO2 also compares countries’ own estimates of coverage with data from the UNICEF/WHO Joint Monitoring Programme (JMP).5 The impact of these different coverage estimates on investment requirements is also assessed.
Based on JMP data, Liberia’s access to improved water supply as of 1990 was 58 percent, which had risen to 68 percent by 2008. Access to improved sanitation was 11 percent in 1990, rising to 17 percent in 2008.
A third source of data is Liberia’s 2008 Housing and Population Census which reports improved water supply and sanitation access as 60 percent and 35 percent, respectively. These data are used by the JMP to build up a trend line from nationally representative household surveys.
In preparing its second Poverty Reduction Strategy (PRS2, 2012–17), Liberia has adopted targets of 77 percent for water supply and 56 percent for improved sanitation as its national sector targets.
Whether the water supply target can be achieved depends greatly on which water supply data are used as the starting point. Based on the conservative PRS1 estimates, reaching the target would require building water supplies for around 342,000 people a year, compared with around 190,000 people a year based on the JMP estimates.
For sanitation, where both the JMP and PRS1 numbers are similar, achieving the target will require multiples of past effort.
Figure 1Progress in water supply and sanitation coverage
Source: PRS1 and JMP 2010 report.
100%
80%
60%
40%
20%
0%1985 1990 1995 2000 2005 2010 2015 2020
Government estimates Government target
Cov
erag
e
100%
80%
60%
40%
20%
0%1985 1990 1995 2000 2005 2010 2015 2020
Government targetGovernment estimates
Cov
erag
e
JMP estimates MDG target JMP estimates MDG target
Sanitation Water supply
9
Water Supply and Sanitation in Liberia: Turning Finance into Services for 2015 and Beyond
Investment Requirements: Testing the Sufficiency of Finance
An estimate of the investment required to meet the national 2015 targets was developed using the CSO2 costing model, using data on coverage, technology mix and lifespan, unit costs, and user contribution policy. The CSO2 costing model allows estimated capital investment (CAPEX) requirements to be compared with anticipated public investment, and the assumed contribution from households.6 Investment requirements for operations and maintenance (OPEX) are assessed separately.
The financing requirements to meet the PRS2/Millennium Development Goal (MDG) targets for water and sanitation, presented below, are based on the PRS1 coverage estimates of 25 percent for water supply and 15 percent for sanitation in 2008.
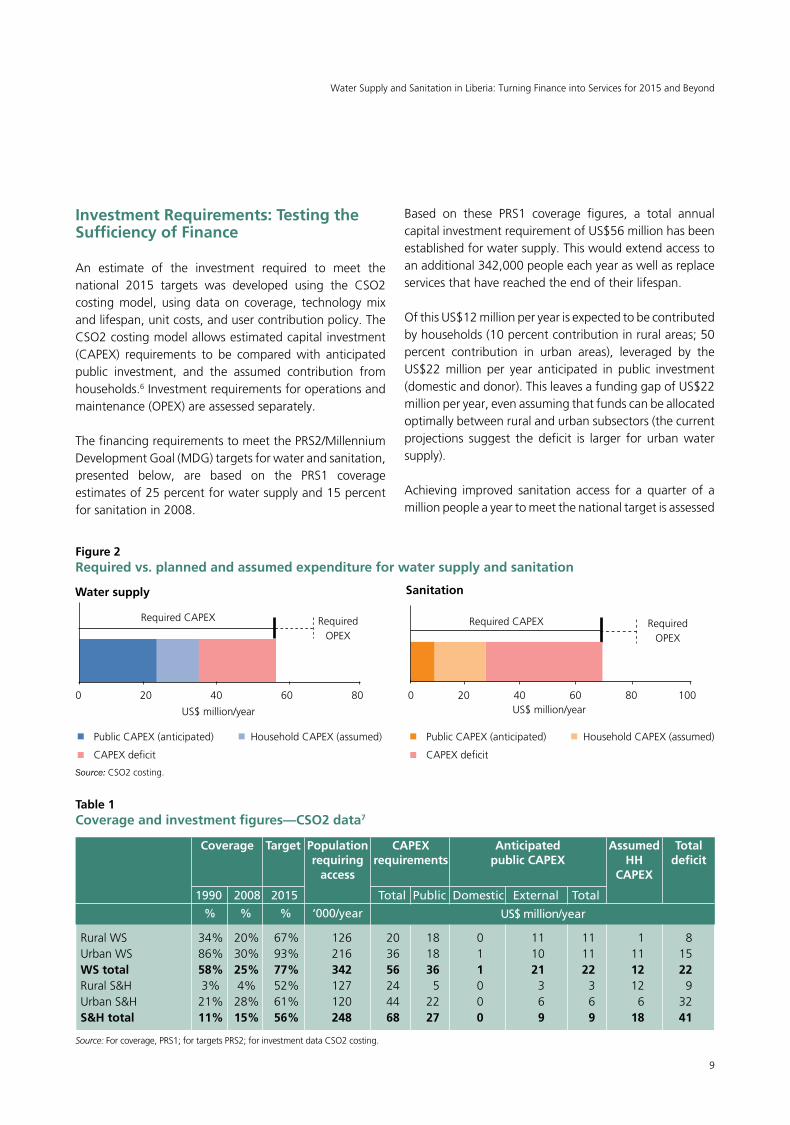
Based on these PRS1 coverage figures, a total annual capital investment requirement of US$56 million has been established for water supply. This would extend access to an additional 342,000 people each year as well as replace services that have reached the end of their lifespan.
Of this US$12 million per year is expected to be contributed by households (10 percent contribution in rural areas; 50 percent contribution in urban areas), leveraged by the US$22 million per year anticipated in public investment (domestic and donor). This leaves a funding gap of US$22 million per year, even assuming that funds can be allocated optimally between rural and urban subsectors (the current projections suggest the deficit is larger for urban water supply).
Achieving improved sanitation access for a quarter of a million people a year to meet the national target is assessed
Sanitation Water supply
Figure 2Required vs. planned and assumed expenditure for water supply and sanitation
Source: CSO2 costing.
Table 1Coverage and investment figures—CSO2 data7
Coverage Target Population CAPEX Anticipated Assumed Total requiring requirements public CAPEX HH deficit access CAPEX
1990 2008 2015 Total Public Domestic External Total
% % % ‘000/year Rural WS 34% 20% 67% 126 20 18 0 11 11 1 8Urban WS 86% 30% 93% 216 36 18 1 10 11 11 15WS total 58% 25% 77% 342 56 36 1 21 22 12 22Rural S&H 3% 4% 52% 127 24 5 0 3 3 12 9Urban S&H 21% 28% 61% 120 44 22 0 6 6 6 32S&H total 11% 15% 56% 248 68 27 0 9 9 18 41
US$ million/year
Required CAPEX Required OPEX
US$ million/year0 20 40 60 80
Required CAPEX Required OPEX
US$ million/year
Public CAPEX (anticipated) Household CAPEX (assumed)
CAPEX deficit
0 20 40 60 80 100
Public CAPEX (anticipated) Household CAPEX (assumed)
CAPEX deficit
Source: For coverage, PRS1; for targets PRS2; for investment data CSO2 costing.
10
An AMCOW Country Status Overview
These considerations are only part of the picture. Bottlenecks can, in fact, occur throughout the service delivery pathway—all the institutions, processes and actors that translate sector funding into sustainable services. Where the pathway is well developed, sector funding should turn into services at the estimated unit costs. Where it is not, the above investment requirements may be gross underestimates. The rest of this report evaluates the service delivery pathway in its entirety, locating the bottlenecks and presenting the agreed priority actions to help address them.
Table 2Annual OPEX requirements
Subsector OPEX US$ million/year
Rural water supply 3Urban water supply 8Water supply total 11Rural sanitation 2Urban sanitation 11Sanitation total 13
Source: CSO2 estimates.
at US$68 million annually, out of which public investment requirements are US$27 million annually. The bulk of the investment in rural sanitation is expected to be borne by households, with the current emphasis on Community-Led Total Sanitation (CLTS). In urban sanitation, the rehabilitation of Monrovia’s sewerage system is assessed at US$18.3 million and is to be executed over three years. The total estimated annual financing gap for sanitation is US$41 million.
The figures in Table 1 are based on the PRS1 coverage data and the PRS2/MDG targets for 2015. If the costing is repeated using JMP coverage estimated for 2008, the investment requirement would be around 20 percent lower for water supply but similar for sanitation. There are a number of reasons why this depiction of investments may be overoptimistic. The first is operation and maintenance (O&M) requirements (Table 2). As in many countries, in Liberia there is an implicit assumption that O&M costs (OPEX) will be recovered from users, though in practice this is not always achieved. If any of the annual OPEX has to be subsidized from the public purse, for example to utilities that do not achieve operational cost recovery, it reduces the amount available for capital investment.
11
Water Supply and Sanitation in Liberia: Turning Finance into Services for 2015 and Beyond
3. Reform Context: Introducing the CSO2 Scorecard
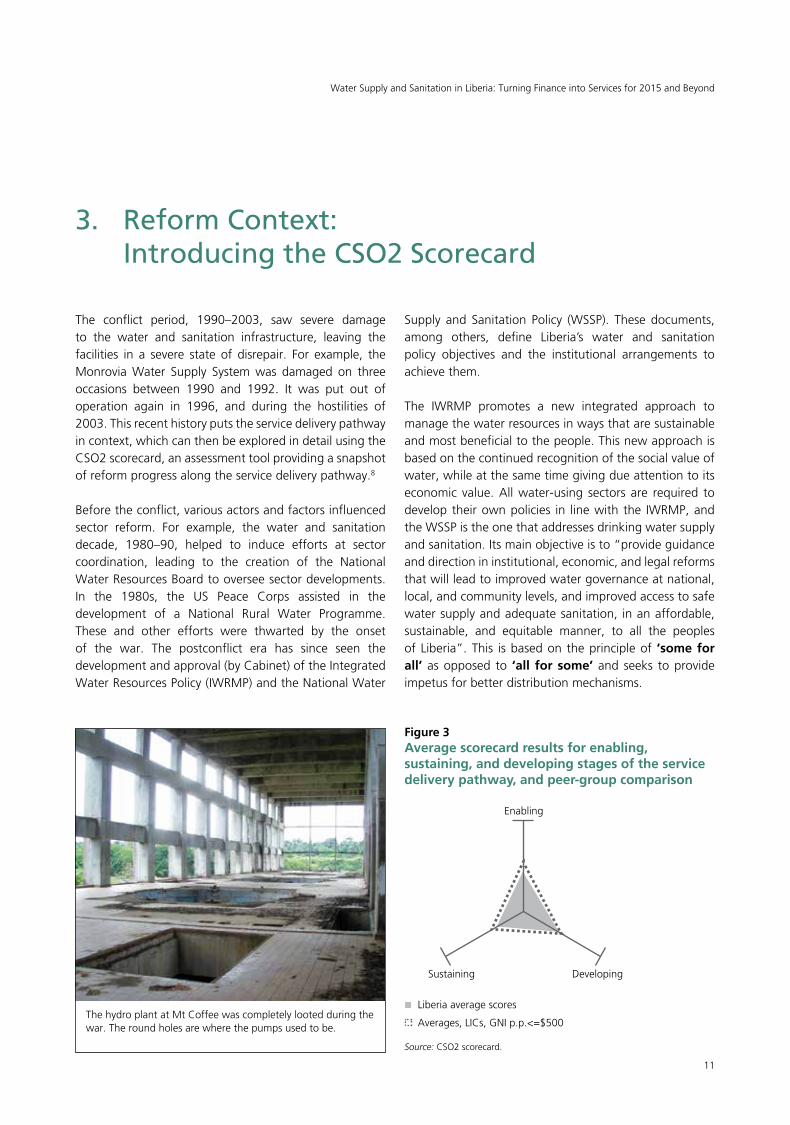
The conflict period, 1990–2003, saw severe damage to the water and sanitation infrastructure, leaving the facilities in a severe state of disrepair. For example, the Monrovia Water Supply System was damaged on three occasions between 1990 and 1992. It was put out of operation again in 1996, and during the hostilities of 2003. This recent history puts the service delivery pathway in context, which can then be explored in detail using the CSO2 scorecard, an assessment tool providing a snapshot of reform progress along the service delivery pathway.8
Before the conflict, various actors and factors influenced sector reform. For example, the water and sanitation decade, 1980–90, helped to induce efforts at sector coordination, leading to the creation of the National Water Resources Board to oversee sector developments. In the 1980s, the US Peace Corps assisted in the development of a National Rural Water Programme. These and other efforts were thwarted by the onset of the war. The postconflict era has since seen the development and approval (by Cabinet) of the Integrated Water Resources Policy (IWRMP) and the National Water
Supply and Sanitation Policy (WSSP). These documents, among others, define Liberia’s water and sanitation policy objectives and the institutional arrangements to achieve them.
The IWRMP promotes a new integrated approach to manage the water resources in ways that are sustainable and most beneficial to the people. This new approach is based on the continued recognition of the social value of water, while at the same time giving due attention to its economic value. All water-using sectors are required to develop their own policies in line with the IWRMP, and the WSSP is the one that addresses drinking water supply and sanitation. Its main objective is to “provide guidance and direction in institutional, economic, and legal reforms that will lead to improved water governance at national, local, and community levels, and improved access to safe water supply and adequate sanitation, in an affordable, sustainable, and equitable manner, to all the peoples of Liberia”. This is based on the principle of ‘some for all’ as opposed to ‘all for some’ and seeks to provide impetus for better distribution mechanisms.
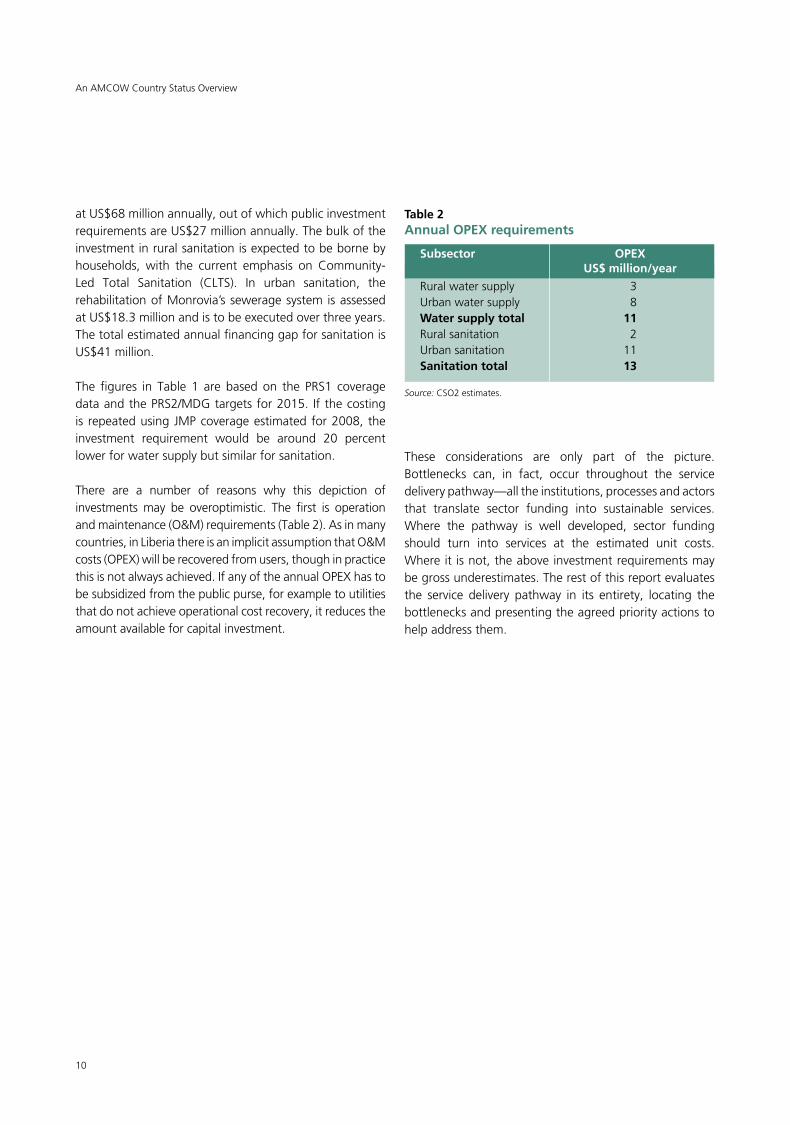
Figure 3Average scorecard results for enabling, sustaining, and developing stages of the service delivery pathway, and peer-group comparison
Liberia average scores
Averages, LICs, GNI p.p.<=$500
Source: CSO2 scorecard.
Enabling
Sustaining Developing
The hydro plant at Mt Coffee was completely looted during the war. The round holes are where the pumps used to be.

12
An AMCOW Country Status Overview
The WSSP spells out the institutional set up and roles (see figure 5 in the next Section) as well as the subsector approaches. A new Water Law is contemplated and is expected to give legal backing to the intentions spelt out in the policy documents. A sector strategic plan is currently under development, and due to be launched in 2011, which sets the stage for the initiation of a Sector-Wide Approach (SWAp).
In the postconflict era, reform effort has concentrated ‘upstream’ in the service delivery pathway—on the enabling environment for service delivery. At the county level this is being done through the creation of strong county health teams which have led the planning, coordination, and monitoring of services. The Ministry of Public Works’ representation at the country level, however, is still thin.
Figure 3 indicates that Liberia scores below its peers in the three building blocks of the service delivery pathway, reflecting weak performance in planning and budgeting, and absence of coherent sector/subsector investment plans, among others. The service delivery pathway also faces significant challenges characterized by poor resource allocation (including inadequate human resources), which limit the amount of services that can be provided. This signals the need for criteria to match resource allocation at national level with need at local level; and for systems to monitor output more effectively. Expanding and sustaining
services remains critical. County administrations and community water and sanitation committees are expected to be in the driving seat to support service delivery but lack adequate capacity. This is further compounded by a lack of a nationally spare parts network, little or no-backstopping, either from the public or private sectors, or NGOs. There is also a need to improve the functionality of systems by ensuring cost recovery and to improve the efficiency of service providers as well as the need for behavior change at the community level. For sanitation, there is a need to establish the efficacy of CLTS, which is the approach of choice as it requires minimum financial investment and promotes behavior change and ownership, and to complement it with testing innovative sanitation marketing approaches including micro-finance schemes to increase uptake.
Sections 4 to 6 highlight progress and challenges across three thematic areas—the institutional framework, finance and monitoring and evaluation (M&E)—benchmarking Liberia against its peer countries based on a grouping by gross national income. The related indicators are extracted from the CSO2 scorecard and presented in charts at the beginning of each section. The scorecards for each subsector are presented in their entirety in Sections 7 to 10.
Table 3 provides a chronology of significant sector reforms events.
Table 3Key dates in the reform of the sector in Liberia
Year Event
1956 Public Health Law enacted.
1975 Act Establishing the New Public Health Law of Liberia Chapter 24 had key objective of protecting Liberia’s water resources.
1980 National Water Resources Board formed, with Ministry of Lands, Mines and Energy served as Chair and Hydrological Services as Secretariat.
1986 National Public Health Committee established to coordinate water and sanitation affairs in the absence of the National Water Resources and Sanitation Board.
1989 Beginning of civil war.
1992 Water and Sanitation (WatSan) Coordinating Committee established and tasked with coordination of the activities of the water sector institutions.
2002 Environment Protection and Management Law approved, with the key objective of ensuring the sound management of environmental and natural resources.
2008 Liberia PRS (2008–11) includes water and sanitation as part of Pillar IV, infrastructure and service delivery and sets targets for water and sanitation.
2008 Approval of Integrated Water Resources Management Policy.
2009 Approval of National Water and Sanitation Policy.

13
Water Supply and Sanitation in Liberia: Turning Finance into Services for 2015 and Beyond
4. Institutional Framework
The WSSP proposes changes to the current institutional arrangements to ensure sector leadership and effective coordination and to remove “fragmented mandates’’. These changes are expected to improve subsector performance once fully implemented. In the meantime, current levels of performance are assessed alongside related scorecard indicators, which look at the extent to which national policy addresses targets for water and sanitation, define institutional roles, and (where these are in place) how national stakeholders have been engaged in these processes. Overall, Liberia performs poorly against its economic peer group, in all subsectors, except rural sanitation and hygiene, as depicted in Figure 4. This better than average performance in rural sanitation is due to having a national policy and subsector targets in the PRS. The lack of sector leadership for sanitation and low budgets are remaining weaknesses. Figure 5 presents the intended architecture for the sector and subsectors as set out in the policy.
This section considers institutional challenges of operationalizing the WSSP, which sets out the institutional roles and subsector approaches in detail, building on the snapshot provided by scorecard indicators.
Human resources and operational capacity: One of the legacies of the civil war was the severe loss of human resources from Liberia. While Liberia set out its water and sanitation targets in the PRS1, current institutional and human resource capacity at all levels (national and country) challenge translating these into services. Even where they are available, the lack of operational budget means that
many sector institutions still depend on aid organizations to carry out both routine tasks and investment. As the WSSP concedes: “There is an acute shortage of qualified staff especially engineers and accountants in the Agency. The Division of Environmental and Occupational Health (DEOH) [for example] has one Sanitary Engineer trained at the University of Liberia, and needs capacity development to handle sanitation programs on a large scale”. Many employees fall into semi-skilled and unskilled categories.
Sector leadership needs further clarification: Institutional fragmentation, to a large extent, has led to the lack of a strong sector leadership in practice. This is partly responsible for the lack of visibility for water and
Priority actions for institutional framework
• Operationalize the Water Supply and Sanitation Policy and its proposed institutions in consultation with stakeholders.
• Undertake a sector capacity needs assessment and resource institutions to play assigned roles.
• Clarify the institutional home for sanitation.
Figure 4Scorecard indicator scores relating to institutional framework compared to peer group (see endnotes)9
Liberia average scores
Averages, LICs, GNI p.p.<=$500
Source: CSO2 scorecard.
RWS
RSH
USH UWS
14
An AMCOW Country Status Overview
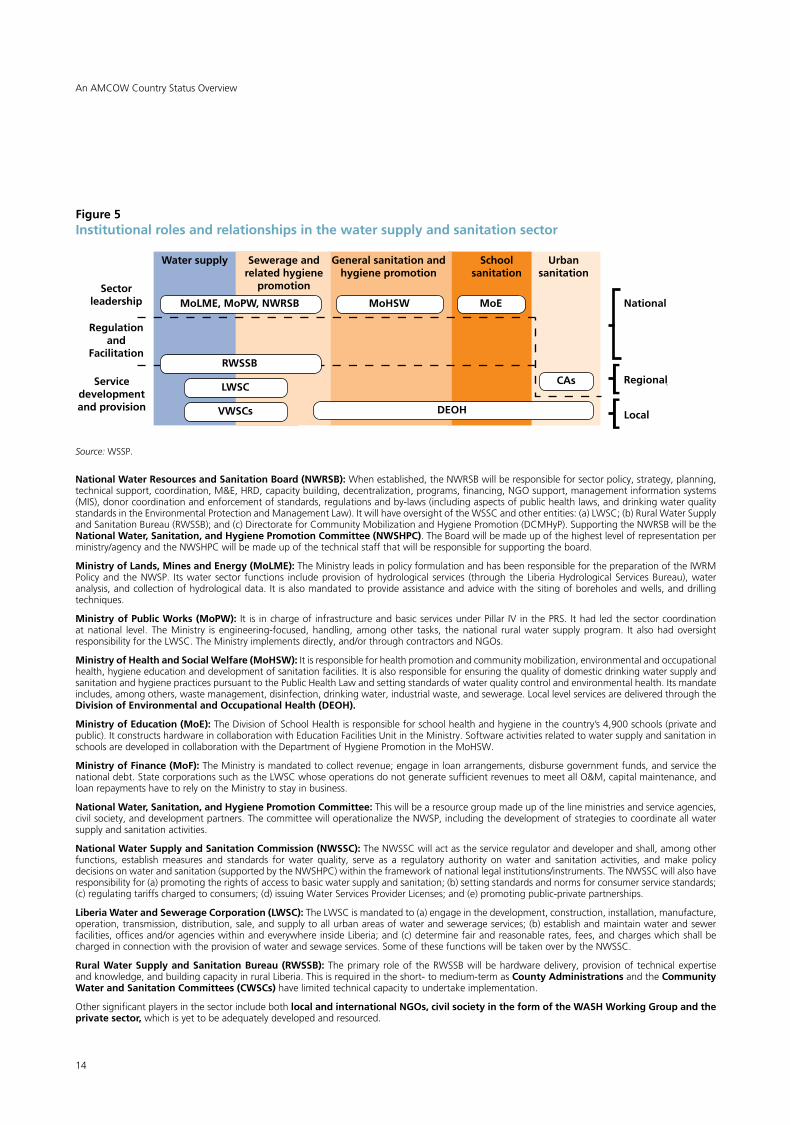
National Water Resources and Sanitation Board (NWRSB): When established, the NWRSB will be responsible for sector policy, strategy, planning, technical support, coordination, M&E, HRD, capacity building, decentralization, programs, financing, NGO support, management information systems (MIS), donor coordination and enforcement of standards, regulations and by-laws (including aspects of public health laws, and drinking water quality standards in the Environmental Protection and Management Law). It will have oversight of the WSSC and other entities: (a) LWSC; (b) Rural Water Supply and Sanitation Bureau (RWSSB); and (c) Directorate for Community Mobilization and Hygiene Promotion (DCMHyP). Supporting the NWRSB will be the National Water, Sanitation, and Hygiene Promotion Committee (NWSHPC). The Board will be made up of the highest level of representation per ministry/agency and the NWSHPC will be made up of the technical staff that will be responsible for supporting the board.
Ministry of Lands, Mines and Energy (MoLME): The Ministry leads in policy formulation and has been responsible for the preparation of the IWRM Policy and the NWSP. Its water sector functions include provision of hydrological services (through the Liberia Hydrological Services Bureau), water analysis, and collection of hydrological data. It is also mandated to provide assistance and advice with the siting of boreholes and wells, and drilling techniques.
Ministry of Public Works (MoPW): It is in charge of infrastructure and basic services under Pillar IV in the PRS. It had led the sector coordination at national level. The Ministry is engineering-focused, handling, among other tasks, the national rural water supply program. It also had oversight responsibility for the LWSC. The Ministry implements directly, and/or through contractors and NGOs.
Ministry of Health and Social Welfare (MoHSW): It is responsible for health promotion and community mobilization, environmental and occupational health, hygiene education and development of sanitation facilities. It is also responsible for ensuring the quality of domestic drinking water supply and sanitation and hygiene practices pursuant to the Public Health Law and setting standards of water quality control and environmental health. Its mandate includes, among others, waste management, disinfection, drinking water, industrial waste, and sewerage. Local level services are delivered through the Division of Environmental and Occupational Health (DEOH).
Ministry of Education (MoE): The Division of School Health is responsible for school health and hygiene in the country’s 4,900 schools (private and public). It constructs hardware in collaboration with Education Facilities Unit in the Ministry. Software activities related to water supply and sanitation in schools are developed in collaboration with the Department of Hygiene Promotion in the MoHSW.
Ministry of Finance (MoF): The Ministry is mandated to collect revenue; engage in loan arrangements, disburse government funds, and service the national debt. State corporations such as the LWSC whose operations do not generate sufficient revenues to meet all O&M, capital maintenance, and loan repayments have to rely on the Ministry to stay in business.
National Water, Sanitation, and Hygiene Promotion Committee: This will be a resource group made up of the line ministries and service agencies, civil society, and development partners. The committee will operationalize the NWSP, including the development of strategies to coordinate all water supply and sanitation activities.
National Water Supply and Sanitation Commission (NWSSC): The NWSSC will act as the service regulator and developer and shall, among other functions, establish measures and standards for water quality, serve as a regulatory authority on water and sanitation activities, and make policy decisions on water and sanitation (supported by the NWSHPC) within the framework of national legal institutions/instruments. The NWSSC will also have responsibility for (a) promoting the rights of access to basic water supply and sanitation; (b) setting standards and norms for consumer service standards; (c) regulating tariffs charged to consumers; (d) issuing Water Services Provider Licenses; and (e) promoting public-private partnerships.
Liberia Water and Sewerage Corporation (LWSC): The LWSC is mandated to (a) engage in the development, construction, installation, manufacture, operation, transmission, distribution, sale, and supply to all urban areas of water and sewerage services; (b) establish and maintain water and sewer facilities, offices and/or agencies within and everywhere inside Liberia; and (c) determine fair and reasonable rates, fees, and charges which shall be charged in connection with the provision of water and sewage services. Some of these functions will be taken over by the NWSSC.
Rural Water Supply and Sanitation Bureau (RWSSB): The primary role of the RWSSB will be hardware delivery, provision of technical expertise and knowledge, and building capacity in rural Liberia. This is required in the short- to medium-term as County Administrations and the Community Water and Sanitation Committees (CWSCs) have limited technical capacity to undertake implementation.
Other significant players in the sector include both local and international NGOs, civil society in the form of the WASH Working Group and the private sector, which is yet to be adequately developed and resourced.
Figure 5Institutional roles and relationships in the water supply and sanitation sector
Sector leadership
Water supply General sanitation andhygiene promotion
School sanitation
Urbansanitation
Servicedevelopment and provision
Regulation and
Facilitation
MoLME, MoPW, NWRSB
Sewerage andrelated hygiene
promotion
MoHSW MoE
RWSSB
LWSC
VWSCs DEOH
CAs
National
Regional
Local
[[
Source: WSSP.
15
Water Supply and Sanitation in Liberia: Turning Finance into Services for 2015 and Beyond
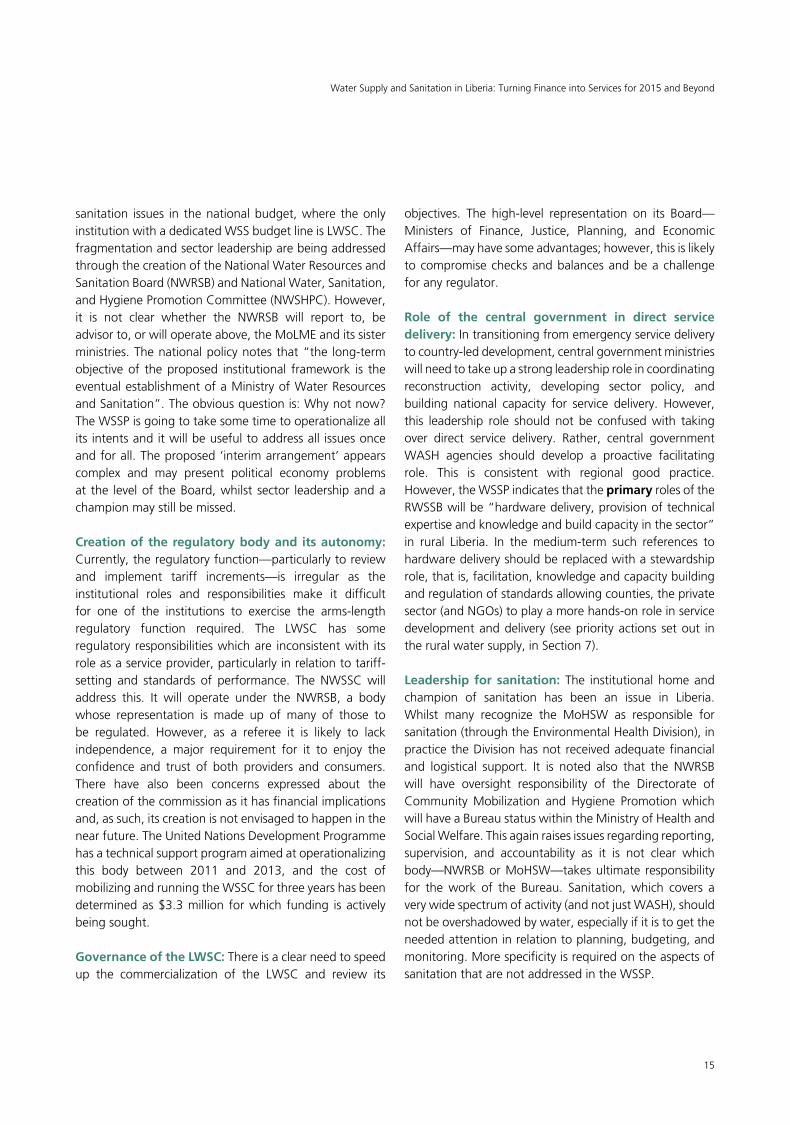
sanitation issues in the national budget, where the only institution with a dedicated WSS budget line is LWSC. The fragmentation and sector leadership are being addressed through the creation of the National Water Resources and Sanitation Board (NWRSB) and National Water, Sanitation, and Hygiene Promotion Committee (NWSHPC). However, it is not clear whether the NWRSB will report to, be advisor to, or will operate above, the MoLME and its sister ministries. The national policy notes that “the long-term objective of the proposed institutional framework is the eventual establishment of a Ministry of Water Resources and Sanitation”. The obvious question is: Why not now? The WSSP is going to take some time to operationalize all its intents and it will be useful to address all issues once and for all. The proposed ‘interim arrangement’ appears complex and may present political economy problems at the level of the Board, whilst sector leadership and a champion may still be missed.
Creation of the regulatory body and its autonomy: Currently, the regulatory function—particularly to review and implement tariff increments—is irregular as the institutional roles and responsibilities make it difficult for one of the institutions to exercise the arms-length regulatory function required. The LWSC has some regulatory responsibilities which are inconsistent with its role as a service provider, particularly in relation to tariff-setting and standards of performance. The NWSSC will address this. It will operate under the NWRSB, a body whose representation is made up of many of those to be regulated. However, as a referee it is likely to lack independence, a major requirement for it to enjoy the confidence and trust of both providers and consumers. There have also been concerns expressed about the creation of the commission as it has financial implications and, as such, its creation is not envisaged to happen in the near future. The United Nations Development Programme has a technical support program aimed at operationalizing this body between 2011 and 2013, and the cost of mobilizing and running the WSSC for three years has been determined as $3.3 million for which funding is actively being sought.
Governance of the LWSC: There is a clear need to speed up the commercialization of the LWSC and review its
objectives. The high-level representation on its Board—Ministers of Finance, Justice, Planning, and Economic Affairs—may have some advantages; however, this is likely to compromise checks and balances and be a challenge for any regulator.
Role of the central government in direct service delivery: In transitioning from emergency service delivery to country-led development, central government ministries will need to take up a strong leadership role in coordinating reconstruction activity, developing sector policy, and building national capacity for service delivery. However, this leadership role should not be confused with taking over direct service delivery. Rather, central government WASH agencies should develop a proactive facilitating role. This is consistent with regional good practice. However, the WSSP indicates that the primary roles of the RWSSB will be “hardware delivery, provision of technical expertise and knowledge and build capacity in the sector” in rural Liberia. In the medium-term such references to hardware delivery should be replaced with a stewardship role, that is, facilitation, knowledge and capacity building and regulation of standards allowing counties, the private sector (and NGOs) to play a more hands-on role in service development and delivery (see priority actions set out in the rural water supply, in Section 7).
Leadership for sanitation: The institutional home and champion of sanitation has been an issue in Liberia. Whilst many recognize the MoHSW as responsible for sanitation (through the Environmental Health Division), in practice the Division has not received adequate financial and logistical support. It is noted also that the NWRSB will have oversight responsibility of the Directorate of Community Mobilization and Hygiene Promotion which will have a Bureau status within the Ministry of Health and Social Welfare. This again raises issues regarding reporting, supervision, and accountability as it is not clear which body—NWRSB or MoHSW—takes ultimate responsibility for the work of the Bureau. Sanitation, which covers a very wide spectrum of activity (and not just WASH), should not be overshadowed by water, especially if it is to get the needed attention in relation to planning, budgeting, and monitoring. More specificity is required on the aspects of sanitation that are not addressed in the WSSP.
16
An AMCOW Country Status Overview
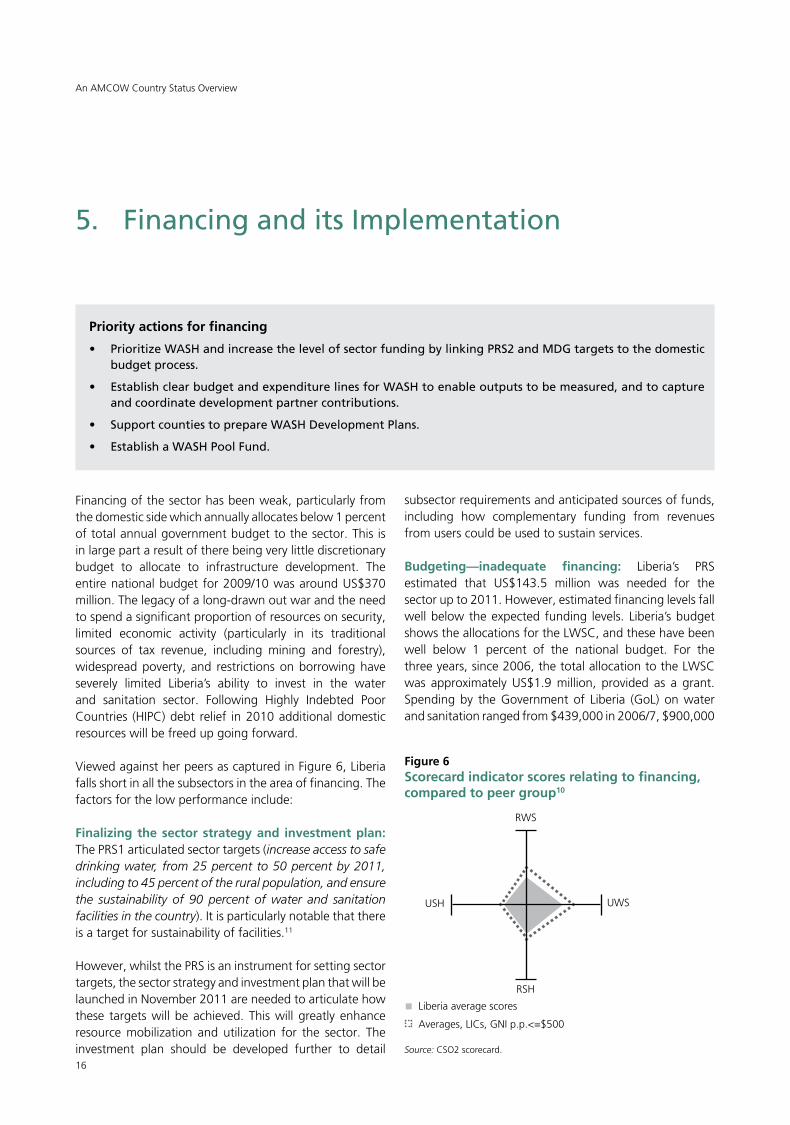
Figure 6Scorecard indicator scores relating to financing, compared to peer group10
Liberia average scores
Averages, LICs, GNI p.p.<=$500
RWS
RSH
USH UWS
Source: CSO2 scorecard.
Financing of the sector has been weak, particularly from the domestic side which annually allocates below 1 percent of total annual government budget to the sector. This is in large part a result of there being very little discretionary budget to allocate to infrastructure development. The entire national budget for 2009/10 was around US$370 million. The legacy of a long-drawn out war and the need to spend a significant proportion of resources on security, limited economic activity (particularly in its traditional sources of tax revenue, including mining and forestry), widespread poverty, and restrictions on borrowing have severely limited Liberia’s ability to invest in the water and sanitation sector. Following Highly Indebted Poor Countries (HIPC) debt relief in 2010 additional domestic resources will be freed up going forward.
Viewed against her peers as captured in Figure 6, Liberia falls short in all the subsectors in the area of financing. The factors for the low performance include:
Finalizing the sector strategy and investment plan: The PRS1 articulated sector targets (increase access to safe drinking water, from 25 percent to 50 percent by 2011, including to 45 percent of the rural population, and ensure the sustainability of 90 percent of water and sanitation facilities in the country). It is particularly notable that there is a target for sustainability of facilities.11
However, whilst the PRS is an instrument for setting sector targets, the sector strategy and investment plan that will be launched in November 2011 are needed to articulate how these targets will be achieved. This will greatly enhance resource mobilization and utilization for the sector. The investment plan should be developed further to detail
5. Financing and its Implementation
Priority actions for financing
• Prioritize WASH and increase the level of sector funding by linking PRS2 and MDG targets to the domestic budget process.
• Establish clear budget and expenditure lines for WASH to enable outputs to be measured, and to capture and coordinate development partner contributions.
• Support counties to prepare WASH Development Plans.
• Establish a WASH Pool Fund.
subsector requirements and anticipated sources of funds, including how complementary funding from revenues from users could be used to sustain services.
Budgeting—inadequate financing: Liberia’s PRS estimated that US$143.5 million was needed for the sector up to 2011. However, estimated financing levels fall well below the expected funding levels. Liberia’s budget shows the allocations for the LWSC, and these have been well below 1 percent of the national budget. For the three years, since 2006, the total allocation to the LWSC was approximately US$1.9 million, provided as a grant. Spending by the Government of Liberia (GoL) on water and sanitation ranged from $439,000 in 2006/7, $900,000

17
Water Supply and Sanitation in Liberia: Turning Finance into Services for 2015 and Beyond
(2007/8) and $1,766,000 in 2008/9.12 Corresponding allocations to education (also major casualties of the war) were $11 million, $45 million, and $58 million over those same years. For health these were $10 million, $17 million, and $23 million. Clearly, the government’s allocations for the sector are far below the required level of funding needed to reach the MDG target on water and sanitation. At 0.23 percent of the total budget, Liberia is one of the countries in Africa which allocates the lowest proportions of national resources to the sector.
Low disbursement rates of domestic funding: The low level of domestic funding is made worse by difficulties securing disbursements of these funds within the government systems. Some government departments in charge of water and sanitation have expressed difficulties in accessing the available, if minimal, domestic funding allocations. This is on account of difficulties to satisfy the new public finance management requirements. Annual budgeting processes now seek to improve budget allocations, disbursements, and align planning to resource allocation within the parameters of the PRS.
Strengthen donor coordination and leadership: Aid is crucial to the development of Liberia due to the years of massive destruction to infrastructure, high poverty levels exacerbated by high unemployment, and limits imposed on borrowing part of the conditions for going through the HIPC process. In the absence of a SWAp, donor financing is project-based. The MoPW initiated a sector donor coordination process in 2009 but it was poorly attended by the six or eight sector donors. However, through 2010
and early 2011 significant progress has been made in donor coordination. The African Development Bank is the lead donor for WASH in Liberia; with the largest funding portfolio at US$37 million, it is due to set up mission in Monrovia in 2011. It is envisaged that the African Development Bank will facilitate donor coordination for the sector and the establishment of a WASH Pool Fund. The most significant milestone in the sector has been the development of the Liberia WASH Compact.13 This Compact between the GoL led by the Ministry of Planning and development partners, under the global Sanitation and Water for All initiative, sets out a roadmap of action under four jointly agreed commitments:
1. Establish and strengthen institutional capacity: Appoint the National Water Resources and Sanitation Board; Operationalize the required institutions (set out in the policy); Mandate assessment and strengthening of county-level structures within existing policies
2. Ensure equity and prioritized service provision: Mandate implementation of WASH standards and regulation protocols; mainstream WASH in the education system; ensure policies support community-led processes to sanitation and hygiene.
3. Develop a monitoring system: Establish monitoring mechanisms; refine and disaggregate the structure of budgets; share WASH data/information internally and externally; institute reviews of the Compact.
4. Improve sector financing mechanisms: Establish a detailed, prioritized Sector Investment Plan; deliver on the GoL’s previous financial commitments; establish WASH pooled fund mechanism.
Figure 7Overall and per capita investment requirements and contribution from different sources
Rural water supply:Total: $19,800,000
Per capita (new): $93
Urban water supply:Total: $36,500,000
Per capita (new): $140
Rural sanitation:Total: $24,100,000
Per capita (new): $130
Urban sanitation:Total: $44,200,000
Per capita (new): $291
Domestic anticipated investment
External anticipated investment
Assumed household investment
Gap
Source: CSO2 estimates.

18
An AMCOW Country Status Overview
Monitoring and evaluation of sector activities is still weak, though significant progress has been made. The WSSP attributes the weak M&E framework to problems related to institutional fragmentation, geographical connectivity and mobility, besides lack of adequate trained manpower and funding. On the whole the average indicator scores, as captured in Figure 8, call for strengthening sector M&E. Specific areas that require improvement are:
Quality, availability and systems for management: As the WSSP document concedes, “there are multiple sources of data indicating different coverage figures of water and sanitation in the country, and these are not necessarily comparable. There is also no proper reporting mechanism in place, besides ad hoc and inconsistent reporting of interventions by the partners to the government”.15 This requires resolution, driven by a strong sector leadership that will bring all actors into line with agreed definitions, indicators, and systems of data capture and management. As targeted in the PRS, all national statistics are expected to be fed into the Liberia Info Database, managed by the Liberia Institute of Statistics and Geo-Information Services, and capacity will be developed to publish this online.
Linking local and national data to planning and outcomes: Liberia’s planning for service delivery should be anchored on credible data gathered through the nationally agreed M&E system. Current plans, particularly the PRS1, are a result of information derived from a joint government and NGO working group. The government has introduced the 90-day PRS deliverables cycle which tries to report progress on a 90-day basis. This is a welcome idea but it is also contingent on what implementing partners report, combined with a proactive and pragmatic government-led
6. Sector Monitoring and Evaluation
Priority actions for sector monitoring and evaluation
• Establish a national information management system for the sector that consolidates reporting on schemes being built and monitors functionality.
• Institute an annual multistakeholder review to evaluate progress and set priority actions for the sector.
process to acquire the information. For the PRS2 period, renewed emphasis has been placed on reporting; it has been agreed that the NWSHPC will collate reports from the GoL and development partners aligned with the PRS2 reporting schedule.
Annual sector review and consolidated annual sector reporting: There is the need to institute an annual multistakeholder review to evaluate progress and set priority actions for the sector. This would bring all sector actors together to discuss sector plans and output as well as address its challenges. This should also involve a consolidated reporting of sector output.
Figure 8Scorecard indicator scores relating to sector M&E, compared to peer group14
RWS
RSH
Liberia average scores
Averages, LICs, GNI p.p.<=$500
USH UWS
Source: CSO2 scorecard.

19
Water Supply and Sanitation in Liberia: Turning Finance into Services for 2015 and Beyond
7. Subsector: Rural Water Supply
Priority actions for rural water supply
• At community level, enforce cost recovery and local management of water points by CWSCs where they are not already established.
• At county level, build capacity to manage spare-part supply-chains and train more pump mechanics.
• At national level, improve the registration, vetting, and quality control of pump installers, and roll out technical guidelines on handpumps and water quality.
Based on the coverage figures adopted by stakeholders in the PRS1, and using the CSO2 costing model, an estimated US$20 million is required annually, of which US$18 million is to be sourced from public sources (domestic or donor). With an anticipated US$11 million in annual external funding leveraging capital contributions of around US$1 million from rural households, the subsector needs to raise an additional $8 million annually.
Additional OPEX requirements are estimated at US$2 million per year—currently this is either a real or deferred burden on public finance, since recovery of operations and maintenance costs from user fees is rare for rural and small town schemes.
Figure 11 shows the scorecard results for the rural water supply service delivery pathway. The scorecard uses a
Before 2000 there is little subsector data on which to base estimates. The JMP includes the 1986 Demographic and Health Survey from which the 1990 baseline is estimated. The government has adopted this 1990 baseline for rural water supply but estimates 2008 coverage to have been 20 percent, while the JMP’s estimate for 2008 is 51 percent. There is no rural subsector estimate for 2003 (only an overall water supply estimate; see Section 2) but the PRS1 estimate of 17 percent coverage in 2003 is used here denoting coverage in the immediate postconflict period. The 2011 water point mapping survey confirmed that over 3,000 rural water points have been built since 2005, strongly suggesting that the downward trend to 2003 has since been reversed. The rural water supply target for the PRS2 period is 67 percent.
Figure 9Rural water supply coverage
100%
80%
60%
40%
20%
0%1985 1990 1995 2000 2005 2010 2015 2020
Source: PRS1 and JMP 2010 report.
Figure 10Rural water investment requirements
Source: CSO2 costing.
Cov
erag
e
JMP pipedJMP improved
Government estimates Government target
0 5 10 15 20 25
Required CAPEX Required OPEX
US$ million/year
Public CAPEX (anticipated) Household CAPEX (assumed)
CAPEX deficit

20
An AMCOW Country Status Overview
Figure 11Rural water supply scorecard
simple color code to indicate: building blocks that are largely in place, acting as a driver on service delivery (score >2, green); building blocks that are a drag on service delivery and require attention (score 1–2, yellow); and building blocks that are inadequate, constituting a barrier to service delivery and a priority for reform (score <1, red). The assessment is based on contributions from sector actors.
The scorecard (represented by Figure 11) shows that there are concerns throughout the service delivery pathway in the rural water subsector. Liberia scores low in the ‘enabling’ and ‘developing’ building blocks whilst it is just above its peers in the area of ‘sustaining’ services (Figure 12). Some of the factors underlying this performance are discussed below.
Whilst the policy documents (PRS1 and WSSP) have articulated the sector vision and targets, these are yet to be rolled out. Institution-building is required to ensure that those identified in the policy documents are established and strengthened. County administrations are expected to drive delivery and then sustain it through CWSCs, but both sets of institutions are challenged by capacity constraints. Budget allocations are very low, whilst utilization rates and releases remain a challenge.
In terms of developing services, the equity building block scores poorly as a result of the absence of criteria and a systematic mechanism for allocating resources across counties and communities, no national guidance on participation and inclusion of communities at the project development stage and no periodic analysis of equity outcomes. Most interventions have been undertaken by NGOs and criteria have included logistical concerns including levels of accessibility and security.
Though marginally better than peers due to an attempt to revive community involvement in management of water points, there are concerns in Liberia about sustaining existing services (maintenance) and not mechanisms to support expansion of existing rural and small town piped schemes. Indicators for maintenance include conducting regular functionality surveys, raising user fees to finance O&M costs for service delivery and whether there is adequate back-stopping and a functioning spare parts delivery network.
With the long-drawn out war many facilities fell into disrepair. NGOs delivering services are not subject to gazetted national guidelines, and solving immediate community needs (rather than long-term sustainable mechanisms) is what has driven projects. In many instances
EnablingPolicy
1.5 1.5 1 1.5 1 2 1 2.5
Planning Budget Expenditure Equity Output Maintenance Expansion Use
Developing Sustaining
Source: CSO2 scorecard.
Figure 12Average RWS scorecard scores for enabling, sustaining, and developing stages of the service delivery pathway, and peer-group comparison
Enabling
Liberia average scores
Averages, LICs, GNI p.p. <=$500
Sustaining Developing
Source: CSO2 scorecard.
1.5
21
Water Supply and Sanitation in Liberia: Turning Finance into Services for 2015 and Beyond
communities do not pay for the use of water and O&M; capital maintenance costs are rarely met.
Even for water points built since 2004, a third are nonfunctional according to the national water point mapping exercise carried out in 2011.16 The mapping exercise also revealed that over 80 percent of all rural water points in Liberia are of just one type—the Afridev handpump and that there is considerable scope for repair and rehabilitation. County administrations, however, do not have the capacity to develop plans for maintenance support.
Three steps should be taken to improve the sustainability of rural schemes. First, the water point mapping survey showed that active community water committees
significantly reduce the likelihood of pump breakdown, yet thousands of points still have no CWSCs. CWSCs need to be put in place where they are not already established. Second, at the county level, spare-part supply-chains need to be strengthened and more pump mechanics need to be trained. Third, at the national level the registration, vetting, and quality control of pump installers should be improved and technical guidelines on handpumps and water quality rolled out.
On the positive side, indicators for use are high as around 84 percent of the rural population covered by improved sources spends less than 30 minutes (round-trip) to fetch water. Among subsector activities is a concerted effort by development partners to improve water storage and point of use treatment.
22
An AMCOW Country Status Overview
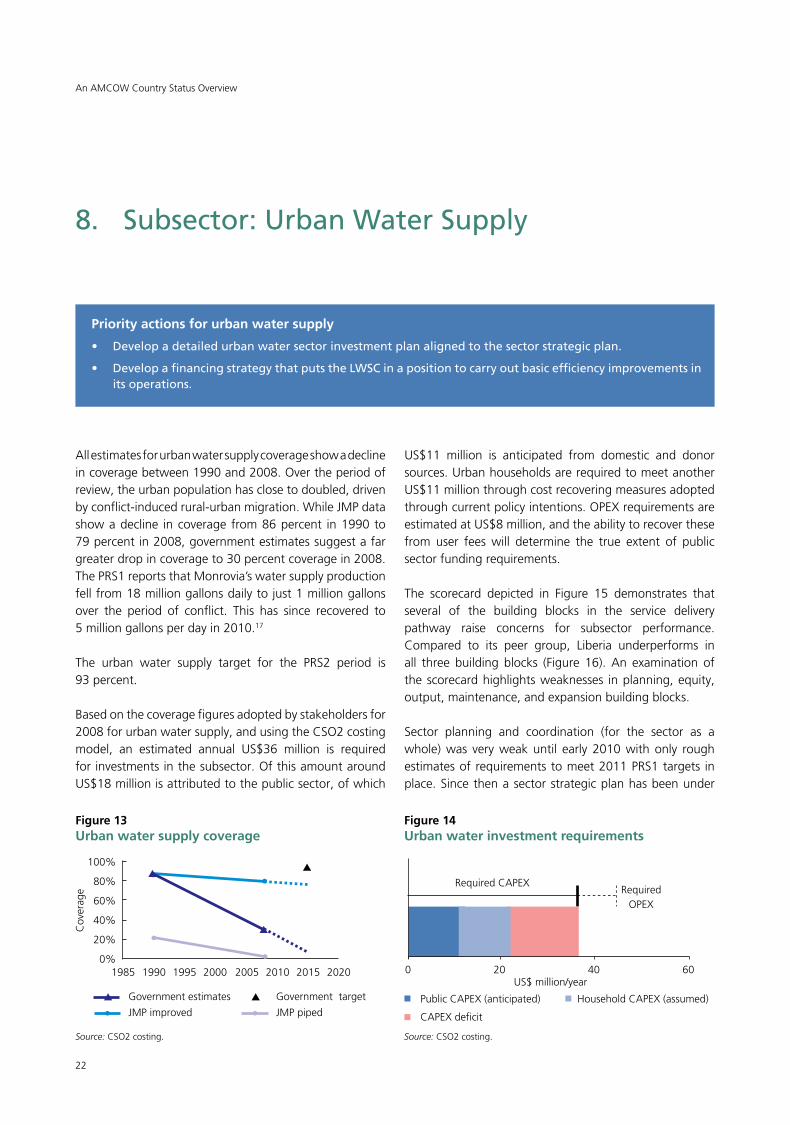
All estimates for urban water supply coverage show a decline in coverage between 1990 and 2008. Over the period of review, the urban population has close to doubled, driven by conflict-induced rural-urban migration. While JMP data show a decline in coverage from 86 percent in 1990 to 79 percent in 2008, government estimates suggest a far greater drop in coverage to 30 percent coverage in 2008. The PRS1 reports that Monrovia’s water supply production fell from 18 million gallons daily to just 1 million gallons over the period of conflict. This has since recovered to 5 million gallons per day in 2010.17
The urban water supply target for the PRS2 period is 93 percent.
Based on the coverage figures adopted by stakeholders for 2008 for urban water supply, and using the CSO2 costing model, an estimated annual US$36 million is required for investments in the subsector. Of this amount around US$18 million is attributed to the public sector, of which
8. Subsector: Urban Water Supply
Priority actions for urban water supply
• Develop a detailed urban water sector investment plan aligned to the sector strategic plan.
• Develop a financing strategy that puts the LWSC in a position to carry out basic efficiency improvements in its operations.
US$11 million is anticipated from domestic and donor sources. Urban households are required to meet another US$11 million through cost recovering measures adopted through current policy intentions. OPEX requirements are estimated at US$8 million, and the ability to recover these from user fees will determine the true extent of public sector funding requirements.
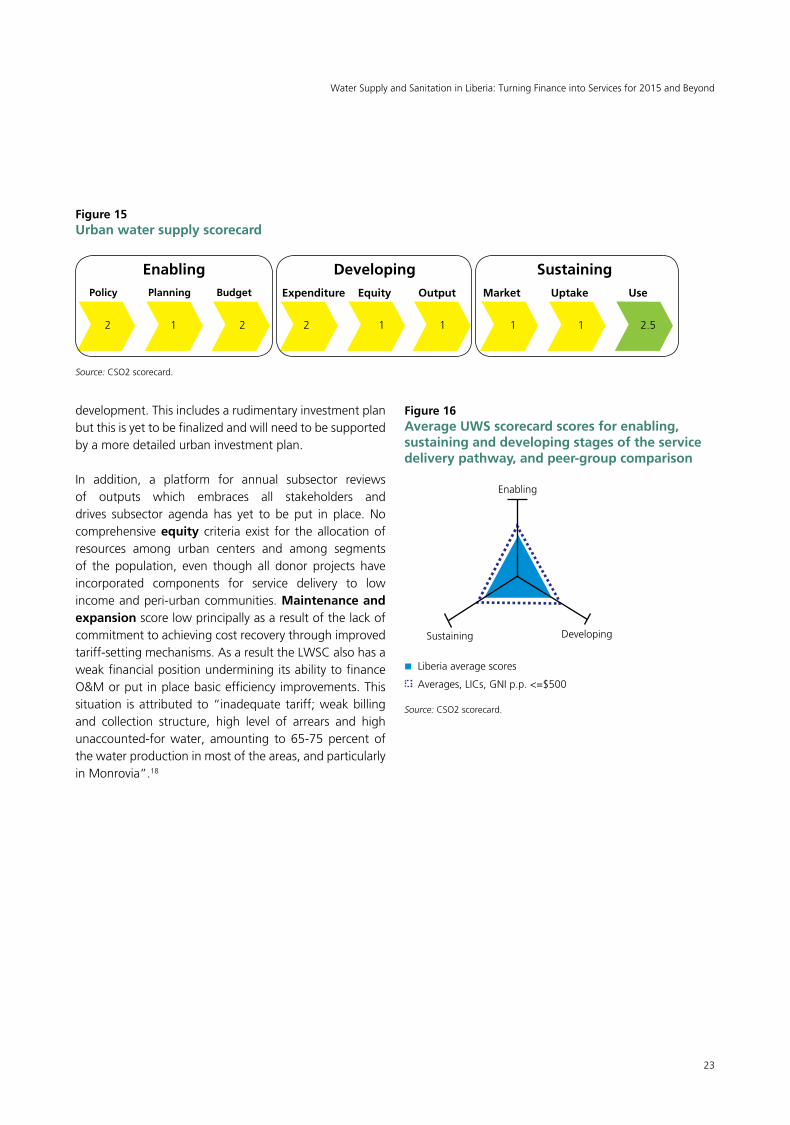
The scorecard depicted in Figure 15 demonstrates that several of the building blocks in the service delivery pathway raise concerns for subsector performance. Compared to its peer group, Liberia underperforms in all three building blocks (Figure 16). An examination of the scorecard highlights weaknesses in planning, equity, output, maintenance, and expansion building blocks.
Sector planning and coordination (for the sector as a whole) was very weak until early 2010 with only rough estimates of requirements to meet 2011 PRS1 targets in place. Since then a sector strategic plan has been under
Figure 13Urban water supply coverage
100%
80%
60%
40%
20%
0%1985 1990 1995 2000 2005 2010 2015 2020
Source: CSO2 costing.
Figure 14Urban water investment requirements
Cov
erag
e
Source: CSO2 costing.
JMP pipedJMP improved
Government estimates Government target
Required CAPEXRequired
OPEX
0 20 40 60US$ million/year
Public CAPEX (anticipated) Household CAPEX (assumed)
CAPEX deficit
23
Water Supply and Sanitation in Liberia: Turning Finance into Services for 2015 and Beyond
Figure 16Average UWS scorecard scores for enabling, sustaining and developing stages of the service delivery pathway, and peer-group comparison
Liberia average scores
Averages, LICs, GNI p.p. <=$500
Enabling
Sustaining Developing
Source: CSO2 scorecard.
development. This includes a rudimentary investment plan but this is yet to be finalized and will need to be supported by a more detailed urban investment plan. In addition, a platform for annual subsector reviews of outputs which embraces all stakeholders and drives subsector agenda has yet to be put in place. No comprehensive equity criteria exist for the allocation of resources among urban centers and among segments of the population, even though all donor projects have incorporated components for service delivery to low income and peri-urban communities. Maintenance and expansion score low principally as a result of the lack of commitment to achieving cost recovery through improved tariff-setting mechanisms. As a result the LWSC also has a weak financial position undermining its ability to finance O&M or put in place basic efficiency improvements. This situation is attributed to “inadequate tariff; weak billing and collection structure, high level of arrears and high unaccounted-for water, amounting to 65-75 percent of the water production in most of the areas, and particularly in Monrovia”.18
Figure 15Urban water supply scorecard
EnablingPolicy
2 1 2 2 1 1 1 1 2.5
Planning Budget Expenditure Equity Output Market Uptake Use
Developing Sustaining
Source: CSO2 scorecard.

24
An AMCOW Country Status Overview
9. Subsector: Rural Sanitation and Hygiene
Priority actions for rural sanitation and hygiene
• Clarify the institutional lead for sanitation and scale up Community-Led Total Sanitation.
• Adapt and adopt a nationwide hygiene promotion toolkit to scale up current levels of progress.
All estimates for rural sanitation show that little progress has been made since 1990. The JMP estimates that open defecation rates have increased from 68 to 77 percent between 1990 and 2008. Access to improved sanitation has remained very low, increasing from only 3 to 4 percent over the same period. The remainder of the population share facilities. Government estimates for rural sanitation default to JMP estimates.
It is clear that Liberia has a long way to go, given that its commitment to achieving the MDG target remains unchanged. The rural share of this target for the PRS2 period is 52 percent.
CAPEX requirements for rural sanitation infrastructure are estimated at US$24 million, of which the public component is around US$5 million. This public component is expected to leverage the remainder (US$19 million) from household expenditure using low or no-subsidy CLTS sanitation approaches. The service delivery pathway for sanitation,
therefore, needs to demonstrate the mechanisms for this leveraging of household expenditure by putting in place credible nationwide sanitation promotion including the budgets, staff, and materials to carry this out.
An examination of the scorecard for rural sanitation (Figure 19) shows a poor performance throughout the service delivery pathway, with concerns in planning and budgeting, poor access, equity as well as all the building blocks pertaining to sustaining the delivery of facilities. Liberia’s rural subsector underperforms its peer group (Figure 20), with average scores in the group reflecting the challenges that countries as a whole have in their sanitation agenda. The high score for policy is explained by the existence of the WSSP, one of the indicators in the enabling factors in the service delivery pathway. Whilst the policy clearly identifies household sanitation as essentially a household-driven activity, the strategies for achieving this are not in place and it is not clear how households are to be encouraged to invest in sanitation,
Figure 18Rural sanitation investment requirements
Source: CSO2 costing.
Figure 17Rural sanitation coverage
100%
80%
60%
40%
20%
0%1985 1990 1995 2000 2005 2010 2015 2020
Source: CSO2 costing.
Cov
erag
e
JMP, improved + sharedJMP Improved
Government estimates Government target
Required CAPEX Required OPEX
0 10 20 30US$ million/year
Public CAPEX (anticipated) Household CAPEX (assumed)
CAPEX deficit

25
Water Supply and Sanitation in Liberia: Turning Finance into Services for 2015 and Beyond
and how this will be financed—an especially urgent issue given the current emphasis on CLTS. The equity building block scores poorly as the key indicators for this—criteria for allocation of sanitation funding, procedures for local participation in planning, budgeting and implementation, and periodic analysis by government and civil society to assess equity issues—are only beginning to take root or are not currently in place. The markets building block also scores poorly due to the absence of a supply chain for sanitation equipment to meet household needs and insufficient supply-side artisanal or technical capacity, major requirements to complement the CLTS approach. The indicators for uptake include the sufficiency of quantity and quality of facilities being rolled to meet the MDGs, and the percentage of rural households practicing hand washing at critical times. The poor rating is more the result of the lack of data than an objective assessment of the current practices, even though there are some significant findings that could support the above verdict.19
Figure 19Rural sanitation and hygiene scorecard
EnablingPolicy
2.5 0.5 1 2 0.5 2 0.5 0.5 1
Planning Budget Expenditure Equity Output Markets Uptake Use
Developing Sustaining
Source: CSO2 scorecard.
Figure 20Average RSH scorecard scores for enabling, sustaining, and developing stages of the service delivery pathway, and peer-group comparison
Enabling
Sustaining Developing
Liberia average scores
Averages, LICs, GNI p.p. <=$500
Source: CSO2 scorecard.

26
An AMCOW Country Status Overview
With a rapidly growing urban population, sanitation in urban areas is critical. The JMP estimates that open defecation rates have increased from 15 to 30 percent between 1990 and 2008. Access to improved sanitation increased marginally from 21 to 25 percent over the same period with a similar proportion of the urban population sharing facilities. Monrovia is by far the largest urban center with a population of over 1 million. There are reported to be only 724 household sewer connections in Monrovia with a further 15 percent of households being connected to the septic tanks.20 Government estimates for urban sanitation are very close to JMP estimates. The urban sanitation target for the PRS2 period is 61 percent.
Based on the CSO2 costing, an annual CAPEX of US$44 million is required to finance investments in urban sanitation and hygiene. Of this amount US$22 is expected from public funding (domestic and donors), whilst household contributions leveraged through the public investment
10. Subsector: Urban Sanitation and Hygiene
Priority actions for urban sanitation and hygiene
• Develop appropriate sanitation technologies for densely populated urban slums.
• Clarify strategy for the promotion of sanitation in low income and peri-urban communities.
• Identify low cost sanitation/sewerage options including small-bore sewerage and decentralized, neighborhood-based treatment plants.
• Clarify use of shared facilities (based on researched evidence on quality, appropriateness) and incorporate in decision making regarding investments.
are estimated at US$6 million. There is a financing gap of US$32 million, given that only US$6 million is anticipated in public expenditure. Furthermore, the programmed public investment in urban sanitation is principally for rehabilitation of the Monrovia sewerage system. For the poor living in informal and peri-urban communities, it is noted that CLTS may not be effective, but there is as yet no clear strategy for promoting sanitation delivery in such communities.
The scorecard for urban sanitation (Figure 23) shows poor performance throughout the service delivery pathway, with concerns in planning, equity as well as very low scores in the building blocks sustaining the delivery of facilities, namely, markets and uptake. Liberia’s urban subsector underperforms its peer group (Figure 24), with the very low average scores in the peer group reflecting the major challenges that these countries have in addressing the urban sanitation agendas.
Figure 22Urban sanitation investment requirements
Source: CSO2 costing.
Figure 21Urban sanitation coverage
Source: CSO2 costing.
100%
80%
60%
40%
20%
0%1985 1990 1995 2000 2005 2010 2015 2020
Cov
erag
e
JMP, improved + sharedJMP improved
Government estimates Government target
Required CAPEXRequired
OPEX
0 20 40 60US$ million/year
Public CAPEX (anticipated) Household CAPEX (assumed)
CAPEX deficit

27
Water Supply and Sanitation in Liberia: Turning Finance into Services for 2015 and Beyond
Though there are national targets set for urban sanitation in both the PRS1 and PRS2, the national WSSP does not provide any policy guidance for the urban sanitation subsector other than to say that pro-poor services should be adopted and that this should be done at full cost recovery. The policy does not stipulate a lead agency for urban sanitation nationally or mention the role of the Monrovia City Council (MCC).21
Monrovia is by far the largest urban center with a population of over 1 million and accounts for over a third of the country’s population. The MCC is the agency that has taken on the charge of solid waste and on-site public sanitation (public toilets). Piped water supply and sewerage are the responsibilities of the LWSC, while drainage is the responsibility of the MoPW.22
In Monrovia, the sewage from the flush toilets and sewage from hundreds of septic tanks (collected by vacuum trucks) is discharged into the sewer network. However, since the sewage treatment plant is not operational, the sewage eventually finds its way untreated into the environment. A multidonor project managed by the LWSC is rehabilitating the waste stabilization ponds.
In fast growing, unplanned areas of the city, space for on-site sanitation is limited, the water table high, and resorting to open defecation common. In an effort to meet the huge unmet demand for sanitation facilities, communal latrines were constructed in urban communities during the humanitarian period but many of these filled up, fell into disrepair, and were abandoned. Since then the MCC and its development partners have implemented a number of rehabilitation programs aimed at reviving and expanding public sanitation facilities. Though still limited in number, these public facilities are becoming a well used solution. The two challenges have been to:
• Identify and put in place effective management models across different types of public facilities: those
with users not resident in the immediate vicinity; those in unplanned settlements with users from the resident community; and those that have both resident and nonresident users.
• Finding solutions for efficient emptying, transfer, and disposal of fecal sludge while maintaining the affordability of public facilitates to users.
Nevertheless, additional initiatives are also needed to promote and improve household sanitation solutions in urban areas as public toilets alone will not mitigate the high fecal contamination of ground water in shallow wells used by the majority of the city’s residents.23 This will need to include developing a strategy for the promotion of sanitation uptake and mobilization of markets for sanitation services for densely populated urban slums, as well as low cost sewerage options including small-bore sewerage and decentralized, neighborhood-based treatment plants in the medium and lower density urban areas.
Figure 23Urban sanitation and hygiene scorecard
EnablingPolicy
1.5 0.5 1 1.5 0.5 1.5 0 0 1
Planning Budget Expenditure Equity Output Markets Uptake Use
Developing Sustaining
Source: CSO2 scorecard.
Figure 24Average USH scorecard scores for enabling, sustaining, and developing stages of the service delivery pathway, and peer-group comparison
Enabling
Liberia average scores
Averages, LICs, GNI p.p. <=$500
Sustaining Developing
Source: CSO2 scorecard.

28
An AMCOW Country Status Overview
1 PRS2 targets for water supply and sanitation. The target for sanitation is for unshared sanitation. The target for sanitation including shared sanitation is 63 percent.
2 The first round of CSOs was carried out in 2006 covering 16 countries and is summarized in the report, Getting Africa On-Track to Meet the MDGs on Water and Sanitation.
3 IMF. 2008. Liberia: Poverty Reduction Strategy Paper (pg 106). http://www.imf.org/external/pubs/ft/scr/2008/cr08219.pdf.
4 Government of Liberia, UNDP, UNECA. 2008. Liberia’s Progress towards the Millennium Development Goals. http://www.lr.undp.org/Documents/RecentPublic/Liberia-MDG-Report-2008-small.pdf.
WaterAid. 2008. Scoping Study to Liberia, London.5 JMP estimates are based on a linear regression of nationally
representative household surveys. WASH stakeholders in Liberia feel the LDHS access figures for water and sanitation have not been realistic over the years. The baseline access figures quoted on page 106 of PRS 2008 are attributed by the sector to the joint Government-NGO Working Group on Water and Sanitation. These figures were said to have been extrapolated using the year 2004 as baseline and accounting for the water and sanitation projects undertaken nationally by the government and partners since that time. They are used as the baseline indicators for the government’s strategic objectives in water and sanitation, including the MDGs, with the proviso that these baselines and targets may be adjusted during the PRS implementation period.
6 In the absence of a clear policy on user contributions, the proportion of capital costs assumed to be met by households was estimated in Ministry of Infrastructure Task Force meetings, as: 5 percent for rural water supply, 0 percent for urban water supply, and 70 percent for both rural and urban sanitation subsectors.
7 Due to rounding, component figures may not sum to totals.
8 The CSO2 scorecard methodology and conceptual framework are discussed in detail in the synthesis report.
9 Indicators relating to the Institutional framework section are as follows: All subsectors: targets in national development plans/PRSP; subsector policy agreed and approved (gazetted as part of national policy or as standalone policy); RWS/UWS: institutional roles defined; RSH/USH: institutional lead appointed.
10 Indicators relating to the Financing section are as follows: All subsectors: programmatic Sector-Wide Approach;
Notes and References
investment program based on MDG needs assessment; sufficient finance to meet MDG (subsidy policy for sanitation); percent of official donor commitments utilized; percent of domestic commitments utilized.
11 The national water point mapping survey carried out in 2011 indicates that progress on the sustainability of systems is yet to be achieved. Of the 7,500 rural water points surveyed 29 percent were not functional and a further 11 percent functional but with problems, for example, water available for only part of the dry season.
12 Figures provided by official of Ministry of Finance.13 www.wash-liberia.org.14 Indicators relating to the M&E section are as follows:
All subsectors: annual review setting new undertakings; subsector spend identifiable in budget (UWS: inc. recurrent subsidies); budget comprehensively covers domestic/donor finance; RWS, RSH, and USH: domestic/donor expenditure reported; UWS: audited accounts and balance sheets from utilities; RWS, RSH, and USH: periodic analysis of equity criteria by CSOs and government; UWS: pro-poor plans developed and implemented by utilities; RWS/UWS: nationally consolidated reporting of output; RSH/USH: monitoring of quantity and quality of uptake relative to promotion and subsidy efforts; All subsectors: Questions and choice options in household surveys consistent with MDG definitions.
15 NWSP, section 3.4.3.16 GoL. 2011. Liberia Waterpoint Atlas: http://wash-liberia.
org/uploads/Final_Review_Version_-_Waterpoint_Atlas___Investment_Plan_x.pdf.
17 LWSC Operation Department. Monthly report. December 2010.
18 AfDB, Project Appraisal Report, Liberia, Monrovia Water Supply and Sanitation Rehabilitation project, 2007.
19 A study by Subah-Belleh Associates on hygiene-related behavior in around 1,000 communities in eight counties in Liberia in early 2008, made the following findings: 60 percent practiced open defecation; and 43 percent did not practice hand-washing with soap.
20 Ministry of Lands, Mines and Energy. 2009. Water Supply and Sanitation Policy.
21 Ibid. 22 Sen, Somnath. 2007. Improved Management of Public
Toilets in Monrovia by Outsourcing.23 WSP (forthcoming). Survey of Water Quality in Monrovia’s
Public Water Supplies.
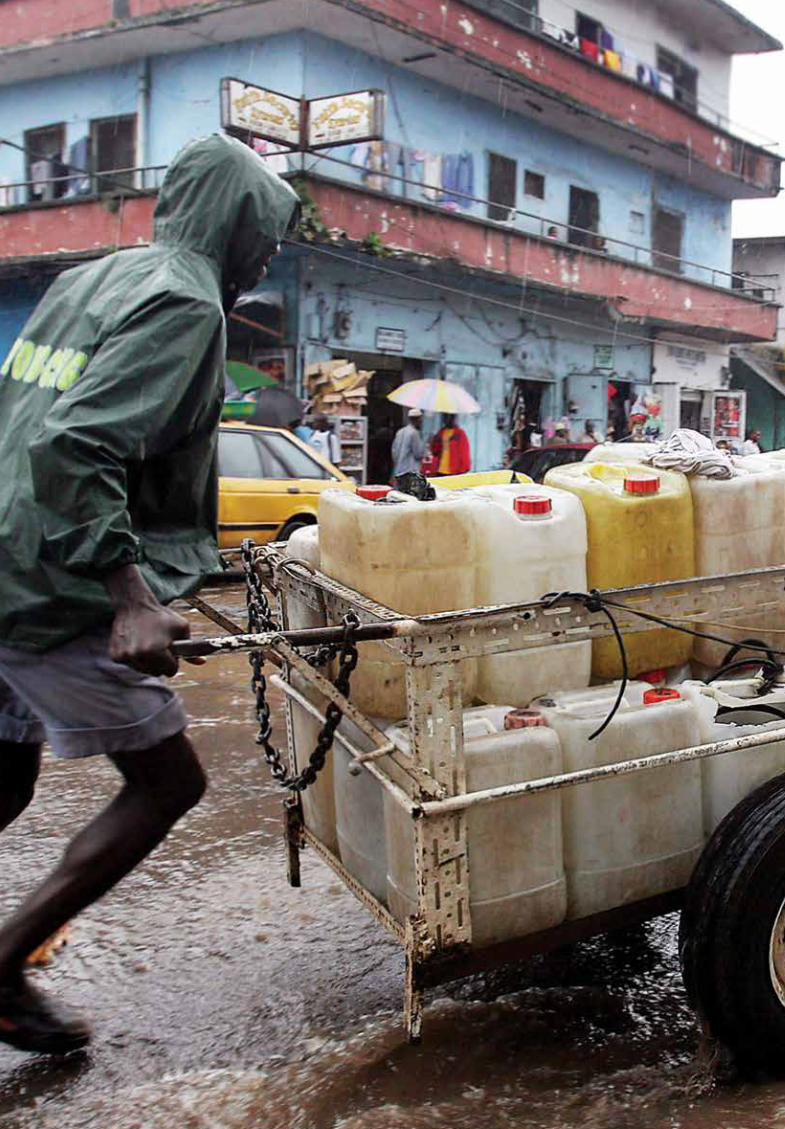

For enquiries, contact:Water and Sanitation Program–Africa RegionThe World Bank, Upper Hill RoadP.O. Box 30577, 00100, Nairobi, KenyaTel: +(254) 20 322 6300 E-mail: [email protected] site: www.wsp.org
An AMCOW Country Status Overview
Water Supply and Sanitation in LiberiaTurning Finance into Services for 2015 and Beyond