Water structure in cubic insulin crystals - PNAS · Waterstructure in cubic insulin crystals ......
5
Proc. Nati. Acad. Sci. USA Vol. 88, pp. 622-626, January 1991 Biophysics Water structure in cubic insulin crystals (x-ray diffraction/protein hydration/crystallographic refinement/hydration force) JOHN BADGER AND D. L. D. CASPAR Rosenstiel Basic Medical Sciences Research Center, Brandeis University, Waltham, MA 02254 Communicated by David Eisenberg, October 8, 1990 (received for review July 27, 1990) ABSTRACT The electron density distribution of the sol- vent in the cubic insulin crystal structure, which occupies 65% of the volume, has been mapped from 1.7-A resolution diffrac- tion data by an iterative difference Fourier method, using the previously determined protein structure as the refinement restraint. Starting with phases from the protein and a flat solvent model, the difference map calculated from the data was added outside the protein envelope, and the modified map was then used to recalculate phases for the iterative refinement. Tests of the method with model data, with the experimental data and a variant protein model, and by carrying out a partial refinement of the solvent map demonstrate that the refinement algorithm produces reliable values for the solvent density within the noise level of the data. Fluctuations in density are observed throughout the solvent space, demonstrating that nonrandom arrangements of the water molecules extend sev- eral layers from the well-ordered hydration shell in contact with the protein surface. Such ordering may account for the hydration force opposing close approach of hydrophilic sur- faces and other long-range water-dependent interactions in living structures. x-ray diffraction data extending from the 002 reflection to 1.7-A resolution has been measured (10), and atomic coordinates for the insulin monomer and 108 bound water molecules in the asymmetric unit were refined to an R factor of 0.20 (8). The 24 insulin molecules within the unit cell are arranged into rows parallel to the cube edges, leaving con- tinuous interconnected solvent channels of diameter -30 A running through the crystal. The 65% volume fraction of the crystal unit cell occupied by solvent corresponds to =440 water molecules per insulin molecule (Mr 5778). Thus, there is slightly more than one water molecule for each nonhydro- gen protein atom. In addition, at the pH and ionic strength of the mother liquor, these crystals should contain about three Na' counterions and about one molecule of salt per insulin monomer. The low salt concentration and large solvent volume within these crystals provide a suitable system for examining the structure of water in the vicinity of a protein surface under near-physiological conditions. Our analysis of the crystal data demonstrates that the average distribution of water molecules beyond those in immediate contact with the protein surface is recognizably nonuniform. Water constitutes at least half of the volume in a wide variety of protein crystals (1), and much of this water is not uniquely ordered. Fourier transformation of the correctly phased Bragg diffraction amplitudes, measured by x-ray or neutron crystallography, maps the average distribution of scattering matter in the crystal asymmetric unit, regardless of the ordering of this matter. Phases for the Bragg reflections from well-ordered protein crystals can be calculated from atomic models (including ordered water) which have been refined (2, 3) to fit observed intensities within a small residual. (R factors for data between 6- and 2-A resolution are typically =0.15- 0.2; cf. Fig. 1 and ref. 4.) However, omission of disordered solvent in the models leads to large discrepancies between calculated and measured data at low resolution. Blake et al. (5) improved the agreement with the low-resolution x-ray diffraction data from lysozyme crystals by filling the voids in their atomic model with uniform density solvent, but refine- ment of the average solvent structure was not attempted. Schoenborn and Cheng (6, 7) modeled the disordered solvent in myoglobin crystals as closely spaced pseudoatoms whose weights and temperature factors were adjusted to fit neutron diffraction data, but the three-dimensional solvent structure was not described. We have applied refinement methods to map the average solvent density distribution in cubic insulin crystals, using the previously determined atomic model (8) as a phasing restraint. Cubic crystals of pig insulin (space group I213 with a = 78.9 A) grow in zinc-free alkaline solutions (pH 9) at low salt concentrations (0.2 M Na2HPO4 or NaCl) (9). Although the protein occupies only about a third of their volume, these crystals are well ordered. A nearly complete set of Bragg Crystallographic Methods When the distribution of a substantial portion of the scatter- ing matter within a crystal has been determined, approxi- mately correct phase angles can be calculated from such a partial model; the missing structure appears with reduced weight in the electron density map computed from these phases and the measured amplitudes. This is the basis of the heavy atom method for solving crystal structures. Using the protein molecule as the initially known part of the structure (i.e., the "heavy atom"), we have developed an iterative procedure to determine the average density distribution of the solvent. An electron density model of the protein structure was constructed (11) from the refined atomic coordinates (8). Hydrogen atoms were placed according to stereochemical criteria and assigned temperature factors 10 A2 higher than the atoms to which they were connected. Hydrogens in -CH3 groups were assumed to be rotationally mobile and assigned temperature factors of 60 A2. The protein region was demarked by the electron density contour around this model which gave a molecular volume equal to that calculated from the sum of the canonical residue volumes (12, 13). Electron density outside this volume was set to the value for liquid water and smoothed at the protein/solvent boundary (5). The R factor for Bragg reflections with d > 7.3 A was reduced from 0.69 to 0.30 by this flat solvent density model and the R factor for the higher-resolution data remained almost un- changed. Density fluctuations needed to improve agreement with the observed data were introduced into this flat solvent model map by an iterative density modification procedure involving (i) calculation of a conventional difference Fourier map by using the experimentally determined structure factor ampli- tudes and amplitudes and phases calculated from the protein 622 The publication costs of this article were defrayed in part by page charge payment. This article must therefore be hereby marked "advertisement" in accordance with 18 U.S.C. §1734 solely to indicate this fact.
Transcript of Water structure in cubic insulin crystals - PNAS · Waterstructure in cubic insulin crystals ......

Proc. Nati. Acad. Sci. USAVol. 88, pp. 622-626, January 1991Biophysics
Water structure in cubic insulin crystals(x-ray diffraction/protein hydration/crystallographic refinement/hydration force)
JOHN BADGER AND D. L. D. CASPARRosenstiel Basic Medical Sciences Research Center, Brandeis University, Waltham, MA 02254
Communicated by David Eisenberg, October 8, 1990 (received for review July 27, 1990)
ABSTRACT The electron density distribution of the sol-vent in the cubic insulin crystal structure, which occupies 65%of the volume, has been mapped from 1.7-A resolution diffrac-tion data by an iterative difference Fourier method, using thepreviously determined protein structure as the refinementrestraint. Starting with phases from the protein and a flatsolvent model, the difference map calculated from the data wasadded outside the protein envelope, and the modified map wasthen used to recalculate phases for the iterative refinement.Tests of the method with model data, with the experimentaldata and a variant protein model, and by carrying out a partialrefinement of the solvent map demonstrate that the refinementalgorithm produces reliable values for the solvent densitywithin the noise level of the data. Fluctuations in density areobserved throughout the solvent space, demonstrating thatnonrandom arrangements of the water molecules extend sev-eral layers from the well-ordered hydration shell in contactwith the protein surface. Such ordering may account for thehydration force opposing close approach of hydrophilic sur-faces and other long-range water-dependent interactions inliving structures.
x-ray diffraction data extending from the 002 reflectionto 1.7-A resolution has been measured (10), and atomiccoordinates for the insulin monomer and 108 bound watermolecules in the asymmetric unit were refined to an R factorof 0.20 (8). The 24 insulin molecules within the unit cell arearranged into rows parallel to the cube edges, leaving con-tinuous interconnected solvent channels of diameter -30 Arunning through the crystal. The 65% volume fraction of thecrystal unit cell occupied by solvent corresponds to =440water molecules per insulin molecule (Mr 5778). Thus, thereis slightly more than one water molecule for each nonhydro-gen protein atom. In addition, at the pH and ionic strength ofthe mother liquor, these crystals should contain about threeNa' counterions and about one molecule of salt per insulinmonomer. The low salt concentration and large solventvolume within these crystals provide a suitable system forexamining the structure of water in the vicinity of a proteinsurface under near-physiological conditions. Our analysis ofthe crystal data demonstrates that the average distribution ofwater molecules beyond those in immediate contact with theprotein surface is recognizably nonuniform.
Water constitutes at least half of the volume in a wide varietyof protein crystals (1), and much of this water is not uniquelyordered. Fourier transformation of the correctly phasedBragg diffraction amplitudes, measured by x-ray or neutroncrystallography, maps the average distribution of scatteringmatter in the crystal asymmetric unit, regardless of theordering of this matter. Phases for the Bragg reflections fromwell-ordered protein crystals can be calculated from atomicmodels (including ordered water) which have been refined (2,3) to fit observed intensities within a small residual. (R factorsfor data between 6- and 2-A resolution are typically =0.15-0.2; cf. Fig. 1 and ref. 4.) However, omission of disorderedsolvent in the models leads to large discrepancies betweencalculated and measured data at low resolution. Blake et al.(5) improved the agreement with the low-resolution x-raydiffraction data from lysozyme crystals by filling the voids intheir atomic model with uniform density solvent, but refine-ment of the average solvent structure was not attempted.Schoenborn and Cheng (6, 7) modeled the disordered solventin myoglobin crystals as closely spaced pseudoatoms whoseweights and temperature factors were adjusted to fit neutrondiffraction data, but the three-dimensional solvent structurewas not described. We have applied refinement methods tomap the average solvent density distribution in cubic insulincrystals, using the previously determined atomic model (8) asa phasing restraint.Cubic crystals ofpig insulin (space group I213 with a = 78.9
A) grow in zinc-free alkaline solutions (pH 9) at low saltconcentrations (0.2 M Na2HPO4 or NaCl) (9). Although theprotein occupies only about a third of their volume, thesecrystals are well ordered. A nearly complete set of Bragg
Crystallographic Methods
When the distribution of a substantial portion of the scatter-ing matter within a crystal has been determined, approxi-mately correct phase angles can be calculated from such apartial model; the missing structure appears with reducedweight in the electron density map computed from thesephases and the measured amplitudes. This is the basis of theheavy atom method for solving crystal structures. Using theprotein molecule as the initially known part of the structure(i.e., the "heavy atom"), we have developed an iterativeprocedure to determine the average density distribution ofthe solvent.An electron density model of the protein structure was
constructed (11) from the refined atomic coordinates (8).Hydrogen atoms were placed according to stereochemicalcriteria and assigned temperature factors 10 A2 higher thanthe atoms to which they were connected. Hydrogens in-CH3 groups were assumed to be rotationally mobile andassigned temperature factors of60 A2. The protein region wasdemarked by the electron density contour around this modelwhich gave a molecular volume equal to that calculated fromthe sum of the canonical residue volumes (12, 13). Electrondensity outside this volume was set to the value for liquidwater and smoothed at the protein/solvent boundary (5). TheR factor for Bragg reflections with d > 7.3 A was reducedfrom 0.69 to 0.30 by this flat solvent density model and the Rfactor for the higher-resolution data remained almost un-changed.
Density fluctuations needed to improve agreement with theobserved data were introduced into this flat solvent modelmap by an iterative density modification procedure involving(i) calculation of a conventional difference Fourier map byusing the experimentally determined structure factor ampli-tudes and amplitudes and phases calculated from the protein
622
The publication costs of this article were defrayed in part by page chargepayment. This article must therefore be hereby marked "advertisement"in accordance with 18 U.S.C. §1734 solely to indicate this fact.

Proc. Natl. Acad. Sci. USA 88 (1991) 623
and solvent electron density model; (ii) addition of thisdifference map to the current model density map outside theprotein volume; and (iii) calculation of a new set of modelamplitudes and phases from this modified map for furtherrefinement cycles.
In real space, the refinement of the solvent map wasrestrained by the requirement that the density distributionwithin the envelope of the protein model should remainunchanged, and in reciprocal space, convergence was drivenby the requirement that the observed and calculated structurefactors should agree as closely as possible. Similar methods,restraining well-defined parts of a crystal density map to fita model, have been used in the refinement of small moleculestructures (14, 15). A related procedure has been proposedfor improving protein electron density maps which are par-tially interpretable in terms of an atomic model (16).
Refined Electron Density Map
During the first four refinement cycles, only the low-resolution phases (d > 4.5 A) were treated as variables. Theiterative refinement was then progressively extended to1.7-A resolution, using all the data. After each refinementcycle, scale factors (a single multiplier and temperaturefactor) between observed and calculated structure factorswere determined from the complete data set. The differenceamplitudes for unrecorded data were taken to be zero, but thecalculated values from the model maps for these termsnaturally could change at each iteration. The refinement wasterminated after 12 cycles, when the largest feature in thedifference Fourier map appeared within the protein volumeand the final R factor (0.06) was close to the expected noiselevel of the data (Fig. 1).An electron density map was then calculated from the
experimentally determined structure factors and the refinedphases. Structure factors obtained from the final modelelectron density map were used to substitute for the smallnumber of unrecorded data (1% of terms to 4.5 A, 7% to 2.0A, and 13% to 1.7 A). A map containing only the solventdensity was obtained by subtracting the model protein den-sity from this refined electron density map.
0.8
0.6
0
cr 0.4
Protein alone
0.2
Protein + solvent
0.00.0 0.1 0.2 0.3 0.4 0.5 0.6
Resolution, A-1
FIG. 1. Crystallographic R factor as a function of resolution 1d= 2sin 0/A for the refined protein model alone and for the proteinmodel and refined solvent density model. The upper curve is aconventionally determined R factor, obtained from Fourier inversionof the model protein electron density. In the calculation of the lowercurve the protein model is identical, but the solvent density mapobtained in the final refinement cycle has been added. In both casesthe observed and calculated structure factors were scaled togetherusing a single scale factor and a small overall temperature factor tocompensate for slightly underestimated B factors in the proteinmodel.
Because protein and solvent electron density in the crystalhave been separately mapped, the calculated structure fac-tors, F, can be divided into terms representing the contribu-tions of density fluctuations within the protein and solventvolumes and the average density contrast between thesevolumes. The spherically averaged distribution of the inten-sity diffracted by the crystal is the sum of these threespherically averaged component F2 terms, whose rms valuesare plotted as a function of resolution in Fig. 2. Regularstructural features within the protein molecule produce mod-ulations in its spherically averaged diffraction pattern withcharacteristic peaks near 0.1 A1 and 0.22 A1 (17). Thecontribution from the shape term dominates the very-low-order Bragg reflections but becomes negligible beyond-1o-A resolution. Fluctuations in the average solvent densitydistribution contribute significantly to the diffracted intensityover the entire resolution range, accounting for the relativelypoorer agreement with the structure factor data calculatedfrom flat solvent density models.
Reliability of the Solvent Density Map
The reliability of the solvent density refinement is obviouslydependent on both the accuracy of the protein model and thestructure factor data. Two independent least-squares deter-minations of the cubic insulin protein structure, using differ-ent refinement procedures, produced models between whichthe modal displacement in the atomic coordinates was only0O.1 A; the final protein model, which combined featuresfrom these two determinations, improved the fit with the dataand stereochemical restraints (8). It is likely that the proteinmodel used here is accurate to within the range of variationbetween the independent determinations and that the struc-ture factor measurements (10) are reliable to within theestimated errors.
0 L-0.0
V\-" Protein
,Shape
0.1 0.2 0.3 0.4
Resolution, A-10.5 0.6
FIG. 2. Spherically averaged components of the observed inten-sity data as a function of resolution. The vertical scale has beencompressed by taking the square root ofeach component and is givenin units of electrons (e) per asymmetric unit. The contribution fromthe fluctuations in the average protein density was calculated bysetting electron density outside the protein volume to the averageprotein density value. The contribution from the solvent densityfluctuations was obtained similarly by setting density within theprotein volume to the average solvent density level. The contributionfrom the overall molecular shape was obtained from Fourier trans-formation of a map in which the electron densities within protein andsolvent volumes were set to their average values. The sharp edges onthe density boundaries were smoothed by applying an additionalartificial temperature factor in all calculations. The observed spher-ically averaged intensity distribution is equal to the sum of the threecalculated components. The sum of all the electrons in an asymmet-ric unit is F(O) = 7529 e.
Biophysics: Badger and Caspar

624 Biophysics: Badger and Caspar
C.,'1 ~ I' - -y< 0.3
CI
a) 0.2
0.1 -2 4 6 8 10 12
Distance, A
FIG. 3. Radially averaged solvent electron density as a functionof distance from the protein surface. To obtain this curve, thedistance from each solvent density gridpoint to the nearest proteinatom was calculated and the density values were averaged withinnarrow (0.2-A) shells. The mean solvent density value, averaged overthe entire solvent volume, is indicated by the broken line.
Inside the protein envelope, the rms density fluctuation ofthe difference between our refined and model maps is 0.05e/A3, which is close to the noise level of0.04 e/A3 calculatedfrom the estimated uncertainty of the structure factor data(10). Relative to the average electron density in the proteinvolume, the rms fluctuation is 0.47 e/A3, and the correspond-ing value for the solvent volume is 0.12 e/A3. Thus, themean-square density fluctuation in the solvent map is only-7% of that in the highly ordered protein; nevertheless, themean-square fluctuation in the solvent density is about sixtimes larger than the noise variance estimated from thedifference between the refined and model protein maps.Because the mean solvent density fluctuation is small com-pared to that ofthe protein, the phases are strongly restrainedby the protein model. Refinement of the solvent densitydistribution, starting from the flat solvent model, yielded aphase residual of only 140, while the R factor decreased from0.22 to 0.06. Density fluctuations in the refined solvent map
A B
that are above the noise level represent physically crediblewater structure.The refinement procedure has been tested by calculating a
synthetic set of structure factors from a realistic protein andsolvent model; the solvent density distribution was thenrefined, starting with an initially flat model, using thesestructure factor amplitudes with the protein model as thephasing restraint. The simulated solvent density map wascreated by combining sets of water positions from a molec-ular dynamics simulation (described below) which producedan average nonuniform density distribution similar to thatobtained from refinement of the experimental data. In onetest, a complete set of structure factors and an error-freeprotein model were used, while in a more realistic test, thestructure factors missing from the observed data were alsoremoved from the synthetic data and random errors (propor-tional to the square root of the temperature factors) wereintroduced into the atomic coordinates of the protein modelto give an average displacement of 0.1 A and an rms error inthe density map of 0.05 e/A3. In both cases the solvent mapsobtained by using the refined phases were much closer to thetrue map than were the maps calculated by using phases fromthe starting models with a flat solvent density. In the firstcase, using error-free data and protein model, the R factor,which was 0.18 for the starting model, converged toward zeroon refinement; in the second case, with missing data and animperfect protein model, refinement reduced the R factorfrom 0.21 to 0.05 (this residual discrepancy was principallyaccounted for by the differences within the protein envelopedue to the errors introduced into the phasing model).To test the uniqueness ofthe refined map obtained from the
observed data, a variant model for the protein was con-structed with one surface side chain (Arg-B22) displaced by7 A at its extremity to give an R factor between model
protein structure factors of0.07 relative to the best model (8).Starting with phases from this variant model and a uniformsolvent density, the map that was refined, using the modelprotein minus the displaced side chain as the phasing re-straint, converged to the initial solution. Density for thecorrectly positioned side chain was recovered and the incor-rect structure was attenuated. In another test of the robust-ness of the refinement, the variant model was imposed as the
C
FIG. 4. (A) Projection of a complete cubic insulin crystal unit cell (a = 78.9 A) showing the Cc backbone of the 24 insulin molecules. Thetwofold axes parallel to the plane are marked with solid lines and the twofold screw axes are marked with broken lines. o marks the twofoldaxes and X the twofold screw axes perpendicular to the plane. (B and C) Superpositions of four sections of the solvent density map spaced0.8 A apart beginning at level Z = 0 (B) and Z = a/8 (C) in the unit cell. Solid contours, which superimpose to mark bound water moleculesas black peaks, are drawn at intervals of 0.1 e/A3 starting at 0.65 e/A3. Broken contours, drawn at 0.4 e/A3 to mark structure in the irregularlyordered water, were obtained from a map of the solvent density which was filtered by multiplying its Fourier coefficients by the gaussianexp(-20/d2) to suppress high-resolution detail. The average solvent density is 0.334 e/A3. The atomic skeleton of the protein in the plane ofthese sections is represented by the stick outlines. Near the protein surface, there is a paucity of the broken contours, representing partiallystructured solvent, because ordering of bound water concentrates electron density into sharp maxima in the first hydration shell.
'.- -' C....,*
.KT..i
C'
::r;i. ... >*
Proc. Natl. Acad. Sci. USA 88 (1991)
Proc. Natl. Acad. Sci. USA 88 (1991) 625
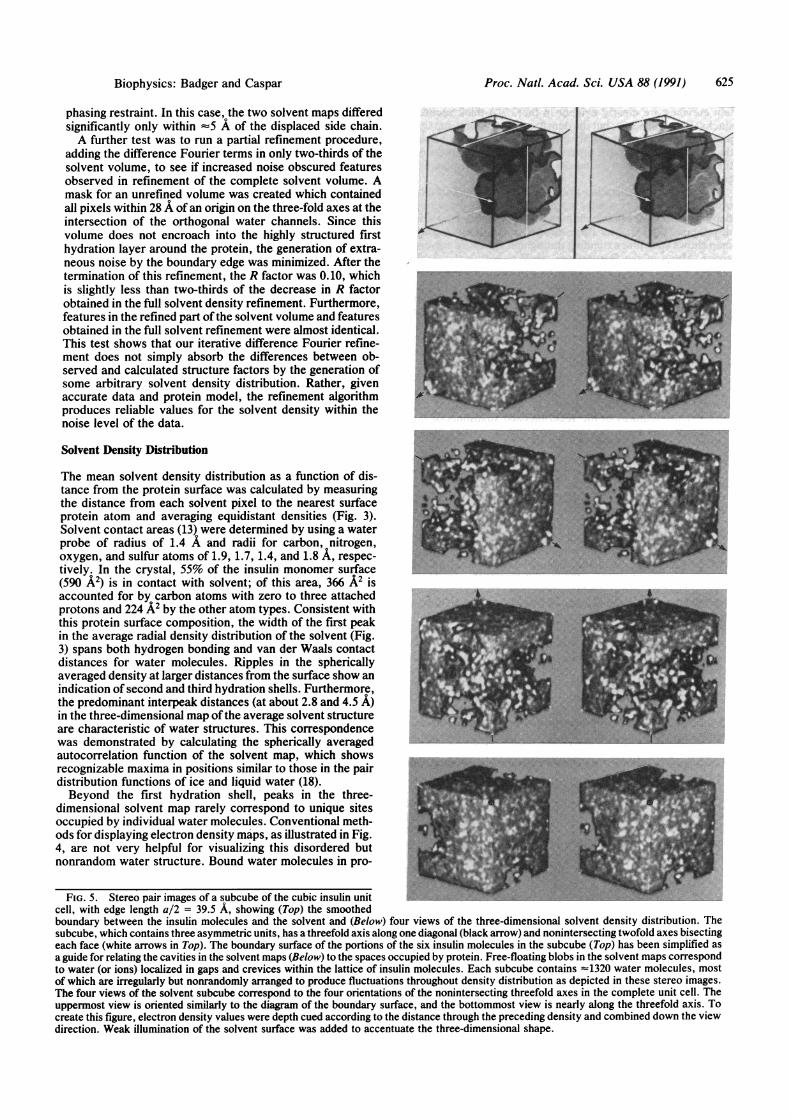
phasing restraint. In this case, the two solvent maps differedsignificantly only within -5 A of the displaced side chain.A further test was to run a partial refinement procedure,
adding the difference Fourier terms in only two-thirds of thesolvent volume, to see if increased noise obscured featuresobserved in refinement of the complete solvent volume. Amask for an unrefined volume was created which containedall pixels within 28 A of an origin on the three-fold axes at theintersection of the orthogonal water channels. Since thisvolume does not encroach into the highly structured firsthydration layer around the protein, the generation of extra-neous noise by the boundary edge was minimized. After thetermination of this refinement, the R factor was 0.10, whichI':;is slightly less than two-thirds of the decrease in R factor g j_obtained in the full solvent density refinement. Furthermore,features in the refined part of the solvent volume and featuresobtained in the full solvent refinement were almost identical.This test shows that our iterative difference Fourier refine-ment does not simply absorb the differences between ob-served and calculated structure factors by the generation ofsome arbitrary solvent density distribution. Rather, givenaccurate data and protein model, the refinement algorithmproduces reliable values for the solvent density within thenoise level of the data.
Solvent Density Distribution
The mean solvent density distribution as a function of dis-tance from the protein surface was calculated by measuringthe distance from each solvent pixel to the nearest surface 1.m4 4protein atom and averaging equidistant densities (Fig. 3). RsSolvent contact areas (13) were determined by using a waterprobe of radius of 1.4 A and radii for carbon, nitrogen,oxygen, and sulfur atoms of 1.9, 1.7, 1.4, and 1.8 A, respec-tively. In the crystal, 55% of the insulin monomer surface : : ::(590 A2) is in contact with solvent; of this area, 366 A2 isaccounted for by carbon atoms with zero to three attachedprotons and 224 A2 by the other atom types. Consistent withthis protein surface composition, the width of the first peakin the average radial density distribution of the solvent (Fig. A;3) spans both hydrogen bonding and van der Waals contactAdistances for water molecules. Ripples in the sphericallyaveraged density at larger distances from the surface show anindication of second and third hydration shells. Furthermore, . .....
the predominant interpeak distances (at about 2.8 and 4.5 A)in the three-dimensional map of the average solvent structureTc.are characteristic of water structures. This correspondencewas demonstrated by calculating the spherically averagedautocorrelation function of the solvent map, which showsrecognizable maxima in positions similar to those in the pair .,; idistribution functions of ice and liquid water (18).Beyond the first hydration shell, peaks in the three-
dimensional solvent map rarely correspond to unique sitesoccupied by individual water molecules. Conventional meth-ods for displaying electron density maps, as illustrated in Fig.4, are not very helpful for visualizing this disordered but Knonrandom water structure. Bound water molecules in pro-_
FIG. 5. Stereo pair images of a subcube of the cubic insulin unit r. ....
cell, with edge length a/2 = 39.5 A, showing (Top) the smoothedboundary between the insulin molecules and the solvent and (Below) four views of the three-dimensional solvent density distribution. Thesubcube, which contains three asymmetric units, has a threefold axis along one diagonal (black arrow) and nonintersecting twofold axes bisectingeach face (white arrows in Top). The boundary surface of the portions of the six insulin molecules in the subcube (Top) has been simplified asa guide for relating the cavities in the solvent maps (Below) to the spaces occupied by protein. Free-floating blobs in the solvent maps correspondto water (or ions) localized in gaps and crevices within the lattice of insulin molecules. Each subcube contains 1320 water molecules, mostof which are irregularly but nonrandomly arranged to produce fluctuations throughout density distribution as depicted in these stereo images.The four views of the solvent subcube correspond to the four orientations of the nonintersecting threefold axes in the complete unit cell. Theuppermost view is oriented similarly to the diagram of the boundary surface, and the bottommost view is nearly along the threefold axis. Tocreate this figure, electron density values were depth cued according to the distance through the preceding density and combined down the viewdirection. Weak illumination of the solvent surface was added to accentuate the three-dimensional shape.
Biophysics: Badger and Caspar

626 Biophysics: Badger and Caspar
tein crevices are clearly evident in the 3.2-A-thick sectionstacks (Fig. 4B and C), but the density peaks further from theprotein surface are not readily interpretable-except to notethat some type of solvent ordering extends to the centers ofthe water channels at distances =15 A from the nearestprotein atoms.To facilitate visualization of the large volume of partially
ordered solvent, a computer graphics method for projectingdepth-cued images of the continuous density distribution wasdeveloped (Fig. 5). The three-dimensional solvent densitymap shows structure extending throughout the entire solventspace. Many of the features are ringlike, with water peakpositions blurred out. The dimensions of these rings indicategroupings of five or six water molecules.A brief molecular dynamics simulation (19) was carried out
to determine the configurations of water molecules that mightoccur within the cubic insulin crystal lattice. Water moleculeswere initially placed on solvent electron density peaks withinthe cube of edge length 39.5 A (containing three asymmetricunits) and then adjusted to eliminate van der Waals overlaps.The dynamics simulation (20) was carried out at z300 Ksubject to crystal boundary conditions and with proteinatoms held fixed. The shapes and arrangements of thehigh-density features in the superimposed snapshots of thewater molecule networks taken from this simulation bear astrong resemblance to the solvent map calculated from thedata. Energy differences among the possible water networksare likely to be small (21), and switching between hexamerand pentamer rings was observed in this simulation.
Water Order and Disorder
Because the range of local order in liquid water, as measuredby the pair distribution function (18), extends out to -0o A,it is not surprising that the immobilizing influence of theprotein surface on water in the insulin crystal should extendover at least this range. Ordered layerings ofwater moleculesbetween closely apposed mica surfaces in 10-3 M KCl wereinferred from measurements of the repulsive force (22),which exhibit damped oscillations with a periodicity of =2.5A out to separations .15 A. Ordering ofwater molecules nearhydrophilic surfaces can account for the strong short-rangerepulsive hydration force observed between surfactantmonolayers in soap films (23), mineral layers in clays (24),phospholipid bilayers in multilayers (25), and DNA mole-cules in liquid crystals (26). Between soft or irregular mo-lecular surfaces, the hydration force is exponentially dampedwith a decay distance of 2.5-3 A. Oscillations of this repul-sion due to regular water layering have, however, beenobserved only between molecularly smooth ionically chargedsurfaces (27).
In protein crystals with constricted intermolecular spaces,all or most ofthe solvent may be confined to unique sites thatcan be located by conventional crystallographic refinementprocedures (cf. refs. 28 and 29). In most protein crystals, thenumber of sites that may be identified and represented by aunique discrete atomic model is much smaller than the totalnumber of water molecules in the solvent volume. Of the-440 water molecules in the cubic insulin asymmetric unit,about a quarter can be assigned discrete positions withrelatively high occupancy (8).With our refinement procedure, we have obtained a map of
the solvent density distribution throughout the entire cubicinsulin crystal, including the regions that cannot be repre-sented by singular atomic models. At hydrogen bondingdistance from the protein surface, sharp density featuresindicate the localized water molecules that were also foundby atomic model refinement procedures (8). Elsewhere, themap is not interpretable in terms of a unique array of solventsites but represents the superposition of different arrange-
ments of water molecules with positions influenced, but notuniquely defined, by the protein surface. Our visualizations(Figs. 3-5) show that water order in cubic insulin crystalsdoes not vanish outside the first hydration shell but contin-ues, in a less-well-defined way, into higher-order hydrationshells. The arrangement of water molecules near molecularsurfaces inside cells may be comparable to the irregularlyordered solvent distribution we have mapped. Over distances=30 A between insulin surfaces, this water ordering resem-bles that postulated in the polarized multilayer model (30)invoked to explain anomalous properties of water in cellscompared to dilute solutions.
This work was supported by Grant CA47439 to D.L.D.C. from theNational Cancer Institute.
1. Matthews, B. W. (1968) J. Mol. Biol. 33, 491-497.2. Hendrickson, W. A. & Konnert, J. H. (1980) in Computing in
Crystallography, eds. Diamond, R., Ramaseshon, S. & Ven-rasan, D. (Indian Acad. Sci., Bangalore), pp. 1-25.
3. Brunger, A. T., Kuriyan, J. & Karplus, M. (1987) Science 235,458-460.
4. Bernstein, F. C., Koetzle, T. F., Williams, G. J. B., Meyer,E. F., Jr., Brice, M. D., Rodgers, J. R., Kennard, 0., Shiman-ouchi, T. & Tasumi, M. (1977) J. Mol. Biol. 112, 535-542.
5. Blake, C. C. F., Pulford, W. C. A. & Artymiuk, P. J. (1983) J.Mol. Biol. 167, 693-723.
6. Schoenborn, B. P. (1988) J. Mol. Biol. 201, 741-749.7. Cheng, X. & Schoenborn, B. P. (1990) Acta Crystallogr. Sect.
B 46, 195-208.8. Badger, J., Harris, M. R., Reynolds, C. D., Evans, A. C.,
Dodson, E. J., Dodson, G. G. & North, A. C. T. (1991) ActaCrystallogr. Sect. B46, in press.
9. Harding, M. M., Hodgkin, D. C., Kennedy, A. F., O'Conner,A. & Weitzmann, P. D. J. (1966) J. Mol. Biol. 16, 212-226.
10. Dodson, E. J., Dodson, G. G., Lewitova, A. & Sabesan, M.(1978) J. Mol. Biol. 125, 387-3%.
11. Agarwal, R. C. (1978) Acta Crystallogr. Sect. A 34, 791-809.12. Chothia, C. (1975) Nature (London) 254, 304-308.13. Richards, F. M. (1977) Annu. Rev. Biophys. Bioeng. 6, 151-
176.14. Ito, T. & Shibuya, I. (1977) Acta Cryst. A33, 71-74.15. Van der Suis, P. & Spek, A. L. (1990) Acta Cryst. A46,
194-201.16. Bhat, T. N. & Blow, D. M. (1983) Acta Cryst. A39, 166-170.17. Tibbitts, T. T., Caspar, D. L. D., Phillips, W. C. & Goode-
nough, D. A. (1990) Biophys. J. 57, 1025-1036.18. Narten, A. H. & Levy, H. A. (1969) Science 165, 447-454.19. McCammon, J. A. & Harvey, S. G. (1987) Dynamics of Pro-
teins and Nucleic Acids (Cambridge Univ. Press, New York).20. Singh, U. C., Weiner, P. K., Caldwell, J. & Kollman, P. A.
(1986) AMBER (University of California, San Francisco), Ver-sion 3.0.
21. Stillinger, F. M. & David, C. W. (1978) J. Chem. Phys. 69,1473-1484.
22. Israelachvili, J. N. & Pashley, R. M. (1983) Nature (London)306, 249-250.
23. Clunie, J. S., Goodman, J. F. & Symons, P. C. (1967) Nature(London) 216, 1203-1204.
24. Viani, B. E., Low, P. F. & Roth, C. B. (1983) J. ColloidInterface Sci. 96, 229-244.
25. Parsegian, V. A., Fuller, N. & Rand, R. P. (1979) Proc. Natl.Acad. Sci. USA 76, 2750-2754.
26. Rau, D. R., Lee, B. K. & Parsegian, V. A. (1984) Proc. Natl.Acad. Sci. USA 81, 2621-2625.
27. Israelachvili, J. N. (1985) in Intermolecular and Surface Forces(Academic, London), pp. 194-212.
28. Teeter, M. M. (1984) Proc. Natl. Acad. Sci. USA 81, 6014-6018.
29. Baker, E. N., Blundell, T. L., Cutfield, J. F., Cutfield, S. M.,Dodson, E. J., Dodson, G. G., Hodgkin, D. C., Hubbard,R. E., Isaacs, N. W., Reynolds, C. D., Sakabe, K., Sakabe, N.& Vijayan, N. M. (1988) Philos. Trans. R. Soc. London B 319,369-456.
30. Ling, G. N. (1965) Ann. N. Y. Acad. Sci. 125, 401-417.
Proc. Natl. Acad Sci. USA 88 (1991)